
Innovative Approaches to Wear Reduction in Horizontal Powder Screw Conveyors: A Design of Experiments-Guided Numerical Study


Abstract
1. Introduction
- Can the abrasive powder material model be effectively calibrated through a combination of literature review, angle of repose, and shear tests to ensure an accurate representation of material behaviour within DEM simulations?
- Can Design of Experiments (DOE) be applied to systematically analyze the impact of various factors, such as screw pitch, clearance, wear, and rotational velocity, on critical screw conveyor performance metrics including mass flow, power consumption, wear, stresses, deformations, and their dependencies?
- Can response surface optimization be applied to identify optimum parameters for maximizing mass flow while minimizing wear?
- Can insights from parametric numerical analysis and utilization of DOE and response surface optimization be translated into practical guidelines for engineers designing efficient conveyor systems?
2. Materials and Methods
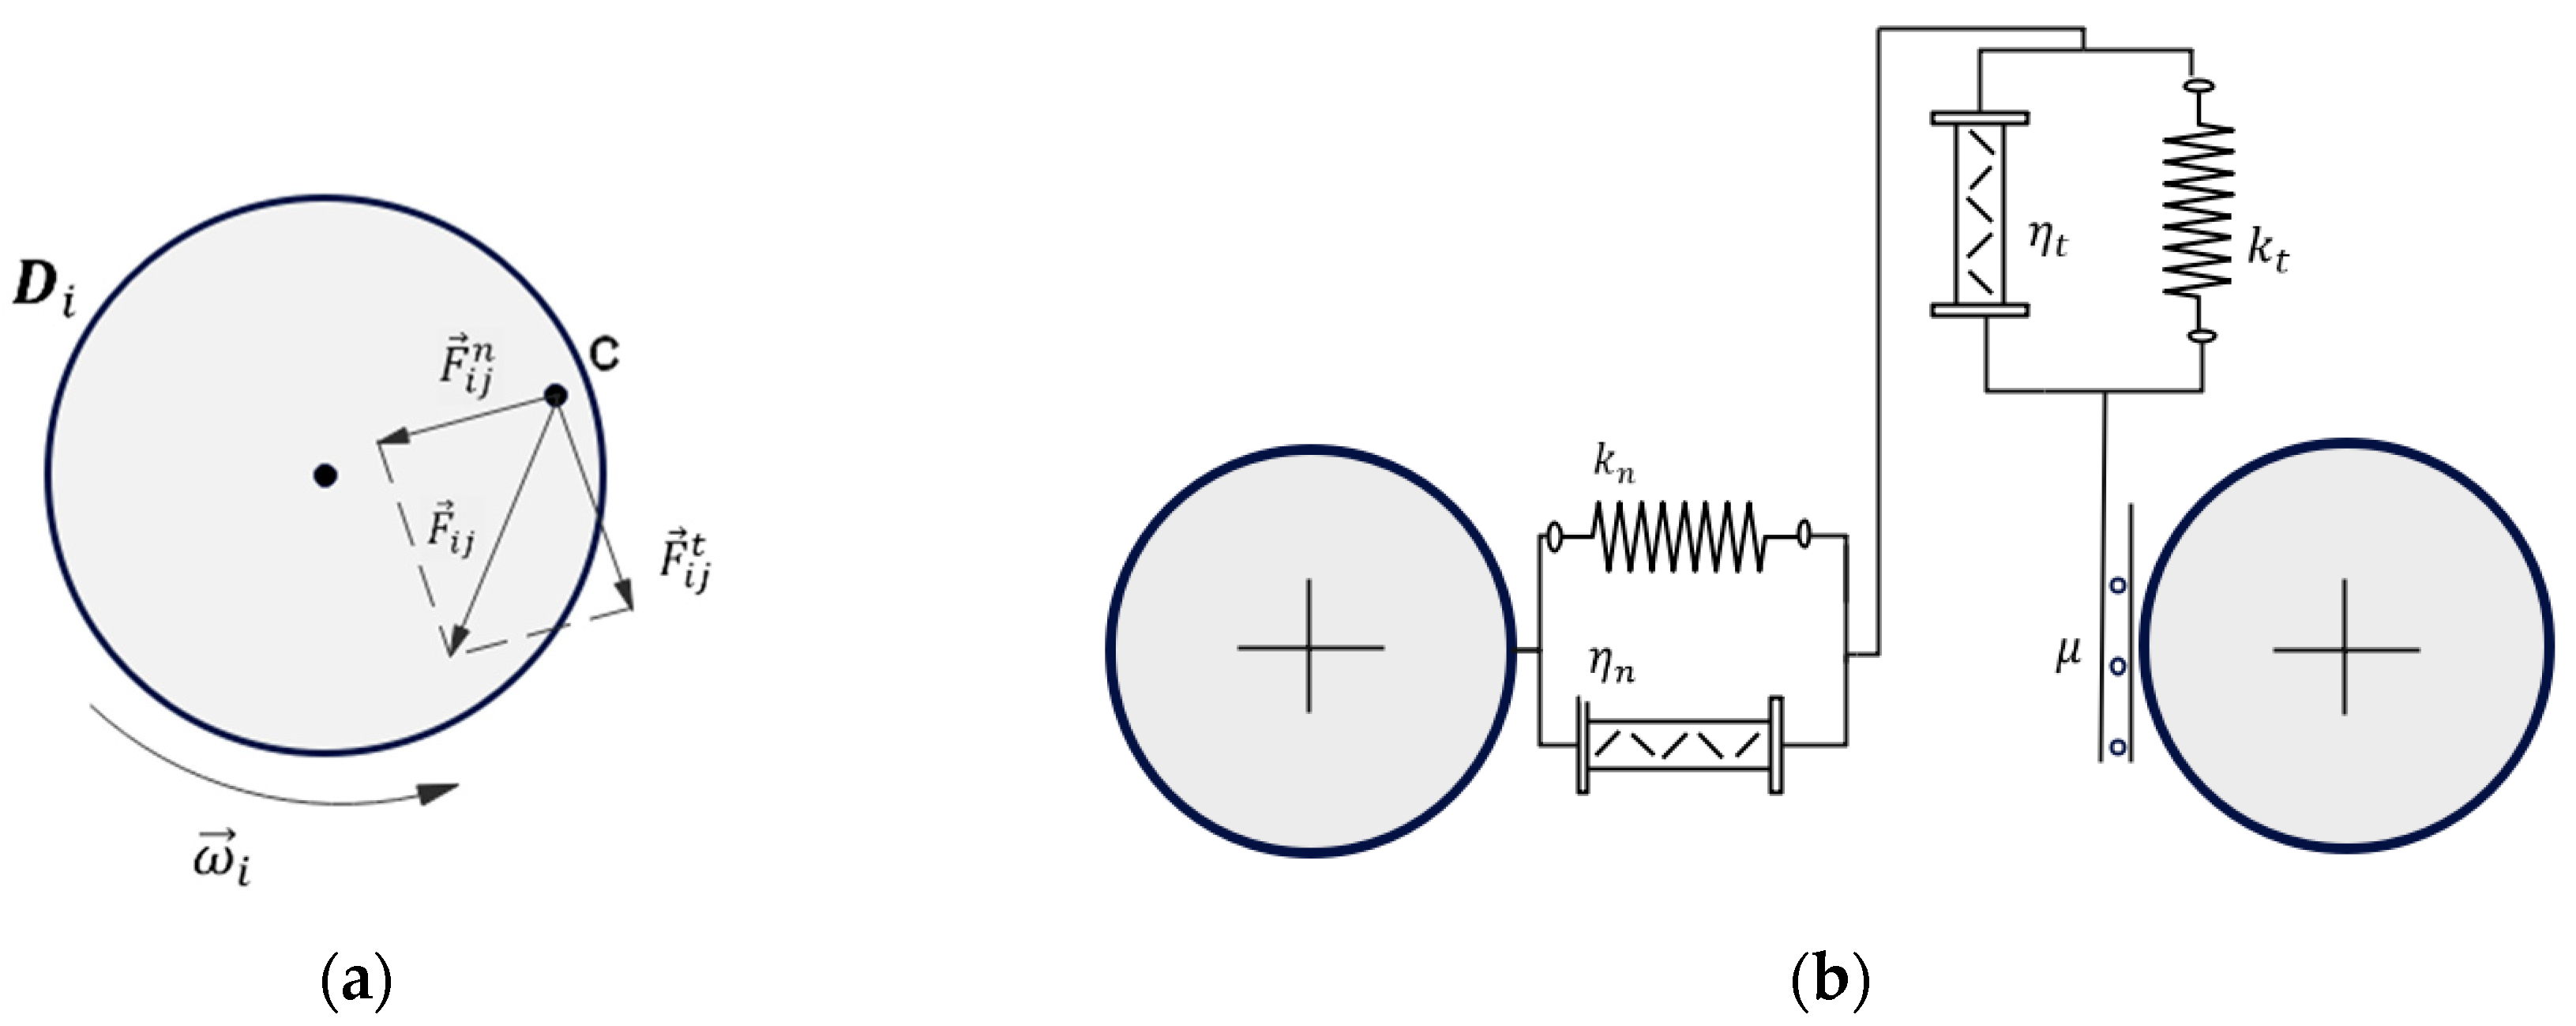
2.1. Discrete Element Method
Contact Model
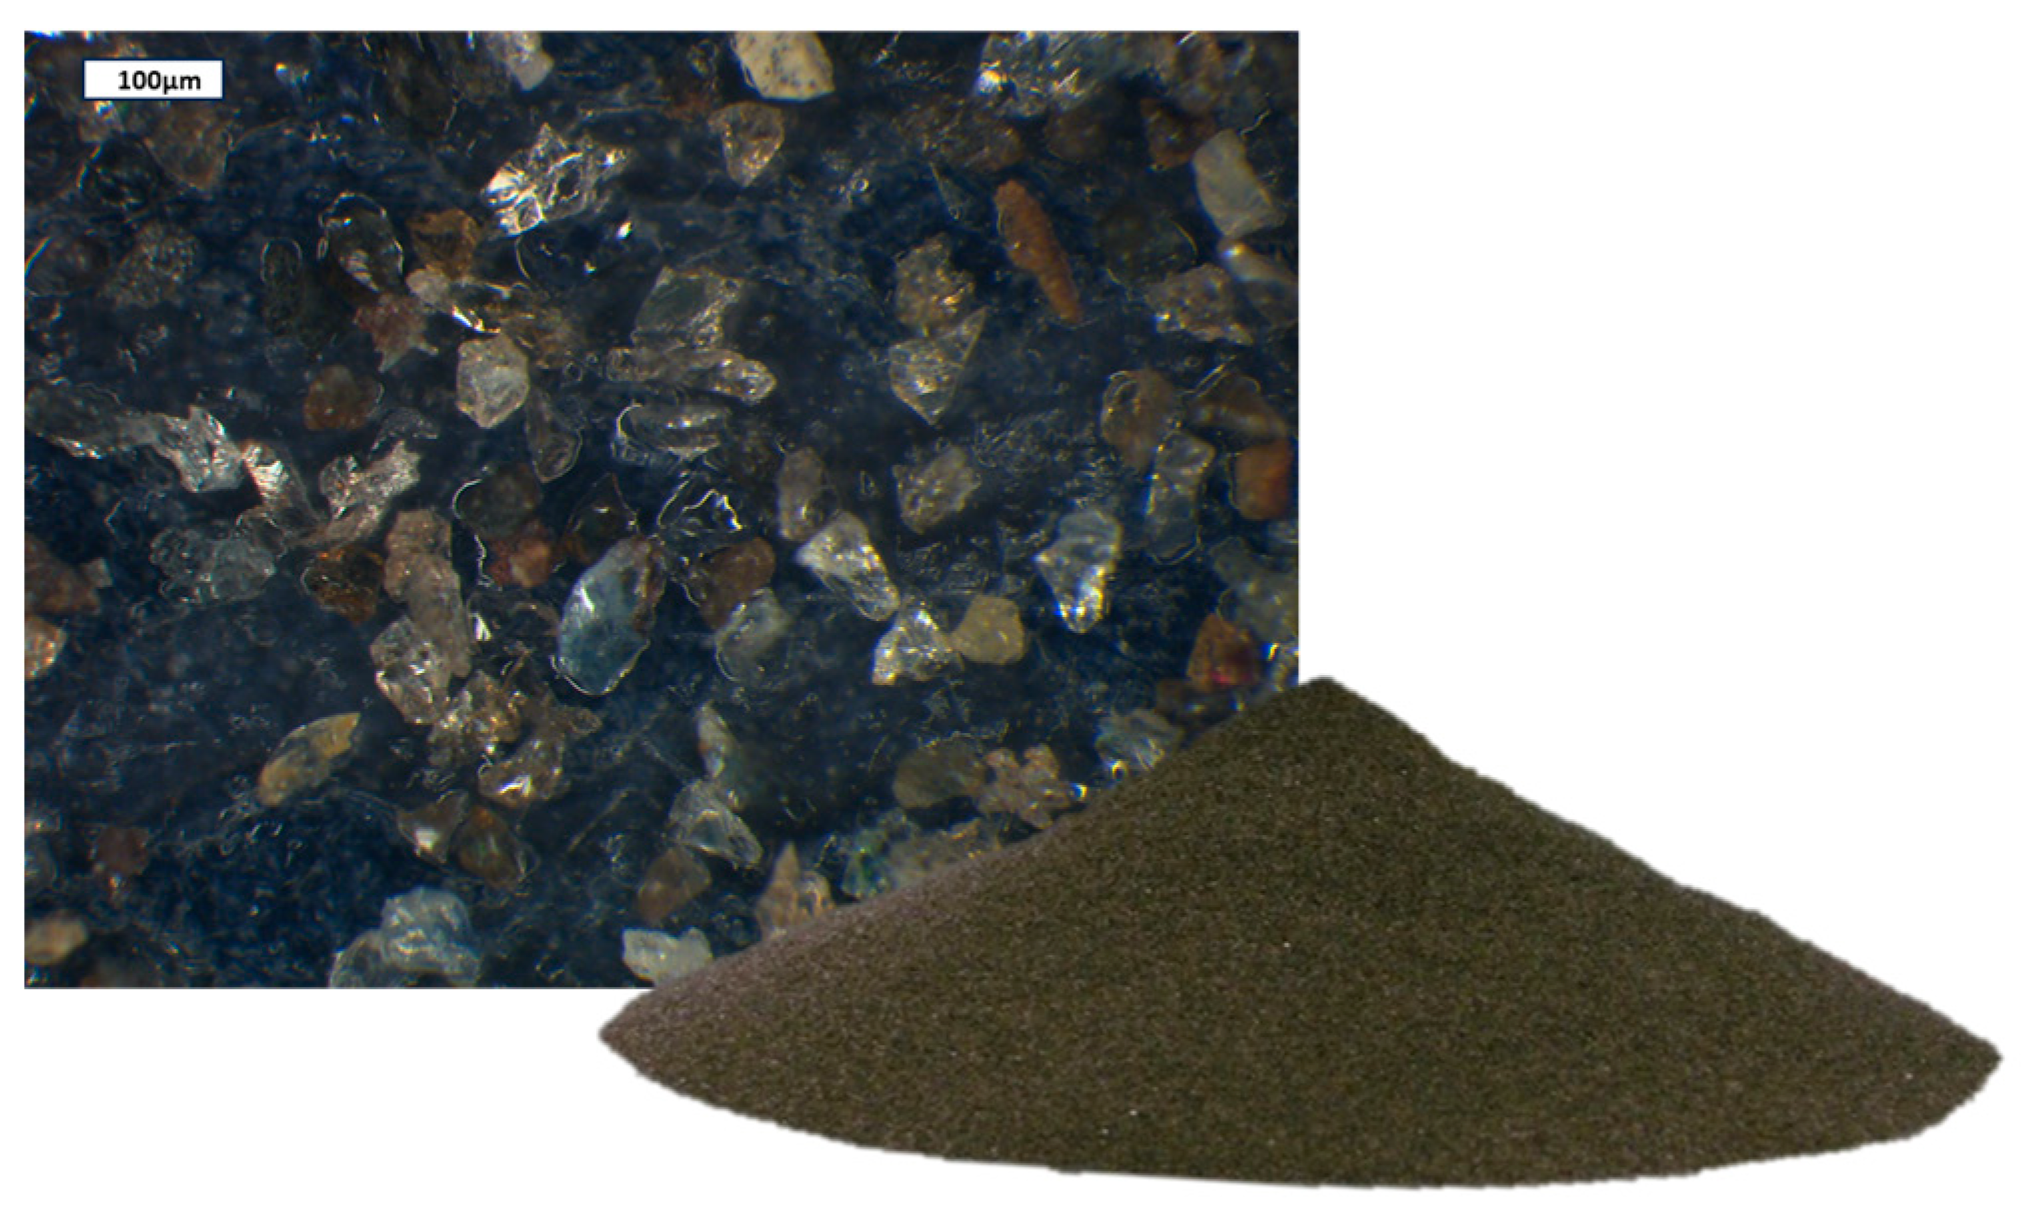
2.2. Used Particle Properties
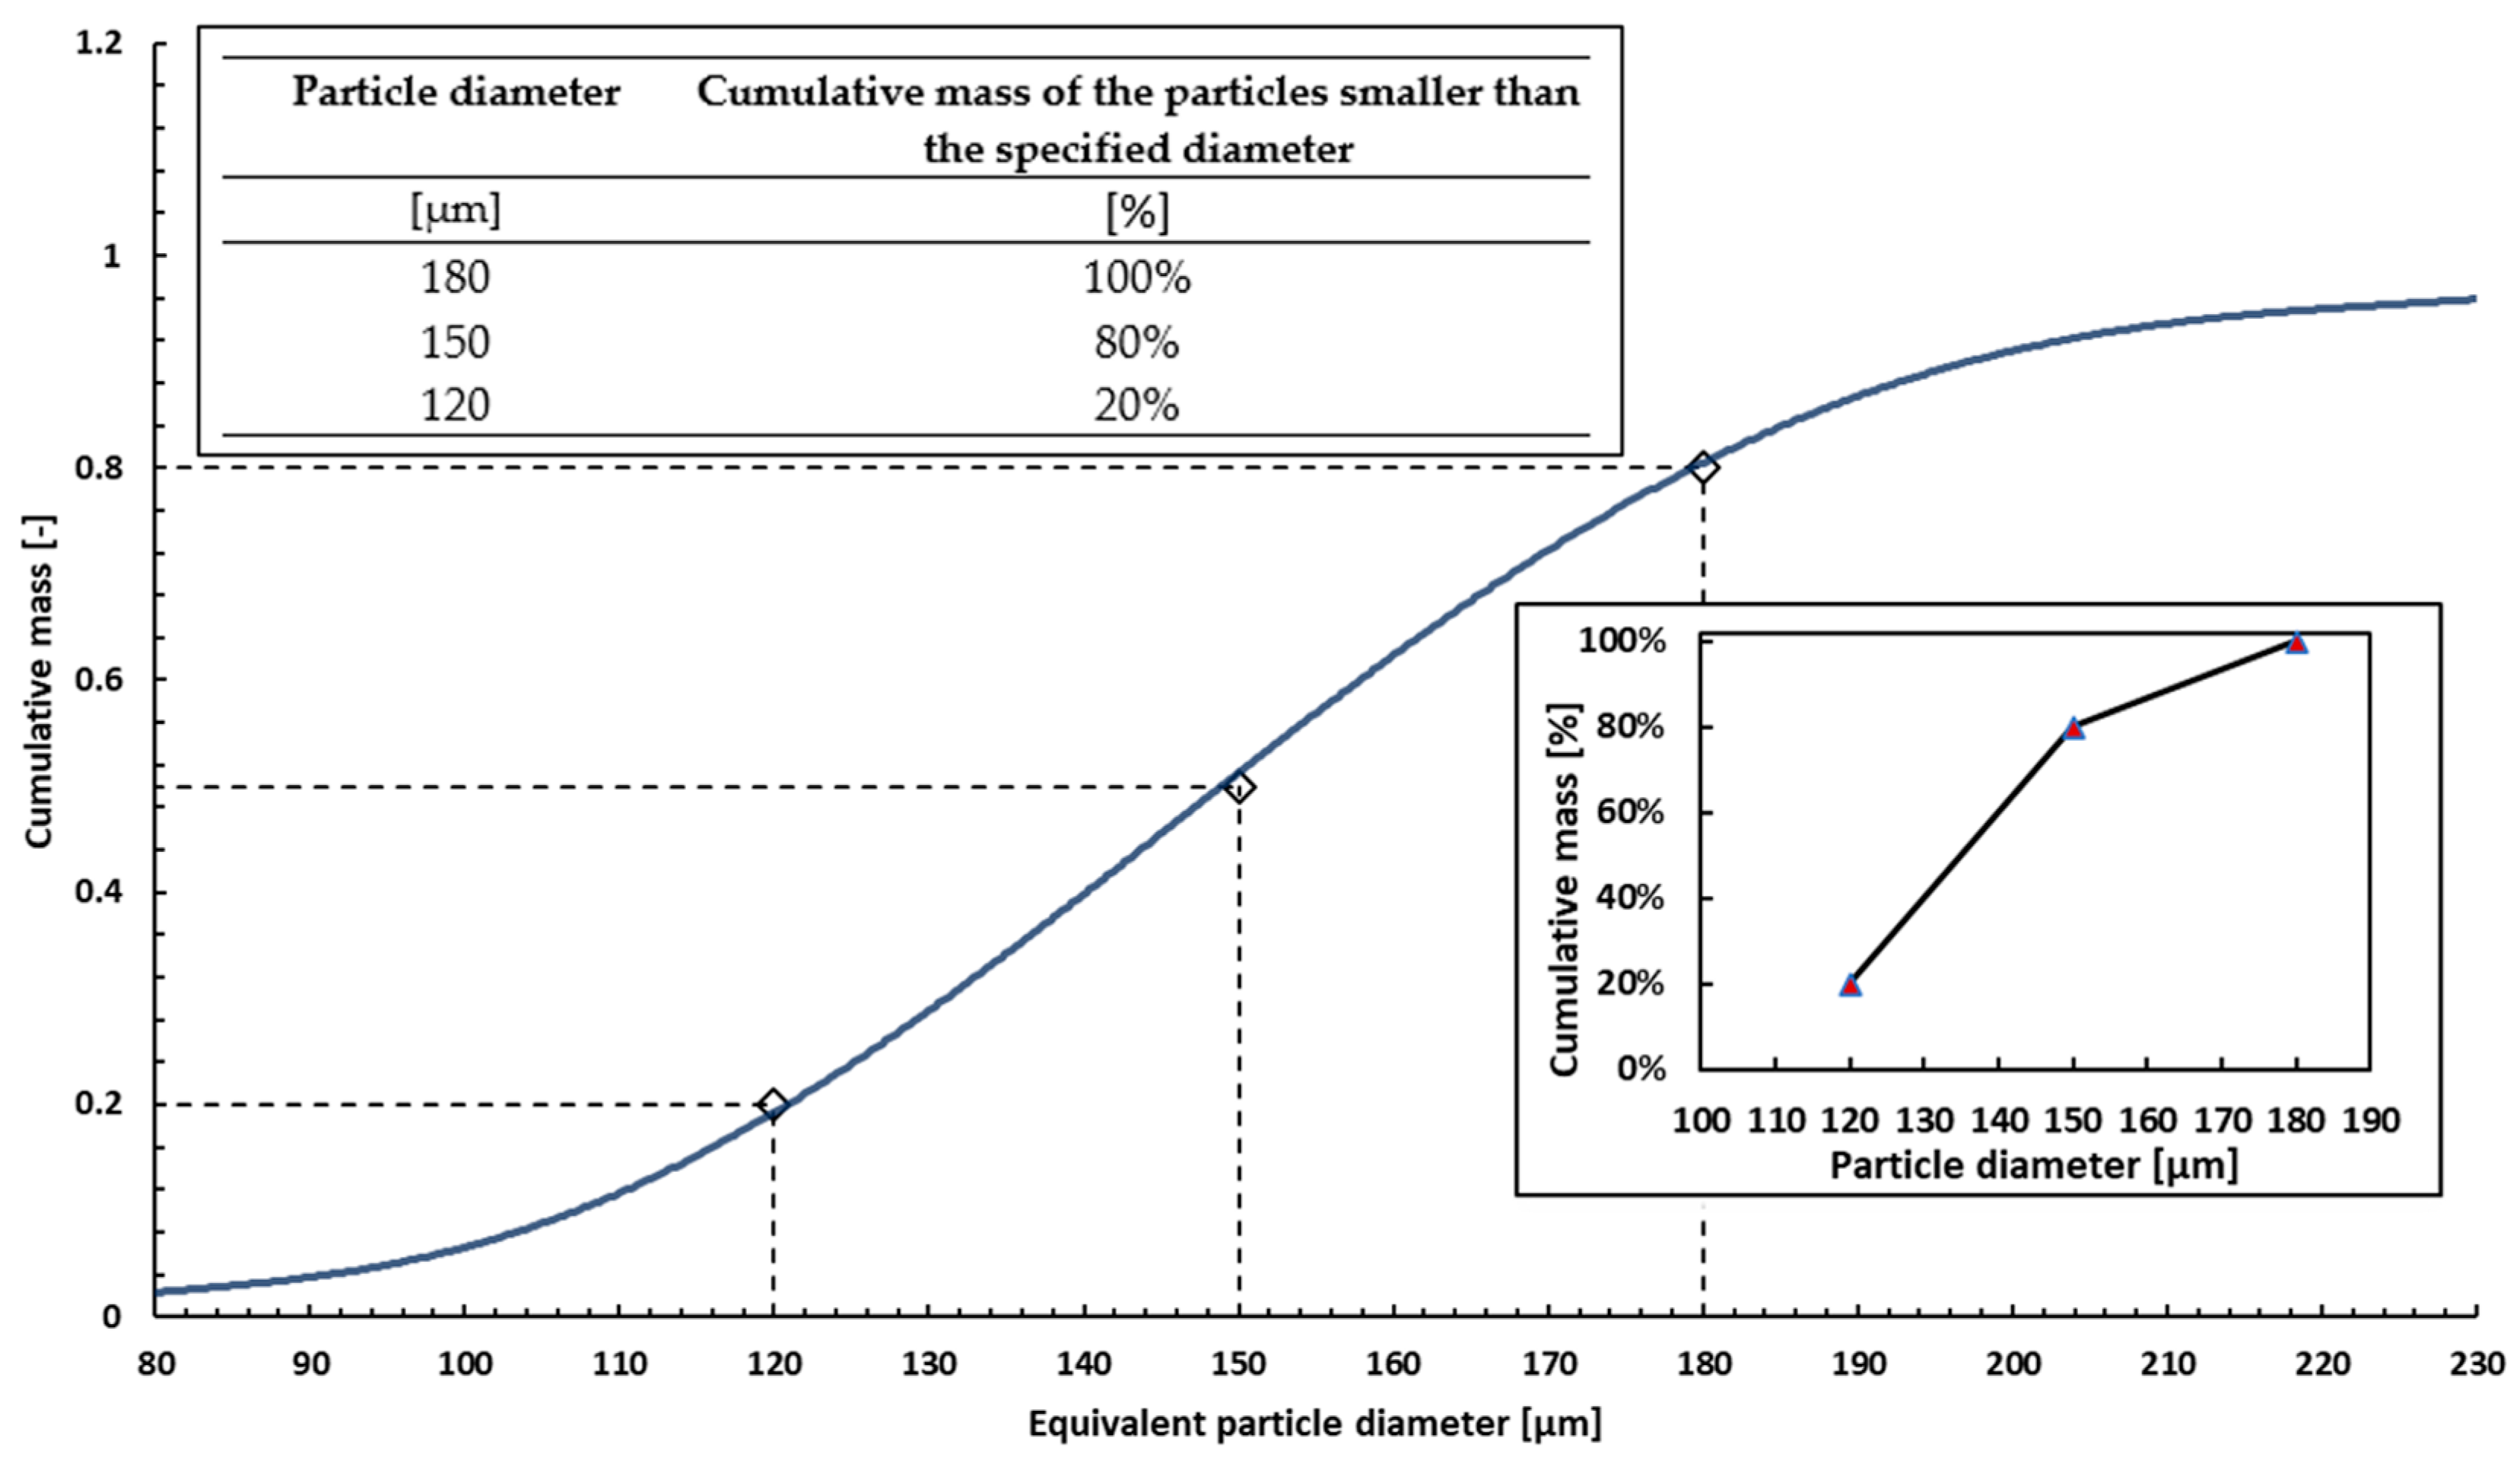
Particle Shape and Size Distribution
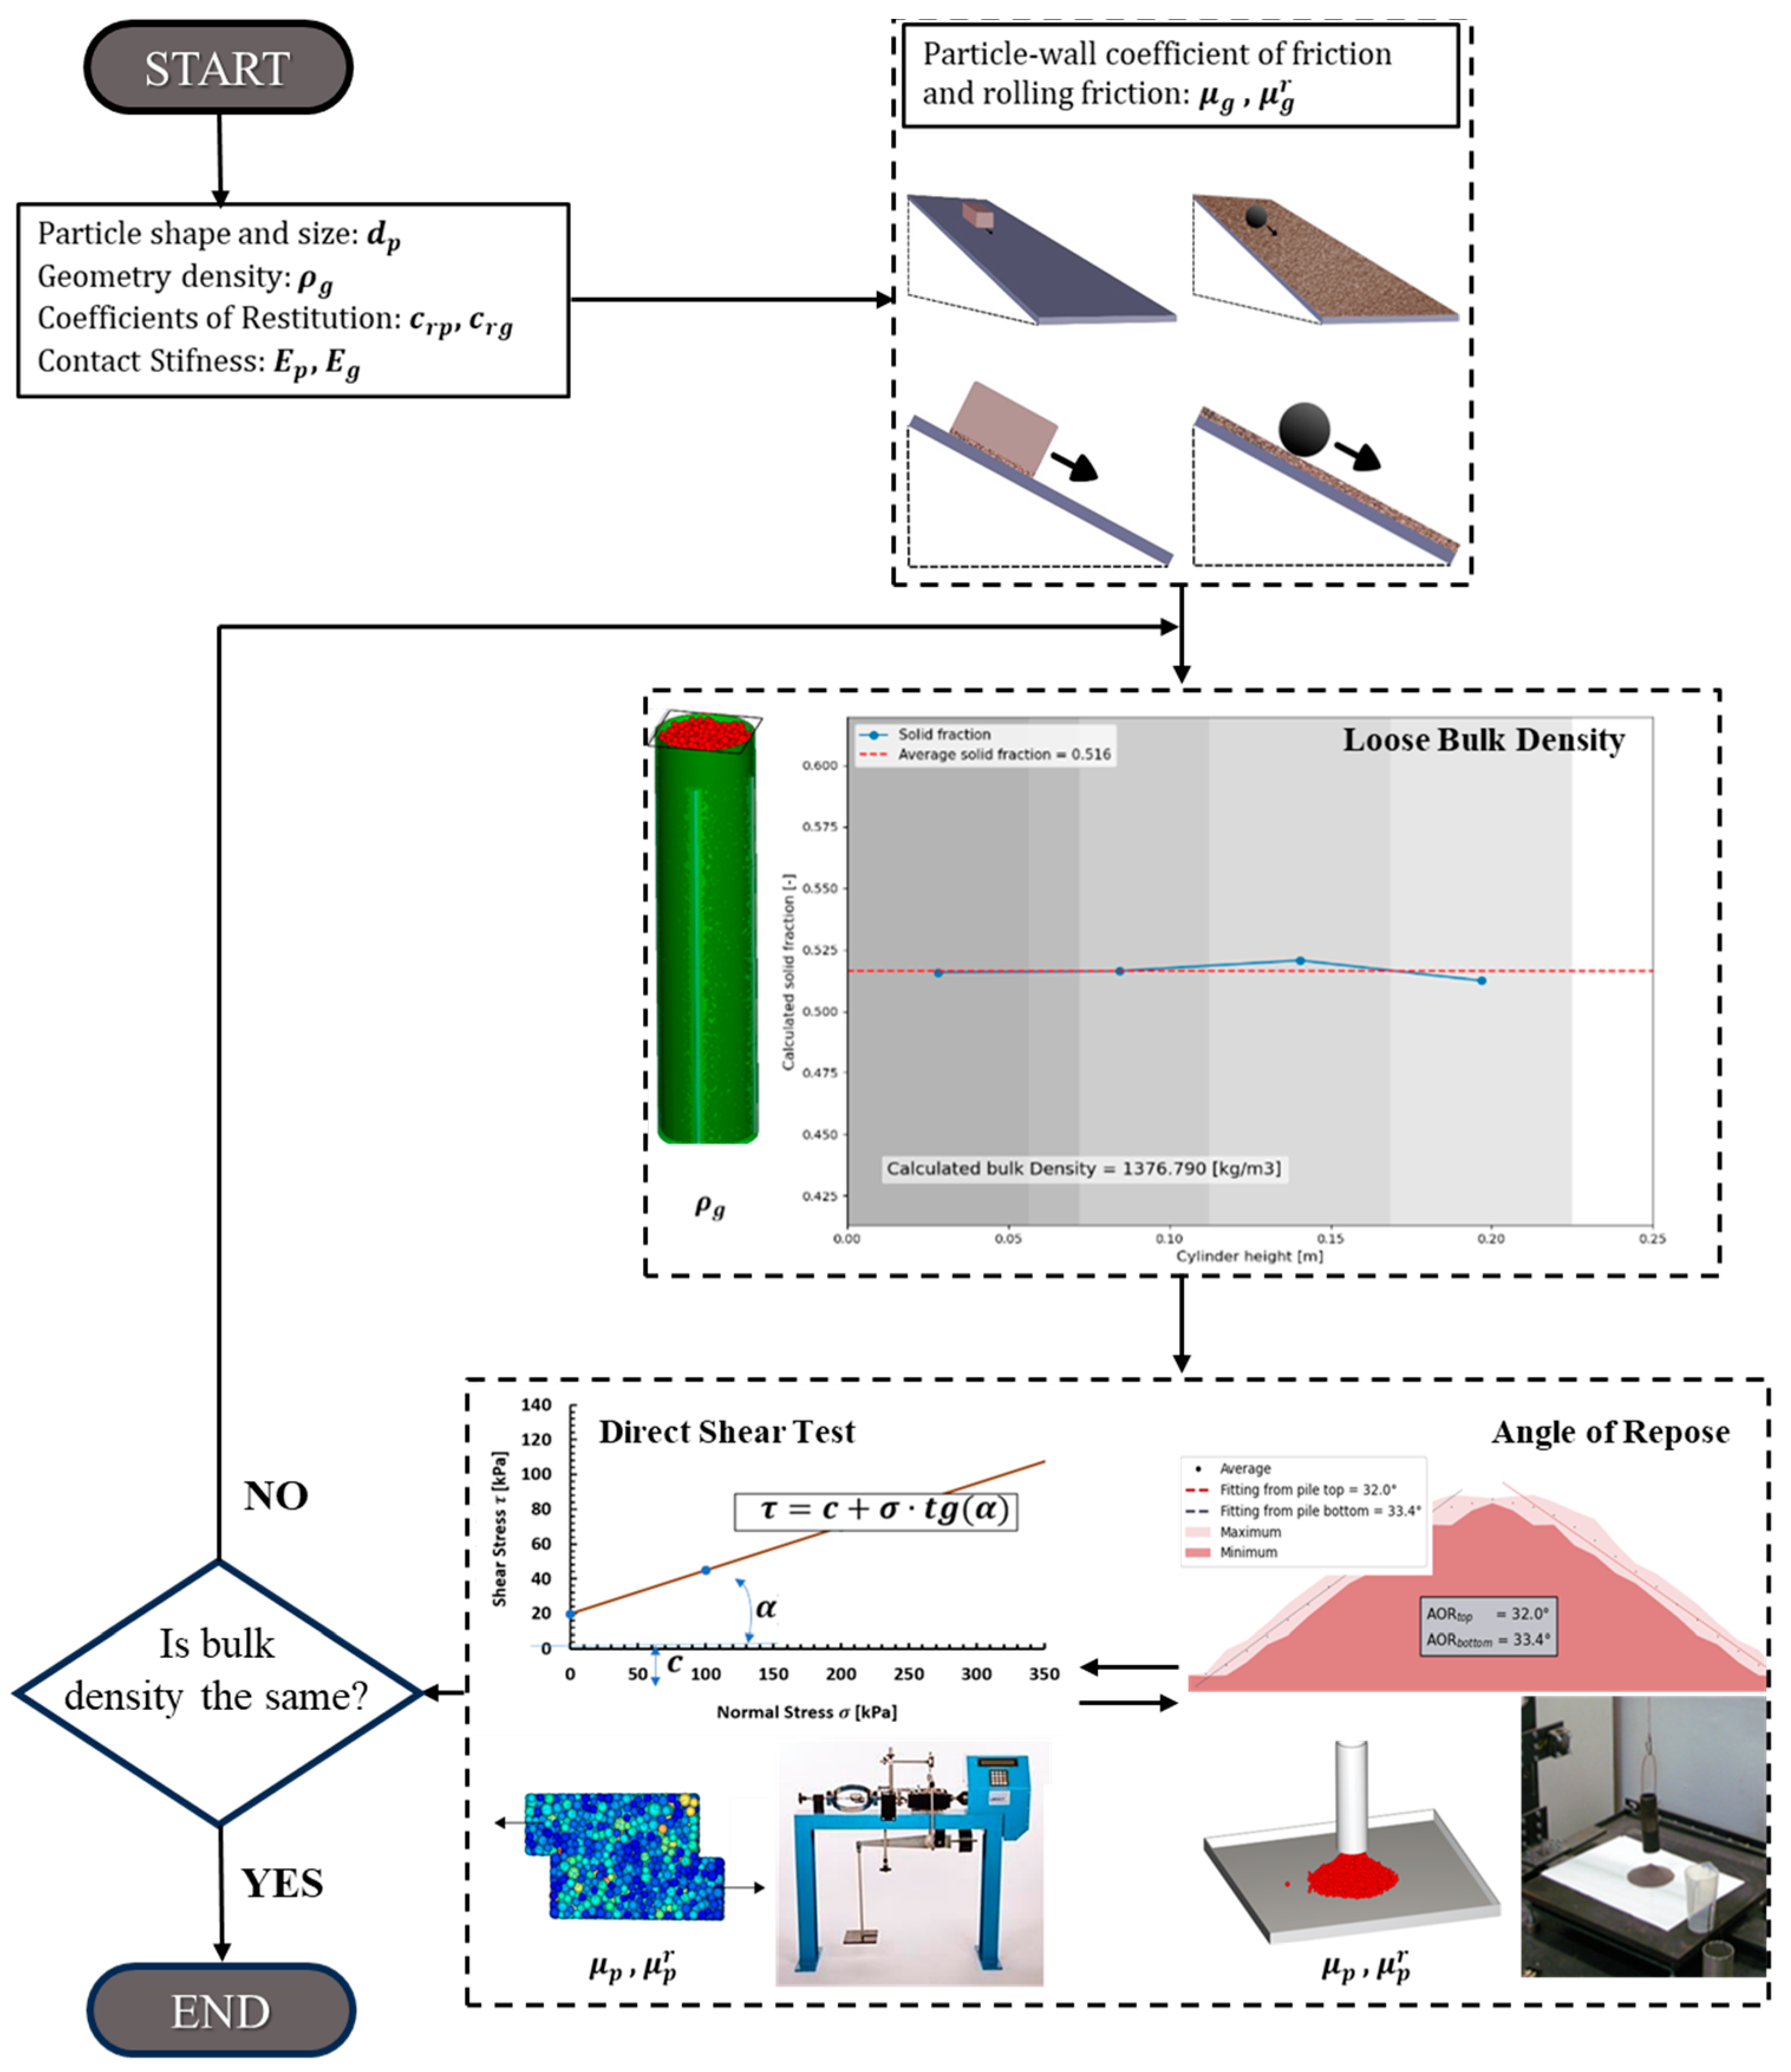
2.3. Numerical Calibration

| Property | Unit | Value | Note/Reference |
|---|---|---|---|
| Geometry: | |||
| Geometry density | [/] | Structural steel [46] | |
| Young’s modulus | [Pa] | Reduced modulus [46] | |
| Poisson ratio | [–] | 0.3 | Structural steel [46] |
| Particle: | |||
| Young’s modulus | [Pa] | Reduced modulus [40,41] | |
| Poisson ratio | [–] | 0.4 | Abrasive sand [41] |
| Mean Particle Diameter | [m] | 150 | Measured |
| Coarse graining | [–] | 18 | Coarse ratio |
| Bulk density | [/] | 1780 | Measured |
| Particle density | [/] | 3490 | Calibrated Figure 3 |
| Contact: | |||
| Hertz Mindlin | No Slip | ||
| Sliding friction p-p | [–] | 0.55 | Calibrated Figure 3 |
| Sliding friction p-g | [–] | 0.6 | Determined—Inclined plate |
| Rolling friction p-p | [–] | 0.1 | Calibrated Figure 3 |
| Rolling friction p-g | [–] | 0.1 | Determined—Inclined plate |
| Coeficient of Restitution p-p | [–] | 0.44 | Assumption based on [41] |
| Coeficient of Restitution p-g | [–] | 0.50 | Assumption based on [41] |
| Simulation: | |||
| DEM Particle count | [–] | 308,609 | - |
| FEM elements count | [–] | 2,138,521 | 4-noded quadratic tetrahedral elements |
| FEM element size | [mm] | 1.5 |
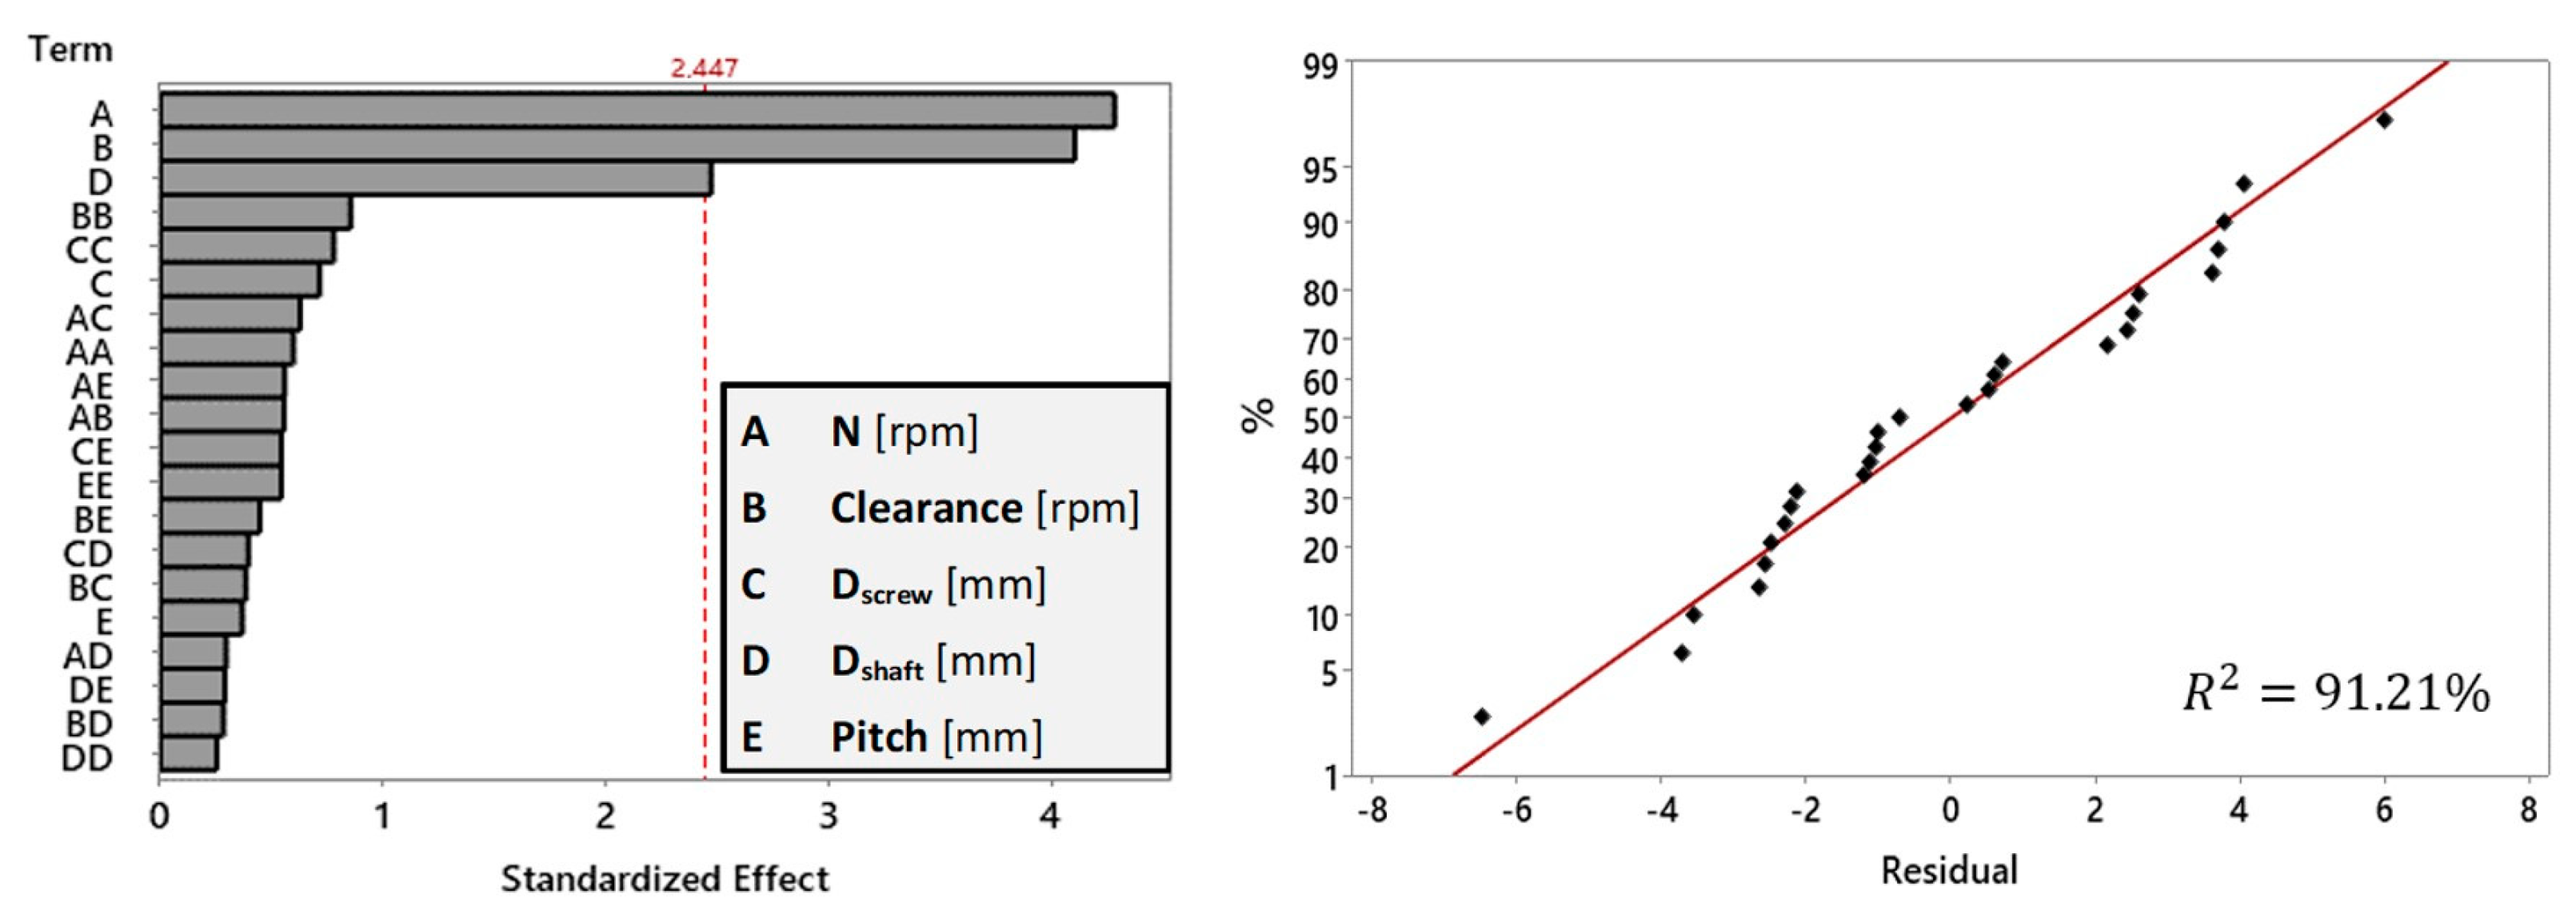
Design of Experiments
3. Results and Discussion
3.1. Parameters Optimization
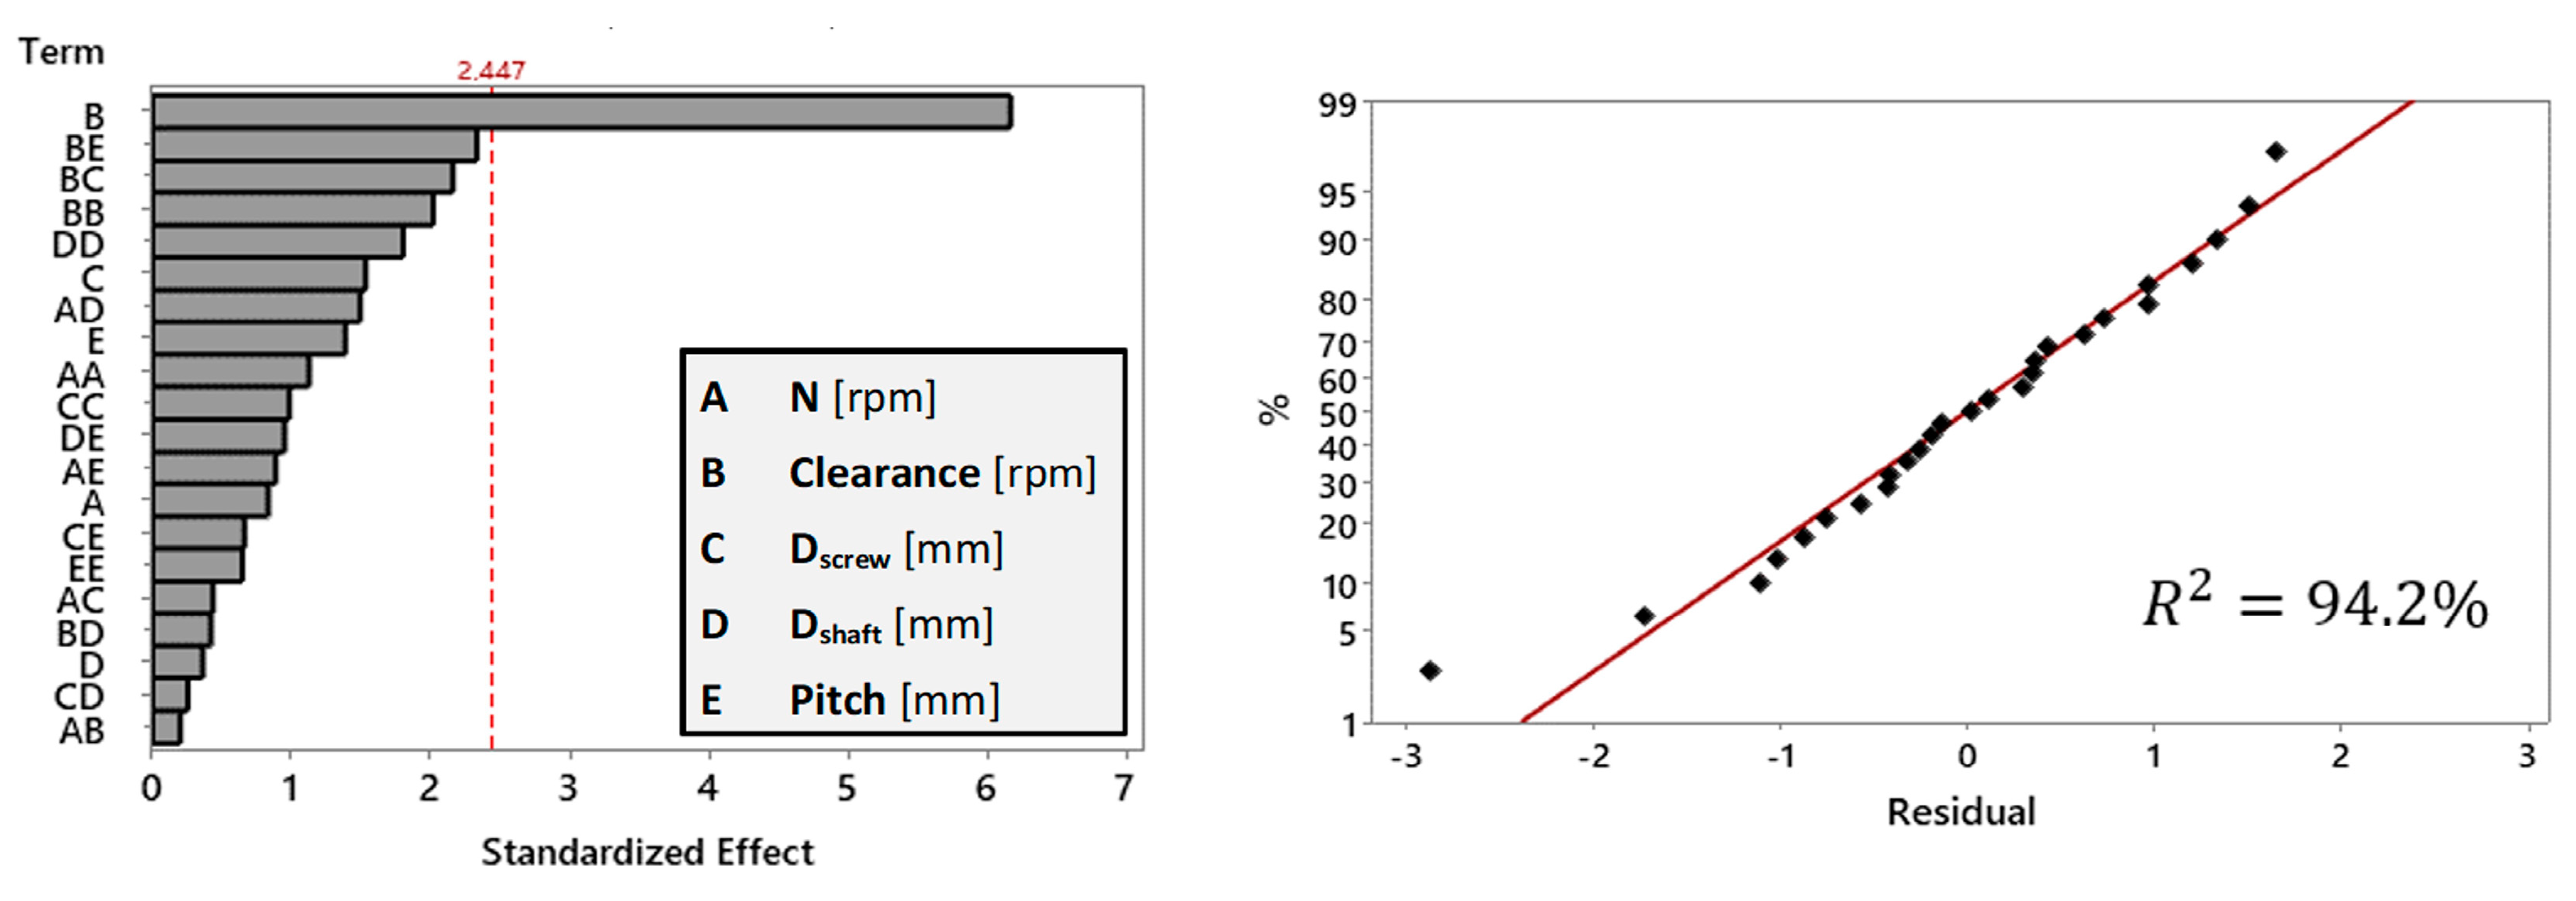
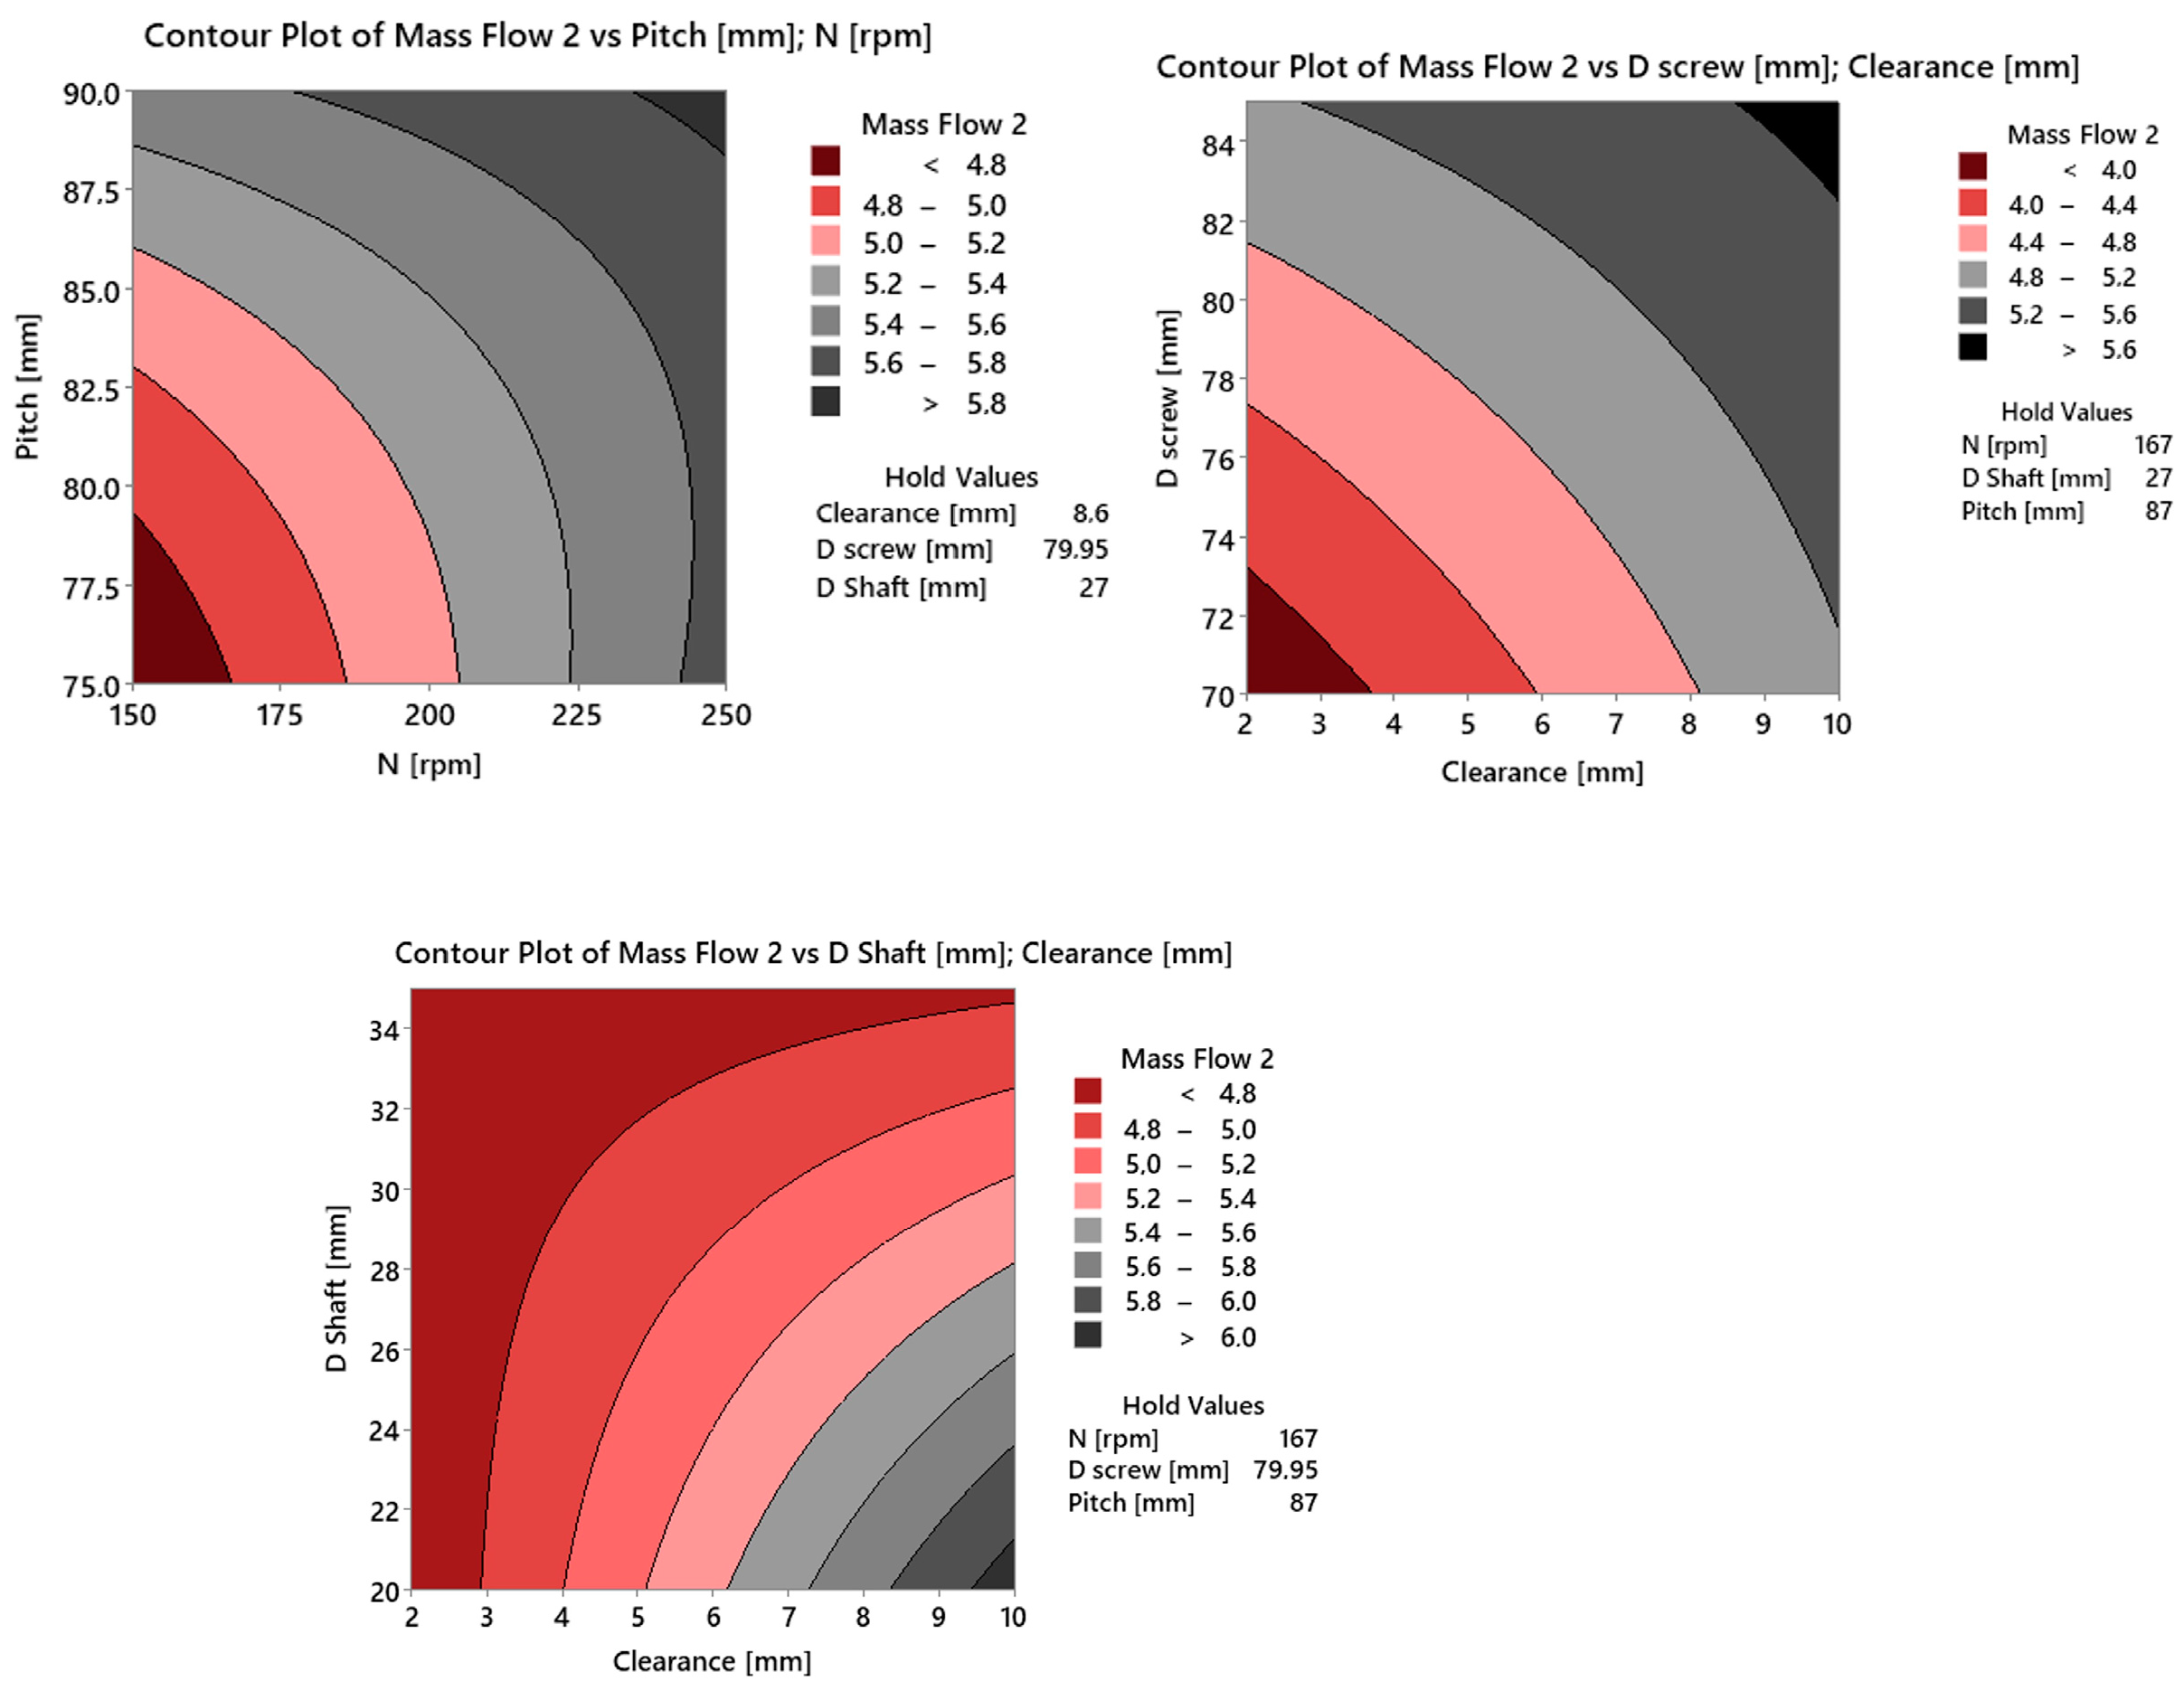
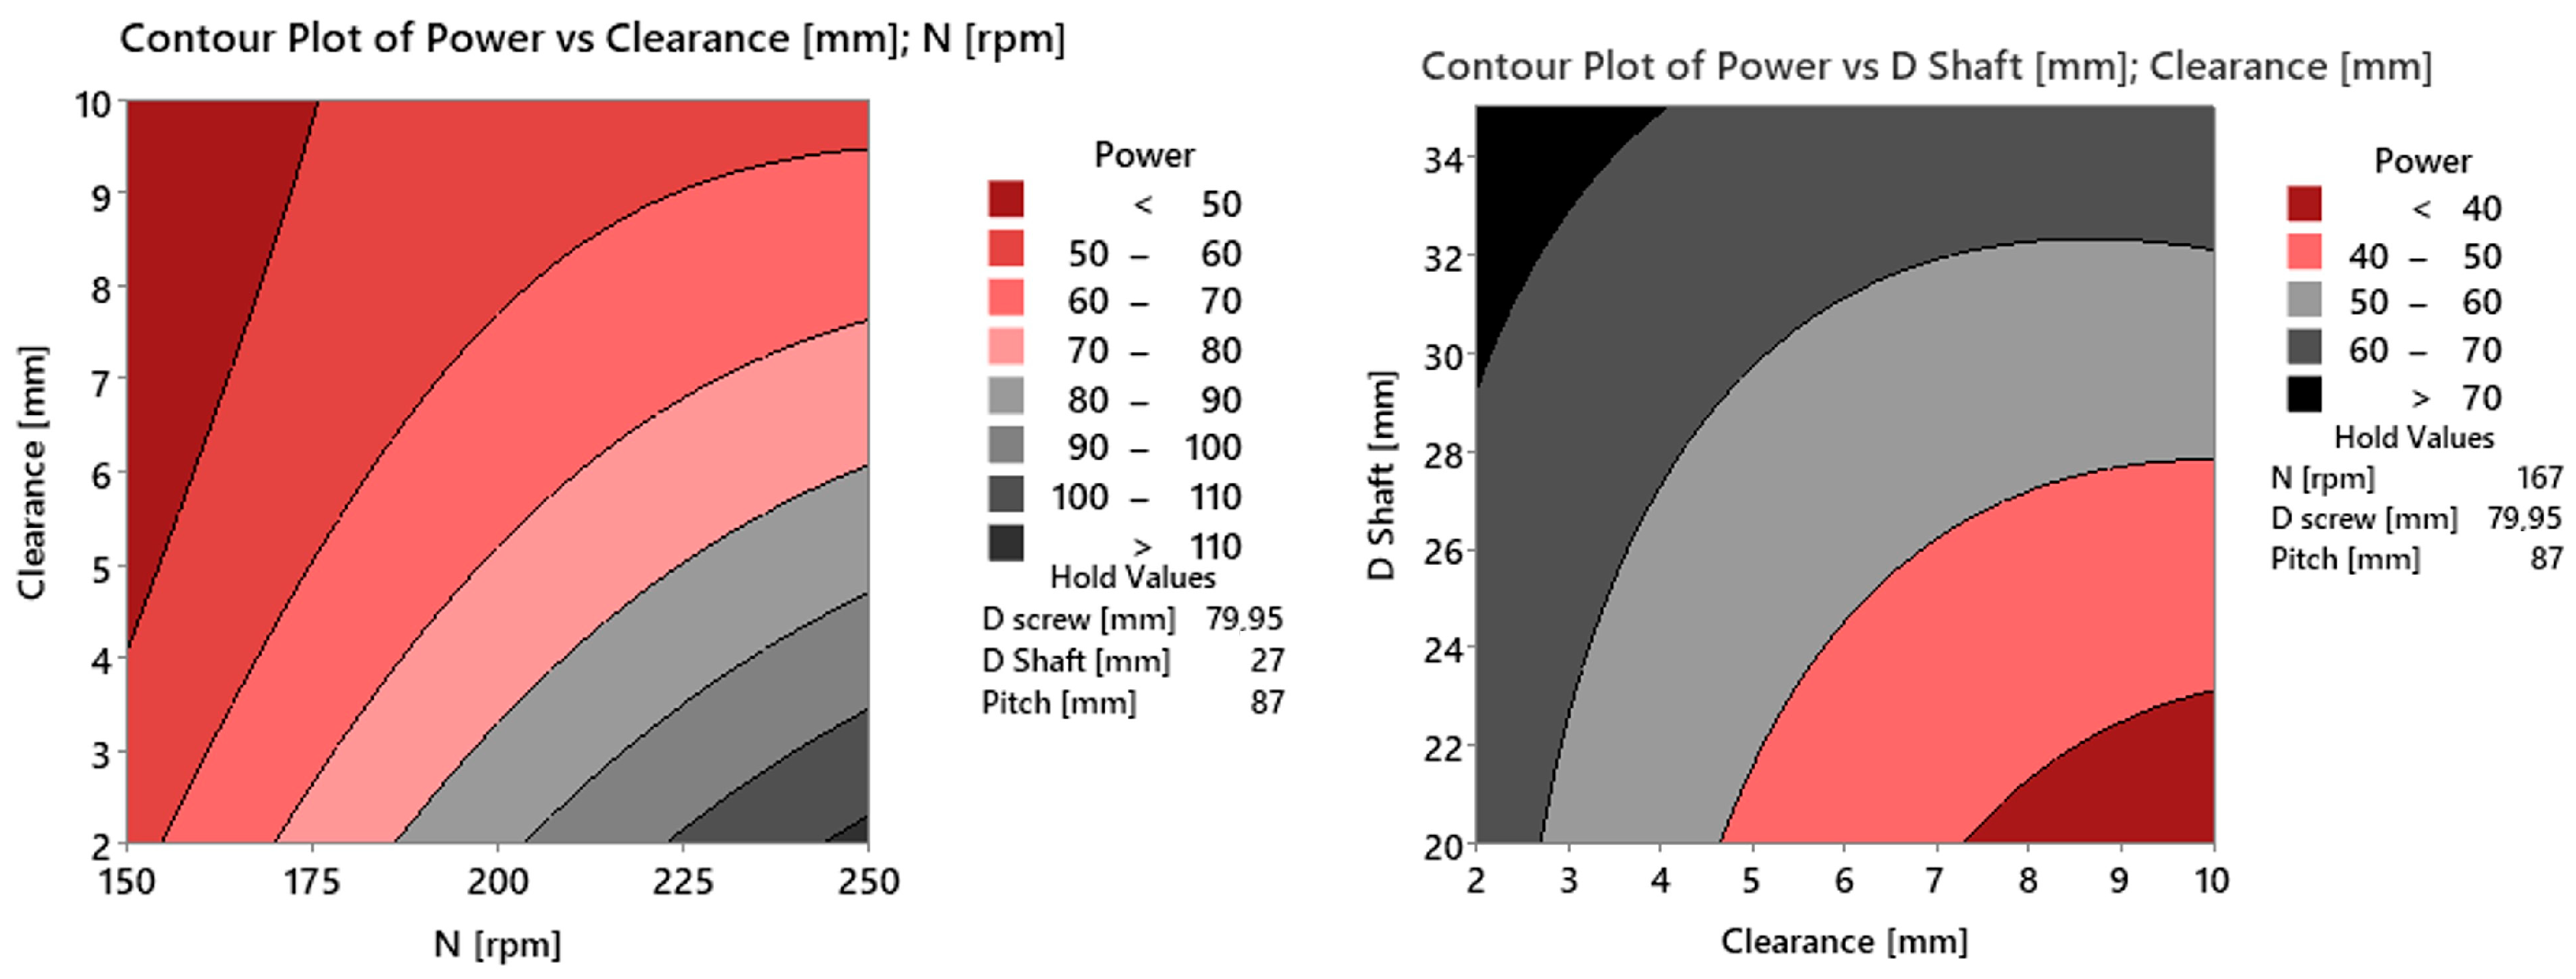
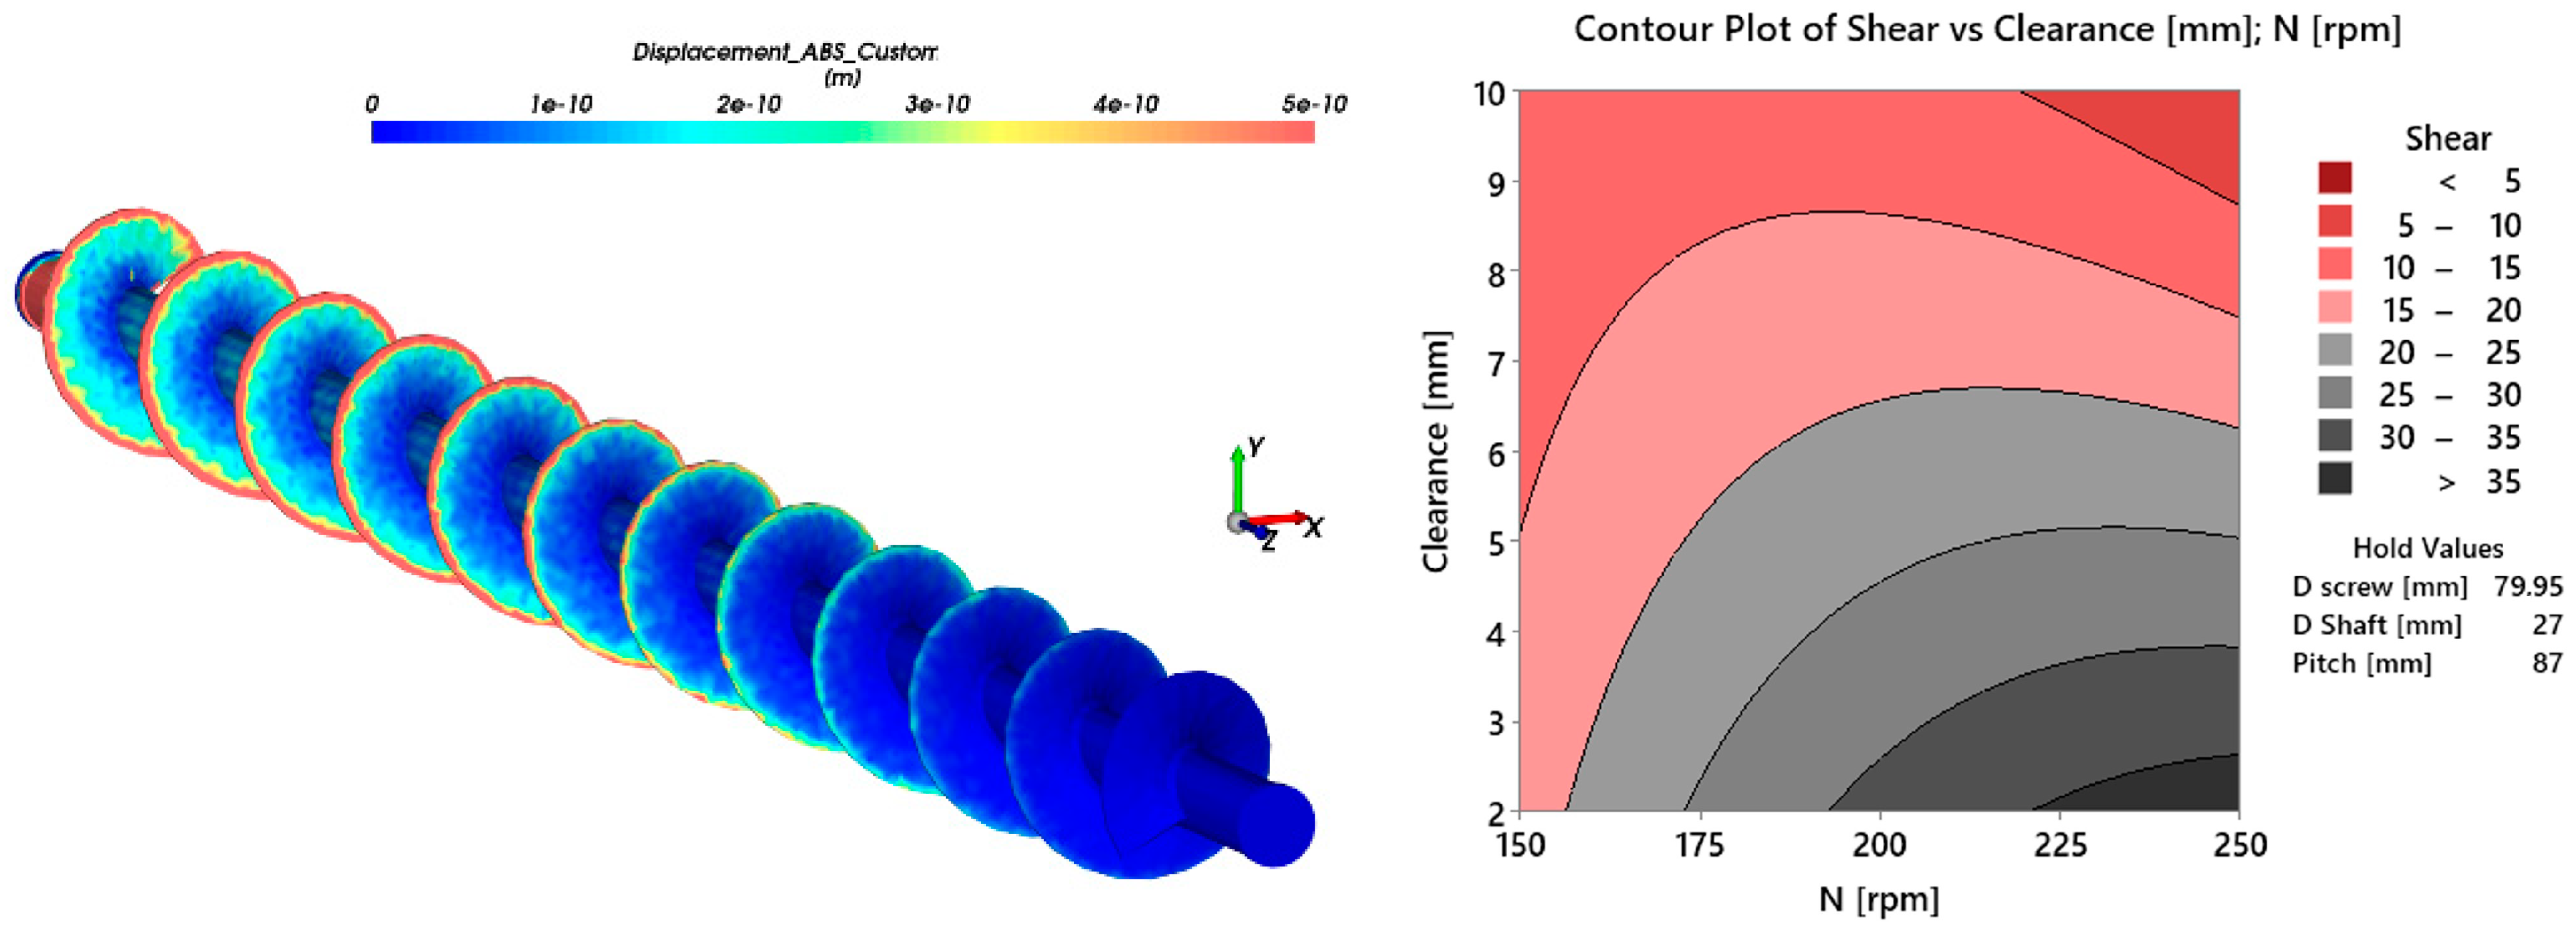
3.2. Response Surface
4. Conclusions
- Our research study focused on calibrating the abrasive powder material model to ensure an accurate representation of material behaviour. We successfully approximated and calibrated the abrasive powder material within DEM simulations. This calibration process was crucial for achieving verified material flow, laying a solid foundation for reliable and realistic simulations.
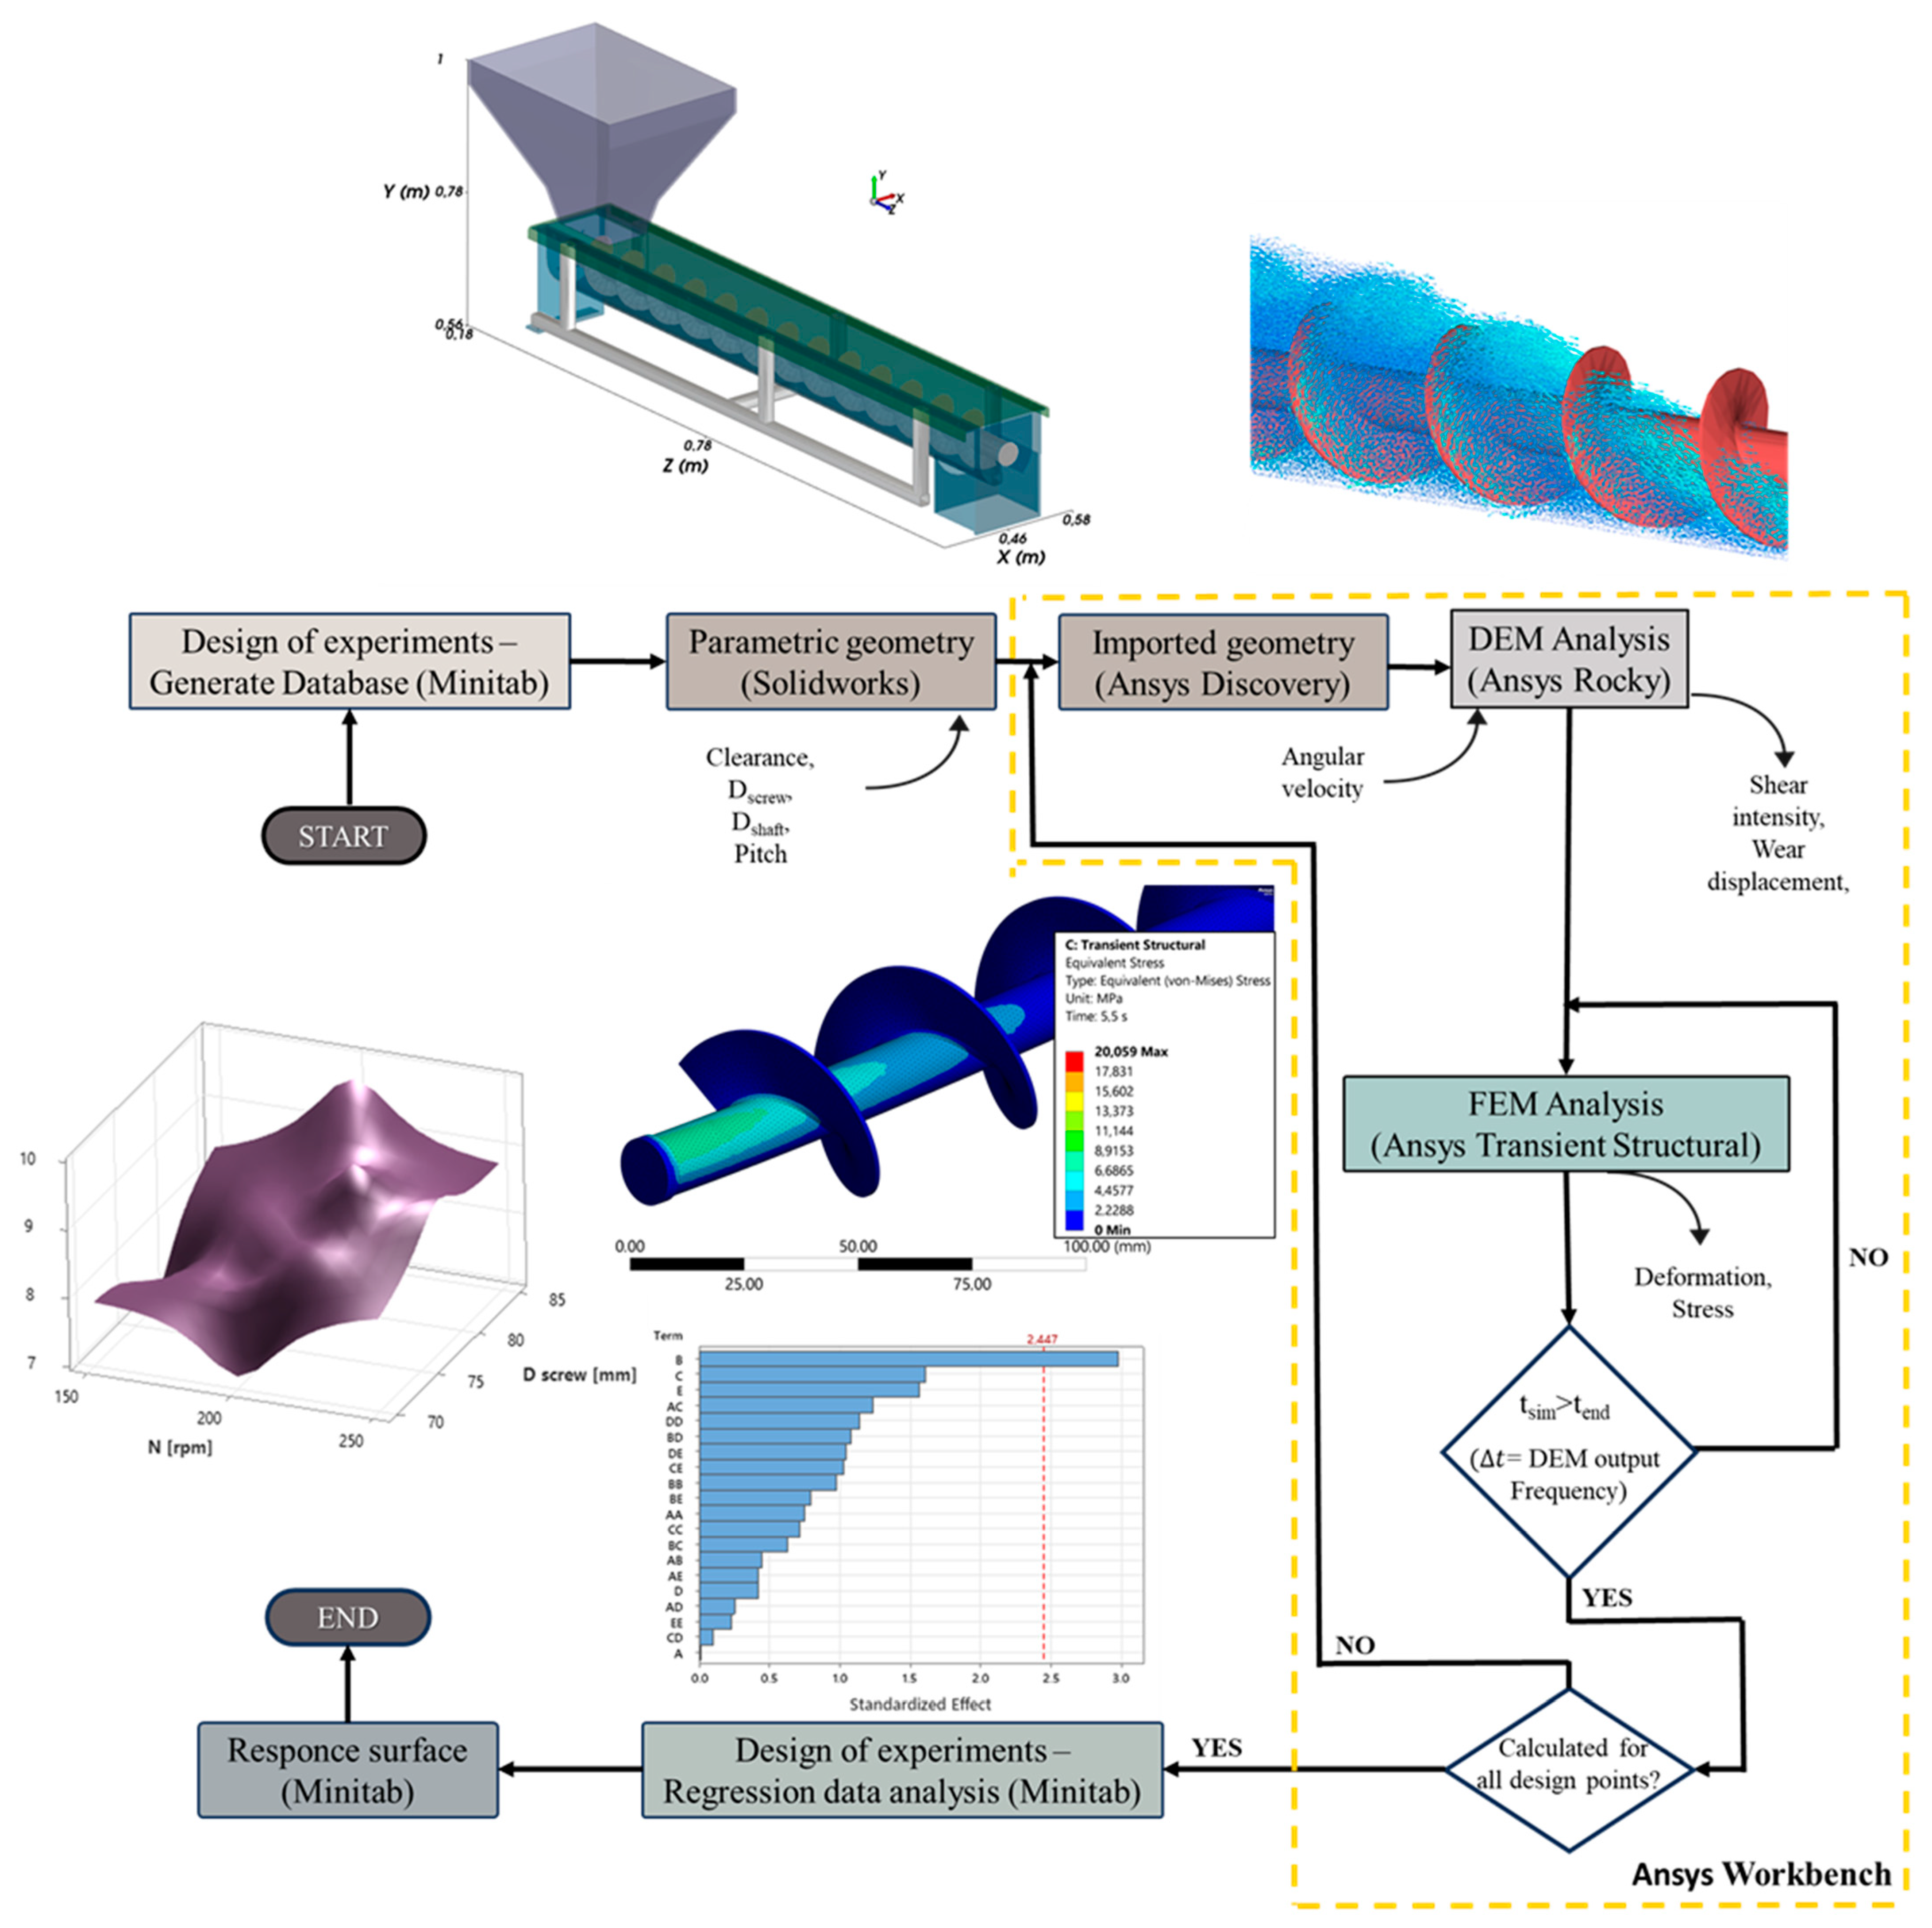
- During the research, we build an advanced numerical model that integrates parametric modelled geometry, DEM, FEM, DOE and response surface optimization to simulate the complex environment of the screw conveyor. The automated parametric numerical model facilitates the exploration of various operating conditions and design parameters, offering valuable insights into the performance of the screw conveyor, wear depth, and structural adequacy of the screw blade.
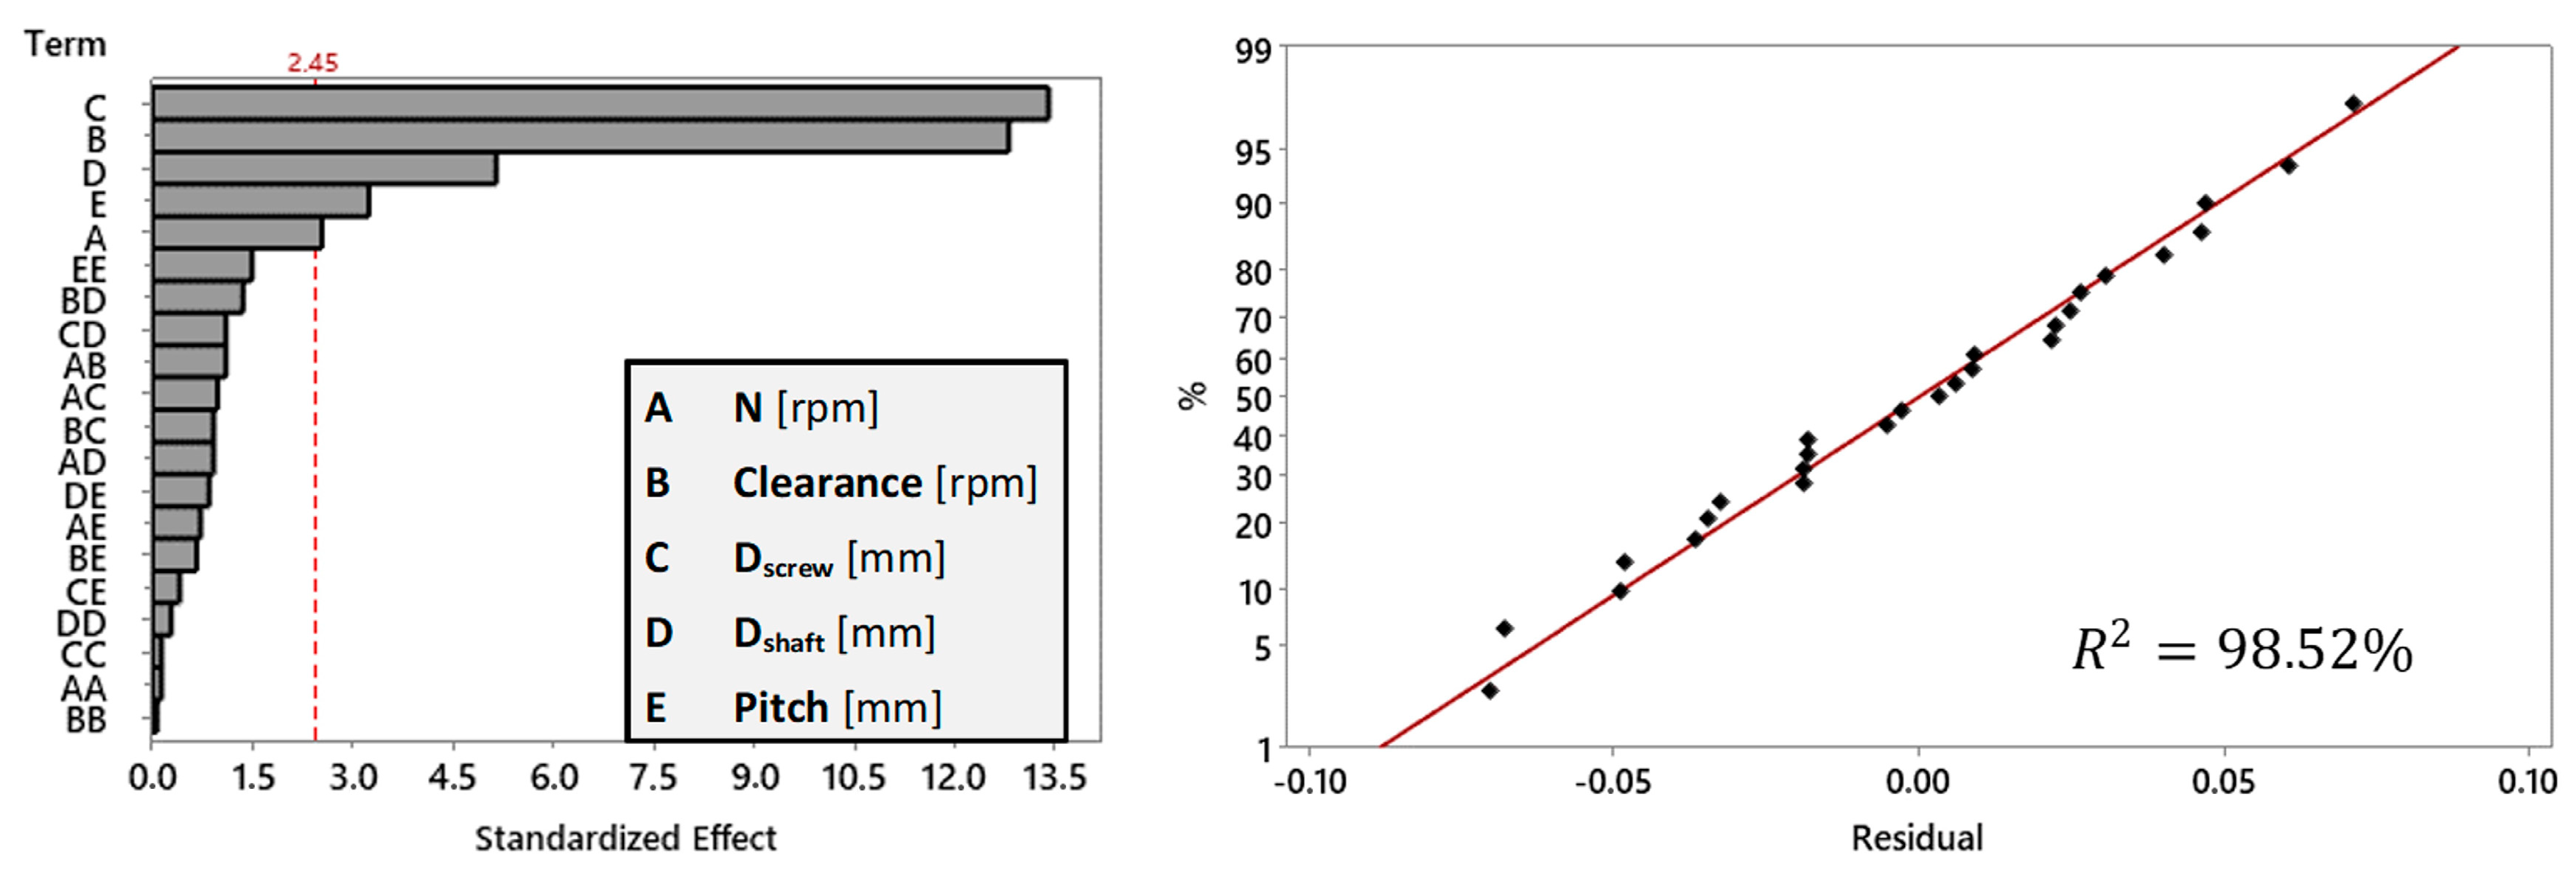
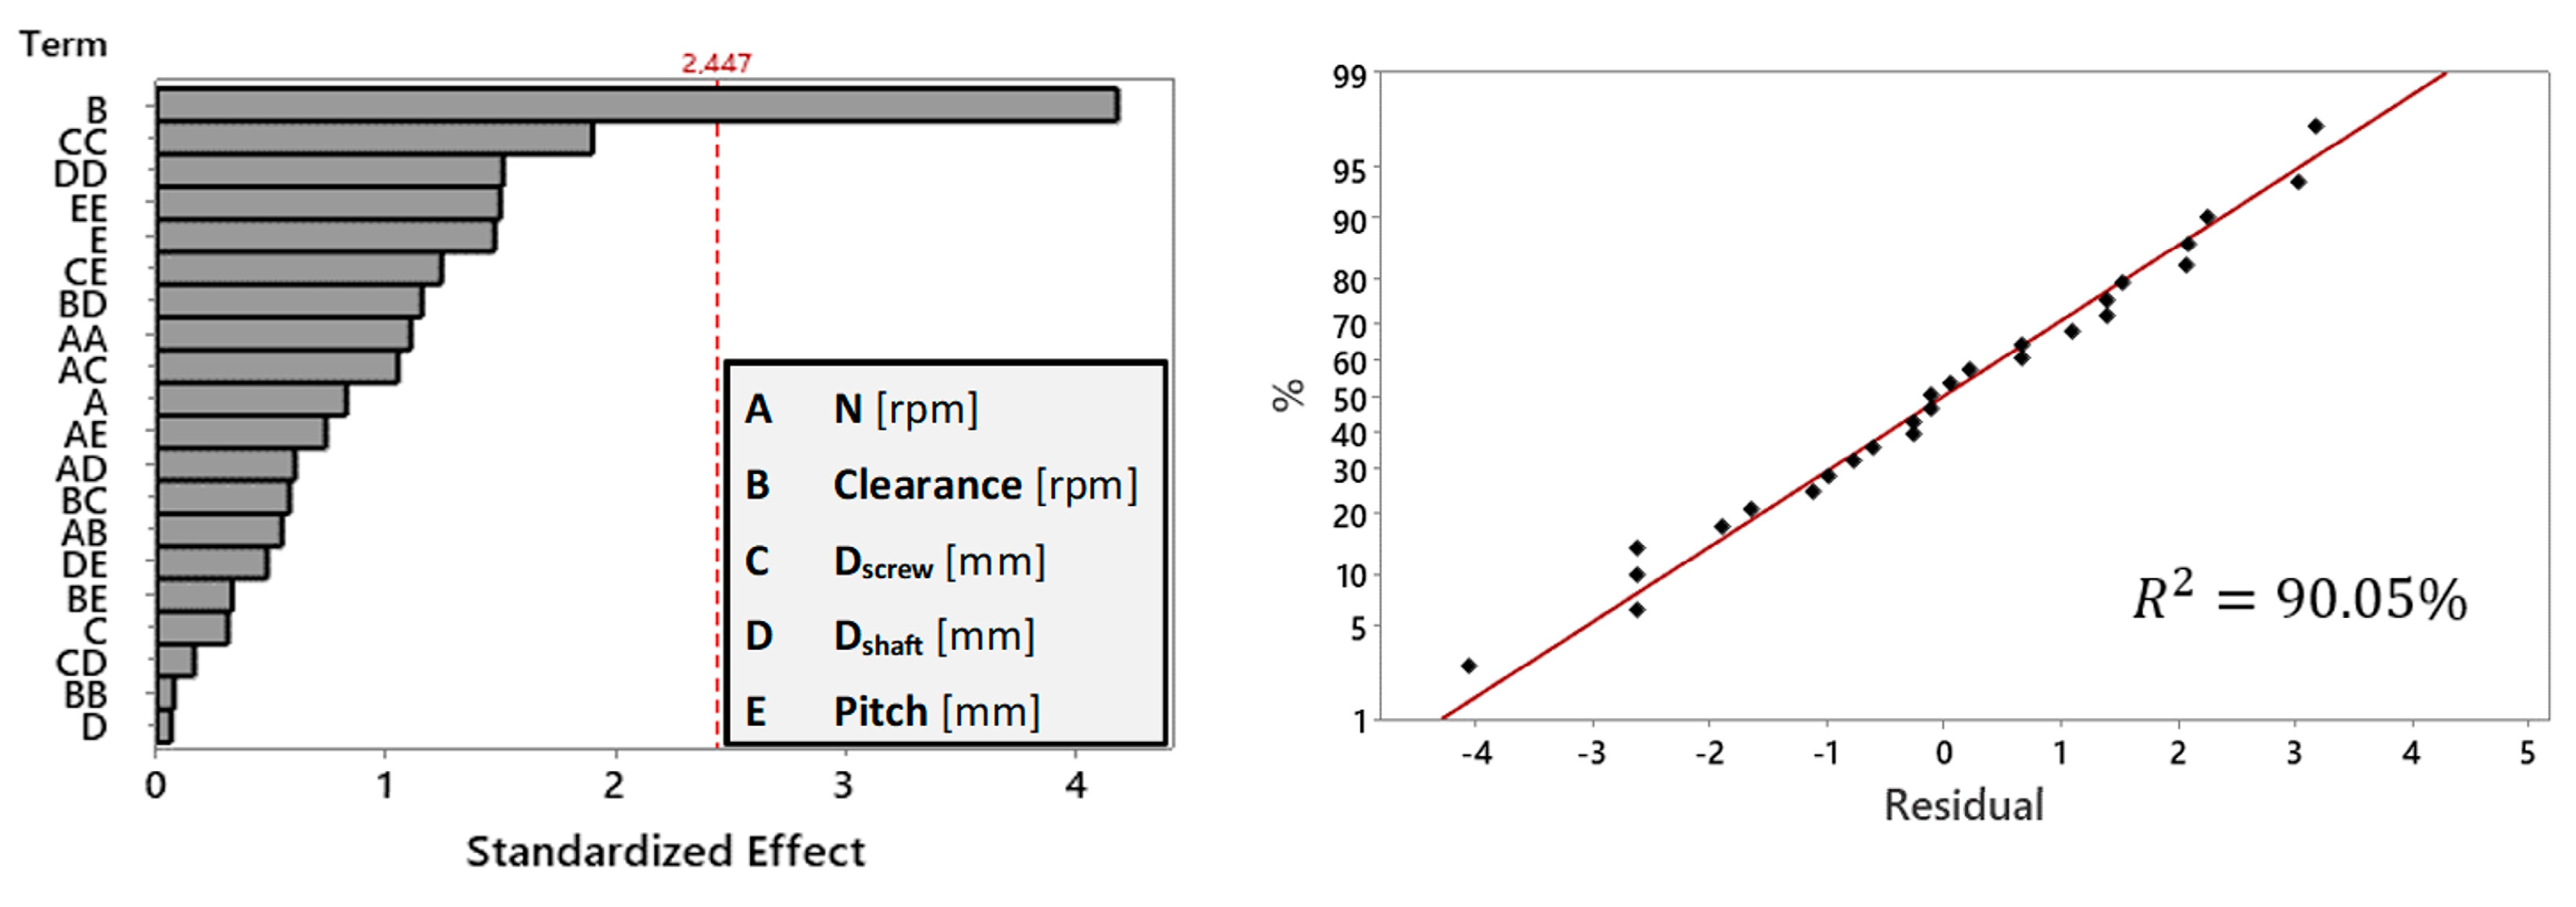
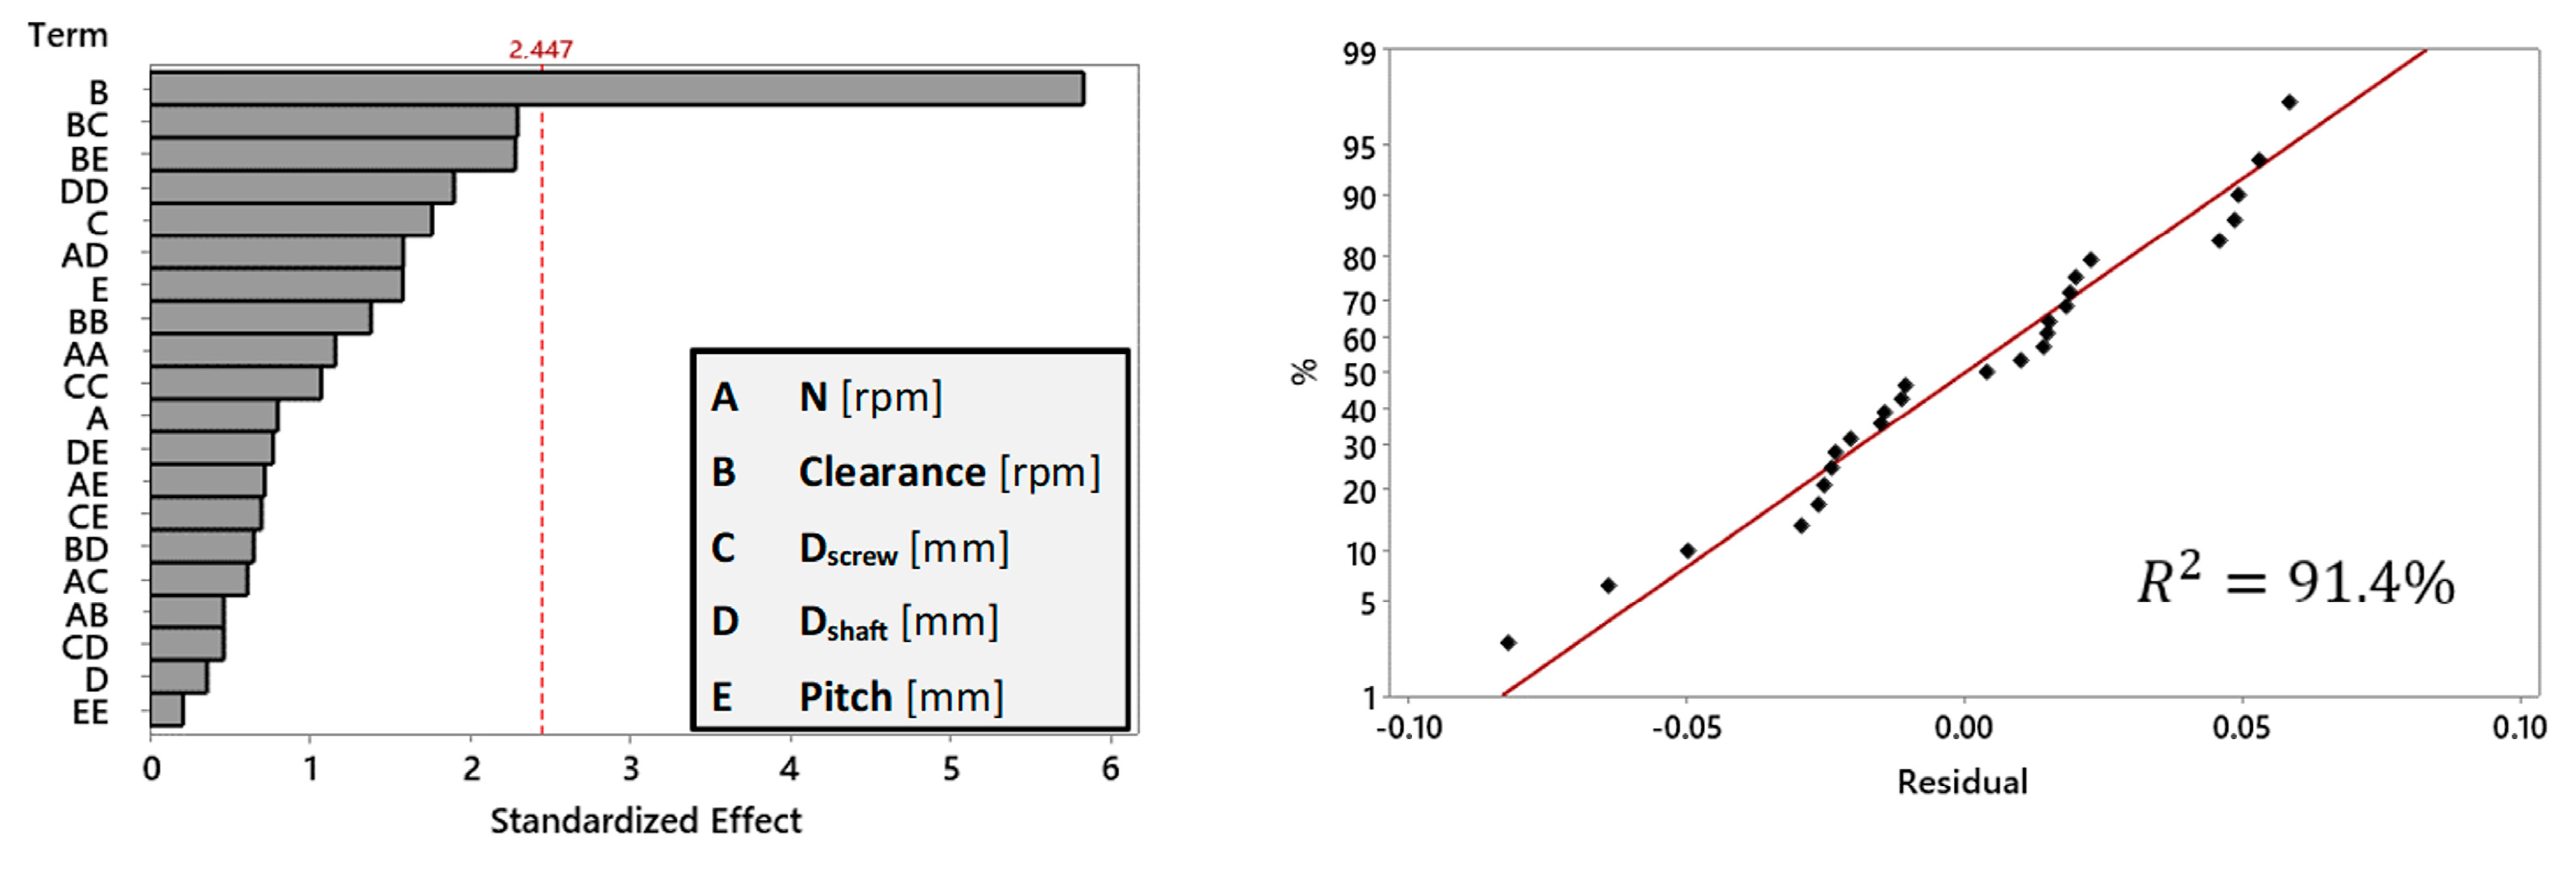
- Clearance has emerged as an important parameter in the optimization process. The mass flow rate demonstrates an increase as the clearance widens, this contributes to the expanded area between the screw blade and the housing. This feature results in a higher mass flow rate. Additionally, as expected, clearance was found to have the most significant influence on power consumption, wear depth, stress, and deformations. Moreover, because of the complexity of the employed material coarse-graining methodology, particle shape and size underwent approximation and adjustment during the calibration process. Consequently, “particle entrapment” between the screw blade and the housing may also occur. Further studies incorporating real particle shape and size are of major importance in order to fully address the clearance effect. It’s crucial to acknowledge that neglecting this aspect may lead to potentially misleading results.
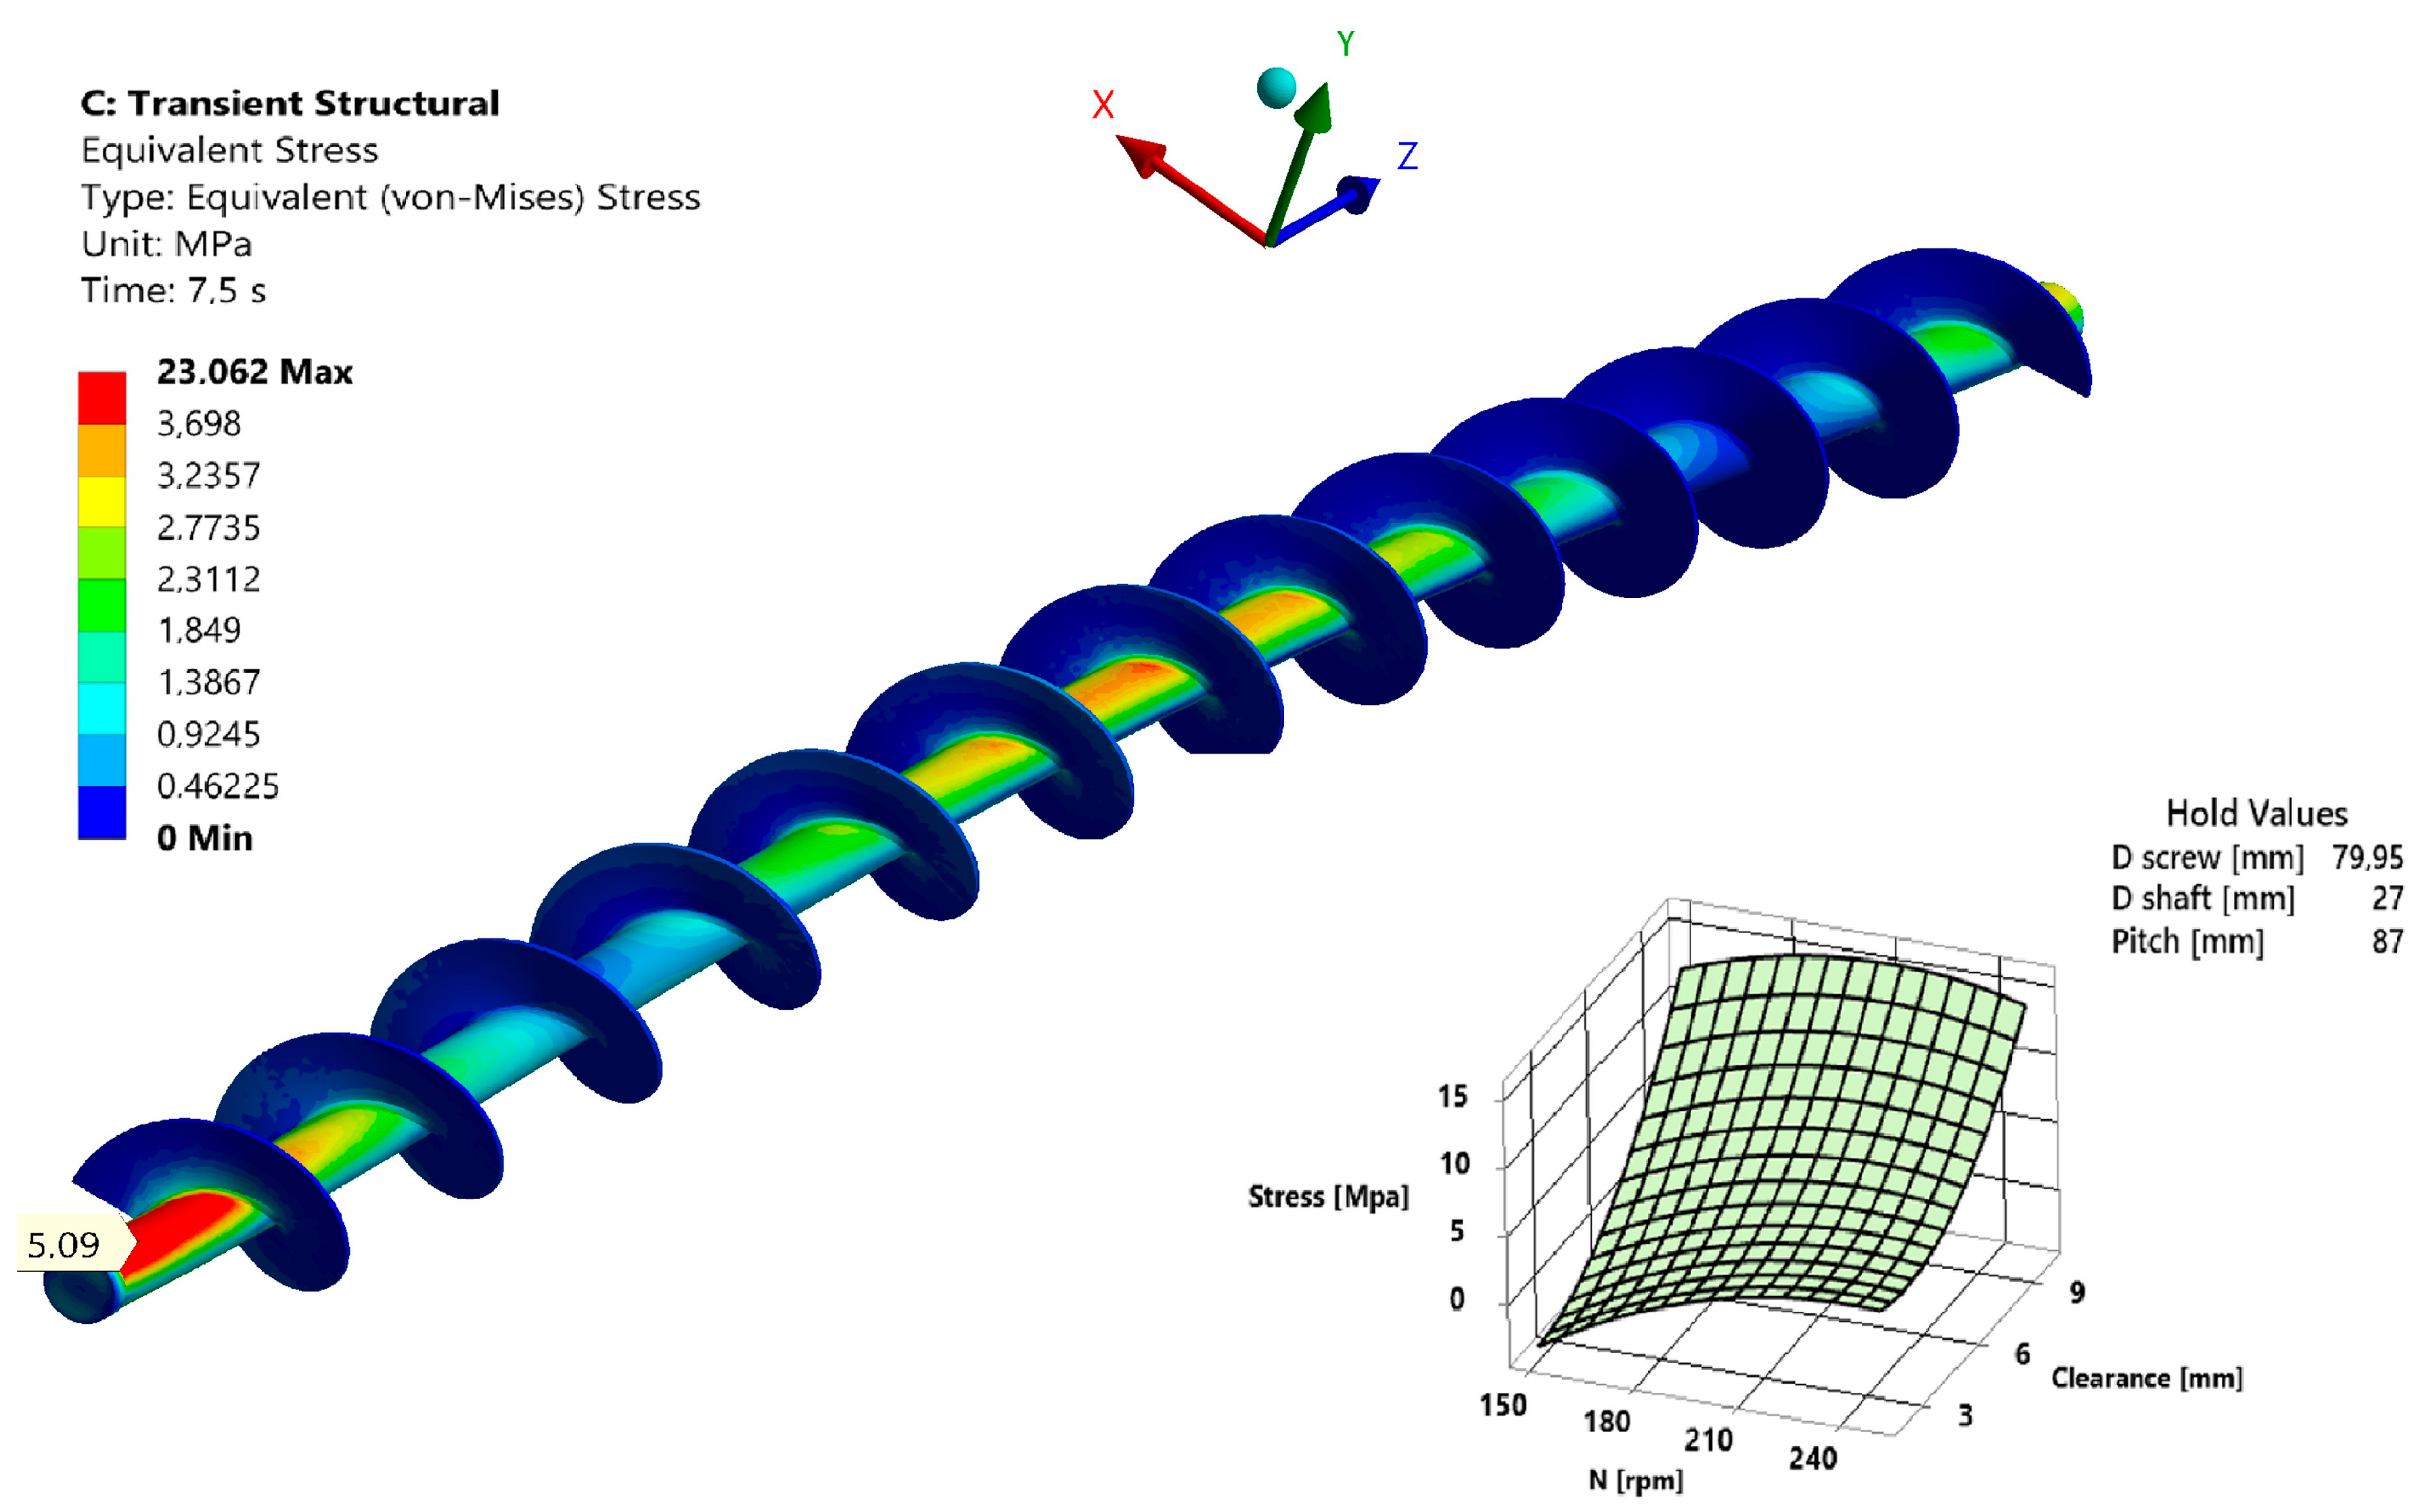
- During the simulations, the stresses on the screw blade were identified to be minor, therefore we have excluded them from further consideration in the optimization phase, which exclusively prioritized wear depth and mass flow.
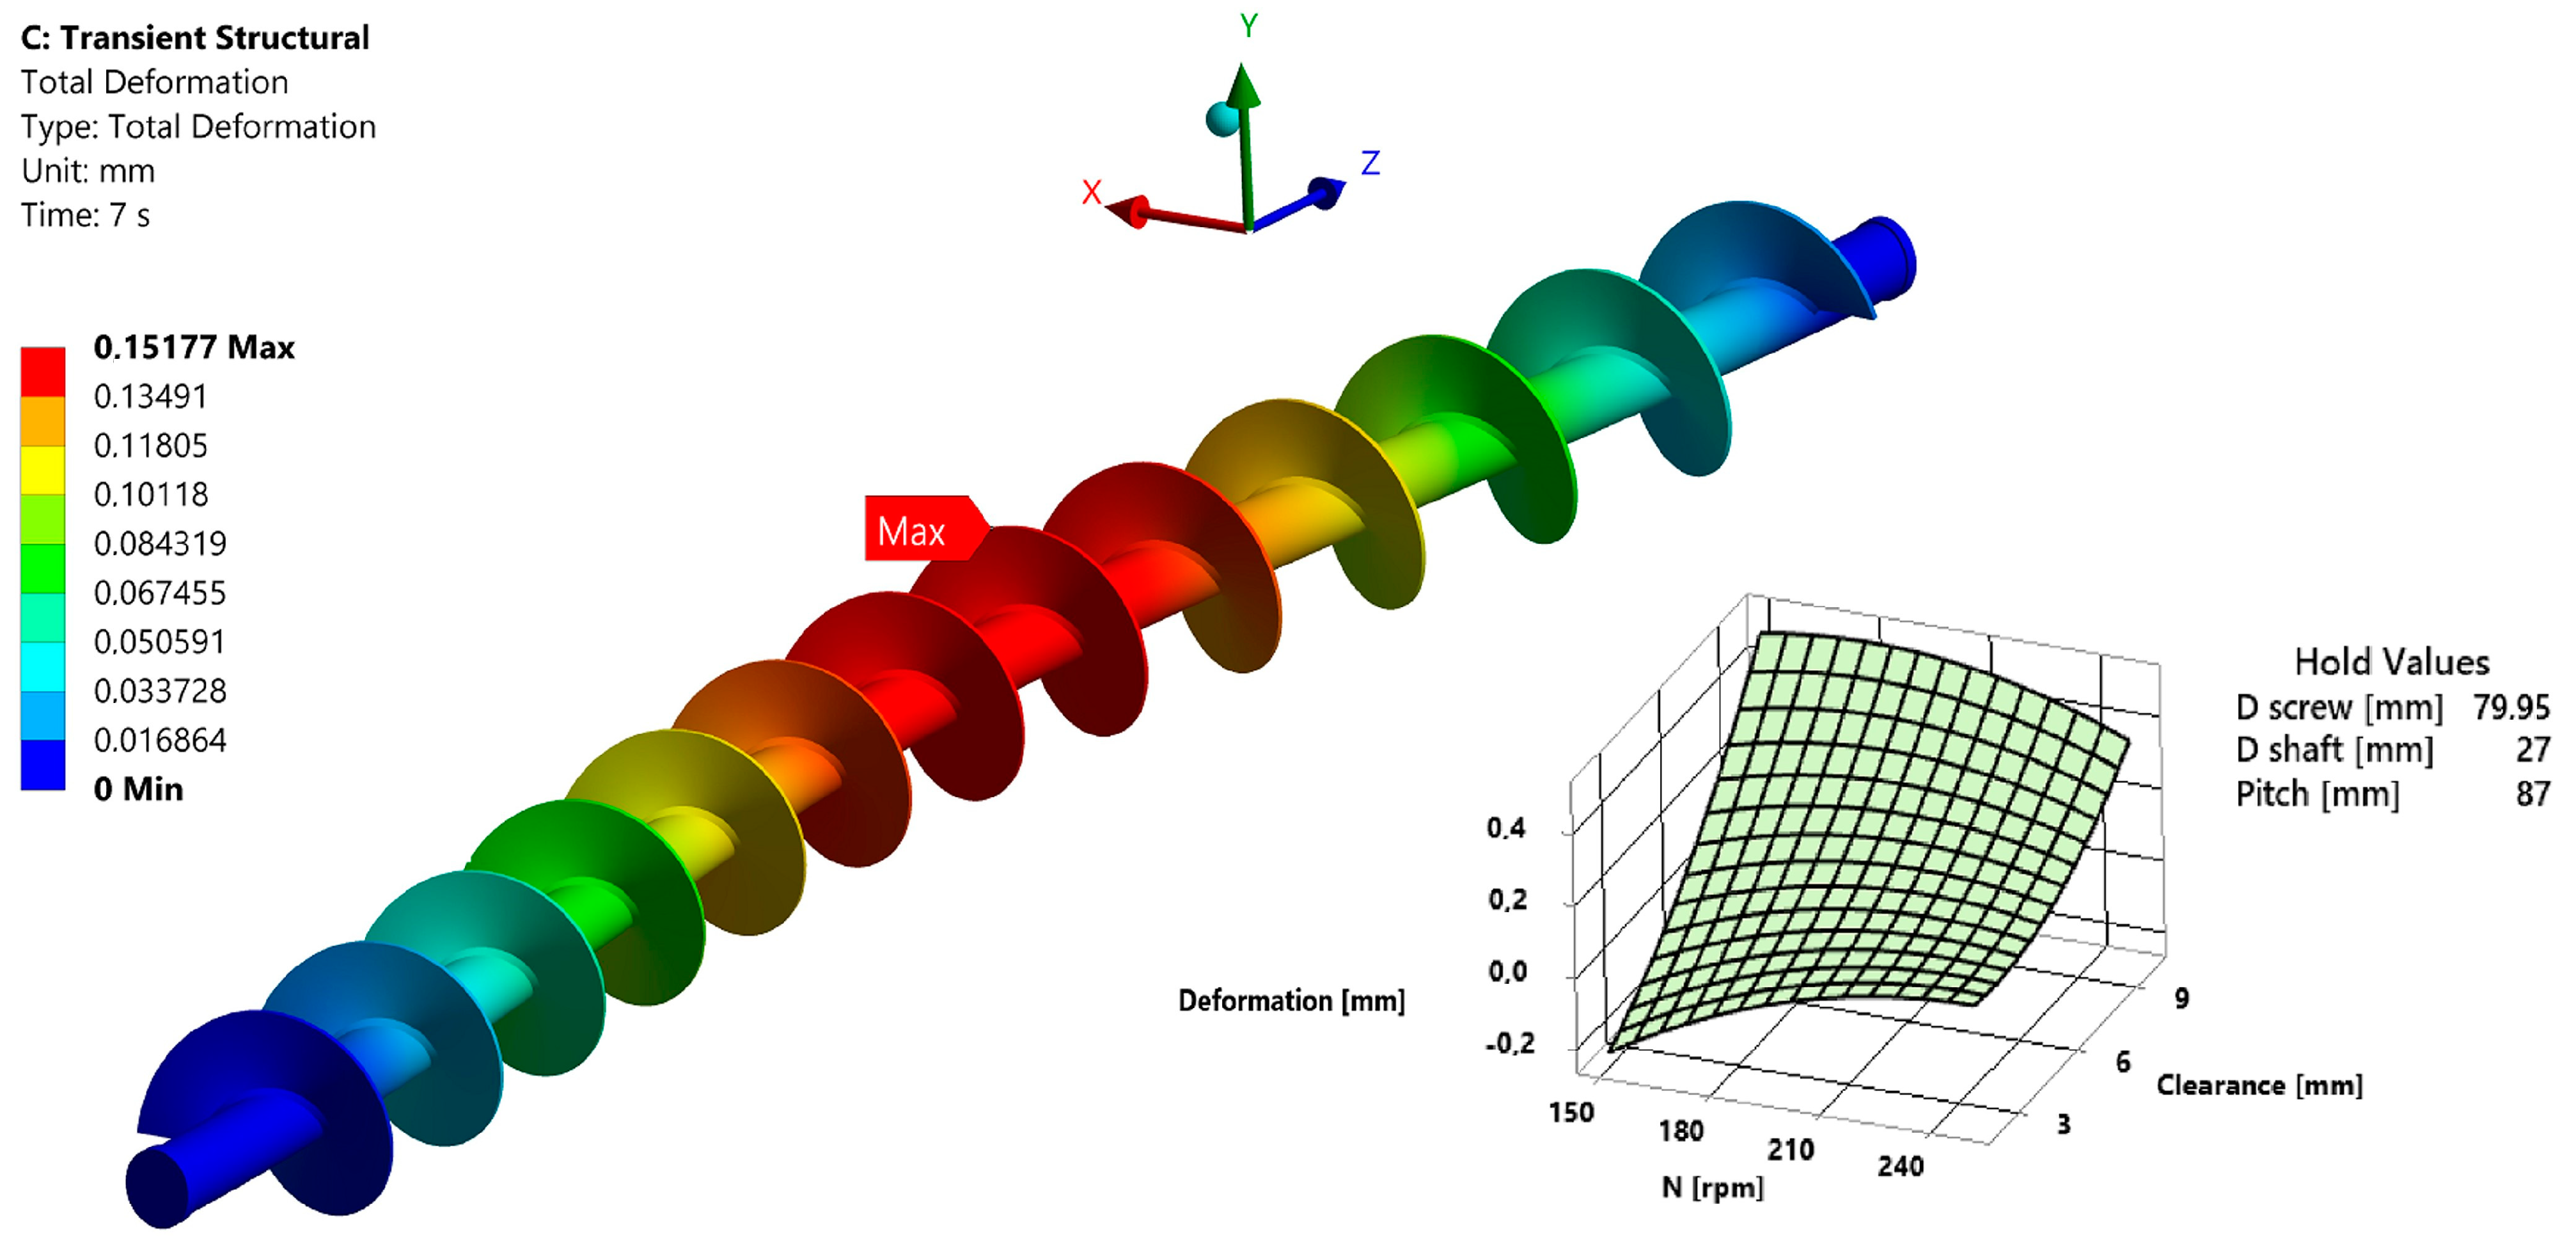
- Through the utilization of the Design of Experiments, we systematically investigated critical parameters such as screw pitch, clearance, wear depth, rotational velocity, and additional structural factors. We demonstrated how this systematic investigation allows us to not only analyze the individual effects of each parameter but also to consider their interdependencies. The optimization process was a success in focusing on mass flow and reducing wear depth. After carefully studying and applying small adjustments, we achieved our goals. We found an optimal set of factors that would give us a good balance between the mass flow and wear depth. In future studies focusing on screw conveyors where stresses and deformations are higher, it would be beneficial, to include structural parameters in the optimization process (shaft thickness etc.).
Author Contributions
Funding
Institutional Review Board Statement
Informed Consent Statement
Data Availability Statement
Acknowledgments
Conflicts of Interest
References
- Schulze, D. Powders and Bulk Solids: Behavior, Characterization, Storage and Flow; Springer: Berlin, Germany; New York, NY, USA, 2008; ISBN 978-3-540-73767-4. [Google Scholar]
- Sousani, M.; Pantaleev, S. Understanding Powder Behavior in an Additive Manufacturing Process Using DEM. Processes 2022, 10, 1754. [Google Scholar] [CrossRef]
- Gelnar, D.; Zegzulka, J. Discrete Element Method in the Design of Transport Systems: Verification and Validation of 3D Models; Springer International Publishing: Cham, Switzerland, 2019; ISBN 978-3-030-05712-1. [Google Scholar]
- Battimelli, G.; Ciccotti, G. Berni Alder and the Pioneering Times of Molecular Simulation. Eur. Phys. J. H 2018, 43, 303–335. [Google Scholar] [CrossRef]
- Cundall, P.A.; Strack, O.D.L. A Discrete Numerical Model for Granular Assemblies. Géotechnique 1979, 29, 47–65. [Google Scholar] [CrossRef]
- Jiang, S.B.; Huang, S.; Zeng, Q.L.; Wang, C.L.; Gao, K.D.; Zhang, Y.Q. Dynamic Properties of Chain Drive System Considering Multiple Impact Factors. Int. J. Simul. Model. 2022, 21, 284–295. [Google Scholar] [CrossRef]
- McGlinchey, D. (Ed.) Bulk Solids Handling: Equipment Selection and Operation; Blackwell Pub: Oxford, UK; Ames, IA, USA, 2008; ISBN 978-1-4051-5825-1. [Google Scholar]
- Orlik, A.G.; Orlik, G.V.; Kobernik, N.V.; Mikheev, R.S. Arc Deposition of Abrasion Wear-Resisting Coatings on the Working Surfaces of Conveyor Screws. Weld. Int. 2017, 31, 945–950. [Google Scholar] [CrossRef]
- Cao, K.; Li, X.H.; Gao, H.D.; Zhang, L.X.; You, F. Design and Analysis of a Vertical Screw Stirring Device for Feeding Dairy Goats. Int. J. Simul. Model. 2023, 22, 462–473. [Google Scholar] [CrossRef]
- Lian, G.; Zhong, W.; Liu, X. DEM Study on the Mixed Feeding Process of Coal and Cylindroid Biomass Particles in a Screw Feeder. Adv. Powder Technol. 2021, 32, 2543–2554. [Google Scholar] [CrossRef]
- Jacob, F. Bulk Materials Handing Handbook; Springer: New York, NY, USA, 2013; Volume 2013. [Google Scholar]
- Roberts, A.W. Design and Performance Criteria for Screw Conveyors in Bulk Solids Operation. Bulk Solids Handl. 2002, 22, 436–444. [Google Scholar]
- Roberts, A.W. The Influence of Granular Vortex Motion on the Volumetric Performance of Enclosed Screw Conveyors. Powder Technol. 1999, 104, 56–67. [Google Scholar] [CrossRef]
- Katterfeld, A.; Roberts, A.; Wheeler, C.; Williams, K.; Wensrich, C.; Scholten, J.; Jones, M.; Kunze, G.; Strubelt, H.; Ilic, D.; et al. Conveying and Construction Machinery. In Springer Handbook of Mechanical Engineering; Grote, K.-H., Hefazi, H., Eds.; Springer International Publishing: Cham, Switzerland, 2021; pp. 829–991. ISBN 978-3-030-47035-7. [Google Scholar]
- Potrč, I. Transportni Sistemi: Zbrano Gradivo; Fakulteta za strojništvo: Maribor, Slovenia, 1999; Volume 1999, ISBN 978-86-435-0280-8. [Google Scholar]
- Minglani, D.; Sharma, A.; Pandey, H.; Dayal, R.; Joshi, J.B. Analysis of Flow Behavior of Size Distributed Spherical Particles in Screw Feeder. Powder Technol. 2021, 382, 1–22. [Google Scholar] [CrossRef]
- DIN 15262:1983-01; Stetigförderer; Schneckenförderer Für Schüttgut; Berechnungsgrundsätze. Beuth Verlag GmbH: Berlin, Germany, 1983.
- Tan, Y.; Rackl, M.; Yang, W.; Fottner, J.; Meng, W.; Kessler, S. A Comparative Study on Design Standards of Screw Conveyors in China, Germany and the USA—Part I: Theoretical Calculation and Quantitative Analysis. Particuology 2022, 69, 61–76. [Google Scholar] [CrossRef]
- Coetzee, C.J. Review: Calibration of the Discrete Element Method. Powder Technol. 2017, 310, 104–142. [Google Scholar] [CrossRef]
- Minkin, A.; Katterfeld, A.; Gröger, T. Screw and Shaftless Screw Conveyors. Bulk Solids Handl. 2007, 27, 84–93. [Google Scholar]
- Shi, Q.; Sakai, M. Recent Progress on the Discrete Element Method Simulations for Powder Transport Systems: A Review. Adv. Powder Technol. 2022, 33, 103664. [Google Scholar] [CrossRef]
- Owen, P.J.; Cleary, P.W. Prediction of Screw Conveyor Performance Using the Discrete Element Method (DEM). Powder Technol. 2009, 193, 274–288. [Google Scholar] [CrossRef]
- Hu, G.; Chen, J.; Jian, B.; Wan, H.; Liu, L. Modeling and Simulation of Transportation System of Screw Conveyors by the Discrete Element Method. In Proceedings of the 2010 International Conference on Mechanic Automation and Control Engineering, Wuhan, China, 26–28 June 2010; pp. 927–930. [Google Scholar]
- Wang, S.; Li, H.; Tian, R.; Wang, R.; Wang, X.; Sun, Q.; Fan, J. Numerical Simulation of Particle Flow Behavior in a Screw Conveyor Using the Discrete Element Method. Particuology 2019, 43, 137–148. [Google Scholar] [CrossRef]
- Fernandez, J.W.; Cleary, P.W.; McBride, W. Effect of Screw Design on Hopper Drawdown of Spherical Particles in a Horizontal Screw Feeder. Chem. Eng. Sci. 2011, 66, 5585–5601. [Google Scholar] [CrossRef]
- Govender, N.; Cleary, P.W.; Wilke, D.N.; Khinast, J. The Influence of Faceted Particle Shapes on Material Dynamics in Screw Conveying. Chem. Eng. Sci. 2021, 243, 116654. [Google Scholar] [CrossRef]
- Sun, H.; Ma, H.; Zhao, Y. DEM Investigation on Conveying of Non-Spherical Particles in a Screw Conveyor. Particuology 2022, 65, 17–31. [Google Scholar] [CrossRef]
- Blais, B.; Vidal, D.; Bertrand, F.; Patience, G.S.; Chaouki, J. Experimental Methods in Chemical Engineering: Discrete Element Method—DEM. Can. J. Chem. Eng. 2019, 97, 1964–1973. [Google Scholar] [CrossRef]
- Wensrich, C.M.; Katterfeld, A. Rolling Friction as a Technique for Modelling Particle Shape in DEM. Powder Technol. 2012, 217, 409–417. [Google Scholar] [CrossRef]
- Fouvry, S.; Liskiewicz, T.; Kapsa, P.H.; Hannel, S.; Sauger, E. An Energy Description of Wear Mechanisms and Its Applications to Oscillating Sliding Contacts. Wear 2003, 255, 287–298. [Google Scholar] [CrossRef]
- Ashrafizadeh, H.; Ashrafizadeh, F. A Numerical 3D Simulation for Prediction of Wear Caused by Solid Particle Impact. Wear 2012, 276–277, 75–84. [Google Scholar] [CrossRef]
- Ansys Product Help. Available online: https://ansyshelp.ansys.com/account/secured?returnurl=/Views/Secured/prod_page.html?pn=Rocky&prodver=24.1&lang=en (accessed on 1 April 2024).
- Archard, J.F. A Crossed-Cylinders Friction Machine. Wear 1958, 2, 21–27. [Google Scholar] [CrossRef]
- Dratt, M.; Katterfeld, A. Coupling of FEM and DEM Simulations to Consider Dynamic Deformations under Particle Load. Granul. Matter 2017, 19, 49. [Google Scholar] [CrossRef]
- Varga, M.; Grundtner, R.; Maj, M.; Tatzgern, F.; Alessio, K.-O. Impact-Abrasive Wear Resistance of High Alumina Ceramics and ZTA. Wear 2023, 522, 204700. [Google Scholar] [CrossRef]
- Zhao, B.; Ding, W.; Chen, Z.; Yang, C. Pore Structure Design and Grinding Performance of Porous Metal-Bonded CBN Abrasive Wheels Fabricated by Vacuum Sintering. J. Manuf. Process. 2019, 44, 125–132. [Google Scholar] [CrossRef]
- Roessler, T.; Katterfeld, A. Scaling of the Angle of Repose Test and Its Influence on the Calibration of DEM Parameters Using Upscaled Particles. Powder Technol. 2018, 330, 58–66. [Google Scholar] [CrossRef]
- Bierwisch, C.; Kraft, T.; Riedel, H.; Moseler, M. Three-Dimensional Discrete Element Models for the Granular Statics and Dynamics of Powders in Cavity Filling. J. Mech. Phys. Solids 2009, 57, 10–31. [Google Scholar] [CrossRef]
- Coetzee, C.; Katterfeld, A. Calibration of DEM Parameters. In Simulations in Bulk Solids Handling; John Wiley & Sons, Ltd.: Hoboken, NJ, USA, 2023; pp. 1–40. ISBN 978-3-527-83593-5. [Google Scholar]
- Lommen, S.; Schott, D.; Lodewijks, G. DEM Speedup: Stiffness Effects on Behavior of Bulk Material. Particuology 2014, 12, 107–112. [Google Scholar] [CrossRef]
- Huang, S.; Huang, J.; Hui, Z.; Li, M.; Ye, W. Wear Calculation of Sandblasting Machine Based on EDEM-FLUENT Coupling. IJHM 2018, 1, 447. [Google Scholar] [CrossRef]
- Yang, W.; Meng, W.; Gao, L.; Tan, Y.; Fottner, J.; Dai, X.; Yao, F.; Yuan, Y.; Sun, X. Analysis of the Screw Flight Wear Model and Wear Regularity of the Bulk Transport in Screw Ship Unloader. Iran. J. Sci. Technol. Trans. Mech. Eng. 2022, 46, 15–29. [Google Scholar] [CrossRef]
- Chen, C.; Gu, J.; Peng, Z.; Dai, X.; Liu, Q.; Zhu, G.-Q. Discrete Element Modeling of Particles Sphericity Effect on Sand Direct Shear Performance. Sci. Rep. 2022, 12, 5490. [Google Scholar] [CrossRef]
- Wang, J.; Gutierrez, M. Discrete Element Simulations of Direct Shear Specimen Scale Effects. Géotechnique 2010, 60, 395–409. [Google Scholar] [CrossRef]
- Wang, C.; Deng, A.; Taheri, A. Three-Dimensional Discrete Element Modeling of Direct Shear Test for Granular Rubber–Sand. Comput. Geotech. 2018, 97, 204–216. [Google Scholar] [CrossRef]
- Chen, L.; Sun, Z.; Li, P.; Ma, H.; Pan, G. DEM Simulation of the Transport of Mine Concrete by a Screw Feeder. J. Braz. Soc. Mech. Sci. Eng. 2022, 44, 280. [Google Scholar] [CrossRef]
- Kleijnen, J.P.C. Design and Analysis of Simulation Experiments; International series in operations research & management science; Springer: New York, NY, USA, 2008; ISBN 978-0-387-71812-5. [Google Scholar]
- Motaln, M.; Lerher, T. Numerical Simulation of Conveying Fine Powders in a Screw Conveyor Using the Discrete Element Method. Teh. Glas. 2023, 17, 338–345. [Google Scholar] [CrossRef]
- Data Analysis, Statistical & Process Improvement Tools|Minitab. Available online: https://www.minitab.com/en-us/ (accessed on 1 February 2024).


| Run Order | Coded Value A B C D E | N [rpm] {150–250} | Clearance [mm] {2–10} | Dscrew [mm] {70–85} | Dshaft [mm] {20–35} | Pitch [mm] {75–90} | ||||
|---|---|---|---|---|---|---|---|---|---|---|
| 1 | 0 | 0 | 0 | 0 | −2 | 200.0 | 6.0 | 77.5 | 27.5 | 75.0 |
| 2 | 1 | −1 | −1 | −1 | −1 | 214.2 | 4.9 | 75.4 | 25.4 | 80.4 |
| 3 | −1 | 1 | −1 | −1 | −1 | 185.8 | 7.1 | 75.4 | 25.4 | 80.4 |
| 4 | −1 | −1 | 1 | −1 | −1 | 185.8 | 4.9 | 79.6 | 25.4 | 80.4 |
| 5 | 1 | 1 | 1 | −1 | −1 | 214.2 | 7.1 | 79.6 | 25.4 | 80.4 |
| 6 | −1 | −1 | −1 | 1 | −1 | 185.8 | 4.9 | 75.4 | 29.6 | 80.4 |
| 7 | 1 | 1 | −1 | 1 | −1 | 214.2 | 7.1 | 75.4 | 29.6 | 80.4 |
| 8 | 1 | −1 | 1 | 1 | −1 | 214.2 | 4.9 | 79.6 | 29.6 | 80.4 |
| 9 | −1 | 1 | 1 | 1 | −1 | 185.8 | 7.1 | 79.6 | 29.6 | 80.4 |
| 10 | 0 | 0 | 0 | −2 | 0 | 200.0 | 6.0 | 77.5 | 20.0 | 82.5 |
| 11 | 0 | 0 | −2 | 0 | 0 | 200.0 | 6.0 | 70.0 | 27.5 | 82.5 |
| 12 | 0 | −2 | 0 | 0 | 0 | 200.0 | 2.0 | 77.5 | 27.5 | 82.5 |
| 13 | −2 | 0 | 0 | 0 | 0 | 150.0 | 6.0 | 77.5 | 27.5 | 82.5 |
| 14 | 0 | 0 | 0 | 0 | 0 | 200.0 | 6.0 | 77.5 | 27.5 | 82.5 |
| 15 | 2 | 0 | 0 | 0 | 0 | 250.0 | 6.0 | 77.5 | 27.5 | 82.5 |
| 16 | 0 | 2 | 0 | 0 | 0 | 200.0 | 10.0 | 77.5 | 27.5 | 82.5 |
| 17 | 0 | 0 | 2 | 0 | 0 | 200.0 | 6.0 | 85.0 | 27.5 | 82.5 |
| 18 | 0 | 0 | 0 | 2 | 0 | 200.0 | 6.0 | 77.5 | 35.0 | 82.5 |
| 19 | −1 | −1 | −1 | −1 | 1 | 185.8 | 4.9 | 75.4 | 25.4 | 84.6 |
| 20 | 1 | 1 | −1 | −1 | 1 | 214.2 | 7.1 | 75.4 | 25.4 | 84.6 |
| 21 | 1 | −1 | 1 | −1 | 1 | 214.2 | 4.9 | 79.6 | 25.4 | 84.6 |
| 22 | −1 | 1 | 1 | −1 | 1 | 185.8 | 7.1 | 79.6 | 25.4 | 84.6 |
| 23 | 1 | −1 | −1 | 1 | 1 | 214.2 | 4.9 | 75.4 | 29.6 | 84.6 |
| 24 | −1 | 1 | −1 | 1 | 1 | 185.8 | 7.1 | 75.4 | 29.6 | 84.6 |
| 25 | −1 | −1 | 1 | 1 | 1 | 185.8 | 4.9 | 79.6 | 29.6 | 84.6 |
| 26 | 1 | 1 | 1 | 1 | 1 | 214.2 | 7.1 | 79.6 | 29.6 | 84.6 |
| 27 | 0 | 0 | 0 | 0 | 2 | 200.0 | 6.0 | 77.5 | 27.5 | 90.0 |
| Source | DF | Adj SS | Adj MS | F-Value | p-Value |
|---|---|---|---|---|---|
| Model | 20 | 2.49783 | 0.12489 | 19.94 | 0.001 |
| Linear | 5 | 2.42307 | 0.48461 | 77.39 | 0 |
| 1 | 0.04015 | 0.04015 | 6.41 | 0.045 | |
| 1 | 1.02763 | 1.02763 | 164.1 | 0 | |
| 1 | 1.12376 | 1.12376 | 179.45 | 0 | |
| 1 | 0.16574 | 0.16574 | 26.47 | 0.002 | |
| 1 | 0.06578 | 0.06578 | 10.5 | 0.018 | |
| Square | 5 | 0.0197 | 0.00394 | 0.63 | 0.686 |
| 1 | 0.00012 | 0.00012 | 0.02 | 0.893 | |
| 1 | 0.00003 | 0.00003 | 0 | 0.947 | |
| 1 | 0.00012 | 0.00012 | 0.02 | 0.893 | |
| 1 | 0.00052 | 0.00052 | 0.08 | 0.784 | |
| 1 | 0.01398 | 0.01398 | 2.23 | 0.186 | |
| 2-Way Interaction | 10 | 0.05507 | 0.00551 | 0.88 | 0.592 |
| 1 | 0.00766 | 0.00766 | 1.22 | 0.311 | |
| 1 | 0.00601 | 0.00601 | 0.96 | 0.365 | |
| 1 | 0.00526 | 0.00526 | 0.84 | 0.395 | |
| 1 | 0.00331 | 0.00331 | 0.53 | 0.495 | |
| 1 | 0.00526 | 0.00526 | 0.84 | 0.395 | |
| 1 | 0.01156 | 0.01156 | 1.85 | 0.223 | |
| 1 | 0.00275 | 0.00275 | 0.44 | 0.532 | |
| 1 | 0.00766 | 0.00766 | 1.22 | 0.311 | |
| 1 | 0.00106 | 0.00106 | 0.17 | 0.696 | |
| 1 | 0.00456 | 0.00456 | 0.73 | 0.426 | |
| Error | 6 | 0.03757 | 0.00626 | ||
| Total | 26 | 2.5354 |
| Opti. Function | Prediction | Simulation | Error | |
|---|---|---|---|---|
| Mass flow [t/h] | Target value (5.35) | 5.35 | 5.31 | 0.75% |
| Shear Intensity [W/m2] | Minimum | 14 | 14.56 | 4% |
| Optimum parameters: | ||||
| N [rpm] | Clearance [mm] | Dscrew [mm] | Dshaft [mm] | Pitch [mm] |
| 167 | 8.60 | 80 | 27 | 87 |
Disclaimer/Publisher’s Note: The statements, opinions and data contained in all publications are solely those of the individual author(s) and contributor(s) and not of MDPI and/or the editor(s). MDPI and/or the editor(s) disclaim responsibility for any injury to people or property resulting from any ideas, methods, instructions or products referred to in the content. |
© 2024 by the authors. Licensee MDPI, Basel, Switzerland. This article is an open access article distributed under the terms and conditions of the Creative Commons Attribution (CC BY) license (https://creativecommons.org/licenses/by/4.0/).
Share and Cite
Motaln, M.; Lerher, T. Innovative Approaches to Wear Reduction in Horizontal Powder Screw Conveyors: A Design of Experiments-Guided Numerical Study. Appl. Sci. 2024, 14, 3064. https://doi.org/10.3390/app14073064
Motaln M, Lerher T. Innovative Approaches to Wear Reduction in Horizontal Powder Screw Conveyors: A Design of Experiments-Guided Numerical Study. Applied Sciences. 2024; 14(7):3064. https://doi.org/10.3390/app14073064
Chicago/Turabian StyleMotaln, Marko, and Tone Lerher. 2024. "Innovative Approaches to Wear Reduction in Horizontal Powder Screw Conveyors: A Design of Experiments-Guided Numerical Study" Applied Sciences 14, no. 7: 3064. https://doi.org/10.3390/app14073064
APA StyleMotaln, M., & Lerher, T. (2024). Innovative Approaches to Wear Reduction in Horizontal Powder Screw Conveyors: A Design of Experiments-Guided Numerical Study. Applied Sciences, 14(7), 3064. https://doi.org/10.3390/app14073064