Abstract
One of the issues of greatest interest in urban planning today concerns the evaluation of the most vulnerable urban areas in the presence of different types of climate hazards. In this research, a hierarchical fuzzy MCDA model is implemented on a GIS-based platform aimed at detecting the urban areas most at risk in the presence of heatwave and pluvial flooding scenarios. The proposed model aims to detect the urban areas most vulnerable to both the two climatic phenomena and the two types of hazards as independent events; it partitions the physical component of an urban settlement into two subsystems: buildings and open spaces, and it determines the criticality of a subzone of the urban area of study by evaluating the vulnerabilities of the two subsystems to the two phenomena. The use of a hierarchical fuzzy MCDA model facilitates the modeling of the two subsystems and the assessment of their vulnerability to the two phenomena, and it provides a computationally fast tool for detecting critical urban areas. The model was tested on a study area made up of the districts of the central-eastern area of the city of Naples (Italy); it was divided into subzones made up of individual census areas. The most critical areas are represented by the subzones with criticality values higher than a specific threshold.
1. Introduction
Recently, with ongoing climate change and the intensification of environmental and climate hazard scenarios, several studies have focused on the assessment of concomitant risks generated by different environmental and climate hazards.
The multi-risk evaluation models can be classified into two categories based on the interrelationships between the types of hazards [1,2]:
- interacting hazards, in which there is a mutual dependence between types of hazards that occur in a place during a specific period. Specific types of interacting hazards are cascade hazards, in which a hazard scenario produced by the presence of a specific phenomenon triggers the generation of another hazard scenario connected to another type of risk (for example, a rainfall phenomenon of strong intensity and duration can cause hydrogeological instability in the territory);
- compound hazards or multi-hazards in which two hazards generated by phenomena of different types occur in the same period (e.g., intense rainfall combined with prolonged periods of heatwaves) [3].
Independent hazards are a particular case of multi-hazards. In [4], independent hazards are defined as two multi-hazards caused by different triggers. In [1], independent hazards and multi-hazards occurred independently in the same area at different times (e.g., heavy rain occurred several days after an earthquake).
In general, two types of hazards that are not related to each other are considered independent hazards, so that, although they occur in the same place and in the same period, they can be treated separately in the assessment of the risks that can be produced by the exposed elements. So, in multi-risk assessment, when referring to independent multi-hazards, the risk analysis can be carried out by treating the two phenomena separately. In these cases, the two risk models are used separately, and the damage caused is assessed by adding the expected risks to the exposed component due to the occurrence of each individual hazard.
In order to sufficiently evaluate the aggregate effect of these vulnerabilities, modeling the urban system with all the characteristics that can influence the assessment of vulnerability to each phenomenon is one of the key critical points of approaches for detecting the criticality of urban settlements in the presence of different kinds of hazards.
The use of a large number of characteristics, however, represents a serious problem due to the unavailability of data necessary for their measurement. Furthermore, if the risk assessment model is too complex, it becomes computationally slow and not easily portable to different urban settlements.
The aim of this study is to develop a model that is both sufficiently accurate and computationally fast to detect the most critical areas of an urban settlement in the presence of heatwave and pluvial flooding climatic hazards, treated as independent hazards, taking into consideration the vulnerabilities of the physical components that make up an urban settlement.
For this purpose, a framework is used to decompose an urban settlement into two physical subsystems: buildings and open spaces, and the characteristics of the two subsystems identified in [5] are taken into consideration for the assessment of their vulnerability to heatwave and pluvial flooding phenomena.
Since the two types of climate hazards are independent, the most natural way to determine which areas are most critical, as they are vulnerable to both phenomena, is to use a MultiCriteria Decision Making Analysis model (MCDA), in which the vulnerability of each subsystem to each phenomenon is considered a criterion whose sub-criteria are connected to the characteristics of the subsystem that affect its vulnerability.
In our research, we implemented a fuzzy-based multi-criteria model proposed in [6] to evaluate which subzones of an urban settlement into which a study area is divided best meet a set of criteria. This model is particularly suited to dealing with complex urban features. Each criterion is broken down into sub-criteria, and each node of the criteria tree is assigned a fuzzy set built starting from the fuzzy sets in the child nodes and considering the preferences assigned to them, built using the Saaty comparison matrix. The alternatives of the model are represented by the subzones into which the area of study is divided; the alternative that most adheres to the set of criteria is the one with the greatest degree of membership in the resulting fuzzy set, a combination of the fuzzy sets in the root nodes of the criteria. In [7], this model is tested to determine which districts in the city of Naples (Italy) were most vulnerable to heatwave scenarios. The results were consistent with expert assessments.
To evaluate which were the most critical subzones in the presence of both types of climatic hazards, we used this fuzzy MCDA model, considering as the main criteria of the hierarchy four criteria given by the vulnerabilities of the two subsystems to heatwave and pluvial flooding phenomena. The root node of the hierarchy provides the assessment of the criticality of the subzone, determined starting from the four criteria.
The main advantage of the proposed model is its adaptability to deal with independent climatic hazards. In fact, the vulnerabilities of an urban subsystem to the two phenomena are assessed separately. Furthermore, it is easily portable as it requires a limited number of characteristics for each subsystem.
In addition, the model has the advantage, on the one hand, of providing a computationally fast tool for detecting the most critical areas and, on the other, of allowing the criticalities of an urban area to be evaluated in a natural way in the presence of multiple types of independent hazards.
Related Works
In the last decade, several models have been implemented to assess the damage caused by independent hazards. Some examples are HAZUS [8], developed by the Federal Emergency Management Agency (FEMA) and implemented in the tool GIS ArcGIS to evaluate separately the risks produced by earthquakes, floods, and hurricanes, and the CAPRA Probabilistic Risk Assessment Program (https://oasishub.co/organization/about/capra accessed on 1 March 2024), a tool that uses probabilistic models to assess separately the risks caused by earthquakes, hurricanes, extreme rainfall, and volcanic hazards.
These models, in addition to assessing the physical damage and social impacts that can be produced by multiple hazards, also carry out an assessment of the resilient effects and costs of mitigation or adaptation strategies. Their main flaw is the need to find detailed local information on the urban fabric under study to provide accurate results.
An increasingly relevant attention caused by the negative effects of climate change today is directed towards the multi-risk analysis generated by independent different climate hazard scenarios.
Following the Intergovernmental Panel on Climate Change (IPCC) Sixth Assessment Report (AR6) [9], the impacts/risks generated by a climate phenomenon on exposed elements in a geographical area are assessed in terms of the vulnerability of the analyzed area, the intensity of the hazard scenario, and the value of the elements exposed to risk.
In order to accurately evaluate the impacts produced by climate phenomena, it is essential to comprehensively model the vulnerability of the analyzed ecosystem to climate hazards, i.e., its propensity to be damaged by the occurrence of the extreme climate phenomenon.
Urban settlements are particularly vulnerable to climate hazards due to the presence of anthropogenic elements and activities, which have increased the ecosystem’s propensity to be damaged by extreme climatic events. Furthermore, when the analyzed ecosystem consists of an urban settlement, the assessment of vulnerability to climate hazards is difficult because of the co-presence of the different elements of which it is composed and their interrelationships. In recent years, many researchers have proposed models to assess the vulnerabilities of cities to various climate events.
A primary role in the assessment of climate vulnerability in urban settlements is managed by the spatial modeling scale of the city, on which the information detail to be acquired and the forecasting and simulation approaches to be used depend [10]. The typology and geomorphology of the urban settlement are also primary characteristics to take into consideration since, depending on the typology of the city and its geomorphological typification, different responses are generated to documented stresses and adverse climatic phenomena. For example, although coastal cities in hot periods are cooler than nearby inland cities, they may be warmer than nearby cities in rural areas if the presence of buildings prevents the flow of sea breezes [11].
A serious critical point of climate vulnerability models in urban settlements is the uncertainty or limitation of the available data. In [12], a climate vulnerability model based on a set of geomorphological and social indicators in coastal cities under rapid urbanization is proposed; the results carried out on a set of different expanding coastal cities show that the lack of detailed data at a local scale prevents the assessment of vulnerability to local climatic phenomena. An attempt to carry out climate vulnerability assessments that can be used in different countries and consider different sectors has been proposed in [13], where the authors propose a composite climate vulnerability index in which endogenously generated weights are used to aggregate six different vulnerability indices; these weights differ locally from sector to sector and from country to country. However, as the results of statistical tests carried out show, further variables and indices would be necessary to obtain information relating to the variation in climate vulnerability across nations. This may be necessary for the study of climate vulnerability in urban settlements, where the urban system and its microclimate need to be modeled [14].
MCDA models have recently been proposed to evaluate climate vulnerability in the presence of different hazard scenarios. They facilitate the identification of the most vulnerable areas of the area of study, considering a large number of climatic, geomorphological, environmental, and socio-economic characteristics.
In [15], an MCDA model is applied to evaluate vulnerability to drought scenarios in the Namakkal district, India. The model was implemented on a GIS platform using the Analytic Hierarchy Process (AHP) method [16,17]. A multicriteria model based on a fuzzy-based AHP model [18] in which triangular fuzzy numbers are used to assign the weights is proposed in [19] to evaluate the alluvial areas most vulnerable to flooding phenomena; the model is applied to evaluate flood vulnerability in Aq’Qala county in Iran, taking into consideration the topographical, geomorphological, climatological, and social characteristics of the area.
A MCDA model based on AHP was proposed in [20] for studying the risks of wildfire outbreaks in the northeast and northern regions of Ghana. This model is computationally fast but does not take into account the city-scale characteristics needed to assess the vulnerabilities of buildings and impervious open spaces.
In [21], an AHP-based MCDA model is applied to assess the vulnerability of coastal cities to erosion. The model considers a set of environmental and human activity criteria to evaluate the most vulnerable cities. The model was tested in the coastal city of Kuala Terreganu, Malaysia, producing reliable results. Its main limitation is that it is not portable to other urban settlements, as the hierarchy of criteria was built considering the local characteristics of Kuala Terreganu.
The fuzzy AHP (F-AHP) method [18] is used in a MCDA model applied in [22] to assess the heatwave vulnerability in Indian districts using demographic and socioeconomic data. A MCDA model based on the fuzzy AHP-WIKOR method [23] is applied in [24] to the districts of Alexandria, in Egypt, to detect those urban districts most at risk of flooding; various geomorphological, infrastructural, environmental, and socio-economic indicators are used in the model. The main limitation of these models is their complexity; the number of indicators is too high; therefore, getting all the data to measure them can be difficult.
A GIS-based framework for climatic multi-risk assessment in urban areas is applied in the Metropolitan City of Venice (Italy) in [25] to detect areas and receptors at risk, considering storm surge, pluvial flooding, heat waves, and drought hazard scenarios. The main limitation of this model is its portability, due to the difficulty of finding high-resolution data; this can lead to inaccurate assessments of the most vulnerable urban areas.
An AHP-based multicriteria assessment of climatic multi-risks by considering urban flooding, coastal flooding, and heat wave hazard scenarios is applied in [26] to the coastal municipality of Jesolo (Italy). Satellite indices connected to vegetation health, soil impermeability, altitude, and population concentration are used to evaluate the joint vulnerability of the urban settlement to the three phenomena. The main strength of this approach is its high portability for different urban settlements; on the other hand, it uses information on a too small scale, which can affect the accuracy of the assessments.
In this research, we propose a GIS-based MCDA model of the urban areas most vulnerable to the two types of climate hazards, heatwaves and pluvial flooding, treated as independent events, partitioning the physical urban system into two subsystems: buildings and open spaces. To guarantee a trade-off between the accuracy of the results and the portability of the model, it adopts the fuzzy-based hierarchical MCDA method [6] and takes into consideration the characteristics that affect the vulnerability of buildings and ranges open to the two types of hazards proposed in [5].
In the following section, the GIS-based multicriteria model presented in [6] and the vulnerability assessment model of urban settlements to heatwave and rain flooding phenomena proposed in [5] are first briefly described. Then, the proposed assessment model of the areas of the area of study most vulnerable to both phenomena is described. Section 3 reports the results of the testing of our method on an area of study consisting of the eastern area of the city of Naples (Italy). The concluding discussions are reported in Section 4.
2. Materials and Methods
This section describes in detail the methodology proposed for the assessment of the urban area of study most vulnerable to both heatwave and pluvial flooding climatic phenomena, considered independent multi-hazard events.
The next two paragraphs introduce, respectively, the fuzzy-based MCDA model proposed in [6] and the model proposed in [5] for the assessment of the vulnerability of building and open space subsystems to heatwaves and pluvial flooding scenarios. Finally, Section 2.4 describes the case study urban area.
2.1. The GHF-MCDA Model
In [6], a fuzzy-based multicriteria decision-making model was implemented on a GIS platform to find, among the subzones in which the area of study is partitioned, the ones best suited to meeting a set of criteria expressed as fuzzy sets.
Formally, A = {a1, a2, …, am} is the set of alternatives correspondent to the set of homogeneous subzones, and r1, r2, …, rn is the set of n criteria. Each criterion rk is expressed as a linguistic label for the fuzzy set:
where is the membership degree assigned to the ith alternative in meeting the kth criterion. The relevance of the kth criterion in selecting the best alternative is modeled in [27] with a weight αk called the Coefficient of Relative Significance (for short, CRS).
The CRS are assigned to the n criteria, respecting the following constraint:
The Saaty’s AHP pairwise comparison matrix is assigned by the expert to obtain the CRS’s. When B is the pairwise comparison nxn matrix where bkj, k, j = 1,….,n; it gives the relevance of the criterion rk with respect to the criterion rj.
The values assigned to the pairwise comparison matrix element bkj are shown in Table 1.

Table 1.
Values of the Saaty’s pairwise comparison matrix.
The conjugate elements bjk are set to 1/bkj and the diagonal elements bkk are set to 1.
The CRS values α1, α2, …, αn are given by the components of the eigenvector w = (w1, w2, …, wk, … wn) correspondent to the greatest real eigenvalue solution of the characteristic equation
where I is the identity nxn matrix.
The CRS value αk of the kth criterion is given by:
To find the best alternative, the fuzzy set intersection of the n fuzzy sets R1, R2, …, Rn is built, given by
with membership function
The alternative that best meets all the criteria is the one with the greatest membership degree in the fuzzy set R.
Moreover, in [20], a suitability thematic map of the subzones is constructed by classifying them based on the membership values μR(ai) i = 1, …, m.
In order to model complex criteria that characterize urban analysis problems, in [6], a hierarchical tree extension of this fuzzy MCDA model, called GHF-MCDA, was tested. In GHF-MCDA, a criterion is broken down into sub-criteria, and the fuzzy set corresponding to a criterion is built starting from the fuzzy sets associated with its sub-criteria.
The n criteria at the top level are denoted with: r1(1), r2(1), …, rn(1), where the subscript in round brackets (1) denotes the level in the hierarchy.
Let us suppose that the kth criterion rk(1) is decomposed in the next level in nk sub-criteria rk1(2), rk2(2), …, rknk(2). Then, the fuzzy set Rk(1) is given by the intersection of the fuzzy sets Rk1(2), Rk2(2), …, Rknk(2). It is given by:
where the membership degree of the ith alternative to Rk(1) is given by
A sub-criterion can be decomposed into sub-criteria in the next step, up to the decomposition into atomic sub-criteria corresponding to the leaf nodes of the tree.
The fuzzy set corresponding to a sub-criterion in a leaf node is created by the decision maker as a triangular or trapezoidal fuzzy number on the domain of a numerical index calculated from the set of characteristics of the subzones. For example, a fuzzy set Scarcity of public parks could be built on the domain of a numerical index called density of public parks per inhabitant; it is calculated as the ratio between the surface area of the sub-area covered by public parks and the number of residents.
Starting from the sub-criteria in the leaf nodes, the fuzzy sets of the sub-criteria in the upper level are built; the process continues until the fuzzy sets of all the criteria in the initial nodes in level 1 of the tree are constructed. Each subzone will be assigned a suitability given by the membership degree to the final fuzzy set, corresponding to the insertion of the fuzzy sets assigned to the n criteria.
Figure 1 schematizes the fuzzy hierarchical model proposed in [6].
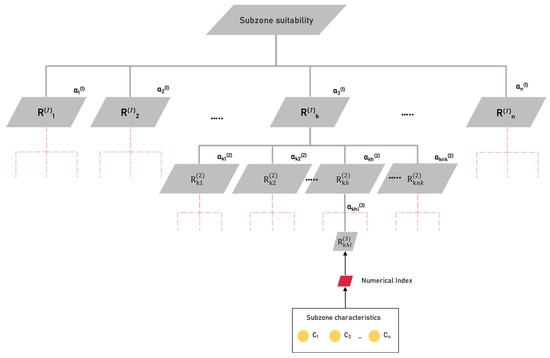
Figure 1.
Schema of the GHF-MCDA model.
In the preprocessing phase, the hierarchical structure of the model proposed in [4] is created. This phase is schematized in the pseudocode in Algorithm 1.
| Algorithm 1: Create a Hierarchical Structure |
| Input: Set of n criteria |
| Output: Hierarchical structure of criteria |
| Set the n criteria r1, r2,…,rk,…, rn at the first level in the hierarchy Construct the L-levels hierarchical model of the criteria |
| For l = L to 1 |
| For each node R(l)k at the lth level |
| If R(l)k is a leaf node then Define the numerical index related to the sub-criterion Create the fuzzy set on the domain of the numerical index |
| Else Create the AHP pairwise comparison matrix of the child nodes Calculate the CRS of the child nodes Construct the fuzzy set of the node |
| End if |
| Next node |
| Next l |
The GHF-MCDA algorithm imports the spatial data containing the area of study and the characteristics of its subzones. It builds the hierarchical structure of the criteria used to assign a suitability value to each subzone (Algorithm 2).
| Algorithm 2: GHF-MCDA |
| Input: Spatial database of the area of study |
| Output: Array s[] containing the suitability of each subzone |
| Partition the area of study in m subzones giving the m alternatives Join the dataset of the characteristics to the subzones |
| For i = 2 to m Calculate the values of the numerical indices assigned to the leaf nodes For l = L to 1 For each node R(l)k at the lth level Calculate the membership degree Next R(l)k Next l s[i]:= |
| Next i Return s[] |
2.2. The Heatwave and Pluvial Flooding Vulnerability Model
In [5], to evaluate the vulnerability of an urban area of study, the urban settlement is composed of three sub-systems: the physical and constructive sub-systems of buildings and open spaces, and the social sub-system. The vulnerability of each subsystem to heatwave and pluvial flooding phenomena is assessed as a weighted average of a set of intermediate indicators whose values are all normalized on a scale from 1 to 5. Each intermediate indicator is evaluated on a set of measures based on the characteristics of the elements of the urban system.
The weight of an intermediate indicator was determined based on a calibration process applied using simulation tools applied to sample elements.
In Table 2, the intermediate indicators used to assess the vulnerability of the sub-systems of buildings and open spaces to the heatwave and pluvial flooding phenomena are shown. The last column shows the weights assigned to the indicators.
Table 2.
Intermediate indicators used in [5] to evaluate the vulnerabilities of buildings and open spaces to heatwave and pluvial flooding phenomena.
Regarding the vulnerability of buildings to heatwaves, the thermal lag and the thermal decrement indicators measure the performance of the building envelope during the overheating of the external environment. The building volume indicator is evaluated by measuring the volume of the entire building envelope. The solar exposure of a building envelope is evaluated based on the exposure of the facades and roofing to solar radiation on summer days.
The vulnerability of open spaces to heatwaves is assessed, taking into consideration the effect of solar radiation on the surface and on the material that makes up the open space. The sky view factor indicator measures the portion of the sky visible from open space. Albedo measures the reflective power of the surface covering the open space. The solar exposure of an open space is evaluated based on the exposure of the open space to solar radiation on summer days. NDVI measures the relevance of live green vegetation in an open space; it is obtained from the red and near infrared remotely sensed multispectral images.
As regards the vulnerability of buildings to pluvial flooding, the building coverage ratio indicator measures the presence of uncovered internal areas that can cause flooding of ground floors. The percentage of buildings on the sidewalk evaluates the presence of sidewalks around built-up areas; the more a building is surrounded by sidewalks, the less likely it is that rainwater will spill from the street into the internal areas of the building. The ground floor activities indicator evaluates the presence of activities and services on the ground floor of buildings. Roof typology evaluates the ability of the roofing slab to facilitate the outflow of rainwater, avoiding the development of infiltrations on the walls and floors below.
The vulnerability of open spaces to pluvial flooding is assessed by analyzing the physical characteristics of the open space that affect its ability to collect and absorb extreme meteorological flows. The open space area indicator measures the extension of the exposed open space surface. Soil permeability measures the ability of an open space made up of soil with a specific runoff coefficient to absorb rainwater that flows into the soil. The flow capacity of the storm drainage system measures the capacity of the hydraulic system to drain rainwater flows and is evaluated by the ratio between the flow rate of the drainage pipes and the flow rate of the rainfall runoff. Maintenance of the storm drainage system evaluates the functioning of the drainage system, determined by calculating the percentage of clogged drains in the open space.
Each intermediate indicator is normalized on a scale between 1 and 5; the vulnerability of each subsystem is given by the weighted average of the values of its intermediate indicators.
In [5], the vulnerability of the two subsystems is combined with the exposure given by the residents and a hazard scenario to assess the correspondent impact scenario of the two phenomena.
2.3. The Proposed Model
We apply the hierarchical method [4] to evaluate which subzones of an urban area are the most critical in the presence of multi-risk scenarios. In particular, we investigate which subzones are most vulnerable in the presence of multiple risk scenarios. The GHF-MCDA model is implemented in a GIS-based framework with the aim of determining which subzones are most vulnerable in the presence of multiple risks.
Following the hierarchical decomposition model of an urban settlement into subsystems proposed in [5], the urban settlement is partitioned into subsystems, and the vulnerability of each subsystem is assessed. In our study, the GHF-MCDA model was tested to detect which subzones of an urban settlement were most vulnerable to the two climatic phenomena of heatwaves and pluvial flooding, taking into consideration the vulnerabilities of the physical system, broken down into the subsystems of buildings and open spaces.
The hierarchy of the criteria is built on two hierarchical levels. The first level is made up of four criteria: residential building heatwave vulnerability, open space heatwave vulnerability, residential building pluvial flooding vulnerability, and open space pluvial flooding vulnerability. Each criterion is partitioned into a set of sub-criteria related to the set of indicators used in [5] to evaluate the vulnerability of the sub-systems of buildings and open spaces to heatwave and pluvial flooding phenomena.
Figure 2 shows the hierarchy of the criteria and the characteristics needed to calculate the set of indicators.
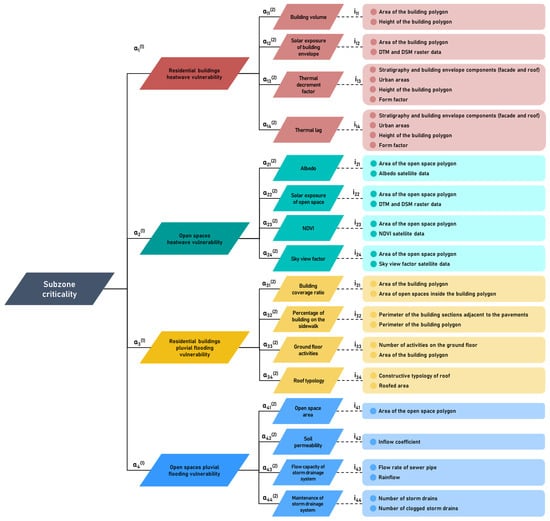
Figure 2.
Hierarchical structure of the criteria.
The radix node, called Subzone criticality, is a value in the normalized interval [0, 1] corresponding to the suitability of the subzone to be vulnerable to both phenomena.
The fuzzy sets of each sub-criterion are assigned to the domain [0, 5] in which the values of the intermediate indicators fall (Figure 3).
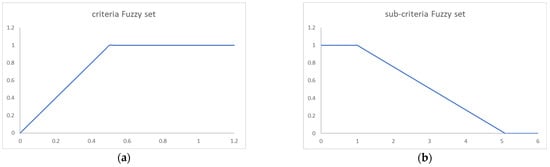
Figure 3.
Fuzzy sets assigned to criteria (a) and sub-criteria (b).
The fuzzy sets of the four criteria are assigned to the normalized domain [0, 1].
The Saaty’s pairwise comparison matrix of a criterion is built taking into account the weights of the intermediate indicators assigned in [5]. The four pairwise comparison matrices are shown, respectively, in Table 3, Table 4, Table 5 and Table 6.
Table 3.
Pairwise comparison matrix of the criterion residential building heatwave vulnerability.
Table 4.
Pairwise comparison matrix of the criterion open space heatwave vulnerability.
Table 5.
Pairwise comparison matrix of the criterion residential building pluvial flooding vulnerability.
Table 6.
Pairwise comparison matrix of the criterion open space pluvial flooding vulnerability.
The pairwise comparison matrix applied at the radix of the tree is related to the density of the built environment in the subzone, consisting of the ratio between the overall volume of buildings and the overall area of open spaces.
Through appropriate calibrations executed on a sample of subzones in different urban settlements, three ranges of built density were distinguished (Table 7):
Table 7.
Range of built density.
Each built density class is assigned a specific pairwise comparison matrix applied at the radix, considering:
- -
- a prevalence of the vulnerability of open spaces compared to the vulnerability of buildings for the low built density class (Table 8);
- -
- an equal relevance for the medium built density class (Table 9);
- -
- a prevalence of the vulnerability of buildings compared to the vulnerability of open spaces for the high built density class (Table 10).
Table 8.
Pairwise comparison matrix of the radix node— low built density class.
Table 8.
Pairwise comparison matrix of the radix node— low built density class.
| Heatwave Residential Building Vulnerability | Heatwave Open Space Vulnerability | Pluvial Flooding Building Vulnerability | Pluvial Flooding Open Space Vulnerability | |
|---|---|---|---|---|
| Heatwave residential building vulnerability | 1 | 1/4 | 1 | 1/4 |
| Heatwave open space vulnerability | 4 | 1 | 4 | 1 |
| Pluvial flooding building vulnerability | 1 | 1/4 | 1 | 1/4 |
| Pluvial flooding open space vulnerability | 4 | 1 | 4 | 1 |
Table 9.
Pairwise comparison matrix of the radix node—medium built density class.
Table 9.
Pairwise comparison matrix of the radix node—medium built density class.
| Heatwave Residential Building Vulnerability | Heatwave Open Space Vulnerability | Pluvial Flooding Building Vulnerability | Pluvial Flooding Open Space Vulnerability | |
|---|---|---|---|---|
| Heatwave residential building vulnerability | 1 | 1 | 1 | 1 |
| Heatwave open space vulnerability | 1 | 1 | 1 | 1 |
| Pluvial flooding building vulnerability | 1 | 1 | 1 | 1 |
| Pluvial flooding open space vulnerability | 1 | 1 | 1 | 1 |
Table 10.
Pairwise comparison matrix of the radix node— high built density class.
Table 10.
Pairwise comparison matrix of the radix node— high built density class.
| Heatwave Residential Building Vulnerability | Heatwave Open Space Vulnerability | Pluvial Flooding Building Vulnerability | Pluvial Flooding Open Space Vulnerability | |
|---|---|---|---|---|
| Heatwave residential building vulnerability | 1 | 4 | 1 | 4 |
| Heatwave open space vulnerability | 1/4 | 1 | 1/4 | 1 |
| Pluvial flooding building vulnerability | 1 | 4 | 1 | 4 |
| Pluvial flooding open space vulnerability | 1/4 | 1 | 1/4 | 1 |
To assign the pairwise comparison matrix to the radix node of the tree, each subzone is classified based on the calculated built density.
After determining the criticality value of all subzones, each subzone is classified based on the degree of criticality. This classification is carried out by setting two criticality thresholds, θL and θH. Subzones with a criticality value under θL are classified as having low criticality and subzones with a criticality value over θH are classified has having high criticality. The remaining subzones are classified as medium criticality. Finally, a thematic map of the criticality of the urban area of study is generated, in which adjoining subzones with the same criticality class are merged. The criticality map of the area of study will show the most critical urban zones, i.e., those most vulnerable to both phenomena; they consist of those zones with criticality classified as high.
2.4. The Case Study Area
The model has been tested on an urban area of study given by the central-eastern districts of the city of Naples (Italy); it extends from the districts of the city center, such as San Lorenzo and Vicaria, to the coastal and eastern districts, such as San Giovanni a Teduccio and Ponticelli.
The availability of many fabrics with different built-in densities is a key component in the choice of this area of study. Three different patterns may really be distinguished: a high-built density, a medium-built density, and a low-built density.
The high-built density pattern can be traced back to the subzones in the historic center, in the district of San Lorenzo to the east of the area of study; the surface of these subzones is mainly covered by residential buildings, with almost little open space present. The medium built density pattern is found in the sections to the east, near the district of Ponticelli, and to the south-east, in correspondence of the districts of Barra and San Giovanni to Teduccio; in these subzones there is a more equal distribution of the surface between open spaces and buildings. The low-built density pattern can be traced back to the subzones of the center and center-north, in correspondence with the district of Poggioreale; the surface of these areas has a less residential character in favor of wider open spaces that occupy more area of the Census area.
Figure 4 shows the area of study and the subzones located in it. Non-residential subzones are highlighted in gray; they were excluded from the test as they lack urban settlements.
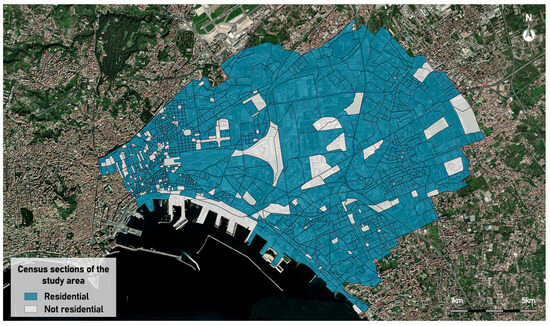
Figure 4.
The area of study: the central-eastern area of the city of Naples.
We have implemented our model on a GIS platform built using the ESRI ArcGIS Pro Tool GIS suite and the ESRI ArcPy Python libraries for ArcGIS Pro 3.2.
To test the GIS platform in the area of study, it was partitioned into subzones consisting of the census areas included in it. The reason for this is that the census areas constitute the homogeneous areas in terms of territorial and urban characteristics into which the area of study is divided. The data containing the characteristics of the census areas were extracted from the latest population and building heritage census carried out by ISTAT, the Italian national institute of statistics. The area of study is partitioned into 1328 subzones, of which 1073 are residential subzones.
To build the dataset of the characteristics of the subzones, the dataset of the characteristics of buildings and open spaces created in [5] was used. All the building indices were calculated as a weighted average of the values of the indices assigned to the buildings located in the subzone, where the weight is given by the volume of the building. The open space indices were calculated considering the weighted average of the values of the indices assigned to the open spaces located in the subzone, where the weight is given by the area covered by the open space in the subzone.
After building the hierarchical model of the criteria schematized in Figure 2, each subzone was assigned to a built density class based on the classification in Table 7, after calculating the density of the built environment in the subzone.
To execute the model all the numerical indices calculated for the subzone were normalized and assigned to the leaf nodes; then, they were fuzzified using the sub-criteria fuzzy set shown in Figure 3b. The model is executed using all the pairwise comparison matrices in Table 3, Table 4, Table 5 and Table 6. Based on the built density class to which the subzone is assigned, one of the three pairwise comparison matrices in the radix node shown, respectively, in Table 8, Table 9 and Table 10 is used.
3. Results and Discussion
This section shows and discusses the results of the test performed on the study area.
Figure 5 and Figure 6 show the thematic maps of the criteria heatwave residential building vulnerability and heatwave open space vulnerability, respectively, where the distribution of the membership degree to the correspondent fuzzy set is displayed.
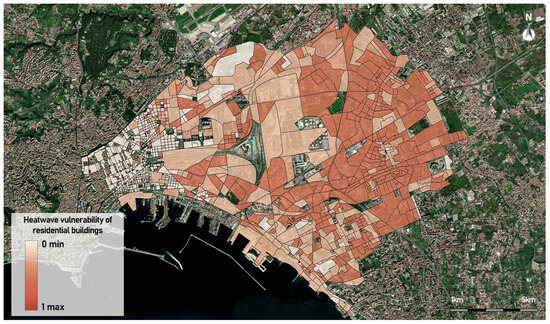
Figure 5.
Thematic map of the heatwave residential building vulnerability criterion.
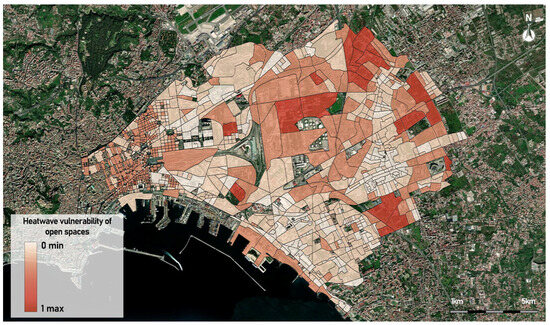
Figure 6.
Thematic map of the heatwave open space vulnerability criterion.
The thematic map in Figure 5 highlights the presence of a large eastern area, which presents a greater propensity for residential buildings to be vulnerable to heatwave scenarios. This area is located near the historic center of the city, where there is a high density of residential buildings; this is due to the fact that in this area the buildings were mainly built in materials that have ineffective thermal performance, such as reinforced concrete. In contrast, the western zone of the area of study has low values for residential building heatwave vulnerability. In fact, in this area, mainly located in the historic city center, there are mostly load-bearing masonry buildings with good thermal performance; furthermore, the high building density prevents too much sun from shining on the building facades.
As can be seen from the thematic map in Figure 6, a large central area of the area of study has a greater propensity of open spaces to heatwave vulnerability, mainly because it is predominantly of an industrial nature with open spaces that are almost totally impervious. Even the western area of the area of study in the historic city center shows a propensity of open spaces to heatwave vulnerability; this is due to the presence in this area of exclusively waterproof open spaces. Conversely, the low propensity of open spaces to heatwave vulnerability in two zones to the south and south-east of the area of study is mainly due to the fact that in this area there are permeable surfaces of different types of soil, which prevent the achievement of negative or low values of the NDVI index.
Figure 7 and Figure 8 show the thematic maps of the criteria pluvial flooding residential building vulnerability and pluvial flooding open space vulnerability, respectively.
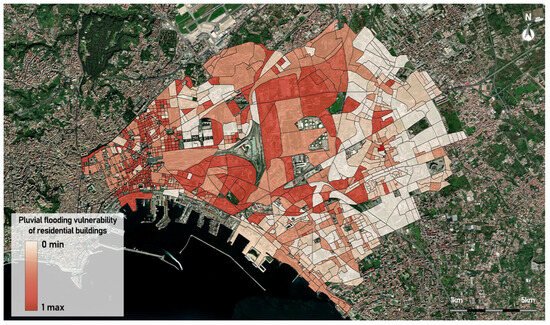
Figure 7.
Thematic map of the pluvial flooding residential building vulnerability criterion.
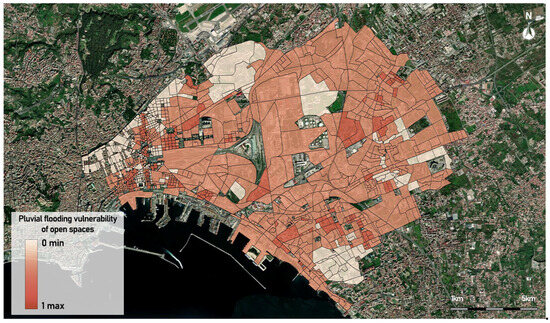
Figure 8.
Thematic map of the pluvial flooding open space vulnerability criterion.
Figure 7 shows an exceptionally large area located mainly to the west and center of the area of study, with buildings more likely to be vulnerable to pluvial flooding scenarios; this is mainly due to the prevalence of multiple activities on the ground floors in this area. On the contrary, in the eastern area of the city, there are much fewer buildings with activities on the ground floors.
The thematic map in Figure 8 shows that in almost all the subzones of the area of study, the open spaces have a not negligible propensity to be vulnerable to pluvial flooding scenarios. This result is due to the presence in the area of study of drainage and rainwater disposal systems that are ineffective in managing the wastewater load.
To set the two criticality thresholds, θL and θH, the help of a domain expert was used. He identified in a set of urban settlements, based on his own experience, which areas were most vulnerable to both phenomena (hot spots) and which ones were the least critical (cold spots). After running the model in these areas, the minimum criticality value determined in the hot spot areas was set as the θH threshold, and the maximum value determined in the cold spot areas was set as the θL threshold. These values are fixed to θH = 0.1 and θL = 0.01.
Figure 9 shows the thematic map of criticality, in which the subzones are classified as having low, medium, and high criticality.
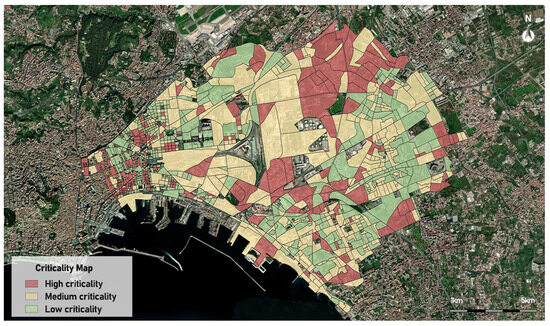
Figure 9.
Final criticality map of the area of study.
The most critical subzones are mainly concentrated to the west and north-east of the area of study. In them, the propensity for vulnerability of buildings and open spaces to both phenomena is high or not negligible. On the contrary, in the south and south-eastern areas, low criticality prevails in most subzones, mainly due to a low propensity of open spaces to be vulnerable to heatwave scenarios and to a low propensity of buildings to be vulnerable to pluvial flooding scenarios.
Table 11 shows the percentages of subzones of the three patterns belonging to the three classes of criticality.
Table 11.
Frequencies of subzones grouped by pattern and classified with low, medium, and high criticality.
In Table 11, the high-built density pattern records the greatest presence of subzones classified as having high criticality. The reason for this is linked to the high volume of residential buildings located in these subzones; this connotation is typical of the areas of the historic center, present to the west of our study area, which have an extremely low presence of open spaces.
Conversely, the medium density pattern records an exceptionally low value for subzones classified with high criticality; this is inferable from the presence of open spaces mainly of permeable type and an overall lower built volume. This type of pattern can be found in the areas to the east and south-east of the study area that constitute the most peripheral districts of the city of Naples; these districts are characterized by green spaces and residential buildings with smaller volumes compared to those of the historic center and different types of construction.
About 27% of subzones belonging to the low-built pattern are classified as having high criticality; the reason for that is the high presence of waterproof open spaces, typical of the industrial areas present in the center-north of the study area. In fact, despite being residential, in these subzones there are industrial complexes that, despite having a low volume of buildings, have large open spaces that are completely waterproof.
In summary, the most critical areas are concentrated as follows:
- in the western area, corresponding to the historic city center and corresponding to areas with a high-built density and an absence of permeable open spaces;
- in the industrial areas to the north-east of the urban area of study, which, despite being characterized by a low building density, are poor in permeable open spaces and equipped with large permeable open space surfaces, which affect the vulnerability to hazard scenarios of heat waves and pluvial flooding.
In order to verify the performance of the model, the results were compared with those obtained by applying the heatwave and pluvial flooding vulnerability assessment model [5] described in previously.
To carry out the comparative tests, the model proposed in [5] was implemented by building the hierarchical structure of the indicators necessary to evaluate the vulnerabilities of the building and open space subsystems to the two phenomena, which are divided into five classes: 1—high, 2—medium-high, 3—medium, 4—medium-low, 5—low.
To compare the results obtained in the two models for each of the two phenomena and for each of the two physical subsystems, a statistical analysis was carried out aimed at verifying the congruence of the spatial distribution of the vulnerabilities obtained with the two models.
For all the subzones belonging to a specific vulnerability class according to the model [5], the average and standard deviation values of the membership degrees to the fuzzy set of the corresponding criterion in the proposed model were calculated.
Table 12 shows the number of subzones belonging to each vulnerability class and the average and standard deviation of the membership degree value.
Table 12.
Average and standard deviation of the membership degrees to the fuzzy sets of the four vulnerability criteria of the subzones belonging to each vulnerability class.
The results in Table 12 show that, in all four cases, as the vulnerability of the subzones increases, the average value of the membership degree to the fuzzy set that models the criterion increases. Furthermore, the values of the standard deviations are in all cases smaller than the mean values, and the ratio between the measured standard deviation and the mean is always less than 0.4. This result highlights that the fluctuations from the average values are limited; this allows us to validate the existence of this correlation between the results obtained by executing the two models.
One of the main limitations of the proposed MCDA model is the fact that it uses a limited number of indicators to evaluate the vulnerabilities of the two subsystems; this, while facilitating the portability of the model, may lead to less accurate results than those possible with models that use a larger number of indicators, such as, for example, [22,23,24]. On the other hand, the use of a large number of indicators can lead to difficulty in finding data with high spatial resolution and, consequently, low portability of the model. By the way, considering spatial scales for subzones with average extensions of urban census zones, high spatial accuracy in the detection of the urban areas most at risk is not necessary.
4. Conclusions and Future Works
We propose a novel GIS-based fuzzy hierarchical MCDA model applied to assess the vulnerability of physical components of urban settlements in the presence of climatic independent multi-hazard scenarios. The model allows us to evaluate the propensity of physical components to vulnerability to multi-hazard heatwave and pluvial flooding scenarios. Following [5], the urban settlement is partitioned into the building and open space subsystems and the model is applied to evaluate a multi-hazard vulnerability index given by the criticality of urban subzones in the presence of both phenomena.
The model was tested on the central-eastern area of the municipality of Naples, in Italy. The results highlighted the presence of a critical region to the north-east of the area of study in which there is a high predisposition of open spaces to be vulnerable to heatwave scenarios and of buildings to be vulnerable to pluvial flooding scenarios.
Comparison tests have shown that the results are compatible with those obtained using the vulnerability assessment model of buildings and open spaces to heatwave and pluvial flooding phenomena proposed in [5].
Compared to other multi-risk models based on multi-criteria approaches, the proposed model has the advantage of defining the subsystems of an urban settlement in a more natural way. In fact, it uses a hierarchical fuzzy-based MCDA model in which each sub-criterion node corresponds to a fuzzy set automatically constructed starting from the fuzzy sets of the sub-nodes that compose it. The degree of criticality is determined in the root node of the hierarchical tree of criteria, assigning a degree of preference to the vulnerabilities of the two subsystems, buildings, and open spaces, based on the built density in the subzone.
The main critical point of this model is that it was built taking into consideration only the set of characteristics determined in [5] for the assessment of the vulnerabilities to heatwaves and pluvial flooding of the two urban subsystems. However, the hierarchical structure of the fuzzy MCDA model used may allow in the future to refine the model by taking into consideration a larger number of characteristics of an urban subsystem that impact its vulnerability. Furthermore, Saaty’s pairwise comparison matrix for each criterion was constructed taking into consideration the weights of the intermediate indicators assigned in [5] for the determination of the vulnerability indicators. However, these weights may vary depending on the type of urban settlement; further research will be necessary to optimize the values of the Saaty’s pairwise comparison matrices of the individual criteria, analyzing the impact of the identified characteristics on the vulnerability of the subsystems depending on the type of urban settlement.
Finally, the proposed model considers independent climate hazard events. A future evolution of the research includes the extension of the model to treat all types of climatic and environmental multi-hazards.
Author Contributions
Conceptualization, B.C., V.D., F.D.M. and V.M.; methodology, B.C., V.D., F.D.M. and V.M.; software, B.C., V.D., F.D.M. and V.M.; validation, B.C., V.D., F.D.M. and V.M.; formal analysis, B.C., V.D., F.D.M. and V.M.; investigation, B.C., V.D., F.D.M. and V.M.; resources, B.C., V.D., F.D.M. and V.M.; data curation, B.C., V.D., F.D.M. and V.M.; writing—original draft preparation, B.C., V.D., F.D.M. and V.M.; writing—review and editing, B.C., V.D., F.D.M. and V.M.; visualization, B.C., V.D., F.D.M. and V.M.; supervision, B.C., F.D.M. and V.M. All authors have read and agreed to the published version of the manuscript.
Funding
This research received no external funding.
Institutional Review Board Statement
Not applicable.
Informed Consent Statement
Not applicable.
Data Availability Statement
Data is contained within the article.
Conflicts of Interest
The authors declare no conflicts of interest.
References
- Tilloy, A.; Malamud, B.D.; Winter, H.; Joly-Laugel, A. A review of quantification methodologies for multi-hazard interrelationships. Earth-Sci. Rev. 2019, 196, 102881. [Google Scholar] [CrossRef]
- Pescaroli, G.; Alexander, D. Understanding compound, interconnected, interacting, and cascading risks: A holistic framework. Risk Anal. 2018, 38, 2245–2257. [Google Scholar] [CrossRef] [PubMed]
- Eshrati, L.; Mahmoudzadeh, A.; Taghvaei, M. Multi hazards risk assessment, a new methodology. Int. J. Health Syst. Disaster Manag. 2015, 3, 79–88. [Google Scholar]
- van Westen, C.J.; Greiving, S. Multi-hazard risk assessment and decision making. In Environmental Hazards Methodologies for Risk; Dalezios, N.R., Ed.; International Water Association (IWA) Publishing: London, UK, 2017; pp. 31–94. [Google Scholar] [CrossRef]
- Apreda, C.; D’Ambrosio, V.; Di Martino, F. A climate vulnerability and impact assessment model for complex urban systems. Environ. Sci. Policy 2019, 93, 11–26. [Google Scholar] [CrossRef]
- Cardone, B.; Di Martino, F. GIS-based hierarchical fuzzy multicriteria decision-making method for urban planning. J. Ambient. Intell. Humaniz. Comput. 2021, 12, 601–615. [Google Scholar] [CrossRef]
- Cardone, B.; Di Martino, F.; Miragia, V. GIS-based hierarchical fuzzy MCDA framework for detecting critical urban areas in climate scenarios. In Proceedings of the Computational Science and Its Applications—ICCSA 2023 Workshops, Athens, Greece, 3–6 July 2023; Lecture Notes in Computer Science; Springer Nature: Cham, Switzerland, 2023; Volume 14108, pp. 345–358. [Google Scholar] [CrossRef]
- Schneider, P.J.; Schauer, B.A. HAZUS, its development and its future. Nat. Hazards Rev. 2006, 7, 40–44. [Google Scholar] [CrossRef]
- Core Writing Team; Lee, H.; Romero, J. (Eds.) IPCC, 2023: Climate Change 2023: Synthesis Report; Contribution of Working Groups I, II and III to the Sixth Assessment Report of the Intergovernmental Panel on Climate Change; IPCC: Geneva, Switzerland, 2023; p. 184. [Google Scholar] [CrossRef]
- Blocken, B. Computational fluid dynamics for urban physics: Importance, scales, possibilities, limitations and ten tips and tricks towards accurate and reliable simulations. Build. Environ. 2015, 91, 219–245. [Google Scholar] [CrossRef]
- Masson, V.; Lemonsu, A.; Hidalgo, J.; Voogt, J. Urban Climates and Climate Change. Annu. Rev. Environ. Resour. 2020, 45, 411–444. [Google Scholar] [CrossRef]
- Sterzel, T.; Lüdeke, M.K.; Walther, C.; Kok, M.T.; Sietz, D.; Lucas, P.L. Typology of coastal urban vulnerability under rapid urbanization. PLoS ONE 2020, 15, 24. [Google Scholar] [CrossRef]
- Edmonds, H.K.; Lovell, J.E.; Lovell, C.A.K. A new composite climate change vulnerability index. Ecol. Indic. 2020, 117, 106529. [Google Scholar] [CrossRef]
- Zhao, L.; Oleson, K.; Bou-Zeid, E.; Kraienhoff, E.S.; Bray, A.; Zhu, Q.; Zheng, Z.; Chen, C.; Oppenheimer, M. Global multi-model projections of local urban climates. Nat. Clim. Chang. 2021, 11, 152–157. [Google Scholar] [CrossRef]
- Sivakumar, V.L.; Krishnappa, R.R.; Nallanathel, M. Drought vulnerability assessment and mapping using Multi-Criteria decision making (MCDM) and application of Analytic Hierarchy process (AHP) for Namakkal District, Tamilnadu, India. Mater. Today: Proc. 2021, 43, 1592–1599. [Google Scholar] [CrossRef]
- Saaty, T.L. Theory and Applications of the Analytic Network Process: Decision Making with Benefits, Opportunities, Costs, and Risk; RWS Publications: Pittsburgh, PA, USA, 2013; p. 370. ISBN 0962031798. [Google Scholar]
- Saaty, T.L.; Kearns, K.P. Analytical Planning: The Organization of System; International Series in Modern Applied Mathematics and Computer Sciences; Pergamon Press: Oxford, UK, 2014; Volume 7, p. 205. [Google Scholar] [CrossRef]
- Chang, D.Y. Applications of the extent analysis method on fuzzy AHP. Eur. J. Oper. Res. 1996, 95, 649–655. [Google Scholar] [CrossRef]
- Ganji, K.; Gharechelou, S.; Ahmadi, A.; Johnson, B.A. Riverine flood vulnerability assessment and zoning using geospatial data and MCDA method in Aq’Qala. Int. J. Disaster Risk Reduct. 2022, 82, 103345. [Google Scholar] [CrossRef]
- Asori, M.; Emmanuel, D.; Dumedah, G. Wildfire hazard and Risk modelling in the Northern regions of Ghana using GIS-based Multi-Criteria Decision Making. Anal. J. Environ. Earth Sci. 2020, 10, 18. [Google Scholar]
- Bagheri, M.; Zaiton Ibrahim, Z.; Mansor, S.; Abd Manaf, L.; Akhir, M.F.; Talaat, W.I.A.W.; Beiranvand Pour, A. Application of Multi-Criteria Decision-Making Model and Expert Choice Software for Coastal City Vulnerability Evaluation. Urban Sci. 2021, 5, 84. [Google Scholar] [CrossRef]
- Kumar Dubey, A.; Lal, P.; Kumar, P.; Kumar, A.; Dvornikov, A.Y. Present and future projections of heatwave hazard-risk over India: A regional earth system model assessment. Environ. Res. 2021, 201, 111573. [Google Scholar] [CrossRef] [PubMed]
- Ishak, A.; Asfriyati; Nainggolan, B. Integration of fuzzy AHP-VIKOR methods in multi criteria decision making: Literature review. IOP Conf. Ser. Mater. Sci. Eng. 2020, 1003, 0121630. [Google Scholar] [CrossRef]
- Mabrouk, M.; Haoying, H. Urban resilience assessment: A multicriteria approach for identifying urban flood-exposed risky districts using multiple-criteria decision-making tools (MCDM). Int. J. Disaster Risk Reduct. 2023, 91, 103684. [Google Scholar] [CrossRef]
- Sambo, B.; Bonato, M.; Sperotto, A.; Torresan, S.; Furlan, E.; Lambert, J.H.; Linkov, I.; Critto, A. Framework for multirisk climate scenarios across system receptors with application to the Metropolitan City of Venice. Risk Anal. 2023, 43, 2241–2261. [Google Scholar] [CrossRef]
- Maragno, D.; Pozzer, G.; Dall’Omo, C.F. Supporting metropolitan Venice coastline climate adaptation. A multi-vulnerability and exposure assessment approach. Environ. Impact Assess. Rev. 2023, 100, 107097. [Google Scholar] [CrossRef]
- Arefiev, N.; Terleev, V.; Badenko, V. GIS-based Fuzzy Method for Urban Planning. Procedia Eng. 2015, 117, 39–44. [Google Scholar] [CrossRef][Green Version]
Disclaimer/Publisher’s Note: The statements, opinions and data contained in all publications are solely those of the individual author(s) and contributor(s) and not of MDPI and/or the editor(s). MDPI and/or the editor(s) disclaim responsibility for any injury to people or property resulting from any ideas, methods, instructions or products referred to in the content. |
© 2024 by the authors. Licensee MDPI, Basel, Switzerland. This article is an open access article distributed under the terms and conditions of the Creative Commons Attribution (CC BY) license (https://creativecommons.org/licenses/by/4.0/).