Article

The Characteristics of Luminescence from High-Temperature- and High-Pressure-Treated Diamonds

1
National Gems & Jewelry Testing Group, Beijing Education Technology Co., Ltd., Beijing 100013, China
2
School of Gemology, China University of Geosciences, Beijing 100083, China
*
Author to whom correspondence should be addressed.
Appl. Sci. 2024, 14(7), 3071; https://doi.org/10.3390/app14073071
Submission received: 17 January 2024 / Revised: 19 March 2024 / Accepted: 1 April 2024 / Published: 5 April 2024
(This article belongs to the Special Issue New Advances, Challenges, and Illustrations in Applied Geochemistry)

Abstract

:
High-temperature and high-pressure (HTHP)-treated diamonds have attracted attention all over the world due to their vivid colors. In order to explore a new method for the rapid and non-destructive identification of HTHP-treated diamonds, in this paper, five IaAB-type diamonds yielded in Russia were selected as the research object and treated with HTHP. The HTHP-treated diamonds were investigated by DiamondViewTM, cathodoluminescence, micro-infrared spectrometry (micro-IR), low-temperature photoluminescence (PL) spectrometry, and three-dimensional (3D) fluorescence spectrometry. The results show that under DiamondViewTM and cathode rays, the five samples were all non-phosphorescent with different luminous patterns, such as regular annular bands, multiple groups of intersecting linear stripes, or jagged stripes. In the low-temperature PL spectra, most HTHP-treated diamonds exhibited stronger luminescence peaks at 637 nm compared to 575 nm. But there were also exceptions, such as the purple-red sample showing the opposite luminescence peak. In the 3D fluorescence spectrum of the HTHP-treated diamonds, the fluorescence peak mainly appeared in the range of 440–450 nm, accompanied by a broad band of 350–500 nm and even longer wavelengths. Meanwhile, some samples also exhibited fluorescence peaks at longer wavelengths, such as 353 nm, 676 nm, and 665 nm. These results make it possible to identify HTHP-treated diamonds by using luminescence characteristics, providing a new method for the non-destructive and rapid detection of HTHP-treated diamonds.

1. Introduction

Colored diamonds have always been highly sought after by consumers, and their colors are diverse, including gold, brown, green, and blue. In recent years, with the improvements in high-temperature and high-pressure (HTHP) treatment technology, this technology has also been applied to the field of diamond color modification. In 1999, General Electric (GE) used HTHP treatment technology to turn brown and gray IIa diamonds into colorless to nearly colorless diamonds [1,2]; in the same year, HTHP treatment technology was also used to turn type Ia brown Nova diamonds into a bright yellow-green color [3,4]. Since then, more and more scholars have begun to devote themselves to the research of HTHP treatment experiments [3,5,6]. With the continuous progress of treatment technology, through HTHP treatment, diamonds can present more vivid colors, such as golden yellow, pink, and so on [7,8]. The research of the HTHP treatment of diamonds has also been deepening. HTHP laboratory conditions provided sufficient isotropic pressure and potential energy for treating lattice defects in brown-yellow diamonds, which helped the dislocations in type Ia and IIa brown-yellow diamonds to climb, reorganize, annihilate, proliferate, and slip, finally transforming the diamonds into colorless, yellow-green, and blue diamonds [1,9,10,11]. In another study, the formation and evolution of lattice defects jointly restricted diamond color and luminescence [10]. In other experiments, brown diamonds were changed to yellow after HTHP treatment, mainly related to H3, H4, and N3 centers and isolated nitrogen [12,13,14]. Diamonds becoming green or yellow-green after treatment has been shown to be mainly related to H2 and H3 centers [12,14,15,16]; after treatment, the red color is mainly related to high concentrations of (N-V) centers [4,12,14,17,18]. In other experiments, the color of type IIa diamonds became white, mainly because no new color centers were formed due to vacancies and the disappearing of interstices [10,14].
However, previous research on HTHP-treated diamonds has mainly focused on the color-changing mechanism and spectroscopic characteristics; there is relatively little research on their luminescence. Therefore, this paper takes HTHP-treated diamonds as samples and conducts research on their luminescence characteristics by DiamondViewTM, cathodoluminescence, low-temperature photoluminescence (PL), and three-dimensional (3D) fluorescence spectrometry, and hopes to find a non-destructive and rapid method of identification of HTHP diamonds.

2. Materials and Methods

The samples tested in this study were five natural diamonds from Russia, and they were subjected to high-temperature and high-pressure treatment to change their color (Figure 1). The colors of the samples mainly include yellow-green (R-YG-1), yellow (R-Y-1, R-Y-2), purple-red (R-P-1), and brown (R-B-1). The HTHP treatment of diamonds was carried out in a cubic press. The temperature range was 1600~2400 °C, the pressure range was 5.5~8 GPa, and the time range was 15~30 min. In this paper, the basic gemological properties of the samples were observed by a gemological microscope, crossed polarizers, and ultraviolet fluorescent lamps. Micro-IR was used to identify the type of diamond. Bruker Lumos FTIR was used for spectral analysis, with a wave number range of 600~4000 cm−1, 32 scans, and a resolution was 4 cm−1. DiamondViewTM was applied to observe the growth structure and fluorescence from the samples at room temperature using a short-wavelength (<230 nm) ultraviolet light source. The above two tests were completed in the gem laboratory of the School of Gemmology, China University of Geosciences, Beijing. The model of the cathodoluminescence test instrument was RELIONⅢ, and the test was carried out at the Analtical Laboratory of BRIUG. A DXR Raman Microscope was used to analyze the PL spectrum. The wavelength of the laser was 532 nm, the exposure time was 1 s, and the number of exposures was 30. The 3D fluorescence spectra of the diamond samples were analyzed by the fluorescence spectrometer FL3-TCSPC. The excitation slit was 14.00 nm, the emission slit was 14.00 nm, the integration time was 0.1 s, the excitation wavelength range was 230~400 nm, and the emission wavelength range was 236~1050 nm. PL and 3D contour fluorescence plot (HORIBA Fluorolog-3) tests were completed at the Beijing branch of HORIBA (Beijing, China).

3. Results and Discussion

3.1. Gemological Properties

Except for sample R-P-1, the color distribution of other samples was more uniform. The local color of sample R-P-1 showed a stripe distribution. The internal characteristics of the samples were observed by a gemological microscope, and black opaque hexagonal sheet inclusions (Figure 2a), rounded colorless crystal inclusions (Figure 2b), and disc-shaped stress fractures (Figure 2c) were observed in some samples. Under orthogonally polarized light, the samples showed obvious anomalous birefringence of parallel bands (Figure 2d) or ripples (Figure 2e). The extinction geometric pattern remained basically unchanged at any rotation angle, accompanied by strong interference color (Figure 2f). The ultraviolet fluorescence characteristics of the samples are shown in Table 1.

3.2. DiamondViewTM and Cathodoluminescence

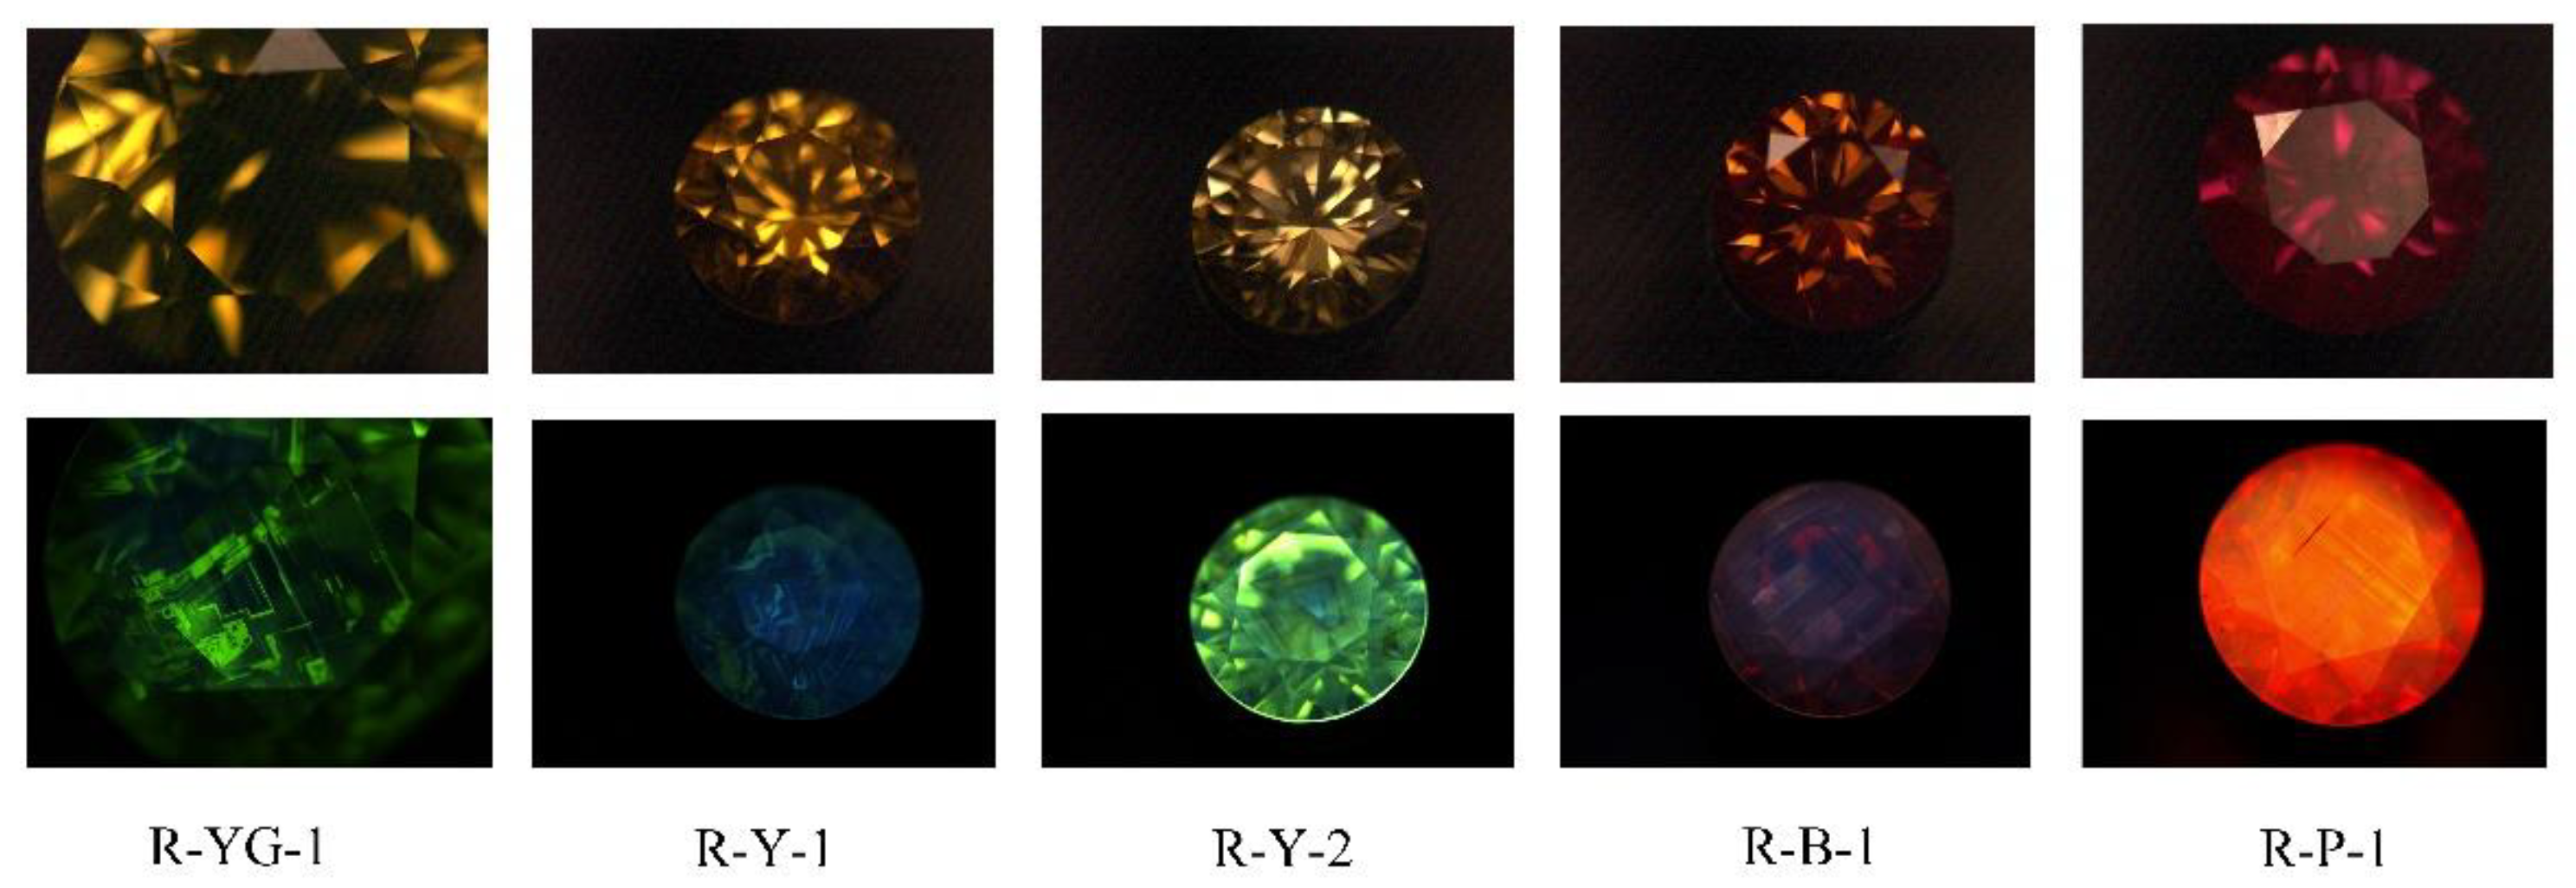
The five samples presented different fluorescence images in DiamondViewTM, but none of them had phosphorescence. The specific luminous pattern is shown in Figure 3. Sample R-YG-1 emitted medium green fluorescence, presenting a geometric luminescence pattern of a “chip” shape. The growth rings were straight and fine, and some were serrated. The central luminescence was relatively concentrated and uniform, presenting a regular quadrilateral luminescence pattern. Sample R-Y-1 showed weak green and blue fluorescence at the same time, and the whole growth band was fine and straight, with a partial ladder shape. Sample R-Y-2 presented strong yellow-green fluorescence in general, and blue fluorescence was seen in local areas. The outer part was a lamellar growth ring, and a structure similar to a “growth nucleus” was seen in the center. Sample R-B-1 showed a weak orange fluorescence with blue, straight growth bands. The purple sample R-P-1 showed a strong orange fluorescence, and some showed a yellow and orange fluorescence interphase distribution, which was consistent with the characteristics of the ribbon. In addition, a linear growth pattern was visible, with some of the nearly vertically intersected reticular luminescence patterns.
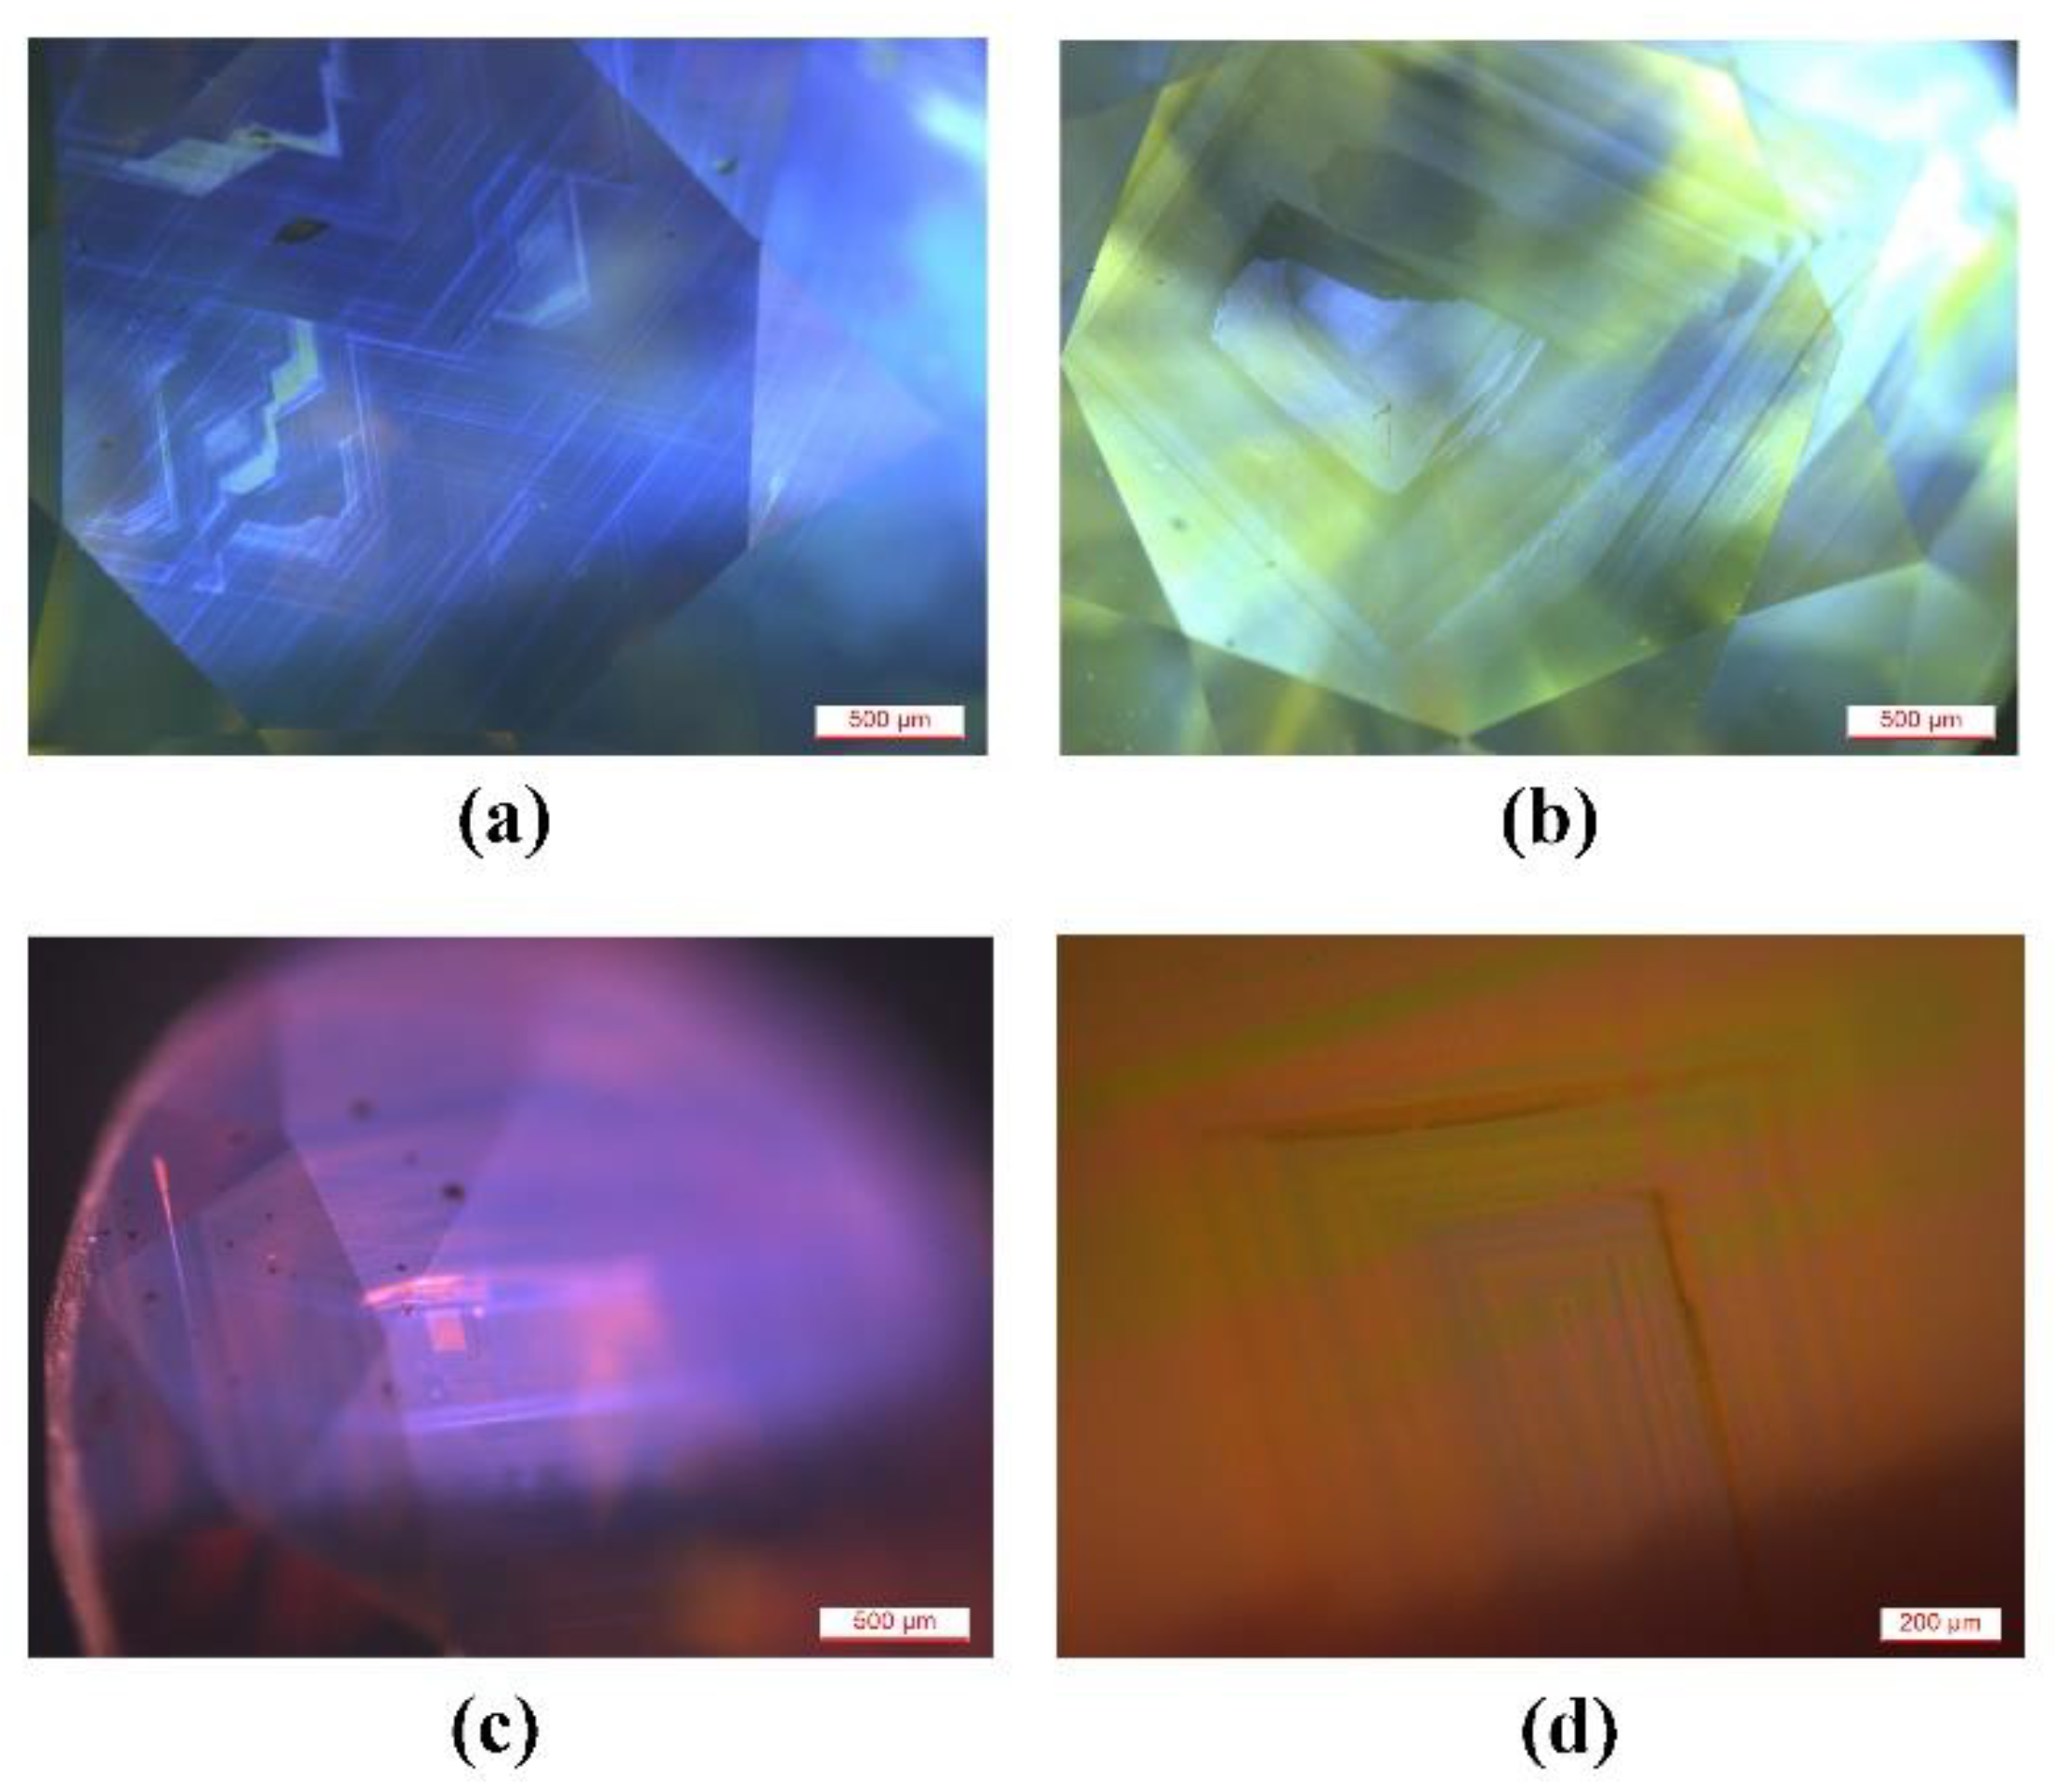
Cathodoluminescence was used to further observe the color patterns of the samples. Under high-energy cathode rays, the luminescence characteristics of the samples were basically the same as those seen in DiamondViewTM, but the luminous intensity under the cathode rays was relatively strong, and the image was sharper, thus providing more detail. Jagged growth textures were seen in the sample R-Y-1. In addition, three groups of fine flat linear textures were visible (Figure 4a). In sample R-Y-2, the edge of the part similar to the “growth nucleus” was irregular, and was cut off from the fine, straight, and quadrangular growth ring outside (Figure 4b). In addition to the blue growth ring in the sample R-B-1, a uniform orange luminescence pattern with a regular quadrilateral could be seen (Figure 4c). Sample R-P-1 presented a strip-like luminescence pattern with orange and yellow intersections, and regular laminar growth bands could also be seen inside (Figure 4d). The observation of cathodoluminescence images of diamonds can (1) reveal the internal morphology, growth structure, growth mechanism, growth stage, and process of diamonds; (2) provide the plastic deformation information of diamonds; (3) verify and interpret the results of an infrared spectrum analysis, a stable isotope analysis, and the geological chronology of the diamond microzone; and (4) provide key evidence for distinguishing a natural diamond from a synthetic diamond. It can be seen from the combination of the observation under DiamondViewTM and cathodoluminescence that, in the HTHP-treated diamond samples, the yellow-green samples presented yellow-green luminescence, while the yellow samples mainly presented luminescence characteristics of a combination of blue and green, and the brown and purple samples presented a luminescence of orange with different intensities.
In the study of the cathodoluminescence of HTHP-treated diamonds, it has been proposed that the geometric luminous patterns of diamonds before and after HTHP treatment have obvious differences. On the {111} plane of natural brown-yellow diamonds without HTHP treatment, three groups of slip surfaces (lines) are generally developed. The slip band emits a more uniform strong yellow-green luminescence and obviously cuts through and destroys the primary growth ring structure of the diamond, while the locally remaining primary growth ring emits strong blue luminescence, and the sub-deformation transition zone emits uneven strong blue-white luminescence [10,19]. However, HTHP conditions provide sufficient isotropic pressure and potential energy for the crystal defects in these brown and brown-yellow diamonds [10,11]. On the basis of helping the crystal defects to change and achieve the purpose of color change, their luminosity will also be affected. The surface of a yellow-green diamond treated with HTHP shows strong yellow-green luminescence as a whole, and three groups of clear CL slip surfaces (lines) and CL deformation bands show strong yellow-green luminescence, which constitutes the characteristics of loading-type strong dislocation slip reflected in HTHP-treated yellow-green diamonds [10,19]. Jia and Chen [20] combined HTHP-treated type Ia natural diamond fluorescence images and a PL spectrum analysis and found out that blue fluorescence is mainly caused by N3, while yellow-green fluorescence is related to an H3 center [5]. In addition, Luo and Breeding [21] also proposed that HTHP-treated orange and yellow type Ia natural diamonds show orange-yellow fluorescence, mainly due to the presence of the 480 nm band.
From the point of view of the luminous patterns, the samples appeared relatively complicated, and the luminous patterns were mainly divided into three types: regular annulus bands, multiple groups of intersecting linear stripes, and jagged stripes. Bulanova and Milledge [22] studied the cathodoluminescence of the particulate diamond system in Yakut Kimberlite and concluded that there are three main types of diamond growth structure: single octahedral growth bands, complex growth bands, and multi-stage growth bands, and most diamonds are of the single octahedral growth band type. The regular growth bands observed in the samples here belong to this type of growth structure. According to Chen et al. [23], these types of growth bands are straight with different widths and consist of non-luminescent regions and blue-green luminescence regions, arranged parallel from the center to the outside and obviously controlled by the layered growth mechanism. The three groups of fine linear textures observed in the samples are the characteristics of loading-type strong dislocation slip reflected in HTHP-treated diamonds. According to the study of Luo [19], this is the important identification basis of HTHP-treated yellow-green diamonds.
According to the study of Chen et al. [24], the serrated ablation lines or irregular growth pattern and the dense growth pattern in the reaction stage indicate that the diamond grows under pulsating temperature–pressure conditions, and the pulsating characteristics reflect the periodic interaction between the fluid and the melt in an unstable state. Therefore, it can be inferred that the serrated growth texture in the samples observed under cathodoluminescence is an indication of its complex growth environment and process.

3.3. Micro-Infrared Spectroscopy (micro-IR)

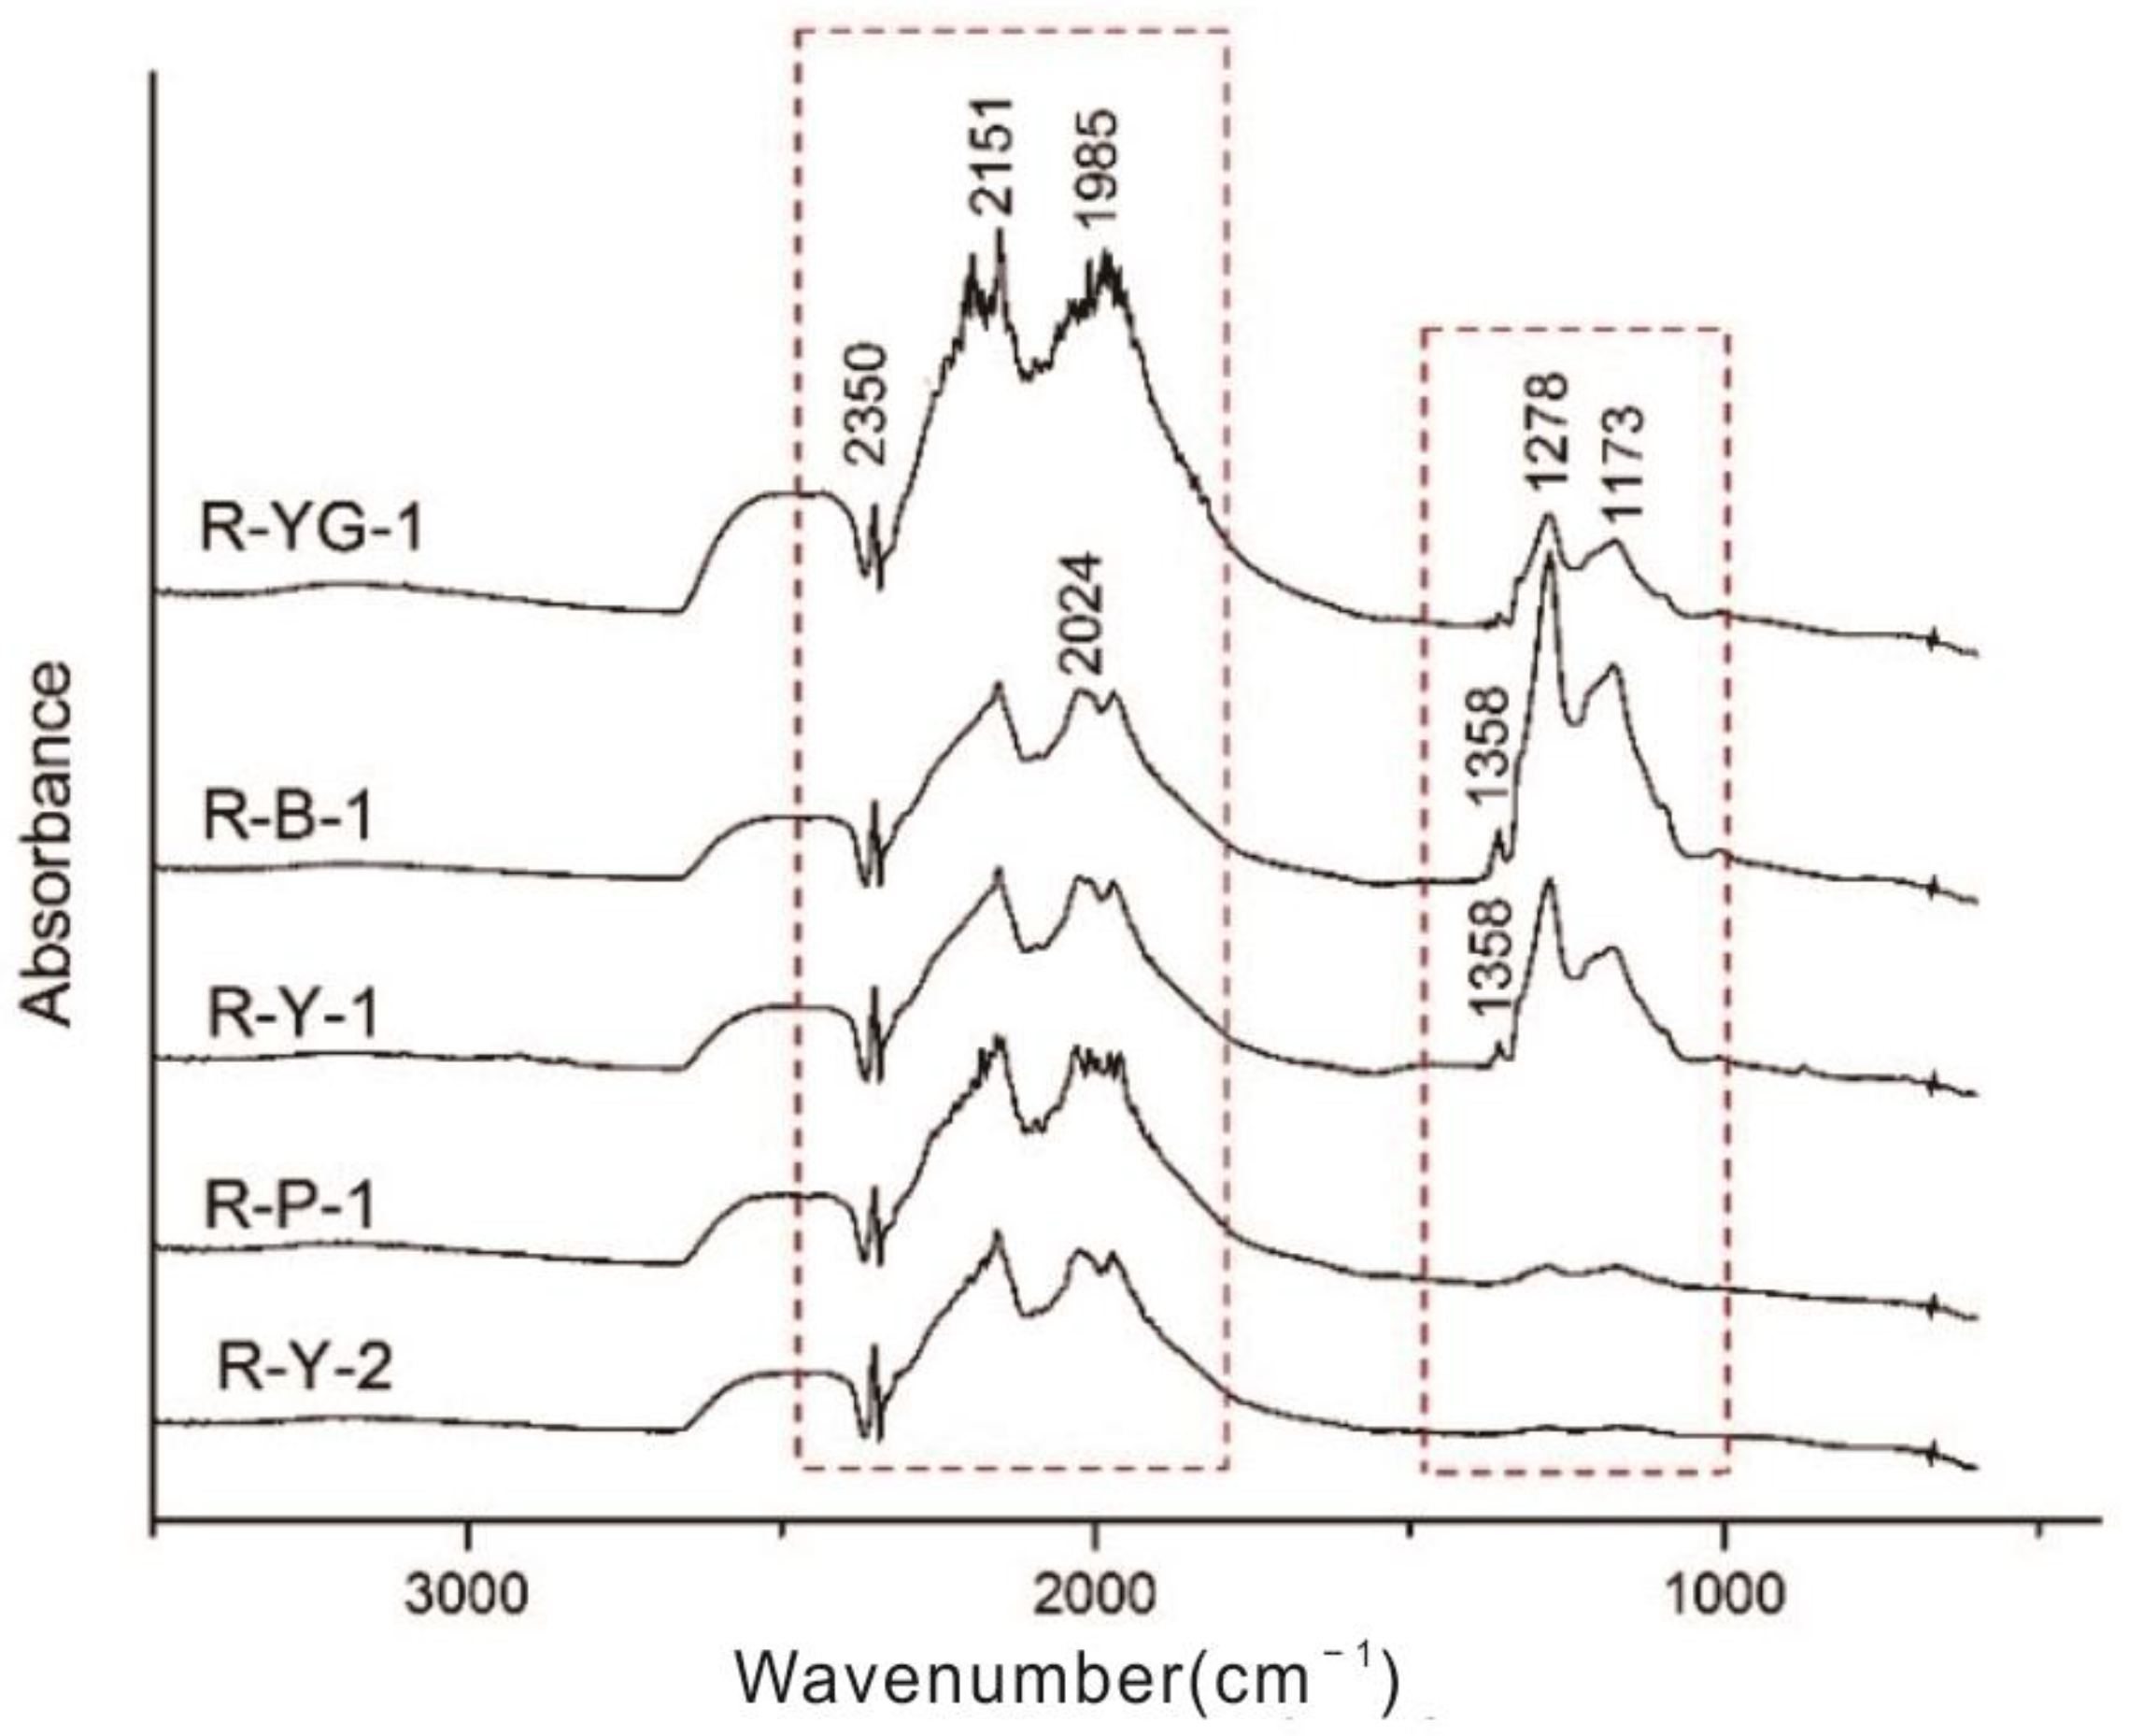
The results of the micro-IR test are shown in Figure 5. The main absorption peaks of the five samples were basically the same. They mainly included the strong absorption peaks at 2350, 2157, and 2030 cm−1 and the absorption peaks at 1282 and 1175 cm−1. For samples R-YG-1, R-Y-1, and R-B-1, the absorption peaks of 1282 and 1175 cm−1 were relatively obvious, and the peak intensity corresponding to 1282 cm−1 was greater than that of 1175 cm−1. The two absorption peaks in sample R-Y-2 and R-P-1 were weak, and some samples showed absorption peaks at 1358 cm−1.
Combining the analysis of the diamond microscopic infrared spectrum by Yang et al. [25], the infrared spectrum of the sample can be divided into two parts: (1) The absorption peak of below 1332 cm−1 is a one-phonon absorption region, where the one-phonon absorption caused by the A nitrogen center is located near 1282 cm−1, and the photon absorption caused by the B nitrogen center is located near 1175 cm−1. It can be judged that the five diamond samples are all IaAB diamonds. (2) Next are the absorption peaks around 1973~2500 cm−1, such as the absorption caused by C-C lattice vibration near 1973, 2022, and 2159 cm−1.

3.4. PL Spectroscopy

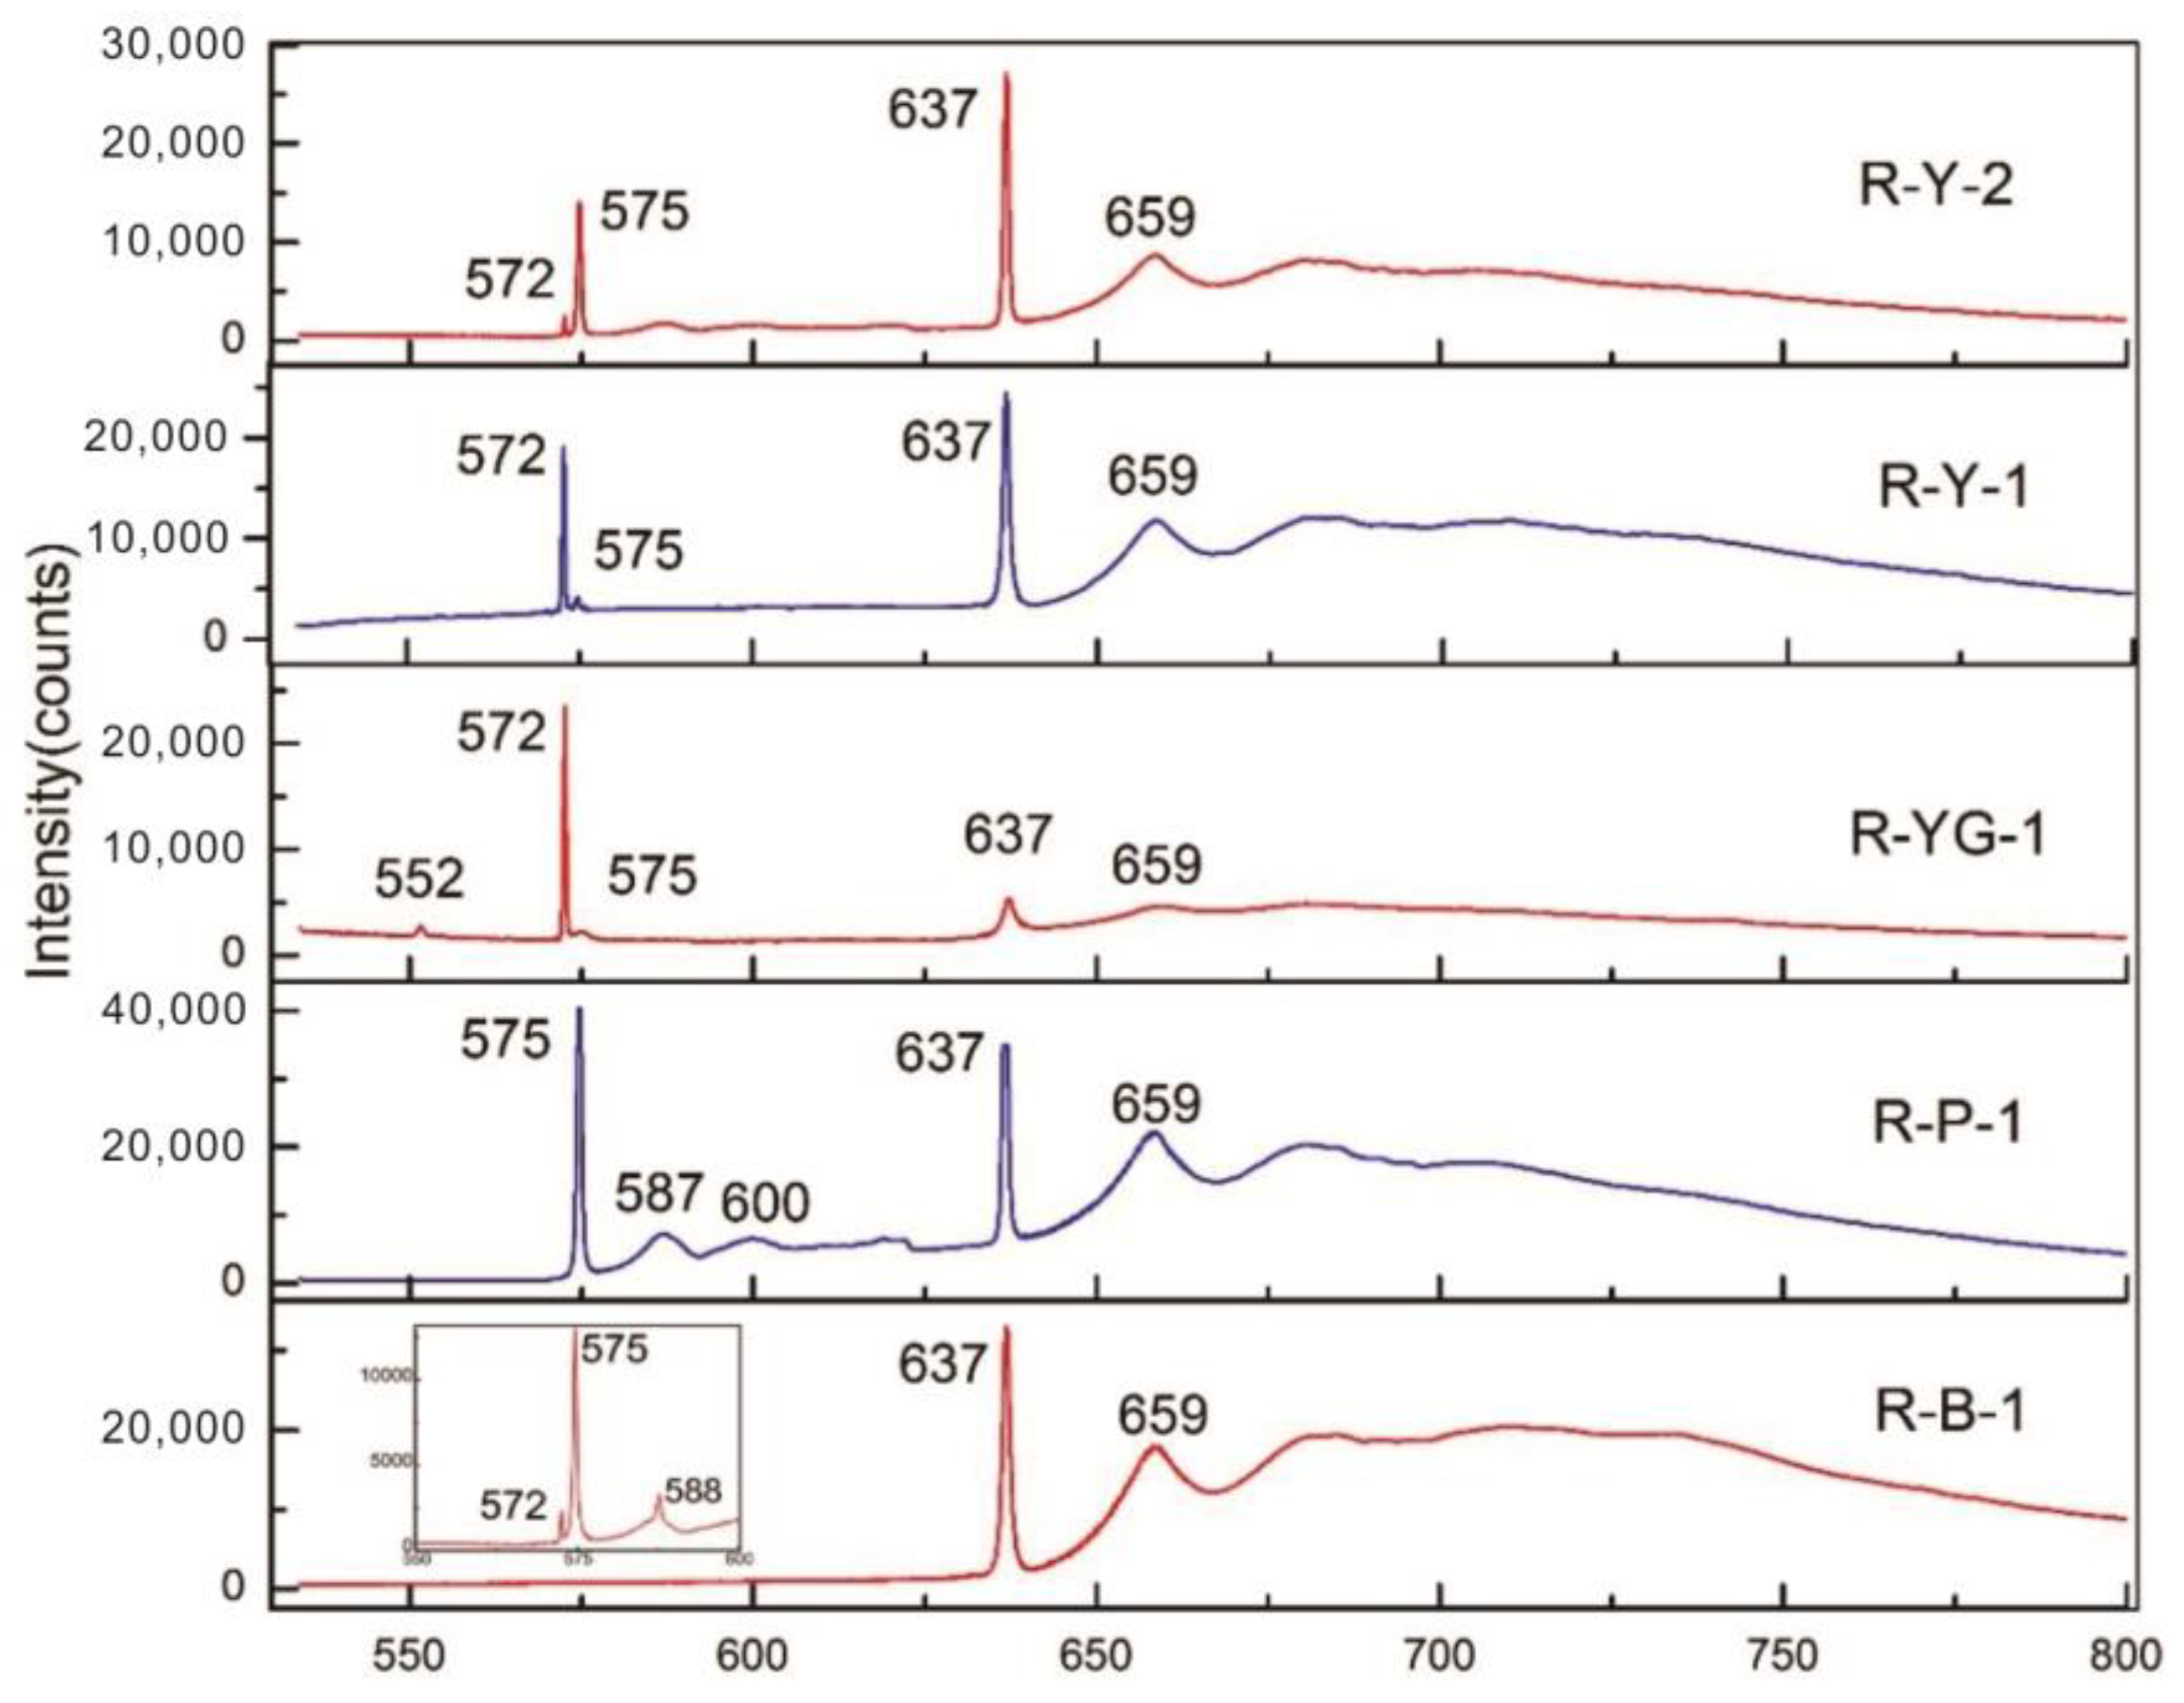
Using the 532 nm wavelength laser as a light source, the PL spectra of the HTHP-treated diamonds were measured in a liquid nitrogen environment. The PL spectra of the five samples obtained are shown in Figure 6.
It can be seen from Figure 6 that except for the weak emission peak of the sample R-YG-1 at 552 nm, no other samples show emission peaks here. The luminescence peak at 552 nm is the intrinsic peak of the diamond, but because the fluorescence of the diamond sample is too strong, it will weaken or even disappear completely. In addition, the five samples showed luminescence peaks at 637 nm and 575 nm, but the relative intensities of the two peaks were different in different color samples: the yellow (R-Y-1, R-Y-2), yellow-green (R-YG-1), and brown samples (R-B-1) had a stronger emission peak at 637 nm than at 575 nm, while the purple-red sample (R-P-1) showed the opposite phenomenon.
The peak at 575 nm corresponds to the (N-V)0 center, and the peak at 637 nm corresponds to the (N-V) center. According to the study of Shi et al. [14], when the temperature of the HTHP treatment is higher than 1960 °C, the aggregate A in the diamond may decompose to produce isolated nitrogen, and isolated nitrogen may combine with a hole to form an uncharged (N-V)0 center. However, the (N-V)0 center is very likely to capture an electron during HTHP treatment to form a negatively charged (N-V) center. According to most studies, the peak strength of HTHP-treated diamonds at 637 nm is stronger than that at 575 nm, mainly because more aggregates of nitrogen are decomposed under HTHP treatment, resulting in a higher concentration of the (N-V) center [26]. The reason for the opposite phenomenon in the purple-red samples needs further experimental investigation. In the photoluminescence spectrum test of diamond samples processed by the US Lotus Colors Diamond Company, Qu and Shen [27] also found that the (N-V)0 center and (N-V) center intensity of purple diamonds did not have an obvious uniform rule, but most of the (N-V) center intensity was stronger. Whether there is an obvious relationship between this phenomenon and color remains to be further confirmed.

3.5. Three-Dimensional Fluorescence Spectroscopy

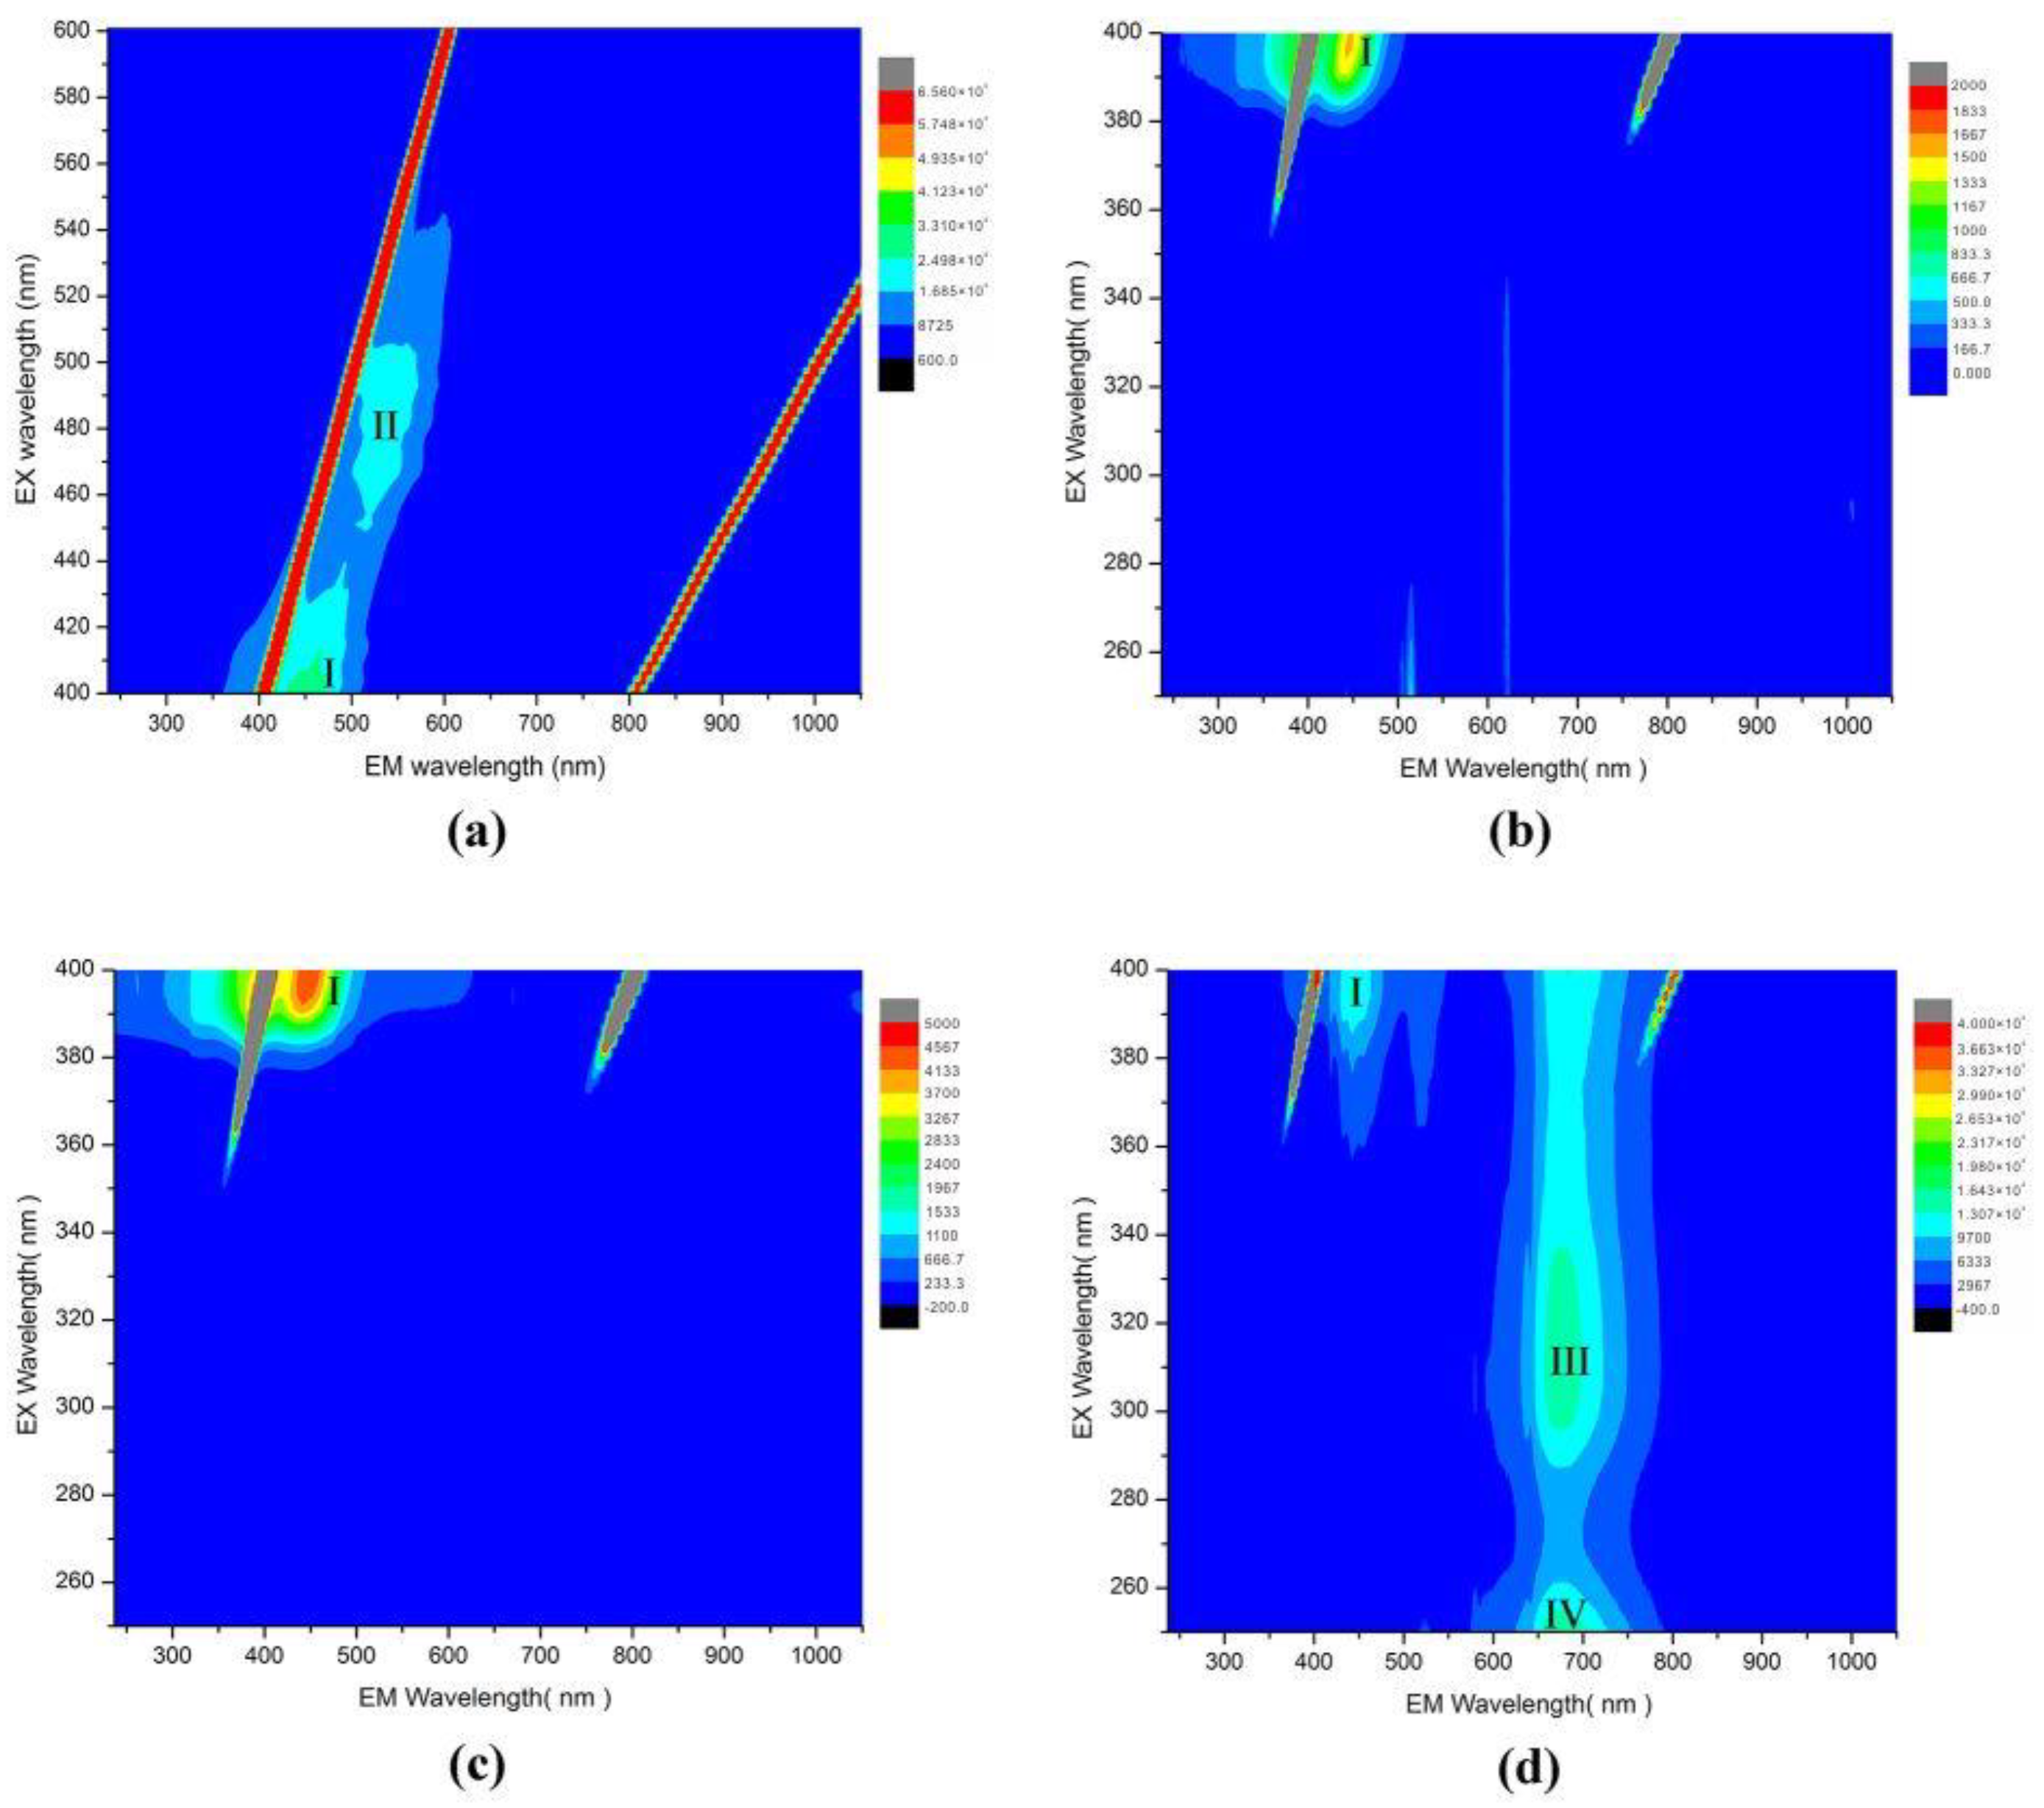
The 3D fluorescence spectra can provide fluorescence intensity information when the excitation wavelength (EX) and emission wavelength (EM) are changed simultaneously. In this paper, the contour fluorescence spectrum is used to analyze the test results of the samples. In order to more comprehensively display the 3D fluorescence characteristics of the samples, according to the excitation wavelength, it was divided into two wavelength ranges of 250–400 nm and 400–600 nm for testing and analysis.
The yellow sample of R-Y-1 showed two fluorescence peaks in the fluorescence spectrum in the excitation wavelength range of 400–600 nm. One of the fluorescence peaks had an emission wavelength peak at 536 nm (excitation wavelength was 481 nm), and it was accompanied by a relatively wide band. The second fluorescence peak was at 457 nm (excitation wavelength was 403 nm) and was accompanied by a band of 365–510 nm (Figure 7a). The two fluorescence peaks of the other yellow sample R-Y-2 showed at 449 nm (EX = 400 nm) and 535 nm (EX = 490 nm). However, the yellow-green sample R-YG-1 had no obvious fluorescence peak in the excitation wavelength range of 400–600 nm and was mainly concentrated in the range of 250–400 nm. The fluorescence peak of this sample was located at 443 nm, accompanied by a wide fluorescence band of 260–500 nm, and the corresponding excitation wavelength was 397 nm (Figure 7b). For the brown sample R-B-1, a more prominent fluorescence peak appeared at 450 nm, accompanied by a band of ~250–625 nm (Figure 7c). The case of the purple-red sample R-P-1 was different from that of the previous four samples. Three fluorescence peaks appeared in the excitation wavelength range of 250–400 nm, which were located at 441 nm (EX = 394 nm), 676 nm (EX = 313 nm), and 665 nm (EX = ~250) (Figure 7d).
Based on the analysis of the data (Table 2), the fluorescence peaks of the 3D fluorescence spectra of HTHP-treated diamonds have the following characteristics.
(1) Samples of different colors have fluorescence peaks in the range of 440–450 nm, which are often accompanied by a broad band ranging from 350 to 500 nm, and the excitation wavelength corresponding to the fluorescence peak is around 400 nm. The brown sample has special characteristics, accompanied by the band extending towards longer wavelengths.
(2) The yellow samples have double fluorescence peaks in the excitation wavelength range of 400–600 nm. In addition to the first characteristic fluorescence peak, there is a second fluorescence peak at 535 nm, and it is accompanied by a 500–600 nm fluorescence band. The corresponding excitation wavelength is around 480 nm. In their research of the luminescence phenomenon caused by optical defects in diamonds, Lou and Breeding [21] pointed out that natural and HTHP-treated yellow-green diamond samples with different saturations show an emission maximum at 520 nm with a wide band extending from ~480 to 650 nm, a feature that manifested itself as a green or yellowish green fluorescence. This emission feature is caused by H3 and has a maximum at 470 nm excitation. And some natural yellow-green samples showed an emission peak centered at 512 nm with a band from ~470 to 630 nm that resulted in a green color from H4 fluorescence. However, this fluorescence peak was not found in the Russian HTHP-treated diamond samples. This may be because the H4 centers are unstable at higher temperatures (greater than 1500 °C) and can be easily decomposed to form H3 centers and isolated nitrogen [14].
(3) The purple-red sample has three fluorescence peaks in the excitation wavelength range of 250–400 nm. In addition to the fluorescence peaks in the range of 440–450 nm, there are two fluorescence peaks at longer wavelengths (in the red wavelength range). According to Lou and Breeding [21], diamond samples affected by the special 480 nm band will present a more complex 3D fluorescence spectrum. It has two main characteristics: (1) a wide band centered at ~653 nm (maximum shifts between 630 and 655 nm), which maximized with a 485 nm excitation wavelength; (2) a ~539 nm band that increased with 420, 345, and 285 nm excitation energies. The combination of both bands ranged from ~500 to 700 nm and produced yellow to orange fluorescence when excited by visible light (near-LWUV) [21]. In this paper, the fluorescence characteristics and ultraviolet fluorescence phenomenon of the purple-red sample are similar, and it is speculated that the fluorescence characteristics of the purple-red sample may be related to the 480 nm band.

4. Conclusions

Through testing and research on HTHP-treated IaAB-type diamonds, the luminescence and fluorescence spectra characteristics can be summarized as follows: Under DiamondViewTM and cathode rays, the yellow samples mainly showed a combination of blue and green luminescence, while the brown and purple samples showed a luminescence of orange with different intensities; the luminous patterns could mainly be divided into three types: regular annular bands, multiple groups of intersecting linear stripes, and jagged stripes. In the PL spectra of the yellow, yellow-green, and brown samples, the peaks at 637 nm were stronger than 575 nm, but the opposite phenomenon appeared in the purple-red sample. The 3D fluorescence spectra showed that the fluorescence peaks in the range of 440–450 nm in samples with different colors were accompanied by a wide band ranging from 350 to 500 nm, and in the brown sample, the band extended to the longer wavelength. The second fluorescence peaks at 535 nm appeared in the yellow samples, and in the purple-red sample, there were two peaks of fluorescence at longer wavelengths, which provided a more intuitive detection method for the rapid and non-destructive identification of HTHP-treated diamonds.

Author Contributions

Conceptualization, M.-L.H. and X.-M.H.; methodology, and M.-L.H.; software, M.-Y.D.; validation, M.-L.H., P.-F.J. and X.-F.W.; formal analysis, M.-L.H.; investigation, M.-L.H., P.-F.J. and X.-F.W.; resources, X.-M.H.; data curation, X.-M.H.; writing—original draft preparation, M.-L.H.; writing—review and editing, M.-L.H., X.-M.H., M.-Y.D., P.-F.J. and X.-F.W.; supervision, X.-M.H.; funding acquisition, X.-M.H. All authors have read and agreed to the published version of the manuscript.

Funding

This work has been supported by the project of “Geology of mineral resources in China” from China Geological Survey (Grant Nos. DD20160346, DD20190379).

Institutional Review Board Statement

Not applicable.

Informed Consent Statement

Not applicable.

Data Availability Statement

The original contributions presented in the study are included in the article, further inquiries can be directed to the corresponding author.

Acknowledgments

We are grateful to the editors and anonymous reviewers whose comments improved the quality of the manuscript.

Conflicts of Interest

Author Mu-Lin Huang was employed by the company Beijing Education Technology Co., Ltd. The remaining authors declare that the research was conducted in the absence of any commercial or financial relationships that could be construed as a potential conflict of interest.

References

  1. Schmetzer, K. Clues to the process used by generalelectric to enthance the GE Pol diamonds. Gems Gemmol. 1999, 35, 186–190. [Google Scholar] [CrossRef]
  2. Song, Z.H.; Lu, T.J.; Tang, S.; Gao, B.; Su, J.; Ke, J. Discrimination of HTHP-treated Type Ia Cape Diamonds Using Optical and Photoluminescence Spectroscopic Techniques. Rock Miner. Anal. 2020, 39, 85–91. [Google Scholar]
  3. Hainschwang, T. HTHP treatment of different classes of type I brown diamond. J. Gemmol. 2005, 29, 261–273. [Google Scholar] [CrossRef]
  4. Bai, Q. Study of Color enhancement experiment processed on synthetic diamonds and its characteristics. China Univ. Geosci. 2019, 25, 1–5. [Google Scholar]
  5. Fisher, D.; Spits, R.A. Spectroscopic evidence of GE pol HTHP-treated natural type Iia diamonds. Gems Gemmol. 2000, 36, 186–190. [Google Scholar]
  6. Reinitz, I.M.; Buerki, P.R.; Shigley, J.E. Identification of HTHP-treated yellow to green diamonds. Gems Gemmol. 2000, 36, 128–137. [Google Scholar] [CrossRef]
  7. Shen, C.Q. Application of High Temperature with Superhigh Pressure Method to Treatment of Jewelry and Jade. China Gems Jades 2004, 4, 39–41. [Google Scholar]
  8. Karl, S. High pressure high temperature treatment of diamonds—A review of the patent literature from five decades (1960–2009). J. Gemmol. 2010, 32, 52–53. [Google Scholar]
  9. Wang, Y.M.; He, B.; Zhao, Z.H. Diamond; China University of Geosciences Press: Wuhan, China, 1997. [Google Scholar]
  10. Qi, L.J.; Yuan, X.Q.; Tian, L.G.; Yuan, Z.Z. Evolution and Colouration of Lattice Defects in Diamonds at High Pressure and High Temperature. J. Gems Gemmol. 2001, 3, 1–7. [Google Scholar]
  11. Mai, X.; Chen, M.H.; Chen, Z. HTHP Treatment Technology of Diamond. J. Gems Gemmol. 2004, 4, 22–24. [Google Scholar]
  12. Collins, A.T.; Kanda, H.; Kitawaki, H. Colour changes produced in natural brown diamonds by high-pressure, high-temperature treatment. Diam. Relat. Mater. 2000, 9, 113–122. [Google Scholar] [CrossRef]
  13. Collins, A.T. The colour of diamond and how it may be changed. J. Gemmol. 2001, 27, 341–359. [Google Scholar] [CrossRef]
  14. Shi, K.; Chen, M.H.; Wang, B.; Wang, H. Structural defects and color change mechanism of HTHP-treated diamond. Superhard Mater. Eng. 2010, 22, 43–45. [Google Scholar]
  15. Shigley, J.E. Diamonds: High-Pressure-High-Temperature Treatment of Gem Diamonds. Elements 2005, 1, 101–104. [Google Scholar] [CrossRef]
  16. Wang, J.X.; Chen, M.H.; Wang, L.S. Characteristics of HTHP-Treated Diamonds from Russia. J. Gems Gemmol. 2010, 12, 5–8+4. [Google Scholar]
  17. Wang, W.Y.; Smith, C.P.; Hall, M.S.; Breeding, C.M.; Moses, T.M. Treated-color pink-to-red diamonds from Lucent Diamonds Inc. Gems Gemol. 2005, 41, 6–19. [Google Scholar] [CrossRef]
  18. Shan, X.M. Comparison of Color Modification Experiment and Characteristics of HTHP Synthetic Yellow Diamonds; University of Geosciences: Beijing, China, 2020. [Google Scholar]
  19. Luo, Y.A. The Application of Cathodoluminescence Technology in Gemology—A Case Study of Emerald and Diamond; China University of Geosciences: Wuhan, China, 2002. [Google Scholar]
  20. Jia, Q.; Chen, M.H. Luminescen22ce Characteristics and Fluorescence Spectrum of HTHP-Treated and Irradiated Diamond. J. Gems Gemmol. 2018, 20, 1–8. [Google Scholar]
  21. Lou, Y.; Breeding, M.C. Fluorescence Produced by Optical Defects in Diamond: Measurement, Characterization, and Challenges. Gems Gemol. 2013, 49, 82–97. [Google Scholar]
  22. Bulanova, G.P.; Milledge, H.J. Origin and History of Growth of Macro-Diamonds from Yakutian Kimberlites. In 6th International Kimberlite Conference: Extended Abstract; Siberian Branch of Russian Academy of Science: Novosibirsk, Russia, 1995. [Google Scholar]
  23. Chen, M.H.; Lu, F.X.; Di, J.R.; Zheng, J.P. Cathode Luminescence and Infrared Spectrum Analysis of Diamond in Wafangdian, Liaoning. Sci. Bull. 2000, 45, 1424–1428. [Google Scholar] [CrossRef]
  24. Chen, M.H.; Lu, F.X.; Zheng, J.P. Cathodoluminescence Features of Diamond in Fuxian Liaoning Provence and Their Implications. Earth Sci. J. China Univ. Geosci. 1999, 24, 71–74. [Google Scholar]
  25. Yang, Z.J.; Peng, M.S.; Xie, D.X.; Yuan, Z.Z. Mico-Area Analysis of Diamond by Micro-Infrared Spectrometry and Its Significance. Rock Miner. Anal. 2002, 21, 161–165. [Google Scholar]
  26. Dobrinets, I.A.; Vins, V.G.; Zaitsev, A.M. HTHP-Treated Diamonds: Diamonds Forever; Springer: Berlin/Heidelberg, Germany, 2013. [Google Scholar]
  27. Qu, M.W.; Shen, X.T. Spectroscopic Characteristic of Orange Red to Purple Colour-Treated Diamond from Lotus Colors, Inc. U.S.A. J. Gems Gemmol. 2019, 21, 17–23. [Google Scholar]
Figure 1. HTHP-treated diamond samples examined in this study.
Applsci 14 03071 g001
Figure 2. Black hexagonal sheet inclusions in sample R-P-1 (a), colorless crystal inclusions in sample R-YG-1 (b), and disc-shaped stress cracks in sample R-Y-1 (c). Under orthogonal polarized light, the sample showed more obvious parallel bands (d) or corrugated abnormal extinction (e), accompanied by strong strain interference color (f).
Applsci 14 03071 g002
Figure 3. Fluorescence images of samples under DiamondViewTM.
Applsci 14 03071 g003
Figure 4. Under the cathode ray, three groups of serrated and fine linear texture could be observed in sample R-Y-1 (a). The “growth nucleus” in sample R-Y-2 was cut off from the outer fine growth rings (b). Uniform luminescence pattern of regular quadrilateral in sample R-B-1 (c). Sample R-P-1 regular layered growth bands (d).
Applsci 14 03071 g004
Figure 5. Micro-infrared absorption spectra of samples.
Applsci 14 03071 g005
Figure 6. PL spectra of diamond samples.
Applsci 14 03071 g006
Figure 7. The contour fluorescence spectra of the diamond samples. Sample R-Y-1 shows two fluorescence peaks (Ⅰ, Ⅱ) in the excitation wavelength range of 400–600 nm (a); the fluorescence peak of sample R-YG-1 is located at 443 nm (Ⅰ) (b); the brown sample R-B-1 shows a more prominent fluorescence peak at 450 nm (Ⅰ) (c); the purple-red sample R-P-1 shows three fluorescence peaks (Ⅰ, Ⅲ, Ⅳ) appearing in the excitation wavelength range of 250–400 nm (d).
Applsci 14 03071 g007
Table 1. The ultraviolet fluorescence characteristics of the samples.
SampleColorLWUV (Long-Wave Ultraviolet Light: 315–400 nm)SWUV (Short-Wave Ultraviolet Light: 200–280 nm)
R-YG-1Yellow-greenStrong yellow-greenMedium yellow-green
R-Y-1YellowWeak greenWeak orange
R-Y-2YellowMedium yellow-greenStrong yellow-green
R-B-1Brown--
R-P-1Purple-redMedium orangeMedium orange-red
Table 2. The 3D fluorescence peak distribution of samples.
SamplesEM (nm)EX (nm)Accompanied Band
R-Y-1536481500–590
457403365–510
R-Y-2535490475–610
449around 400390–480
R-YG-1443397260–505
R-B-1450around 400~250–625
R-P-1441394365–545
676313595–785
665around 250575–790
Disclaimer/Publisher’s Note: The statements, opinions and data contained in all publications are solely those of the individual author(s) and contributor(s) and not of MDPI and/or the editor(s). MDPI and/or the editor(s) disclaim responsibility for any injury to people or property resulting from any ideas, methods, instructions or products referred to in the content.

