
Dynamic Response of the Tunnel Lining with a Circumferential Crack Subjected to a Harmonic Point Load


Abstract
1. Introduction
2. Methodology
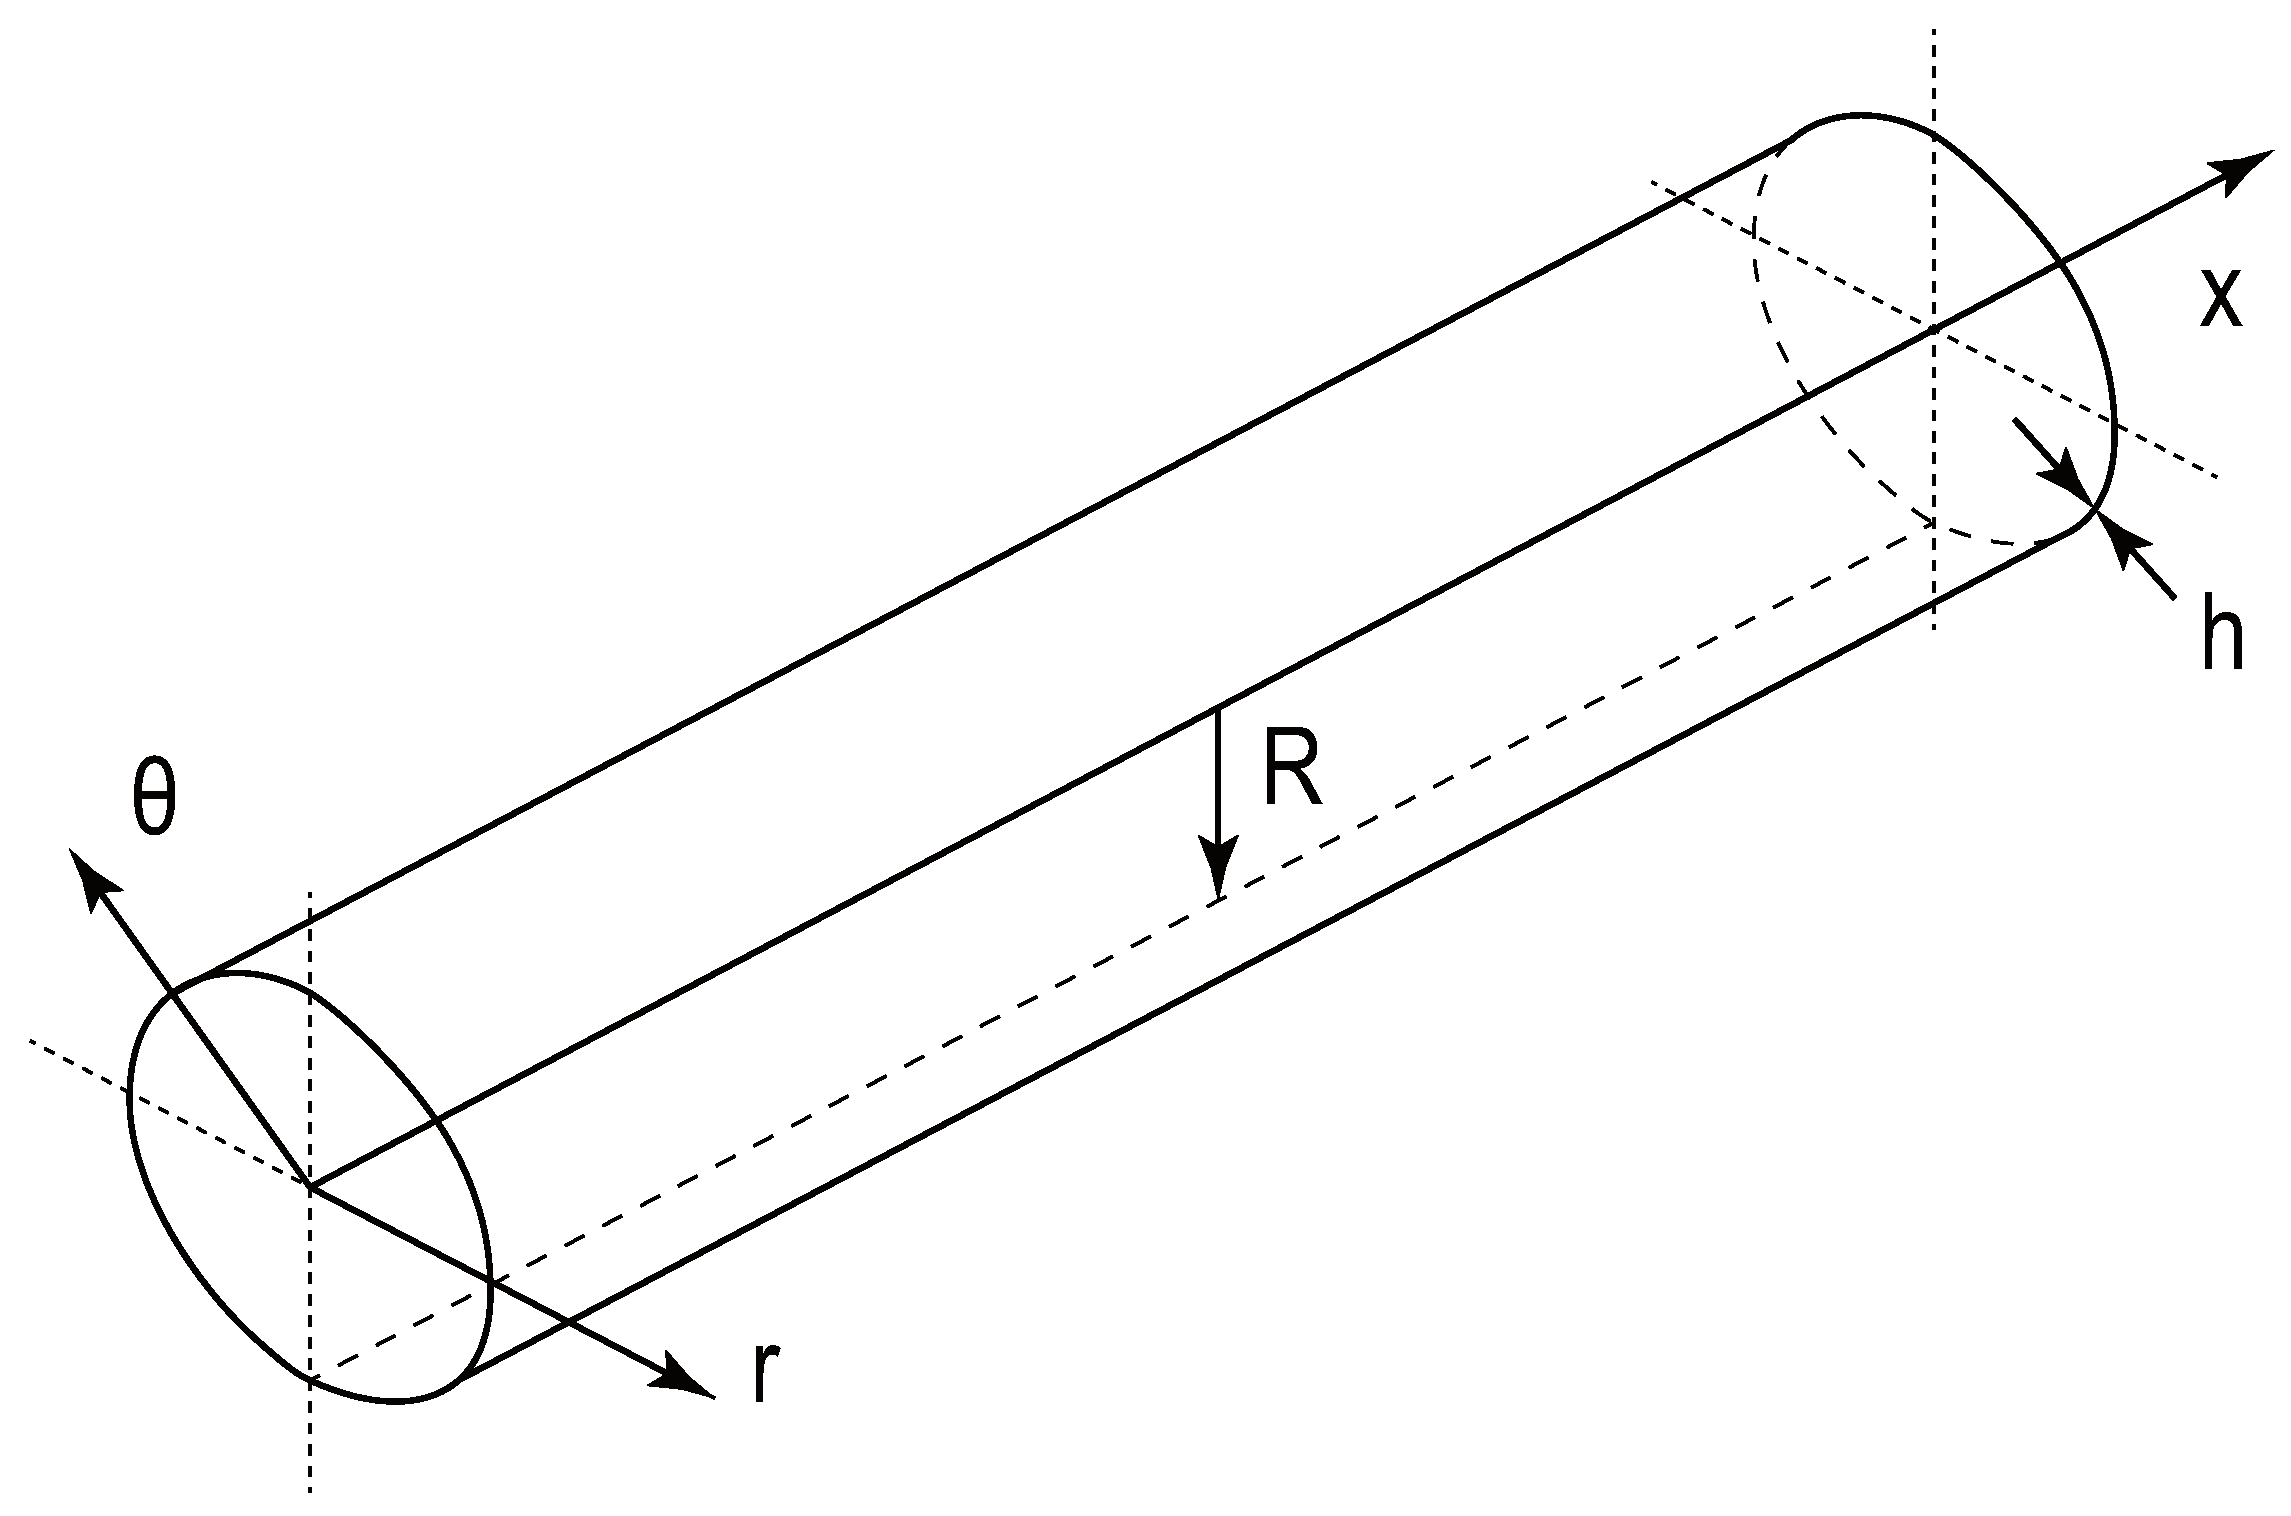
2.1. Dynamic Model for Free Vibration
2.2. Dynamic Model for Forced Vibration
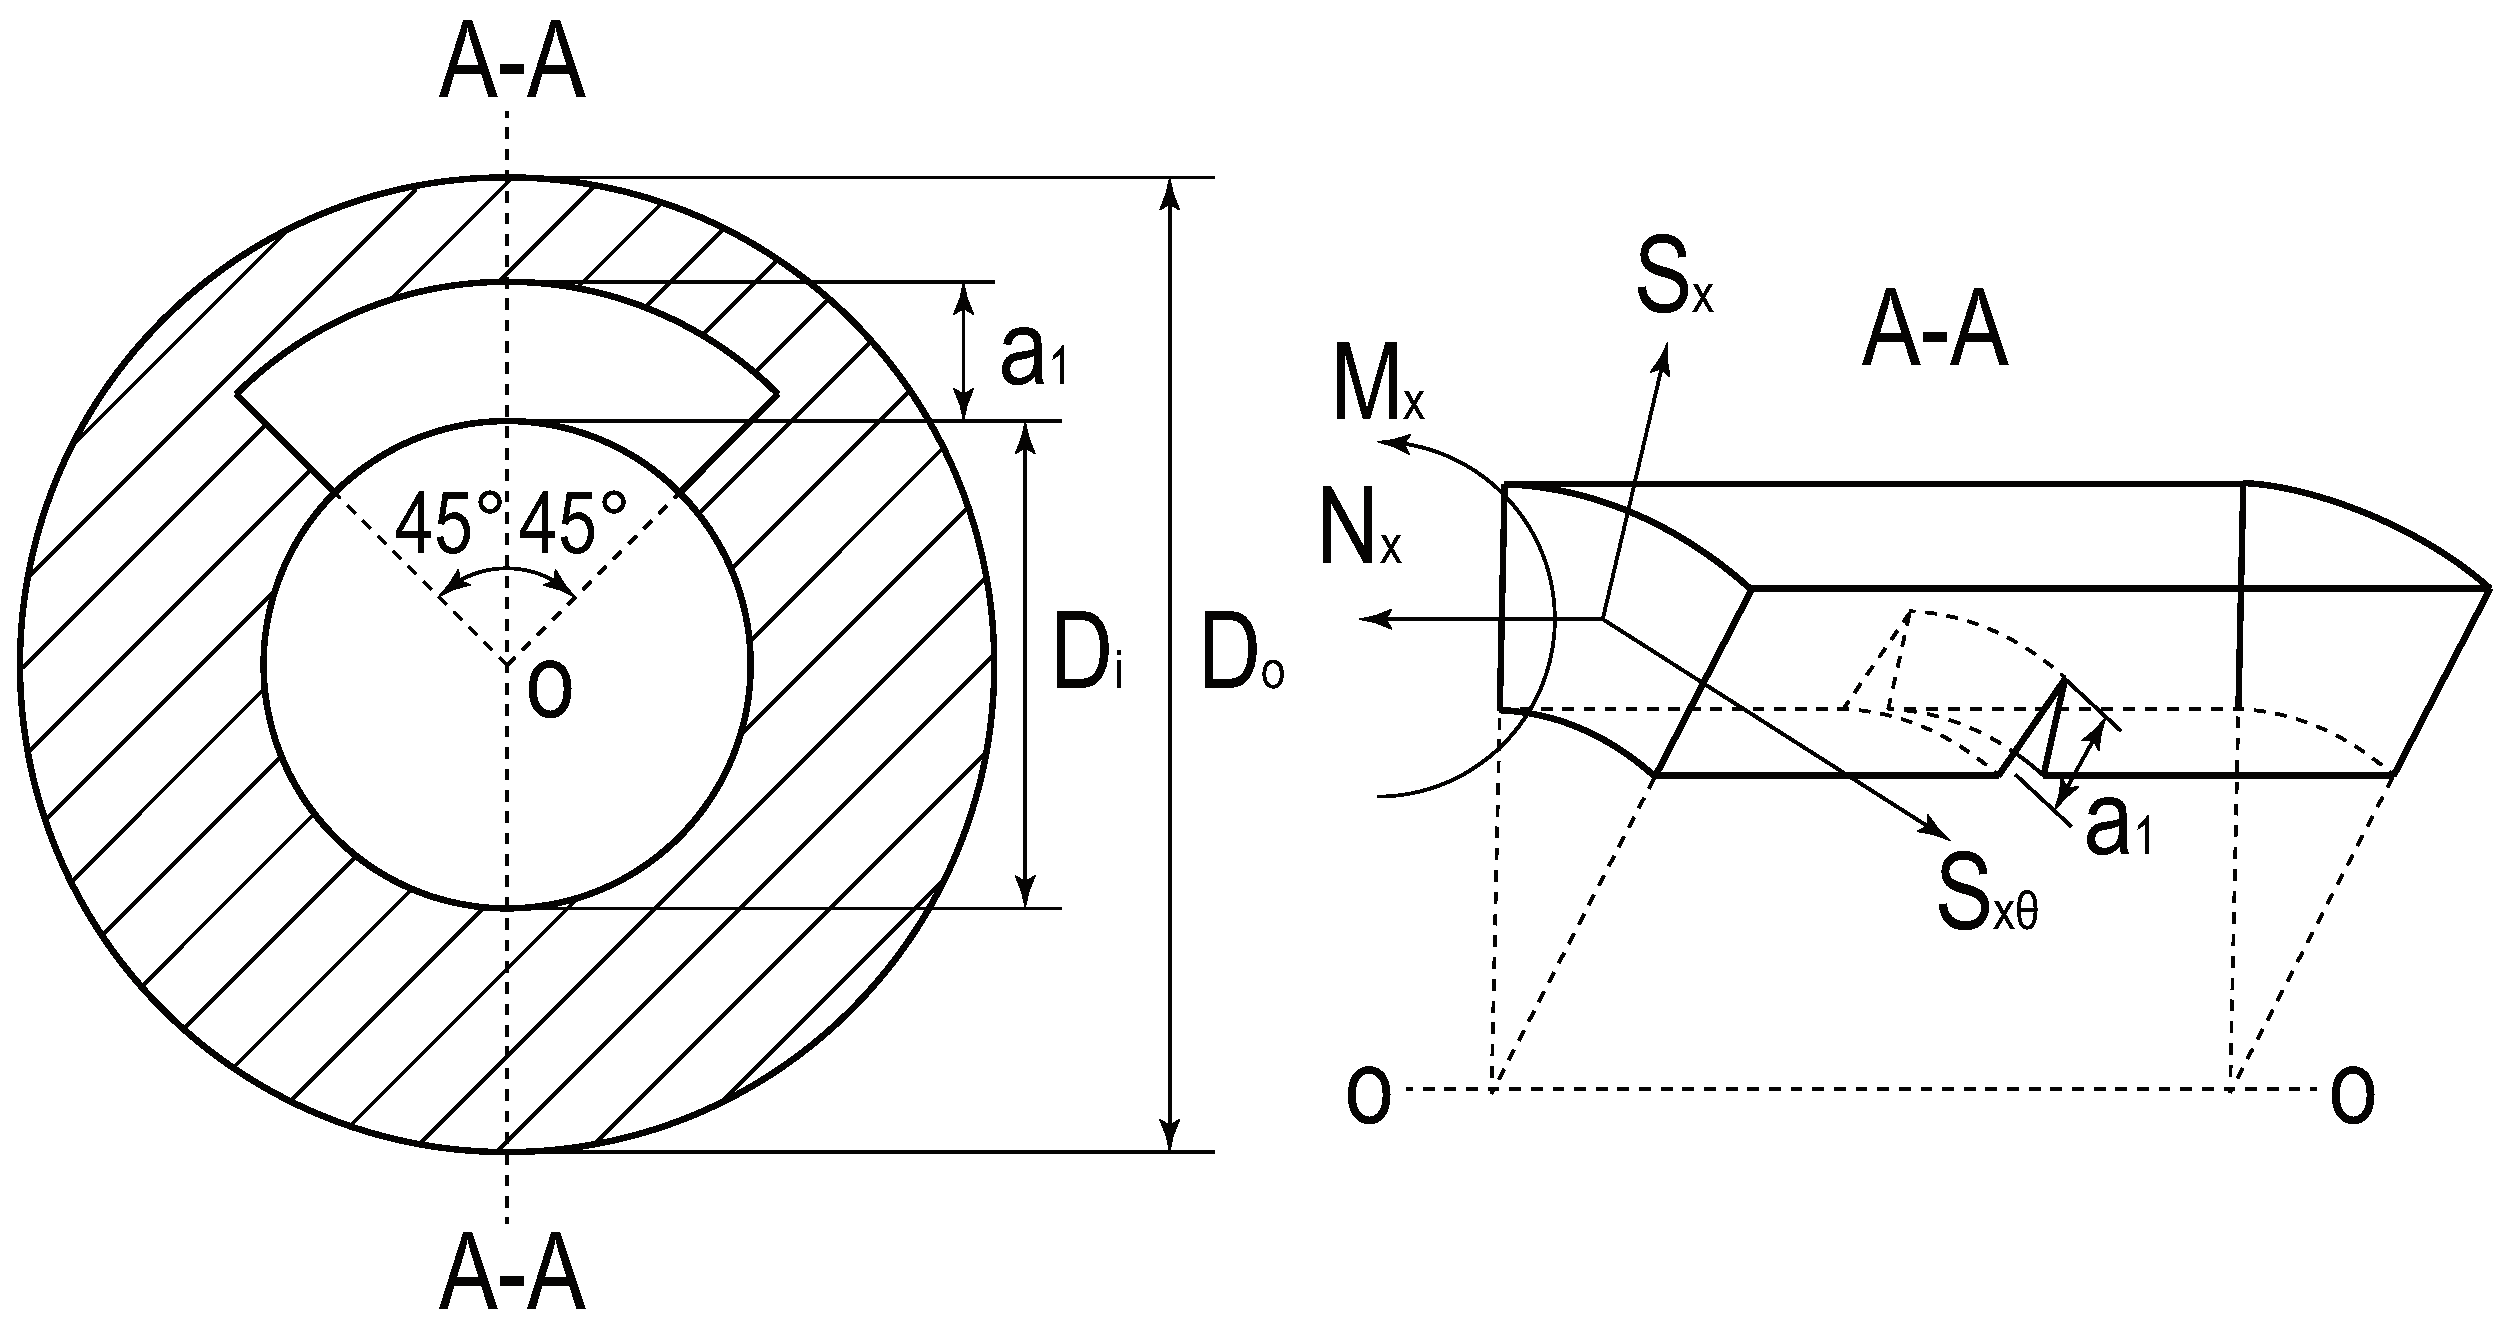
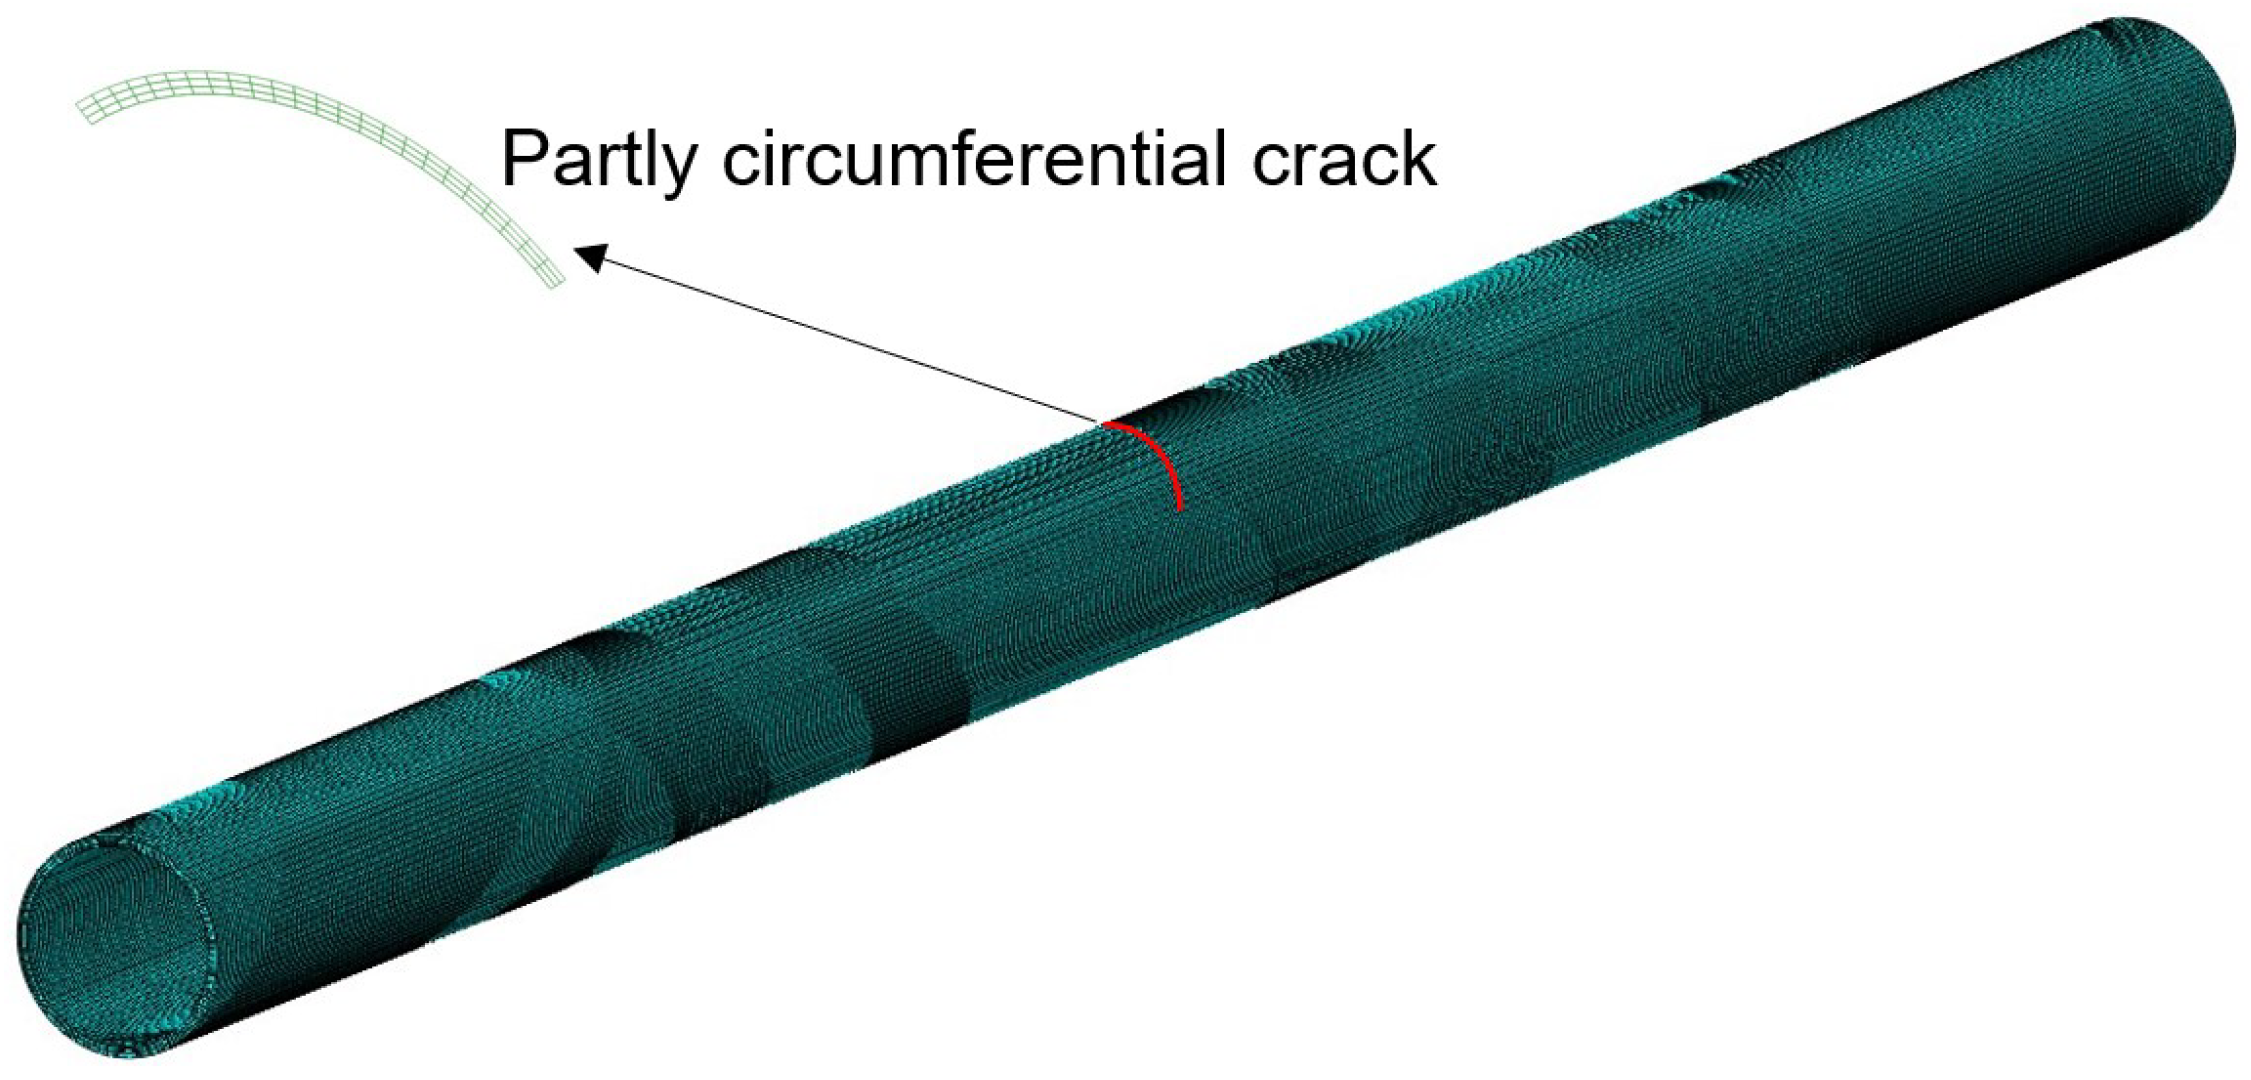
2.3. Crack Simulation
2.4. Displacement Response of a Circumferential Crack
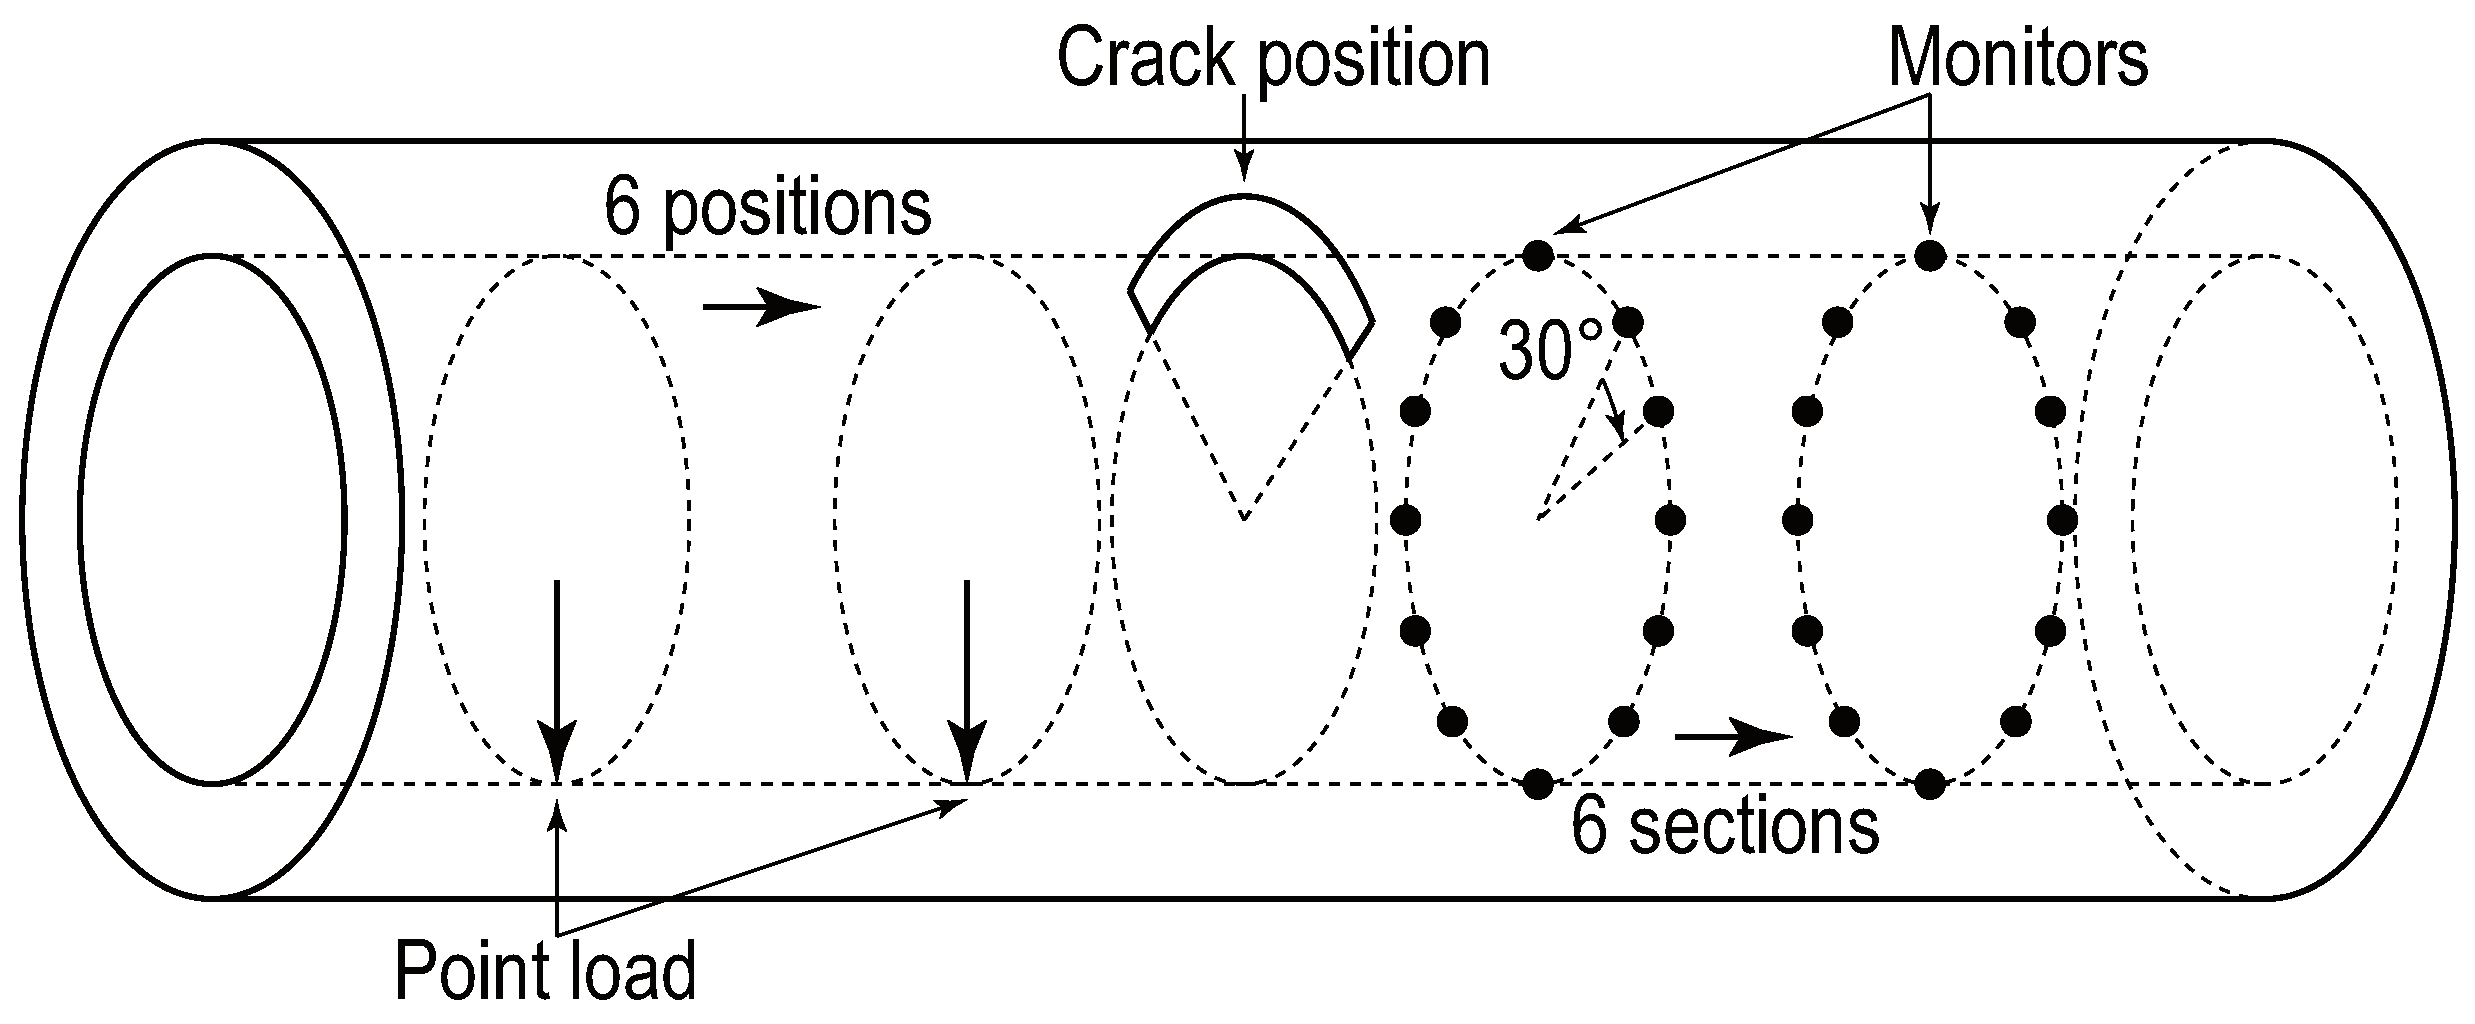
2.5. Load and Monitor Location
3. Model Validation
4. Results and Discussion
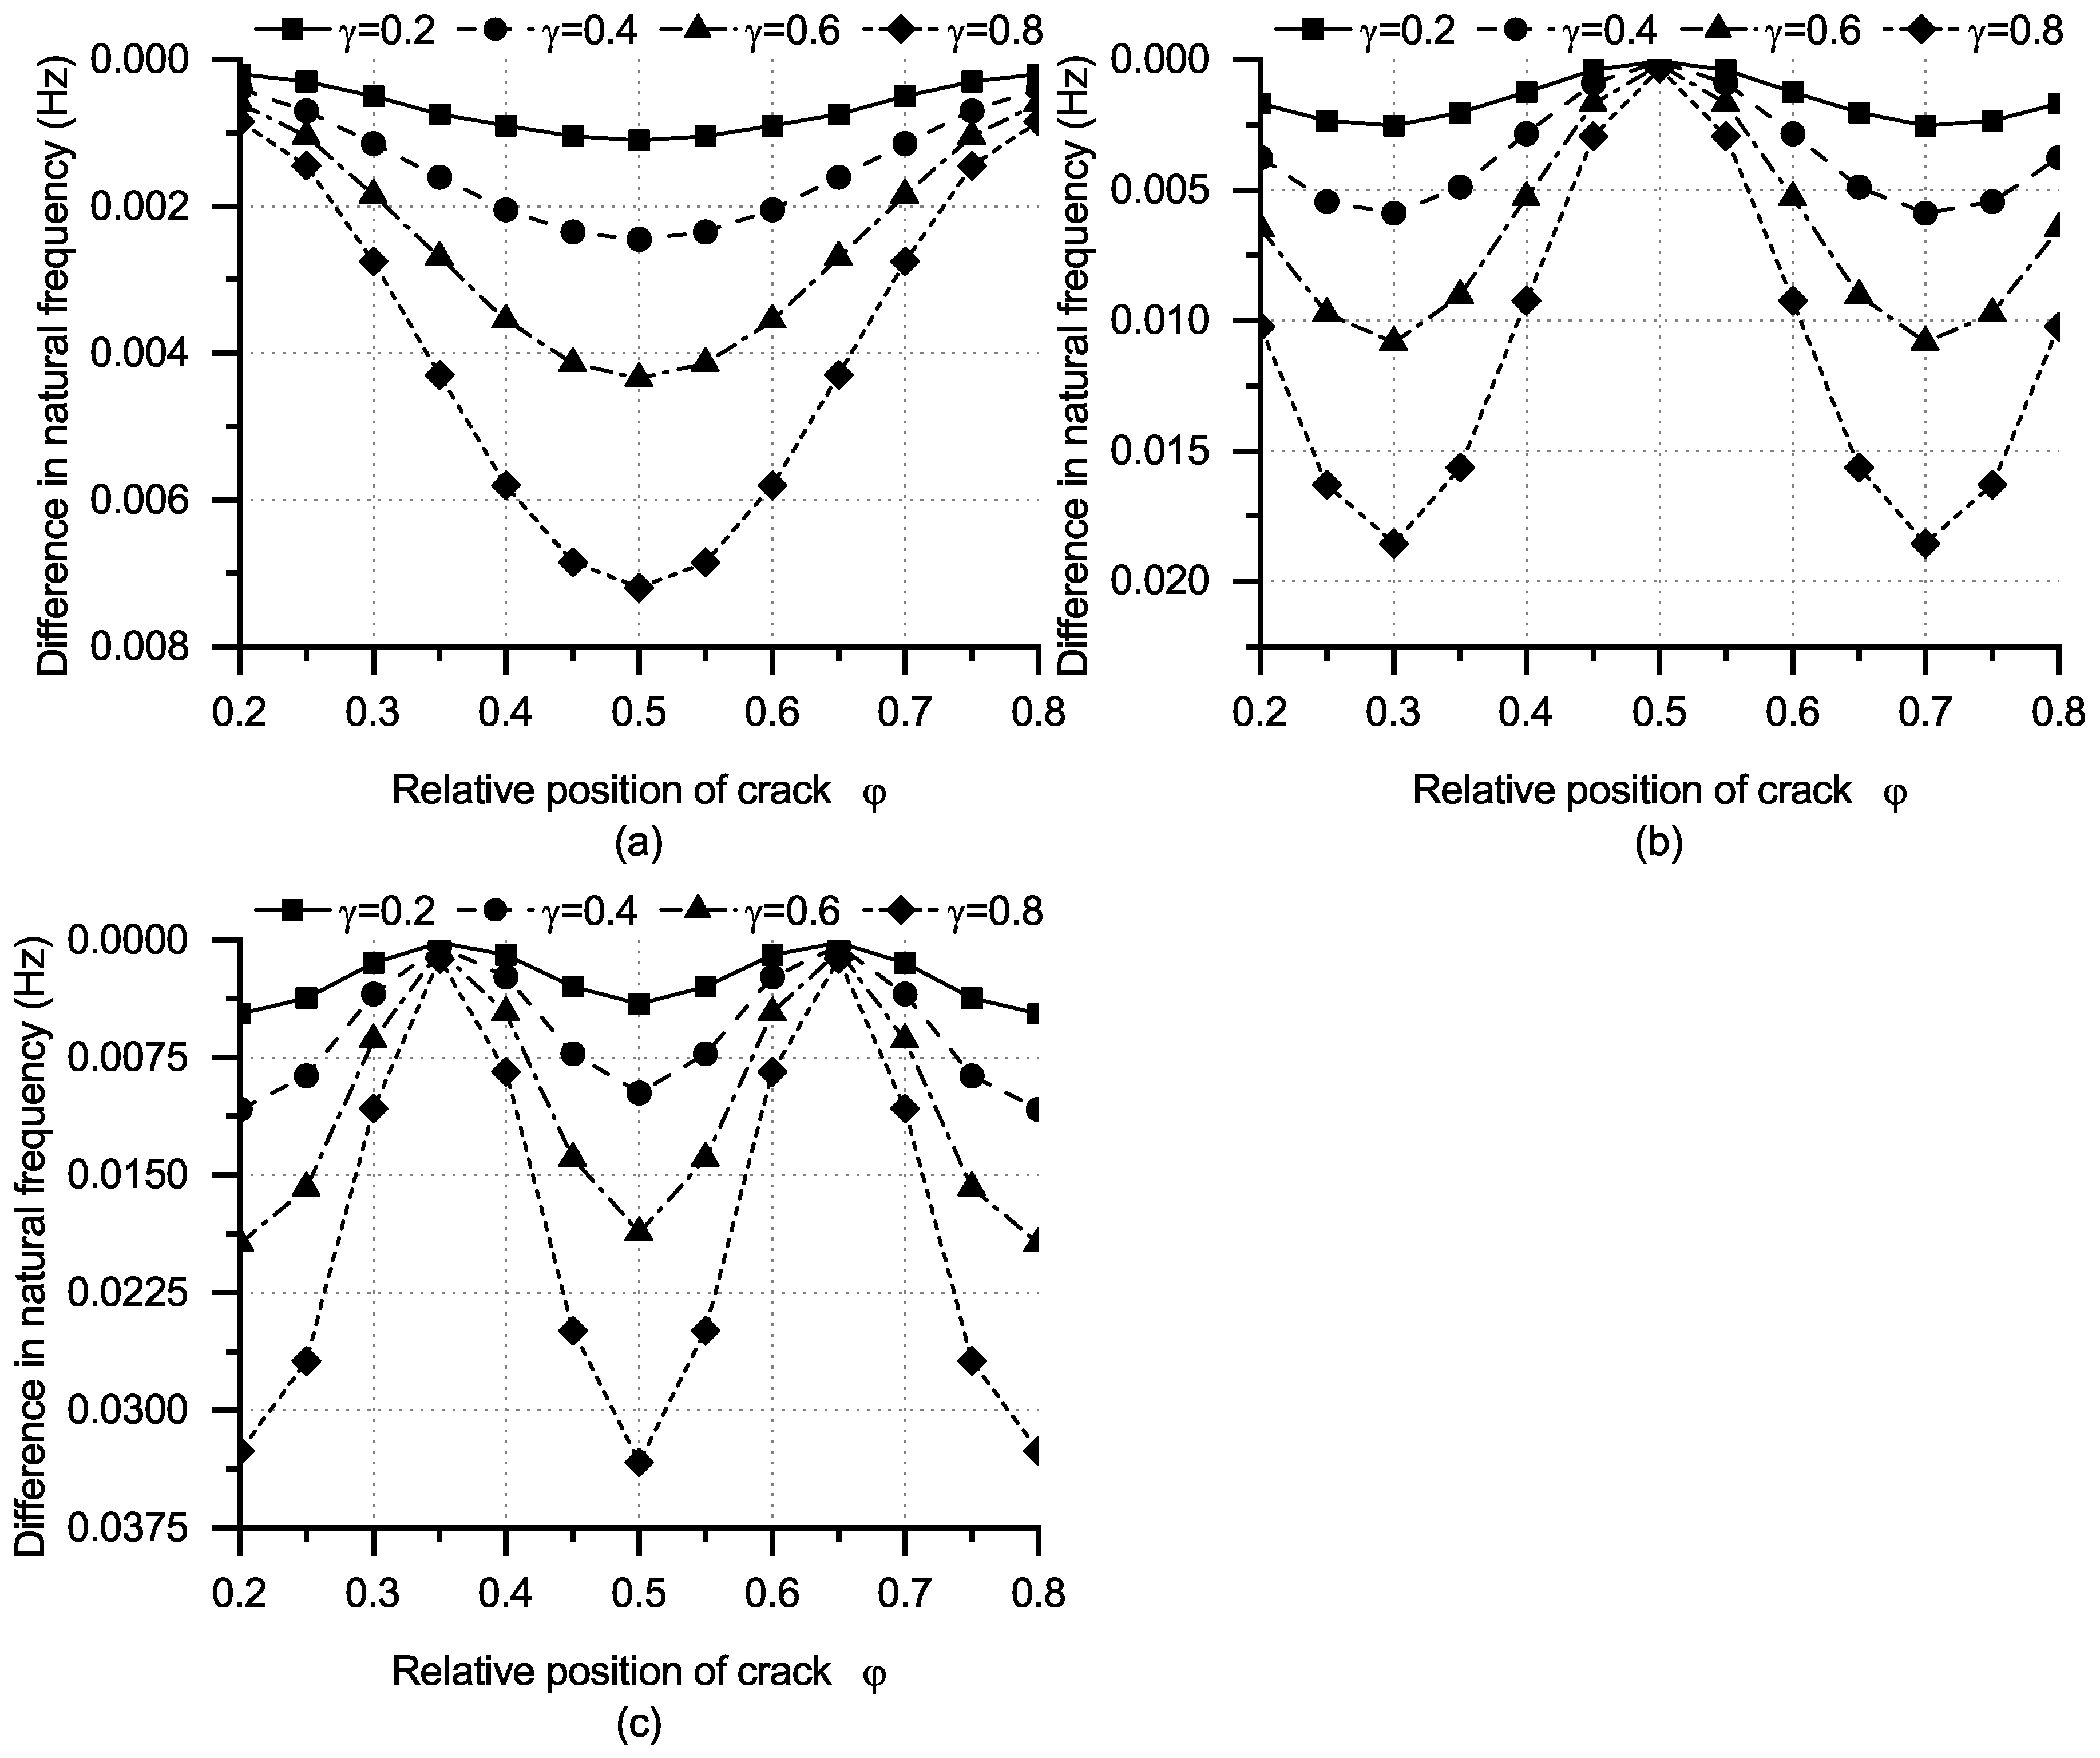
4.1. Natural Frequency Characteristics
4.2. Forced Vibration with Different Monitoring Positions
4.3. Forced Vibration under Different Load Positions
5. Conclusions
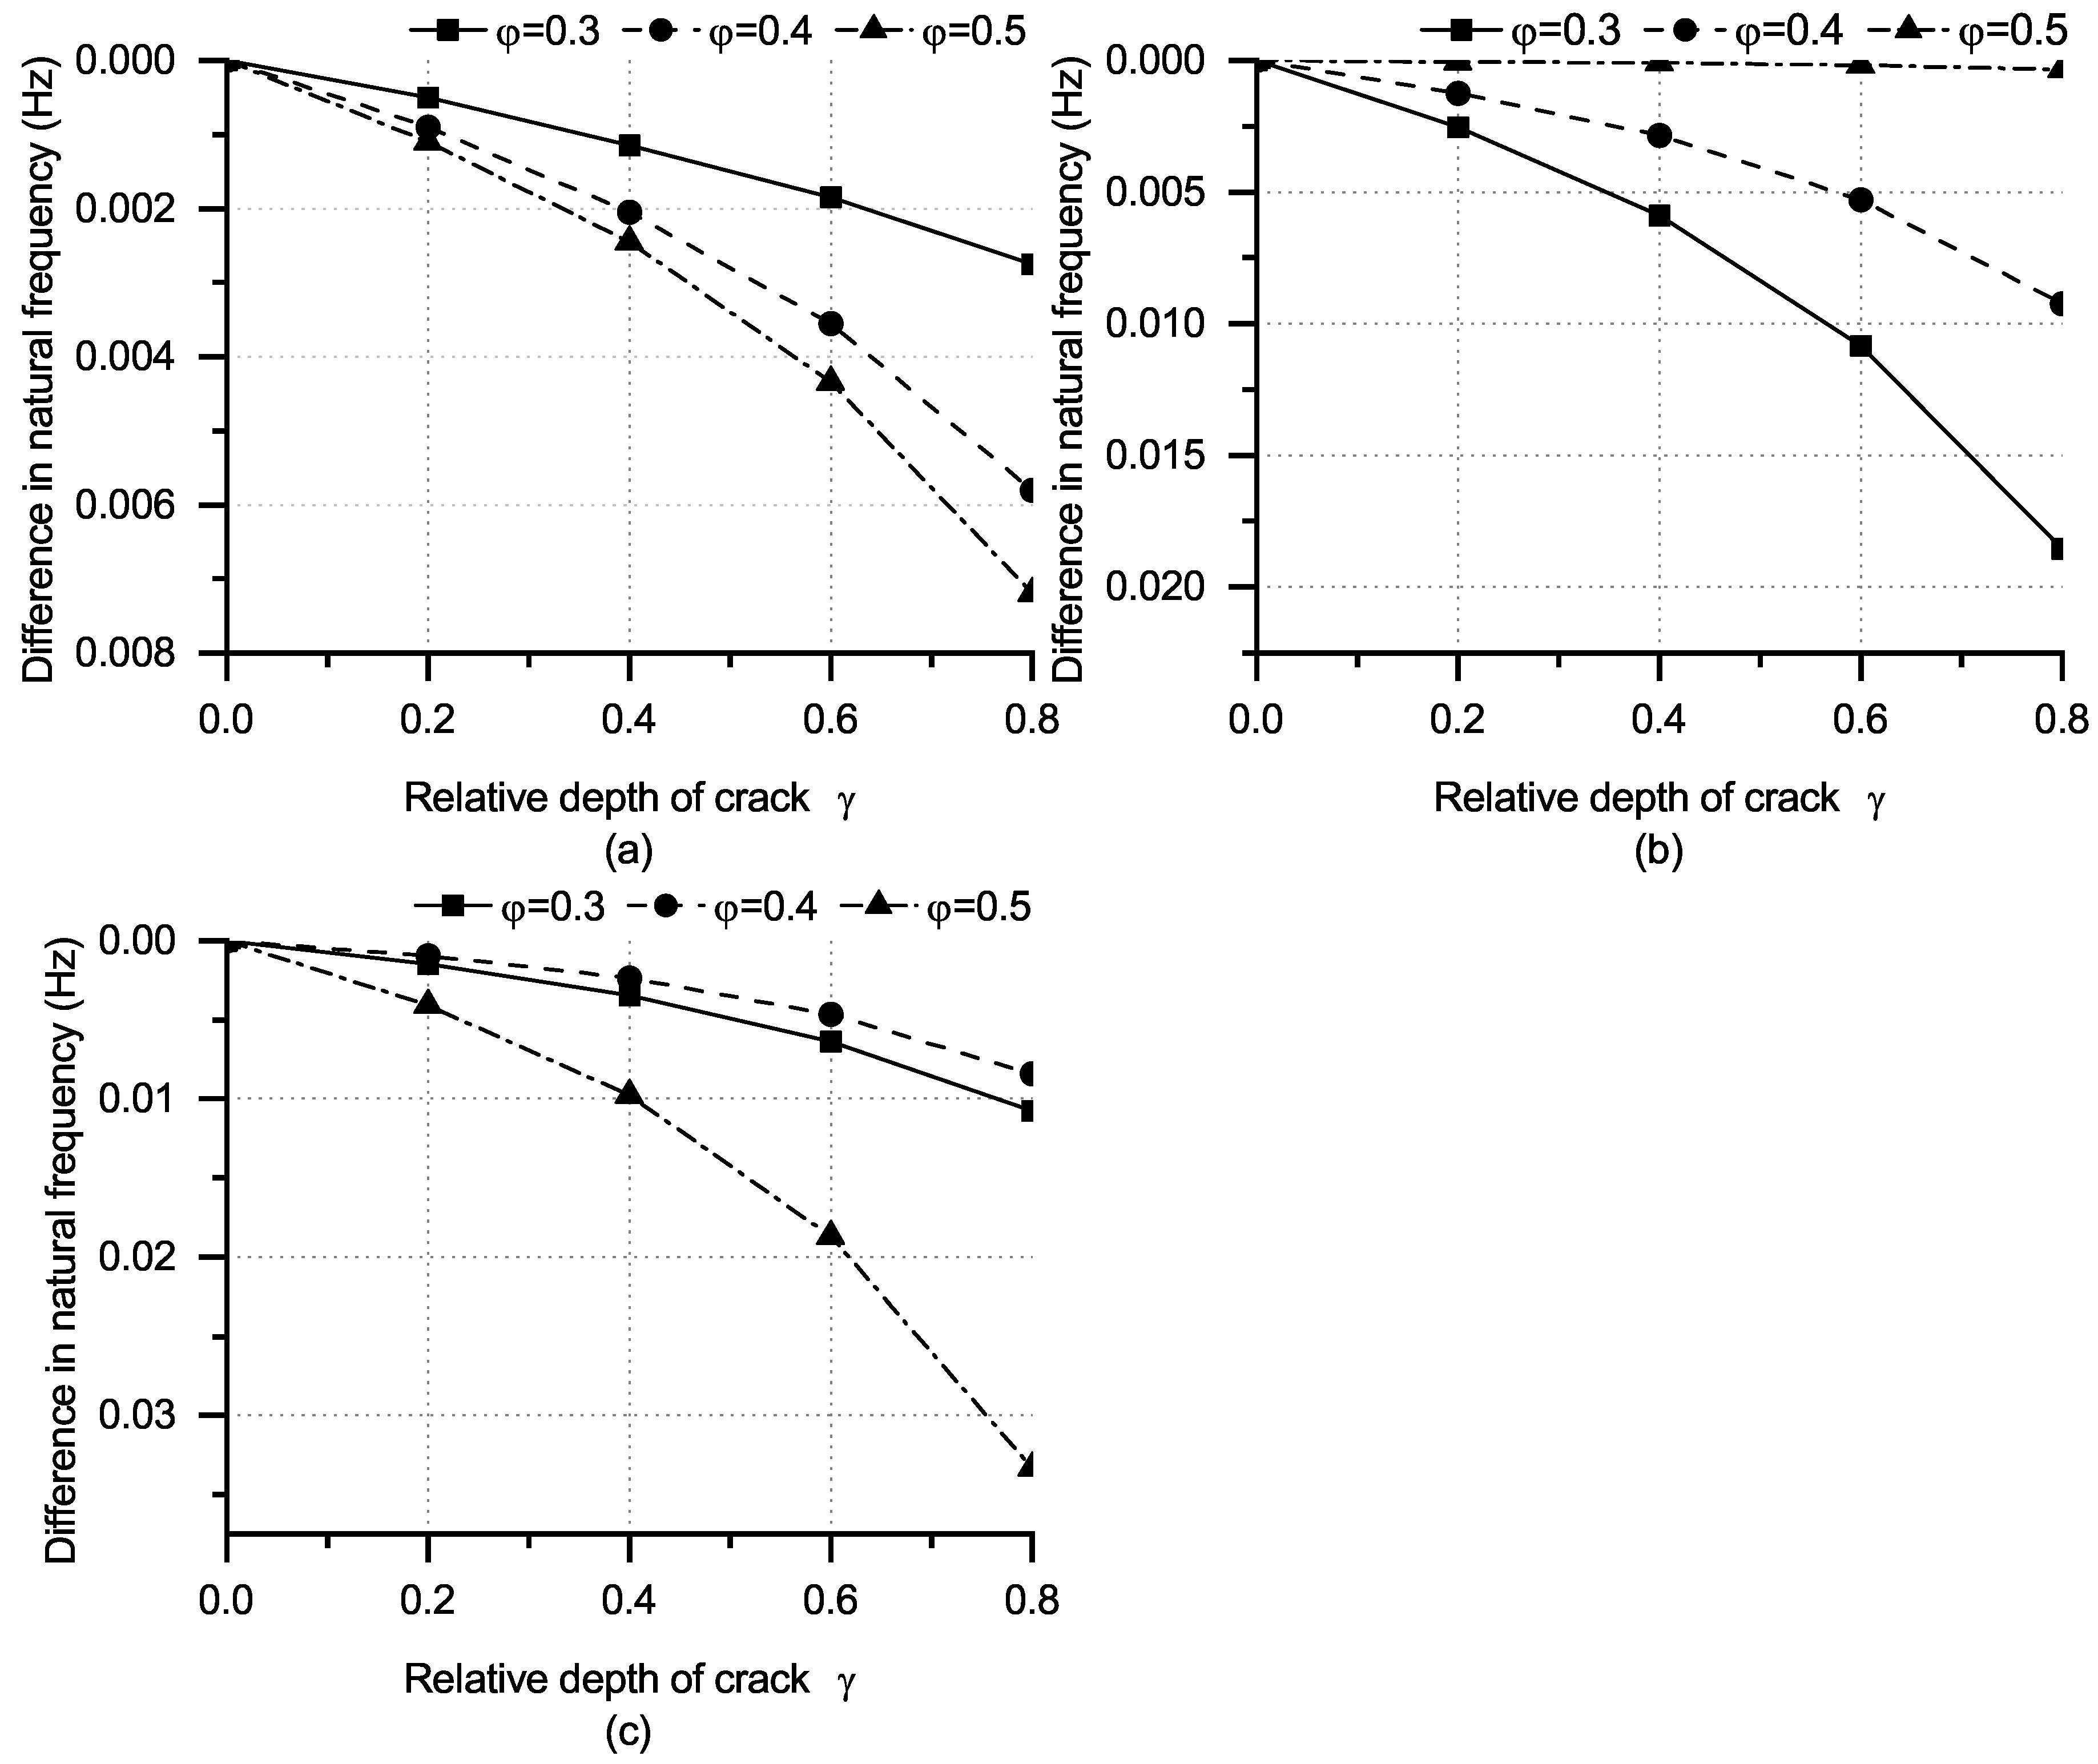
- The partly circumferential crack reduces the natural frequency of the shield tunnel lining because it causes local flexibility in the lining. Moreover, the rise in crack depth accelerates the decrease in natural frequency. Meanwhile, when the partly circumferential crack is positioned at a modal node, the crack minimally impacts the natural frequency of this mode. In contrast, when the crack is located in the middle of two nodes, the natural frequency of this mode undergoes the most significant variation. Therefore, the partly circumferential crack intensifies the fluctuation of natural frequency changes in high-order modes. This finding can aid in identifying the axial location of the crack and evaluating its depth;
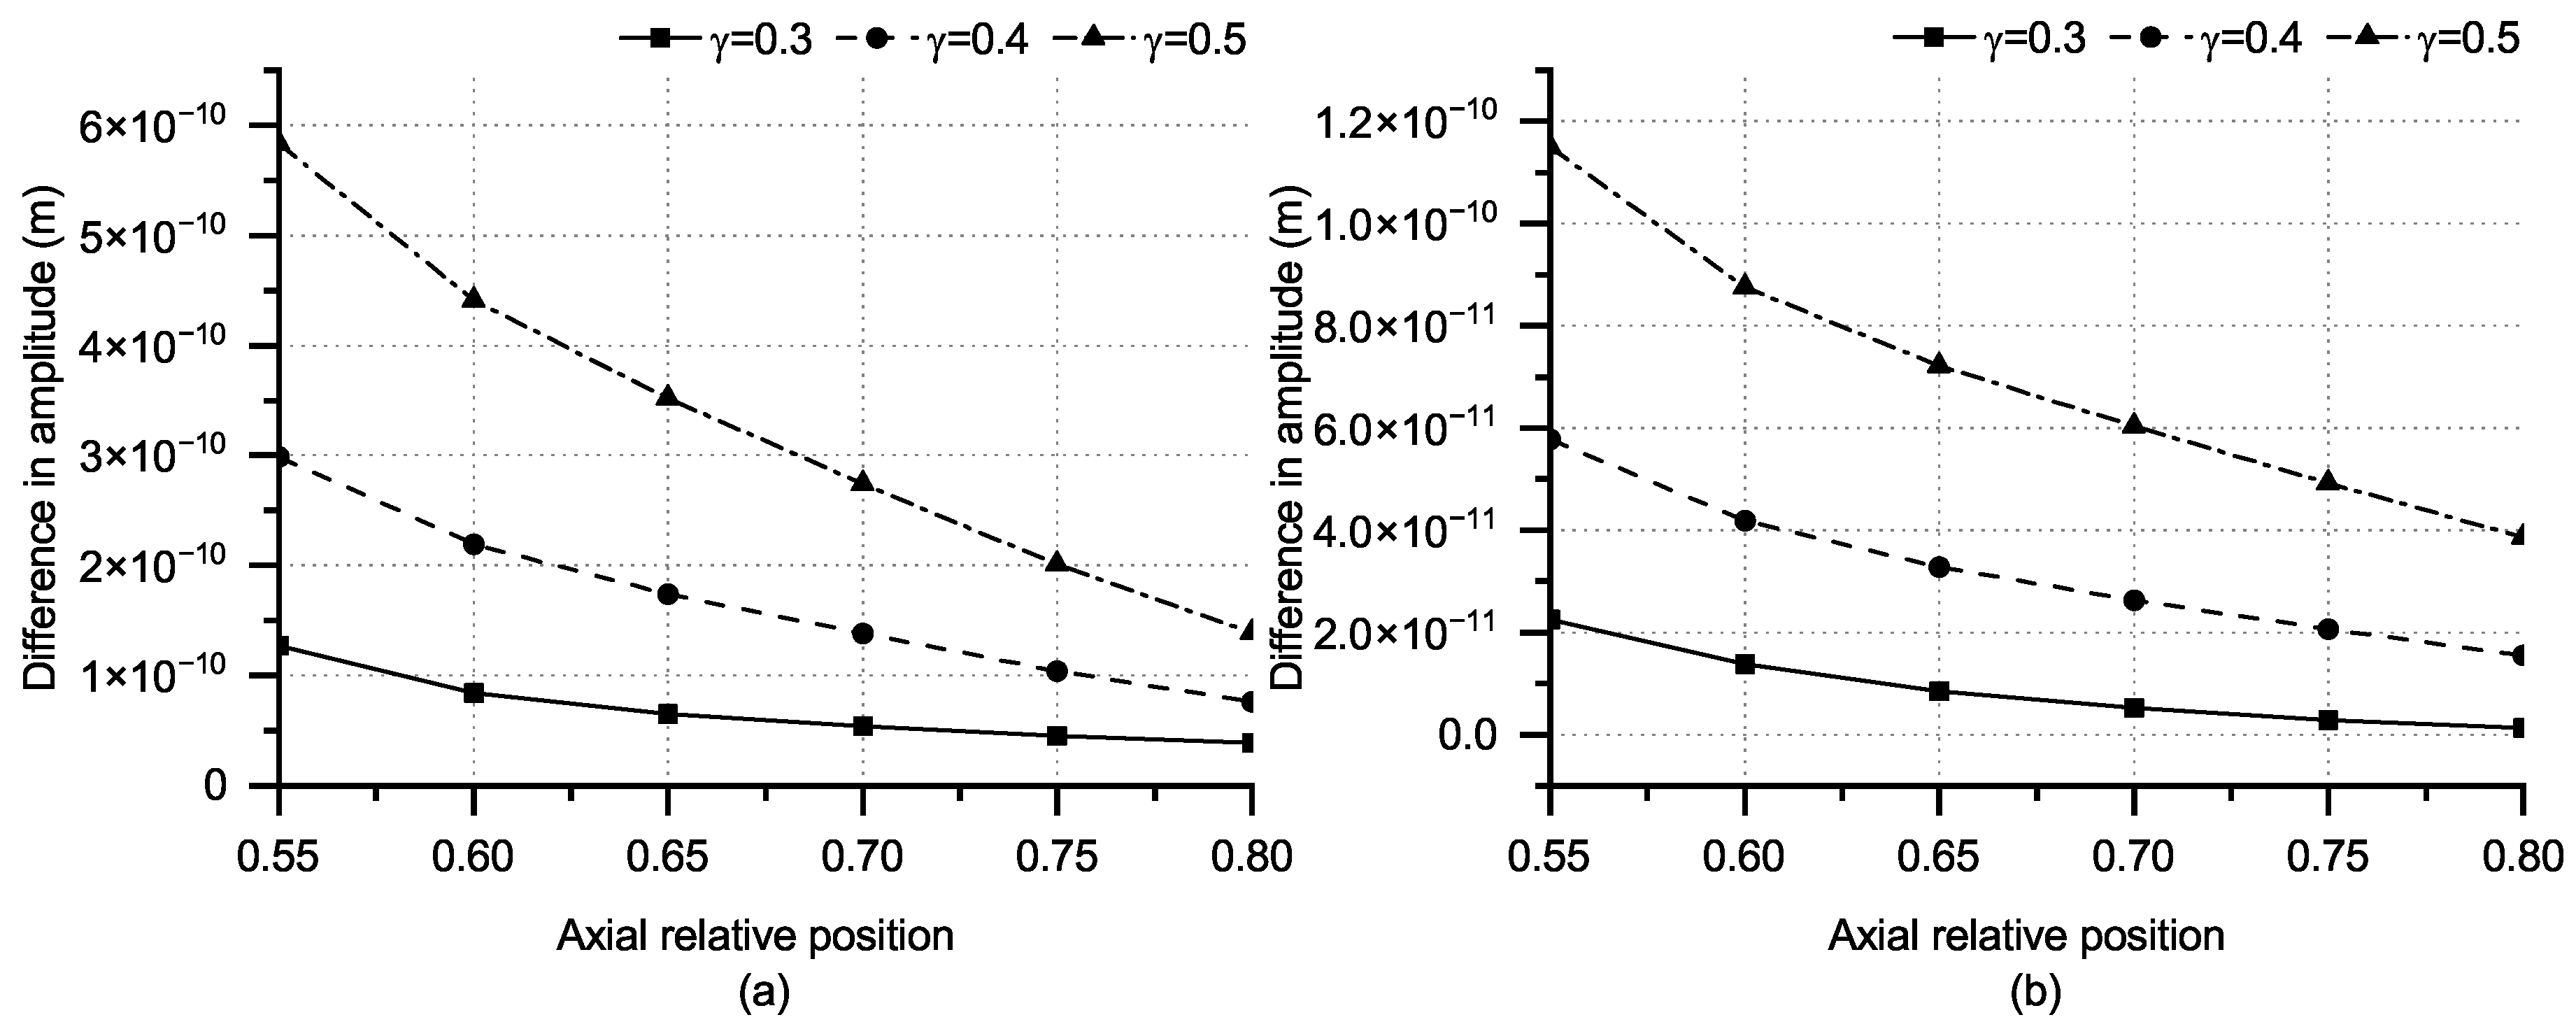
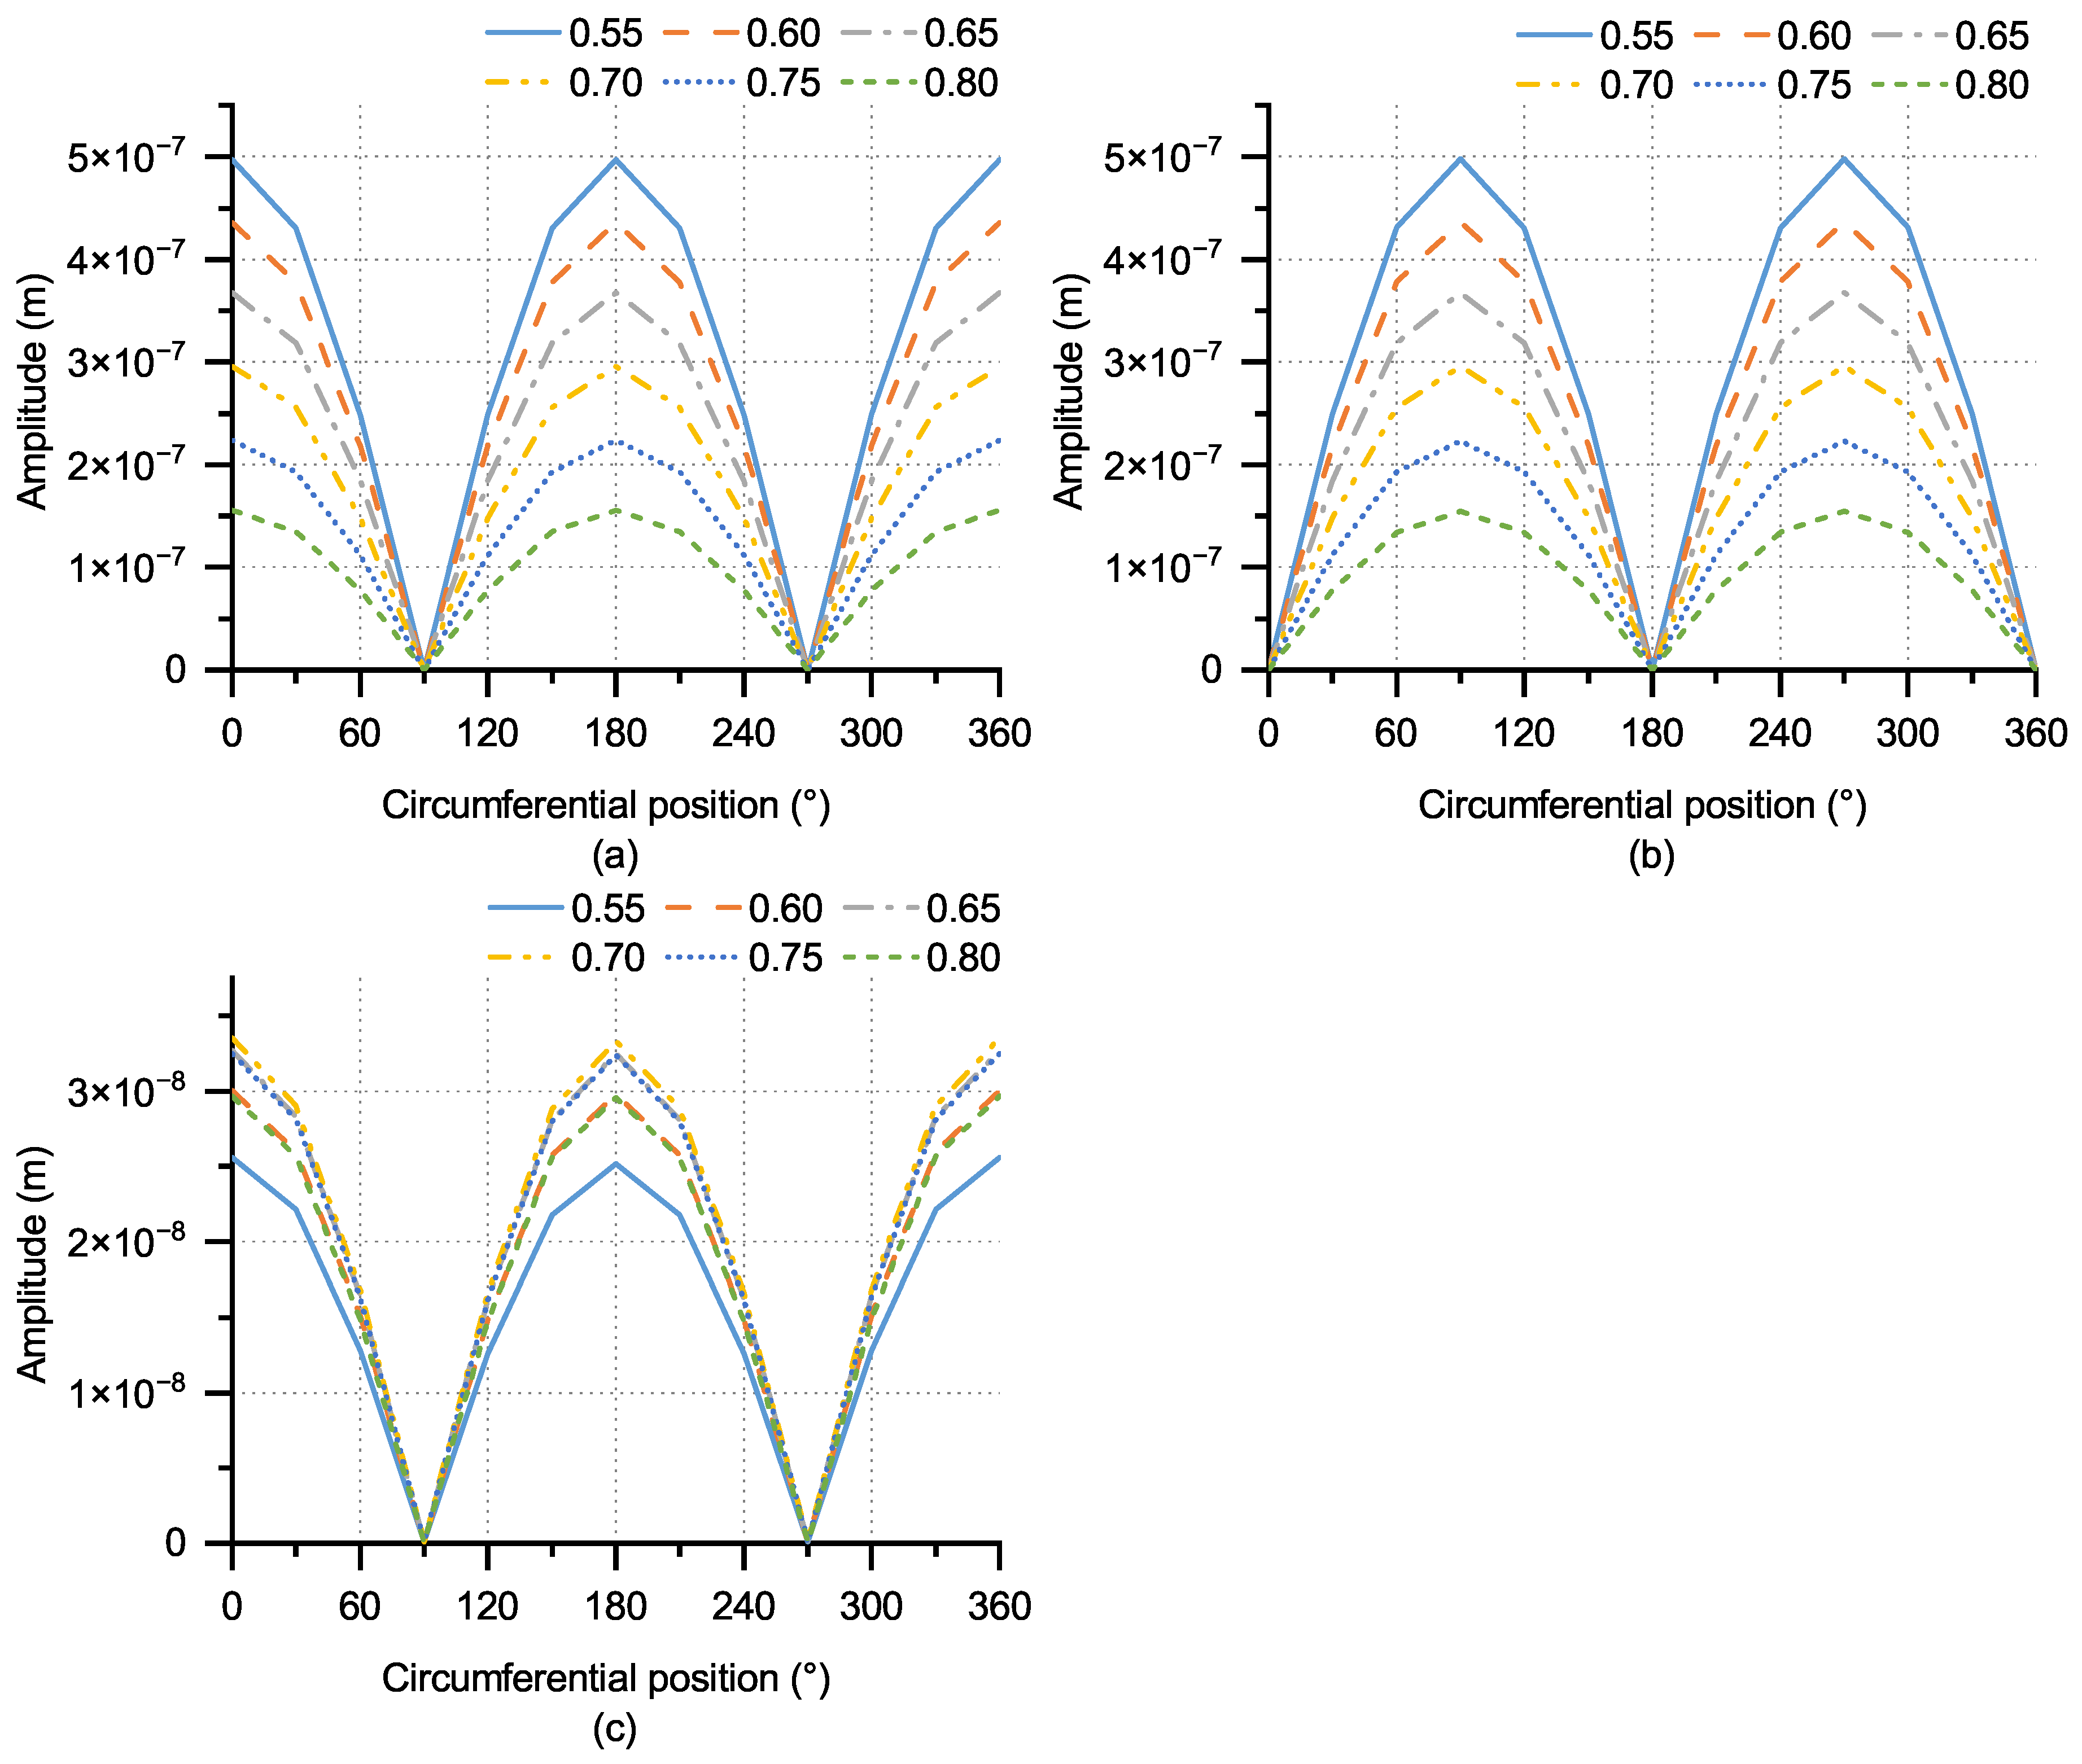
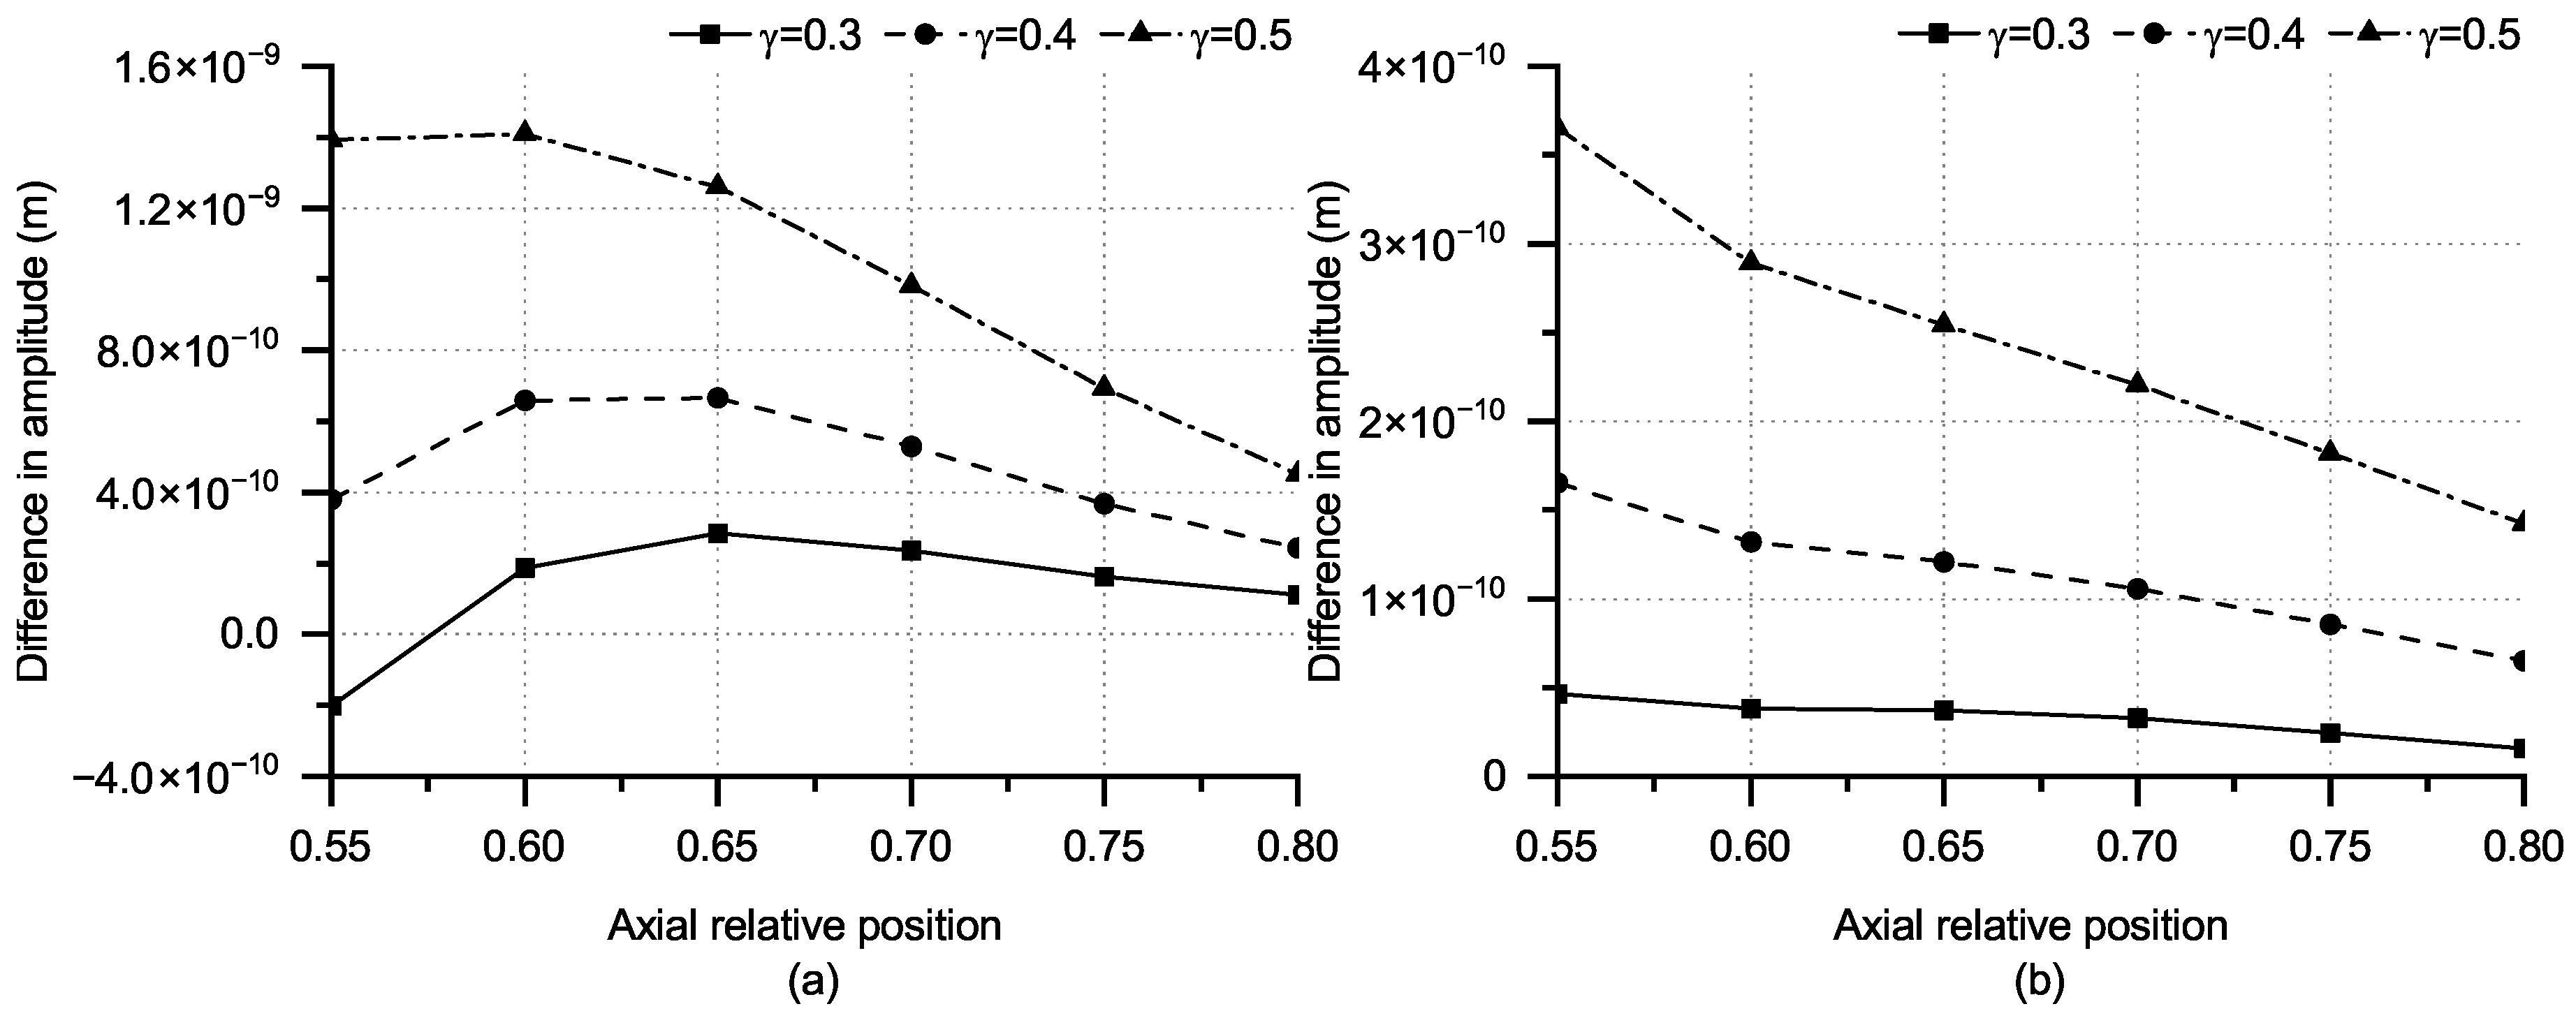
- The monitoring point at circumferentially experiences the highest amplitudes of displacement response in both radial and axial directions under a time-harmonic normal point load. Hence, the displacement response in both directions can be used to analyze a partly circumferential crack at the circumferential position. The radial and axial amplitude differences show a downward trend on the other side of the crack as the distance from the monitoring point to the partly circumferential crack increases. In the meantime, the difference in radial displacement amplitudes exceeds that of axial displacement amplitudes. Furthermore, as the crack deepens, the scope in displacement amplitude difference increases. The variation in displacement response occurs in the region affected by the partly circumferential crack. Consequently, the alteration in radial and axial displacement amplitudes helps identify the crack’s circumferential position, and the radial displacement is more effective than the axial one;
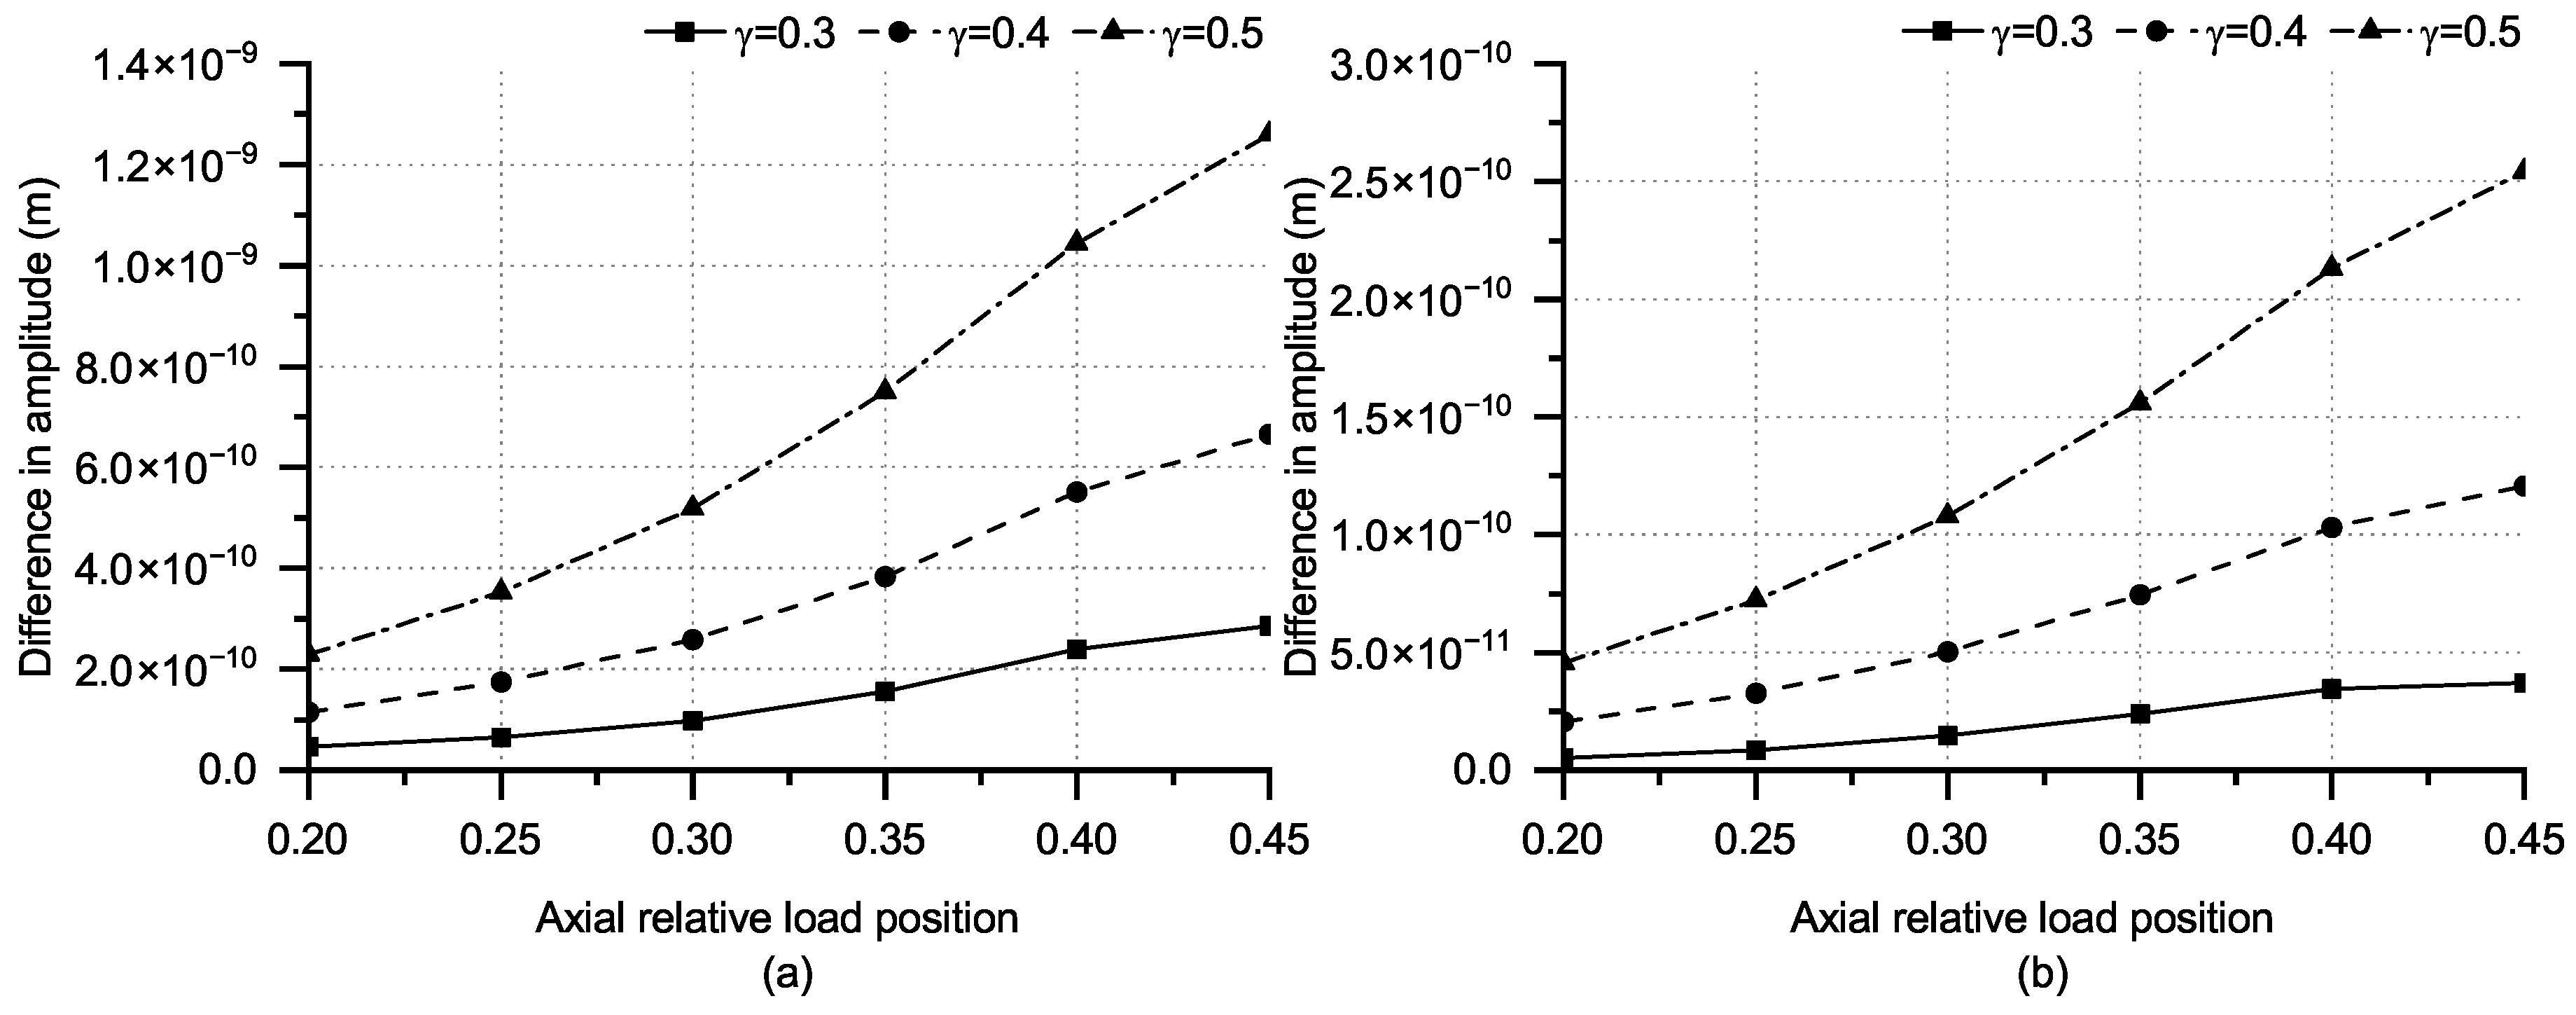
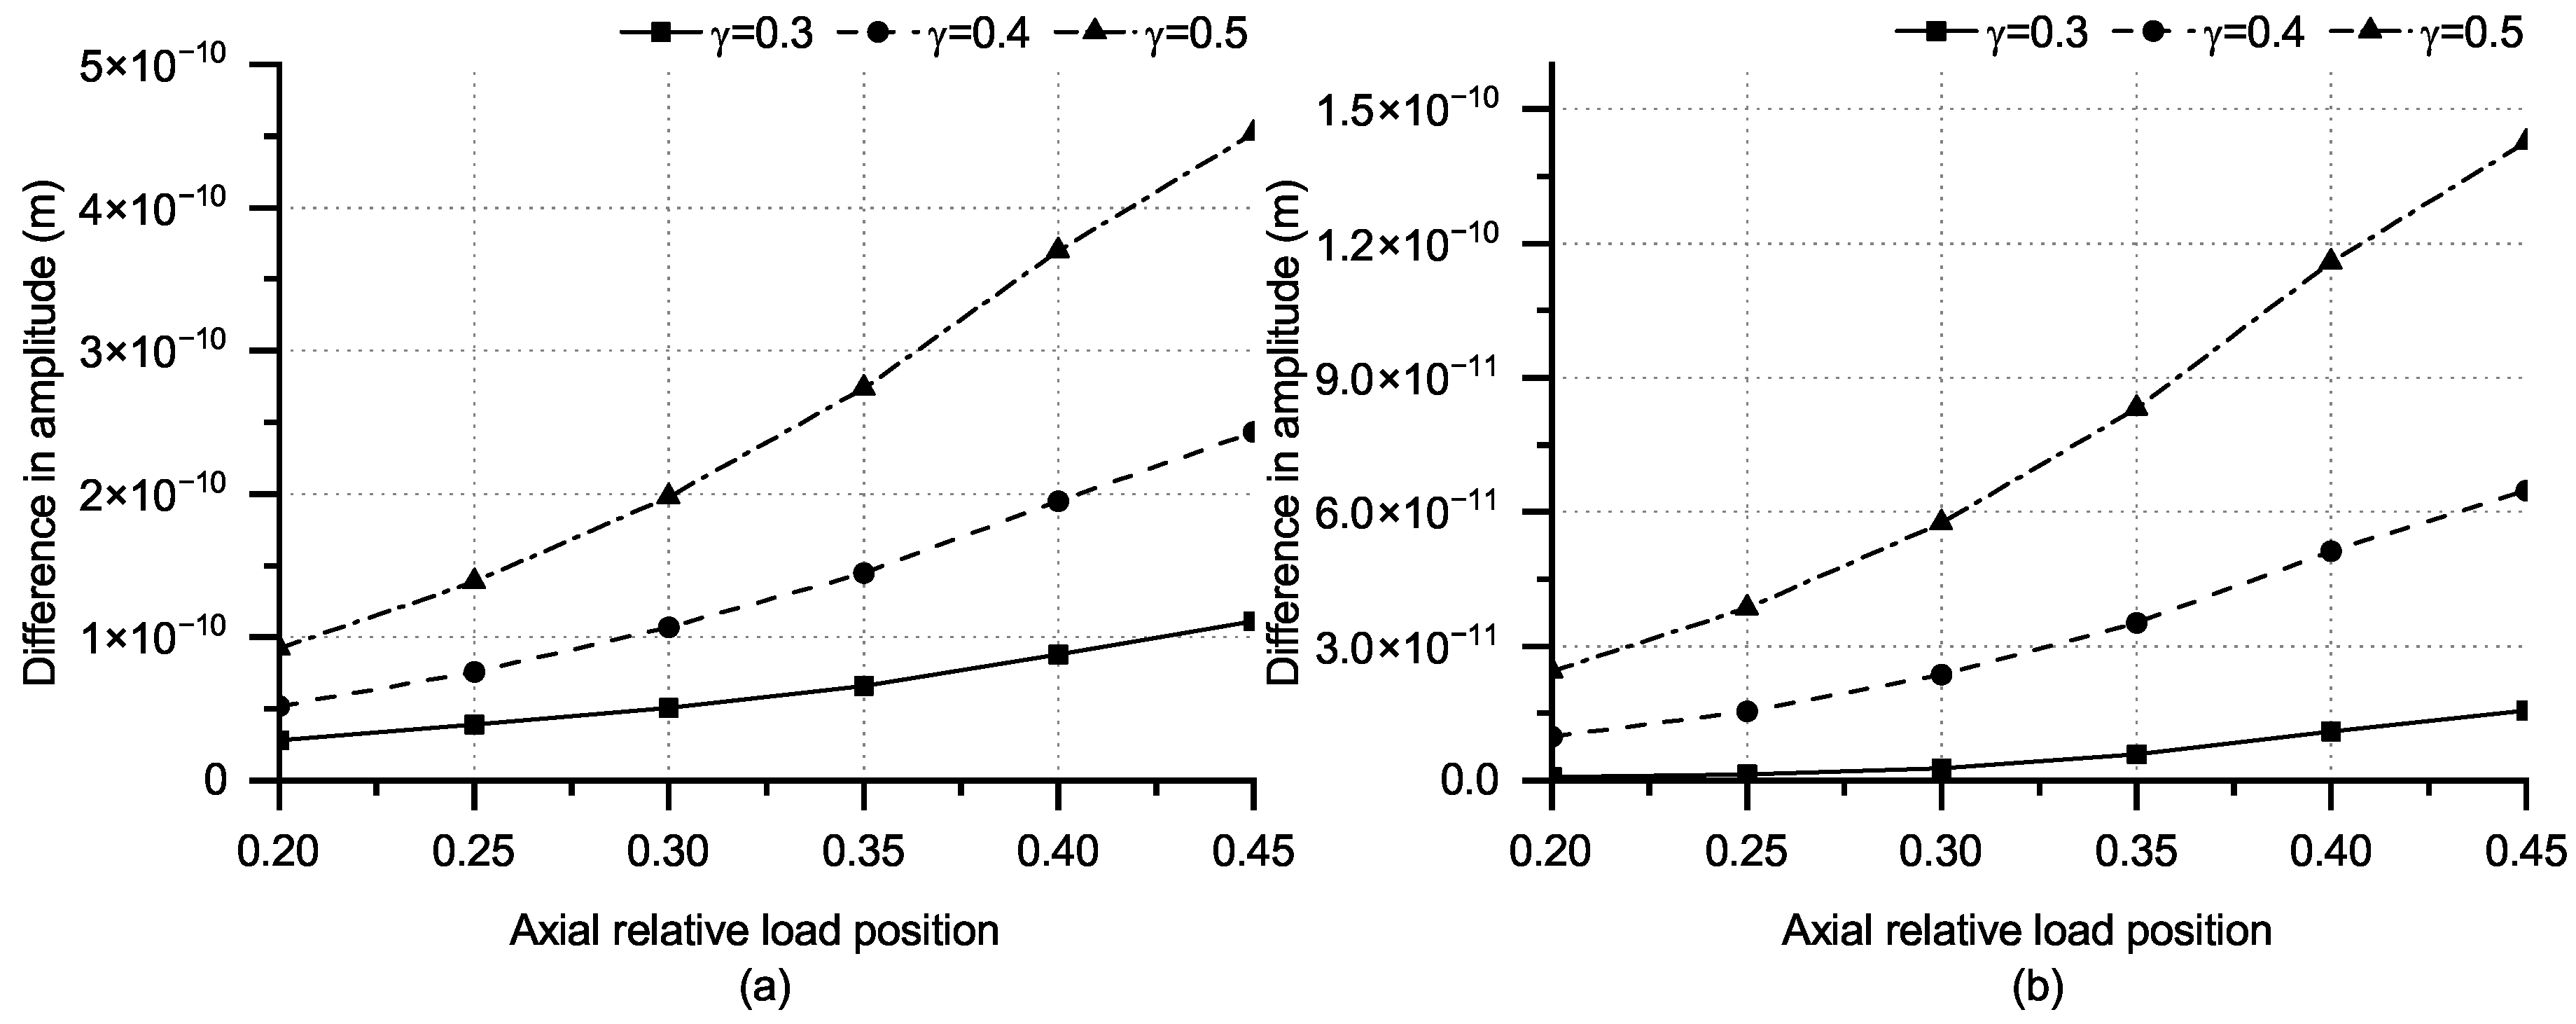
- When the time-harmonic normal point load is near the crack, the radial amplitude difference on the other side of the crack initially increases and subsequently decreases. This phenomenon diminishes progressively as the load position moves away from the crack. Since the amplitude difference of the required monitoring points needs to have evolution laws, the axial relative positions of the monitor should be , , , and . As the distance between the load point and the crack decreases, the radial and axial amplitude differences of the selected monitoring points show a downward trend. Moreover, as the monitoring point relocates away from the crack, the range of variation in amplitude differences gradually decreases. Meanwhile, the deepening crack exhibits an enlarged variation range in radial and axial displacements. The results contribute to the identification of the crack’s circumferential position, providing a basis for selecting the load point and corresponding monitoring point locations.
Author Contributions
Funding
Institutional Review Board Statement
Informed Consent Statement
Data Availability Statement
Acknowledgments
Conflicts of Interest
References
- Huang, Z.; Fu, H.; Chen, W.; Zhang, J.; Huang, H. Damage detection and quantitative analysis of shield tunnel structure. Autom. Constr. 2018, 94, 303–316. [Google Scholar] [CrossRef]
- Haorong, C.; Limin, P.; Mingfeng, L.; Fudong, C.; Qianlong, T. Causes analysis, reinforcement and repair technology of segment crack and damage during shield tunnelling process: A case study. Geotech. Geol. Eng. 2019, 37, 765–773. [Google Scholar] [CrossRef]
- Mo, H.H.; Chen, J.S. Study on inner force and dislocation of segments caused by shield machine attitude. Tunn. Undergr. Space Technol. 2008, 23, 281–291. [Google Scholar] [CrossRef]
- Dong, F.; Fang, Q.; Zhang, D.L.; Xu, H.; Li, Y.; Niu, X. Analysis on defects of operational metro tunnels in Beijing. China Civ. Eng. J. 2017, 50, 104–113. [Google Scholar]
- Yang, R.; Kong, Q.; Ren, M.; Ji, F.; Li, D. Statistical and numerical analysis on characteristics and influence factors of construction cracks of large-diameter underwater shield tunnel: A case study. Front. Earth Sci. 2023, 11, 1235674. [Google Scholar] [CrossRef]
- Xu, M.; Chen, D.; Zhong, G.; Liu, C.; Li, H.; Zhang, Z. Effects of Jack Thrust on the Damage of Segment Lining Structure during Shield Machine Tunnelling. Front. Earth Sci. 2023, 13, 2274. [Google Scholar] [CrossRef]
- Li, H.; Xie, X.; Zhang, Y.; Wang, Q. Theoretical, Numerical, and Experimental Study on the Identification of Subway Tunnel Structural Damage Based on the Moving Train Dynamic Response. Sensors 2021, 21, 7197. [Google Scholar] [CrossRef]
- Zhang, Y.; Xie, X.; Li, H.; Zhou, B.; Wang, Q.; Shahrour, I. Subway tunnel damage detection based on in-service train dynamic response, variational mode decomposition, convolutional neural networks and long short-term memory. Autom. Constr. 2022, 139, 104293. [Google Scholar] [CrossRef]
- Ding, Z.; Huang, X.; Sun, M.M.; Xu, L.Y.; Huang, Z.G.; Zhou, Q.H. Experimental study on the influence of cracks on tunnel vibration under subway train load. Tunn. Undergr. Space Technol. 2023, 142, 105444. [Google Scholar] [CrossRef]
- Forrest, J.A.; Hunt, H.E.M. A three-dimensional tunnel model for calculation of train-induced ground vibration. J. Sound Vib. 2006, 294, 678–705. [Google Scholar] [CrossRef]
- Wang, T.; Wang, C.; Yin, Y.; Zhang, Y.; Li, L.; Tan, D. Analytical approach for nonlinear vibration response of the thin cylindrical shell with a straight crack. Nonlinear Dyn. 2023, 111, 10957–10980. [Google Scholar] [CrossRef]
- Tornabene, F. Free vibration analysis of functionally graded conical, cylindrical shell and annular plate structures with a four-parameter power-law distribution. Comput. Methods Appl. Mech. Eng. 2009, 198, 2911–2935. [Google Scholar] [CrossRef]
- Flügge, W. Stresses in Shells; Springer Science & Business Media: Berlin/Heidelberg, Germany, 2013. [Google Scholar]
- Fuller, C.R. The effects of wall discontinuities on the propagation of flexural waves in cylindrical shells. J. Sound Vib. 1981, 75, 207–228. [Google Scholar] [CrossRef]
- Zhang, X.M.; Liu, G.R.; Lam, K.Y. Vibration analysis of thin cylindrical shells using wave propagation approach. J. Sound Vib. 2001, 239, 397–403. [Google Scholar] [CrossRef]
- Zhang, X.M.; Liu, G.R.; Lam, K.Y. Coupled vibration analysis of fluid-filled cylindrical shells using the wave propagation approach. Appl. Acoust. 2001, 62, 229–243. [Google Scholar] [CrossRef]
- Li, X. Study on free vibration analysis of circular cylindrical shells using wave propagation. J. Sound Vib. 2008, 311, 667–682. [Google Scholar]
- Iqbal, Z.; Naeem, M.N.; Sultana, N. Vibration characteristics of FGM circular cylindrical shells using wave propagation approach. Acta. Mech. 2009, 208, 237–248. [Google Scholar] [CrossRef]
- Gan, L.; Li, X.; Zhang, Z. Free vibration analysis of ring-stiffened cylindrical shells using wave propagation approach. J. Sound Vib. 2009, 326, 633–646. [Google Scholar] [CrossRef]
- Mostofizadeh, S.; Fagerström, M.; Larsson, R. Dynamic crack propagation in elastoplastic thin-walled structures: Modelling and validation. Int. J. Numer. Methods Eng. 2013, 96, 63–86. [Google Scholar] [CrossRef]
- Talreja, R.; Varna, J. Modeling Damage, Fatigue and Failure of Composite Materials; Elsevier: Cambridge, UK, 2015. [Google Scholar]
- Zhao, X. Analytical solution of deflection of multi-cracked beams on elastic foundations under arbitrary boundary conditions using a diffused stiffness reduction crack model. Arch. Appl. Mech. 2021, 91, 277–299. [Google Scholar] [CrossRef]
- Rice, J.R.; Levy, N. The part-through surface crack in an elastic plate. J. Appl. Mech. 1972, 39, 185–194. [Google Scholar] [CrossRef]
- Delale, F.; Erdogan, F. Line-spring model for surface cracks in a Reissner plate. Int. J. Eng. Sci. 1981, 19, 1331–1340. [Google Scholar] [CrossRef]
- Delale, F.; Erdogan, F. Application of the line-spring model to a cylindrical shell containing a circumferential or axial part-through crack. J. Appl. Mech. 1982, 49, 97–102. [Google Scholar] [CrossRef]
- Parks, D.M.; White, C.S. Elastic-plastic line-spring finite elements for surface-cracked plates and shells. J. Press. Vessel Technol. 1982, 104, 287–292. [Google Scholar] [CrossRef]
- Mohan, R. Fracture analyses of surface-cracked pipes and elbows using the line-spring/shell model. Eng. Fract. Mech. 1998, 59, 425–438. [Google Scholar] [CrossRef]
- Nikpour, K. Diagnosis of axisymmetric cracks in orthotropic cylindrical shells by vibration measurement. Compos. Sci. Technol. 1990, 39, 45–61. [Google Scholar] [CrossRef]
- Zhu, X.; Li, T.Y.; Zhao, Y.; Liu, J.X. Structural power flow analysis of Timoshenko beam with an open crack. Int. J. Eng. Sci. 2006, 297, 215–226. [Google Scholar] [CrossRef]
- Li, T.Y.; Zhu, X.; Zhao, Y.; Hu, X.F. The wave propagation and vibrational energy flow characteristics of a plate with a part-through surface crack. Int. J. Eng. Sci. 2009, 47, 1025–1037. [Google Scholar] [CrossRef]
- Moazzez, K.; Googarchin, H.S.; Sharifi, S.M.H. Natural frequency analysis of a cylindrical shell containing a variably oriented surface crack utilizing Line-Spring model. Thin Wall Struct. 2018, 125, 63–75. [Google Scholar] [CrossRef]
- Hu, J.S.; Feng, X.; Zhou, J. Theoretical and experimental study on local flexibility of pipe with a part-through circumferential crack. Eng. Mech. 2010, 27, 37–43. [Google Scholar]
- Fuller, C.R. The input mobility of an infinite circular cylindrical elastic shell filled with fluid. J. Sound Vib. 1983, 87, 409–427. [Google Scholar] [CrossRef]
- Lam, K.Y.; Loy, C.T. Effects of boundary conditions on frequencies of a multi-layered cylindrical shell. J. Sound Vib. 1995, 188, 363–384. [Google Scholar] [CrossRef]
- King, G.C. Vibrations and Waves; John Wiley & Sons: Manchester, UK, 2013. [Google Scholar]


| Analytical | Reference [11] | Reference [34] | Mode (n,m) |
|---|---|---|---|
| 12.14 Hz | 12.13 Hz | 12.17 Hz | (2,1) |
| 28.06 Hz | 28.06 Hz | 28.06 Hz | (2,2) |
| 19.61 Hz | 19.61 Hz | 19.61 Hz | (3,1) |
| 23.28 Hz | 23.28 Hz | 23.28 Hz | (3,2) |
| 31.97 Hz | 31.97 Hz | 31.98 Hz | (3,3) |
| 36.47 Hz | 36.48 Hz | 36.47 Hz | (4,1) |
| 37.37 Hz | 37.38 Hz | 37.37 Hz | (4,2) |
| 39.77 Hz | 39.77 Hz | 39.78 Hz | (4,3) |
| Order | Crack Relative Depth 0.4 | Crack Relative Depth 0.6 | ||||
|---|---|---|---|---|---|---|
| 1 | 2 | 3 | 1 | 2 | 3 | |
| Natural frequency (FEM) | 1.980 Hz | 5.239 Hz | 9.758 Hz | 1.978 Hz | 5.239 Hz | 9.749 Hz |
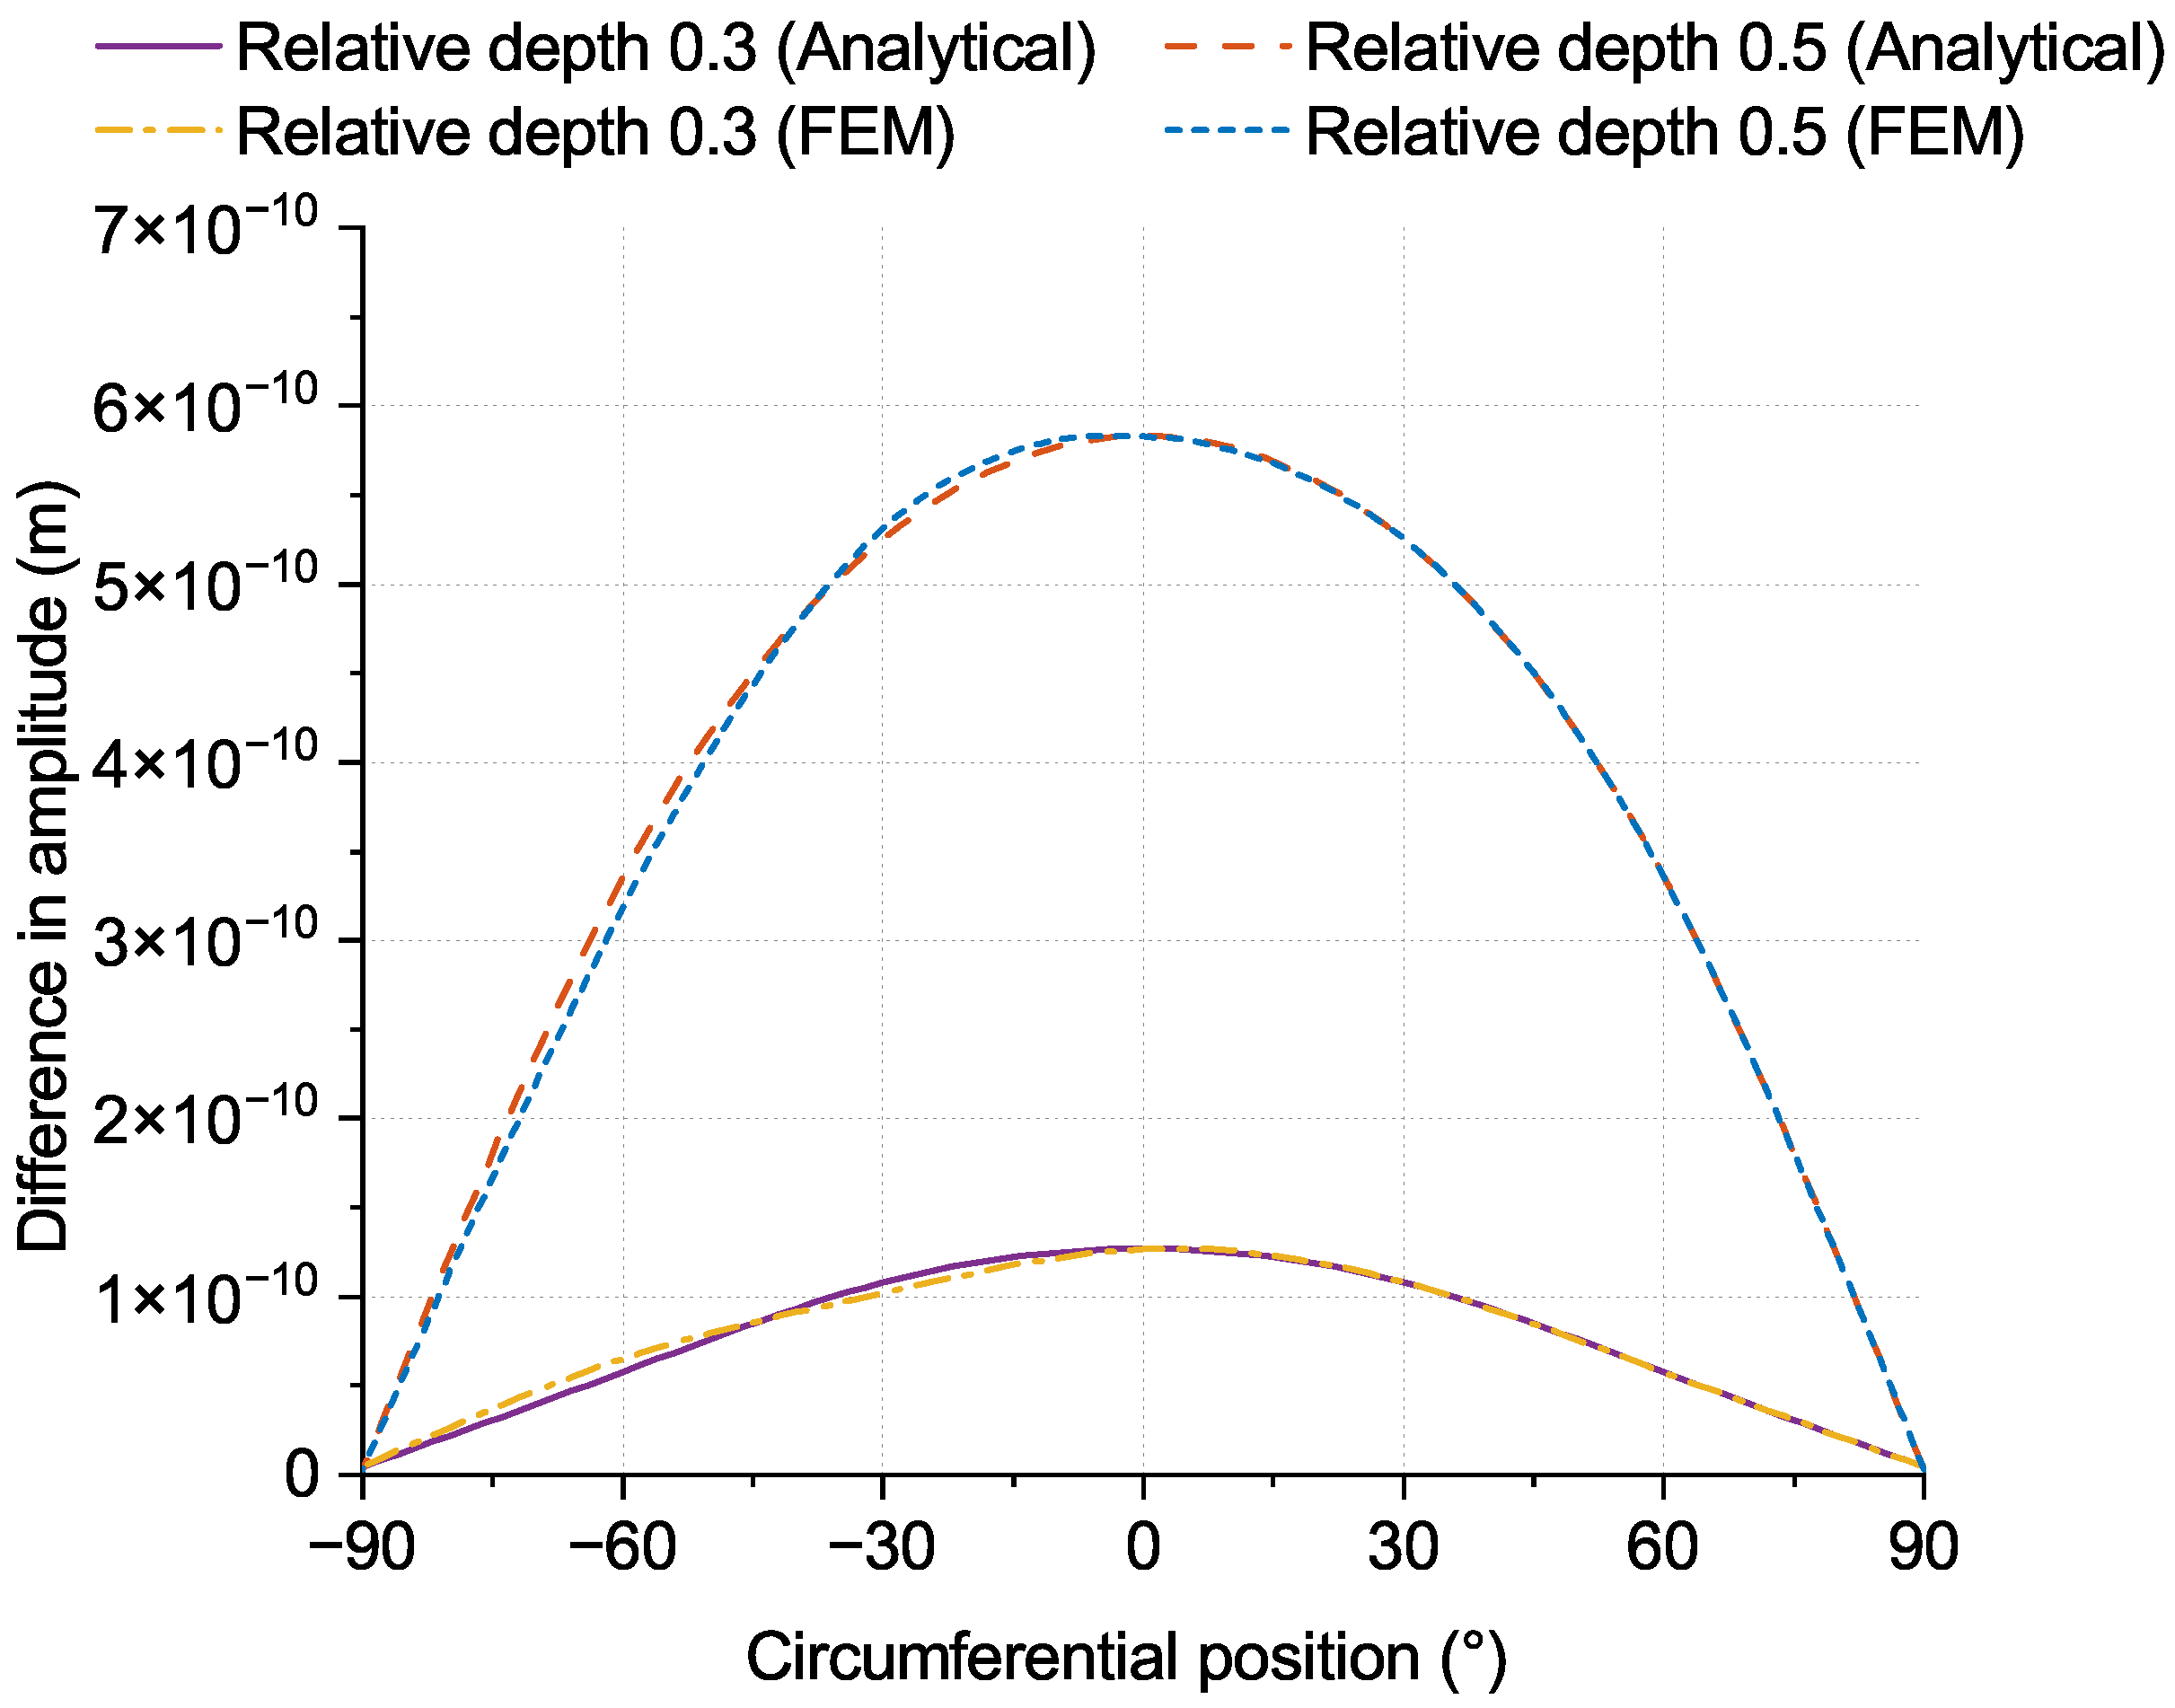
| Natural frequency (Analytical) | 1.996 Hz | 5.240 Hz | 9.894 Hz | 1.982 Hz | 5.239 Hz | 9.750 Hz |
Disclaimer/Publisher’s Note: The statements, opinions and data contained in all publications are solely those of the individual author(s) and contributor(s) and not of MDPI and/or the editor(s). MDPI and/or the editor(s) disclaim responsibility for any injury to people or property resulting from any ideas, methods, instructions or products referred to in the content. |
© 2024 by the authors. Licensee MDPI, Basel, Switzerland. This article is an open access article distributed under the terms and conditions of the Creative Commons Attribution (CC BY) license (https://creativecommons.org/licenses/by/4.0/).
Share and Cite
Yang, J.; Liu, C.; Liu, P.; Zhao, Y. Dynamic Response of the Tunnel Lining with a Circumferential Crack Subjected to a Harmonic Point Load. Appl. Sci. 2024, 14, 3072. https://doi.org/10.3390/app14073072
Yang J, Liu C, Liu P, Zhao Y. Dynamic Response of the Tunnel Lining with a Circumferential Crack Subjected to a Harmonic Point Load. Applied Sciences. 2024; 14(7):3072. https://doi.org/10.3390/app14073072
Chicago/Turabian StyleYang, Jianwei, Changdong Liu, Peishan Liu, and Yue Zhao. 2024. "Dynamic Response of the Tunnel Lining with a Circumferential Crack Subjected to a Harmonic Point Load" Applied Sciences 14, no. 7: 3072. https://doi.org/10.3390/app14073072
APA StyleYang, J., Liu, C., Liu, P., & Zhao, Y. (2024). Dynamic Response of the Tunnel Lining with a Circumferential Crack Subjected to a Harmonic Point Load. Applied Sciences, 14(7), 3072. https://doi.org/10.3390/app14073072