Article

Synergistic Effect and Phase Behavior of SCG-CAPB-H2O Ternary Compound System

School of Chemical Engineering and Technology, Tianjin University, Tianjin 300354, China
*
Author to whom correspondence should be addressed.
Appl. Sci. 2024, 14(7), 3081; https://doi.org/10.3390/app14073081
Submission received: 4 March 2024 / Revised: 30 March 2024 / Accepted: 4 April 2024 / Published: 6 April 2024
(This article belongs to the Section Surface Sciences and Technology)

Abstract

:
The physical properties of sodium cocoyl glycinate (SCG) and the synergistic effects within the SCG/CAPB complex system were investigated using visible–ultraviolet spectrophotometry and a surface tension meter. Analysis of the synergistic parameters of the complex system revealed that the combination of SCG and cocamidopropyl betaine (CAPB) yielded superior results compared to the individual use of SCG. Building upon this, the ternary phase behavior of the SCG/CAPB/H2O system was further explored. Different lyotropic liquid crystal phases were identified using polarized optical microscopy (POM) and small-angle X-ray scattering (SAXS). Surfactant solutions with varying mass fractions exhibited diverse phase behaviors, including the micellar phase (L1), micelle–solid mixed phase (L1-S), hexagonal phase (H), and lamellar phase (Lα), with the insoluble solid phase predominating. The investigation of the ternary phase diagram of SCG/CAPB/H2O provided valuable guidance for detergent formulation screening, enriched the understanding of sodium cocoyl glycinate complex systems, and further promoted the utilization of amino acid-based surfactants in the field of personal care products.

1. Introduction

Surfactants are amphiphilic molecules possessing both hydrophilic and hydrophobic groups. Due to their amphiphilic nature, surfactants self-assemble into various structures in water through hydrophobic interactions, such as micelles [1,2,3,4,5] and lyotropic liquid crystals [6,7,8,9,10,11]. Typically, phase diagrams are used to describe the different self-assembled structures in surfactant systems. Lyotropic liquid crystals, as important assemblies of amphiphilic surfactants, have attracted extensive research interest among scholars. In aqueous surfactant solutions, with increasing surfactant concentration, various lyotropic liquid crystal phases can form, including hexagonal phase (H), lamellar phase (Lα), and cubic phase (V) [6,12,13,14,15,16]. For surfactant mixtures, the system may exhibit more complex self-assembly behaviors [17,18,19,20], and the microstructures may vary with different compositions. Understanding phase behavior is crucial for determining cleaning product formulations [21,22,23]. By understanding the phase behavior of different component mixtures, one can predict and identify surfactant concentrations, thereby forming stable and semi-transparent solutions containing various surfactants. Consequently, lyotropic liquid crystal phases formed by surfactant mixtures have been extensively studied.
Sodium cocoyl glycinate (SCG) [24,25,26] is an amino acid-based surfactant known for its mildness, low irritation, biocompatibility, and renewable raw materials. It also exhibits a low critical micelle concentration, requiring only a small amount to significantly reduce the surface tension of water [27,28,29,30]. Currently, it finds wide application in personal cleansing products such as shampoos and body washes. Niu et al. [31] investigated the application of sodium cocoyl glycinate in low-rank coal flotation processes, where its excellent surface properties shine. However, due to its relatively high cost and poor solubility in water, sodium cocoyl glycinate is seldom used alone in practical applications. Moreover, single surfactants often fail to meet the required performance criteria. Therefore, sodium cocoyl glycinate is typically used in conjunction with cationic surfactants or amphoteric surfactants to achieve the desired performance.
Cocamidopropyl betaine (CAPB) [32,33,34] is also a commonly used amphoteric surfactant in personal care products. Due to its mildness and cost-effectiveness, it is often combined with other surfactants to achieve optimal performance in personal care formulations.
The present study extensively investigates the physical properties of SCG, laying a theoretical foundation for subsequent studies on complex formulations. Specifically, the SCG/CAPB complex system was selected for detailed investigation, focusing on the synergistic effects within this system. Surface tension measurements were conducted to determine various synergistic parameters of the system. Additionally, the phase behavior of the SCG/CAPB/H2O ternary system was studied. Polarized optical microscopy (POM) and small-angle X-ray scattering (SAXS) were employed to identify the types of phases present. Viscosity measurements were analyzed to understand the relationship between viscosity and liquid crystal phases. Furthermore, based on the results of small-angle X-ray scattering, the phase transition mechanisms between different phases were further explored.
Despite the extensive use of sodium cocoyl glycinate (SCG) in daily chemical and petroleum industries [25,31,35,36], there has been no detailed report on the synergistic effects and phase behavior of the SCG/CAPB/H2O ternary system to date. This study holds significant implications for detergent formulation design, serving as a valuable reference for subsequent formulation designs in the commercial sector. Additionally, it enriches the understanding of phase behavior of amino acid-based surfactants, contributing to the broader research landscape in this field.

2. Materials and Methods
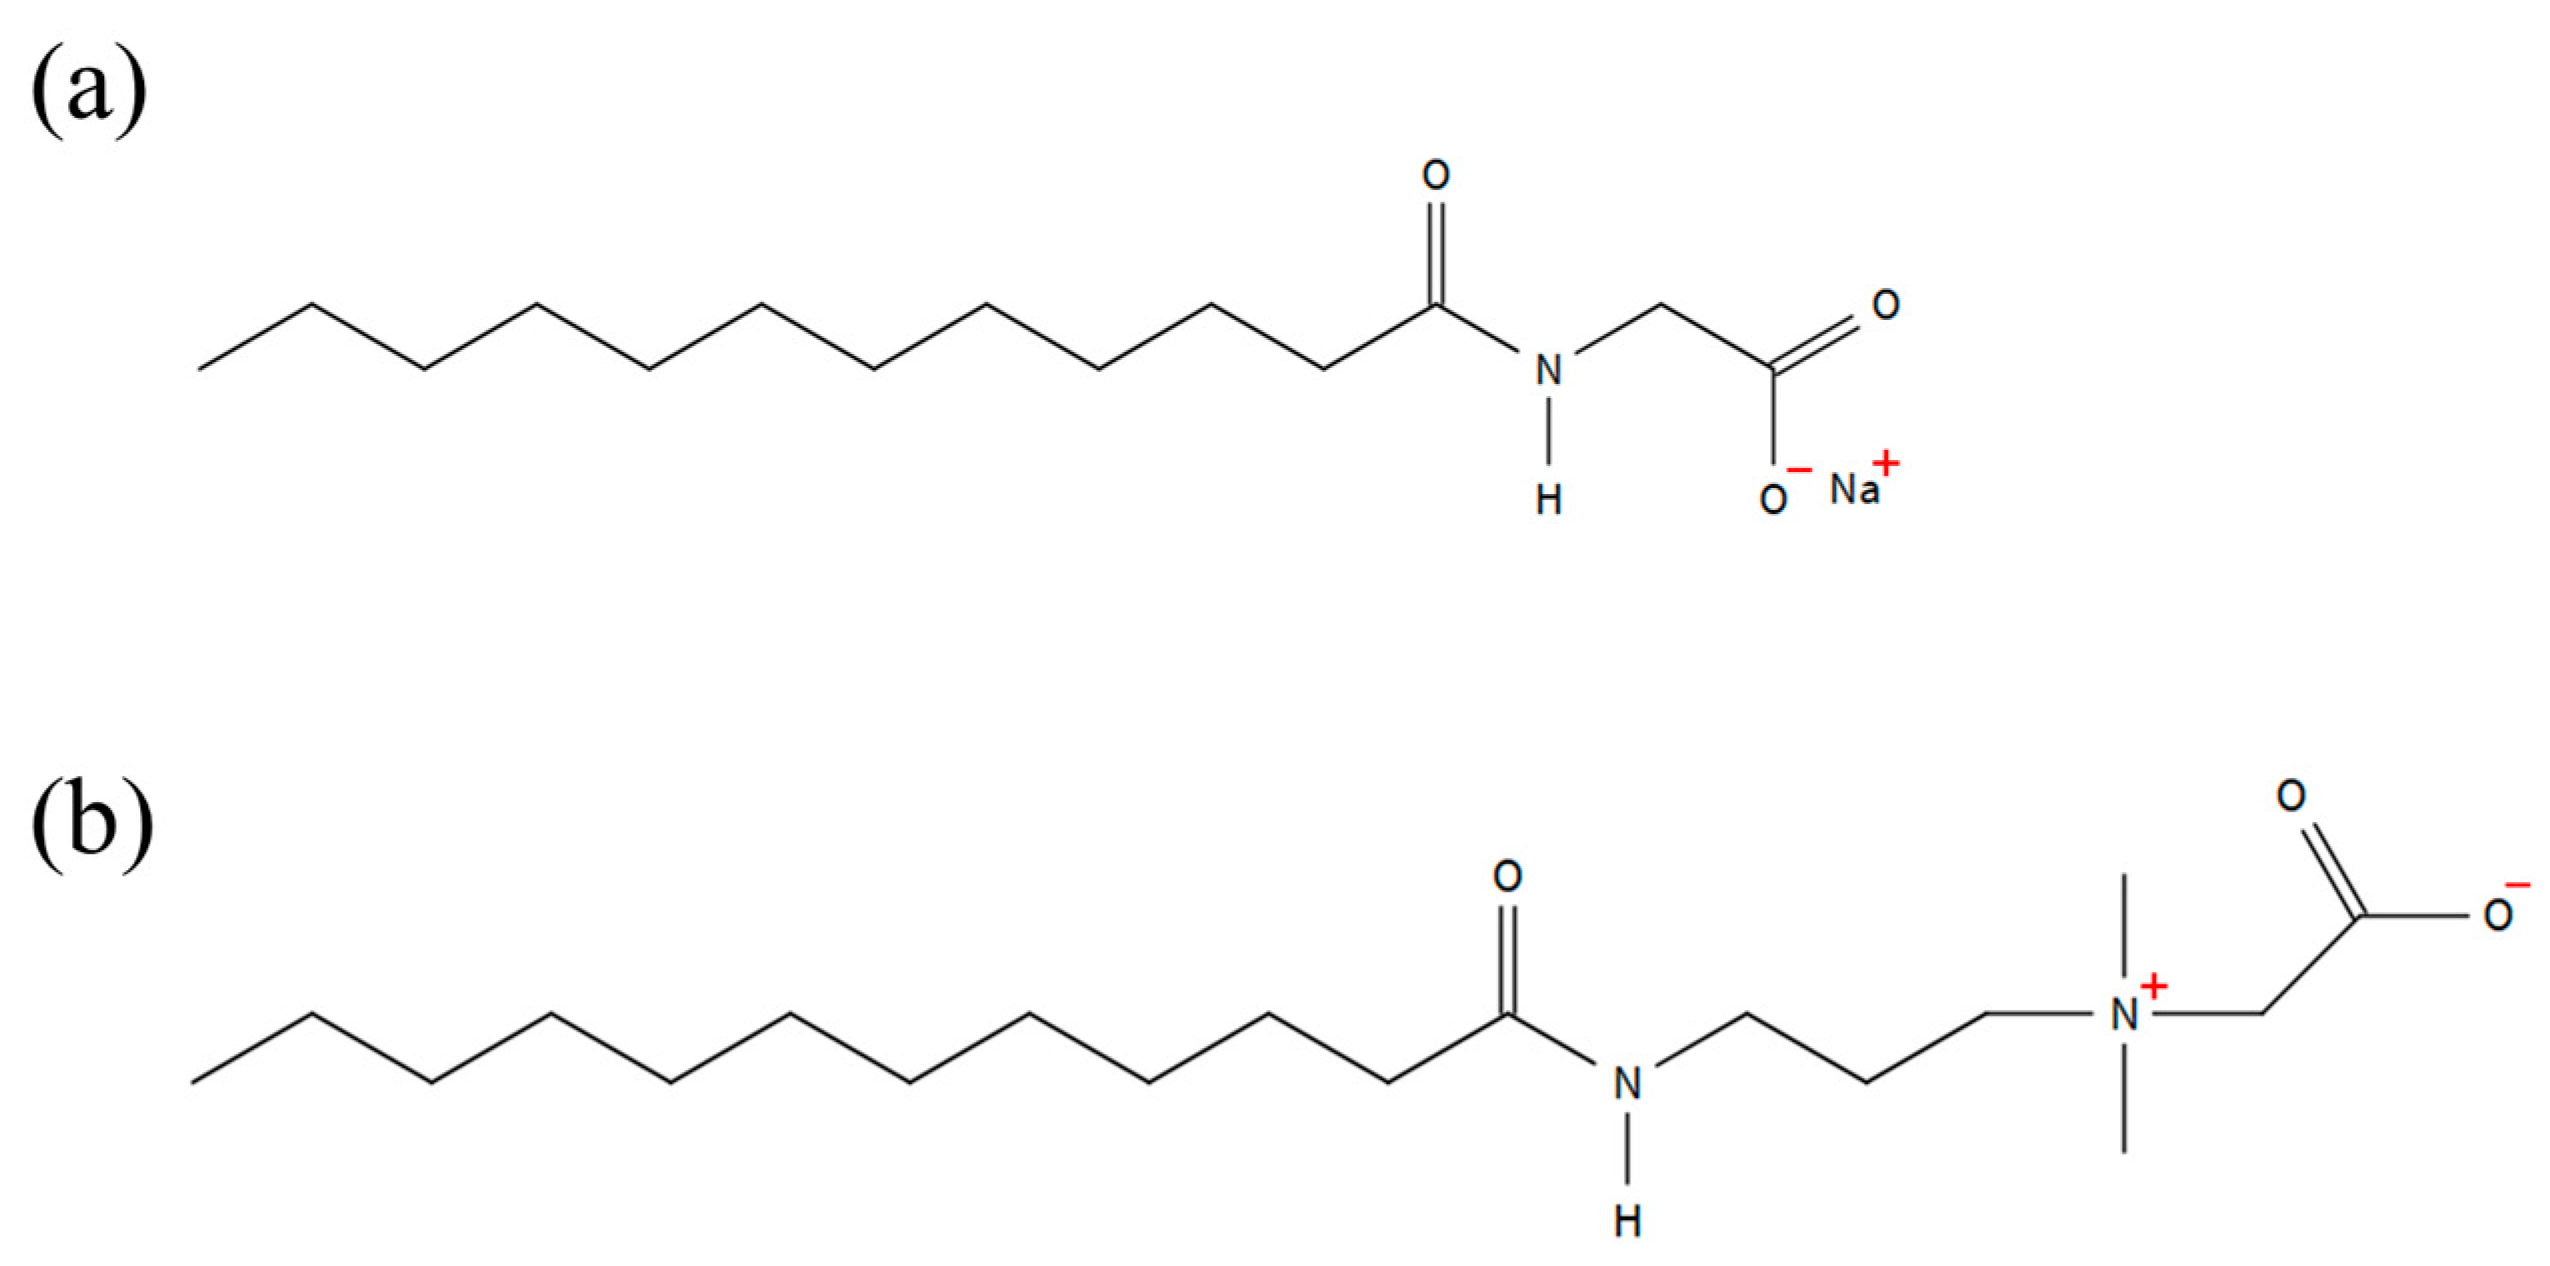
2.1. Materials

Sodium cocoyl glycinate (SCG) and cocamidopropyl betaine (CAPB) were sourced from Guangzhou Tianci Advanced Materials Co., Ltd. (Guangzhou, China). These raw materials were synthesized using the Schotten–Baumann condensation method, with a purity exceeding 95%. All chemicals were used as received without further purification. The molecular structures of sodium cocoyl glycinate (SCG) and cocamidopropyl betaine (CAPB) are depicted in Figure 1.

2.2. Sample Preparation

The samples for surface tension experiments were prepared by successive dilutions of a standard solution. Initially, a 0.1 mol/L surfactant solution was accurately prepared using a beaker and a volumetric flask. Subsequently, solutions of varying concentrations of surfactant were obtained by diluting the 0.1 mol/L stock solution.
The samples for phase behavior were prepared based on the percentage composition corresponding to each point in the phase diagram. For example, Sample 1 consisted of 15% SCG, 5% CAPB, and 80% water by mass. Initially, 2.5 g of CAPB was dissolved in 40 g of water. The solution was stirred at 600 revolutions per minute using a magnetic stirrer (LICHEN, Shanghai, China)) at 25 °C for 0.5 h to obtain a homogeneous and transparent CAPB aqueous solution. Subsequently, 7.5 g of SCG was added to the prepared CAPB aqueous solution, and stirring was continued at 600 revolutions per minute for approximately 2 h to achieve homogenization of the SCG/CAPB/H2O mixed solution. The prepared samples were left to stand for about 2 weeks to eliminate bubbles in the solution. In this study, the mixing ratio refers to the weight percentage of SCG/CAPB/H2O, with each sample’s total mass controlled at 50 g. The preparation method for the other samples in the phase diagram was the same as that for Sample 1, with approximately 100 samples prepared in total.

2.3. Surface Tension Measurement

Different concentrations of sodium cocoyl glycinate (SCG) aqueous solutions were prepared for surface tension testing using the Wilhelmy plate method [37,38,39]. The Wilhelmy plate method employs a platinum plate. Prior to measurement, the platinum alloy plate was heated until it was red-hot using an alcohol lamp to ensure that there were no residues on the plate surface. At this point, due to the extremely high surface free energy of platinum material, the wetting effect is ideal, resulting in a contact angle θ of 0° (cos θ = 1) between the plate and the liquid.
The Wilhelmy equation is as follows:
γ = F L · cos θ
where γ represents the surface tension of the solution, measured in mN·m−1; F denotes the force exerted on the platinum plate by the liquid surface, measured in mN; L stands for the wetted length of the platinum plate, measured in m; and θ represents the contact angle between the liquid surface and the platinum plate.
Surface tension measurements were conducted using the Kruss K100 surface tension meter (Hamburg, Germany). Prior to measurement, the liquid surface was gradually raised until it reached the platinum plate, then further raised to a height 2 mm above the platinum plate before commencing measurements. During the measurement process, the liquid surface height was slowly lowered, and the force exerted by the liquid surface on the platinum plate was measured using the instrument’s high-precision mechanical sensor. Thirty consecutive measurements were taken until the difference between consecutive measurements was less than ±0.1 mN·m−1, indicating measurement completion.

2.4. UV–Visible Spectrophotometer

The transmittance of the samples was measured using a TU-1900 UV–Visible spectrophotometer (Beijing General Instruments Co., Ltd., Beijing, China). The variation in transmittance with temperature was analyzed to determine the Krafft point of the surfactant system. The wavelength was set at 600 nm.

2.5. Phase Behavior

Samples covering the entire compositional range of the ternary phase diagram of the SCG/CAPB/H2O system were prepared. The required weight ratios of SCG, CAPB, and H2O were mixed homogeneously at room temperature using a high-efficiency mechanical stirrer. Phase diagrams were constructed using polarized optical microscopy (POM) and small-angle X-ray scattering (SAXS). Polarized optical microscopy was utilized to roughly determine the phase behavior of the SCG/CAPB/H2O system [40,41]. As different liquid crystal phases exhibit distinct polarized optical images, they can be identified using POM. Additionally, SAXS was employed to confirm the results [42,43,44,45]. For rough mapping, the compositional intervals were chosen as 5%, with smaller intervals of 1–2.5% defining the phase boundaries in the transition regions. Phase equilibrium was determined by visual observation. The types of liquid crystals and phase boundaries were confirmed using polarized optical microscopy and small-angle X-ray scattering. In this study, samples were tested within one day to one week after preparation.

2.6. Polarized Optical Microscopy (POM)

The birefringence of experimental samples was tested using a polarized optical microscope (POM) from Chongqing BK-POL Company(Chongqing, China). This microscope employs polarized light passing through crossed polarizers to observe the samples. A computer connected to the microscope’s CCD module (Sony Corporation, Tokyo, Japan) via a micro-USB interface monitors and captures images. For each test, approximately 0.1 g of sample was placed between a glass slide and cover slip, gently pressed to ensure uniform distribution before observation. In this process, approximately 100 samples with different mass fractions across the ternary phase diagram were tested. The magnification was set to 10× during testing. The testing temperature was controlled at 25 ± 0.1 °C.
Different liquid crystal phases may exhibit anisotropic or isotropic behavior under polarized light, resulting in distinct patterns or textures [40]. For instance, the hexagonal phase may display irregular bright spots or fan-shaped textures, while the lamellar phase may present oily streaks or Maltese cross patterns. Micellar and cubic phases, being isotropic, appear uniformly dark in POM images. Therefore, the liquid crystal type can be preliminarily determined by examining the sample’s image under a polarized optical microscope.

2.7. Small-Angle X-ray Scattering (SAXS)

Small-Angle X-ray Scattering (SAXS) is employed to determine the structure of liquid crystal phases. SAXS experiments were conducted on the SAXSpace small-angle X-ray scattering instrument from Anton Paar (Graz, Austria). The instrument operated at a voltage of 40 kV, utilizing Cu Kα radiation with a wavelength (λ) of 0.15406 nm. SAXS patterns within the 1–3° scanning range were collected at a scanning rate of 0.5 degrees per minute using a tube current of 100 mA. The sample-to-detector distance was set to 317 mm, and the acquisition time for all samples was 600 s. Throughout the entire testing period, the experimental temperature was maintained at 25.0 ± 0.1 °C.
In the spectrum, a plot of scattering intensity versus scattering vector (q) was generated, where q = 4πsinθ/λ, with λ representing the wavelength and θ denoting the scattering angle. The type of liquid crystal phase was determined by the ratio of scattering vectors at the SAXS peak [43,45]. For instance, the scattering vector ratio for the hexagonal phase is 1:√3:2:√7, for the lamellar phase is 1:2:3:4, and for the cubic phase is 1:√2:√4:√6:√8. Based on the scattering vector q corresponding to the first scattering peak, the lattice parameter of the liquid crystal phase can be calculated using the formula d = 2π/q, where d represents the interlayer spacing between layers in the layered phase and the lattice parameter in the hexagonal phase.

2.8. Viscosity Measurement

Viscosity measurements were conducted using the Malvern Kinexus rotational rheometer (Malvern Instruments Ltd., Malvern, UK). A cone–plate sensor with a diameter of 40 mm and a cone angle of 2° was employed. The measurement temperature was maintained at 25 ± 0.1 °C. Each sample was gently inserted into the top of the cone–plate. Excess sample extruded from the sensor system was gently removed. A stress relaxation period of 10 min was allowed before measurements were taken.

3. Results and Discussion

3.1. Synergistic Effect of SCG/CAPB Ternary Compound System

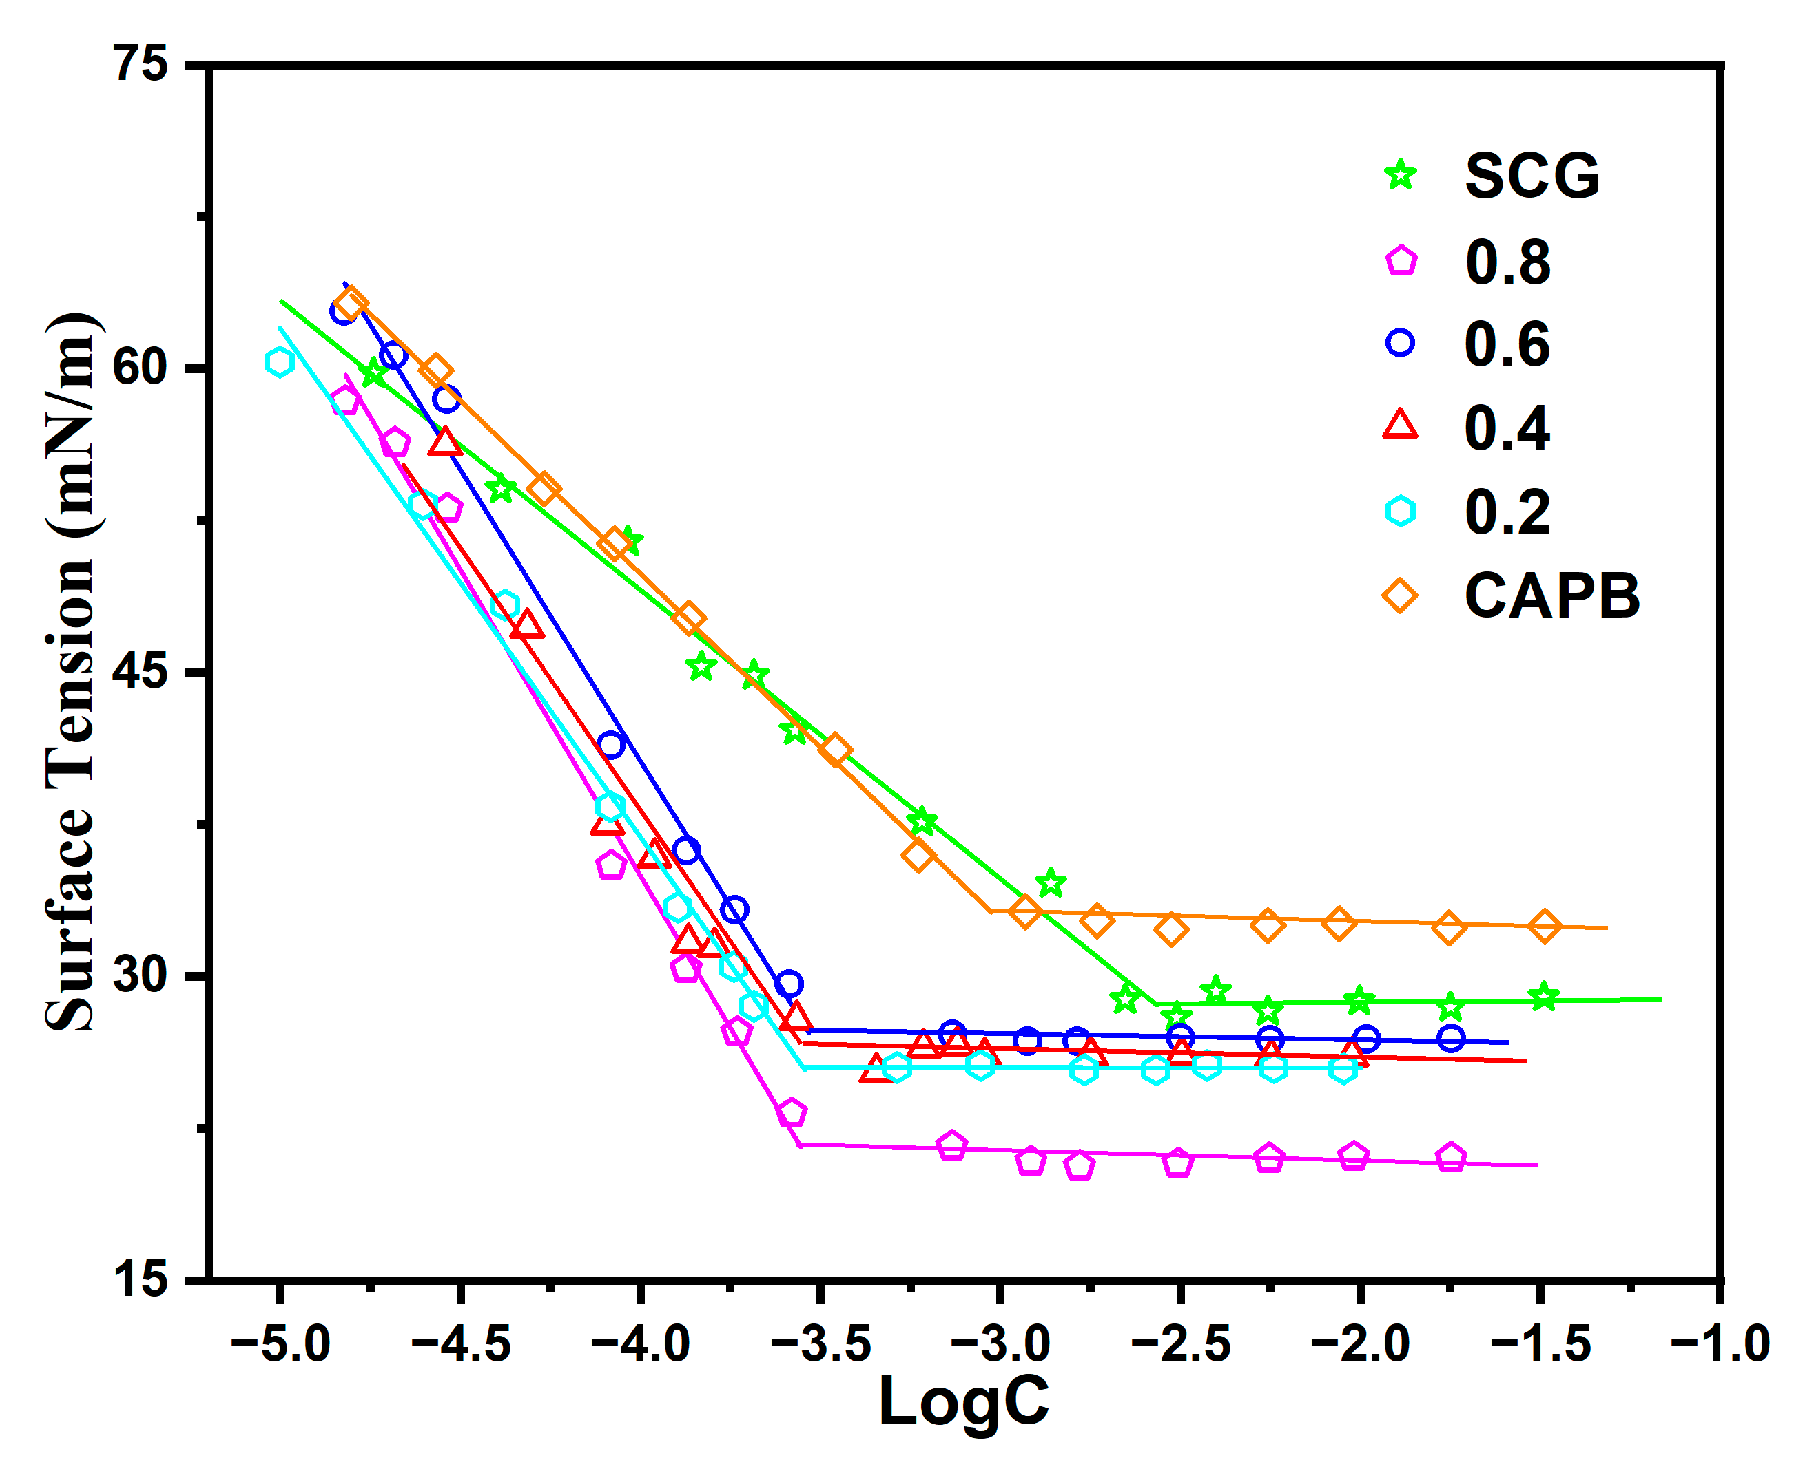
3.1.1. CMC of SCG/CAPB System

It is widely recognized that surfactants possess a crucial attribute in reducing the surface tension of water. As the concentration of surfactants increases, surface adsorption within the solution gradually intensifies. The hydrophobic segment of the surfactant aligns towards the surface, disrupting the hydrogen bonding network within water molecules, consequently leading to a gradual decline in surface tension. Upon reaching the critical micelle concentration (CMC), micelle formation initiates. Further escalation of surfactant concentration beyond this threshold elicits minimal alterations in surface tension. Using the surface tension method, we determined the critical micelle concentrations (CMC) and additional surface properties of individual surfactants SCG and CAPB, as well as their binary SCG/CAPB system ( where   X 1 = C S C G / ( C S C G + C C A P B ) . Figure 2 illustrates the correlation between surface tension (γ) and the logarithm of concentration (logC).
The surface tension decreases rapidly with increasing surfactant concentration, eventually reaching a plateau. Linear regression was employed to fit the trend lines of both segments, and their intersection indicated the critical micelle concentration (CMC). At this point, the corresponding surface tension represents the minimum achievable surface tension of the solution, donated as γ C M C . Table 1 provides the critical micelle concentrations and minimum surface tensions for individual surfactants as well as their mixed systems. The critical micelle concentration (CMC) of sodium cocoyl glycinate is determined to be 3.013 mmol/L, which corresponds to approximately 0.84 g/L by mass concentration. This value is slightly higher than the reported value of 0.57 g/L in the literature [31]. This difference is likely attributed to variations in the content of sodium chloride in the raw materials [46]. It is noteworthy that the reported CMC values of sodium cocoyl glycinate in the literature [47,48] range from 0.21 to 33.8 mmol/L, which is also likely due to differences in the sodium chloride content in the raw materials used in different studies. Similarly, the CMC value of cocamidopropyl betaine was determined to be 0.974 mmol/L, which is slightly higher than the reported value of 0.881 mmol/L in the literature [49]. Considering the inevitable presence of sodium chloride impurities in the raw materials of cocamidopropyl betaine [50], this also contributes to the observed discrepancies in the CMC values reported in different studies [33,34,51,52,53,54,55,56]. The results demonstrate that the addition of a small amount of CAPB significantly reduces both the CMC and γ C M C of the SCG/CAPB mixed system compared to the SCG system alone. This reduction indicates enhanced surface activity in the mixed system.
To investigate whether mixed micelles exhibit ideal or non-ideal behavior, we employed a pseudo-phase separation model to analyze their properties. [57,58]. In this model, micelles are considered equilibrium macroscopic phases containing respective monomer solutions. The ideal critical micelle concentration (CMC∗) for binary surfactant can be determined using Equation (2).
1 C M C * = X 1 C M C 1 + 1 X 1 C M C 2
In Equation (2), C M C 1 and C M C 2 represent the critical micelle concentrations (CMC) of SCG and CAPB, respectively. The calculation results of CMC* for the SCG/CAPB system is displayed in Table 1.
In Table 1, the experimental critical micelle concentration (CMC) value is one order of magnitude lower than CMC*. This indicates that the SCG/CAPB mixture deviates from ideal behavior, suggesting a strong synergistic interaction between SCG and CAPB. Additionally, the efficiency factor pC20, denoting the logarithmic reduction in surfactant concentration required to achieve a 20 mN·m−1 surface tension, exhibits a higher value for the SCG/CAPB blend compared to the SCG system, surpassing 4.0. This observation underscores the significantly enhanced surface activity of the SCG/CAPB combination relative to SCG alone. The formation of micelles in surfactant mixtures is chiefly governed by two factors: the electrostatic interaction between oppositely charged head groups and the hydrophobic interaction among the hydrocarbon tails. The electrostatic screening of surfactant head groups was experimentally confirmed through zeta potential measurements. Chen [59] gradually introduced NPES into CTAB aqueous solution and measured the zeta potential of the formed micelles. It was observed that the absolute value of the zeta potential of the resulting mixed micelles decreased gradually. This observation confirmed the occurrence of electrostatic interactions between NPES and CTAB head groups bearing opposite charges, resulting in a reduction in the net charge carried by the head groups and a decrease in the electrostatic repulsion between them. Regarding the SCG/CAPB complex system, when forming mixed micelles, the anionic head groups of SCG attract the cationic head groups of CAPB, reducing the electrostatic repulsion between the head groups. Additionally, the molecular tails form dual hydrophobic chains. As a result, they tend to form mixed micelles earlier, thereby reducing the CMC value of the complex system.

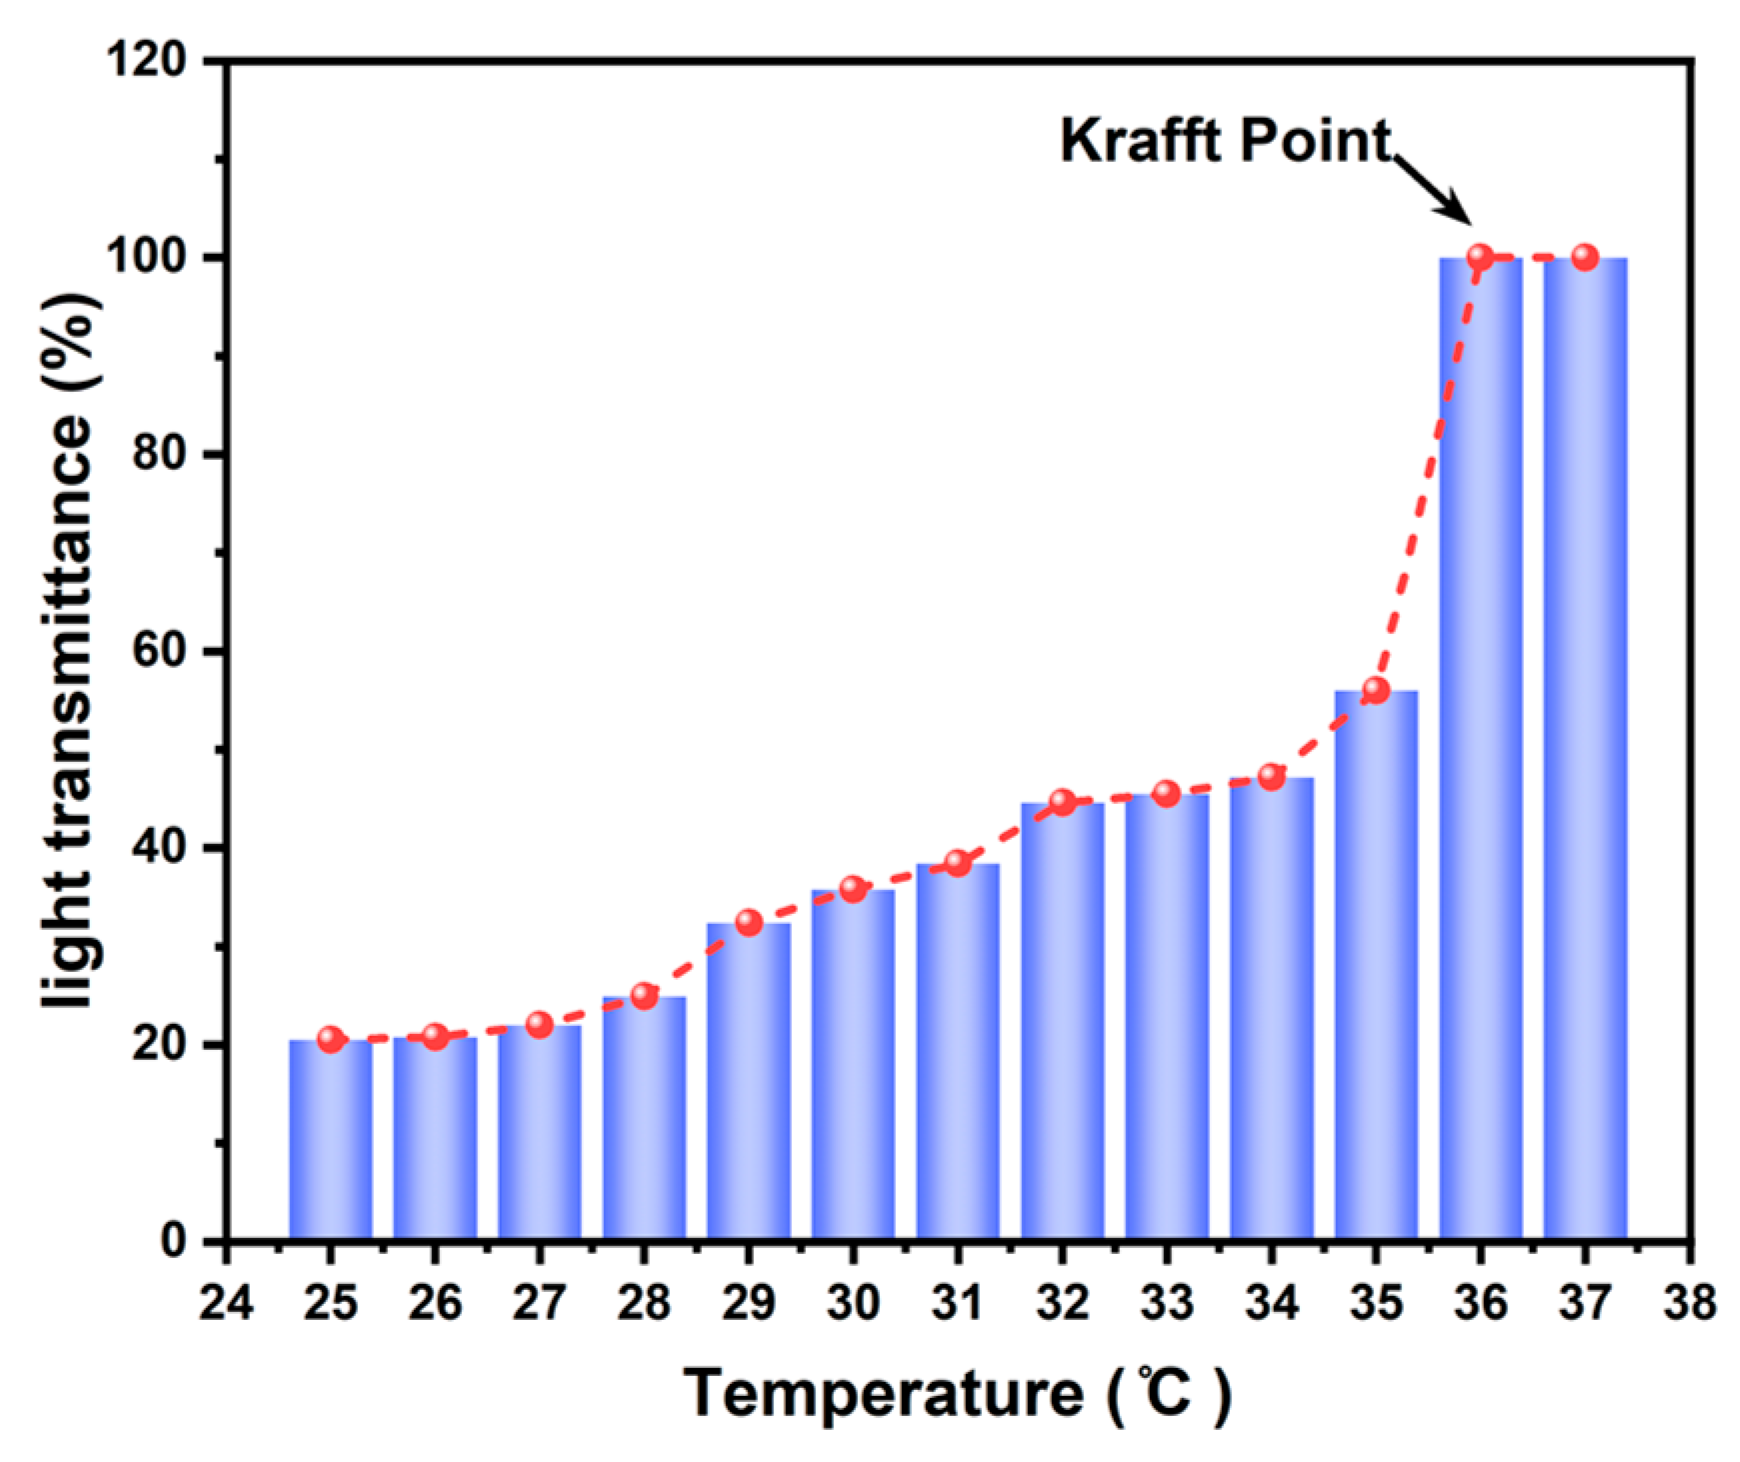
3.1.2. Krafft Point of Sodium Cocoyl Glycinate (SCG)

The solubility of surfactants in water varies with temperature. As the temperature increases to a certain point, the solubility of the surfactant sharply increases. This temperature is known as the Krafft point. To measure the lowest temperature at which micelle formation occurs, the sum of the amounts of dissolved and undissolved surfactant in the system must exceed the critical micelle concentration.
The experiment was conducted to determine the Krafft point of sodium cocoyl glycinate solution at a concentration of 1.0 × 10⁻² mol/L, slightly above the critical micelle concentration. After maintaining the solution at various temperatures for 30 min, the transmittance of red light in the visible spectrum was measured using a UV–visible spectrophotometer. The results are shown in Figure 3. It can be observed from the graph that at a temperature of 36 °C, there is a significant increase in the transmittance of sodium cocoyl glycinate solution, reaching 100%. This indicates complete dissolution of the solute in the solution, indicating the formation of micellar solution in water, significantly increasing the solubility of sodium cocoyl glycinate in water. Therefore, the Krafft point of sodium cocoyl glycinate was determined to be 36 °C. Notably, this is the first report for the Krafft temperature of sodium cocoyl glycinate.

3.1.3. Critical Packing Parameter (CPP) of Sodium Cocoyl Glycinate (SCG)

From the results of surface tension measurements, we can also deduce the aggregation state of surfactant molecules at the air/water interface. The Gibbs adsorption isotherm [60,61,62] is one of the fundamental equations for studying surface adsorption of surfactant solutions. From the Gibbs adsorption equation, we can obtain a crucial parameter—the maximum surface adsorption amount, denoted as Γ m a x :
Γ m a x = 1 2.303 n R T γ l o g C T
In the equation, R denotes the gas constant (8.3144 J · m o l 1 K 1 ), T is the absolute temperature, C stands for the concentration of surfactant, and ∂γ/∂logC is calculated as the slope of linear surface tension γ with respect to the logarithm of concentration logC. Here, sodium cocoyl glycinate is an ionic surfactant of the 1:1 electrolyte type [63], so n is taken as 2. From the above equation, Γ m a x can be calculated as 3.085 × 10 6   m o l · m 2 .
After the surfactant dissolves in water, due to its amphiphilic nature, the surfactant tends to preferentially aggregate at the interface between water and air. Therefore, Γ m a x can be further utilized to determine the minimum cross-sectional area A m i n with Equation (4).
A m i n = 10 18 N A · Γ m a x   n m 2
Based on the previously calculated Γ m a x , A m i n can be determined to be 0.538 n m 2 .
The morphology of organized molecular self-assembly depends on the geometric structure of surfactants, particularly the relative sizes of the cross-sectional areas of the hydrophilic and hydrophobic groups in solution. This concept has been defined by Israelachvili [64] as the critical packing parameter (CPP); it can be calculated by Equation (5).
C P P = V c L c · A m i n
Here, Vc refers to the volume of the hydrophobic portion of the surfactant molecule, Lc denotes the chain length of the hydrophobic tail of the surfactant molecule, and A m i n indicates the cross-sectional area of the head group of the surfactant molecule.
According to the Tanford equation [65], the volume Vc of the hydrophobic portion of the surfactant molecule and the chain length Lc of the hydrophobic tail can be calculated based on the number of carbon atoms n in the hydrophobic chain of the surfactant molecule:
V c = 0.0274 + 0.0269 n   n m 3
L c = 0.15 + 0.1265 n   n m
The calculations yield Vc = 0.3233 nm3, Lc = 1.5415 nm, and CPP = 0.7935. The physical properties of sodium cocoyl glycinate are shown in Table 2.

3.1.4. The Interaction Parameter (β) for the SCG/CAPB System

According to conventional solution theory, the interaction strength between the head groups of two surfactant molecules in a solution can be represented by the interaction parameter β [66]. Typically, interaction parameters for mixed micelles ( β m ) and mixed interfaces ( β σ ) can be calculated accordingly. If β < 0, it indicates mutual attraction between the two components; if β > 0, it suggests mutual exclusion between the two components; when β = 0, it signifies no interaction between them. Generally, the interaction parameter β can be determined by measuring the critical micelle concentration (CMC) of the corresponding surfactant mixture. The interaction between surfactants in the SCG/CAPB binary mixture system is evaluated using equations from the Rubingh non-ideal mixing theory [66,67]. This model is derived from the regular solution theory (RST). According to this theory, the critical micelle concentration ( C 12 m ) of the surfactant mixture can be determined using Equation (8).
C = X 1 m   f 1 m ·   C 1 m = X 1 ·   C 12 m
In Equation (8), C represents the concentration of the surfactant SCG in the solution; X 1 and X 1 m denote the molar fractions of SCG in the solution and in the micelles, respectively; C 1 m and C 12 m are the critical micelle concentrations (CMC) of SCG and the binary mixed surfactant, respectively; f 1 m stands for the activity coefficient of SCG in the mixed micelles. The activity coefficients of SCG ( f 1 m ) and CAPB ( f 2 m ) are associated with the interaction parameters and can be determined by Equations (9) and (10).
l n f 1 m = β m 1     X 1 m 2
l n f 2 m = β m X 1 m 2
As f 1 m = X 1 C 12 m / ( X 1 m C 1 m ) and f 2 m = C 12 m ( 1 X 1 ) / [ C 2 m ( 1 X 1 m ) ] , X 1 m could be calculated from Equation (11). In Equation (11), C 2 m represents the critical micelle concentration (CMC) of the surfactant CAPB.
X 1 m 2 ln ( C 12 m X 1 ) / ( C 1 m X 1 m     ) 1 X 1 m 2 ln ( C 12 m   ( 1 X 1   ) ) / [ C 2 m 1 X 1 m ]  
The interaction parameter β m can be calculated using Equation (12).
β m = ln C 12 m X 1 / C 1 m X 1 m 1 X 1 m 2
Similarly, the interaction parameter β σ for the mixed monolayer can be calculated using the Rubingh formula [67], as given in Equations (13) and (14).
X 1 σ 2 ln ( C 12 s X 1 ) / ( C 1 s X 1 σ     ) 1 X 1 σ 2 ln ( C 12 s   ( 1 X 1   ) ) / [ C 2 s 1 X 1 σ ]   = 1
β σ = ln C 12 s X 1 / C 1 s X 1 σ 1 X 1 σ 2
In the equations above, X 1 σ represents the molar fraction of SCG in the mixed monolayer; C 1 s , C 2 s , and C 12 s are the concentrations of SCG, CAPB, and the binary complex system, respectively, at which the surface tension reaches 40 mN·m−1. The activity coefficients f 1 σ and f 2 σ for SCG and CAPB can be determined from the interaction parameter β σ of the mixed monolayer, as in Equations (15) and (16).
l n f 1 σ = β σ 1     X 1 σ 2
l n f 2 σ = β σ X 1 σ 2
Through surface tension experiments, the concentrations of C 1 s , C 2 s , and C 12 s were determined, and subsequently, a series of parameters, such as X 1 m , X 1 σ , β m , β σ , etc., were calculated, which are presented in Table 3. Evidently, all parameters of β m and β σ in the binary mixed system exhibit negative values, indicating that the interaction between SCG and CAPB in the mixed micelles and mixed monolayer surpasses that of each individual surfactant alone. Furthermore, it is notable that β σ displays a more negative value compared to β m , implying that the incorporation of two hydrophobic groups into micelles presents a greater challenge than at the interface, indicative of stronger interactions at the gas/liquid interface.

3.2. The Phase Behavior of SCG/CAPB System

To determine the phase state of each sample, we conducted visual observation, polarized light microscopy, and small-angle X-ray scattering (SAXS) tests. Visual observation is the simplest and quickest method to determine the phase state of a sample. Micellar phases are isotropic in nature, so for some clear and transparent solutions, we could easily judge the micellar phase by visual observation. For solutions with lower transparency, polarized light microscopy and SAXS techniques were employed to explore their microstructural phases.

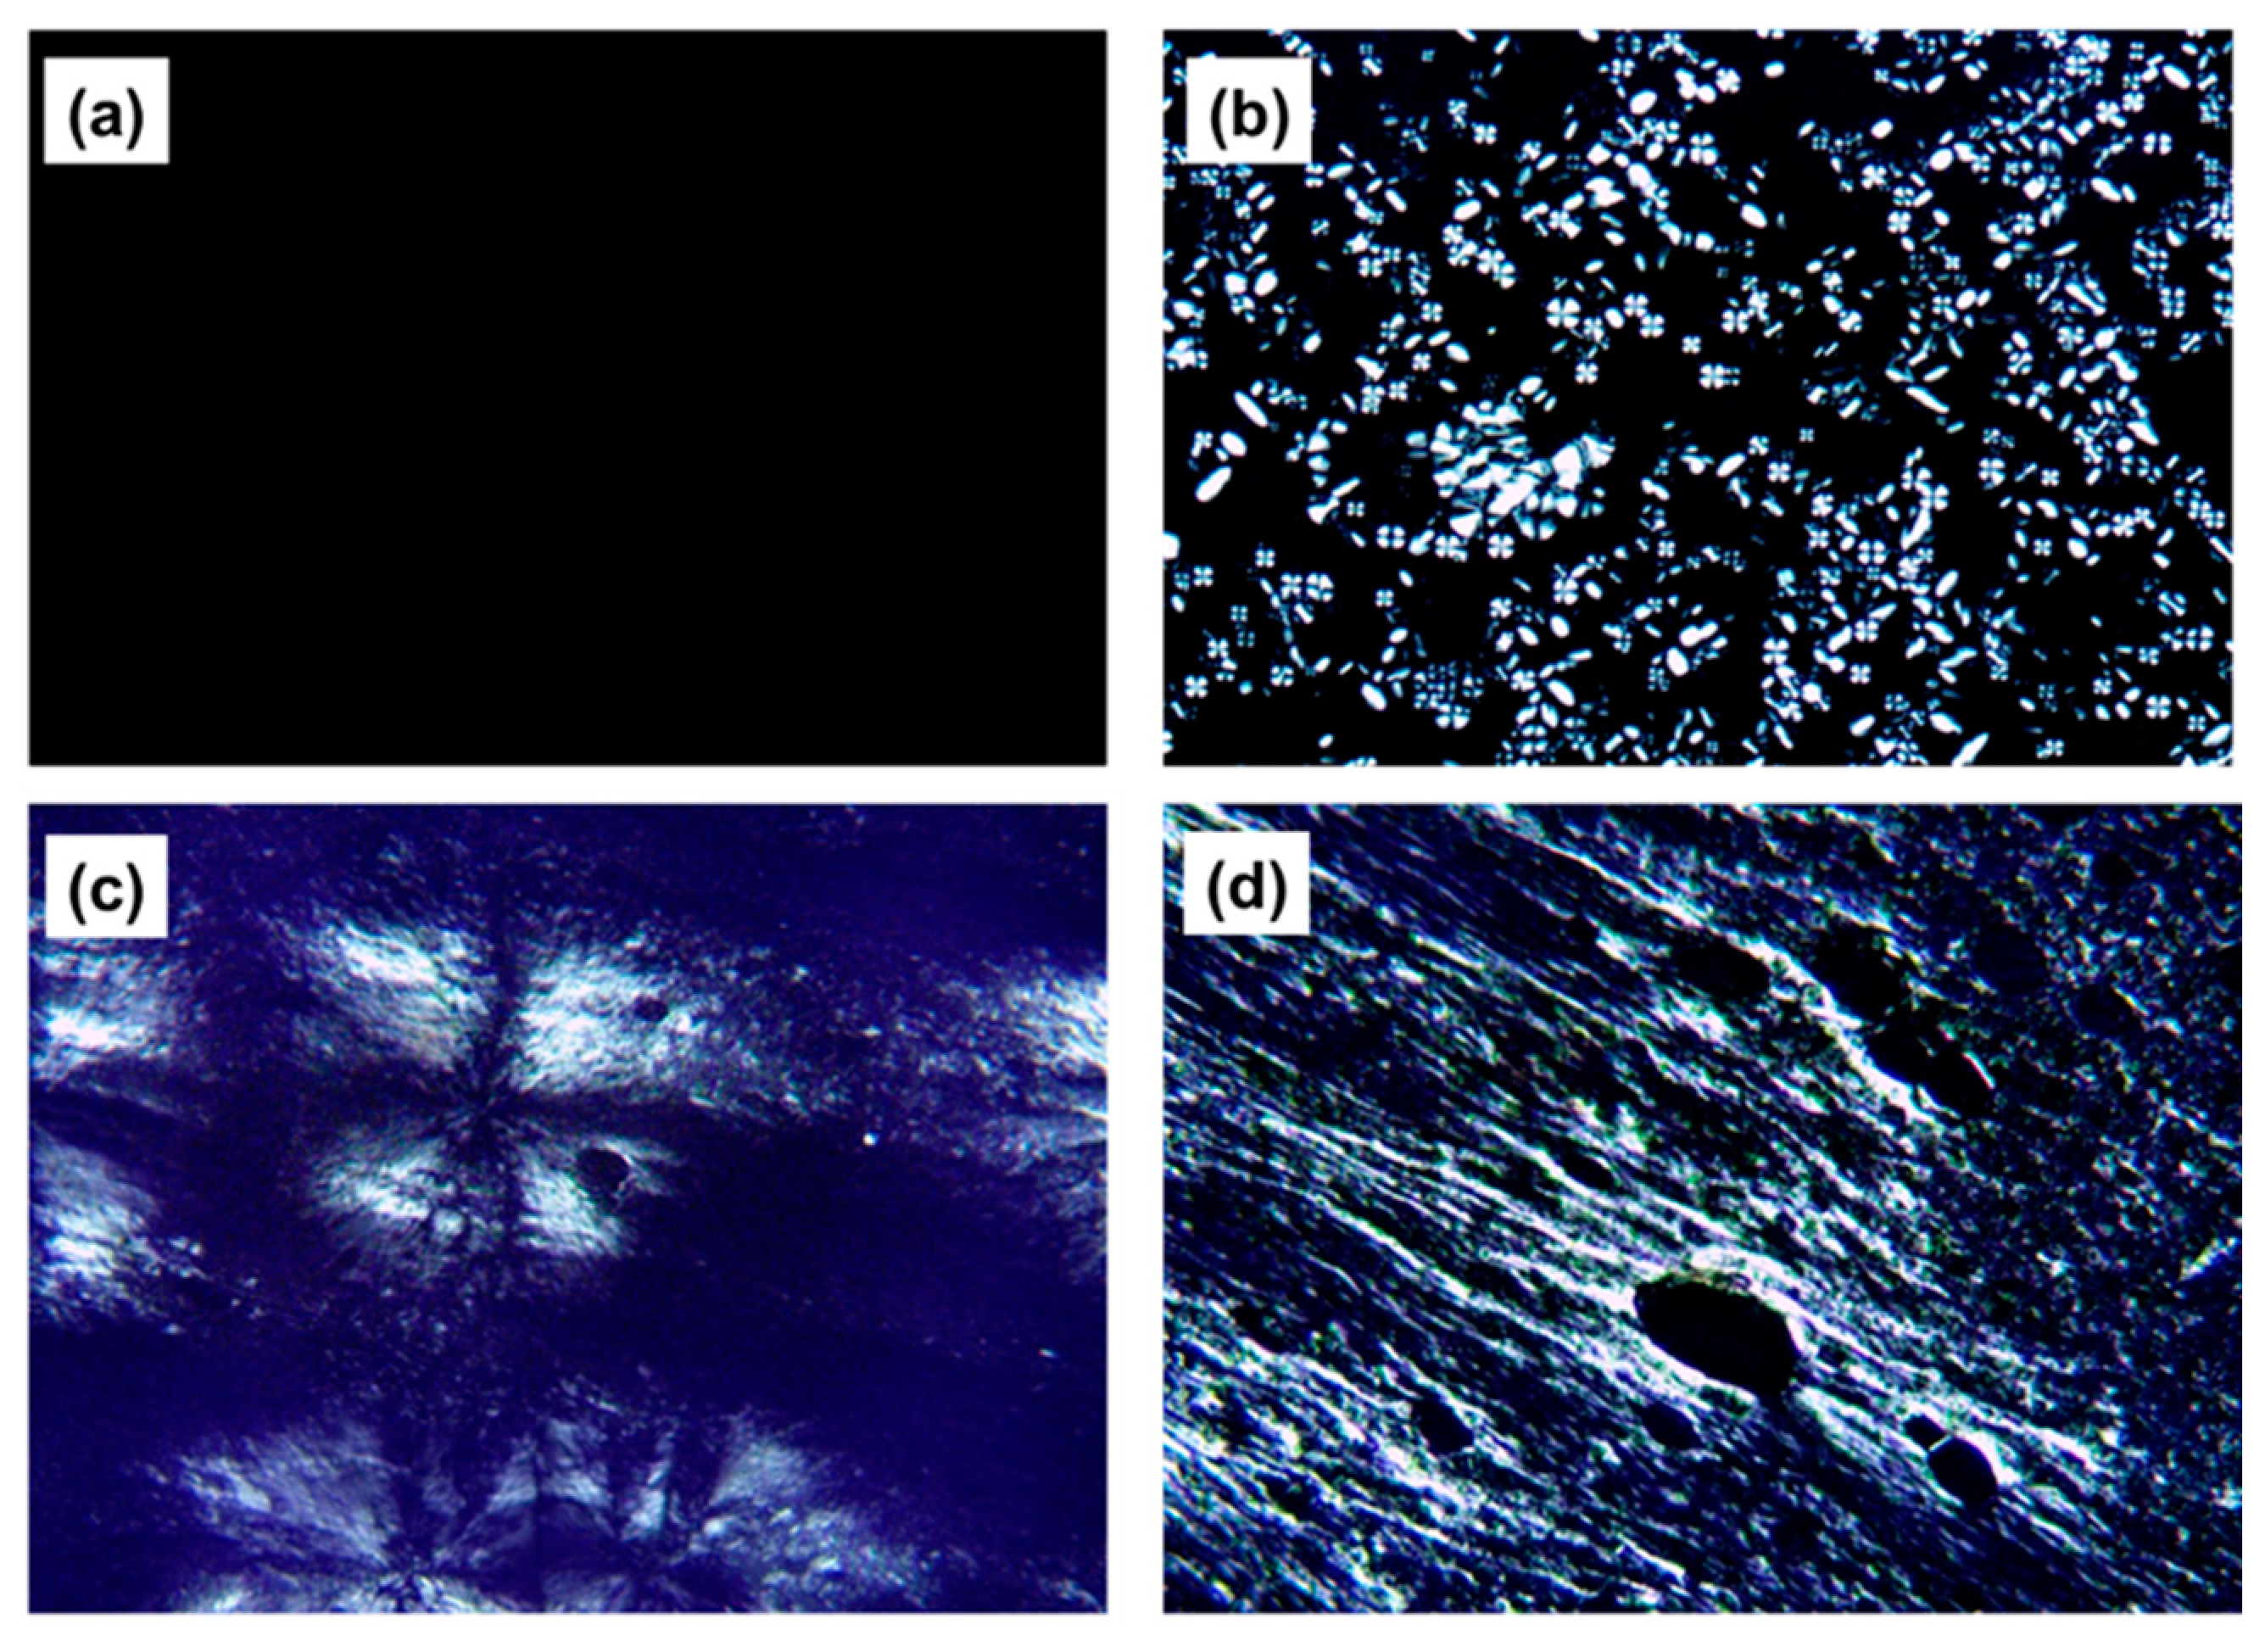
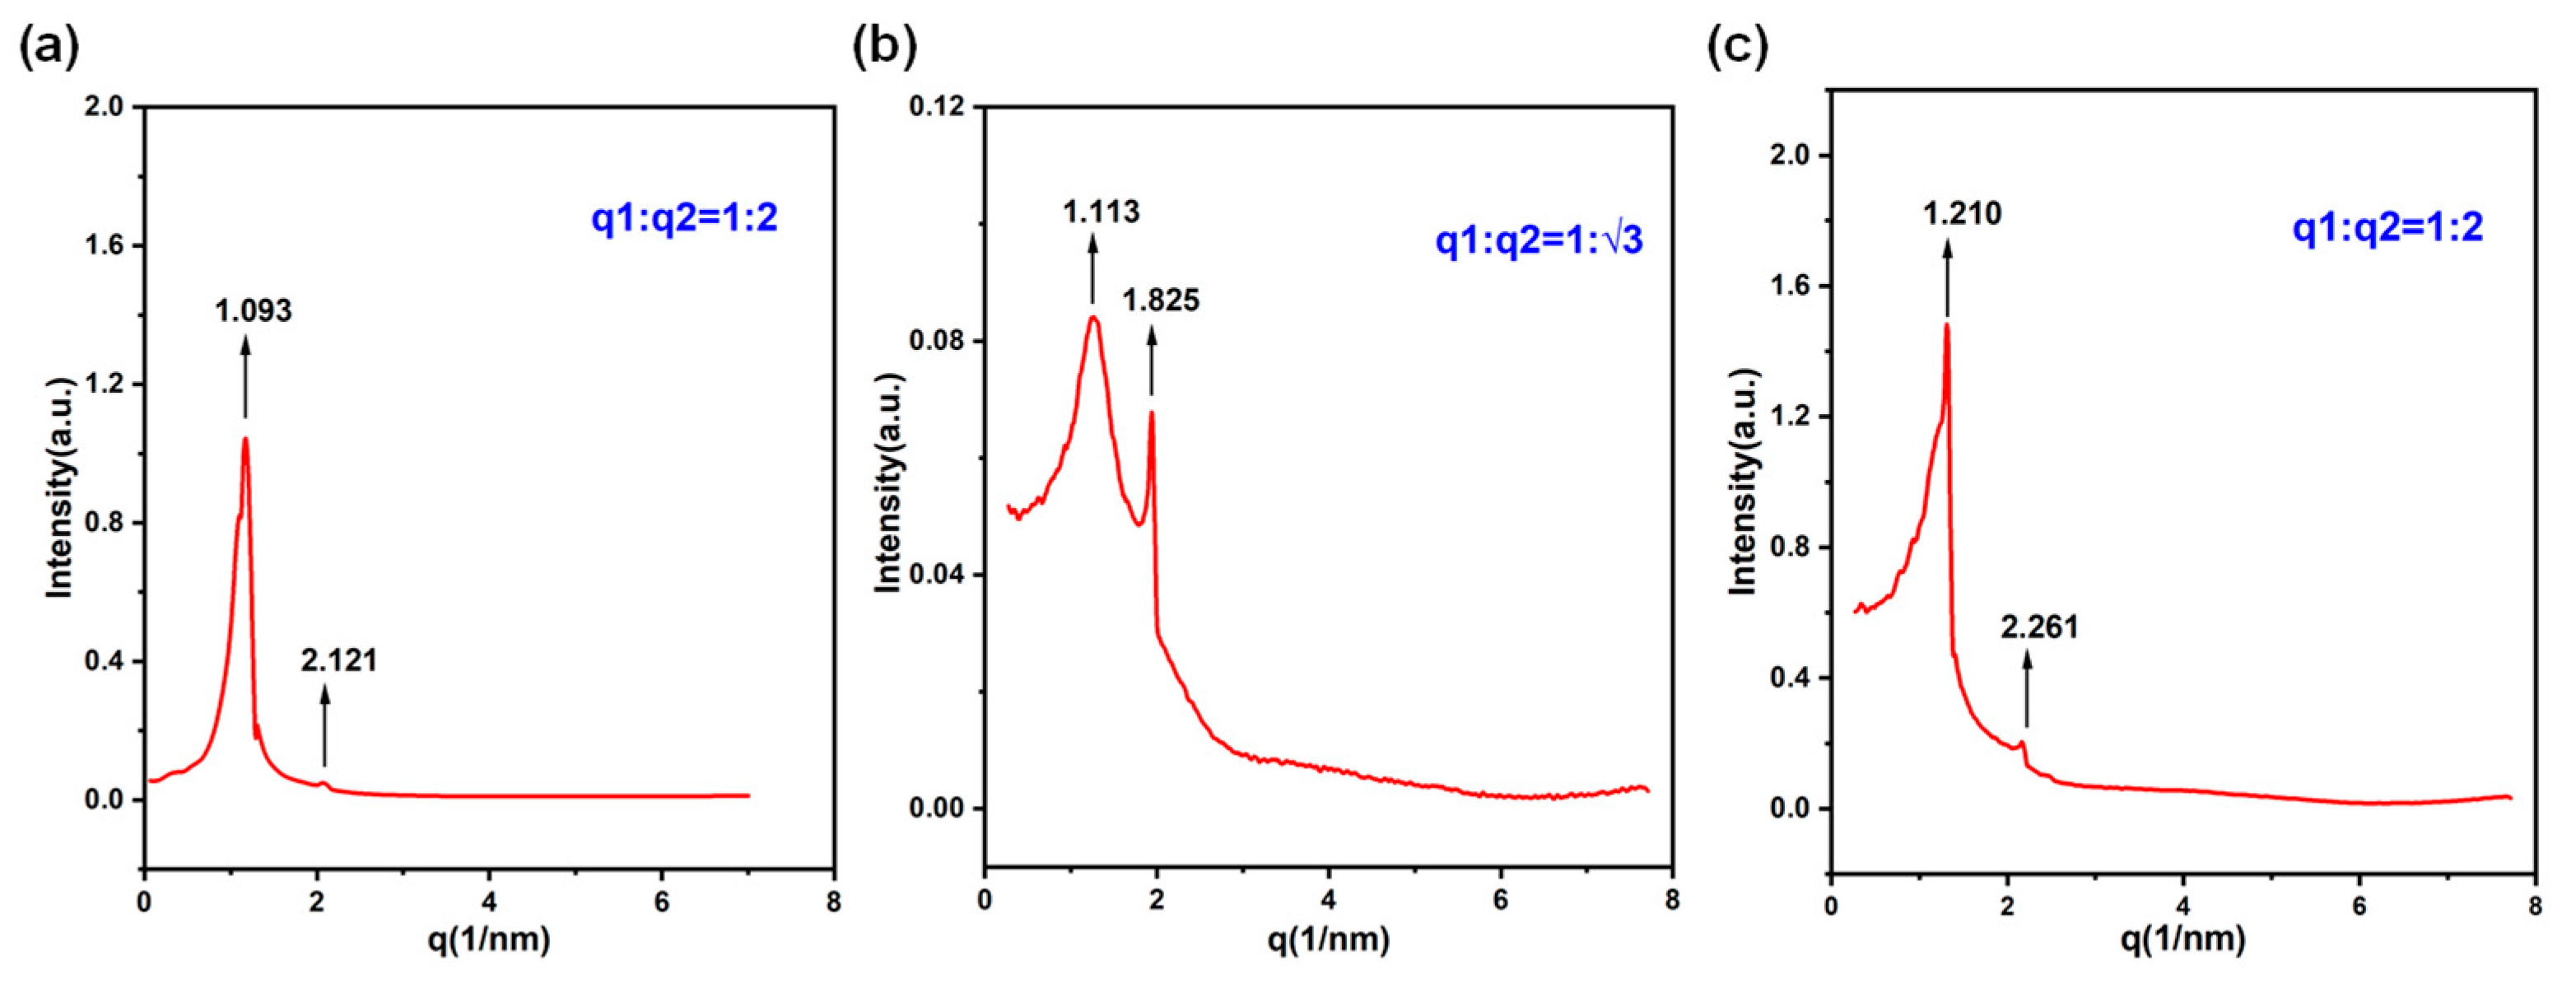
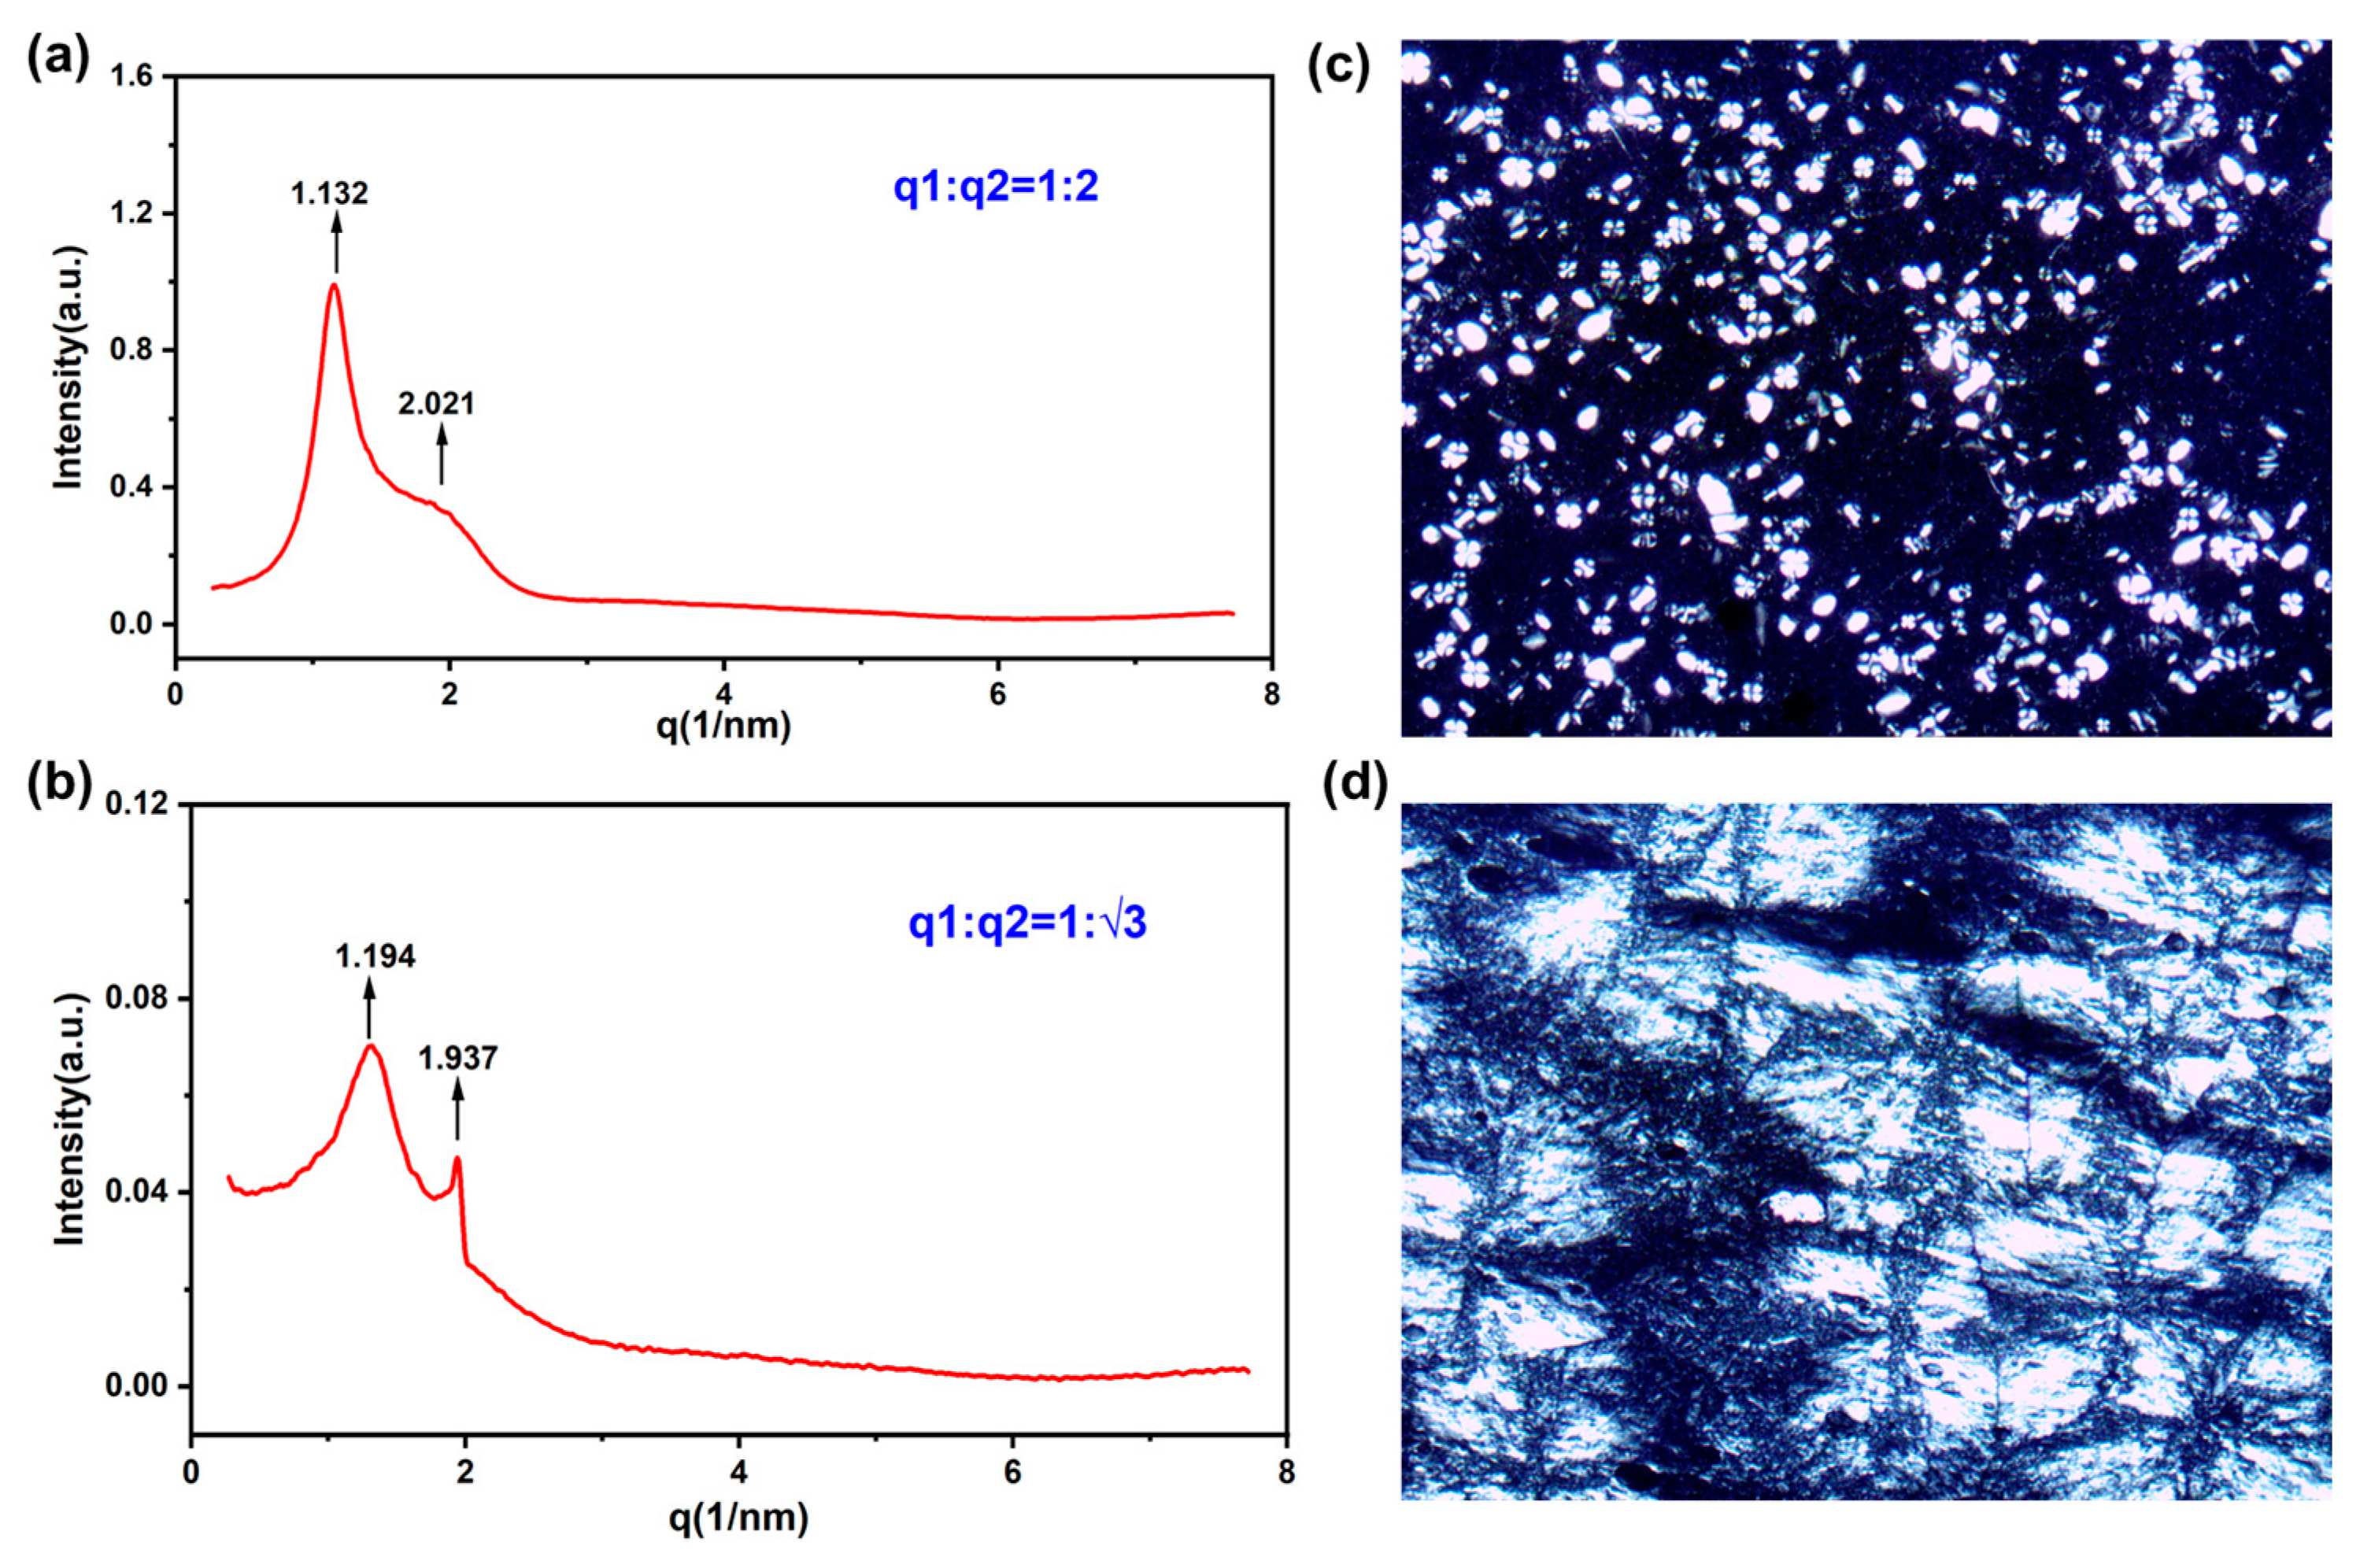
3.2.1. POM and SAXS Results

In comparison to visual observation, polarized light microscopy allows for a more precise determination of the phase state of anisotropic solution samples. Different phases of samples exhibit distinct interference patterns under polarized light, presenting varied texture structures when detected by a polarizer [8,9,10]. Selected representative samples were characterized using polarized light microscopy, and the composition of these samples is provided in Table 4.
The polarized optical microscope images of samples 1–4 are shown in Figure 4. In Figure 4a, the sample appears dark under the polarized microscope, indicating that it belongs to an isotropic solution. Previous visual observations also confirmed the sample to be a clear, colorless solution. Combined with visual observations and polarized microscope characterization, it can be inferred that sample 1 is a micellar solution. Figure 4b exhibits the characteristic “Maltese cross” pattern [68], indicating a layered phase. Figure 4c displays fan-shaped stripes under the polarized microscope, providing strong evidence for the existence of a hexagonal phase, as hexagonal phases exhibit distinctive fan-shaped textures under polarized microscopy. Figure 4d shows pronounced oily streaks, suggesting that sample 4 likely belongs to a layered phase. However, it should be noted that polarized microscopy characterizes the samples optically, providing only one perspective on their phase behavior. To further confirm the results obtained from polarized microscopy, additional characterization using small-angle X-ray scattering (SAXS) is necessary.
For samples in the POM characterization results where birefringence phenomenon is not observed, they can be classified as micellar phase solutions. Both polarized light microscopy and viscosity measurements indicate their isotropic nature. Sample 1 falls into the category of micellar phase solution, thus negating the necessity for SAXS characterization.
The small-angle X-ray scattering (SAXS) characterization results of samples 2, 3, and 4 were analyzed by calculating the ratios between the Bragg peaks to determine the phase states of the samples. As depicted in Figure 5a, the ratio of the scattering vector q at the Bragg peak positions is 1:2, which is a characteristic ratio for layered phases. Combined with the “Maltese cross” pattern [68] observed in the POM (polarized optical microscope) image in Figure 4b, it can be inferred that sample 2 exhibits a layered phase. In Figure 5b, the ratio of the scattering vector q at the Bragg peak positions is 1:√3, which is a characteristic ratio for hexagonal phases. This observation, coupled with the fan-shaped texture seen in the POM image in Figure 4c, indicates that sample 3 displays a hexagonal phase. Similarly, in Figure 5c, the ratio of the scattering vector q at the Bragg peak positions is 1:2, in line with the oily streaks observed in the POM image in Figure 4d, suggesting that sample 4 adopts a layered phase. This interpretation integrates the small-angle X-ray scattering (SAXS) data with the polarized optical microscopy (POM) images, providing comprehensive insights into the phase behavior of the samples.

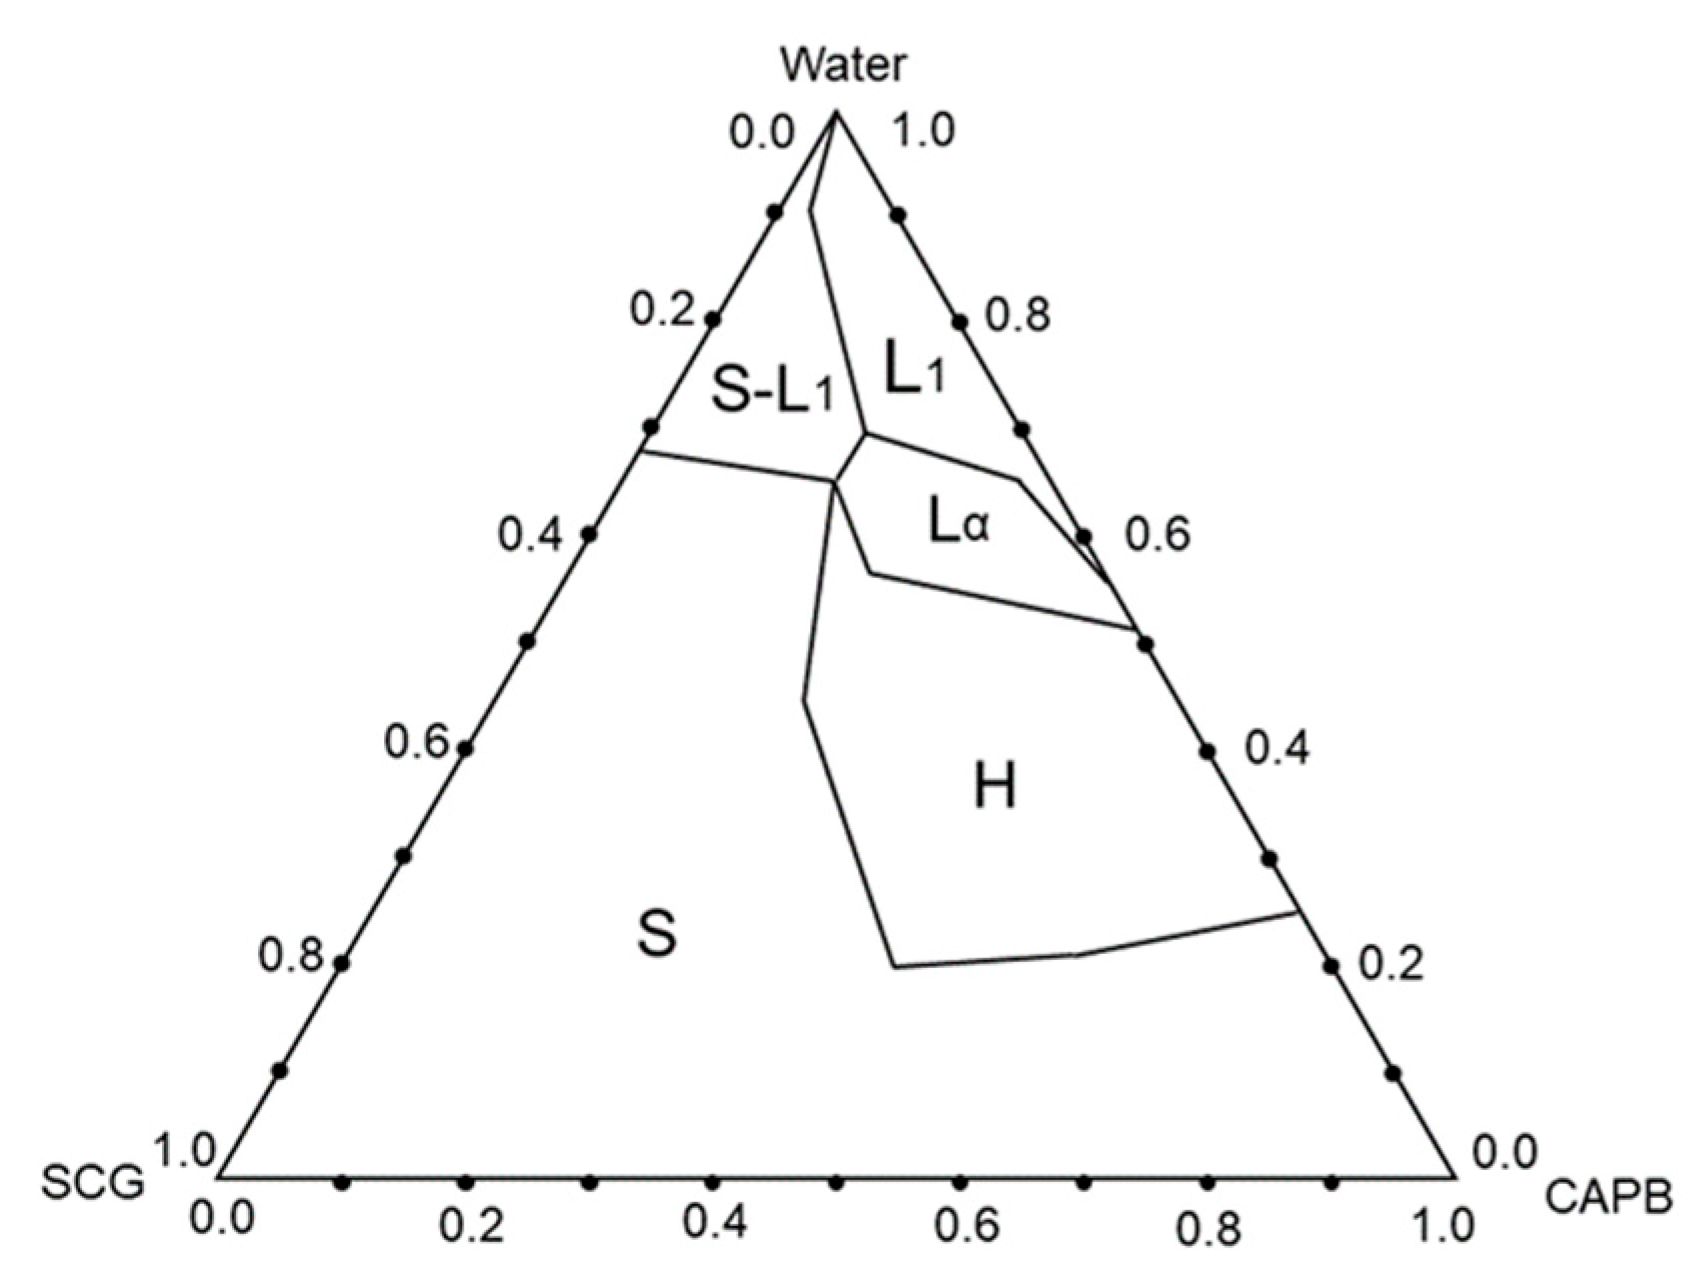
3.2.2. Phase Diagram of SCG/CAPB/H2O Ternary Compound System

Based on the previous research results of this study, a phase diagram of the SCG/CAPB/H2O ternary system at 25 °C was constructed, as depicted in Figure 6. In Figure 6, S represents the solid phase, L1 represents the micellar phase, Lα represents the lamellar phase, and H represents the hexagonal phase. It can be observed that the SCG/CAPB/H2O ternary system exhibits rich phase behavior, featuring one miscible phase, one micellar phase, two liquid crystal phases, and one solid phase.
Due to the low temperature (25 °C), significantly below the Krafft point of SCG (36 °C), SCG exhibits low solubility and cannot completely dissolve in water. Therefore, undissolved surfactants swell in water, existing in the form of hydrated crystals in the aqueous solution. On the other hand, CAPB has higher solubility and can fully dissolve in water to form a micellar solution at low concentrations. A single SCG aqueous solution tends to form a micelle–solid phase, resembling a suspension macroscopically. In contrast, a single CAPB aqueous solution readily forms a micellar phase, and due to the anisotropic physical properties of micellar solutions, its clear and transparent solution state is easily observed.
However, when the two solutions are mixed, diverse results are observed due to the varying relative content of SCG and CAPB. With increasing CAPB content in the samples, the less soluble solid surfactant gradually dissolves in the solution until a homogeneous micellar phase solution is formed. This is likely due to the electrostatic interaction between the cationic part of CAPB and the anionic part of SCG, leading to mutual attraction between the head groups of the two molecules and facilitating the entry of SCG molecules into the gaps formed by CAPB micelles, thus increasing the solubility of SCG in water. Furthermore, the total mass fraction of surfactants also significantly affects the phase behavior of the solution. As the total mass fraction of surfactants gradually increases, the solution successively exhibits lamellar and hexagonal phases.

3.2.3. Mechanism of Phase Transition over SCG/CAPB/H2O System

In order to investigate the phase transition mechanism between different phases of SCG/CAPB/H2O system, a series of samples were selected as the research objects. The mass fraction, phase state, and viscosity of each component of samples 5–10 are shown in Table 5.
Sample 5 belongs to the region of mixed micelle–solid phase in the phase diagram. In this region, SCG has not completely dissolved, and undissolved surfactant monomers form hydrated crystals due to hydration and remain freely dispersed in the aqueous solution. Viscosity testing was conducted on the sample, revealing that the viscosity of sample 5 is approximately 100 times that of sample 6. This could be attributed to the increased relative content of CAPB in the solution. The cationic head groups of CAPB may exert strong electrostatic attraction on the anionic head groups of SCG molecules, weakening the hydrogen bonding interactions between SCG monomers and leading to the rupture of intermolecular hydrogen bonds. As a result, the electrostatic interaction attracts SCG molecules into the interior of CAPB micelles, increasing the solubility of SCG and reducing the resistance to relative sliding between hydrated crystals, thereby decreasing viscosity.
Through POM, SAXS, and viscosity testing, it was observed that although samples 6 and 7 belong to the micellar phase, the viscosity of the solution increases with the higher relative content of CAPB. This is because at this stage, both the number and size of CAPB micelles increase, leading to an increase in relative sliding resistance between particles in the solution. When the relative content of CAPB further increases in the solution, a significant phase transition occurs from the micellar phase of sample 7 to the lamellar phase of sample 8. It is speculated that the increasing compression between micelles prevents them from maintaining their original spherical shape, and combined with the strong hydrophobic effect of SCG molecular head groups, the micelles gradually transform into a lamellar phase.
Samples 9 and 10 were subjected to small-angle X-ray scattering, and the SAXS results are presented in Figure 7. Based on the scattering vector q corresponding to the first Bragg peak, the interlayer spacing (d) for the layered phase and the distance (dH) between cylindrical layers in the hexagonal phase were calculated using (d = 2π/q) and (dH = 4π/√3q), respectively. The calculations yielded an interlayer spacing (d) of 5.5477 nm for sample 9 and a distance (dH) between cylindrical layers of 6.0733 nm for sample 10. This indicates that with an increase in the relative content of SCG, the system transitions from a layered phase to a hexagonal phase, and the distance between the liquid crystal phases increases. This increase is speculated to be due to the stronger interactions between SCG and CAPB molecules, leading to a denser arrangement of SCG and CAPB within the cylindrical layers.

4. Conclusions

In this study, we extensively investigated the physical properties of sodium cocoyl glycinate (SCG), including critical micelle concentration (CMC), Krafft point, and critical packing parameter (CPP). The synergistic effect of the SCG/CAPB surfactant complex system was examined, and the synergistic parameters of the complex system were determined based on the critical micelle concentration under different blending ratios (X1) obtained using a surface tension meter. It was observed that the interaction between SCG and CAPB in mixed micelles and mixed monolayers is stronger than the interaction of individual surfactants alone. Moreover, the surface activity of the SCG/CAPB complex system was significantly superior to that of the SCG system, with the CMC and γ C M C of the SCG/CAPB complex system being much lower than those of the SCG system. These findings collectively suggest that the combination of SCG and CAPB surfactants yields superior results compared to using a single surfactant.
Furthermore, the phase behavior of the SCG/CAPB/H2O ternary system was investigated in detail. Solutions with different mass fractions of surfactants exhibited diverse phase behaviors, including micellar phase (L1), micelle–solid mixed phase (L1-S), hexagonal phase (H), and lamellar phase (Lα). Overall, when the mass fraction of SCG in the solution is relatively high, due to its poor solubility, undissolved surfactant monomers form hydrated crystals through hydration and remain free in the aqueous solution. Conversely, when the mass fraction of CAPB in the solution is higher, the samples tend to form lamellar or hexagonal phases. During the investigation of the mechanism of phase transition, it was discovered that the cationic head groups of CAPB exert a strong electrostatic attraction on the anionic head groups of SCG molecules, leading to a weakening in the hydrogen bonding interactions between SCG monomers. As a result, electrostatic forces replace the hydrogen bonding interactions, causing the rupture of intermolecular hydrogen bonds.
This study enhances our understanding of surfactant complex systems involving acyl amino acid surfactants, enriches the research on the phase behavior of acyl surfactants, and lays a theoretical foundation for the widespread application of acyl amino acid surfactants.

Author Contributions

Conceptualization, Z.Z.; methodology, Z.Z.; software, Z.Z.; validation, Z.Z. and J.Z.; formal analysis, Z.Z. and F.W.; investigation, Z.Z.; resources, L.D.; data curation, Z.Z. and W.F.; writing—original draft preparation, Z.Z.; writing—review and editing, Z.Z.; visualization, Z.Z.; supervision, H.W.; project administration, L.D.; funding acquisition, H.W. All authors have read and agreed to the published version of the manuscript.

Funding

This research received no external funding.

Institutional Review Board Statement

Not applicable.

Informed Consent Statement

Not applicable.

Data Availability Statement

Data are contained within the article.

Conflicts of Interest

The authors declare no conflicts of interest.

References

  1. Ghosh, S.; Ray, A.; Pramanik, N. Self-assembly of surfactants: An overview on general aspects of amphiphiles. Biophys. Chem. 2020, 265, 106429. [Google Scholar] [CrossRef] [PubMed]
  2. Luo, M.L.; Jia, Z.L.; Sun, H.T.; Liao, L.J.; Wen, Q.Z. Rheological behavior and microstructure of an anionic surfactant micelle solution with pyroelectric nanoparticle. Colloids Surf. A 2012, 395, 267–275. [Google Scholar] [CrossRef]
  3. Panmai, S.; Prud’homme, R.K.; Peiffer, D.G. Rheology of hydrophobically modified polymers with spherical and rod-like surfactant micelles. Colloids Surf. A 1999, 147, 3–15. [Google Scholar] [CrossRef]
  4. Choi, T.S.; Shimizu, Y.; Shirai, H.; Hamada, K. Solubilization of disperse dyes in cationic gemini surfactant micelles. Dyes Pigments 2000, 45, 145–152. [Google Scholar] [CrossRef]
  5. Gong, L.Y.; Liao, G.Z.; Chen, Q.S.; Luan, H.X.; Feng, Y.J. Swollen surfactant micelles: Properties and applications. Acta Phys.-Chim. Sin. 2019, 35, 816–828. [Google Scholar] [CrossRef]
  6. Qiao, W.; Zheng, Z.; Peng, H.; Shi, L. Synthesis and properties of three series amino acid surfactants. Tenside Surfactants Deterg. 2012, 49, 161–166. [Google Scholar] [CrossRef]
  7. Feng, S.H.; Wang, H.X.; Zhang, G.Y.; Xie, X.L. Rheological properties of lyotropic liquid crystal. Prog. Chem. 2004, 16, 687–695. [Google Scholar]
  8. Fong, C.; Le, T.; Drummond, C.J. Lyotropic liquid crystal engineering-ordered nanostructured small molecule amphiphile self-assembly materials by design. Chem. Soc. Rev. 2012, 41, 1297–1322. [Google Scholar] [CrossRef] [PubMed]
  9. Firouzi, A.; Atef, F.; Oertli, A.G.; Stucky, G.D.; Chmelka, B.F. Alkaline lyotropic silicate-surfactant liquid crystals. J. Am. Chem. Soc. 1997, 119, 3596–3610. [Google Scholar] [CrossRef]
  10. Braun, P.V.; Osenar, P.; Tohver, V.; Kennedy, S.B.; Stupp, S.I. Nanostructure templating in inorganic solids with organic lyotropic liquid crystals. J. Am. Chem. Soc. 1999, 121, 7302–7309. [Google Scholar] [CrossRef]
  11. Li, G.Z.; Gu, Q.; Yan, L.C. Study of lyotropic liquid crystal containing nonionic surfactant of AEO-9. Acta Chim. Sin. 2001, 59, 6–10. [Google Scholar]
  12. Alam, M.M.; Matsumoto, Y.; Aramaki, K. Effects of surfactant hydrophilicity on the oil solubilization and rheological behavior of a nonionic hexagonal phase. J. Surfactants Deterg. 2014, 17, 19–25. [Google Scholar] [CrossRef]
  13. Funari, S.S. Induction of a hexagonal phase in phospholipid-surfactant bilayers. Eur. Biophys. J. 1998, 27, 590–594. [Google Scholar] [CrossRef]
  14. Linemann, R.; Lauger, J.; Schmidt, G.; Kratzat, K.; Richtering, W. Linear and nonlinear rheology of micellar solutions in the isotropic, cubic and hexagonal phase probed by rheo-small-angle light-scattering. Rheol. Acta 1995, 34, 440–449. [Google Scholar] [CrossRef]
  15. Liu, C.C.; Wang, X.M.; Lee, S.; Pfefferle, L.D.; Haller, G.L. Surfactant chain length effect on the hexagonal-to-cubic phase transition in mesoporous silica synthesis. Microporous Mesoporous Mater. 2012, 147, 242–251. [Google Scholar] [CrossRef]
  16. Gutberlet, T.; Dietrich, U.; Klose, G.; Rapp, G. X-ray diffraction study of the lamellar-hexagonal phase transition in phospholipid/surfactant mixtures. J. Colloid Interface Sci. 1998, 203, 317–327. [Google Scholar] [CrossRef] [PubMed]
  17. Jiang, L.C.; Basri, M.; Omar, D.; Rahman, M.B.A.; Salleh, A.; Rahman, R. Self-assembly behaviour of alkylpolyglucosides (APG) in mixed surfactant-stabilized emulsions system. J. Mol. Liq. 2011, 158, 175–181. [Google Scholar] [CrossRef]
  18. Xu, Y.; Yu, X.L.; Yan, H.; Wang, Y.; Feng, J. Self-assembly behaviors of heterogemini surfactant in aqueous solution investigated by dissipative particle dynamics. J. Dispers. Sci. Technol. 2014, 35, 1300–1307. [Google Scholar] [CrossRef]
  19. Zhang, J.H.; Zhao, Y.R.; Han, S.Y.; Chen, C.X.; Xu, H. Self-assembly of surfactant-like peptides and their applications. Sci. China-Chem. 2014, 57, 1634–1645. [Google Scholar] [CrossRef]
  20. Svenson, S. Controlling surfactant self-assembly. Curr. Opin. Colloid Interface Sci. 2004, 9, 201–212. [Google Scholar] [CrossRef]
  21. Alzahid, Y.A.; Mostaghimi, P.; Walsh, S.D.C.; Armstrong, R.T. Flow regimes during surfactant flooding: The influence of phase behaviour. Fuel 2019, 236, 851–860. [Google Scholar] [CrossRef]
  22. Zhang, K.W.; Karlstrom, G.; Lindman, B. Phase-behavior of systems of a nonionic surfactant and a nonionic polymer in aqueous-solution. Colloids Surf. 1992, 67, 147–155. [Google Scholar] [CrossRef]
  23. Chen, L.F.; Shang, Y.Z.; Liu, H.L.; Hu, Y. Phase behavior of n-butanol/n-octane/water/cationic gemini surfactant system. J. Dispers. Sci. Technol. 2006, 27, 317–323. [Google Scholar] [CrossRef]
  24. Branco, M.A.; Pinherio, L.; Faustino, C. Amino acid-based cationic gemini surfactant-protein interactions. Colloids Surf. A 2015, 480, 105–112. [Google Scholar] [CrossRef]
  25. Ishwarya, S.P.; Nisha, P. Insights into the composition, structure-function relationship, and molecular organization of surfactants from spent coffee grounds. Food Hydrocoll. 2022, 124, 107204. [Google Scholar] [CrossRef]
  26. Infante, M.R.; Pérez, L.; Pinazo, A.; Clapés, P.; Morán, M.C.; Angelet, M.; García, M.T.; Vinardell, M.P. Amino acid-based surfactants. Comptes Rendus Chim. 2004, 7, 583–592. [Google Scholar] [CrossRef]
  27. FAINERMAN, V.B.; MILLER, R. Dynamic surface tensions of surfactant mixtures at the water-air interface. Colloids Surf. A 1995, 97, 65–82. [Google Scholar] [CrossRef]
  28. Bera, A.; Ojha, K.; Mandal, A. Synergistic effect of mixed surfactant systems on foam behavior and surface tension. J. Surfactants Deterg. 2013, 16, 621–630. [Google Scholar] [CrossRef]
  29. Shalel, S.; Streichman, S.; Marmur, A. Monitoring surfactant-induced hemolysis by surface tension measurement. J. Colloid Interface Sci. 2002, 255, 265–269. [Google Scholar] [CrossRef]
  30. Manyala, D.L.; Varade, D. Formation and characterization of microemulsion with novel anionic sodium n-lauroylsarcosinate for personal care. J. Mol. Liq. 2021, 343, 117657. [Google Scholar] [CrossRef]
  31. Niu, C.; Xia, W.; Li, Y.; Bu, X.; Wang, Y.; Xie, G. Insight into the low-rank coal flotation using amino acid surfactant as a promoter. Fuel 2022, 307, 121810. [Google Scholar] [CrossRef]
  32. Godek, E.; Grzadka, E.; Maciolek, U.; Bastrzyk, A. Influence of zwitterionic CAPB on flocculation of the aqueous cationic guar gum/glauconite suspensions at various pH. Int. J. Mol. Sci. 2021, 22, 12157. [Google Scholar] [CrossRef]
  33. Tzocheva, S.S.; Kralchevsky, P.A.; Danov, K.D.; Georgieva, G.S.; Post, A.J.; Ananthapadmanabhan, K.P. Solubility limits and phase diagrams for fatty acids in anionic (SLES) and zwitterionic (CAPB) micellar surfactant solutions. J. Colloid Interface Sci. 2012, 369, 274–286. [Google Scholar] [CrossRef] [PubMed]
  34. El-Dossoki, F.I.; Abdalla, N.S.Y.; Gomaa, E.A.; Hamza, O.K. An insight into thermodynamic and association behaviours of cocamidopropyl betaine (CAPB) surfactant in water and water-alcohol mixed media. SN Appl. Sci. 2020, 2, 690. [Google Scholar] [CrossRef]
  35. Ganjoo, R.; Sharma, S.; Thakur, A.; Assad, H.; Sharma, P.K.; Dagdag, O.; Berisha, A.; Seydou, M.; Ebenso, E.E.; Kumar, A. Experimental and theoretical study of sodium cocoyl glycinate as corrosion inhibitor for mild steel in hydrochloric acid medium. J. Mol. Liq. 2022, 364, 119988. [Google Scholar] [CrossRef]
  36. Manna, S.; Adak, D.; Manna, S.; Maity, S.; Jana, S.; Bhattacharya, R.; Medda, S.K. Antireflection cum photocatalytic with superhydrophilic based durable single layer mesoporous TiO2-ZrO2 coating surface for efficient solar photovoltaic application. Sustain. Energy Technol. Assess. 2023, 57, 103236. [Google Scholar] [CrossRef]
  37. Grundke, K.; Uhlmann, P.; Gietzelt, T.; Redlich, B.; Jacobasch, H.J. Studies on the wetting behaviour of polymer melts on solid surfaces using the wilhelmy balance method. Colloids Surf. A. 1996, 116, 93–104. [Google Scholar] [CrossRef]
  38. Wu, N.; Dai, J.L.; Micale, F.J. Dynamic surface tension measurement with a dynamic wilhelmy plate technique. J. Colloid Interface Sci. 1999, 215, 258–269. [Google Scholar] [CrossRef] [PubMed]
  39. Luo, R.; Zhang, D.R.; Zeng, Z.; Lytton, R.L. Effect of surface tension on the measurement of surface energy components of asphalt binders using the wilhelmy plate method. Constr. Build. Mater. 2015, 98, 900–909. [Google Scholar] [CrossRef]
  40. Inoue, T.; Dong, B.; Zheng, L.Q. Phase behavior of binary mixture of 1-dodecyl-3-methylimidazolium bromide and water revealed by differential scanning calorimetry and polarized optical microscopy. J. Colloid Interface Sci. 2007, 307, 578–581. [Google Scholar] [CrossRef]
  41. Zhang, S.H.; Yuan, J.; Ma, H.C.; Li, N.; Zheng, L.Q.; Inoue, T. Aqueous phase behavior of ionic liquid-related gemini surfactant revealed by differential scanning calorimetry and polarized optical microscopy. Colloid Polym. Sci. 2011, 289, 213–218. [Google Scholar] [CrossRef]
  42. Ma, G.Q.; Yuan, X.B.; Sheng, J. Phase structure in blends of polypropylene with ethylene-propylene rubber: A study by small angle X-ray scattering. Acta Polym. Sin. 2002, 1, 63–67. [Google Scholar]
  43. Lang, P.; Marczuk, P.; Lermann, E.; Möller, M. Gels of semifluorinated alkanes: Structural investigations by small angle X-ray scattering. Berichte Bunsen-Ges.-Phys. Chem. Chem. Phys. 1998, 102, 1644–1647. [Google Scholar] [CrossRef]
  44. Nishikawa, K.; Morita, T. Fluid behavior at supercritical states studied by small-angle X-ray scattering. J. Supercrit. Fluids 1998, 13, 143–148. [Google Scholar] [CrossRef]
  45. Lin, T.L.; Yu, T.L.; Liu, W.J.; Tsai, Y.M. Phase segregation of crosslinked polyurethane by small angle X-ray scattering. Polym. J. 1999, 31, 120–126. [Google Scholar] [CrossRef]
  46. Rafique, A.S.; Khodaparast, S.; Poulos, A.S.; Sharratt, W.N.; Robles, E.S.; Cabral, J.T. Micellar structure and transformations in sodium alkylbenzenesulfonate (NaLAS) aqueous solutions: Effects of concentration, temperature, and salt. Soft Matter 2020, 16, 7835–7844. [Google Scholar] [CrossRef] [PubMed]
  47. Zhang, G.; Xu, B.; Han, F.; Zhou, Y.; Liu, H.; Li, Y.; Cui, L.; Tan, T.; Wang, N. Green synthesis, composition analysis and surface active properties of sodium cocoyl glycinate. Am. J. Anal. Chem. 2013, 4, 445–450. [Google Scholar] [CrossRef]
  48. Yea, D.; Lee, S.; Jo, S.; Yu, H.; Lim, J. Preparation of environmentally friendly amino acid-based anionic surfactants and characterization of their interfacial properties for detergent products formulation. J. Surfactants Deterg. 2018, 21, 541–552. [Google Scholar] [CrossRef]
  49. Danov, K.D.; Kralchevska, S.D.; Kralchevsky, P.A.; Ananthapadmanabhan, K.P.; Lips, A. Mixed solutions of anionic and zwitterionic surfactant (betaine): Surface-tension isotherms, adsorption, and relaxation kinetics. Langmuir 2004, 20, 5445–5453. [Google Scholar] [CrossRef]
  50. Ouverney Ferreira, M.; Câmara de Assis, H.F.; Percebom, A.M. Cocamidopropyl betaine can behave as a cationic surfactant and electrostatically associate with polyacids of high molecular weight. Colloid Surf. A-Physicochem. Eng. Asp. 2022, 654, 130123. [Google Scholar] [CrossRef]
  51. Wilson, K.M.; Danielson, N.D. Micellar and sub-micellar chromatography with a cocamidopropyl betaine surfactant. J. Chromatogr. A 2022, 1681, 463442. [Google Scholar] [CrossRef] [PubMed]
  52. Sarkar, R.; Pal, A.; Rakshit, A.; Saha, B. Properties and applications of amphoteric surfactant: A concise review. J. Surfactants Deterg. 2021, 24, 709–730. [Google Scholar] [CrossRef]
  53. Yavrukova, V.I.; Radulova, G.M.; Danov, K.D.; Kralchevsky, P.A.; Xu, H.; Ung, Y.W.; Petkov, J.T. Rheology of mixed solutions of sulfonated methyl esters and betaine in relation to the growth of giant micelles and shampoo applications. Adv. Colloid Interface Sci. 2020, 275, 102062. [Google Scholar] [CrossRef] [PubMed]
  54. Staszak, K.; Wieczorek, D.; Michocka, K. Effect of sodium chloride on the surface and wetting properties of aqueous solutions of cocamidopropyl betaine. J. Surfactants Deterg. 2015, 18, 321–328. [Google Scholar] [CrossRef]
  55. Dai, C.; Zhao, J.; Yan, L.; Zhao, M. Adsorption behavior of cocamidopropyl betaine under conditions of high temperature and high salinity. J. Appl. Polym. Sci. 2014, 131, 40424. [Google Scholar] [CrossRef]
  56. Kareem, S.H.; Sattar, B. Adsorption properties for aqueous solution of binary mixture of cocamidopropyl betaine-sodiumdodecyl sulfate surfactants on air-liquid interface. Int. J. Sci. 2015, 24, 50–58. [Google Scholar]
  57. Kamrath, R.F.; Franses, E.I. Thermodynamics of mixed micellization. Pseudo-phase separation models. Ind. Eng. Chem. Fundam. 1983, 22, 230–239. [Google Scholar] [CrossRef]
  58. Shinoda, K.; Hutchinson, E. Pseudo-phase separation model for thermodynamic calculations on micellar solutions1. J. Phys. Chem. 1962, 66, 577–582. [Google Scholar] [CrossRef]
  59. Chen, Z.-X.; Deng, S.-P.; Li, X.-K. Micellization and synergistic interaction of binary surfactant mixtures based on sodium nonylphenol polyoxyethylene ether sulfate. J. Colloid Interface Sci. 2008, 318, 389–396. [Google Scholar] [CrossRef]
  60. Donohue, M.D.; Aranovich, G.L. A new classification of isotherms for gibbs adsorption of gases on solids. Fluid Phase Equilib. 1999, 158, 557–563. [Google Scholar] [CrossRef]
  61. Zhang, S.M. Gibbs adsorption isotherm for concentration as variable. Surf. Rev. Lett. 2005, 12, 379–389. [Google Scholar] [CrossRef]
  62. Donohue, M.D.; Aranovich, G.L. Classification of gibbs adsorption isotherms. Adv. Colloid Interface Sci. 1998, 76, 137–152. [Google Scholar] [CrossRef]
  63. Rosen, M.J.; Kunjappu, J.T. Surfactants and Interfacial Phenomena, 4th ed.; Wiley: Hoboken, NJ, USA, 2004; pp. 60–62. [Google Scholar]
  64. Israelachvili, J.N.; Mitchell, D.J.; Ninham, B.W. Theory of self-assembly of hydrocarbon amphiphiles into micelles and bilayers. J. Chem. Soc. Faraday Trans. 2 Mol. Chem. Phys. 1976, 72, 1525–1568. [Google Scholar] [CrossRef]
  65. Tanford, C. Micelle shape and size. J. Phys. Chem. 1972, 76, 3020–3024. [Google Scholar] [CrossRef]
  66. Holland, P.M.; Rubingh, D.N. Nonideal multicomponent mixed micelle model. J. Phys. Chem. 1983, 87, 1984–1990. [Google Scholar] [CrossRef]
  67. Rubingh, D.N. Mixed Micelle Solutions. In Solution Chemistry of Surfactants; Mittal, K.L., Ed.; Springer New York: Boston, MA, USA, 1979; Volume 1, pp. 337–354. [Google Scholar]
  68. Park, B.D.; Youm, J.K.; Jeong, S.K.; Choi, E.H.; Ahn, S.K.; Lee, S.H. The characterization of molecular organization of multilamellar emulsions containing pseudoceramide and type iii synthetic ceramide. J. Investig. Dermatol. 2003, 121, 794–801. [Google Scholar] [CrossRef]
Figure 1. Molecular structure of materials: (a) sodium cocoyl glycinate (SCG), (b) cocamidopropyl betaine (CAPB).
Applsci 14 03081 g001
Figure 2. The correlation between surface tension (γ) and the logarithm of concentration (logC) over different ratios ( X 1 ) of the binary SCG/CAPB system.
Applsci 14 03081 g002
Figure 3. Transmittance of sodium cocoyl glycinate as a function of temperature.
Applsci 14 03081 g003
Figure 4. Results of polarized light microscopy characterization of different samples at 25 °C: (a) sample 1; (b) sample 2; (c) sample 3; (d) sample 4.
Applsci 14 03081 g004
Figure 5. The SAXS results of different samples: (a) sample 2; (b) sample 3; (c) sample 4.
Applsci 14 03081 g005
Figure 6. Phase diagram of SCG/CAPB/H2O ternary system.
Applsci 14 03081 g006
Figure 7. The SAXS results of (a) sample 9 and (b) sample 10; the polarized light microscopy characterization of (c) sample 9 and (d) sample 10.
Applsci 14 03081 g007
Table 1. CMC, CMC*, γ C M C , and pC20 values for different molar fractions (X1) of the SCG/CAPB mixed system.
X1CMC (mmol·L−1)CMC* (mmol·L−1)γCMC (mN·m−1)pC20
00.974-32.84.69
0.20.1722.12425.94.21
0.40.1481.64026.84.36
0.60.1521.33626.74.38
0.80.1851.12722.44.41
13.013-29.33.62
Table 2. Physical properties of sodium cocoyl glycinate.
ParameterValue
Krafft point ( ) 36
Γ m a x   ( μ m o l · m 2 ) 3.085
A m i n   ( n m 2 ) 0.538
CPP0.7935
Table 3. The interaction parameter (β) for the SCG/CAPB system.
X 1 X 1 m X 1 σ β m β σ l n C 1 m C 2 m l n C 1 s C 2 s β σ β m l n C 2 m C 1 s C 1 m C 2 s
0.20.4900.529−10.112−12.531−1.124−0.902−2.4190.222
0.40.5310.558−9.854−12.152−2.298
0.60.5670.583−9.606−11.685−2.079
0.80.6120.631−9.254−11.012−1.758
Table 4. The composition of typical samples.
Sample No.SCG (wt%)CAPB (wt%)H2O (wt%)
151085
254055
3154540
4152560
Table 5. Mass fraction, phase state, and viscosity of each component of Sample 5–10.
Sample No.SCG (wt%)CAPB (wt%)H2O (wt%)PhaseViscosity (Pa·S)
515580S-L10.5168
651580L10.0072
752570L10.0176
8103060Lα1.1907
9103555Lα6.7612
10153550H16.3508
Disclaimer/Publisher’s Note: The statements, opinions and data contained in all publications are solely those of the individual author(s) and contributor(s) and not of MDPI and/or the editor(s). MDPI and/or the editor(s) disclaim responsibility for any injury to people or property resulting from any ideas, methods, instructions or products referred to in the content.

