Article

Enhanced Design of Sunroof System through Parametric Study Considering Vibration Phenomenon during Vehicle Operation

1
Korea Intelligent Automotive Parts Promotion Institute, Daegu 43011, Republic of Korea
2
School of Mechanical Engineering, Yeungnam University, Gyeongsan-si 38541, Republic of Korea
*
Author to whom correspondence should be addressed.
Appl. Sci. 2024, 14(7), 3085; https://doi.org/10.3390/app14073085
Submission received: 28 February 2024 / Revised: 1 April 2024 / Accepted: 4 April 2024 / Published: 6 April 2024
(This article belongs to the Section Acoustics and Vibrations)

Abstract

:
Recently, performance development related to noise, vibration, and harshness in sunroof systems has attracted significant research attention. However, research thus far has been limited to analytical and experimental studies relating to structural improvement of the individual parts, rather than considering vehicle driving conditions. This study compared the experimental data from actual driving tests with simulation results to examine sunroof vibration characteristics under realistic conditions. Firstly, the characteristics of sunroof vibrations were investigated theoretically in order to derive equations of motion and the natural frequencies of the sunroof. Sunroof vibrations occurring during driving were analyzed through experimental modal analysis and operational deflection shape. A parametric study was conducted adapting design parameters such as the Young’s modulus, glass thickness, and bracket location. The vibration characteristics of the sunroof glass could be improved by changing the support points of the front and rear brackets, which represent the design elements that can achieve the greatest efficiency with minimal design changes.

1. Introduction

1.1. Research Background

In recent years, automotive vehicles have become integral to daily life as economy and technology have progressed, and people’s living standards have increased. Consequently, they are required to perform many functions in addition to their primary transportation function. In addition to providing ventilation and comfort for passengers, sunroof systems also cater to consumers’ aesthetic preferences by furnishing a sensibly open interior. As a result, an elevated level of consumer interest has led to an increased demand for superior-quality sunroofs [1].
The noise, vibration, and harshness (NVH) performance of sunroofs has become a vital aspect of development, as consumer demands for sunroofs have expanded to encompass emotional quality in addition to operational quality and durability. Sunroof vibrations can affect the functionality and durability of the entire system. Hence, research must be devoted to reducing vibration during vehicle operation. As a result, considerable research has focused on the optimal structural design and structural analysis of automotive sunroof systems in order to reduce vibrations and improve the NVH performance through increased dynamic and static rigidity.

1.2. Related Literature

Lee et al. [2] performed finite element analysis (FEA) using viscoelastic patches as a passive control measure to mitigate vibrations from dynamic systems. They compared the results with the experimental modal analysis (EMA) results on the vehicle roof, which were reliable. The most advantageous placement of patches was also suggested for weight-adjusted damping performance, by minimizing the area and position of the viscoelastic patches. Choi et al. investigated the reliability of the jig stiffness test and structural analysis concerning the internal and external structure of the vehicle sunroof system as induced by pressure differences [3]. An approximately 13% discrepancy was verified in relation to the experimental findings via finite element method (FEM) structural analysis conducted with Abaqus. Hwang et al. conducted modal analysis and vibration experiments on sunroofs for heavy construction equipment to evaluate their structural stability under dynamic driving conditions and specific structural conditions [4]. The principal vibration range commonly encountered by heavy construction equipment was established at 50 Hz, with an acceleration of 0.3 G implemented. The reliability of both was ensured according to the inherent vibration frequencies observed in the test and analysis. Ha et al. [5] sought to simplify the assembly process while increasing the structural rigidity of tubeless frame sunroof components by optimizing the design and analysis. The researchers employed structural stress analysis. Their new method resulted in an approximately 43.6% reduction in displacement and a 54.7% decrease in stress.
Woo and Jeong examined the changes in the operational load and operating time of the sunroof system by investigating the causal factors of the operating load and resistance factors on panoramic sunroofs for structural optimization [6]. They reported that the motor load resulting from the tilt lever resistance to the side molding trim seal and rear glass seal was a substantial factor. The tilting mechanism and structure were changed to reduce their counterforce, and the counterforce torque decreased by an average of 20% compared to the prior design. Kim et al. [7] examined the rigidity and dynamic properties of sliding and panoramic sunroof frames. Dynamic stiffness analysis and testing were performed on the sunroof panel components of each type under a distributed load of 1000 N. Resonant frequencies from the first to fifth order were derived experimentally and compared with the analytical resonant frequencies. Kim et al. [8] conducted experimental modal analysis to evaluate the dynamic properties of vehicle tuning components. They obtained the modal parameters, including the mode frequency, mode shape, and modal attenuation. The modes of the vehicle components were identified using the mode indicator function (MIF) technique on measured frequency response function (FRF) data. In addition, Choi et al. [9] assessed the development of a Hub composite park lock wheel and performed dynamic characteristic analysis on the structure. Their modal analysis anticipated its vibration characteristics; this was achieved through constructing a three-dimensional finite element model and comparing it with the results obtained from modal testing. Lee et al. [10] investigated mount resonance avoidance by analyzing the dynamic characteristics of a water injection pump system. After evaluating the potential resonance at the 7X component derived from axial dynamic characteristic analysis, experimental measurements at approximately 107 Hz confirmed the casing resonance. They reinforced the mounts of vulnerable components, such as the lube oil system and pedestal, to increase rigidity and suggested modifications to the design to eliminate resonance frequency bands. Huang et al. [11] proposed a comprehensive design strategy for a fixed sunroof system with a robust assembly process. Utilizing experimental and finite element analysis, the relationship between loading force, the structure, and the materials was established in order to optimize the assembly process and enhance interference performance.
The sunroof is a part mounted on the chassis of the vehicle body and is in direct contact with the air outside the vehicle when driving. Therefore, aerodynamic noise and structural vibration due to flow may occur. Several studies related to this have been conducted. He et al. [12] presented a vortex simulation method and applied it to calculate sunroof buffeting. Their results showed that the most severe sunroof buffeting occurs at the indoor resonant frequency. Vortices flow out of the leading edge and hit the rear edge of the sunroof opening, causing strong pressure fluctuations inside the cabin. A deflector with a gap and notched upper edge reduces sunroof buffeting. Riedelsheimer et al. [13] developed a simplified car model based on the outcomes of numerous experiments examining sunroof buffeting. Helmholtz frequencies generated by vortex formation in the sunroof aperture are most significantly impacted by the structural mode of the body segments. By validating this model with acoustic and flow measurements, the frequency of buffeting and the level of noise can be predicted. He et al. and Zhang et al. [14,15] proposed a practical simulation approach that utilizes large eddy simulation to analyze the buffeting characteristics of a vehicle’s sunroof equipped with a castellated deflector. In close proximity to the leading edge of the sunroof, a sloping baffle was attached to form a subcavity designed to mitigate the sound pressure level. Tang et al. and Li et al. [16,17] suggested a design process to solve the sunroof buffeting noise problem. In this design process, the small vortices at the front of the sunroof were merged into a large vortex, and as the turbulent vortices moved over the sunroof, they caused a resonant response in the cab space. Noise generated from the sunroof can be reduced by optimizing existing accessories to improve the flow field characteristics. Vijaykumar et al. [18] proposed a flow control method for solving sunroof buffeting via geometric modifications. Pressure oscillations were significantly reduced by placing a protrusion near the leading edge of the cavity. As the distance from the leading edge to the protrusion decreased, the sound pressure level also decreased. The flow characteristics were also examined by Lee et al. [19], specifically in relation to the angle of the panoramic sunroof mesh deflector, and their impact on aerodynamic noise was confirmed. In comparison to the pre-existing deflector, the upward and uniform flow direction of the forward-inclined deflector reduced noise. Efforts to reduce vehicle weight are also being applied to sunroofs through the application of methods such as the use of honeycomb paper in some awnings; however, this causes increased sensitivity to vibrations and produces a buzzing noise [20]. The key to solve this problem is to design a sunshade interfering with the front frame, so that the effort to open and close it is not excessive. Nandagiri et al. [21] examined the aerodynamics of the vehicle along its streamlined profile in order to investigate the velocity field of the interior air and the drag force on the vehicle when the sunroof is open. Speed profiles and drag coefficients were evaluated for the sunroof. Cao et al. [22] performed dynamic mode decomposition (DMD) to investigate the characteristics of the sunroof structure. They found that pressure fluctuations between the center and trailing edge of the sunroof are caused by the vortices, and the vibration is caused by the vortices protruding from the trailing edge.

1.3. Objectives

A careful examination of the abovementioned case studies revealed the substantial research effort that has been made to mitigate vibrations in automobile sunroofs and guarantee their structural integrity. Many research endeavors have been undertaken to reduce vibration and improve the structural soundness of automotive sunroofs. These endeavors have employed experimental and analytical methods, with the latter being supported by test data to ensure the consistency and dependability of the experimental and analytical findings. Nevertheless, limited research has been conducted on the structural rigidity and vibration durability of sunroofs in their individual states, as opposed to while the vehicle is in motion. This suggests that there is a limitation in accurately representing the vibration characteristics of sunroofs in different driving environments. Vehicle sunroofs are a unified system integrated into a vehicle and demonstrate fluctuating vibration properties in response to driving conditions. Therefore, structural enhancements and research to mitigate vibrations must be undertaken by measuring and testing sunroof vibrations while the vehicle is in motion with the sunroof mounted.
As a result, this study examined the characteristics and magnitude of vibrations in vehicle sunroofs, taking the operational environment of the vehicle into account. Analytical methods were employed to establish the dependability of experimental and analytical data, while analytical simulations were used to propose an optimal design for mitigating vibrations in vehicle sunroofs while in operation. To ascertain the natural frequency of the sunroof systems, the thin plate theory was examined initially, and was then modified appropriately to account for the structure’s vibration characteristics. In addition, natural frequencies and vibration characteristics were determined through EMA and operational deflection shape (ODS) tests, and the outcomes of these tests were contrasted with the results obtained from computational structure analysis. Upon demonstrating a satisfactory level of concurrence, it was possible to ascertain that the vibration analysis model pertaining to a given sunroof structure corresponded to the experimental findings and supported the related theoretical conclusions. Subsequently, a parametric study was conducted on the analysis model to ascertain the direction of design modification in accordance with the findings. Figure 1 shows the flowchart depicting the general process of the employed methodologies.
The remainder of this paper is organized as follows. Section 2 expounds on thin plate theory, concerning the vibration of planar surfaces, such as the glass of vehicle sunroofs. Experimental vibration measurement methods, including modal analysis, EMA, and ODS, are described in Section 3. Section 4 examines structural enhancement via analysis and simulation results. Section 5 concludes with a discussion of future endeavors.

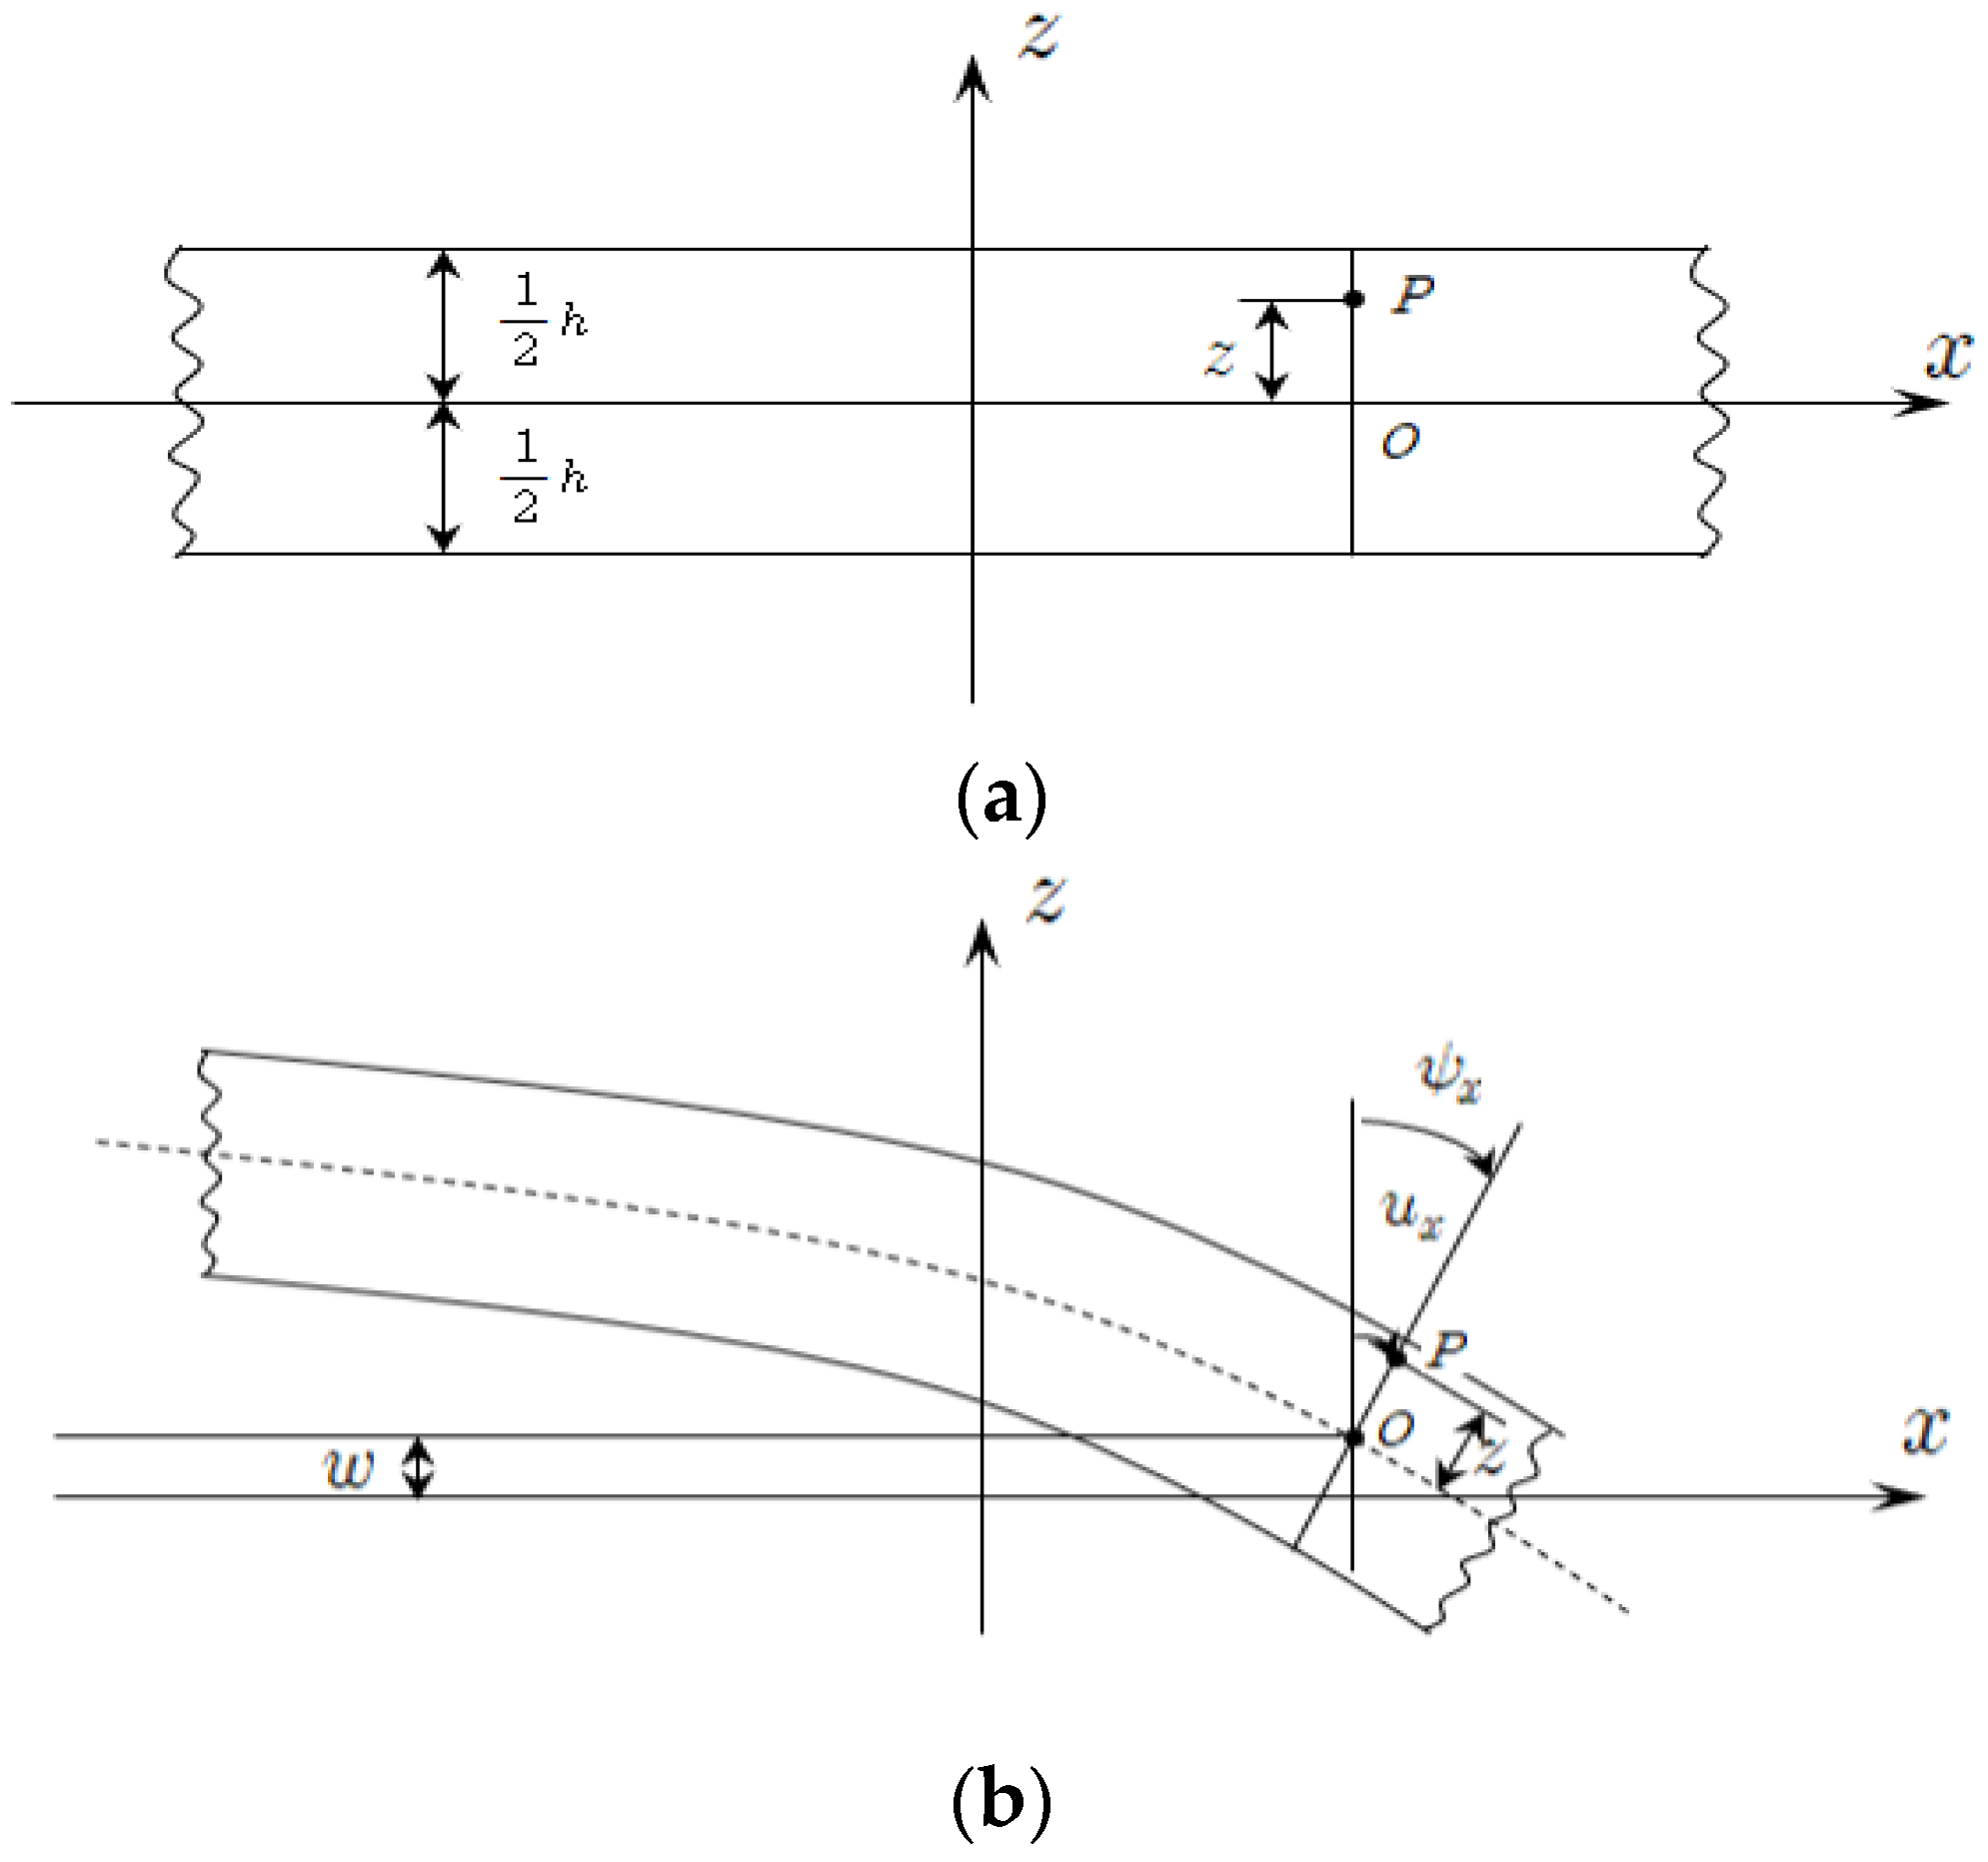
2. Thin Plate Theory

The structure of a vehicle sunroof can be roughly divided into six parts: motor, glass, mechanism, frame assembly, sunshade, and deflector, as shown in Figure 2.
The glass component is a narrow, flat plate structure with a significant surface area, being one of the sunroof structures. It is susceptible to vibration due to the exciting force transmitted from the vehicle body during operation, and its broad structure renders it visible to the driver during vibration. Recently, sunroof glass has grown in size and weight, owing primarily to drivers’ preference for openness and the aesthetics of modern automobiles. This is especially true for wide and panoramic sunroofs, which have the drawback of making the vehicle more susceptible to vibrations while in motion. This study examined the free vibration and natural frequency of a thin plate with a large surface area comparable to that of glass using the equations of motion for a thin plate [23,24].
A plate is classified as a load-bearing structural element comprising a surface connecting its edges and two parallel surfaces. The thickness of the plate refers to the distance between a flat surface and a parallel surface, which are both perpendicular. The plane that is equidistant from the surface and runs parallel to it is referred to as the middle plane or central plane of the plate. The equation of motion for this narrow plate can be derived using Hamilton’s principle L = T U , where, L, T, and U, are the Lagrangian function, kinetic energy, and potential energy of the plate, respectively. Then, the motion of the deformable plate can be specified as follows:
t 1 t 2 δ L d t = t 1 t 2 δ ω d t
where δ L defines the primary transformation of the deformation energy L, and δ w is the virtual work based on the virtual displacement u i by an external force. The displacement u i can be found in Figure 3, and the displacement vector can be represented as follows:
u = e i ^ u i = e z ^ w x 1 , x 2 + z ψ x 1 , x 2
The kinetic energy is expressed as
T = 1 2 t 1 ρ u ˙ · u ˙ d V = 1 2 A ρ h w 2 ˙ + 1 12 ρ h 3 ψ α ˙ ψ α ˙ d A
where ρ represents the mass density of the plate, and if the first strain of the plate is taken, the amount of strain, δ T , of kinetic energy can be expressed as follows:
δ T = A ρ h w ˙ δ w ˙ + 1 12 ρ h 3 ψ α ˙ δ ψ α ˙ d A
In the above equation, the angle between the z-axis and the OP of the rotation line element is ψ , the thickness of the plate is h, and the local displacement of the surface is w . The following is defined regarding the conditions, δ ψ α = δ w = 0 , t = t 1 , t = t 2 :
t 2 t 1 δ T d t = t 1 t 2 A ρ h w ¨ δ w + 1 12 ρ h 3 ψ α ¨ δ ψ α d A d t
The virtual work of the transformative energy of the plate and the external forces acting on the plate is as follows:
δ W = A P δ w d A + C M δ ψ + Q n δ w d s
Substituting Equations (5) and (6) for Equation (1) results in the following kinetic stress equation, since the quantities of δ w and δ ψ α are independent and arbitrary:
ρ h w ¨ = Q α , α + p 1 12 ρ h 3 ψ α ¨ = M α β , β Q α       in   A
The equation of kinetic stress of the plate can be derived from classical plate theory (CPT) and the bending stiffness of the plate D . The equation of the kinetic stress of the plate through the biharmonic operator 4 is expressed as:
ρ h w ¨ = M α β , β α + p
D 4 w + ρ h w ¨ = p x , y , t
Assume p 0 that the boundary condition is homogeneous:
E i t h e r       w = 0       o r       V n = 0 E i t h e r       w n = 0       o r       M n n = 0       on   C
Free oscillations can be characterized and expressed as follows:
w i   o r   j x , y , t = W i   o r   j x , y cos Ω i   o r   j t ,             i ,   j = 1,2 , 3 ,
Here, Ω i represents the natural frequency, and W j x , y is the natural mode shape. The equilibrium equation is derived by substituting the above equation into the previously derived kinetic stress equation.
D 4 W i = ρ h Ω i 2 W i
D 4 W j = ρ h Ω j 2 W j
For the following equilibrium equation, assuming that the reciprocal theorem is applied, it is expressed as P i = ρ h Ω i 2 W i and P j = ρ h Ω j 2 W j . Homogeneous boundary conditions were assumed before deriving the boundary conditions. Hence:
Ω i 2 Ω j 2 A ρ h W i W j d A = 0
Assuming that Ω i 2 Ω j 2 , there is an orthogonal relationship between the free vibration modes, and their orthogonal relationship can be expressed as follows:
A ρ h W i W j d A = 0
Each eigenfunction W i , i = 1 , 2 , 3 , can only be determined within an arbitrary constant because the partial differential Equation (15) that characterizes the eigenfunctions has a homogeneous solution. This constant can be fixed by concatenating it under arbitrary normalization conditions. The regularization conditions under which subsequent solutions of the forced motion problem will prove advantageous are expressed as:
A ρ h W i W j d A = 1
Equations (15) and (16) can be expressed in the following form:
A ρ h W i W j d A = δ i j
where δ i j is a Kronecker-delta operator that varies the output depending on the subscript i , j . The natural frequencies and associated mode shapes are derived for a free-oscillating, simply supported rectangular plate with dimensions a, b, and h. According to the boundary conditions of the plate, assuming 0 x a , 0 y b as the range:
W i x , 0 = M y y i x , 0 = 0
W i x , b = M y y i x , b = 0
W i 0 , y = M x x i 0 , y = 0
W i a , y = M x x i a , y = 0
According to the above conditions, the solution of W i , which is the eigenmode form, is as follows:
W i x , y = A m n s i n m π x a s i n n π y b
and when m = 1 , 2 , 3 , , n = 1 , 2 , 3 , , A m n is a constant, and the natural frequency Ω i is as follows:
Ω i = Ω m n = D ρ h 1 / 2 m p i a 2 + n π b 2
The natural frequencies must be arranged as follows to define the correlation between the integers i , m , n : Ω 1 Ω 2 Ω 3 . Next, the natural frequency of a rectangular plate with an aspect ratio of “a:b = 4:3” is calculated using the natural mode Equation (22) and the natural frequency Equation (23). For convenience of calculation, the equation is summarized as follows:
Ω i = Ω m n = 1 4 2 D ρ h 1 / 2 π 3 2 4 2 m 2 + 3 2 n 2
In each case of m = 1 , 2 , 3 , , n = 1 , 2 , 3 , , it can be expressed sequentially as i, which is the natural frequency order, and Table 1 lists the corresponding natural frequency calculation results.
The vehicle sunroof model, the subject of this study, is designed as a rectangular flat plate with width (a) = 1004.6 mm, length (b) = 752.5 mm, and height (h) = 5 mm, and is equipped with a front bracket to support the sunroof glass. The sunroof consists of a rear bracket fastened to the car body. Additional bracket support conditions were applied based on the physical properties of the sunroof glass and sunroof modeling designed for use in future research data to derive result values under the conditions for the experimental and modal analysis. Table 2 lists the natural frequency of sunroof glass with aspect ratio “a:b = 5:2.451”, substituting the dimensions of width (a) = 1004.5 mm, length (b) = 492.5 mm, and height (h) = 5 mm from the result of repeated calculation.

3. Vibration Measurement and Analysis

This study employed ODS, which expresses the vibration data obtained from various locations of an operating vehicle along with geometric shapes. It shows the size by region according to the high and low vibration response obtained at the sensor attachment location. However, the results of various excitation forces and structural characteristics of the vehicle system are mixed and in the absence of a dominant resonance, multiple resonances may make biased contributions at one frequency, resulting in complex motion patterns. Therefore, through EMA, which is a test that can analyze structural and vibration response data with artificially forced excitation, the vibration characteristics are additionally confirmed, and the main frequencies are determined.

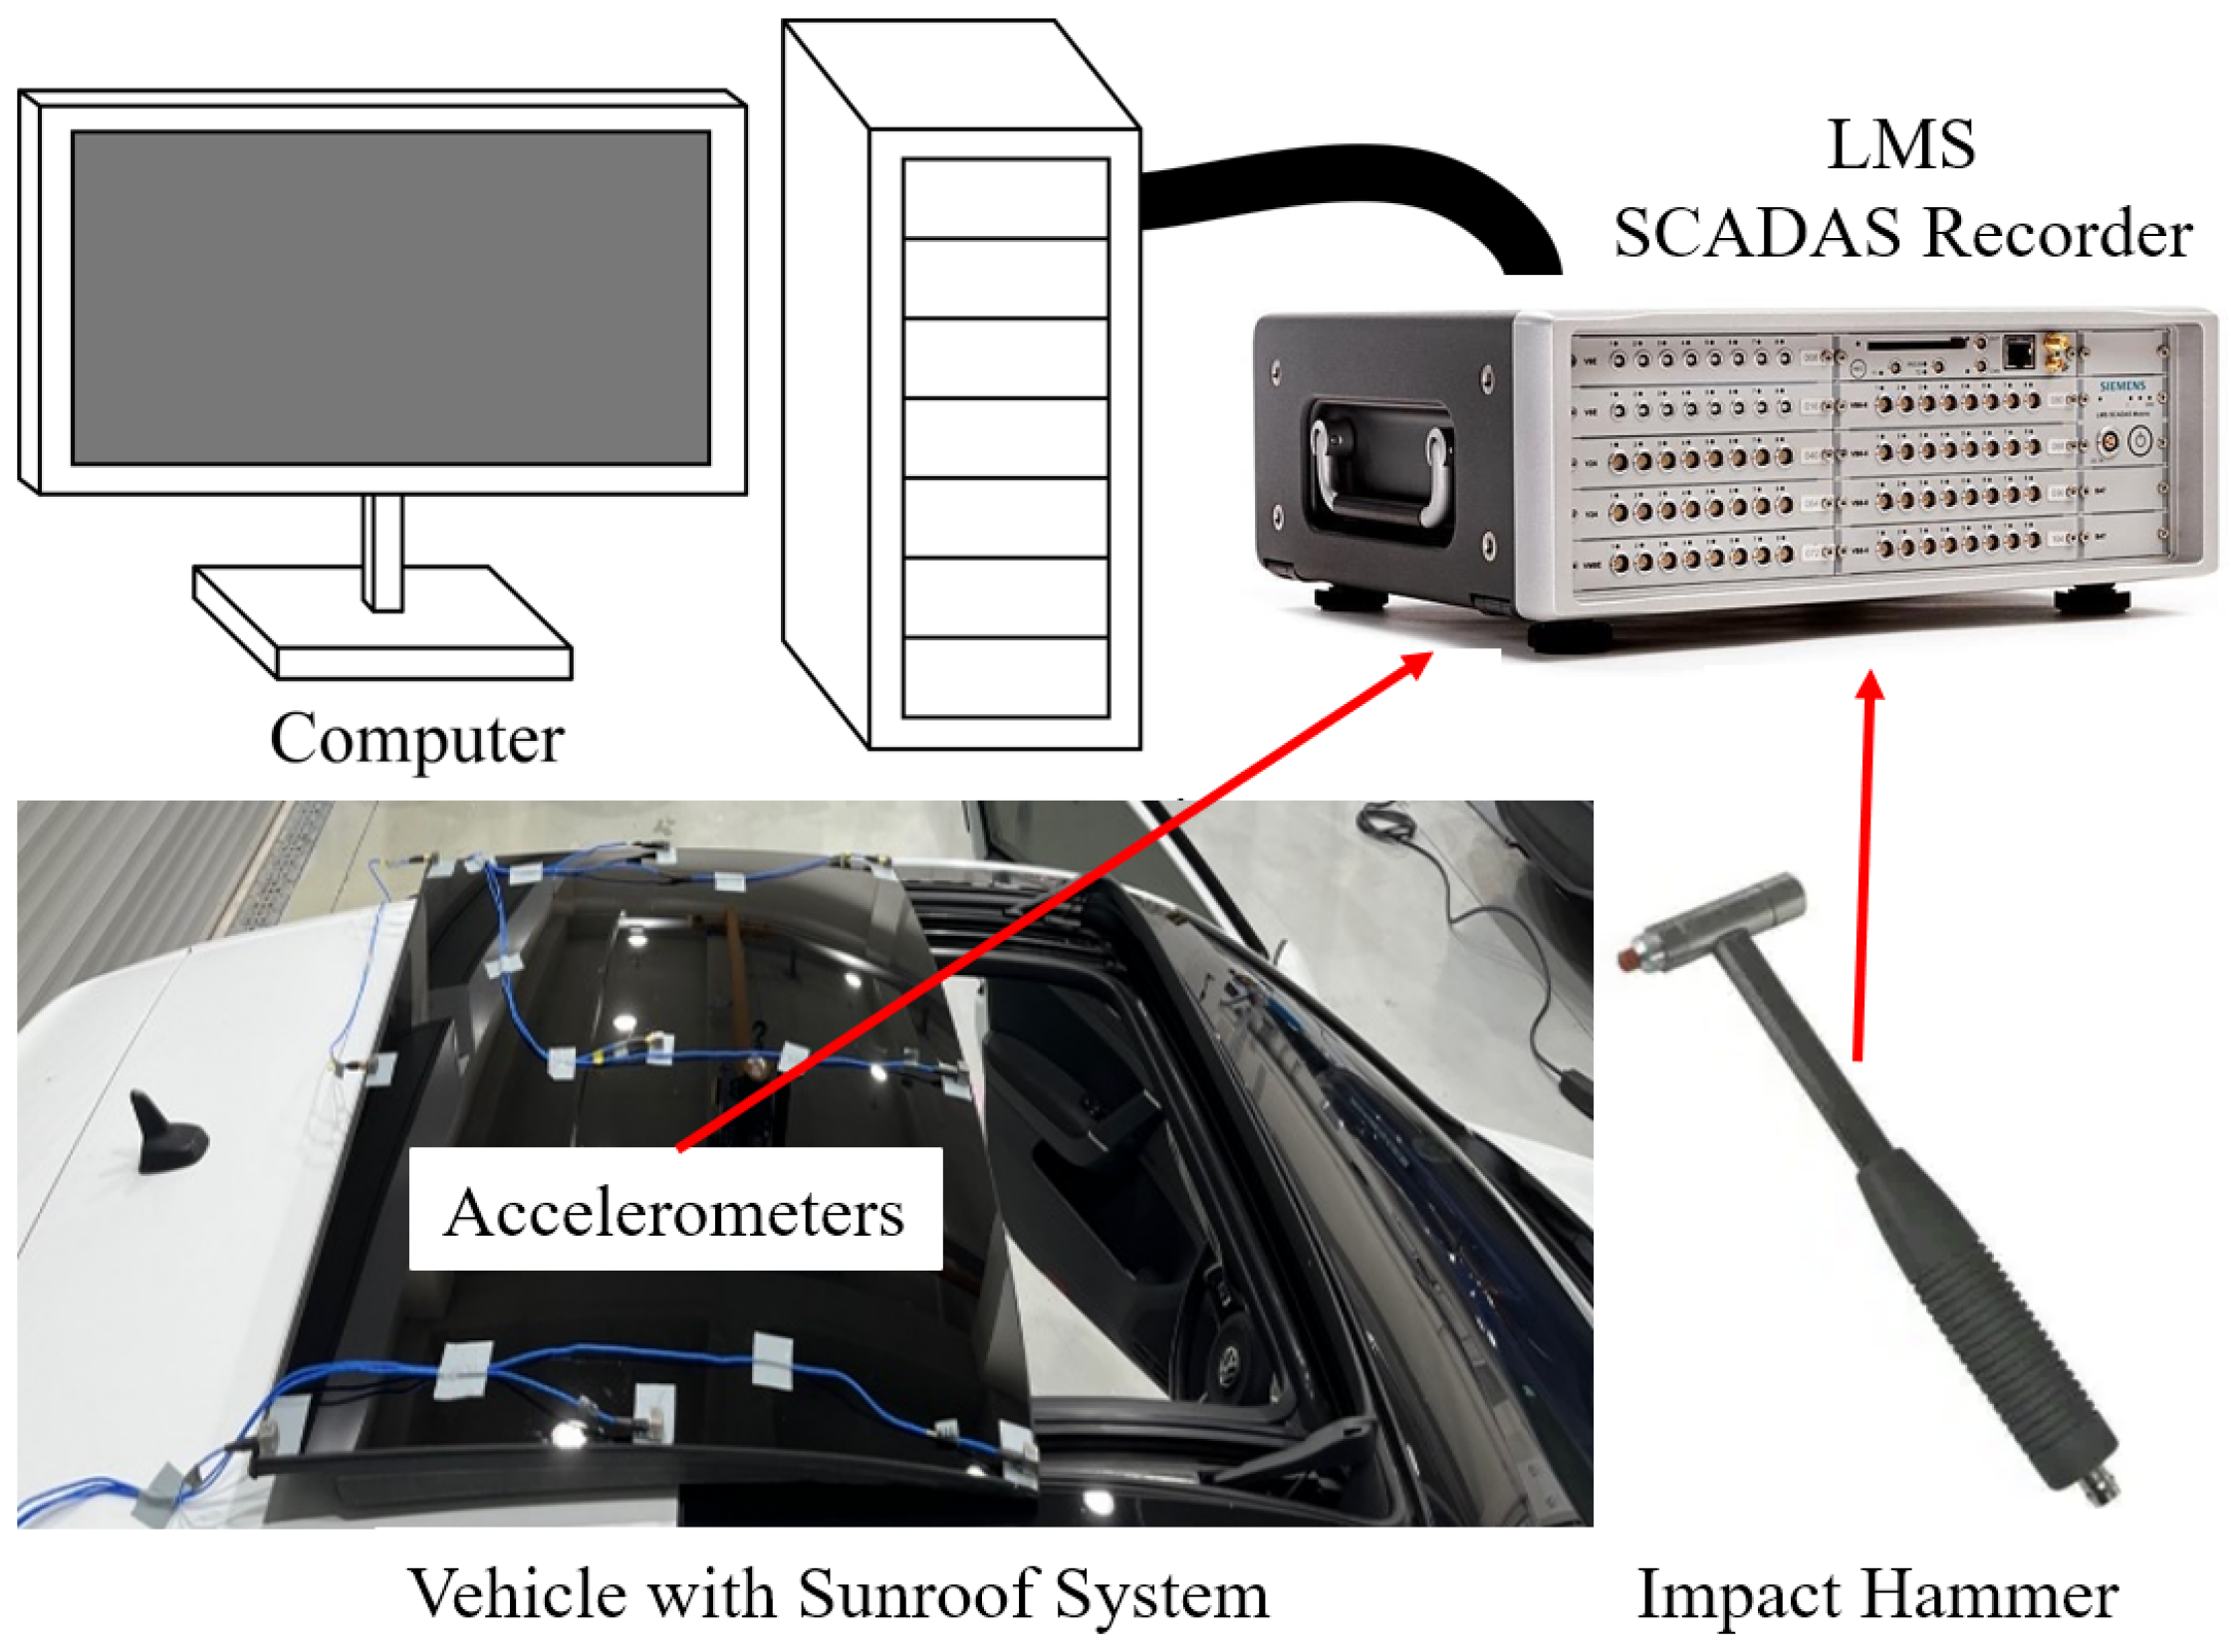
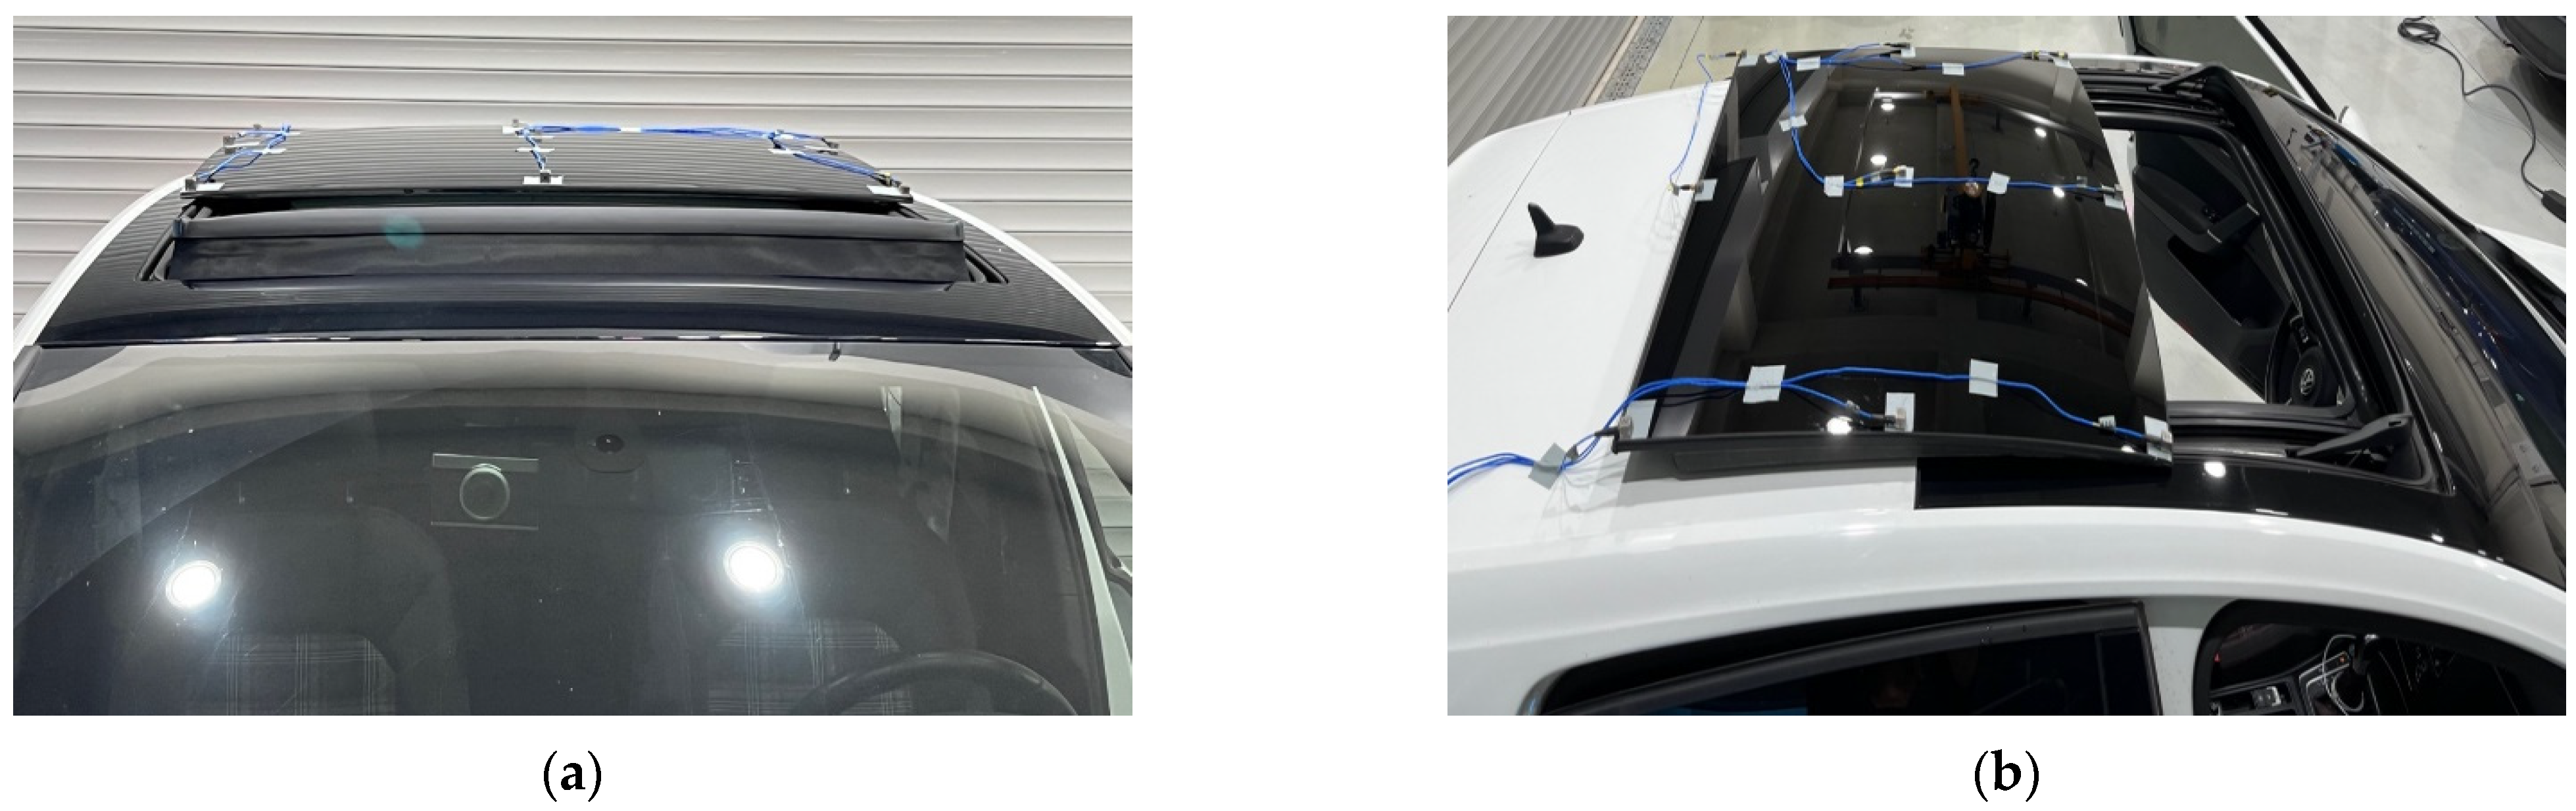
3.1. Experimental Setting

Conducting an experimental modal analysis according to the driving vibration of a vehicle sunroof requires setting the response position according to the driving vibration. The response position should be selected so the analysis results based on vibration can clearly identify the mode shape of the frequency band of interest. In the case of a vehicle sunroof, the response position should be selected as a grid in the form of a wide plate, and an accelerometer should be attached (Figure 4). In addition, the wavelength of the structure decreases as the frequency of interest increases, and higher-order mode shapes occur. Hence, the distance between the individual response positions must be reduced. Nevertheless, in the case of vehicle sunroof vibration, the main resonance occurs in the low-frequency band of 100 Hz or less. Given this background, the sensor was attached with the distance between accelerations set to approximately 500 mm.
The response geometry was defined using software that analyzes the vibration response data of the structure through the exciting forces generated from vehicle systems, such as the engine and tires, when the vehicle is driven and confirms the structural mode in the experimental main frequency band, as shown in Figure 5.
The response geometry was defined by dividing it into the frame assembly, rail part, and vehicle sunroof glass part, up to the sunroof glass, which is the final structure through which exciting force is transmitted. The response geometry was defined as blue for the glass part of the vehicle sunroof, pink for the mechanism rail part, and orange for the frame assembly part. One of the critical parts when defining the response geometry is that all modes in the frequency band of interest must be excited, and the geometry position must be anticipated and set according to the system structure to avoid interference caused by resonance unrelated to the target mode.
Car sunroof glass has a wide rectangular plate structure, and the geometry of the middle part (G:2, G:4, G:6, G:7, G:8, G:9, G:10, G:12, G:14, G:16, G:17, G:18, G:19, G:20, G:22, G:24) is set. In addition, the rail and frame assembly parts were designed to predict the bending mode shape by setting the connection part geometry (R:2, R:4, R:7, R:9, B:2, B:4, B:7, B: 9, B:11, B:13). The equipment for the test measurement was a SIEMENS LMS SCADAS Recorder (SCR209), and the software for analysis was Simcenter Testlab 16A. Triaxial accelerometers (PCB 356A15) with a sensitivity of 100 mV/g (1.2 mV/(m/s2)) and a measurement range of ±50 g pk (±490 pk) were attached to the sunroof system for acceleration measurements, and an impulse force hammer (PCB 086D20) with a sensitivity of 0.244 mV/N was utilized for system excitation. Figure 6 shows the schematic diagram for the modal test setup.

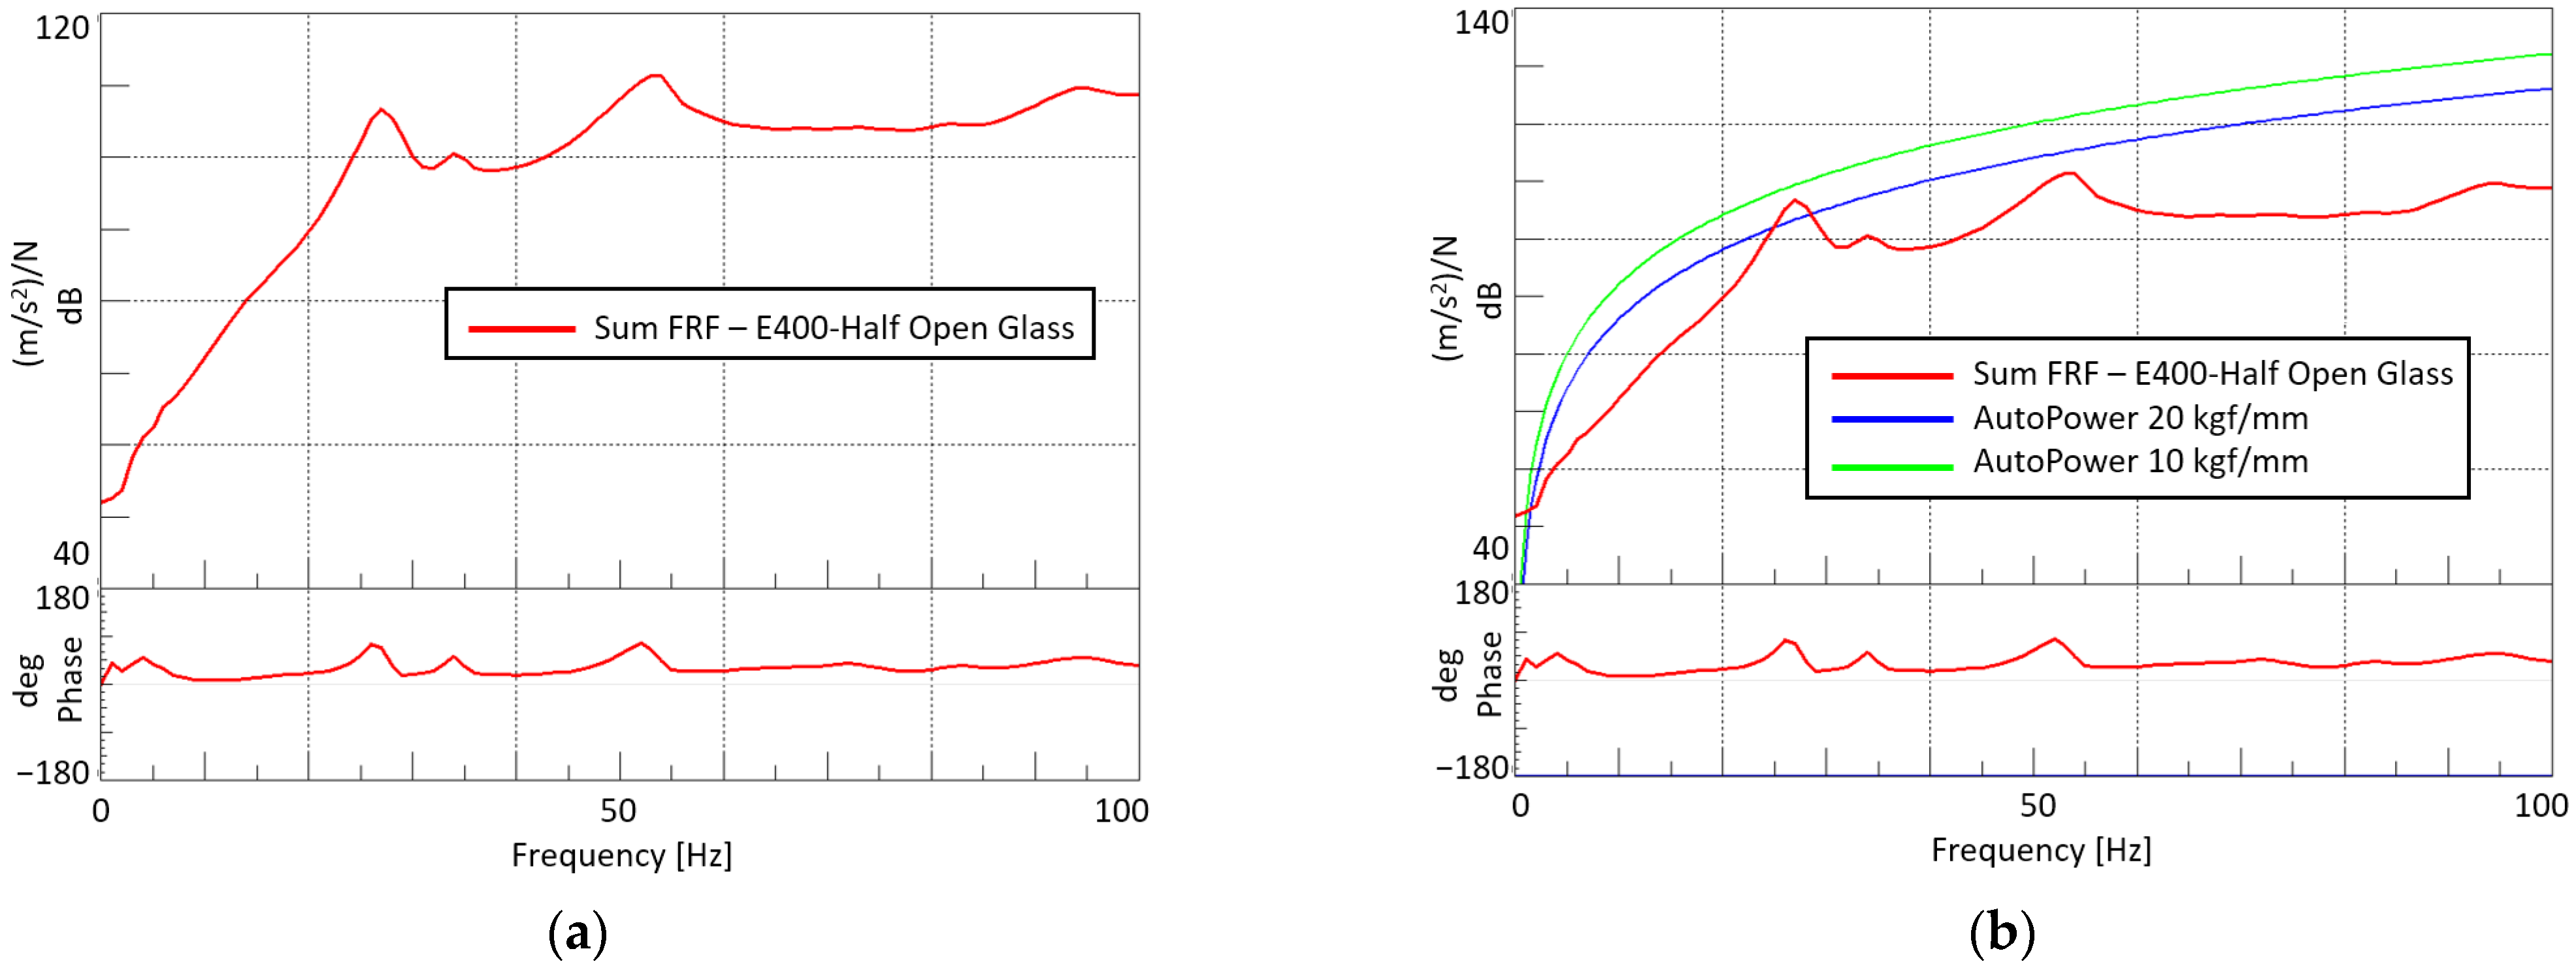
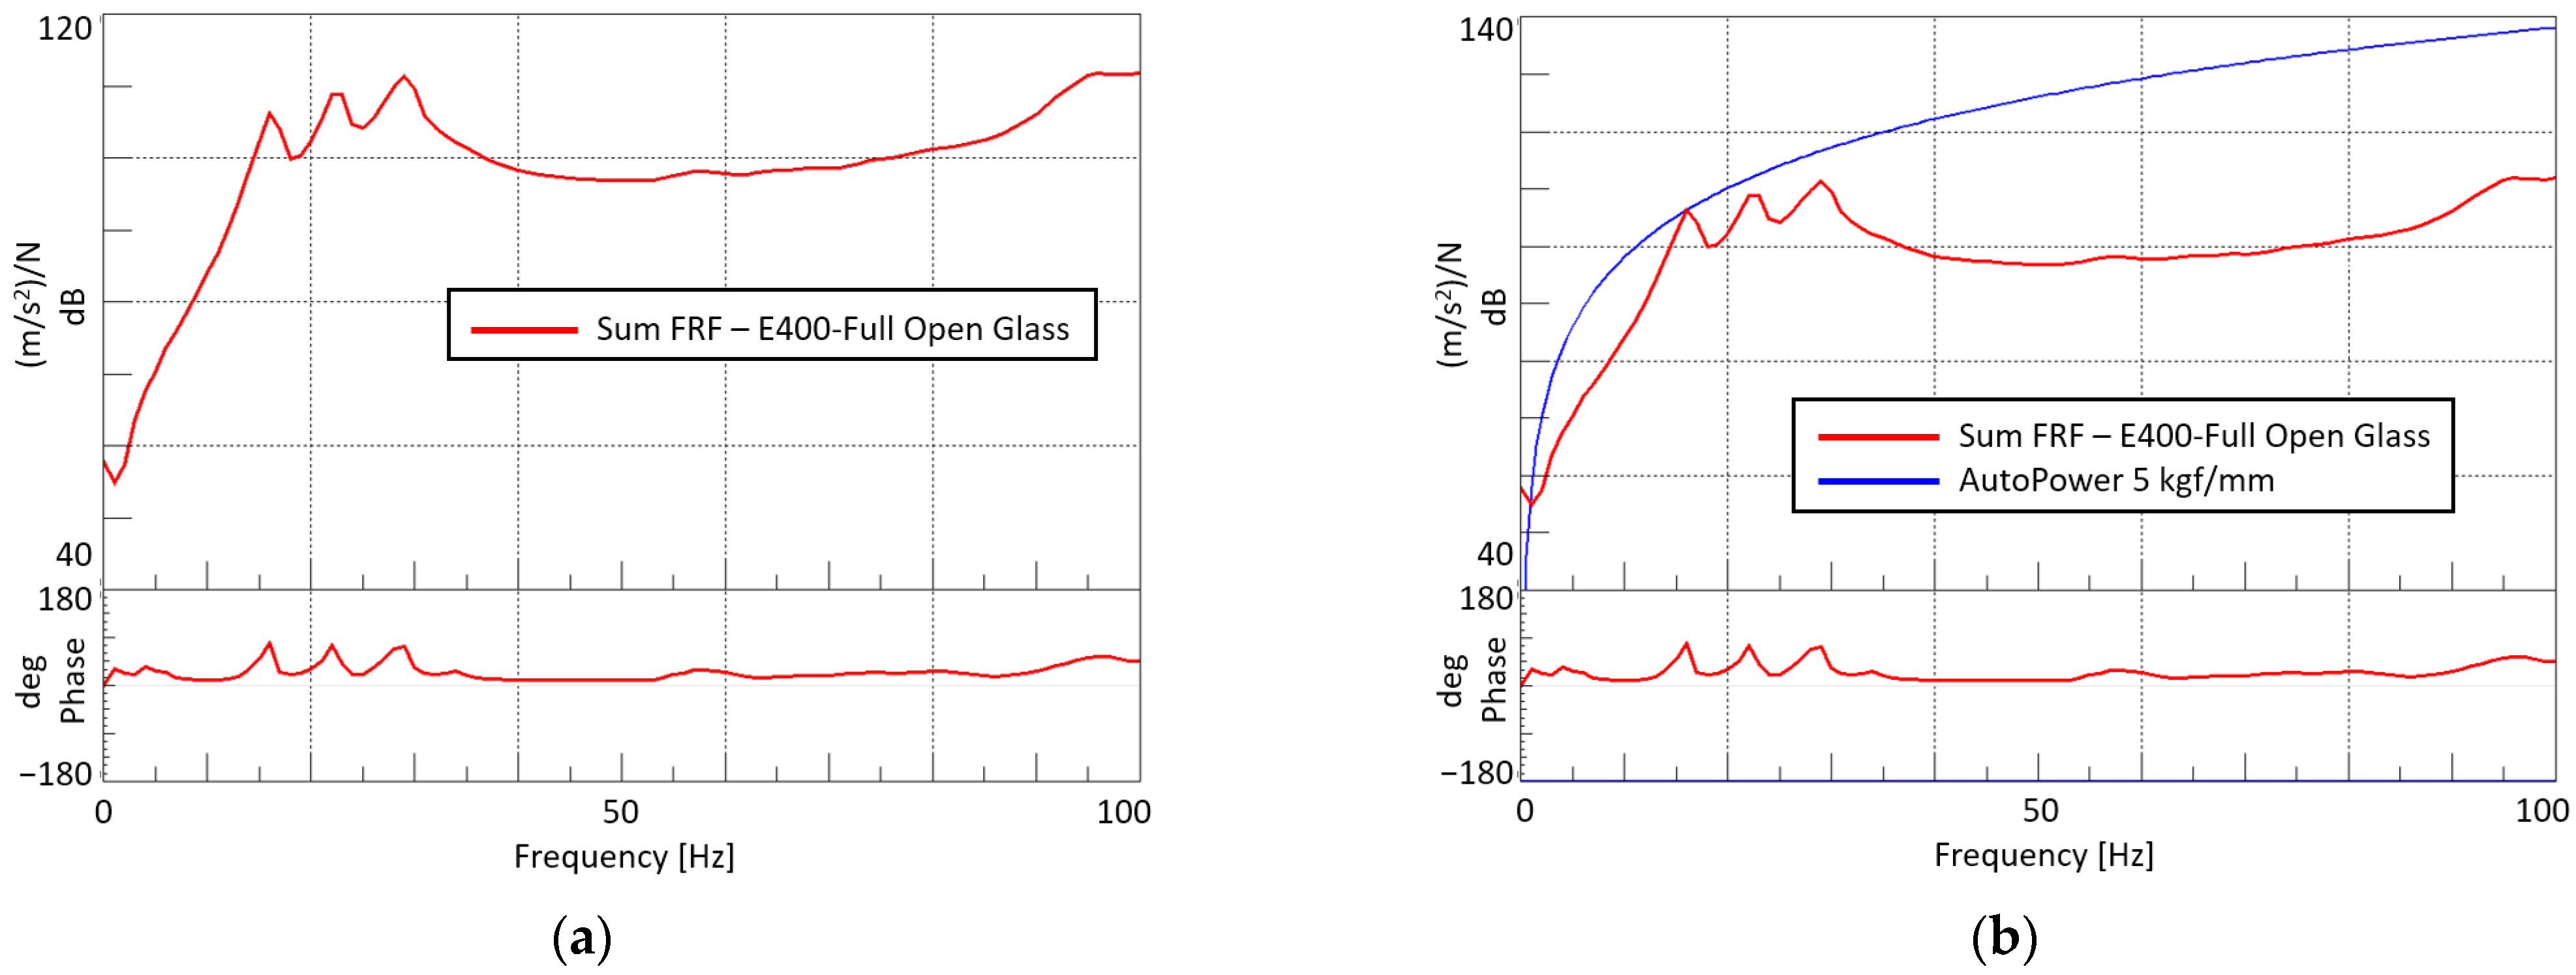
3.2. Experimental Modal Analysis (EMA)

EMA is a method for applying a corrected input (force, N) to a system and receiving and analyzing the response. The system is excited by hitting it using an impact hammer that can convert the unit force according to the impact. This method is easy to perform without installing additional devices, such as exciters in the system itself, and has the advantage of changing the excitation point for impact. The sunroof system in this study is in the form of a thin, flat glass plate, considering the risk of damage from strong vibration and impact and the possibility of errors due to changes in the mass of the sunroof system. Therefore, the response according to the unit force was analyzed by exciting the system using an impact hammer instead of using an electric shaker.
A vehicle sunroof is fixed to the vehicle roof system and opens by moving forward and backward depending on the before and after operation. The dynamic rigidity of the sunroof varies according to the degree of sunroof opening. Hence, it can be closed or mid-open. An actual vehicle test was conducted according to three states: closed state, mid-open state, and fully open state. The summed FRF was calculated by integrating the sensors at the attachment location to confirm the characteristics of the entire sunroof glass rather than the local FRF characteristics at the sensor attachment location. The dynamic characteristics of the entire sunroof glass were analyzed. The measurement conditions for analyzing the dynamic and vibration characteristics of the sunroof glass are as follows: bandwidth = 4096 Hz, resolution = 1 Hz, acquisition time = 1 s, amplitude scaling = RMS.
An automotive sunroof system EMA test was performed. Figure 7 shows the Sum FRF analysis results in the closed state. The natural frequencies, such as 34.8 Hz, 53.1 Hz, and 85.9 Hz, were confirmed below 100 Hz, but it was difficult to judge them as the natural frequencies of the vehicle sunroof glass because the changes in amplitude and phase were small and the damping was large. Furthermore, because the dynamic stiffness was 100 kgf/mm, it was difficult to judge it as the dynamic stiffness of the glass.
For the mid-open state, the Sum FRF analysis results revealed values of 26.5 Hz, 33.8 Hz, and 52.0 Hz (Figure 8). A clearer natural frequency was confirmed than in the closed state, and the dynamic stiffness was also found to be approximately 15 kgf/mm, which was approximately 85 kgf/mm lower than the dynamic stiffness in the closed state.
In the case of the fully open state, as a result of Sum FRF analysis, natural frequencies such as 15.7 Hz, 22.2 Hz, and 28.5 Hz could be analyzed. The change in amplitude and phase was large, and the damping was small compared to the closed and mid-open states. The clearest natural frequency was confirmed, and the dynamic stiffness was also approximately 5 kgf/mm, which was closest to the physical properties of glass, as shown in Figure 9.
Table 3 presents the natural frequency measurement results according to the sunroof state.
The mode order and natural frequency of the sunroof glass showed discernible disparities when the calculated natural frequency derived in the preceding chapter was juxtaposed with the outcome of the EMA test within the frequency range of interest below 50 Hz. On the other hand, the natural frequency computed via plate theory was derived from a flat rectangular plate instead of curved sunroof glass for the sake of calculation simplicity. Environmental factors, including load conditions and attachment conditions of the sunroof glass, were also considered. An analysis of the disparities showed that each main frequency band contained a 4–10% margin of error, as shown in Table 4.
When analyzing the mode shape of the sunroof glass through EMA, as shown in Figure 10, the first mode has a bending mode shape in which the rear part bends up and down based on the front support of the sunroof, and the second and third modes have a shape along the longitudinal center line of the sunroof. As a reference, a torsional mode shape in which the left and right sides were bent was observed.

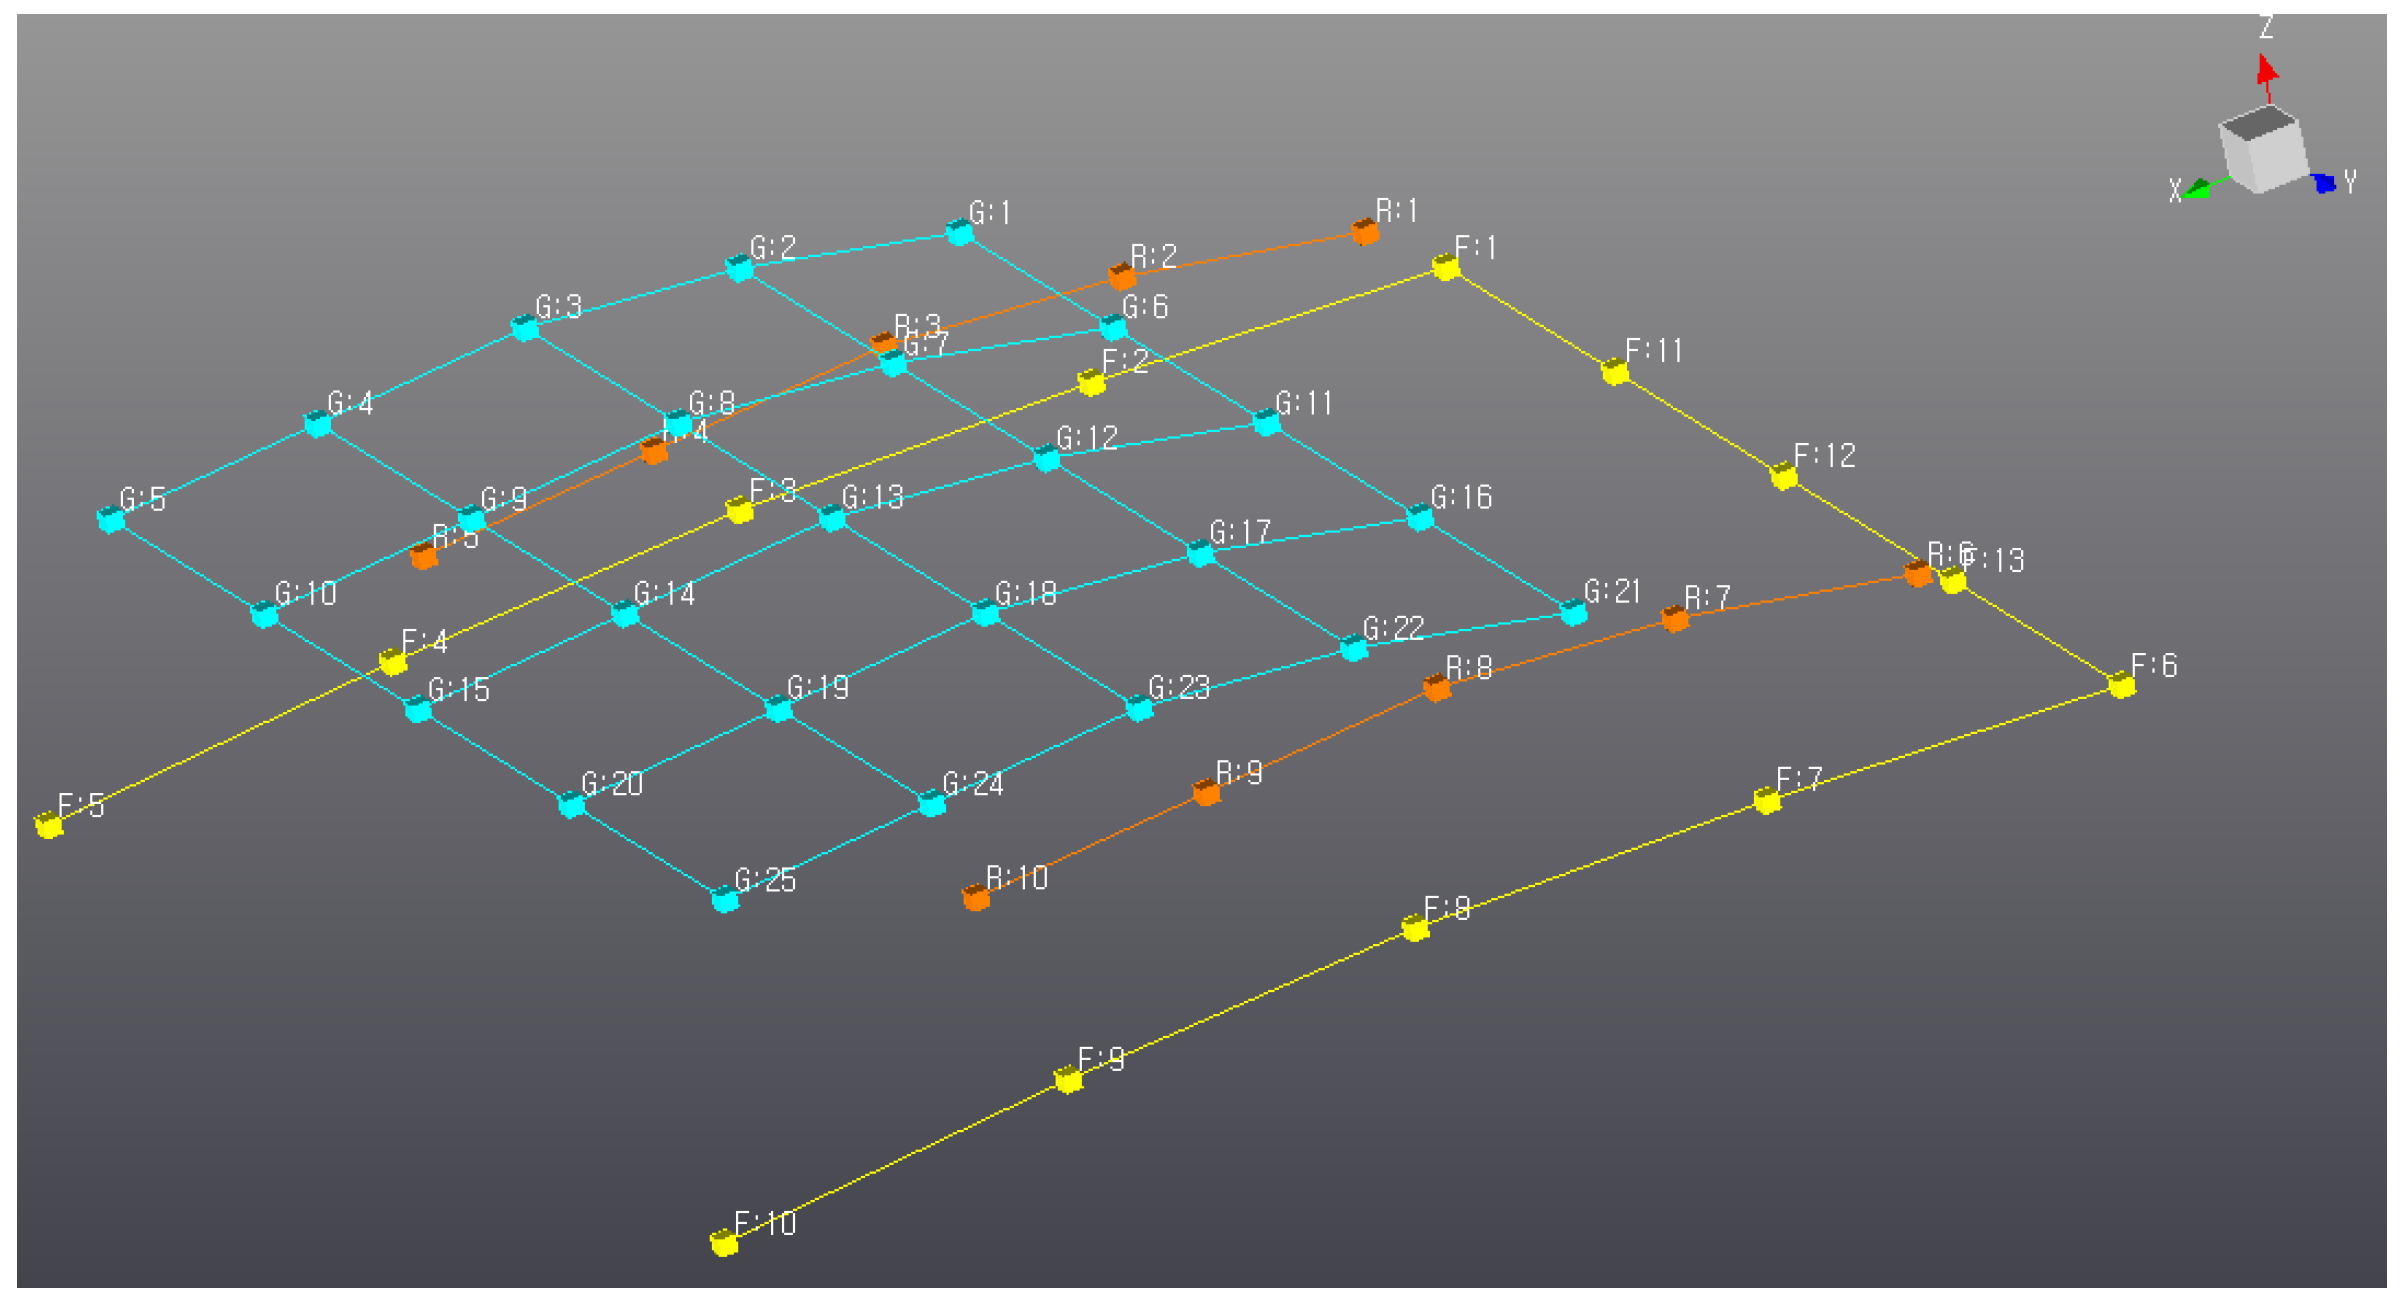
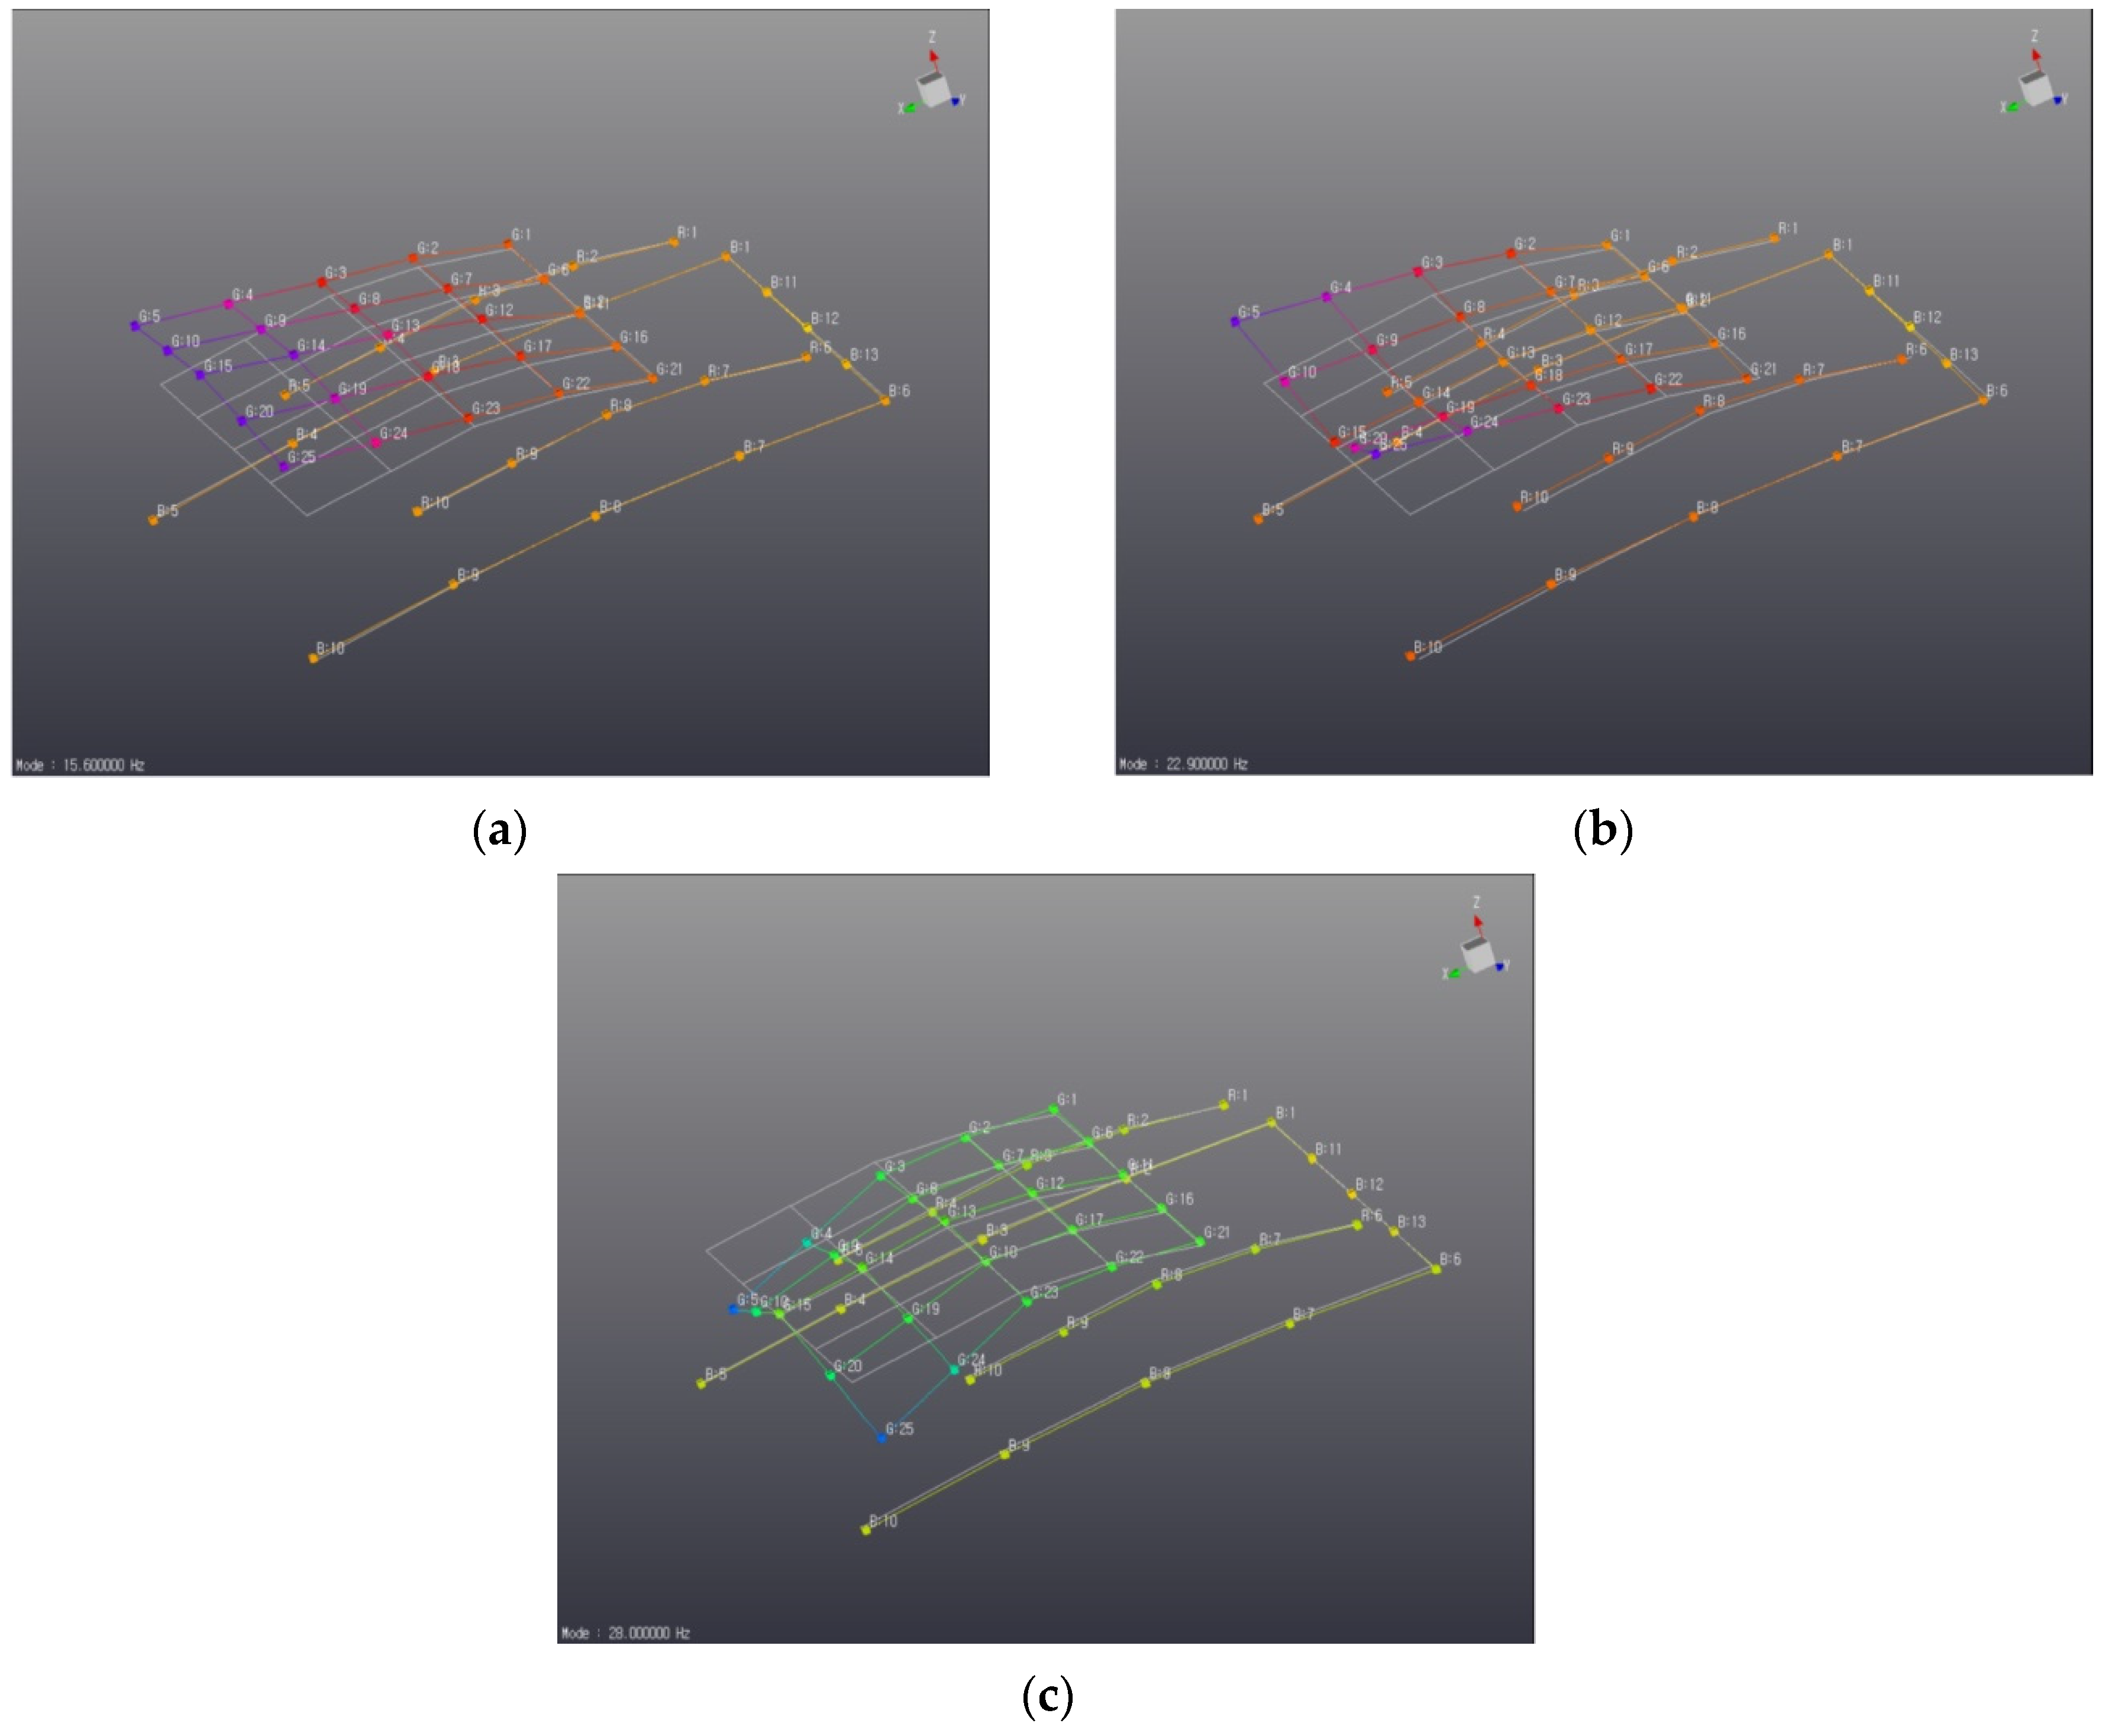
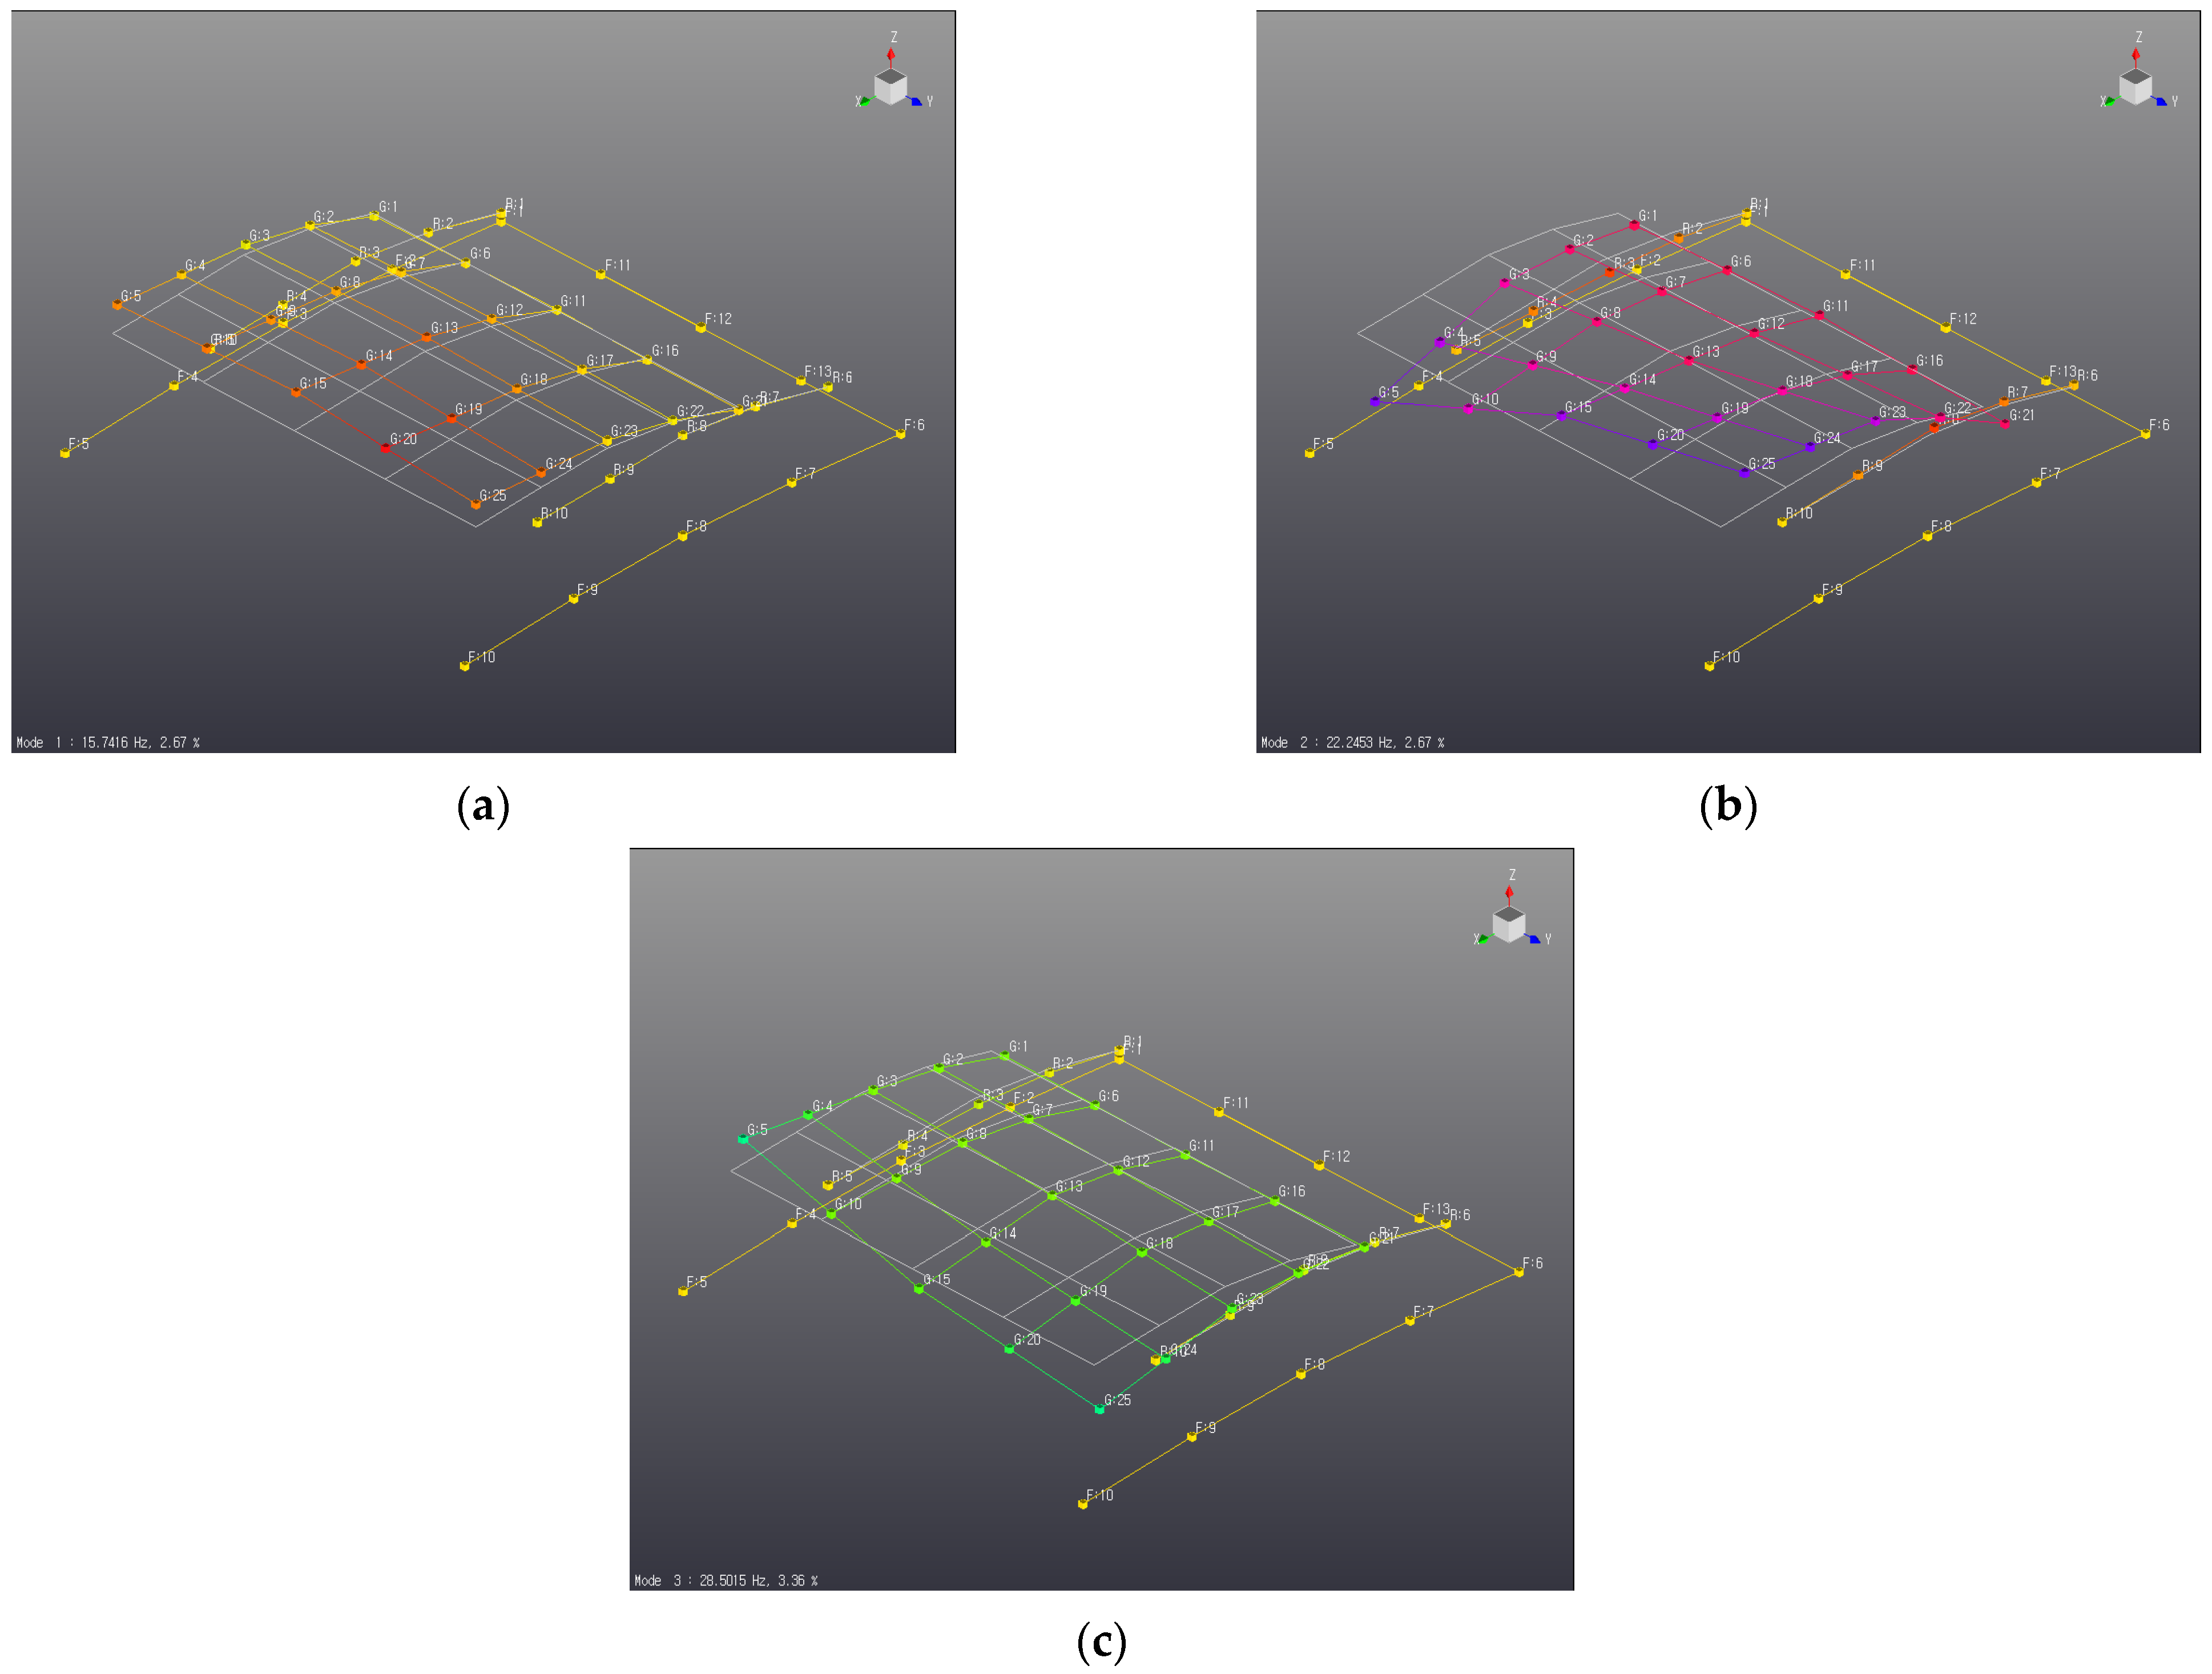
3.3. Operational Deflection Shape (ODS)

In contrast to EMA, ODS operates by animating the dynamic behavior of the measurement system and does not apply a corrected input (force, N). Instead, it receives and analyzes the responses via the input values derived from the operating conditions of the system. This technique visualizes and evaluates dynamic rigidity. Before conducting the ODS actual vehicle test, the following are needed to analyze the vibration phenomenon of the sunroof while driving: the driving conditions, including the condition of the sunroof; the irregularity of the driving surface; and the speed at which the vehicle is being driven. As the mode shape and clear natural frequency of the sunroof were analyzed in the fully open state during the EMA actual vehicle test, the aim was to replicate those conditions during the ODS actual vehicle test. This was to enable a more precise comparison of the test data. Second, the input value of the vibration transmitted to the sunroof system via the vehicle body is negligible when driving on a general asphalt road because of the roughness of the driving surface. Consequently, the driving vibration characteristics of the sunroof system may not be displayed clearly. Therefore, an uneven road surface was chosen to conduct the test. In conclusion, considering the conditions above of a fully open sunroof and a rough road surface, driving at high velocities under such circumstances endangers the safety and condition of the vehicle and its occupant and constitutes a standard driving condition. If this is not the case, the driving disturbance of the sunroof is determined by maintaining a constant speed of 30, 40, or 50 km/h.
Nine accelerometers affixed to the sunroof glass were used to identify a vibration that accurately represents the sunroof vibration and to determine the natural frequency by measuring driving vibration originating from the sunroof glass during vehicle operation. Regarding the representative vibration, the objective was to identify a location where the sunroof glass exhibited a distinct natural frequency with a significant vibration magnitude owing to the vibrations that transpire during vehicle operation. The amplitude in the Z-direction of the accelerometer affixed to the sunroof glass was assessed to verify this, as shown in Figure 11. The comparison of the vibration sizes (amplitude (RMS)) of the G:5 and G:25 sensors affixed to both ends of the sunroof showed that the former had the largest vibration size. Furthermore, the natural frequency characteristics of the two sensors exhibited a resemblance. Subsequent analysis was undertaken using the G:25 accelerometer, which demonstrated a greater vibration magnitude, as the representative accelerometer for sunroof vibration.
First, an analysis of the vibration characteristics of the G:25 accelerometer under driving conditions at a speed of 30 km/h confirmed that the major vibrations occurred at 12.5 Hz, 17.1 Hz, 21.0 Hz, 26.9 Hz, and 29.6 Hz. Second, at 40 km/h, an analysis of the vibration characteristics of the G:25 accelerometer under these driving conditions confirmed that the major vibrations occurred at 15.6 Hz, 22.9 Hz, 27.0 Hz, and 28.9 Hz. Lastly, at 50 km/h, the major vibrations occurred at 22.0 Hz and 28.8 Hz. Figure 12, Figure 13 and Figure 14 show the G:25 accelerometer measurement results and main vibration frequencies according to the driving speed.
The verification of the sunroof glass via EMA revealed the primary vibration frequencies of the data collected while driving at a constant speed of 40 km/h: 15.6 Hz, 22.9 Hz, 27.0 Hz, and 28.9 Hz. This conclusion was reached after comparing the vibration characteristics of the representative accelerometers according to driving speed. The natural frequency band showed the highest degree of similarity to the natural frequencies of 15.724 Hz, 22.245 Hz, and 28.501 Hz. ODS analysis revealed the mode shape for each natural frequency band, representing the dynamic behavior of the sunroof while the vehicle was in motion, as shown in Figure 15. ODS analysis revealed that within the first resonance frequency band of 15.6 Hz, the deformation shape of the front portion was marginal, as determined by the sunroof front support. On the other hand, the rear sunroof glass exhibited a bending mode shape characterized by up and down bending. The sunroof exhibited a torsional mode shape at the second resonance frequencies of 22.9 Hz and 28.9 Hz, with the left and right sides bowed along the X-axis line that connected the front and rear of the sunroof. The degree of torsion in the mode shape underwent a rapid change at 22.9 Hz, as evidenced by the measurement outcomes of the G:25 accelerometer and the main vibration frequency (40 km/h), because the amplitude surpassed the resonance frequency of 28.9 Hz.
The EMA test and ODS analysis were conducted by comparing the natural frequencies of the sunroof glass, which were confirmed by EMA at 15.742 Hz, 22.245 Hz, and 28.501 Hz, with the primary resonance frequencies identified via ODS analysis at 15.6 Hz, 22.9 Hz, 27.0 Hz, and 28.9 Hz. Table 5 lists the error and error rate of the natural frequency.
The error and error rate comparison table for natural and resonance frequency data was obtained via ODS analysis and the EMA test. The table presents the error rate, which varied according to frequency mode and reached a maximum of 2.944%. The frequency deviation was capped at 0.655 Hz, with a margin of error of less than 1 Hz. The findings from both the EMA test and ODS test analysis were corroborated. Nevertheless, it differed slightly from the theoretical natural frequency obtained using the theoretical approach because it accounted for the properties of the plate and not the curved surface of the vehicle sunroof, which is its actual shape. The distinction between natural frequency and resonance frequency is hypothesized to have resulted from the omission of conditions pertaining to the actual vehicle sunroof system, including load conditions and the state of the bracket supporting the glass.

4. Numerical Modal Analysis

Previously, the natural frequency of a rectangular plate similar to sunroof glass was calculated theoretically using thin plate theory, and the actual natural frequency and mode occurring in the sunroof glass in the vehicle system state were calculated through experimental modal analysis. This section examines the differences between actual testing and analysis through analytical modal analysis using a structural CAE program (ANSYS) and studies ways to reduce vibration and resonance by avoiding the major resonance frequencies to optimize sunroof design.

4.1. Background

Before optimizing the sunroof design of Figure 16, the bolt loosening phenomenon, which is caused by driving vibration and resonance and is a significant issue in vehicle sunroofs, was characterized. Bracket fasteners secure a firm connection between the sunroof glass and the frame. Bolt fastening is a critical mechanical component used to join structural components in industries as diverse as automobiles, railways, and industrial apparatuses. Its industry-wide adoption has occurred due to its simple maintenance, assembly, and disassembly processes. On the other hand, repetitive axial loads may cause variations in vibration, shock, and thermal stress that result in a reduction in initial contact pressure and axial force loss in the bolt structure. This can cause severe accidents that destroy both vehicles and structures. Loosening of the bolt structure may result in severe incidents, including vandalism and structural damage, owing to a reduction in initial contact pressure caused by variations in vibration, shock, and thermal stress induced by repeated axial loads [25]. Research findings concerning this bolt loosening phenomenon suggest that the main concern is the loss of initial bolt axial force. Local plastic deformation occurs when the affixed system is subjected to repeated external vibration or impact loads. As a structural loosening stage, bolt loosening phenomena occur swiftly when external vibration continues [26,27].
This section analyzes the resonant frequency for each mode that amplifies the vibration experienced while operating a vehicle sunroof, as well as the vibration caused by changes in material properties, in accordance with the findings of research pertaining to bolt loosening. The methods for avoiding and enhancing resonance frequencies are evaluated. The 3D model of a vehicle sunroof for modal analysis was generated using CATIA, a 3D design software specifically designed for developing automobiles and aircraft.

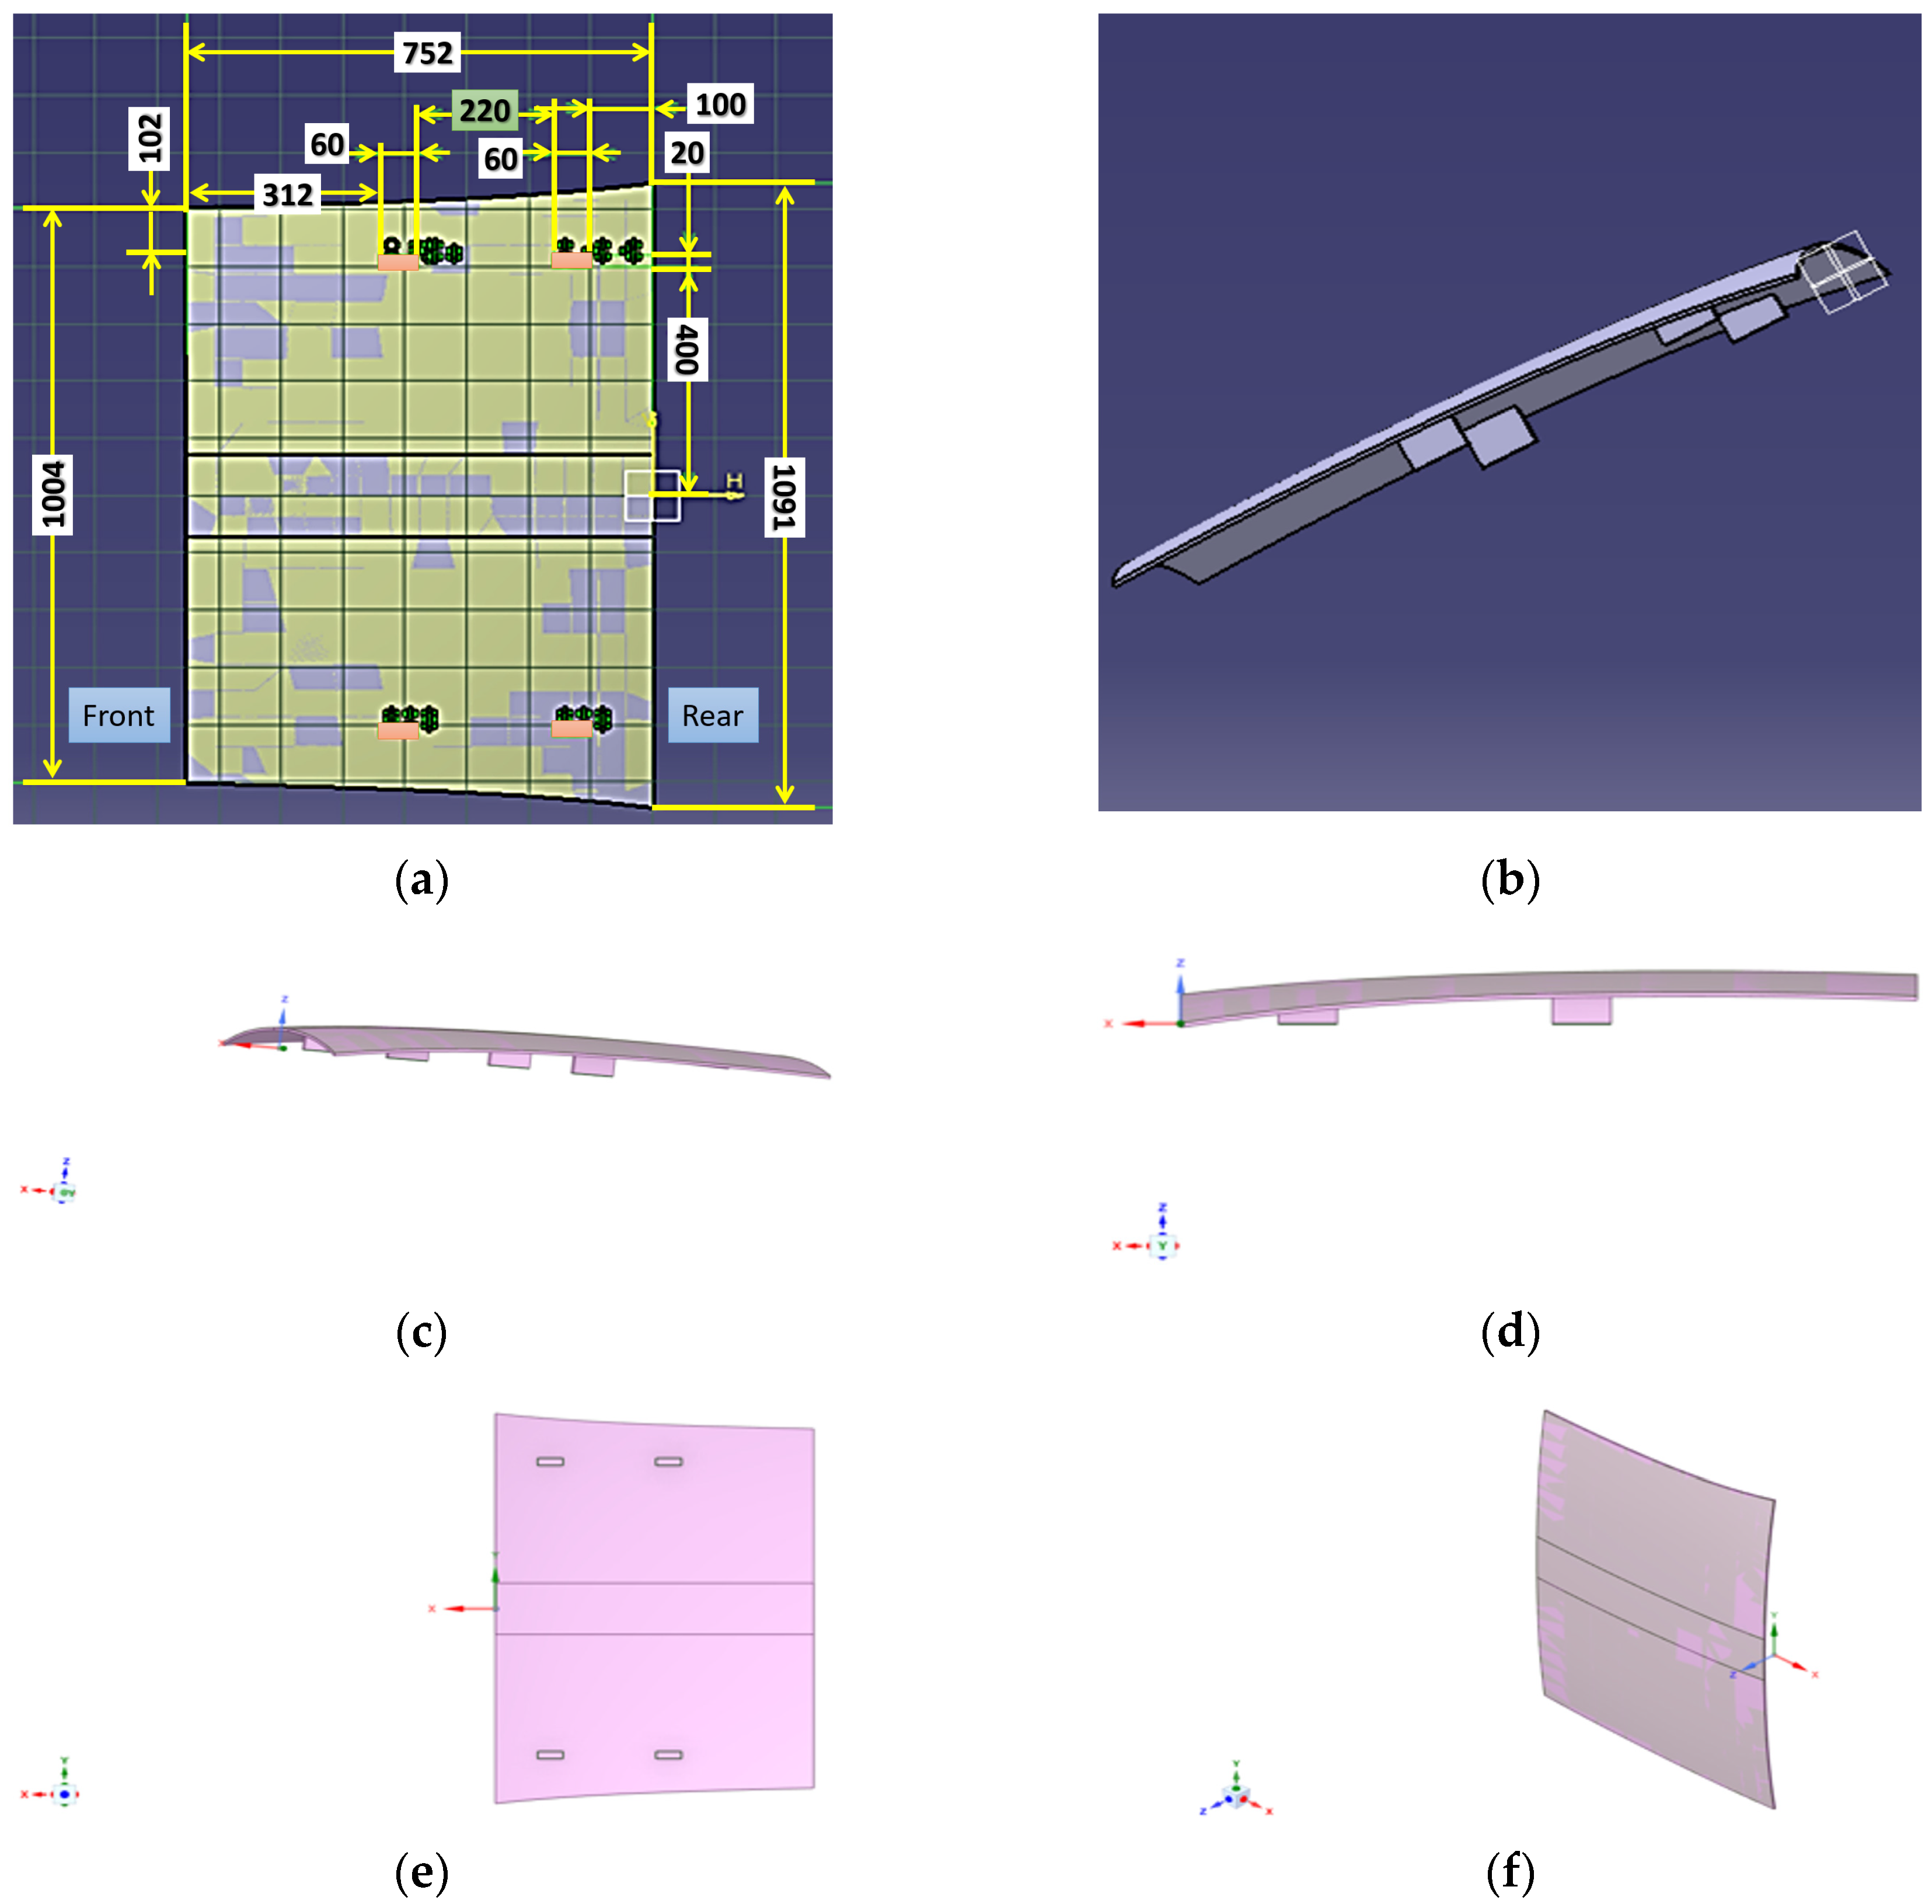
4.2. Model Setting and Conditions

Before starting modal analysis, the conditions necessary for modal analysis were specified to obtain suitable analysis outcomes. These conditions were examined in the sunroof glass, while the vehicle system state was confirmed in the preceding section. The analysis conditions were specified to establish environmental and 3D modeling conditions that mirror the characteristics of the actual resonance frequency and mode shape.
Figure 17 shows a vehicle sunroof model with width = 1004.6 mm, length = 752.5 mm, and thickness = 5 mm, which is equipped with four brackets to support the sunroof glass. The front brackets have a dimension of 60 × 20 × 30   m m 2 and are located 312 mm from the front side and 400 mm from the center. The rear brackets have the same dimension and are placed 220 mm apart from the front ones. Initially, a table of the physical properties of the material, which is one of the most important considerations during analysis, was compiled using the physical properties of tempered glass found in actual vehicle sunroofs. Table 6 lists the application. A comprehensive analysis was carried out using ANSYS 2022R1 software used primarily for general structural analysis and modal analysis, to examine the mesh conditions necessary for precise modal analysis. This was done in light of the monotonous flat plate shape of skylight glass. The analysis was performed with the following parameters: a minimum crush condition size of 9.5 mm, 123,117 nodes, and 65,456 elements. Finally, the load condition for the sunroof glass was specified in the Z-axis direction below the sunroof glass. Fixed support constraints were added to the analysis of the mounting brackets and support system of the sunroof, where the four brackets connected to the sunroof guide rail are assumed to be fixed. Following the aforementioned analysis conditions and 3D modeling, which were used to equalize the vibration characteristics of the test and analytical characteristics, further analysis was conducted utilizing boundary conditions.

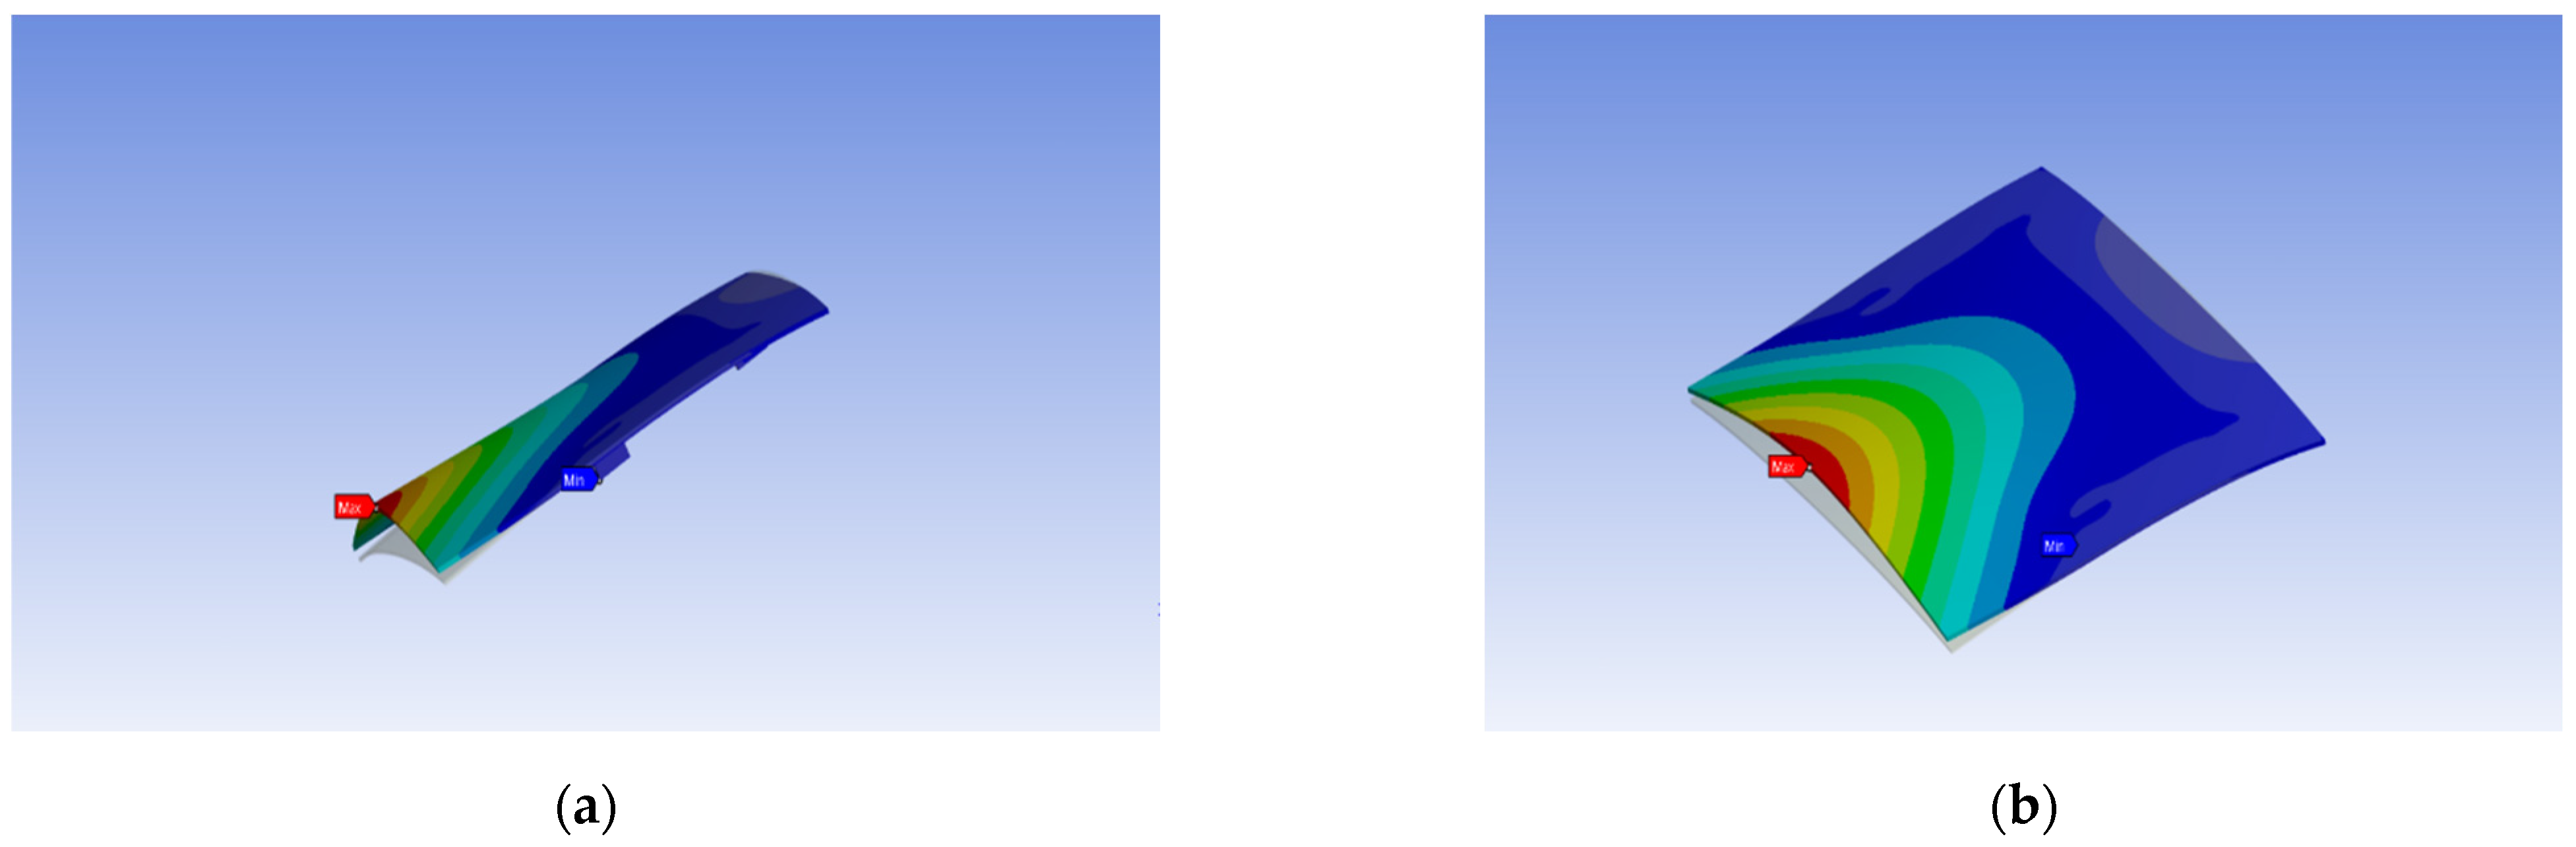
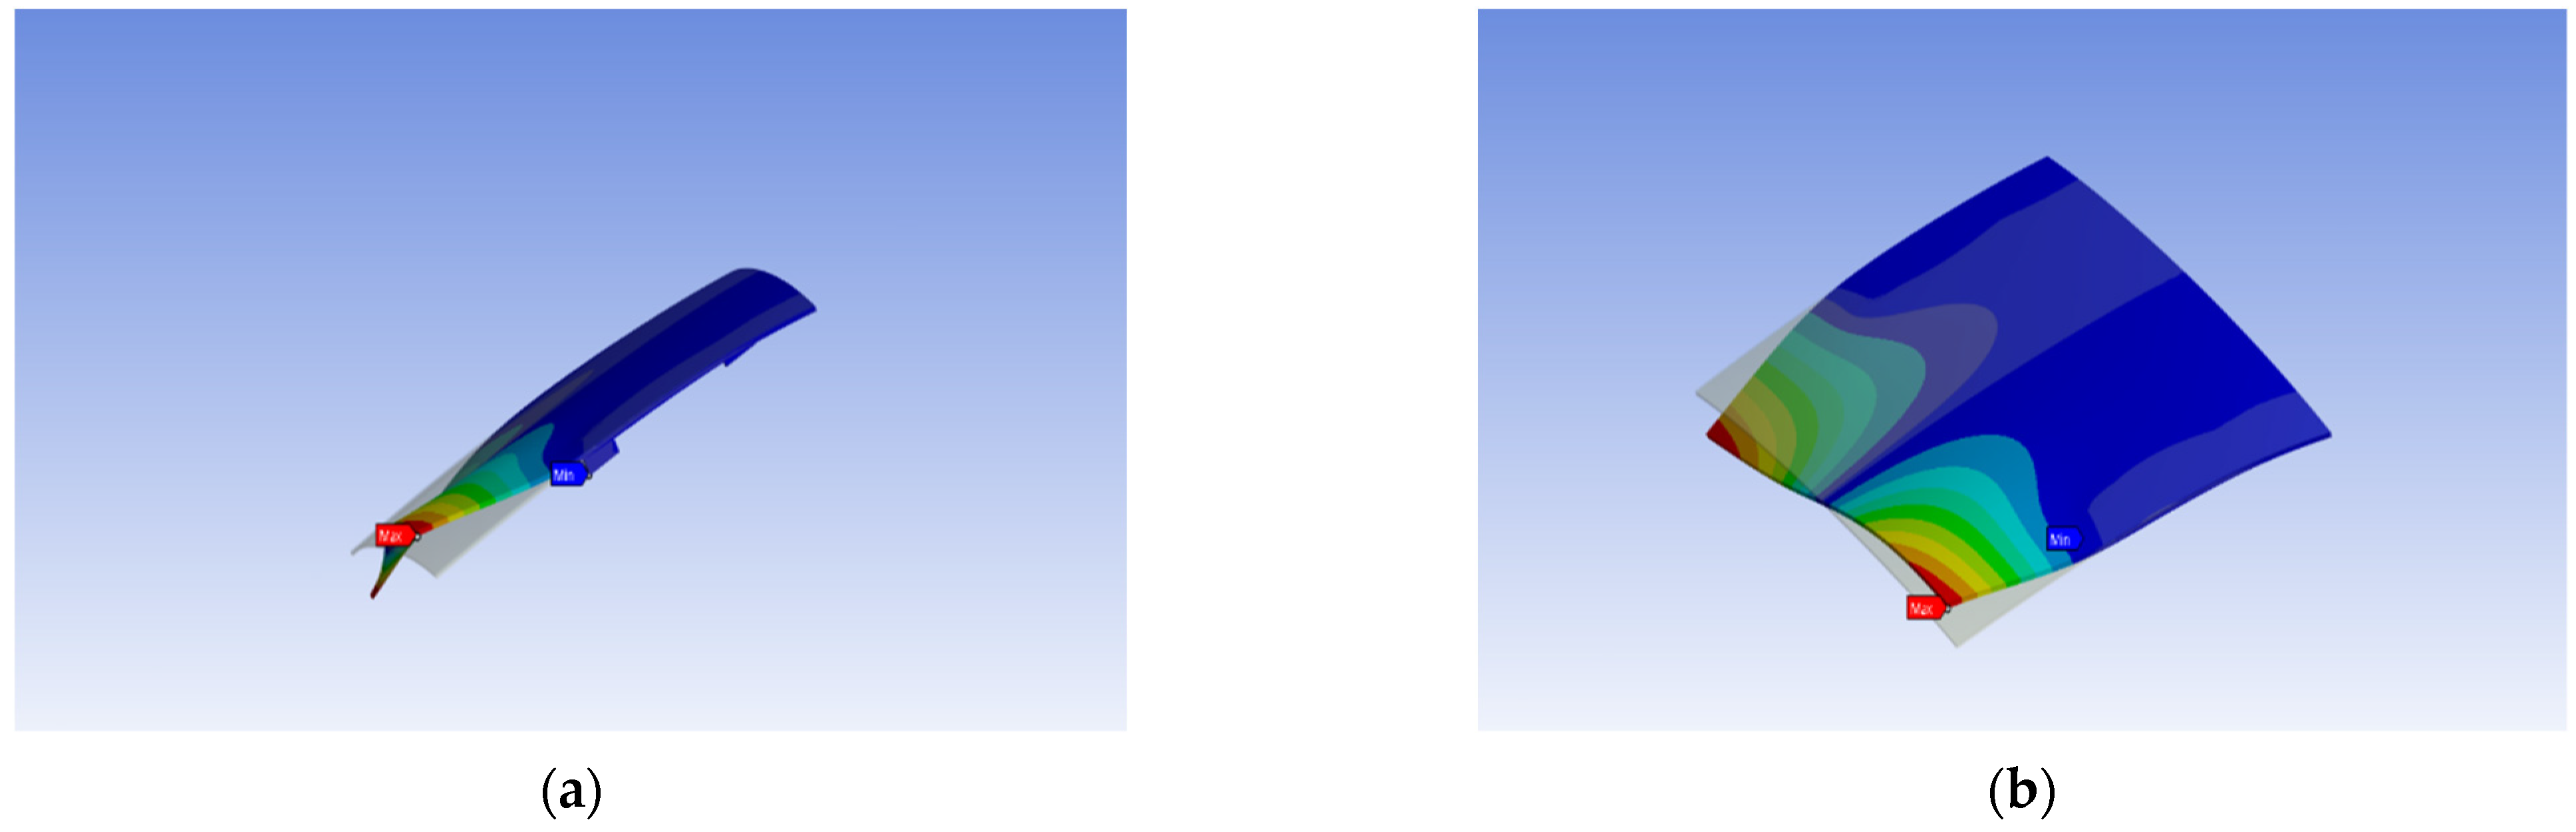
4.3. Modal Analysis Results for the Base Model

The resonance frequencies of the sunroof glass determined by the modal analysis were 15.673 Hz, 23.069 Hz, and 31.864 Hz for the first, second, and third orders, respectively. Figure 18, Figure 19 and Figure 20 shows 1st, 2nd, and 3rd mode shapes of sunroof glass.
Mode analysis confirmed that the first resonance frequency corresponded to a bending mode shape, in which the sunroof bent up and down based on the front support. In the X-axis direction, the rear portion exhibited the largest displacement along the virtual center line connecting the front and back of the sunroof in the X-axis direction. For the second resonance frequency mode, the two corners of the rear part had the greatest displacement. This mode involved bending the left and right sides around the X-axis center line, producing a torsional effect. The second resonant frequency mode exhibited a bending shape where both corners of the rear part experienced the highest displacement, bending in the same direction.
Table 7 presents the comparative analysis results of resonant frequencies obtained from sunroof glass modal analysis and the ODS test, which are based on existing experimental data. The first resonance frequency of the sunroof glass was 15.851 Hz, with an error rate of approximately 1.6% compared to the experimental results. In addition, the second resonance frequency mode was confirmed to be 23.298 Hz, with an error rate of approximately 1.7%. Furthermore, starting with the third mode, the error rate tended to increase gradually because of environmental factors in the test conditions and differences in boundary conditions between testing and analysis. An additional aspect to consider is the qualitative comparison of mode shapes in addition to natural frequencies, as illustrated in Figure 21. Comprehensively analyzing the mode shapes of EMA, ODS, and analysis results, the first mode showed a slight deformation of the front part due to the influence of the sunroof front support, but the rear sunroof glass showed a bending mode shape that bent up and down. In addition, in the second and third modes, a torsional mode shape was shown in which the left and right sides were bent along the axis connecting the front and rear of the sunroof. In the case of the third mode, from the numerical analysis, this mode shape is different from the others. It is thought that there is another mode shape in addition to EMA and ODS which sits between the second and third mode shapes. This shape is caused by an unknown condition in the experimental setup and cannot be replicated by the numerical analysis.
If there is a discrepancy between the two results, there are two ways to reduce it: (1) The finite element model should be delicately tuned (material properties, boundary conditions, element type and size, and so on) so that its modal properties are made as close as possible to the physical model. (2) The experiment should be done again with more accurate settings, such as changing the accelerometer location to accurately measure the natural frequency, and adjusting the excitation of an appropriate impact hammer.
Before examining the influence of each factor, this study assessed whether the modal analysis outcomes of the sunroof glass aligned with the frequency range relevant to the bolt loosening phenomena. A prior investigation into bolt loosening issues in vehicle sunroofs highlighted the significant impact of the initial bolt axial force loss caused by repetitive external vibrations or impact loads. A direct correlation was observed between axial displacement and its influence on bolt loosening, with greater displacement yielding greater impact. Thus, the current focus was to verify the resonant frequency range that induces the maximum axial displacement, as confirmed by the ODS test evaluations. The accelerometer measurements revealed a peak amplitude of 138.08 m/s² at the secondary mode of 22.9 Hz and the second highest amplitude of 123.32 m/s² at the primary mode of 15.6 Hz. Based on these findings, the 22.9 Hz and 15.6 Hz frequency bands had the most pronounced effect on bolt loosening phenomena. Consequently, future analysis will examine these frequency bands to explore the variations in sunroof glass resonance frequency induced by design factors during the optimal design.

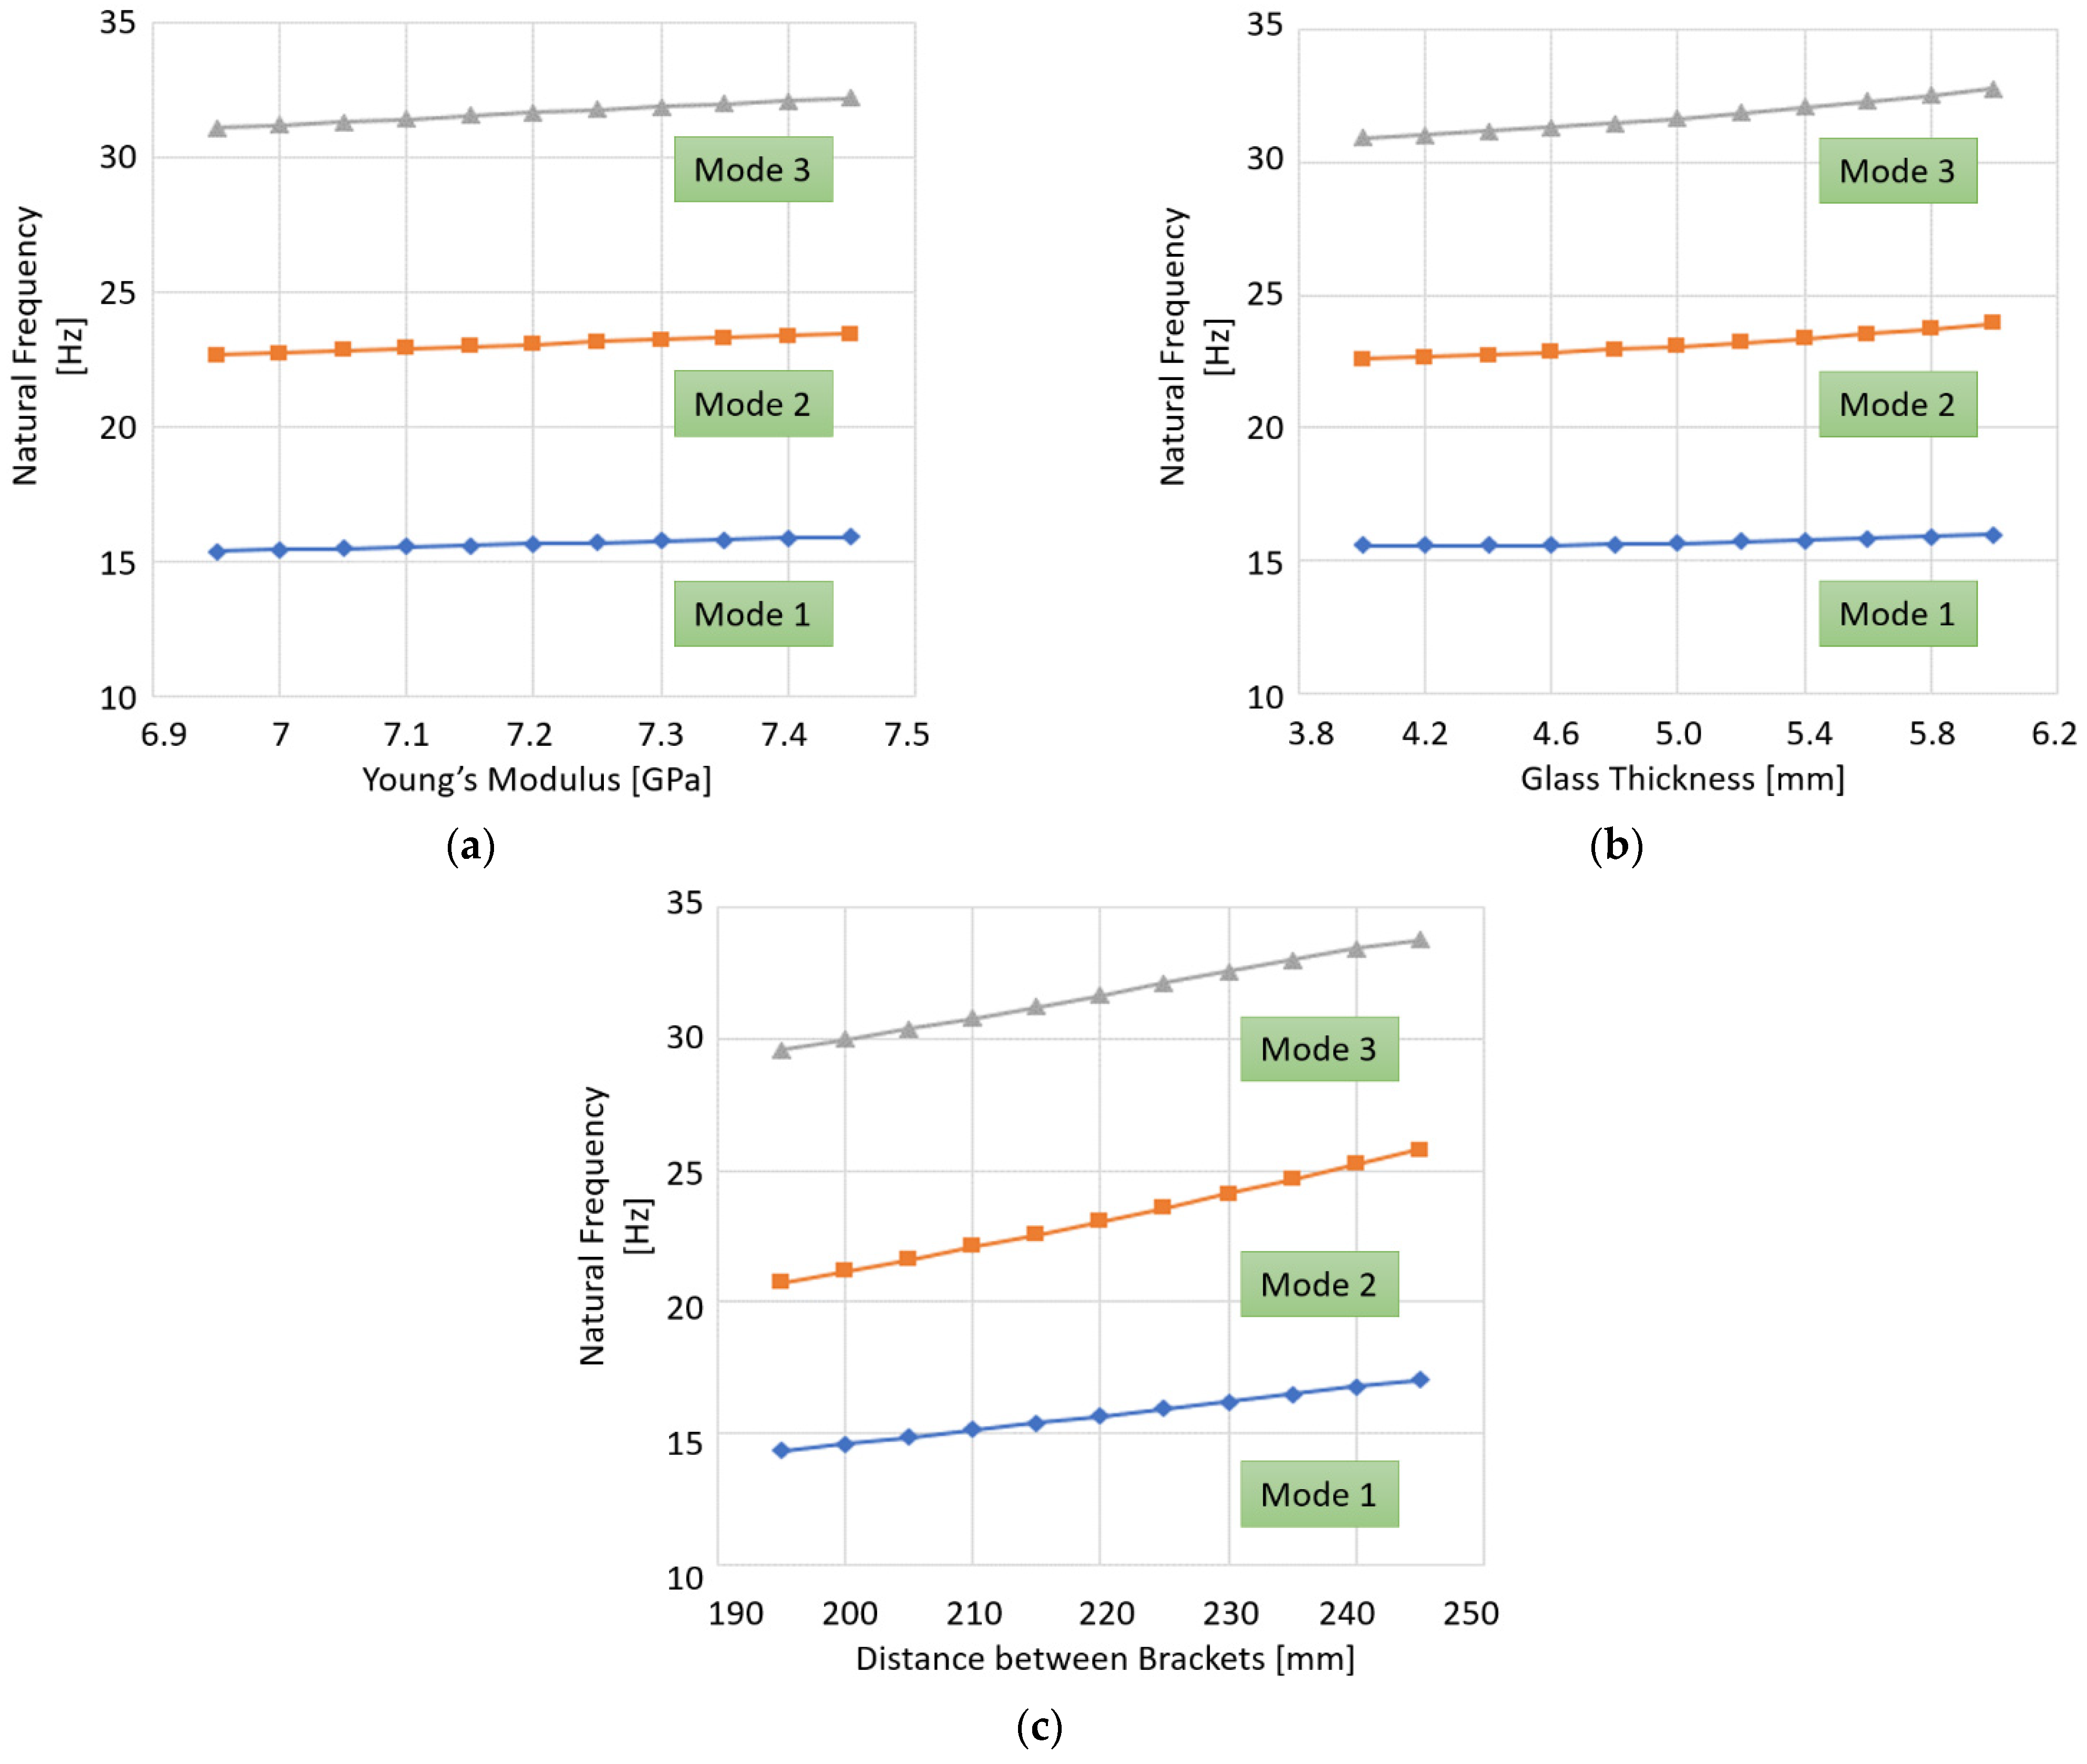
4.4. Modal Analysis According to Changes in Design Factors

Adjustments will be made to the following three primary design factors to propose an optimal design to avoid resonance frequencies of the sunroof glass and reduce vibrations: 3D modeling design elements, Young’s modulus, glass thickness, and bracket position. First, focusing on Young’s modulus, a coefficient reflecting displacement changes relative to stress in elastic materials, this study examined its impact on the resonance frequency. The tempered glass used in sunroofs typically comprises 45–75% SiO2, 10–30% Al2O3, 0–20% B2O3, and 10–25% Na2O, with potential enhancements in mechanical strength achievable through modifications of its composition. Chemical strengthening methods, such as precise temperature control, can induce a compressive stress layer on the glass surface, enhancing its mechanical properties. In particular, Al2O3, found in tempered glass, contributes to the ion exchange performance and can influence the Young’s modulus depending on its concentration [28]. Given its pivotal role in product design and its adaptability to manufacturing improvements, the Young’s modulus is a critical design factor for optimization. The Young’s modulus was modified by increasing or decreasing by 0.05 GPa and repeating the analysis five times each; the results of the 3D modeling analysis on the sunroof glass are as follows.
Table 8 lists the variation in natural frequency with the changes in Young’s modulus. The natural frequency increases as the Young’s modulus increases, and vice versa. For example, with a standard change of 0.05 GPa, the first mode experiences an approximate 0.055 Hz increase, whereas the difference mode displays a resonance frequency shift of approximately 0.08 Hz.
The thickness of the glass is a crucial design factor because of its ease of application and modification during product design. Moreover, variations in mass resulting from changes in thickness affect the vibration characteristics and manufacturing costs. The effects of thickness alterations on the sunroof glass were examined by repeating the analyses ten times with thickness adjustments of ±0.2 mm. The ensuing analysis results are outlined below.
An increase in glass thickness corresponds to a rise in resonant frequency (Table 9), whereas a decrease in thickness leads to a proportional decrease in resonance frequency. Unlike the linear relationship observed with the changes in Young’s modulus, changes in glass thickness result in varying rates of resonant frequency change. In particular, as the thickness increased, the rate of change in the first resonant frequency increased from approximately 0.05 Hz to 0.08 Hz, while a thinning of the glass resulted in a decrease in this rate from 0.04 Hz to 0.01 Hz. For example, with a maximum analysis thickness of 6.0 mm, the first mode experienced an approximate 0.08 Hz increase, while the second mode increased by approximately 0.2 Hz, reaching 15.995 Hz and 23.928 Hz, respectively. By contrast, with a minimum glass thickness of 4.0 mm, the analysis yielded frequencies of 15.581 Hz and 22.603 Hz for the first and second modes, respectively, showing an approximately 0.002 Hz and 0.06 Hz change for the first and second modes, respectively.
Subsequently, this study examined the frequency change characteristics resulting from variations in the bracket supporting the sunroof glass within the vehicle, as shown in Table 10. Such changes involve numerous design considerations, including bracket area, shape, and mounting location. In this study, a consistent bracket area and shape were maintained while altering the support point of the bracket. Figure 17 shows the configuration of the sunroof glass support bracket. A front bracket adjacent to the front of the sunroof and a rear bracket positioned near the center were installed symmetrically along the front-to-rear axis of the sunroof. Given the implications of bracket movement on factors, such as visibility and structural integrity, the position of the front bracket was fixed, and the support point of the rear bracket was varied. By moving the rear bracket support point forward and backward by 5 mm relative to the reference point, located 220 mm apart from the front brackets, this study analyzed the resulting changes in resonance frequency across ten support point configurations.
Similar to the change in Young’s modulus and glass thickness, the resonant frequency increased as the distance between the brackets increased, and vice versa. According to a 5 mm change, which is the standard change in distance between brackets, the first and second modes showed an approximately 0.271 Hz and 0.507 Hz change in resonance frequency, respectively. Compared to the change in resonance frequency due to the change in Young’s modulus, the first mode showed 4.9- and two-fold changes in resonance frequency, respectively. In car mode, the amount of change was relatively large, at 6.3 times.
The resonance frequency characteristics of sunroof glass were examined according to changes in three major design factors to propose an optimal design: Young’s modulus, glass thickness, and bracket position, which are design elements of 3D modeling. The results are summarized in Figure 22.

5. Conclusions and Future Research Directions

This study aimed to mitigate vibrations in vehicle sunroofs and ensure structural stability through design optimization. The actual vibration levels and characteristics of sunroof glass were investigated by calculating the equation of motion and natural frequencies using thin plate theory and validating these findings with experimental tests. An EMA test was conducted on a vehicle equipped with accelerometers to measure vibrations with an impulse hammer in the laboratory, while an ODS test was performed on the same object during vehicle operation (cruising condition with constant velocities). This facilitated an assessment of vibration phenomena within the vehicle sunroof system, focusing on parameters such as the natural and resonance frequencies.
First, the inherent vibration characteristics of sunroof glass when installed on a vehicle were examined using EMA testing. The tests were conducted at varying sunroof positions, revealing clearer vibrations at increased opening levels. Subsequently, ODS testing was conducted to validate the findings under real driving conditions, considering road surface and speed factors. A comparative analysis between EMA and ODS results confirmed the resonance frequencies, showcasing minor deviations between the two methods. Based on the experimental vibration data, 3D modeling of the sunroof glass was used to analyze the changes according to the key design factors: Young’s modulus, glass thickness, and bracket position.
-
Young’s modulus variation:
As Young’s modulus increased or decreased, resonant frequencies showed the corresponding changes, exhibiting a linear relationship. This indicates a potential avenue for improving the vibration characteristics without significant structural alterations.
-
Glass thickness alteration:
Similar to the Young’s modulus, increasing the glass thickness leads to higher resonant frequencies and vice versa. On the other hand, the rate of frequency change decreased as the thickness decreased, raising considerations for manufacturing cost efficiency.
-
Bracket position adjustment:
Changing the distance between brackets affects the resonance frequencies linearly, with larger changes resulting in larger frequency shifts. Increasing the bracket distance enhanced the dynamic rigidity, suggesting potential design improvements.
The contributions of this research are as follows.
(1)
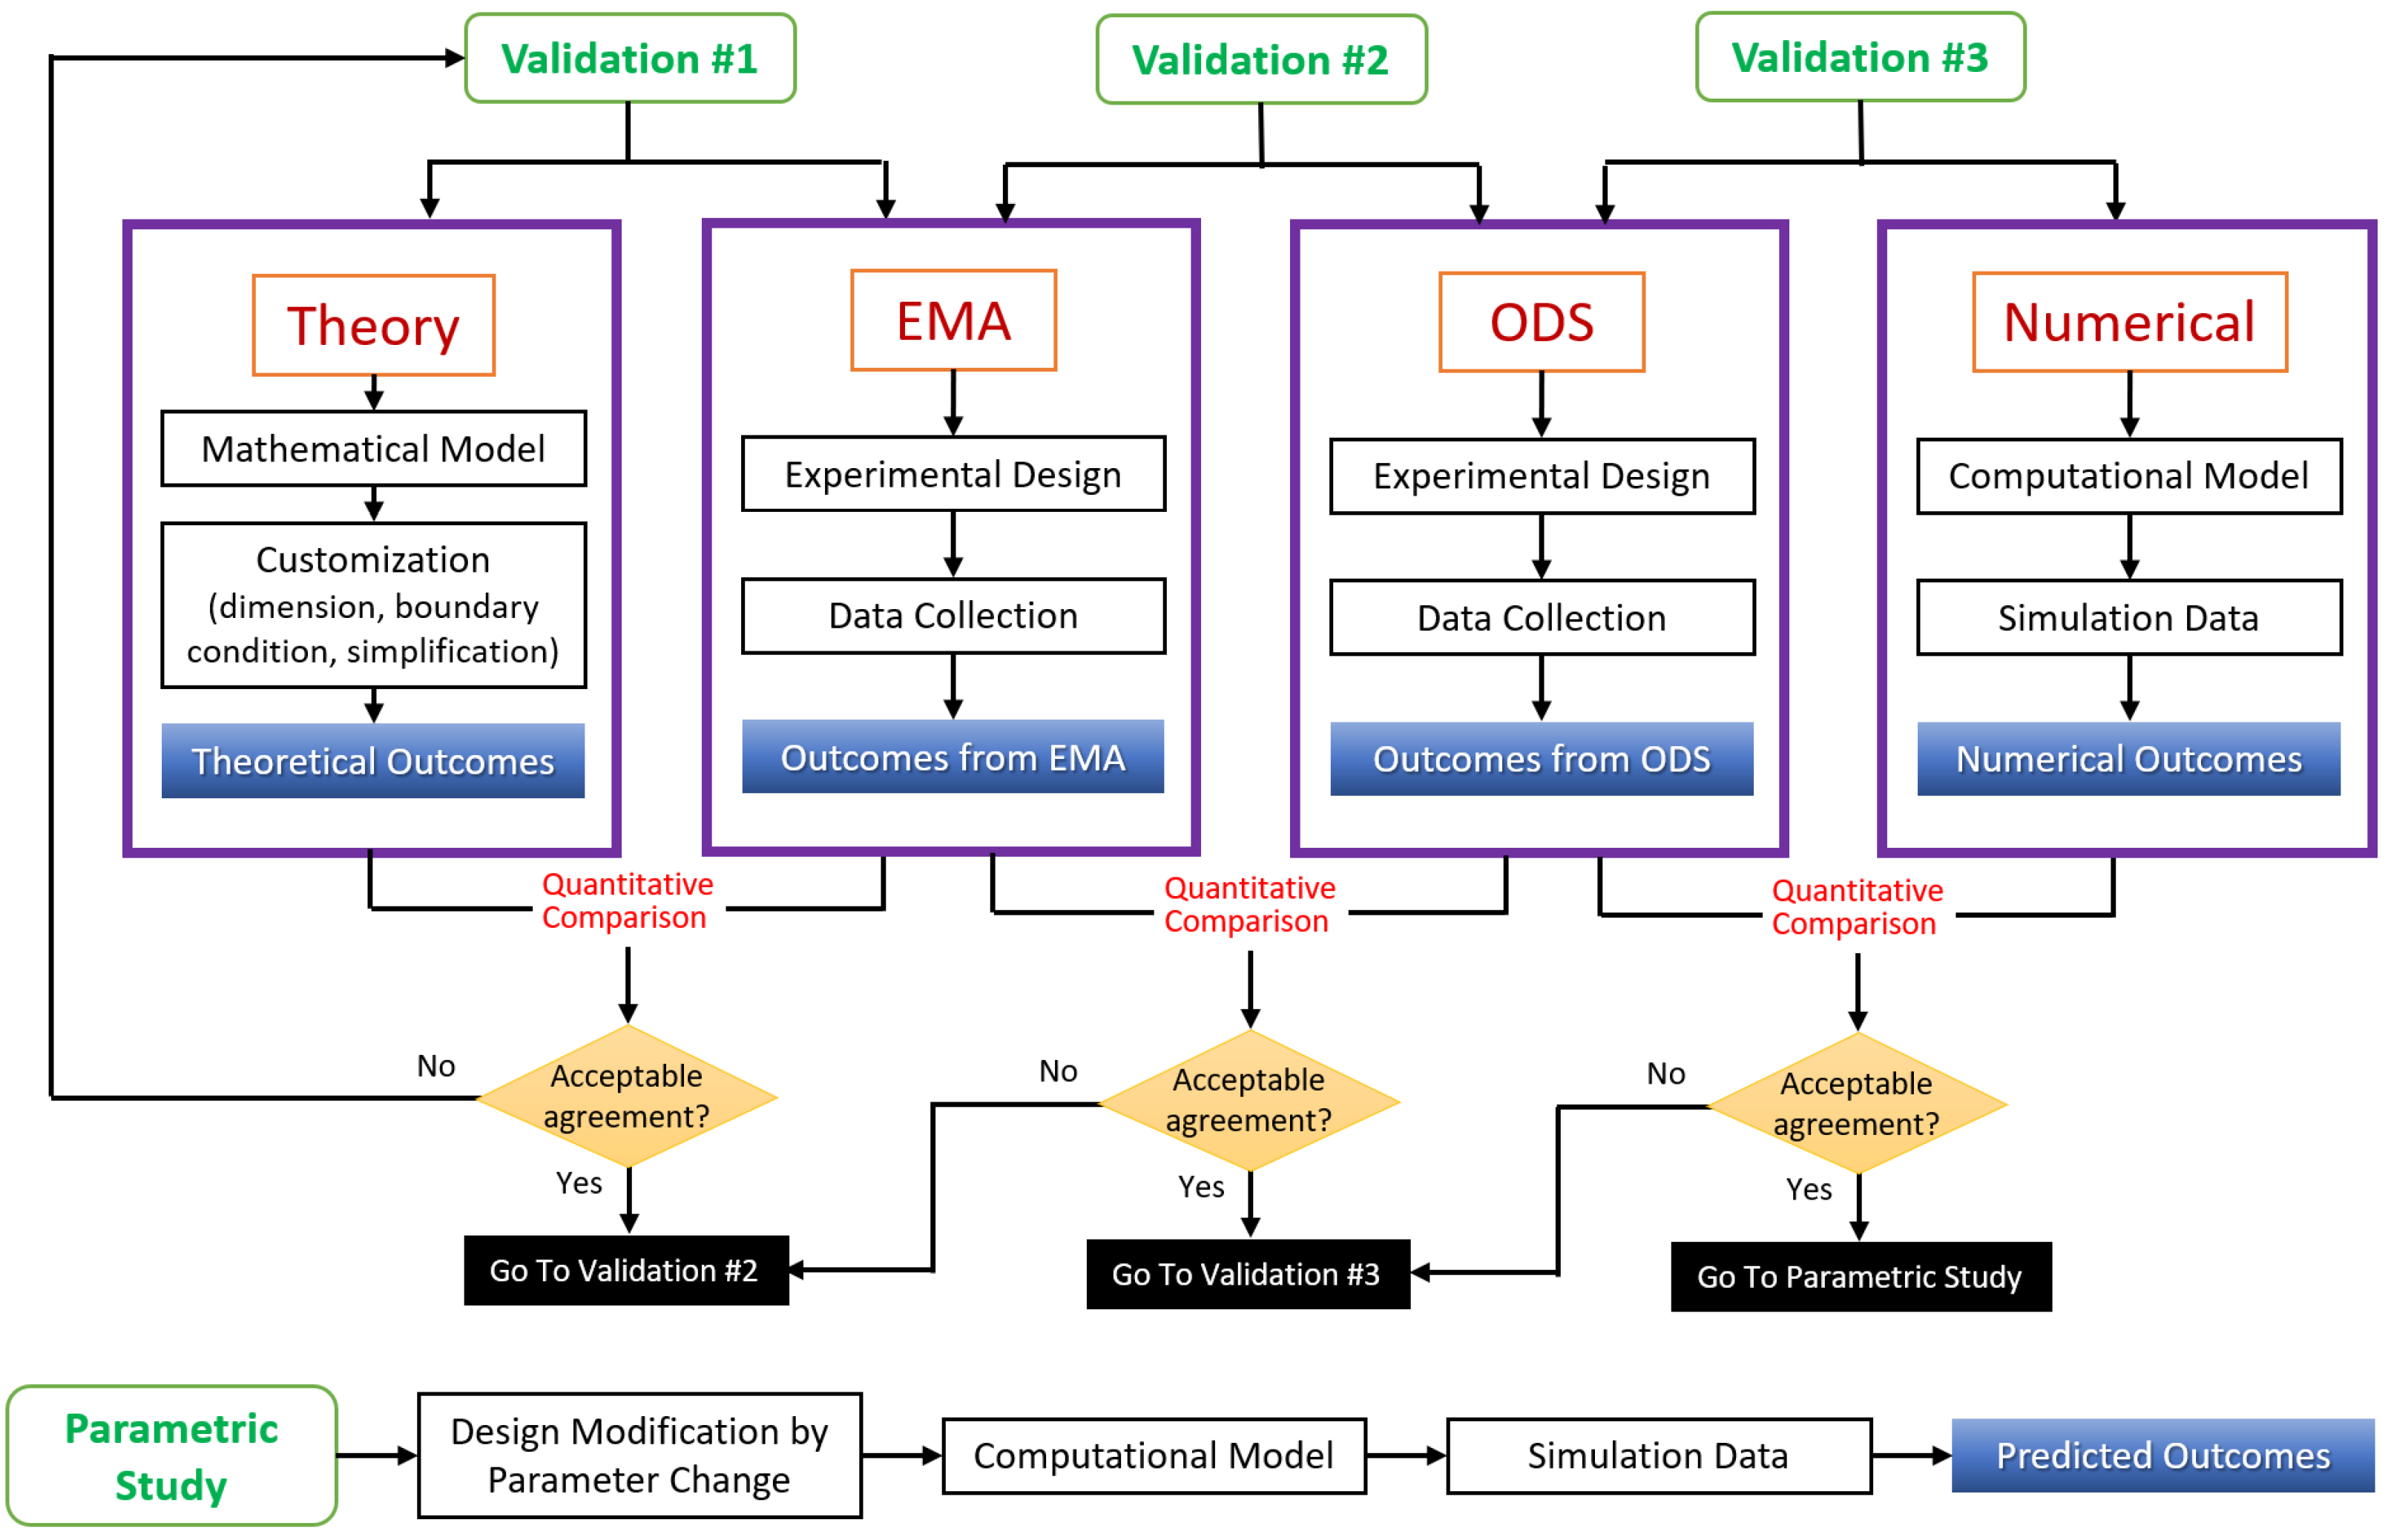
Experimental work for vibration measurements of the whole vehicle were conducted “during operation” with the sunroof system installed, while prior investigations were constrained to examining the static rigidity of a single part.
(2)
An effort was undertaken to establish reliability among different methodologies through a comparison of theoretical, analytical, ODS, and EMA results.
(3)
On this basis, parametric study-based optimization process is conducted, and it is confirmed that an optimal design is feasible to reduce the vibration of the vehicle sunroof that occurs while the vehicle is in motion.
The novelty of this work can be found in the vibration measurements in driving conditions, which are validated with theoretical, analytical, and EMA results. Thus, this type of work can be employed in other applications by replicating this process. Although the amounts of change in the parameters were relatively minimal (limited to the range set, not the entire possible range), they show that there is some possibility for improving vibration through parameter changes. Future research should expand optimization methods, considering various sunroof types and vehicles. Also, there should be investigations with regards to the functionality of the sunroof affected by the parameter changes. Exploring additional design factors and cost optimization is also warranted. Implementing the proposed design optimizations, particularly by adjusting bracket support points, promises improved sunroof glass performance, with potential applications beyond the automotive industry. This includes the aircraft and maritime sectors, contributing significantly to vibration reduction research.

Author Contributions

Conceptualization: B.K.; methodology: S.L.; software: S.L.; writing—original draft preparation: S.L.; writing—review and editing: B.K. All authors have read and agreed to the published version of the manuscript.

Funding

This work was supported by the Basic Science Research Program through the National Research Foundation of Korea (NRF) funded by the Ministry of Education (NRF-2021R1A6A1A03039493 and NRF-2022R1F1A1076089).

Institutional Review Board Statement

Not applicable.

Informed Consent Statement

Not applicable.

Data Availability Statement

The data presented in this study are available upon request from the corresponding author. These data are not publicly available because of the large sample size.

Conflicts of Interest

The authors declare no conflicts of interest.

References

  1. Ha, J.; Choi, S.; Jeon, B.; Ra, M.; Jeong, S. Reliability Evaluation for Tubeless Frame System of the Sunroof on the Car Body. In Proceedings of the KSAE 2015 Annual Conference and Exhibition, Gyeongju, Republic of Korea, 18 November 2015. [Google Scholar]
  2. Lee, K.H.; Kim, C.M.; Kang, Y.K. An Optimal Placement of Passive Constrained Layer Damping Treatment for Vibration Suppression of Automotive Roof. J. Korean Soc. Noise Vib. Eng. 2004, 11, 349–353. [Google Scholar]
  3. Choi, G.; Shin, D.; Choi, S.; Jeong, S. A Study on the Structural Analysis of Automotive Sunroof System. In Proceedings of the KSAE 2015 Annual Conference and Exhibition, Gyeongju, Republic of Korea, 18 November 2015. [Google Scholar]
  4. Hwang, J.D.; Cho, S.J.; Kim, C.S.; Kang, S.H. A Study on the Vibration Test and Analysis for the Sun Shield Roof of Heavy Construction Equipment. In Proceedings of the Korean Society of Precision Engineering Conference, Jeju, Republic of Korea, 31 May 2012. [Google Scholar]
  5. Ha, J.; Choi, S.; Jeon, B.; Ra, M.; Jeong, S. Optimum Structural Design Tubeless Frame System of the Sunroof on the Car Body. In Proceedings of the KSAE 2015 Spring Conference and Exhibition, Gwangju, Republic of Korea, 31 May 2015. [Google Scholar]
  6. Woo, J.; Jeong, H. Design for load of improvement panorama sunroof. In Proceedings of the KSAE 2016 Annual Conference and Exhibition, Daegu, Republic of Korea, 16 November 2016. [Google Scholar]
  7. Kim, I.; Lee, S.; Heo, S.J.; Jeong, J.I. A Study for Evaluation Method of Sunroof System’s Structural Performance. In Proceedings of the KSAE 2010 Annual Conference and Exhibition, Daegu, Republic of Korea, 24 November 2010. [Google Scholar]
  8. Kim, H.; Kang, Y.; Park, H. Identification of Dynamic Characteristics of Vehicle Parts using Experimental Modal Analysis. In Proceedings of the KSAE 2019 Spring Conference and Exhibition, Jeju, Republic of Korea, 9 May 2019. [Google Scholar]
  9. Choi, S.; Song, Y.; Lee, J.; Seo, S.; Kang, H. Dynamic Characteristic Analysis of the Park Lock Wheel Using Mode Analysis and Modal Testing. In Proceedings of the Korean Society of Mechanical Engineers Conference, Taebeak, Republic of Korea, 14 December 2016. [Google Scholar]
  10. Lee, J.M.; Yu, H.T.; Park, G.J.; Choi, H.C.; Choi, B.H. Design for Resonance Avoidance of Mount Though the Modal Analysis. J. Korean Soc. Noise Vib. Eng. 2015, 25, 481–486. [Google Scholar]
  11. Huang, H.; Zhang, Y.; Sui, H. Design Strategy for Fixed Sunroof System; American Society of Mechanical Engineers Digital Collection: Lawrence, KS, USA, 2021. [Google Scholar]
  12. He, Y.; Zhang, Q.; An, C.; Wang, Y.; Xu, Z.; Zhang, Z. Computational Investigation and Passive Control of Vehicle Sunroof Buffeting. J. Vib. Control 2020, 26, 747–756. [Google Scholar] [CrossRef]
  13. Riedelsheimer, A.; Maihöfer, M. Experimental and Numerical Analysis of Sunroof Buffeting of a Simplified Mercedes-Benz S-Class. SAE Int. J. Adv. Curr. Prac. Mobil. 2021, 4, 387–397. [Google Scholar] [CrossRef]
  14. He, Y.; Zhang, Q.; Xu, Z.; Zhang, Z. Study on the Sunroof Buffeting Suppression with a Notched Flat Deflector. INTER-NOISE NOISE-CON Congr. Conf. Proc. 2019, 259, 1677–1683. [Google Scholar]
  15. Zhang, Q.; He, Y.; Wang, Y.; Xu, Z.; Zhang, Z. Computational Study on the Passive Control of Sunroof Buffeting Using a Sub-Cavity. Appl. Acoust. 2020, 159, 107097. [Google Scholar] [CrossRef]
  16. Tang, R.; He, H.; Lu, Z.; Li, S.; Xu, E.; Xiao, F.; Núñez-Delgado, A. Control of Sunroof Buffeting Noise by Optimizing the Flow Field Characteristics of a Commercial Vehicle. Processes 2021, 9, 1052. [Google Scholar] [CrossRef]
  17. Li, S.; Lu, Z.; Tang, R.; Xu, E.; Feng, Z.; Li, G. Optimization of Wind Resistance in Commercial Vehicles with Consideration of Sunroof Buffeting Noise. AIP Adv. 2021, 11, 085304. [Google Scholar] [CrossRef]
  18. Vijaykumar, K.; Poonkodi, S.; Sriram, A.T. Numerical Study on Control of Sunroof Buffeting. Int. J. Veh. Struct. Syst. 2021, 13, 256. [Google Scholar] [CrossRef]
  19. Lee, S.W.; Shin, S.; Choi, E.S.; Yi, J. Analysis of flow characteristics around the sunroof opening variation with sunroof deflector angle. J. Acoust. Soc. Korea 2018, 37, 285–291. [Google Scholar] [CrossRef]
  20. Demori, D.; Oliveira, M.P.D.; Viegas, R.; França, D.; Neto, O.T. Buzz Avoidance on Sunroof Light Sunshades: Design and Validation; SAE International: Warrendale, PA, USA, 2020. [Google Scholar]
  21. Nandagiri, R.; Kumar, S.S.; Nagrale, P.; Chaure, V.; Chormare, S.; Chandrikapure, A.; Sahoo, D. Computational Analysis for Optimal Location of Open Sunroof for an SUV with Ahmed Body Profile. AIP Conf. Proc. 2023, 2890, 020004. [Google Scholar] [CrossRef]
  22. Cao, S.; Zhang, Z.; Zhang, Q.; Xu, Z.; Lin, W. Energy Transfer Characteristics of Sunroof Wind Buffeting Noise via Dynamic Mode Decomposition. J. Sound Vib. 2023, 555, 117724. [Google Scholar] [CrossRef]
  23. Inman, D.J. Engineering Vibration, 3rd ed.; Pearson: Upper Saddle River, NJ, USA, 2008. [Google Scholar]
  24. Reismann, H. ELASTIC PLATES Theory and Application, 1st ed.; Wiley-Interscience: New York, NY, USA, 1988. [Google Scholar]
  25. See, S. Analysis for A Partial Distribution Loaded Orthotropic Rectangular Plate with Various Boundary Condition. J. Korea Inst. Struct. Maint. Insp. 2018, 22, 13–22. [Google Scholar]
  26. Yang, M.; Jeong, S.M.; Lee, S.H.; Lim, J.Y. Experimental Study of Structural Capability Loss of Bolt Clamping Force and Loosening Life of Bolts under Cyclic Loading Conditions. J. Korea Soc. Railw. 2022, 25, 89–95. [Google Scholar] [CrossRef]
  27. Liu, Z.; Zheng, M.; Guo, J.; Chu, H.; Yan, X.; Li, Y. Experimental study on performance characterization of bolted joint under transverse loading. Measurement 2021, 182, 109608. [Google Scholar] [CrossRef]
  28. Murata, T.; Tojyo, T. Tempered Glass and Glass for Tempering. U.S. Patent 20160137550A1, 19 May 2016. [Google Scholar]
Figure 1. Flowchart on the general process of the employed methodologies.
Applsci 14 03085 g001
Figure 2. Structure of a sunroof.
Applsci 14 03085 g002
Figure 3. Plate deformation. (a) Plate in reference configuration and (b) deformed plate.
Applsci 14 03085 g003
Figure 4. Location of the accelerometers on a vehicle sunroof.
Applsci 14 03085 g004
Figure 5. Response geometry for the modal test of a sunroof system.
Applsci 14 03085 g005
Figure 6. Schematic diagram for the modal test setup.
Applsci 14 03085 g006
Figure 7. Response geometry for the modal test with a closed sunroof: (a) Sum FRF in the closed state, (b) Sum FRF with 100 kgf/mm dynamic stiffness plot.
Applsci 14 03085 g007
Figure 8. Response geometry for the modal test with a half-open sunroof: (a) Sum FRF in the half-open state, (b) sum FRF with 10 and 20 kgf/mm dynamic stiffness plots.
Applsci 14 03085 g008
Figure 9. Response geometry for the modal test with an open sunroof: (a) Sum FRF in the open state, (b) sum FRF with 5 kgf/mm dynamic stiffness plot.
Applsci 14 03085 g009
Figure 10. EMA mode shape of the full open sunroof: (a) Mode #1 (15.7 Hz), (b) Mode #2 (22.2 Hz), (c) Mode #3 (28.5 Hz).
Applsci 14 03085 g010
Figure 11. RMS amplitude comparison for sensor attachment location.
Applsci 14 03085 g011
Figure 12. G:25 measurement results and main vibration frequency (30 km/h): (a) waterfall contour map, (b) frequency spectra in all directions.
Applsci 14 03085 g012
Figure 13. G:25 measurement results and main vibration frequency (40 km/h): (a) waterfall contour map, (b) frequency spectra in all directions.
Applsci 14 03085 g013
Figure 14. G:25 measurement results and main vibration frequency (50 km/h): (a) waterfall contour map, (b) frequency spectra in all directions.
Applsci 14 03085 g014
Figure 15. ODS mode shape of the full open sunroof: (a) Mode #1 (15.6 Hz), (b) Mode #2 (22.9 Hz), (c) Mode #3 (28.9 Hz).
Applsci 14 03085 g015
Figure 16. Sunroof system seen from (a) the front and (b) the top.
Applsci 14 03085 g016
Figure 17. Sunroof model. (a) CATIA model with dimensions, (b) side view of CATIA model, (c) side view #1, (d) side view #2, (e) bottom view, (f) ISO view of ANSYS base model.
Applsci 14 03085 g017
Figure 18. 1st Mode shape of sunroof glass (15.673 Hz): (a) side view, (b) top view.
Applsci 14 03085 g018
Figure 19. 2nd Mode shape of sunroof glass (23.069 Hz): (a) side view, (b) top view.
Applsci 14 03085 g019
Figure 20. 3rd Mode shape of sunroof glass (31.864 Hz): (a) side view, (b) top view.
Applsci 14 03085 g020
Figure 21. Mode shape comparison: 1st mode shape from (a) EMA, (b) ODS, (c) numerical analysis. 2nd mode shape from (d) EMA, (e) ODS, (f) numerical analysis. 3rd mode shape from (g) EMA, (h) ODS, (i) numerical analysis.
Applsci 14 03085 g021
Figure 22. Change in natural frequency due to a change in design factors of: (a) Young’s modulus, (b) glass thickness, (c) distance between brackets.
Applsci 14 03085 g022
Table 1. Natural frequencies of a rectangular plate (a/b = 4:3).
imn 16 a π 2 ρ h D 1 / 2 Ω i
11125
21252
32173
41397
522100
623145
731153
814160
932180
1024208
1133225
1241265
Table 2. Natural frequencies of sunroof glass (a:b = 5:2.451).
imn 16 a π 2 ρ h D 1 / 2 Ω i Ω i
11131.0084998.129787
21249.03399616.909958
321106.00849923.738979
41379.07649231.543575
522124.03399632.519150
623154.07649247.152767
731231.00849949.754299
814121.13598652.030639
932249.03399658.534469
1024196.13598667.639831
1133279.07649273.168087
1241406.00849986.175747
Table 3. Natural frequency according to the sunroof state.
StateNatural Frequency [Hz]
#1#2#3#4#5#6
Close34.78553.10085.949---
Mid-open26.49033.83052.01193.802--
Full-open15.74222.24528.50133.78956.98695.897
Table 4. Natural frequency comparison of the theoretical and EMA results.
StateNatural Frequency [Hz]
TheoreticalEMADifferencePercentage (%)
#18.129787---
#216.90995815.7421.1686.907
#323.73897922.2451.4946.293
#431.54357528.5013.0439.646
#532.51915033.789−1.2703.905
#647.152767---
#749.754299---
Table 5. Natural frequency comparison of the EMA and ODS results.
ModeNatural Frequency [Hz]
EMAODSDifferencePercentage (%)
#115.74215.6000.1420.902
#222.24522.9000.6552.944
#328.50128.9000.3991.400
Table 6. Material properties of tempered glass.
PropertySymbolUnitValue
Young’s modulus E GPa72
Poisson’s ratioν-0.23
Thermal expansion coefficientα 10 6   K 1 9.5
Tensile strength (float glass) f t MPa165
Compressive strength f c MPa300
Densityρ k g / m 3 2500
Table 7. Natural frequency comparison of the ODS and modal analysis results.
ModeNatural Frequency [Hz]
ODSModal AnalysisDifferencePercentage (%)
#115.60015.8510.2511.609
#222.90023.2980.3981.738
#328.90031.8642.96410.256
Table 8. Parametric study with the change in Young’s modulus.
Nat. Freq
[Hz]
Young’s Modulus (GPa)
7.2 (base)7.157.17.057.06.95
Mode #115.67315.61915.56415.50915.45415.399
Mode #223.06922.98922.90822.82822.74722.665
Mode #331.63231.52231.41131.30131.18931.078
Nat. Freq
[Hz]
Young’s Modulus (GPa)
7.2 (base)7.257.37.357.47.45
Mode #115.67315.72815.78215.83615.89015.943
Mode #223.06923.14923.22923.30823.38723.466
Mode #331.63231.74131.85131.96032.06832.176
Table 9. Parametric study with the change in glass thickness.
Nat. Freq
[Hz]
Glass Thickness [mm]
5.0(base)4.84.64.44.24.0
Mode #115.63115.63515.60715.58815.57915.581
Mode #223.06922.94322.83322.73922.66222.603
Mode #331.63231.44831.28231.13331.00330.893
Nat. Freq
[Hz]
Glass Thickness [mm]
5.0(base)5.25.45.65.86.0
Mode #115.67315.72115.77715.84215.91515.995
Mode #223.06923.21123.36923.54123.72723.928
Mode #331.63231.83032.04332.26832.50332.746
Table 10. Parametric study with the change in distance between brackets.
Nat. Freq
[Hz]
Distance between Brackets [mm]
220 (base)215210205200195
Mode #115.67315.39915.14114.87414.60414.347
Mode #223.06922.56422.10321.62021.18520.728
Mode #331.63231.18430.76930.33629.95729.557
Nat. Freq
[Hz]
Distance between Brackets [mm]
220 (base)225230235240245
Mode #115.67315.94816.22316.49516.78217.060
Mode #223.06923.57724.11124.65325.22825.798
Mode #331.63232.07632.53032.96833.38233.720
Disclaimer/Publisher’s Note: The statements, opinions and data contained in all publications are solely those of the individual author(s) and contributor(s) and not of MDPI and/or the editor(s). MDPI and/or the editor(s) disclaim responsibility for any injury to people or property resulting from any ideas, methods, instructions or products referred to in the content.

