1. Introduction
Contemporary machines and devices represent complex dynamic systems both in terms of functionality and construction, as well as spatially. The process of their manufacturing and operation consumes vast amounts of labor, materials, and energy. The rapid increase in requirements regarding the technical parameters of machines and devices, coupled with the simultaneous pursuit of reducing manufacturing and operation costs, has brought about fundamental transformations in design methods, production control, and operations. Numerous random damages, unexpected failures, and issues related to damages caused by life and aging processes justify the need for vibration research, which serves as a fundamental source of information about the changing condition [
1,
2,
3,
4].
Hydraulic presses play a critical role in various industrial applications, ranging from metal forming to plastic molding [
5]. These machines are subjected to dynamic forces and vibrations during operation, which can affect their performance, reliability, and longevity. Monitoring these vibrations is essential for ensuring the optimal functioning of hydraulic presses and for detecting any potential mechanical issues that may arise [
6].
In recent years, advancements in measurement technology have provided engineers with sophisticated tools for accurately capturing and analyzing vibrations in hydraulic presses. One such technology is the use of advanced measurement systems equipped with accelerometers and data acquisition capabilities. These systems offer the precise monitoring of vibrations in multiple axes, allowing for a comprehensive assessment of the press’s structural integrity and operational efficiency [
7,
8].
Conventional vibration measurements are limited by the placement of only a limited number of sensors. However, with the advent of computing power and digital imaging technology, the emergence of 3D digital image correlation (DIC) methods has revolutionized the analysis of structural dynamics [
9]. By enabling the full-field measurement of structural responses, DIC facilitates the simultaneous acquisition of a comprehensive data set. The results obtained using the DIC technique are compared with measurements of a conventional accelerometer and scanning laser vibrometer and with the finite element model. Strong correlations can be seen between all three finite element approaches, thus confirming the effectiveness of the DIC method in capturing full-field vibration phenomena.
One of the novel vibration measurement methods is three-dimensional (3D) continuously scanning laser Doppler vibrometry (CSLDV) [
10]. This system represents a cutting-edge technology in the field of structural dynamics analysis. This advanced system employs laser Doppler vibrometry (LDV) principles to precisely measure vibrations across three dimensions, providing comprehensive insights into the dynamic behaviors of structures. The CSLDV system operates by emitting a laser beam onto the surface of the target structure. This laser beam interacts with the surface, and the reflected light is collected by the system’s optical components. By analyzing the Doppler shift in the frequency of the reflected light caused by the motion of the surface, the CSLDV system accurately detects and measures the vibrations of the structure. What sets the CSLDV system apart is its capability for continuous scanning. Unlike traditional vibrometers that measure vibrations at discrete points, the CSLDV system dynamically scans the entire surface of the structure, capturing vibrations across the entirety of the scanned area. This enables the system to provide a comprehensive spatial map of vibrations, offering detailed information about mode shapes, frequencies, and amplitudes across the structure. Furthermore, the CSLDV system operates in three dimensions, meaning it can measure vibrations not only along the surface of the structure but also in the depth direction. This capability is particularly useful for analyzing complex structures with intricate geometries or for investigating vibrations that propagate through the thickness of materials [
11].
Non-destructive vibration testing is a pivotal aspect of structural health monitoring, crucial for assessing structural integrity and mitigating risks associated with structural performance deficiencies [
12]. Among the array of vibration testing methods, ambient vibration testing stands out as the most cost-effective and widely utilized technique for evaluating a structure’s physical condition during operational service. Leveraging ambient vibration data, modal identification serves as a valuable tool for informing model updates and detecting damage throughout a structure’s lifespan. Extensive research has demonstrated the efficacy of modal identification in probing the dynamic behavior of diverse structural typologies. Modal identification executes using a Fast Bayesian FFT method, chosen for its capacity to determine modal parameters with probabilistic precision while analytically assessing associated uncertainties—a critical consideration in field vibration testing scenarios marked by factors such as measurement noise, sensor misalignment, and modeling discrepancies.
This article focuses on the utilization of such an advanced measurement system for vibration monitoring in hydraulic presses. The system comprises a three-axis accelerometer, a data acquisition unit, and dedicated measurement software. Through a detailed case study analysis, the configuration of the measurement system was examined, including the selection of sensor placement and sampling frequency, to optimize the measurement process.
Furthermore, the effectiveness of vibration monitoring in hydraulic presses through practical experimentation and data analysis was evaluated. By comparing measured vibration levels to established thresholds and conducting a frequency domain analysis, the aim of this research was to identify patterns and trends indicative of the press’s operational condition. Additionally, the impact of production parameters on vibration levels was investigated, and we explored how vibration monitoring can contribute to process optimization and maintenance planning.
Overall, this article underscores the importance of vibration monitoring in hydraulic presses and highlights the capabilities of advanced measurement systems in providing valuable insights into machine performance and health. By leveraging such technology, manufacturers can enhance productivity, minimize downtime, and ensure the longevity of their hydraulic press equipment. The novelty of the research lies in the comprehensive exploration and application of cutting-edge measurement technologies for vibration monitoring in hydraulic presses that work in real-time (online). That means vibration data are collected and analyzed immediately after vibrations occur. Unlike traditional methods where measurements can be performed periodically or after the machine has finished operating, real-time monitoring allows one to quickly identify even subtle changes in vibrations, which may indicate potential mechanical problems, failures, or changes in production parameters.
The structure of the paper is as follows. In
Section 2, an overview of the current state of the art in the field of vibration monitoring in industrial machines, with a specific focus on hydraulic presses, is described.
Section 3 outlines the characteristics of the proposed measuring system. In
Section 4, the measurement method, including experimental procedures and signal analysis, is detailed. Furthermore, in the same section, the experimental results obtained from our study are presented.
Section 6 concludes the paper, summarizing the main objectives and discussing potential directions for future technology development.
2. State of the Art
Measurement is defined as a cognitive process involving the comparison, through physical experience, of a given quantity with a certain reference value accepted as the unit. This definition can be expanded to acknowledge that some automatic measuring instruments also fulfill executive tasks [
13].
Measurement is thus the process of receiving and transforming information about the measured quantity in order to obtain, by comparison with a measurement unit, a quantitative result in a form most convenient for perception by human senses, transmission in space or time (registration), mathematical processing, or utilization for control purposes [
14].
Conducting such measurements is necessary for the following [
15,
16,
17]:
Determining vibration waveforms and their parameters over time to identify the type of vibrations and their characteristic magnitudes, and for conducting detailed analysis;
Detecting sources of vibrations, i.e., identifying the cause of vibration occurrence and their locations;
Determining characteristic features of mechanical systems (e.g., determining variations in loads over time during vibrations and their dependence on object parameters, shapes, dimensions, material properties, etc.);
Isolating and reducing harmful vibrations for the reliable operation of equipment and the wellbeing of operators;
Assessing the harmfulness of occurring vibrations for the operation of mechanical equipment and carrying out certain preventive measures.
Often, it is crucial to determine the waveforms of natural and forced vibrations of mechanical systems. Only for simple systems can these waveforms be determined analytically. For more complex systems, these waveforms result from the superposition of natural vibrations, and they must be experimentally determined based on measurements at various points in the system. The waveforms of natural vibrations depend on the initial conditions and mechanical parameters of the system. The waveforms of forced vibrations depend on changes in excitation over time. Based on the obtained vibration waveforms, their type (periodic, random, non-stationary, etc.) can be determined, and an analysis can be conducted [
18].
The aim of the analysis is to obtain information about the vibration parameters of a given system. An important aspect is to determine the nodes of vibration (points, lines, or surfaces that do not participate in vibrations) and points where the vibration amplitudes are highest for a given frequency. The set of vibration amplitudes of individual points in the system represents the shape (waveform) of the vibrations. These issues are the subject of geometric analysis [
19,
20,
21].
Time-domain analysis involves determining how various quantities (linear displacement, velocity, acceleration, deformation, etc.) change over time [
22]. If the changes are periodic, their frequency is also determined. If the changes are random, statistical methods are used for analysis [
23,
24].
Insightful conclusions can also be drawn from a frequency-domain analysis, which involves determining characteristic changes in quantities and parameters as a function of frequency. Sources of vibrations can arise from constructional reasons (e.g., crank mechanisms, cam mechanisms, and other devices performing movements, such as drives of vibratory machines), technological reasons (imperfections in the manufacturing and assembly of machinery, e.g., imbalance of rotating masses, ovalization of bearing elements and rotating parts, unwanted clearances, and other defects), or operational reasons (due to wear of components and surface distortions during motion) [
25,
26,
27].
By measuring the vibrations of individual elements of the examined object, it is possible to identify a subset that is the source of harmful vibrations. Often, replacing this subset can significantly reduce the vibrations of the entire object. It is relatively easy to detect vibrations resulting from kinematic excitation, i.e., those caused by the motion of a specific element (e.g., vibrations due to a vehicle moving on an uneven road), or dynamic excitation, i.e., due to the action of external forces on a specific element or forces resulting from the interactions of other components [
28]. The magnitude of the force may change (periodically or non-periodically), or only its direction or point of application may change over time (e.g., centrifugal forces resulting from the rotational motion of an unbalanced mass). It is more difficult to detect self-excited vibrations, which are usually caused by varying frictional resistance, hydrodynamic and aerodynamic forces, or the occurrence of feedback and parametric vibrations, often caused by periodic changes in the stiffness of elements [
29].
Determining the variation of loads under the influence of vibrations allows for the assessment of stresses and deformations resulting from external forces and inertial forces. By measuring the forces and moments occurring at load application points, connection points, etc., it is possible to obtain the dynamic load profile of individual elements of the object [
30].
Vibration measurements enable the examination of the impact of dimensions and shapes of elements (and thus masses, stiffness, etc.), mounting methods, and materials in vibration parameters. Vibrations of objects, except in vibration engineering systems, are detrimental [
31]. They disrupt the proper functioning of equipment, leading to rapid wear and energy loss. If vibrations occur, efforts are made to identify and locate their causes, followed by mitigation. If vibrations cannot be reduced, isolating elements are employed to dampen them.
The advancement of technology in recent years has revolutionized the field of vibration monitoring in industrial machinery, including hydraulic presses [
32,
33]. Traditional methods of monitoring vibration relied on rudimentary sensors and limited data analysis capabilities, often providing only a partial understanding of machine health [
34].
During the operation of a hydraulic press that performs specific work functions, undesirable phenomena appear that negatively affect the operation of the machine. One of the common undesirable phenomena is the vibration of machine body elements. In the case of hydraulic presses, these vibrations lead to deterioration in the quality of the pressed element and faster wear of the machine, causing more defects and the associated higher production costs. Increasing the resistance of the press to the vibrations (vibrostability) of body elements is possible and is already in the prototype stage [
35].
One of the most frequently used methods for measuring the dynamic characteristics of hydraulic presses is the measurement method using accelerometer sensors. Such measurements are usually carried out under the control of specialized computer measurement systems, such as the CADAX system from LMS. A counterbalance to this type of measurement is research using laser scanning vibrometers. Laser vibrometry has a number of advantages over traditional measurements with accelerometer systems. The biggest of them are no influence of the measurement system on the measured object (non-contact measurement) and a relatively simple measurement procedure (does not require the time-consuming rearrangement of sensors on the measured object) [
36].
However, with the advent of advanced measurement systems equipped with high-resolution accelerometers and sophisticated data processing algorithms, engineers now have access to more comprehensive and accurate vibration data. These systems offer multi-axis vibration measurement capabilities, allowing for a detailed analysis of machine dynamics in real-time [
37].
Furthermore, the integration of data acquisition units with Ethernet communication interfaces has facilitated remote monitoring and the control of vibration parameters. This enables engineers to monitor machine health from a centralized location, enhancing maintenance efficiency and reducing downtime [
38].
Additionally, modern measurement software packages, such as KiStudio Lab (ver. 2910B), provide intuitive interfaces for configuring measurement parameters, visualizing data, and performing advanced signal processing techniques [
39]. These software tools empower engineers to extract valuable insights from vibration data, such as identifying dominant frequencies, detecting anomalies, and predicting potential failures.
Overall, the state of the art in vibration monitoring for hydraulic presses encompasses advanced measurement systems, sophisticated data analysis techniques, and user-friendly software interfaces. This convergence of technology enables engineers to proactively manage machine health, optimize production processes, and ensure the reliability and longevity of hydraulic press equipment.
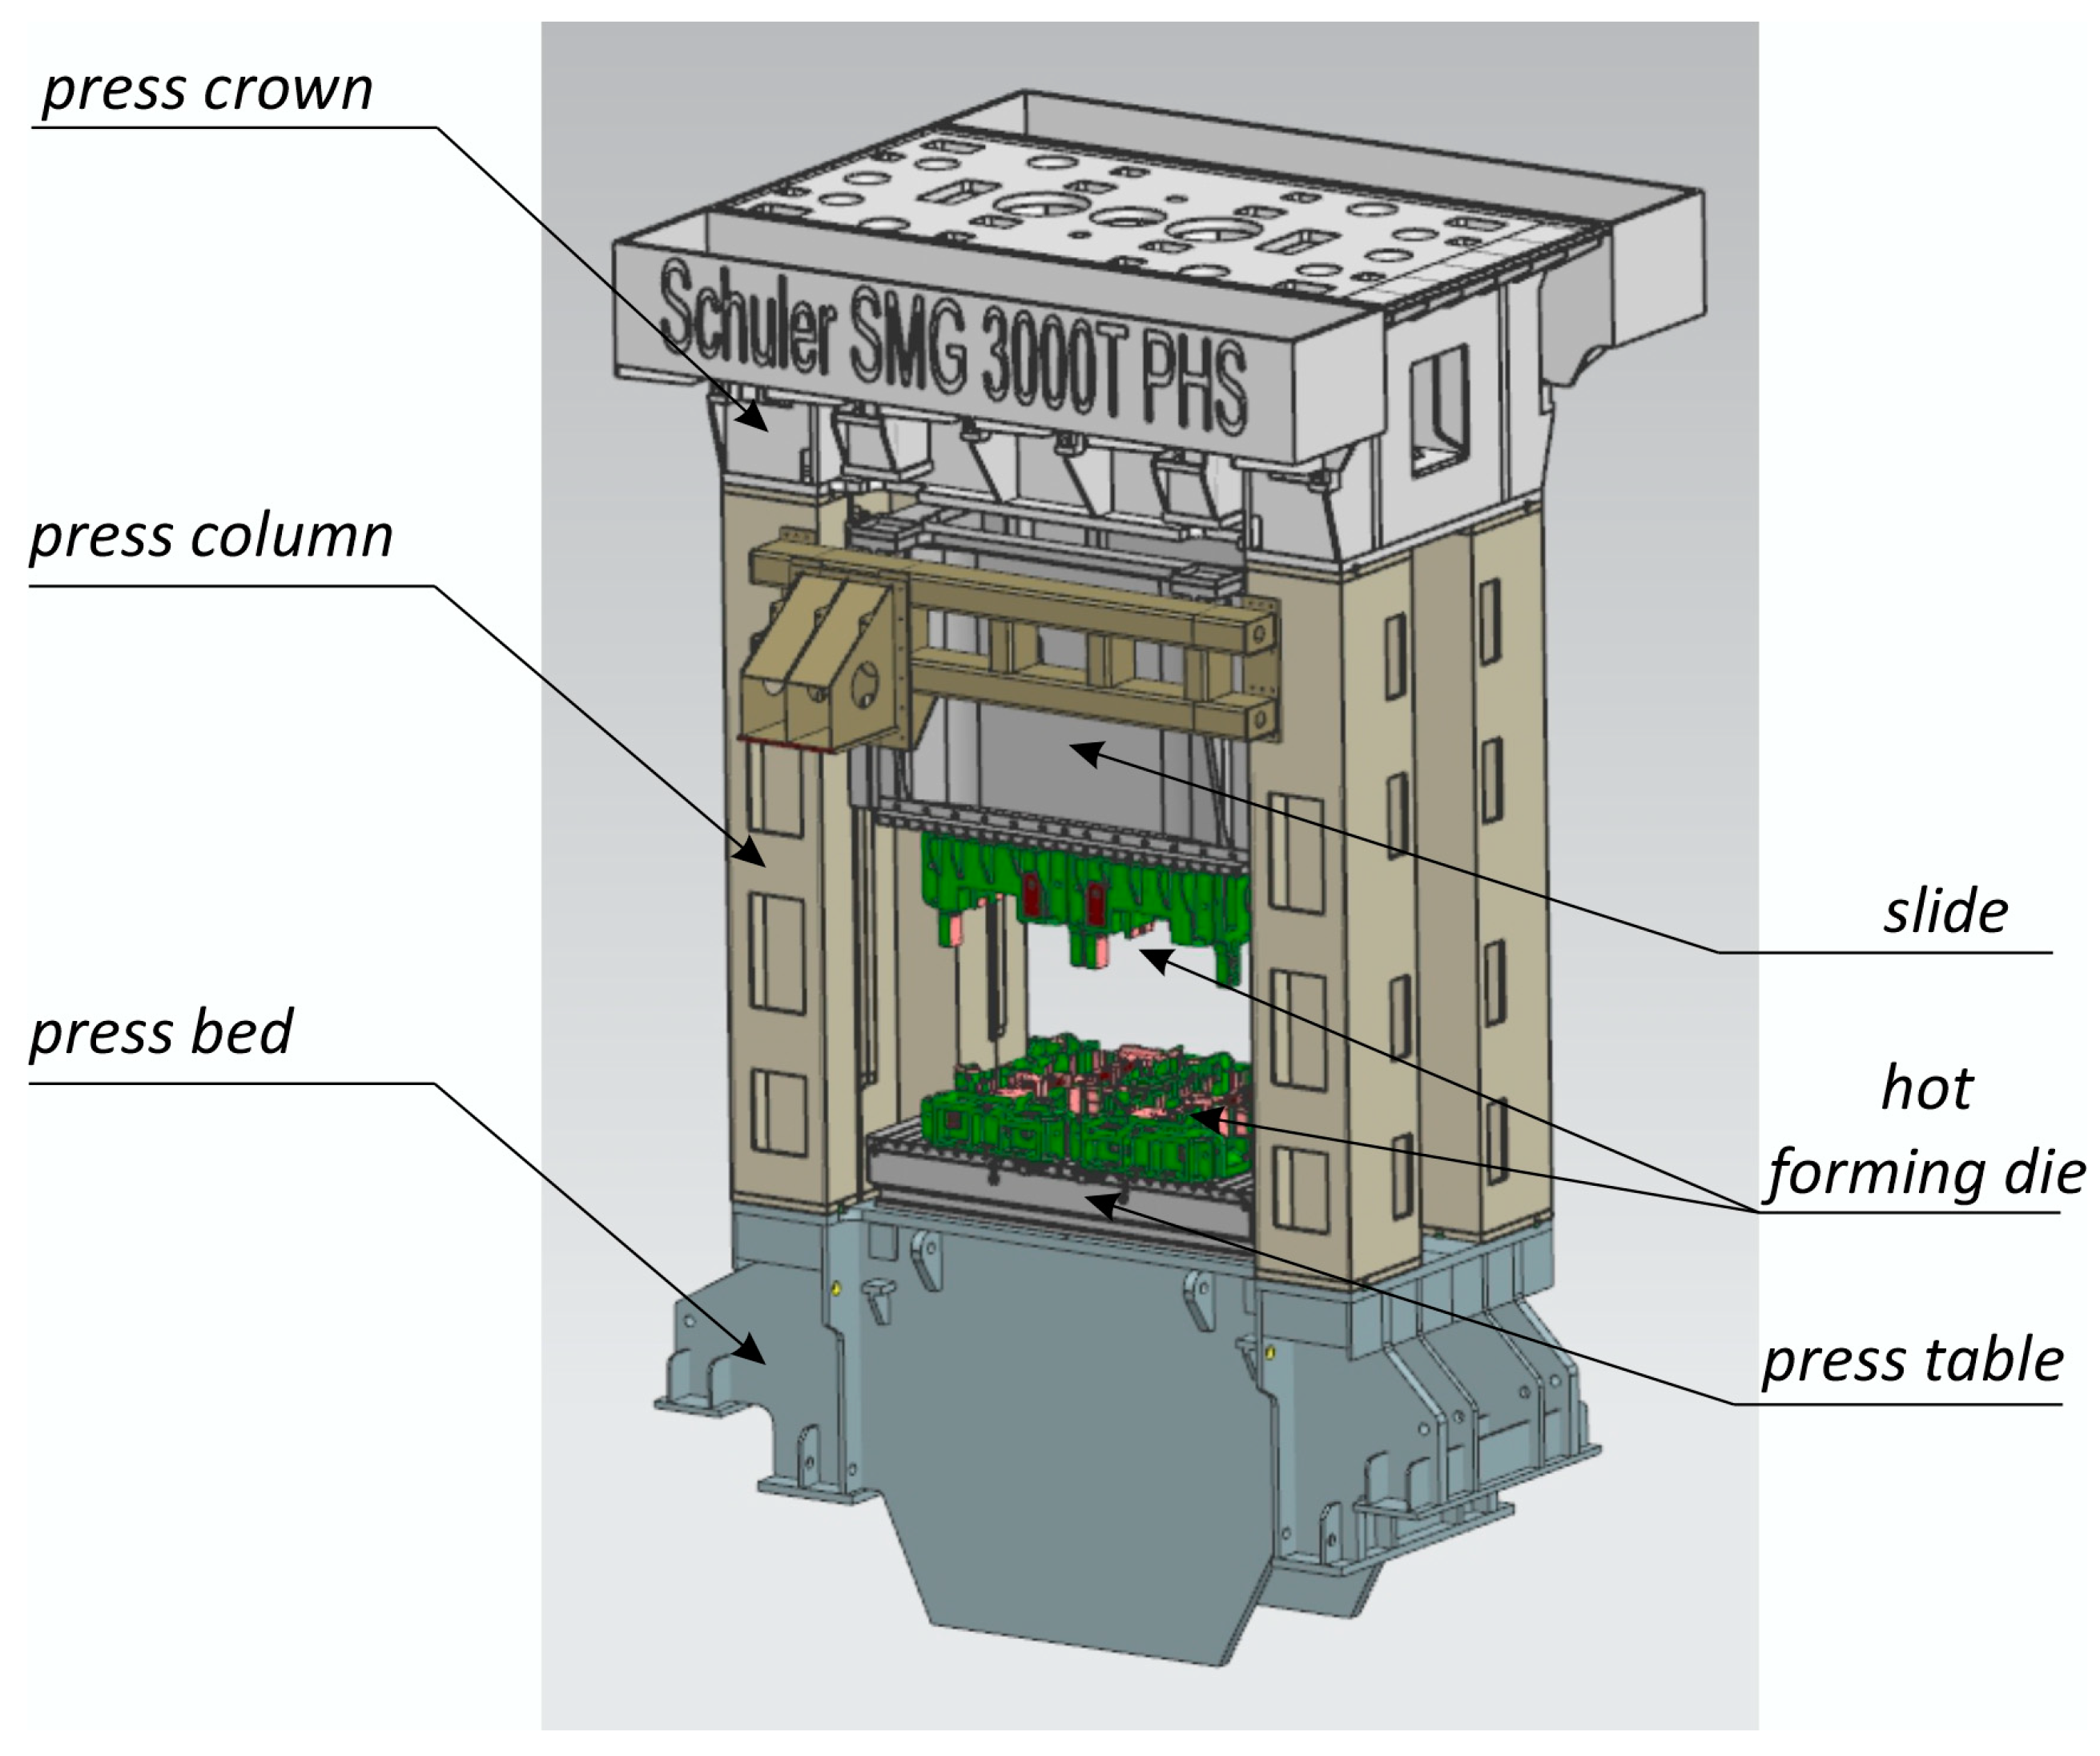
The object of the research is a hydraulic press manufactured by Schuler SMG (Schuler SMG GmbH & Co. KG, Waghäusel, Deutschland), designed to work in a hot stamping line using PHS (Press Hardening Steel) technology. It is a double action press with a total pressure of 3200 tons.
Table 1 lists the basic technical data of the press.
The pictorial view of the hydraulic press covered by the research is presented in
Figure 1.
3. Characteristics of the Proposed Measuring System
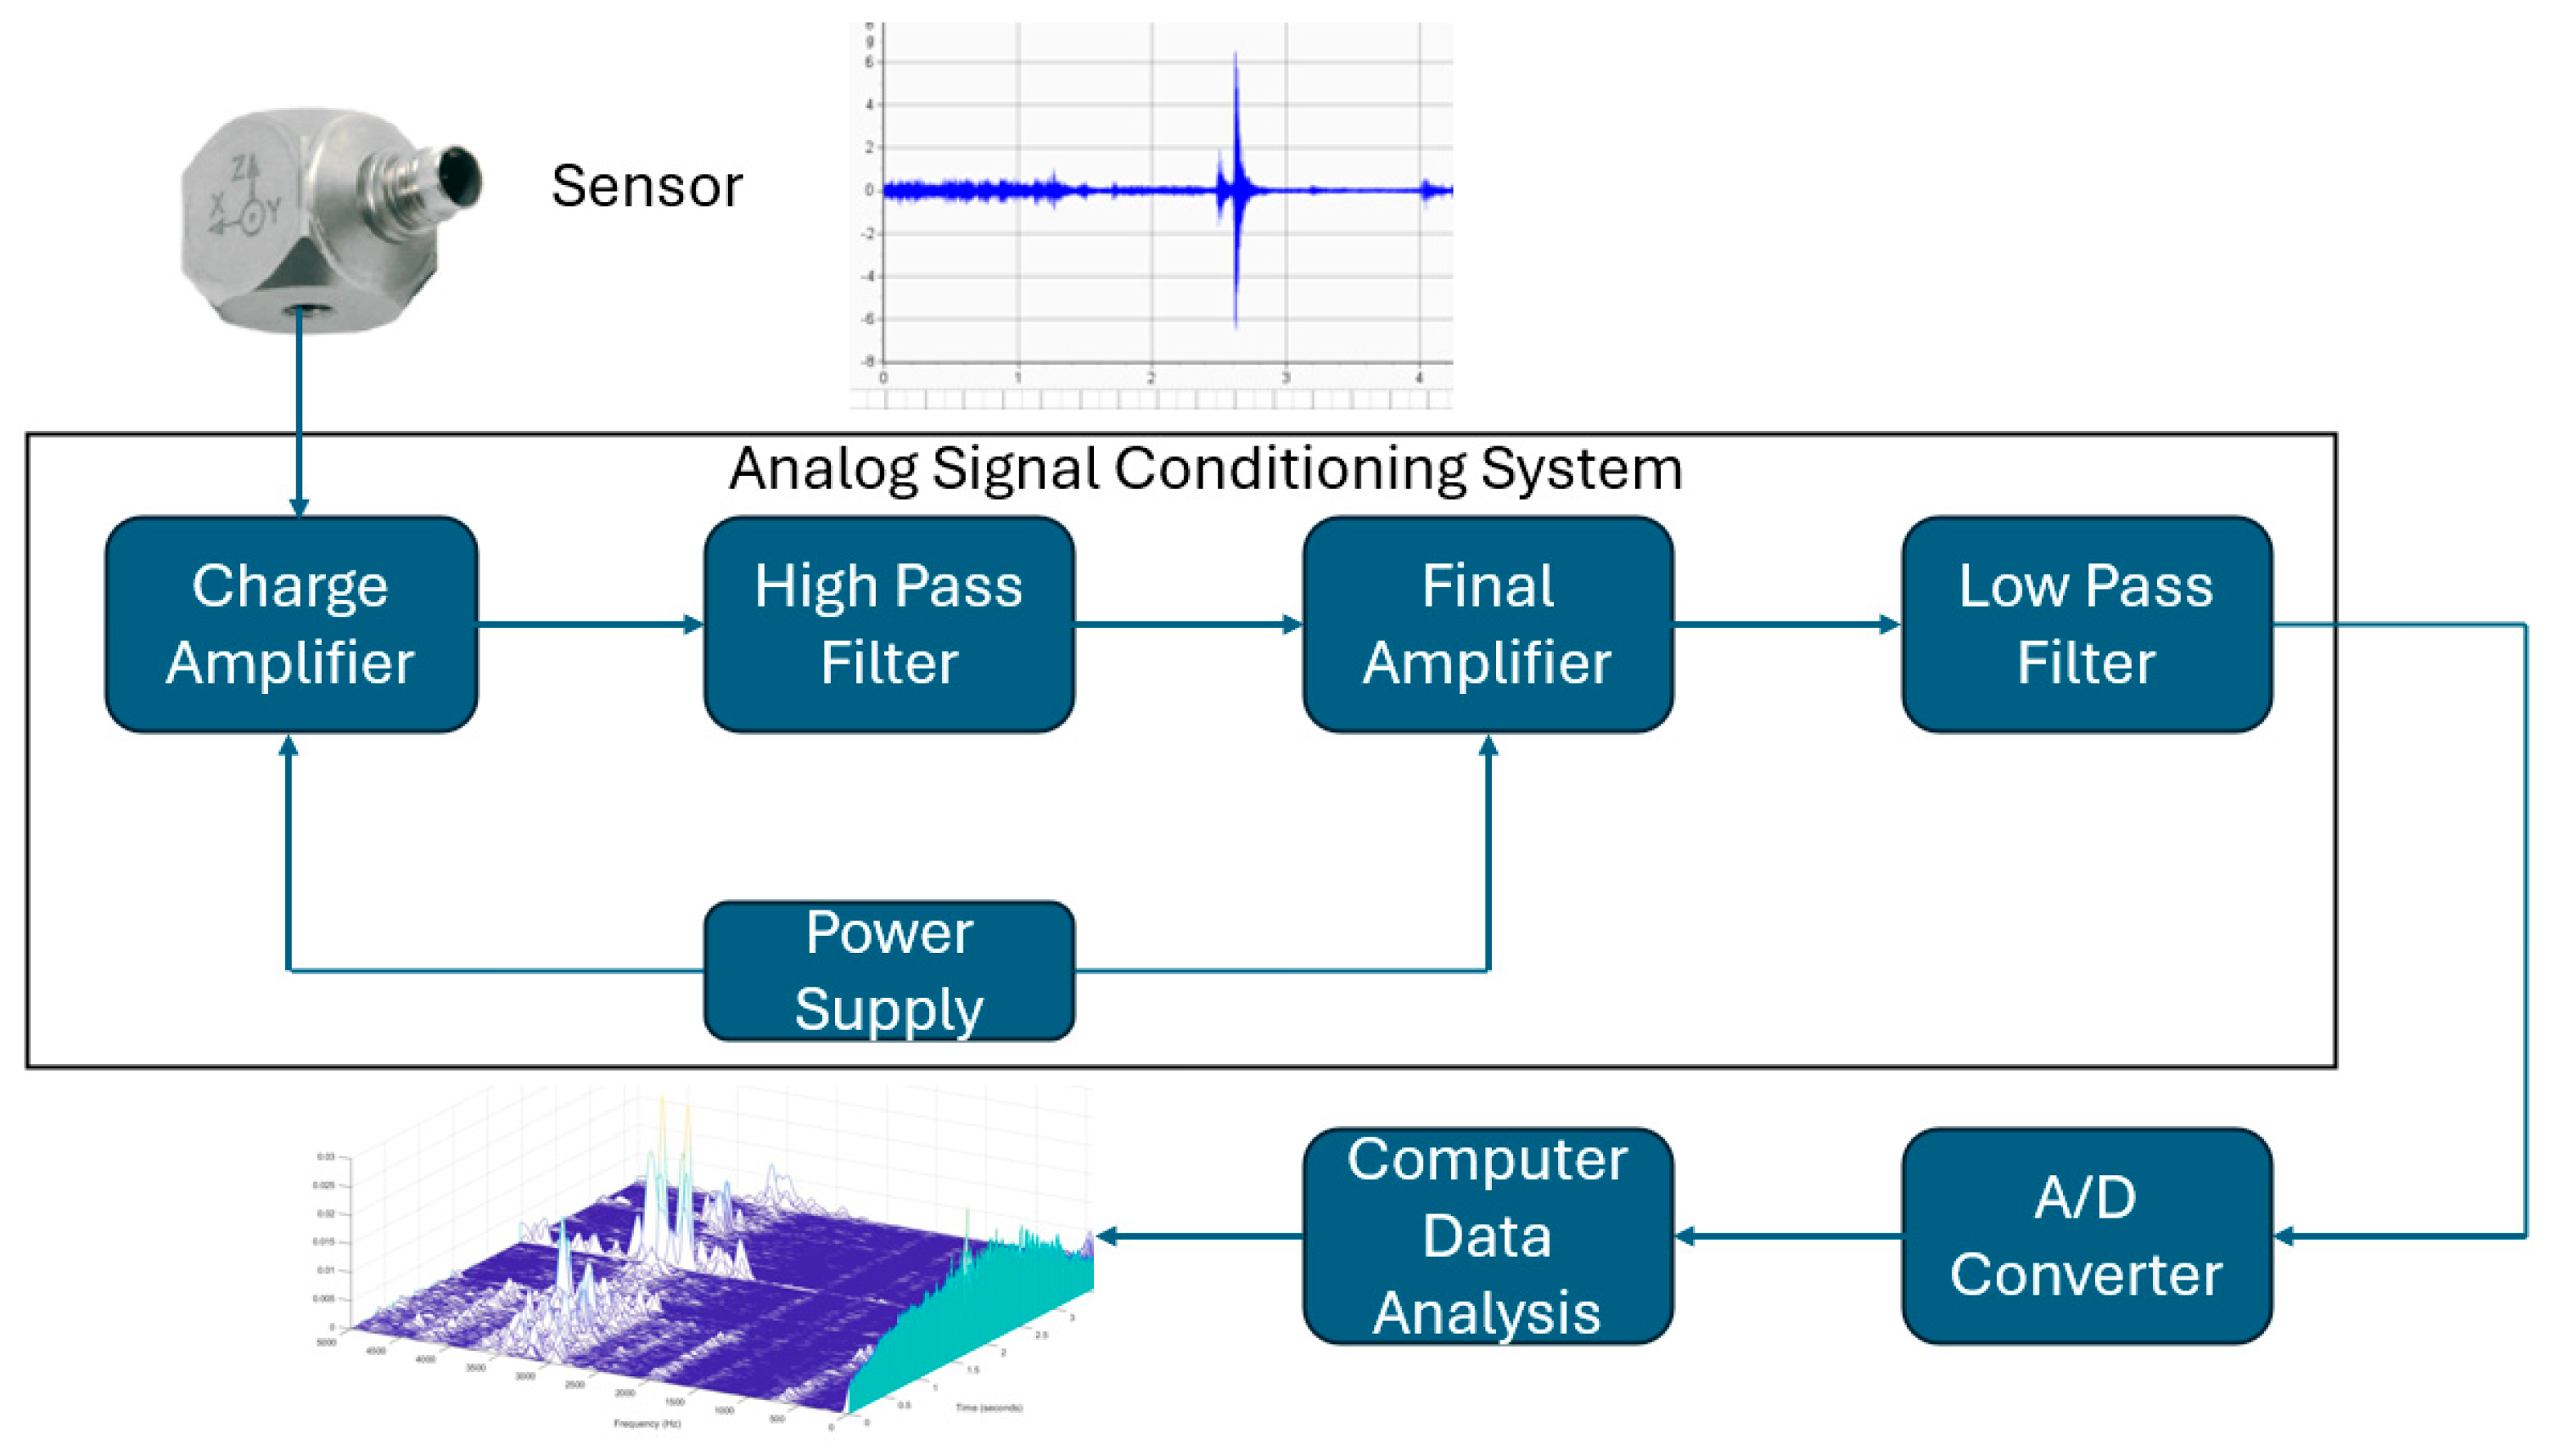
The measurement system was designed to convert the vibrational motion of the object under investigation into readings on the meter or into a form suitable for recording. Sensors were mounted on the object of which vibrations were to be measured. They acted as transducers of the input quantity (vibrations) into an output signal that informed about the measured quantity. Transducers converted mechanical vibrations into another form of mechanical vibrations or into electrical vibrations.
The main task of the proposed solution was as follows: to develop a system for measuring the vibrations of a hydraulic press with data acquisition capability and preliminary processing, which featured an Ethernet communication interface. The block diagram of the proposed system is presented in
Figure 2.
Accelerometers measure acceleration, which is the change in velocity over time. Press vibrations are a form of mechanical vibration that can be described as changes in the accelerometer’s acceleration over time. Therefore, accelerometers are effective for measuring these vibrations. Accelerometers typically have high sensitivity, meaning they can detect even small changes in acceleration. This is important for measuring even minor press vibrations.
For the purposes of the implemented task, the following measurement system has been selected:
A three-axis accelerometer from Kistler, model 8763B1K0AB,
A data logger capable of recording measurements, Kistler LabAmp (Kistler Holding AG, Winterthur, Switzerland), model 5165A4KH00,
A set of measurement cables, model 1784B10K03.
The Kistler 1000 g Ceramic Shear Triaxial Accelerometer (Kistler Holding AG, Winterthur, Switzerland) with IEPE Output is an advanced acceleration sensor designed for the precise measurement of accelerations on three axes:
x,
y, and
z. It is a product offered by Kistler, a reputable manufacturer of high-quality sensors and measurement systems. This sensor utilizes ceramic technology for acceleration measurement. Ceramic acceleration sensors are known for their reliability, durability, and stability over a wide temperature range. They also exhibit high resistance to external disturbances such as vibrations and electromagnetic interference. Detailed technical specifications of the sensor are presented in
Table 2.
The Kistler LabAmp is a dynamic charge amplifier designed for laboratory applications, manufactured by Kistler. It is an advanced device that enables precise amplification and measurement of charge signals originating from sensors such as accelerometers. LabAmp offers many advanced features that ensure high-quality measurements. It has a wide frequency range, allowing the measurement of both sudden, dynamic phenomena and long-term processes. The amplifier is also equipped with filtering functions, which enable the elimination of disturbances and the extraction of relevant signals. The device also offers the ability to configure various settings, such as gain, measurement range, and integration time, to adapt to specific measurement requirements. Additionally, LabAmp features a user interface that allows convenient control and monitoring of measurement parameters. Detailed specifications of the amplifier are presented in
Table 3.
The complete configuration of the measurement setup was performed using the KiStudio Lab Software Package. This software enables the recording of measured signals and their processing after measurements are completed (in offline mode). It is an advanced tool that allows users to conveniently manage, control, and analyze data from Kistler sensors and measurement devices. The KiStudio Lab environment provides an intuitive user interface, facilitating the easy configuration and control of connected measurement devices. Users can create their own measurement setups, define measurement parameters such as ranges, sampling times, and filters, or select measurement channels. This allows them to tailor the software to their specific needs and experiments.
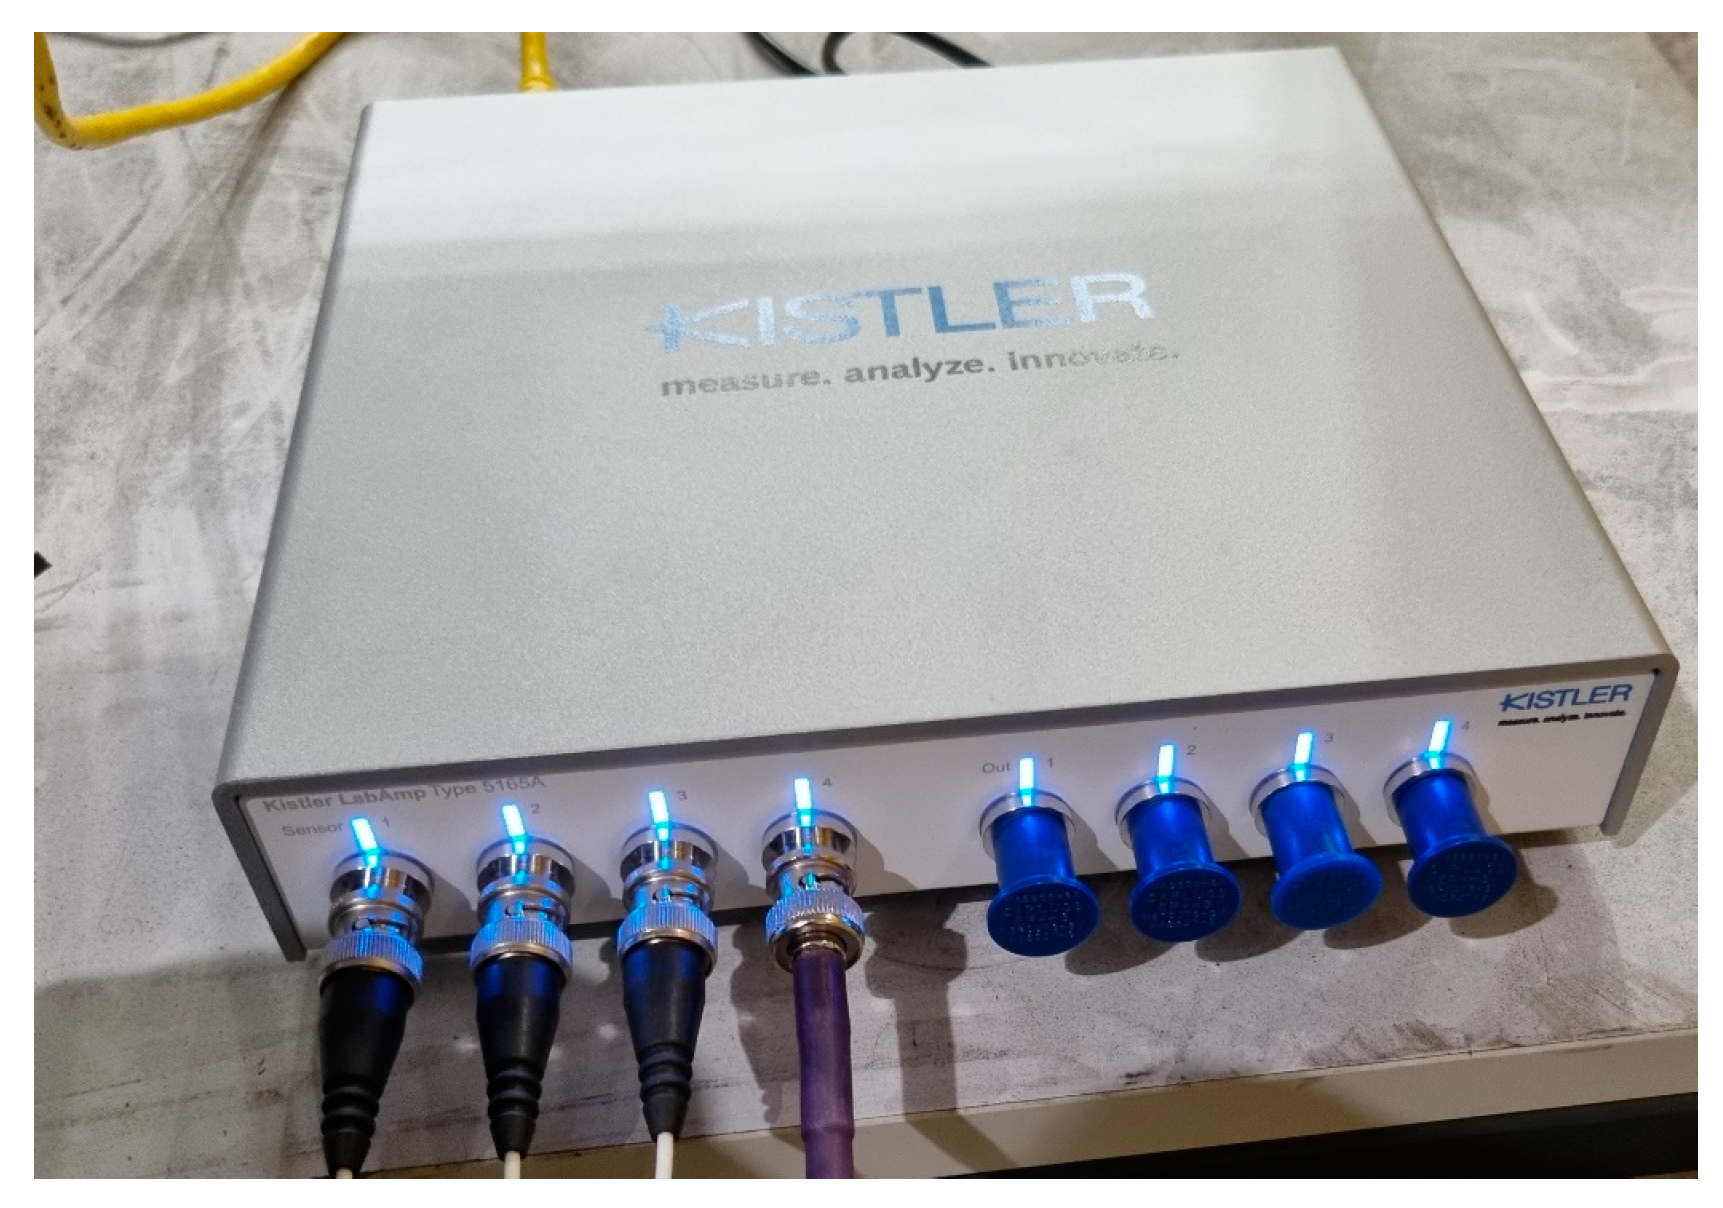
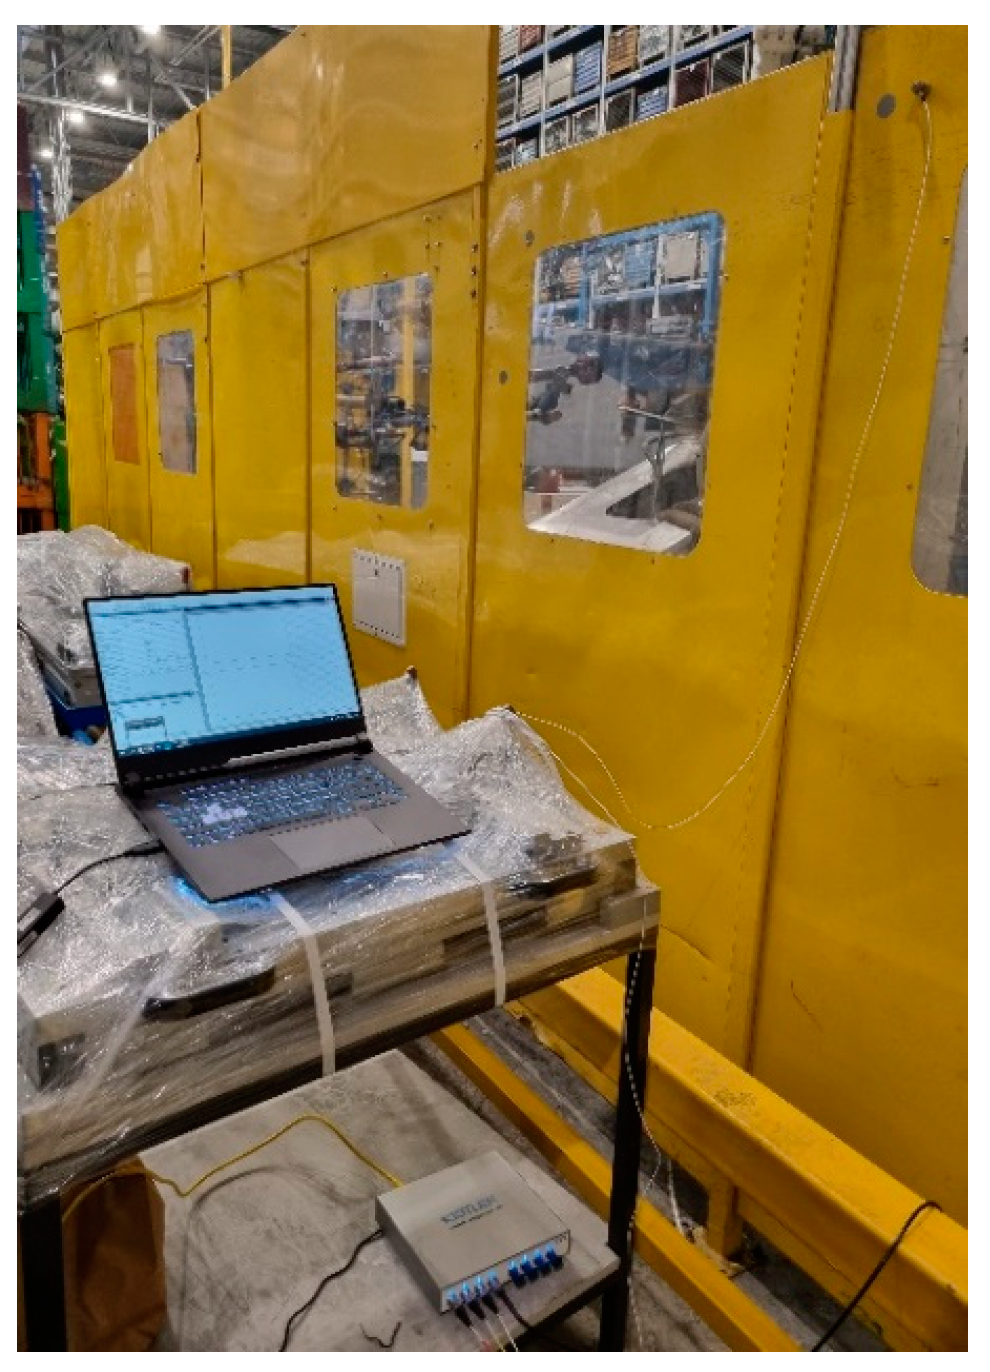
The view of the applied measurement system is presented in
Figure 3 and
Figure 4.
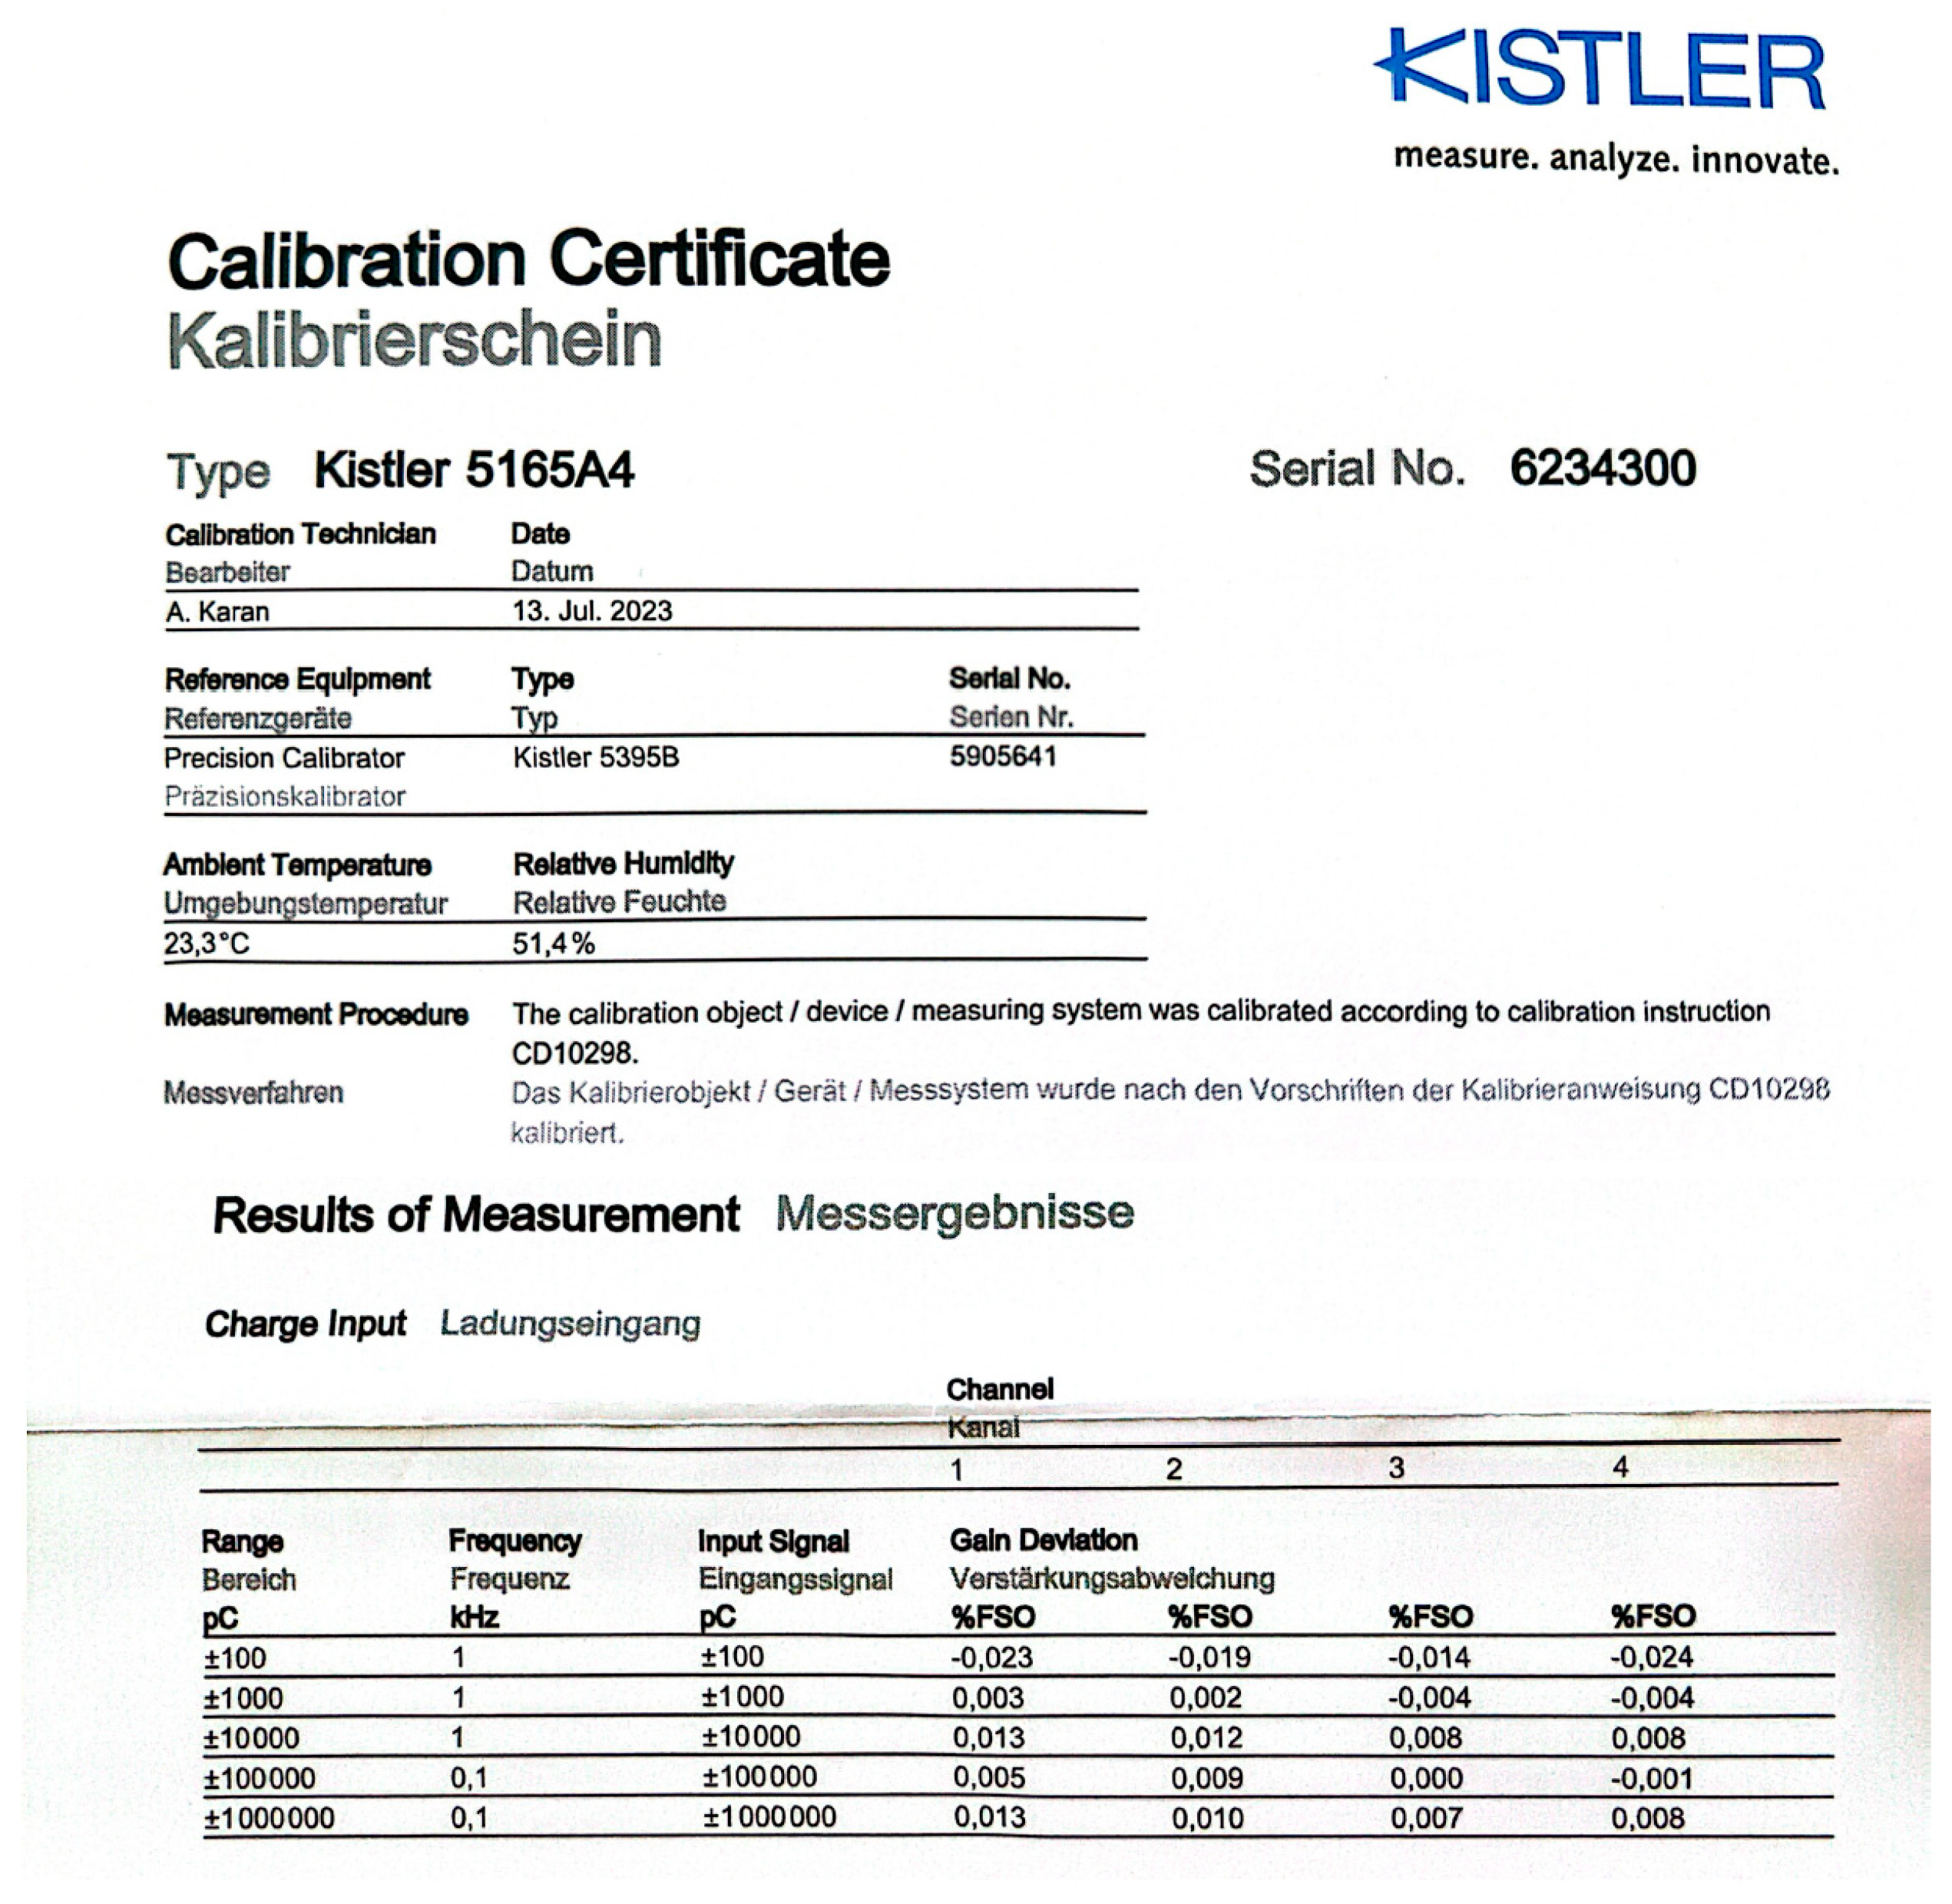
The measurement system was calibrated, and a fragment of the calibration certificate process is shown in
Figure 5.
The measurement system was then configured, and test measurements were conducted to verify the system’s functionality.
Figure 6 illustrates the complete measurement system.
4. Measurement Methodology
The proposed measurement system was an independent part of the press. The system was integrated with the overall digitization system in such a way that the main PLC controller controlled the start and end moments of the measurements. The exchange of the start/stop signal (trigger) was performed using a digital signal in TTL logic (5 V). Vibration measurement was carried out from the moment the press slide started moving down until the impact/pressing moment. The average signal recording time was approximately 5 s.
During the execution of the test measurements, an experimental selection of two parameters was performed: the signal sampling frequency and the sensor mounting location.
The signal sampling frequency was a measure of the number of samples recorded per second, usually expressed in [kS/s] units. The sampling frequency range of the proposed measurement system was from 10 [S/s] to 200 [kS/s]. Based on the conducted studies, this parameter was set to a value of 10 [kS/s] (10 thousand samples per second). When selecting this value, consideration was given to the accuracy of the recorded data and the size of the measurement file. Ultimately, the size of one measurement file was approximately 1990 KB with a content of about 44,500 samples.
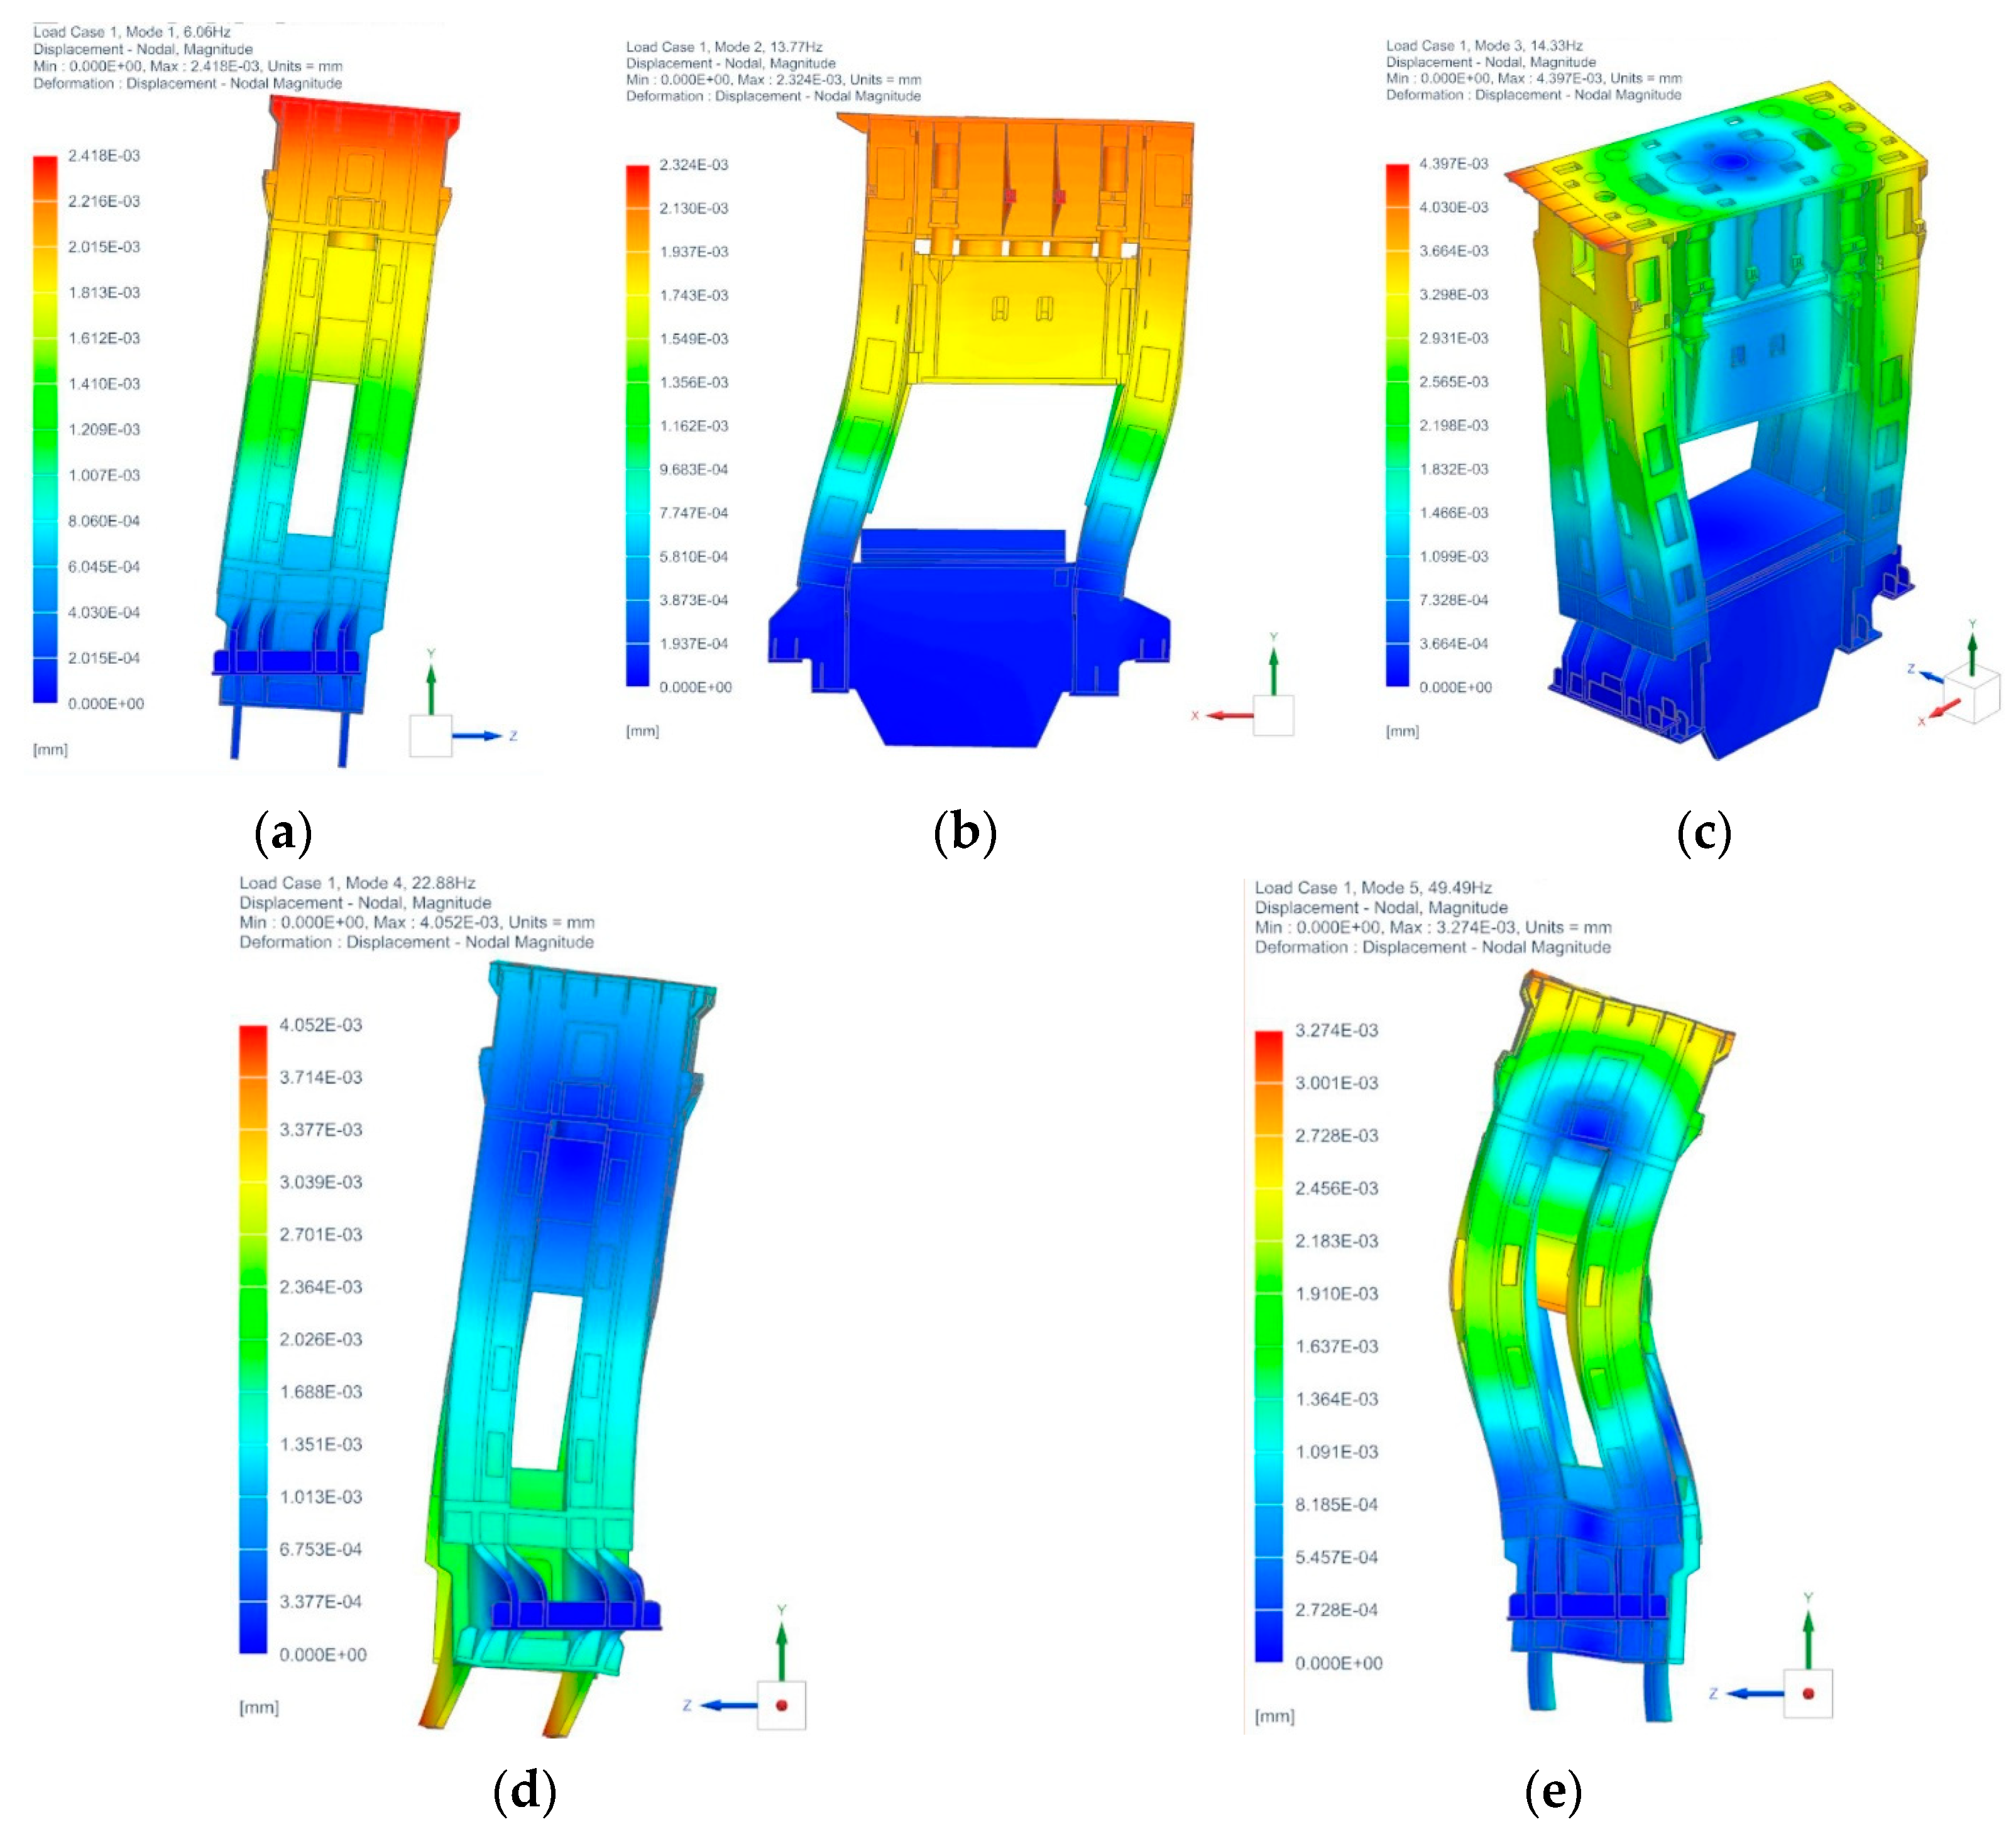
The initial mounting location of the vibration sensor was chosen based on the modal analysis of the press. Using the developed discrete computational model of the press, the natural frequencies of the structure and the corresponding mode shapes were determined. This task was solved using a Simcenter Nastran solver (Siemens NX, Siemens, Berlin, Deutschland) with the designation SOL103 (Real Eigenvalues). According to the results obtained, it was determined that the highest vibration amplitude would occur at the crown of the press (
Figure 7).
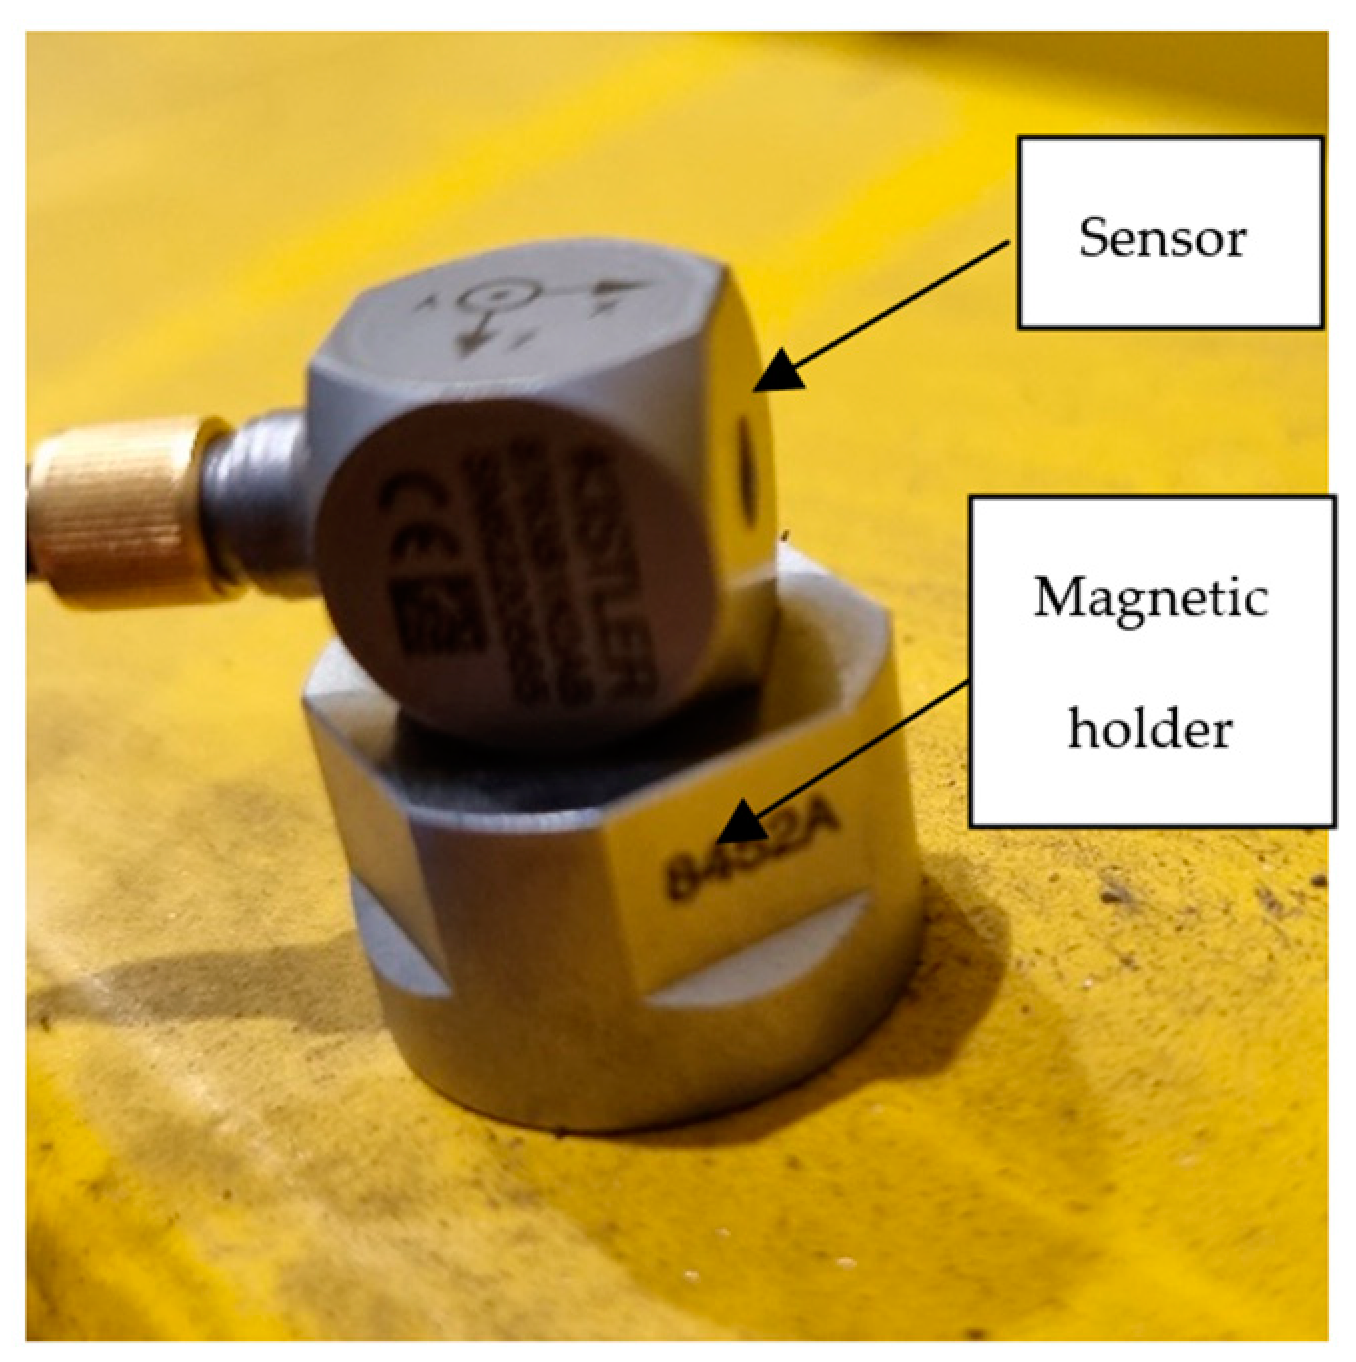
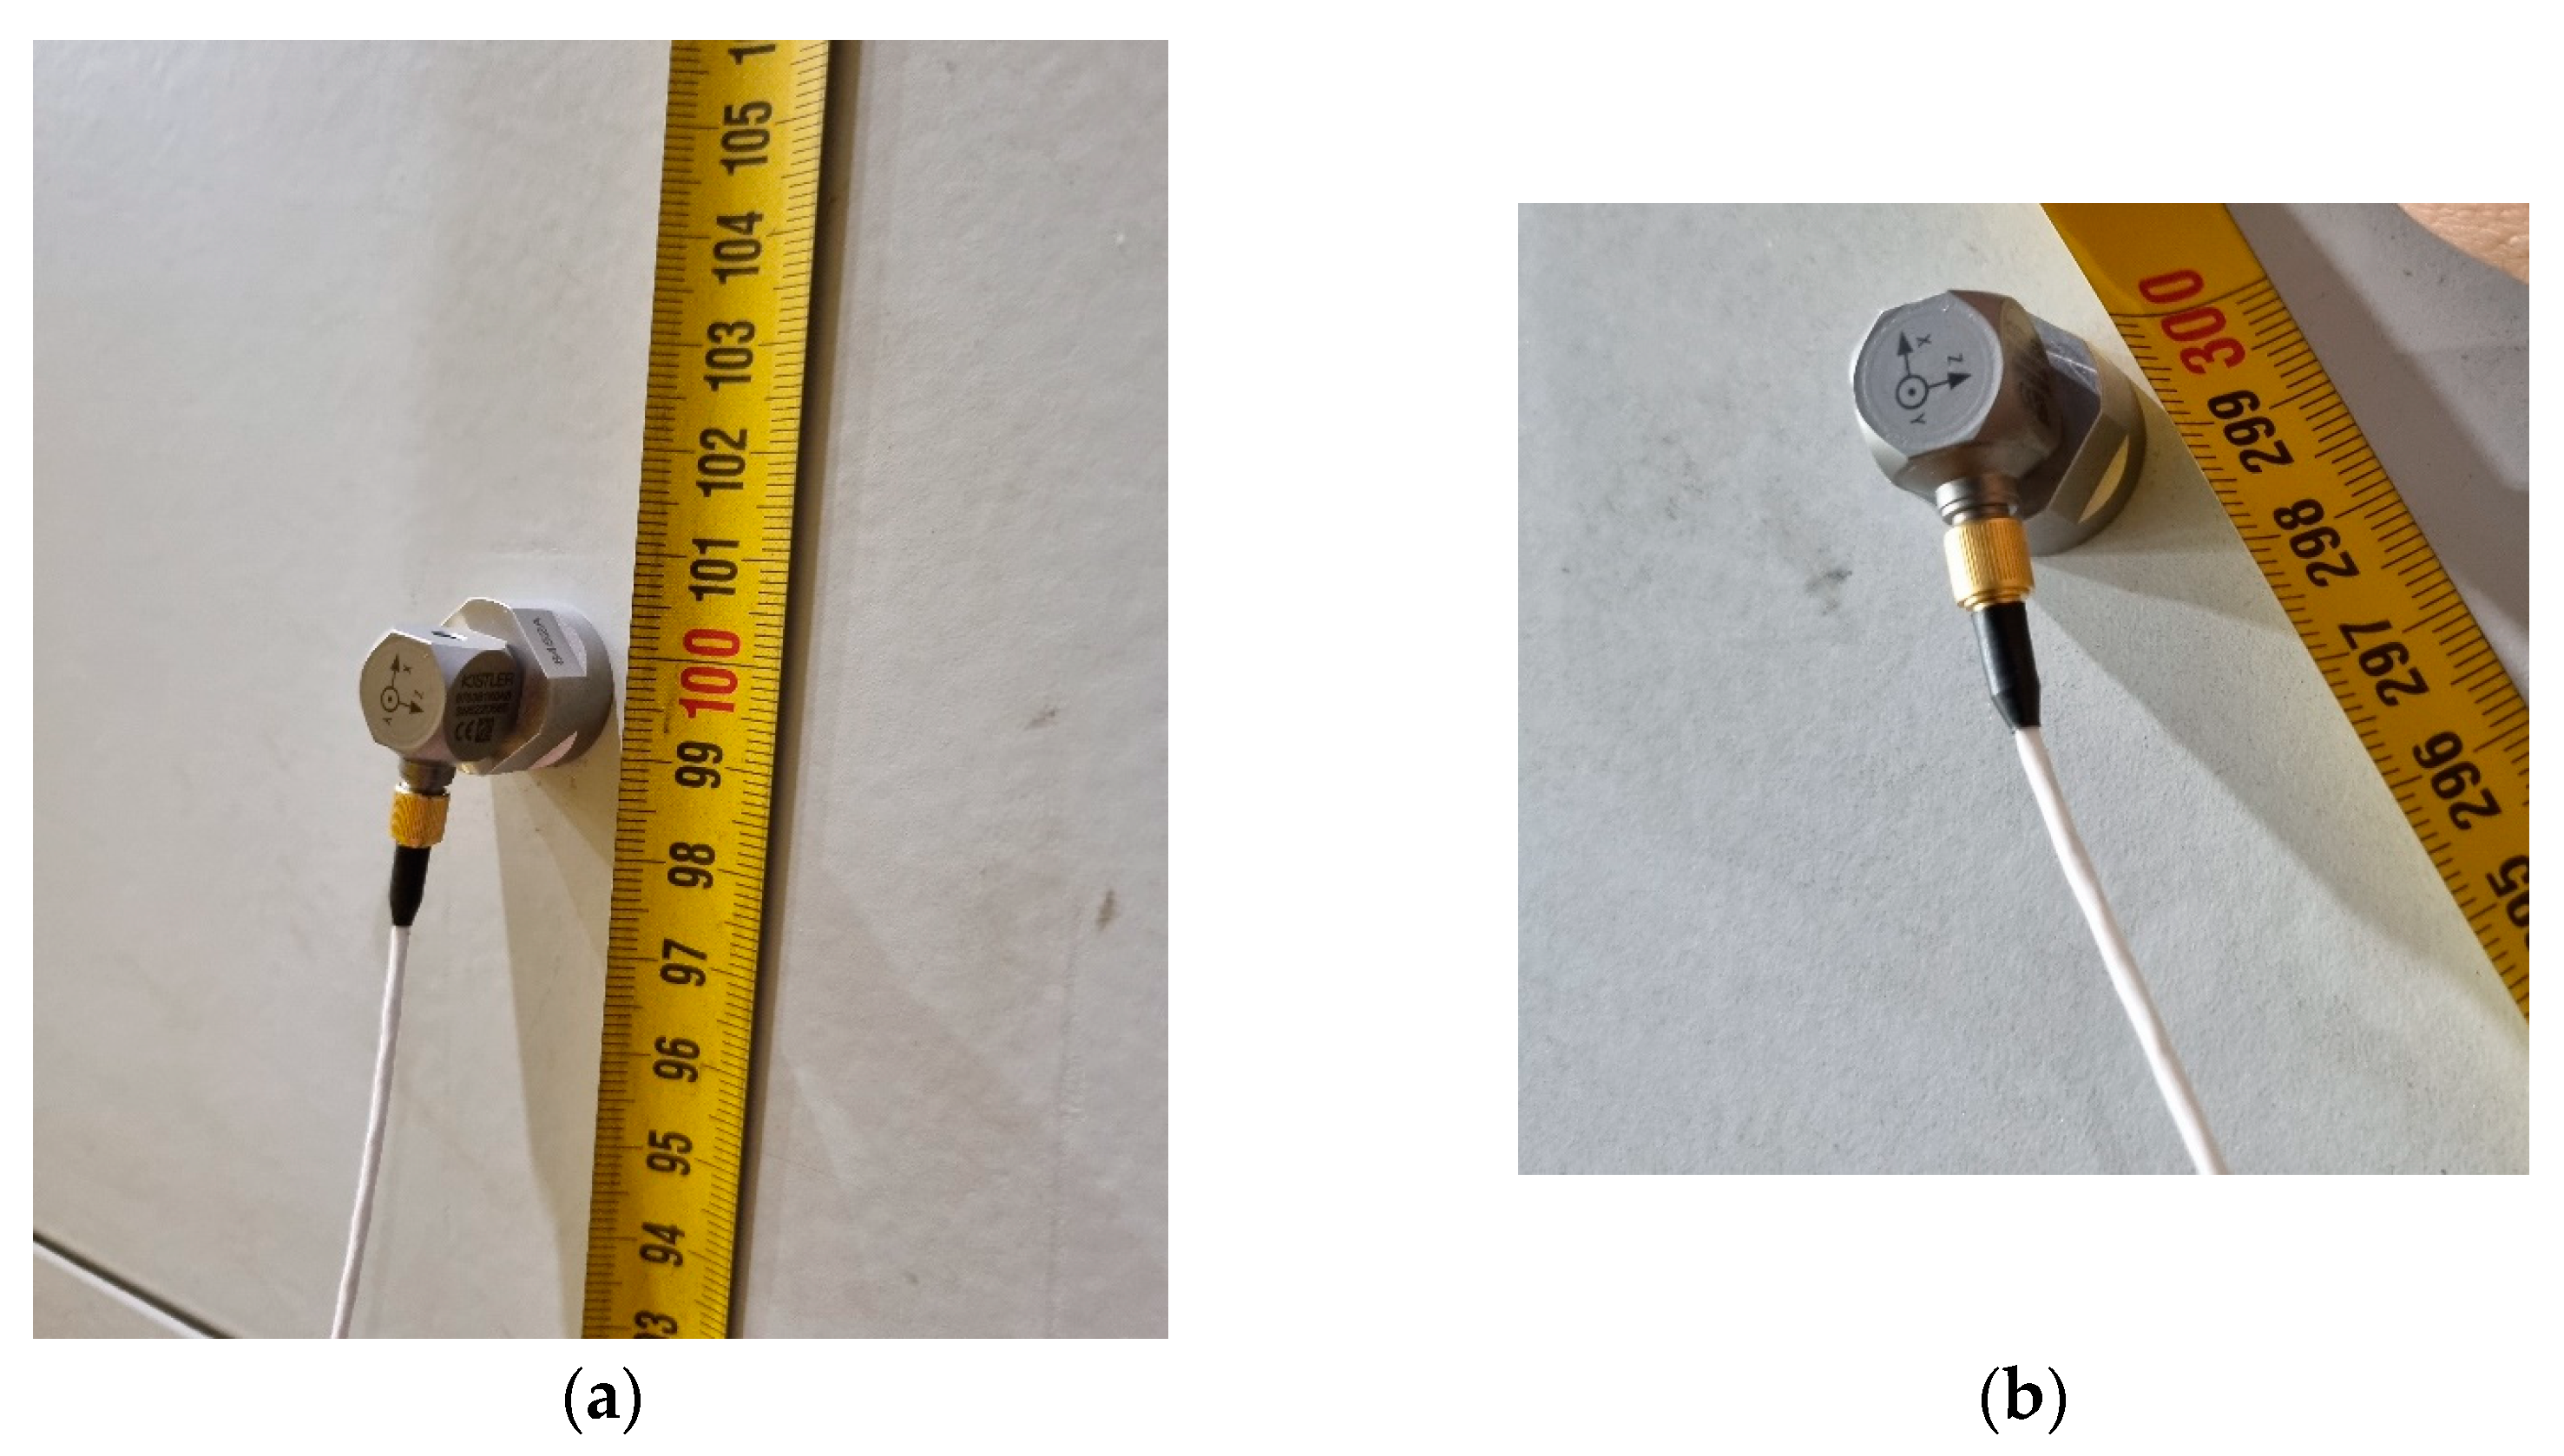
The final mounting location of the vibration sensor was selected through experimental means. For this purpose, a series of measurements was conducted by mounting the sensor on the press column at intervals of 1 m from the base. Sample measurement points are illustrated in
Figure 8. In accordance with the manufacturer’s recommendations, a dedicated magnetic holder, Kistler 8452A, (Kistler Holding AG, Winterthur, Switzerland) was used for mounting the sensor.
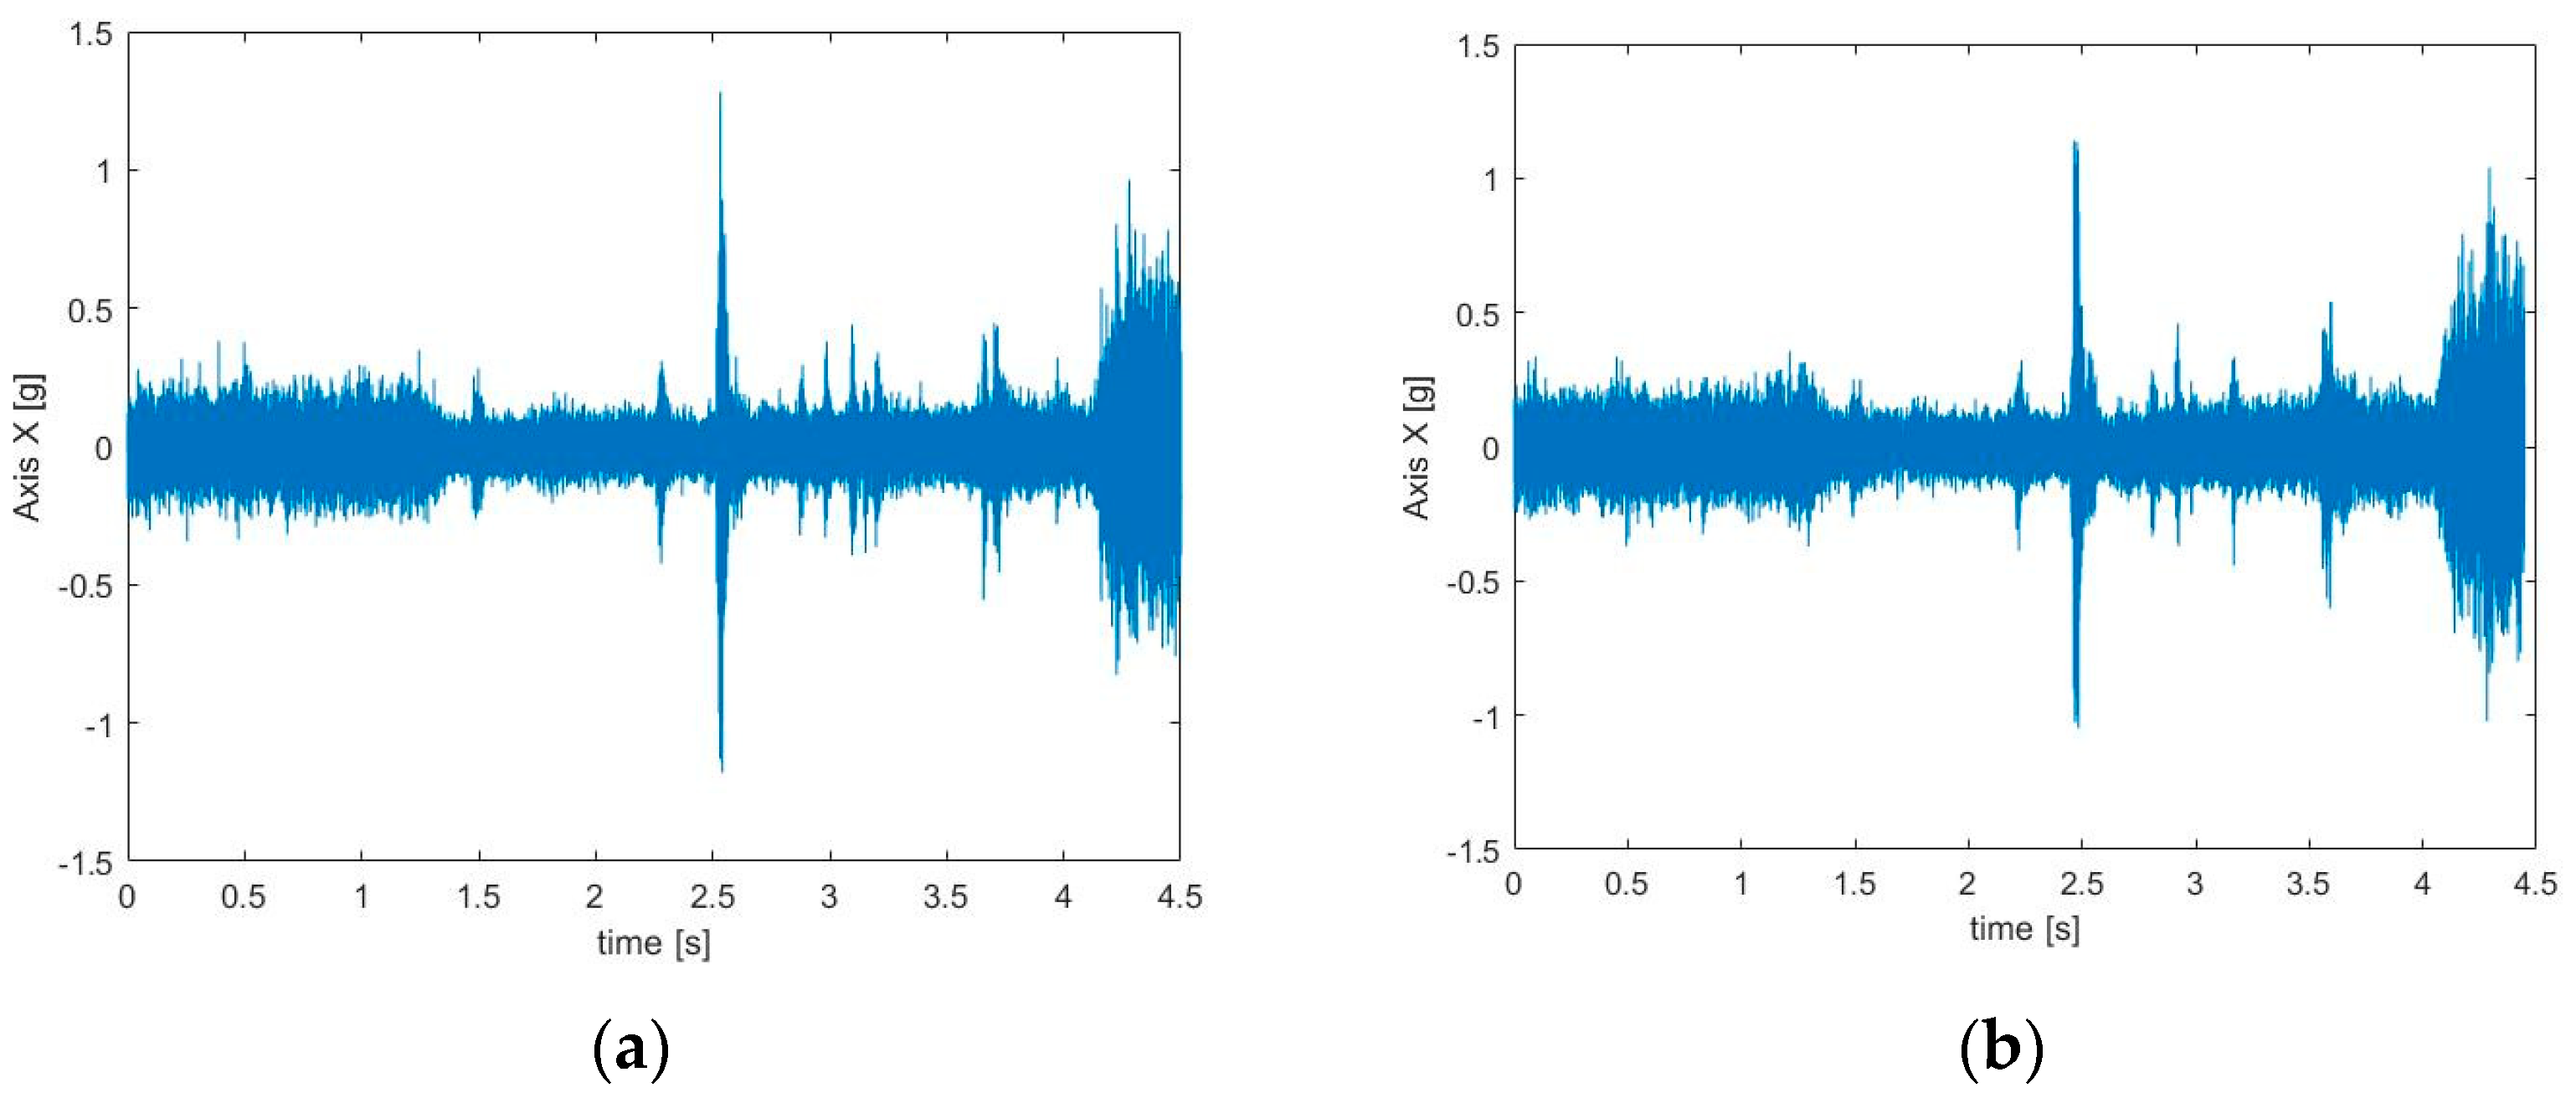
Sample vibration measurement results for various measurement points are presented in
Figure 9.
The initial input for selecting the place to mount the accelerometer was a modal analysis of the press. According to its results, it was assumed that the largest vibration amplitudes would appear on the press crown. When starting the practical implementation of the measurements, an attempt was made to verify the results of the modal analysis by measuring vibrations along the press column at a distance of 1 m. After conducting the tests, it turned out that the location of the sensor had no impact on the obtained vibration measurement results (
Figure 9). The structure of the press was uniform and uniformly stiff throughout its entire height. Finally, it was decided to install the sensor on the press crown (at the highest possible point), in accordance with the results of the modal analysis of the press.
5. Signal Analysis and Discussion of the Results
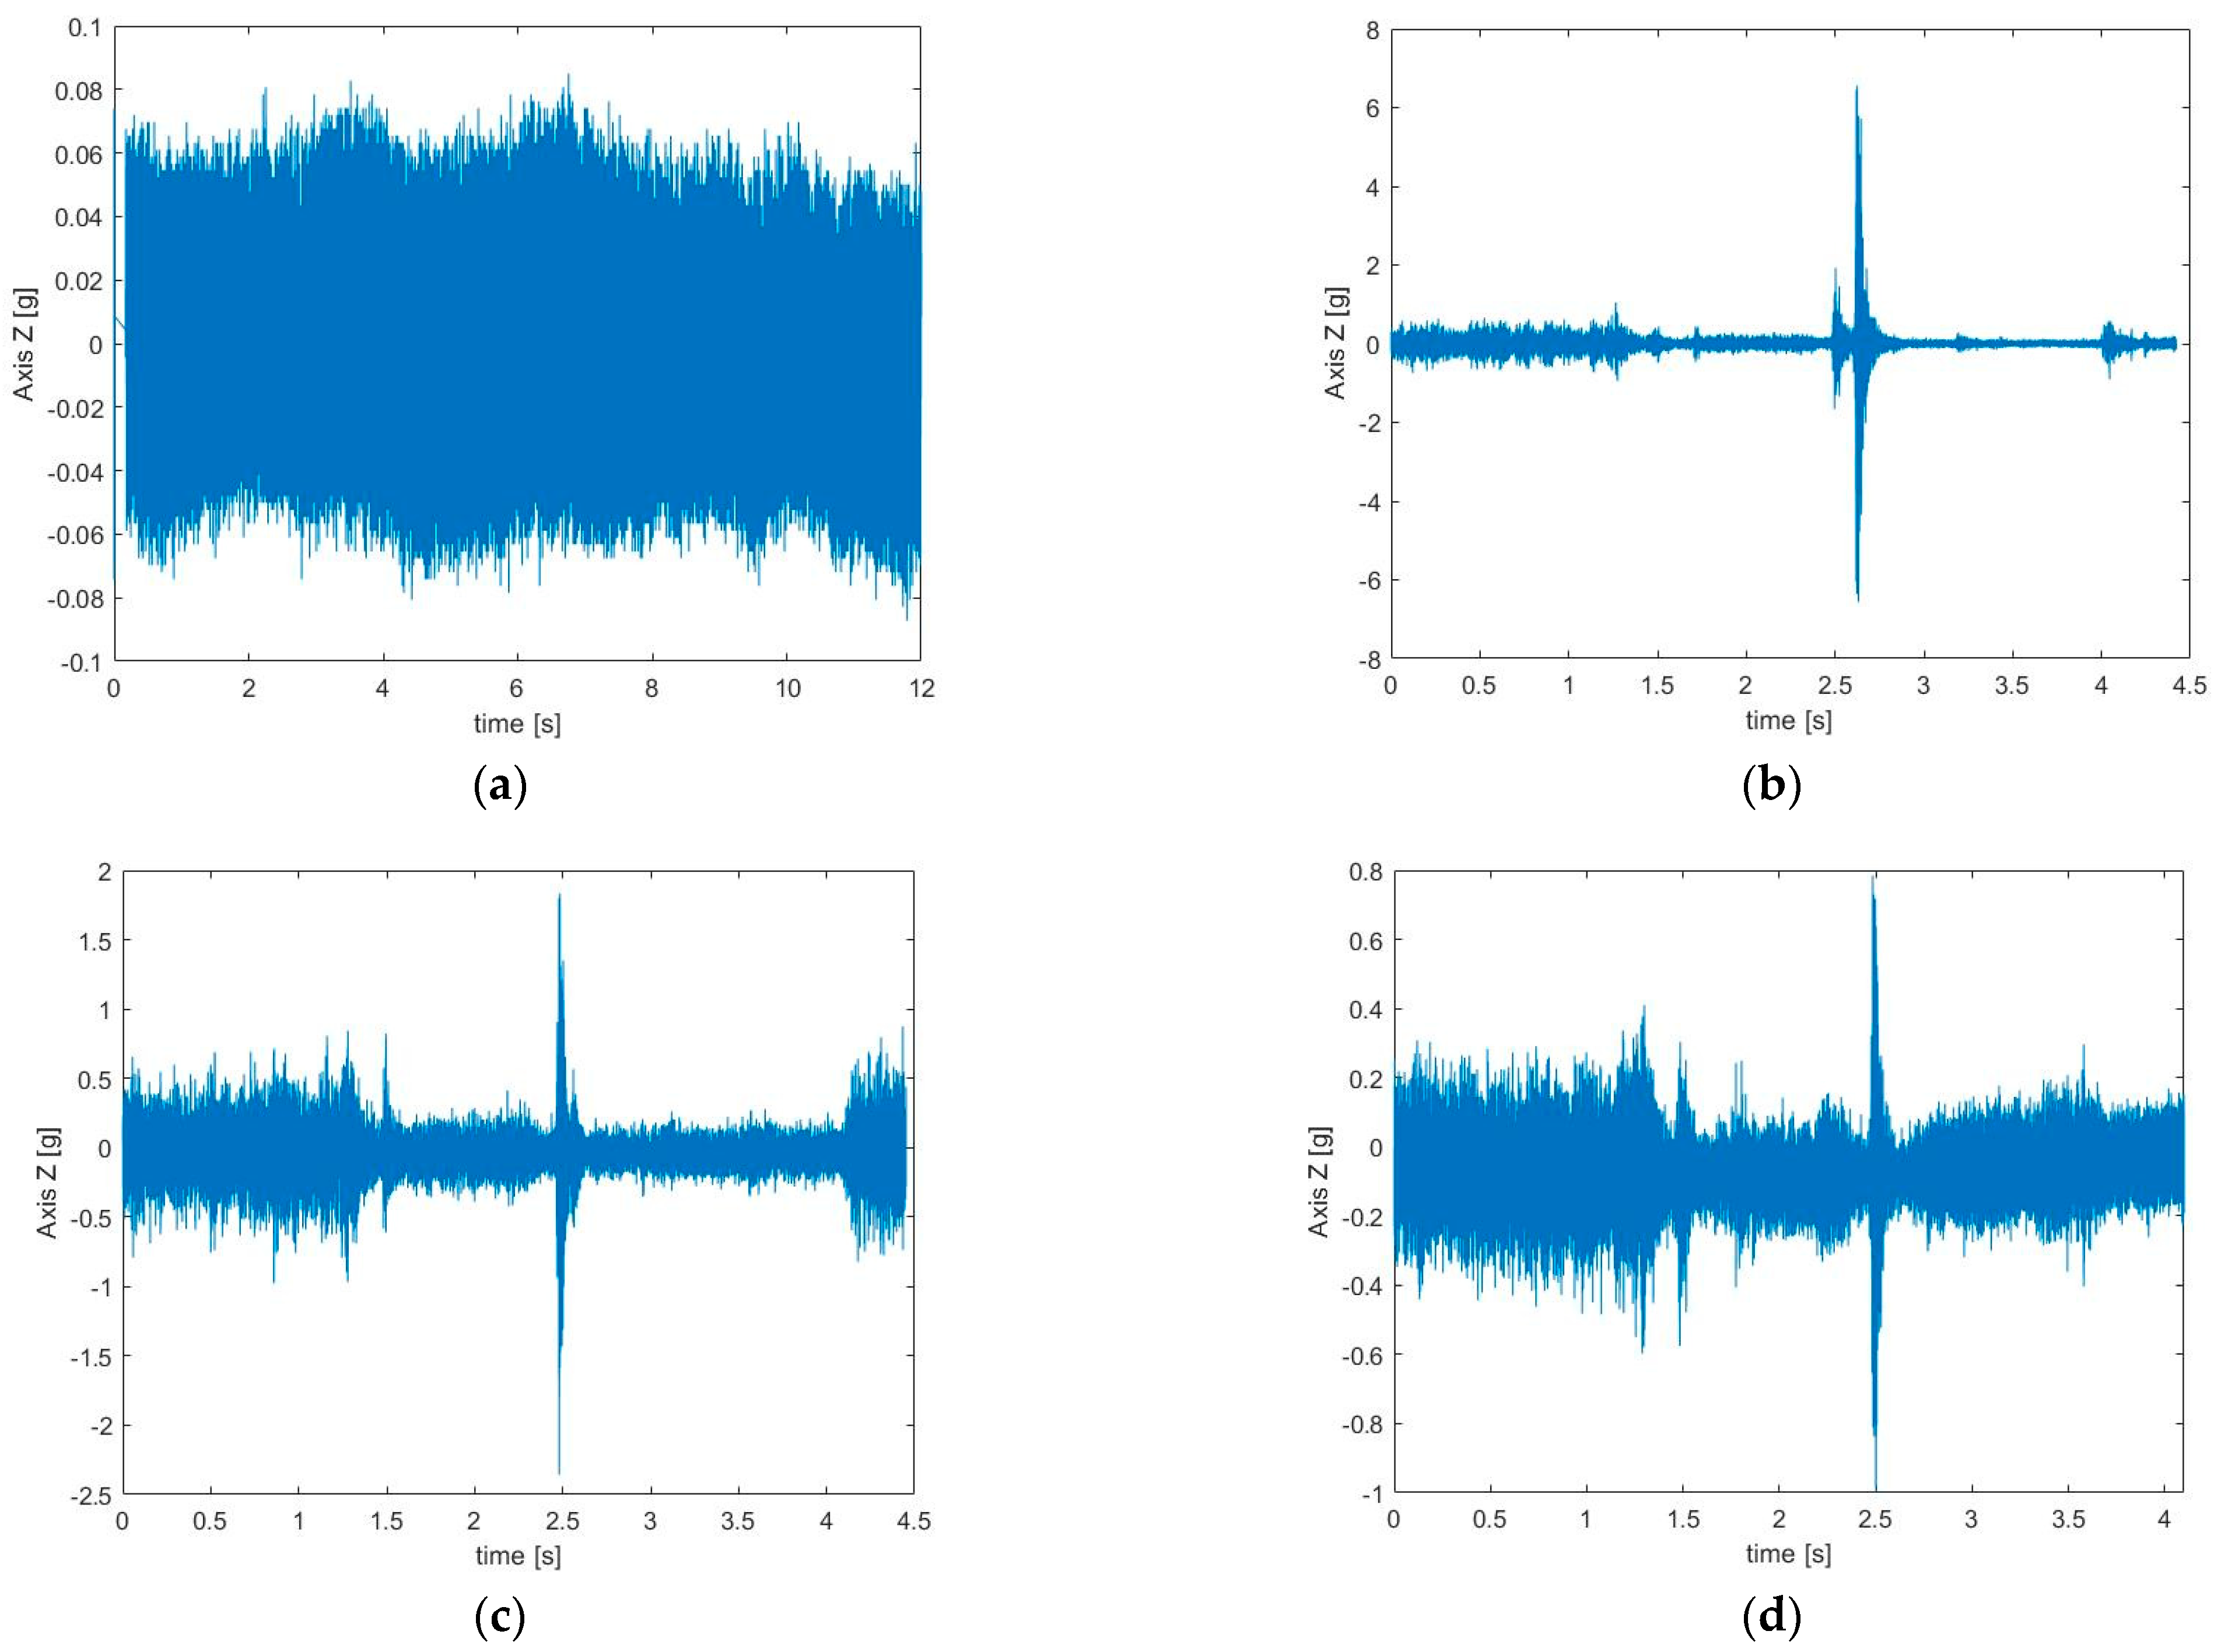
In the first step, an attempt was made to conduct a time analysis of the recorded signals. In this phase, the time course of the signal itself was analyzed. This was a basic analysis that allowed one to understand the basic characteristics of the vibrations, such as frequency, amplitude, and wave shape. Moreover, vibration measurements were also taken when the press was stationary to determine the background noise level, and the vibrations were monitored during impacts without parts. The sample results of these trials are presented in
Figure 10.
From the conducted measurements, it was evident that the background noise level was uniform and averaged between 0.05 g to 0.08 g. The maximum vibration values of the press (over 6 g) were obtained during impacts without items. During the serial production of the tested part, the average vibration values of the press on each axis did not exceed 2 g. Based on the conducted tests, it can be concluded that the detail dampened the vibrations of the press body generated during the production process. For comparison,
Figure 10d shows the time course of acceleration on the
z axis for impact with the details of proper production, but with an increased press pressure (tonnage) of 10% (to the value of 850 t).
Figure 10d shows that increasing the press pressure significantly affects the form of vibrations. Their amplitude decreased to 0.8 g. The reason for the observed phenomenon was the fact that when a given higher pressure was applied, the press moved down more slowly to reach the desired pressure, which directly translated into a lower value of structure vibrations.
After the test research, actual measurements were initiated. A total of 1000 samples were recorded. Each recorded measurement was saved as a separate csv file, containing the following data:
Measurement time,
Acceleration value on the x axis,
Acceleration value on the y axis,
Acceleration value on the z axis.
Each file was then imported into a database using a prepared desktop application, thus enabling access to production data for selected plant services, technologists, and the maintenance department.
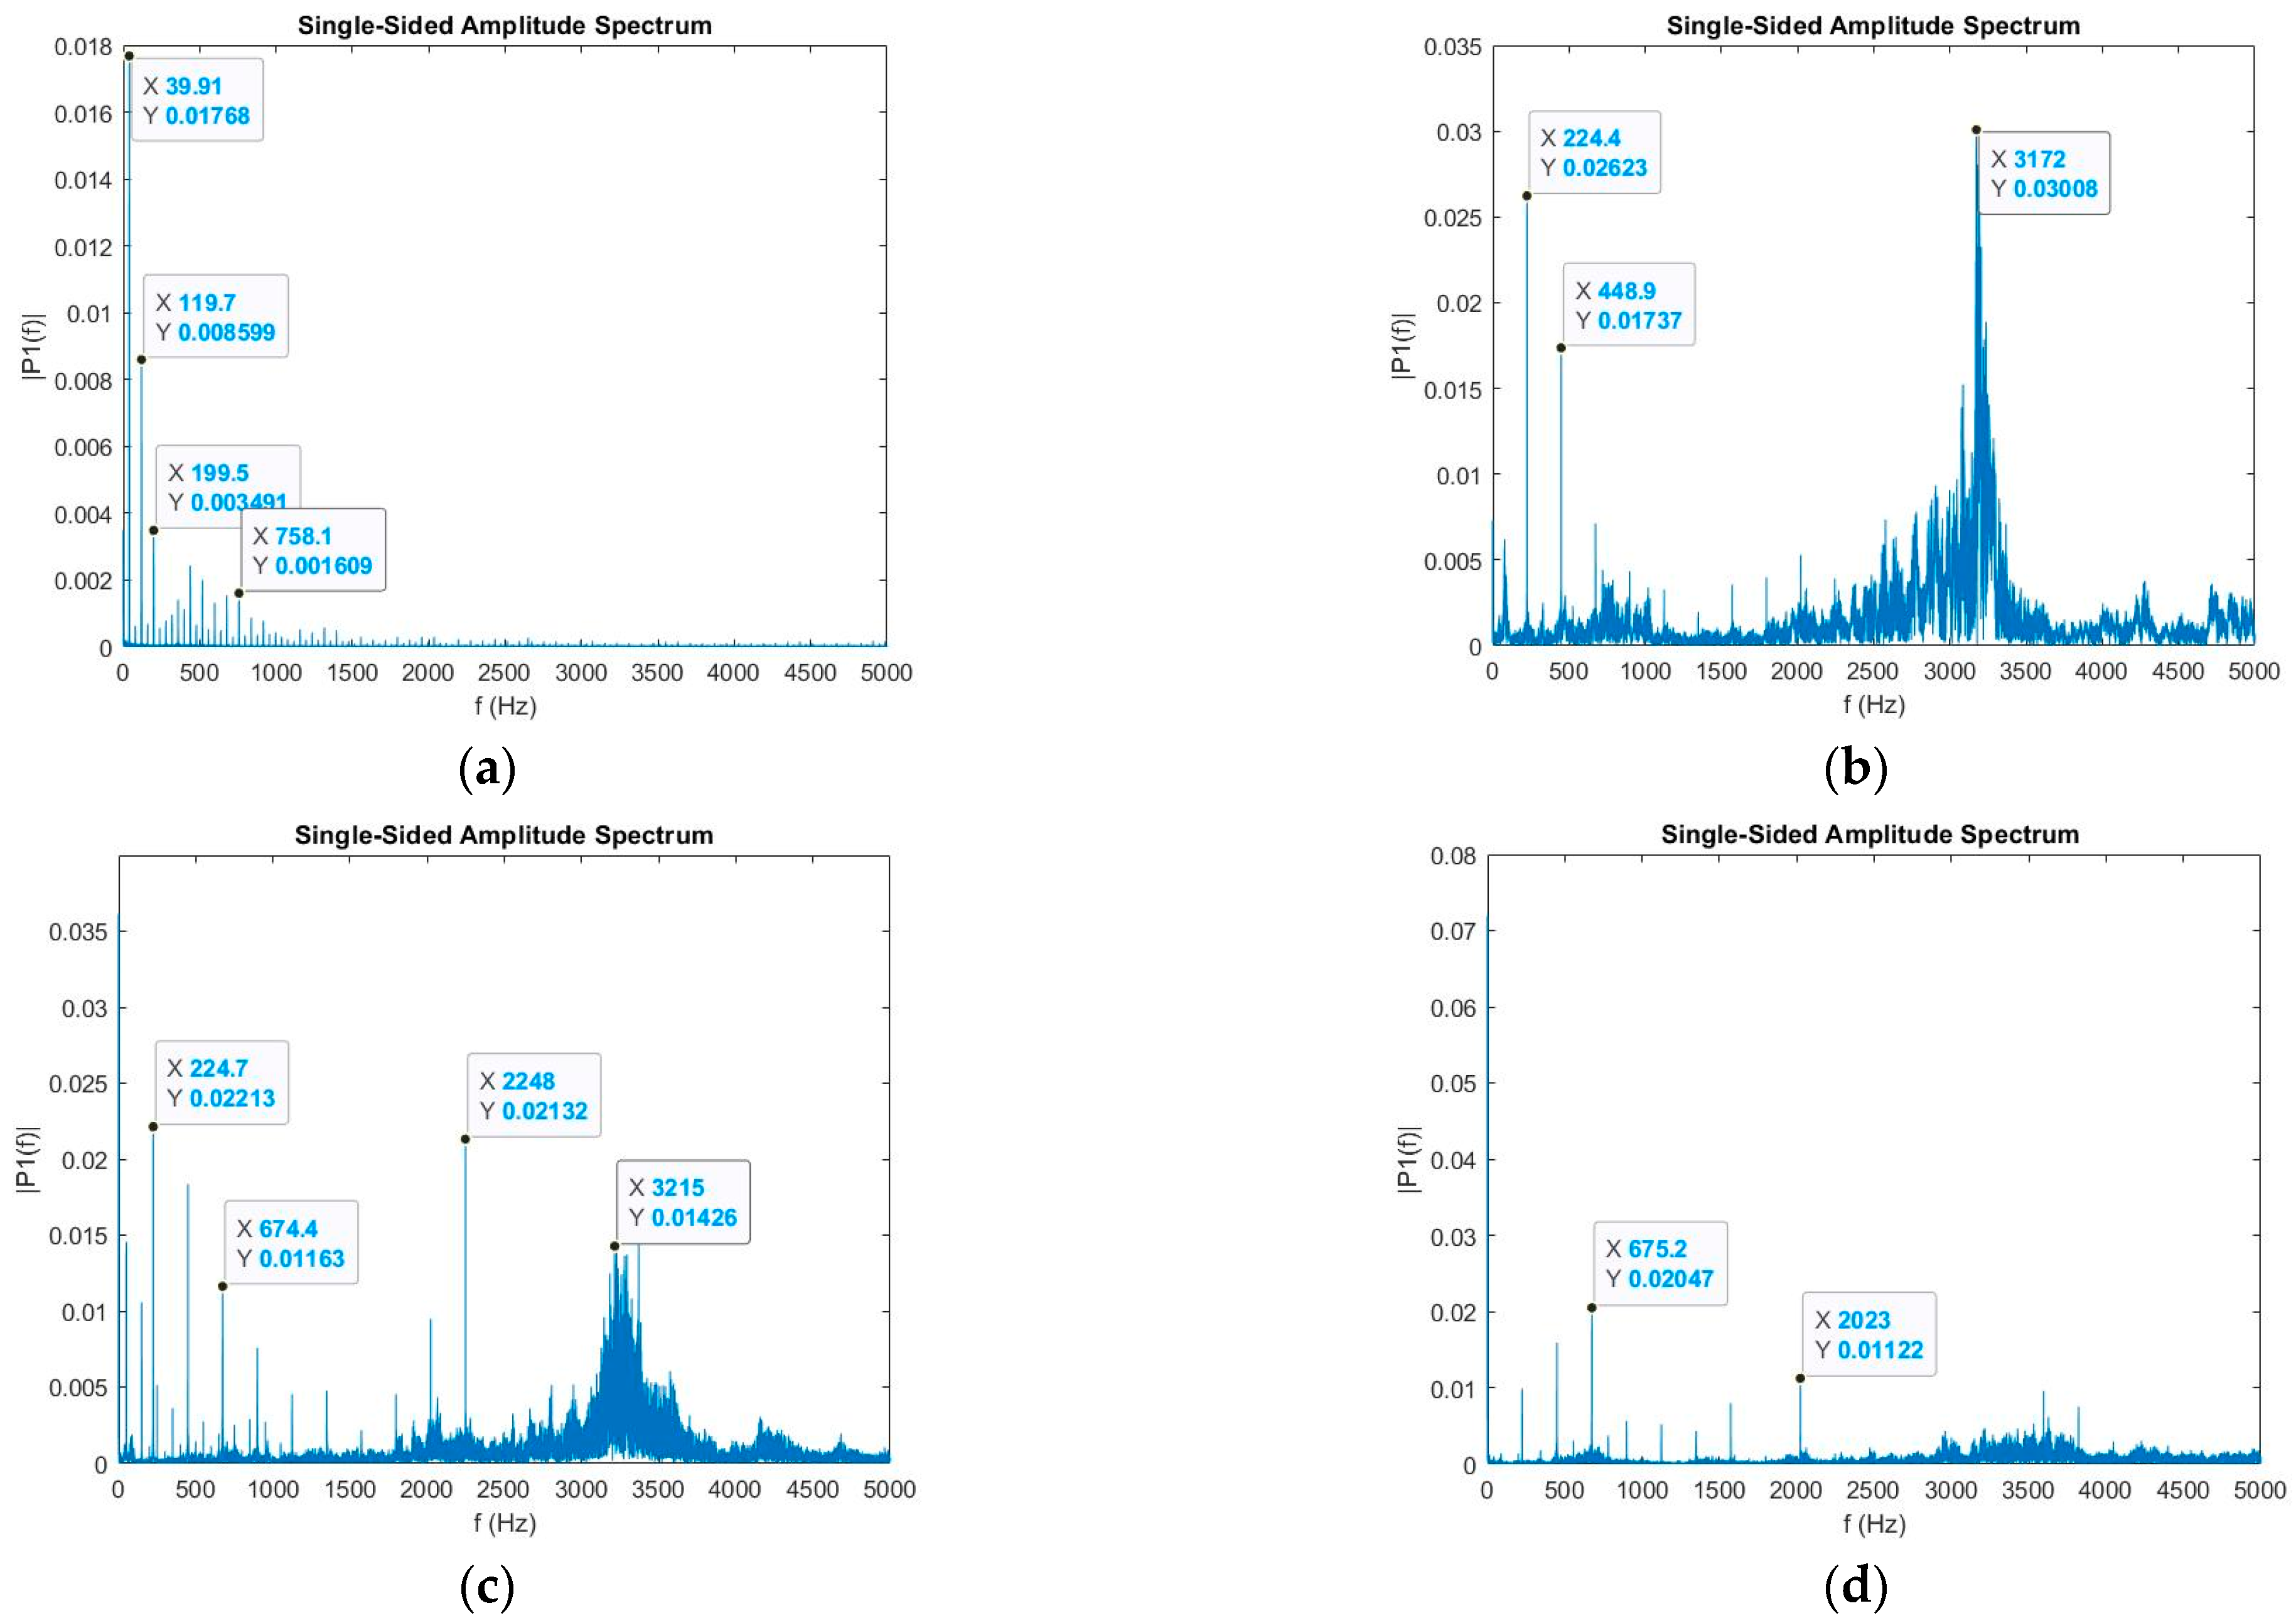
In the next step, the measurements were subjected to analysis in the frequency domain. The recorded signals were analyzed in the range of up to 5000 Hz, which corresponded to half the transducer sampling rate. For this purpose, Fast Fourier Transform (FFT) was used. FFT allows one to transform signals from the time domain to the frequency domain. This allows one to identify the frequency components present in the signal, allowing one to better understand its characteristics. FFT allows the identification of harmonic vibrations, i.e., vibrations with frequencies that are multiples of the fundamental vibration frequency. This is important because some machine faults can lead to the generation of such harmonics. This analysis can reveal characteristic vibration frequencies that may indicate specific problems with the hydraulic press, such as loose bearings or misalignments.
Figure 11 shows single-sided amplitude spectrums of the recorded signals.
The frequency analysis revealed significant differences between the recorded operating moments of the hydraulic press. When analyzing the background (no production,
Figure 12a), low frequencies up to 500 Hz dominated, with the main components occurring at 50, 225, and 450 Hz. In the case of operating without a part (
Figure 11b), the frequencies around 3.2 kHz had the largest share in the signal spectrum, and there were boosts in the values for the low frequencies of 225 and 450 Hz. During a normal production cycle (
Figure 12c), the dominant frequencies of the spectrum are 170, 510, and 850 Hz. For the last case considered, i.e., production with increased press pressure (
Figure 11d), there was no visible boost in the 3.2 kHz range. There were also low frequency components of 225 and 450 Hz. Based on the conducted frequency analysis, it can be clearly stated that it is suitable for analyzing the recorded signals, and thanks to it, the four cases discussed could be characterized in a clearer way. This fact may be useful, for example, to control the set press pressure.
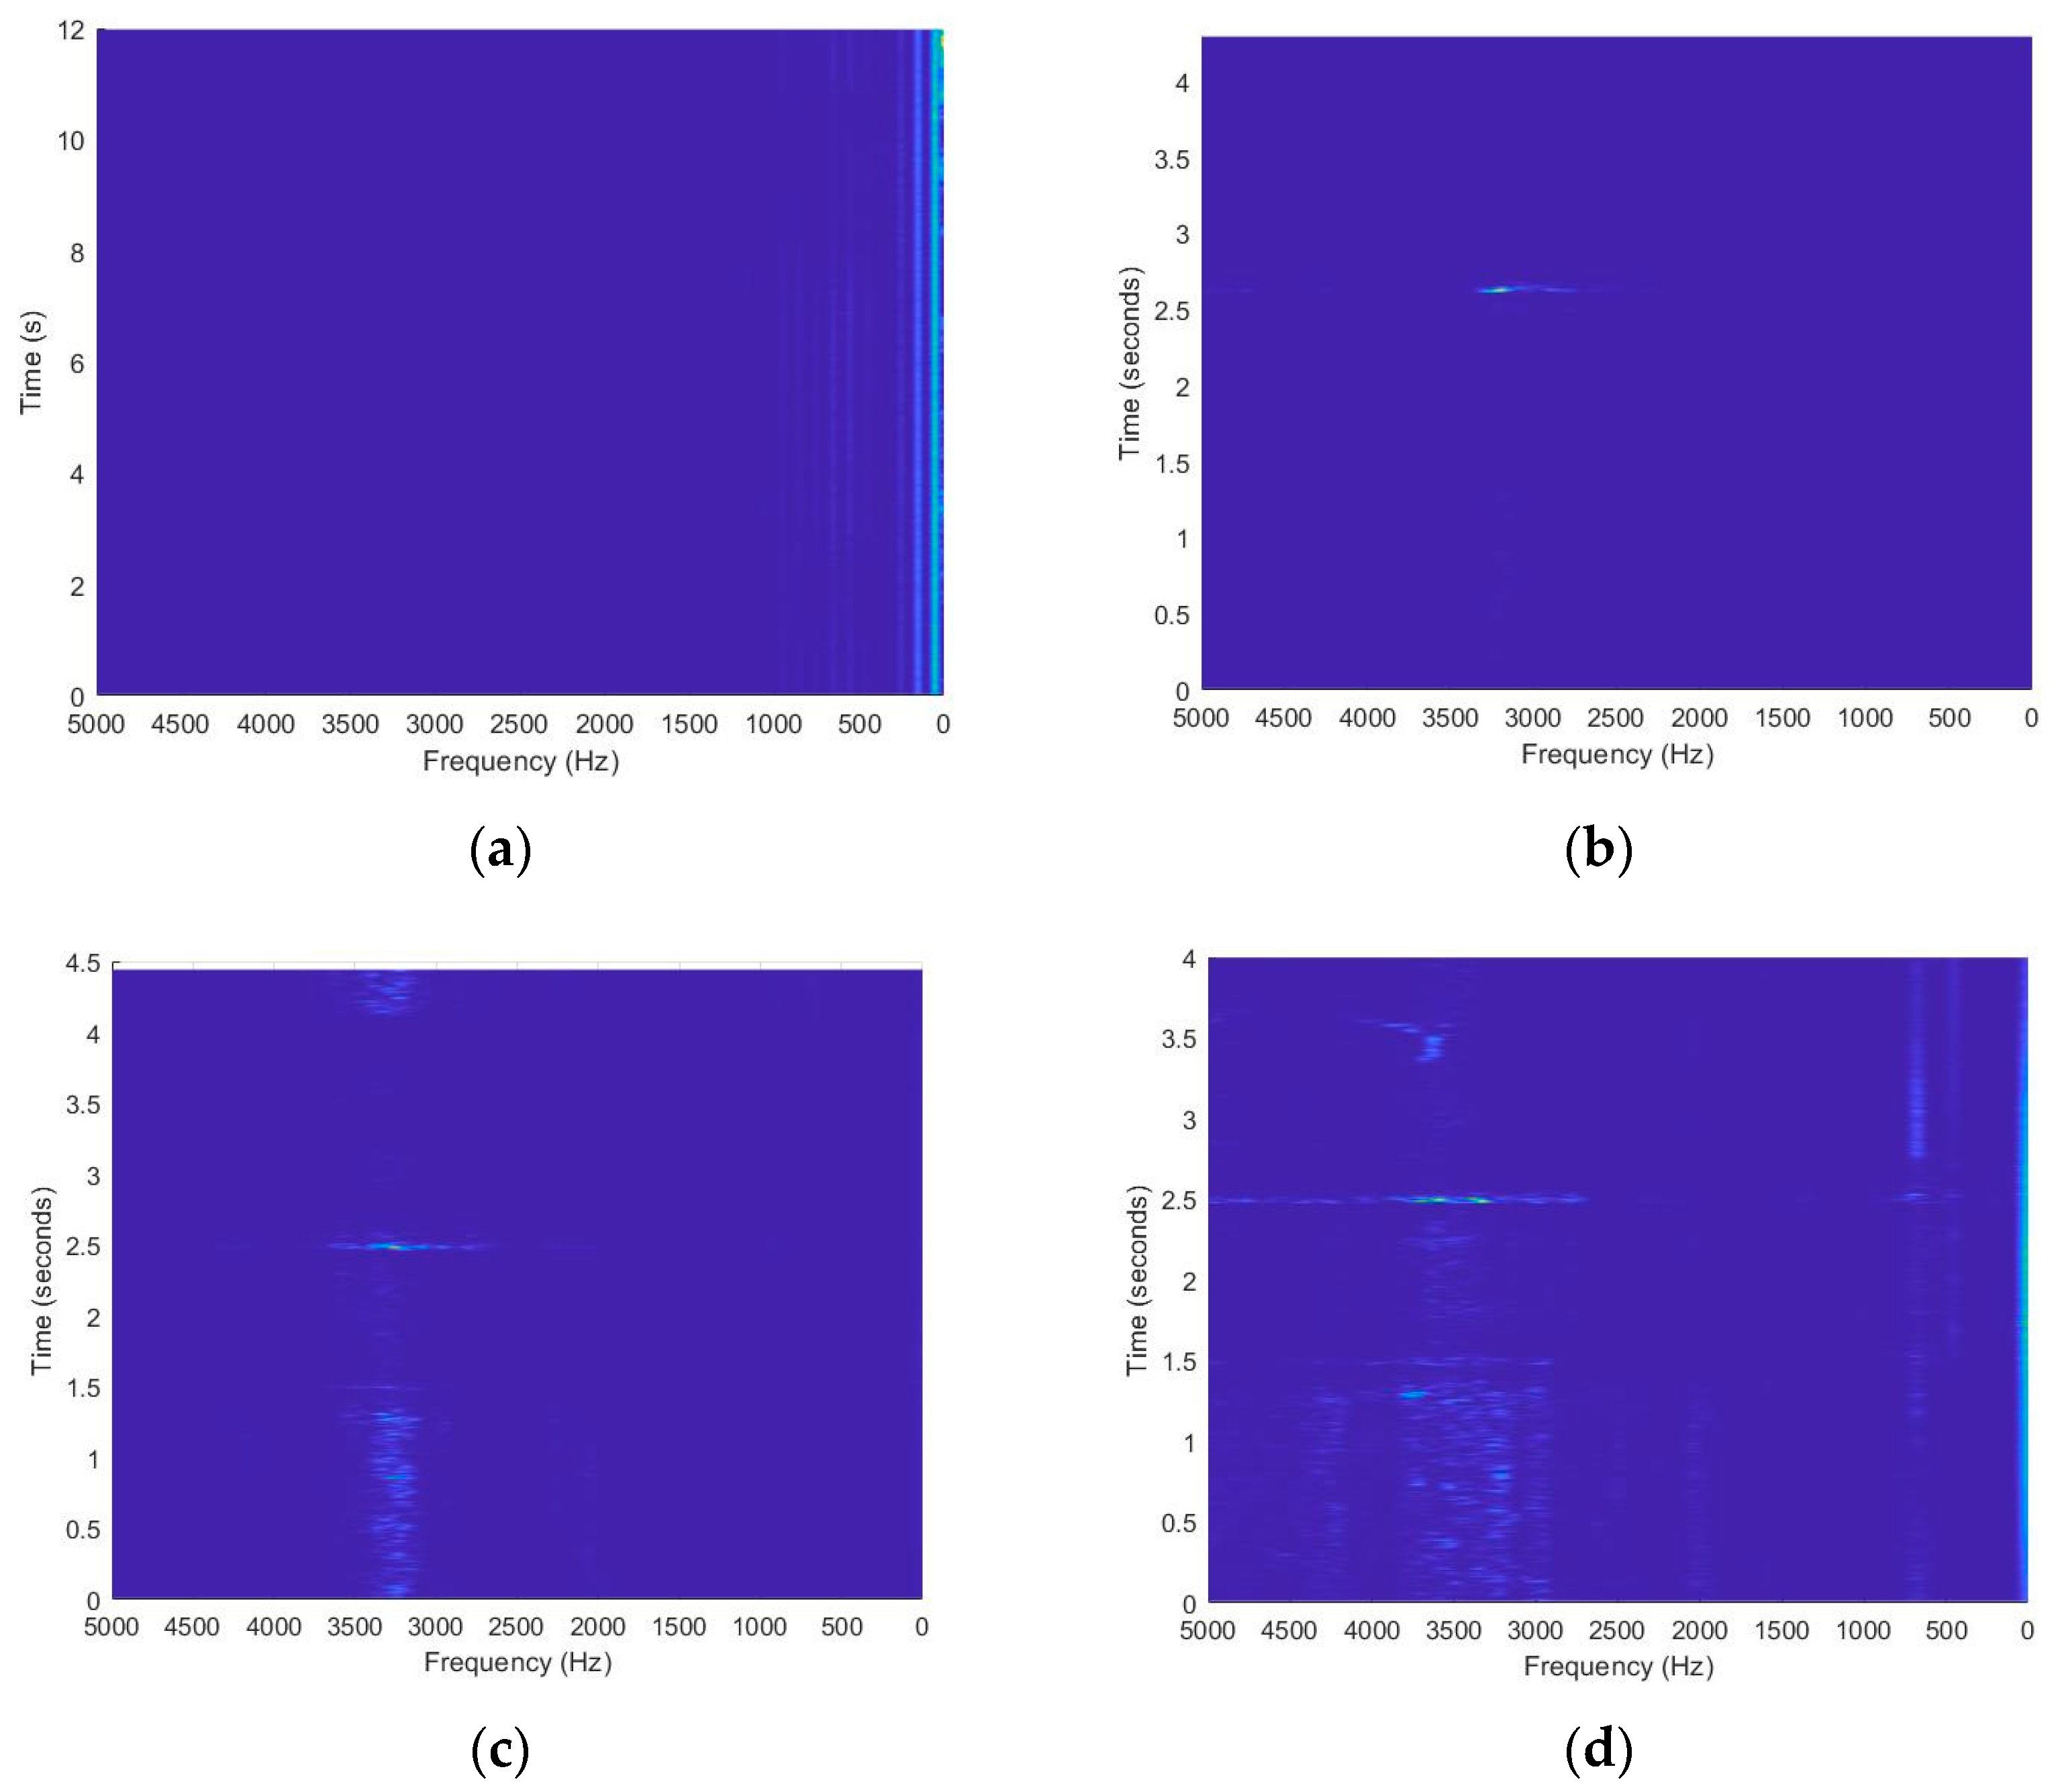
In the next step of the analysis, two-dimensional spectrograms were separately calculated for each of the tested cases and selected measurement points. They presented time–frequency images of the recorded signal. The presented spectrograms were described using a scale in the form of a color palette bar.
Figure 12 shows examples of the two-dimensional spectrograms.
By analyzing the determined spectrograms, it can be concluded that there were characteristic bands showing increased amplitude shares for the low frequency band (up to approximately 10 Hz). Analyzing
Figure 12b–d, one can notice the moment of impact visible in color changes around 3–3.5 kHz, appearing for 2.5 s of the measurement. In the case of production without parts, the change occurring around 3 kHz was the narrowest one.
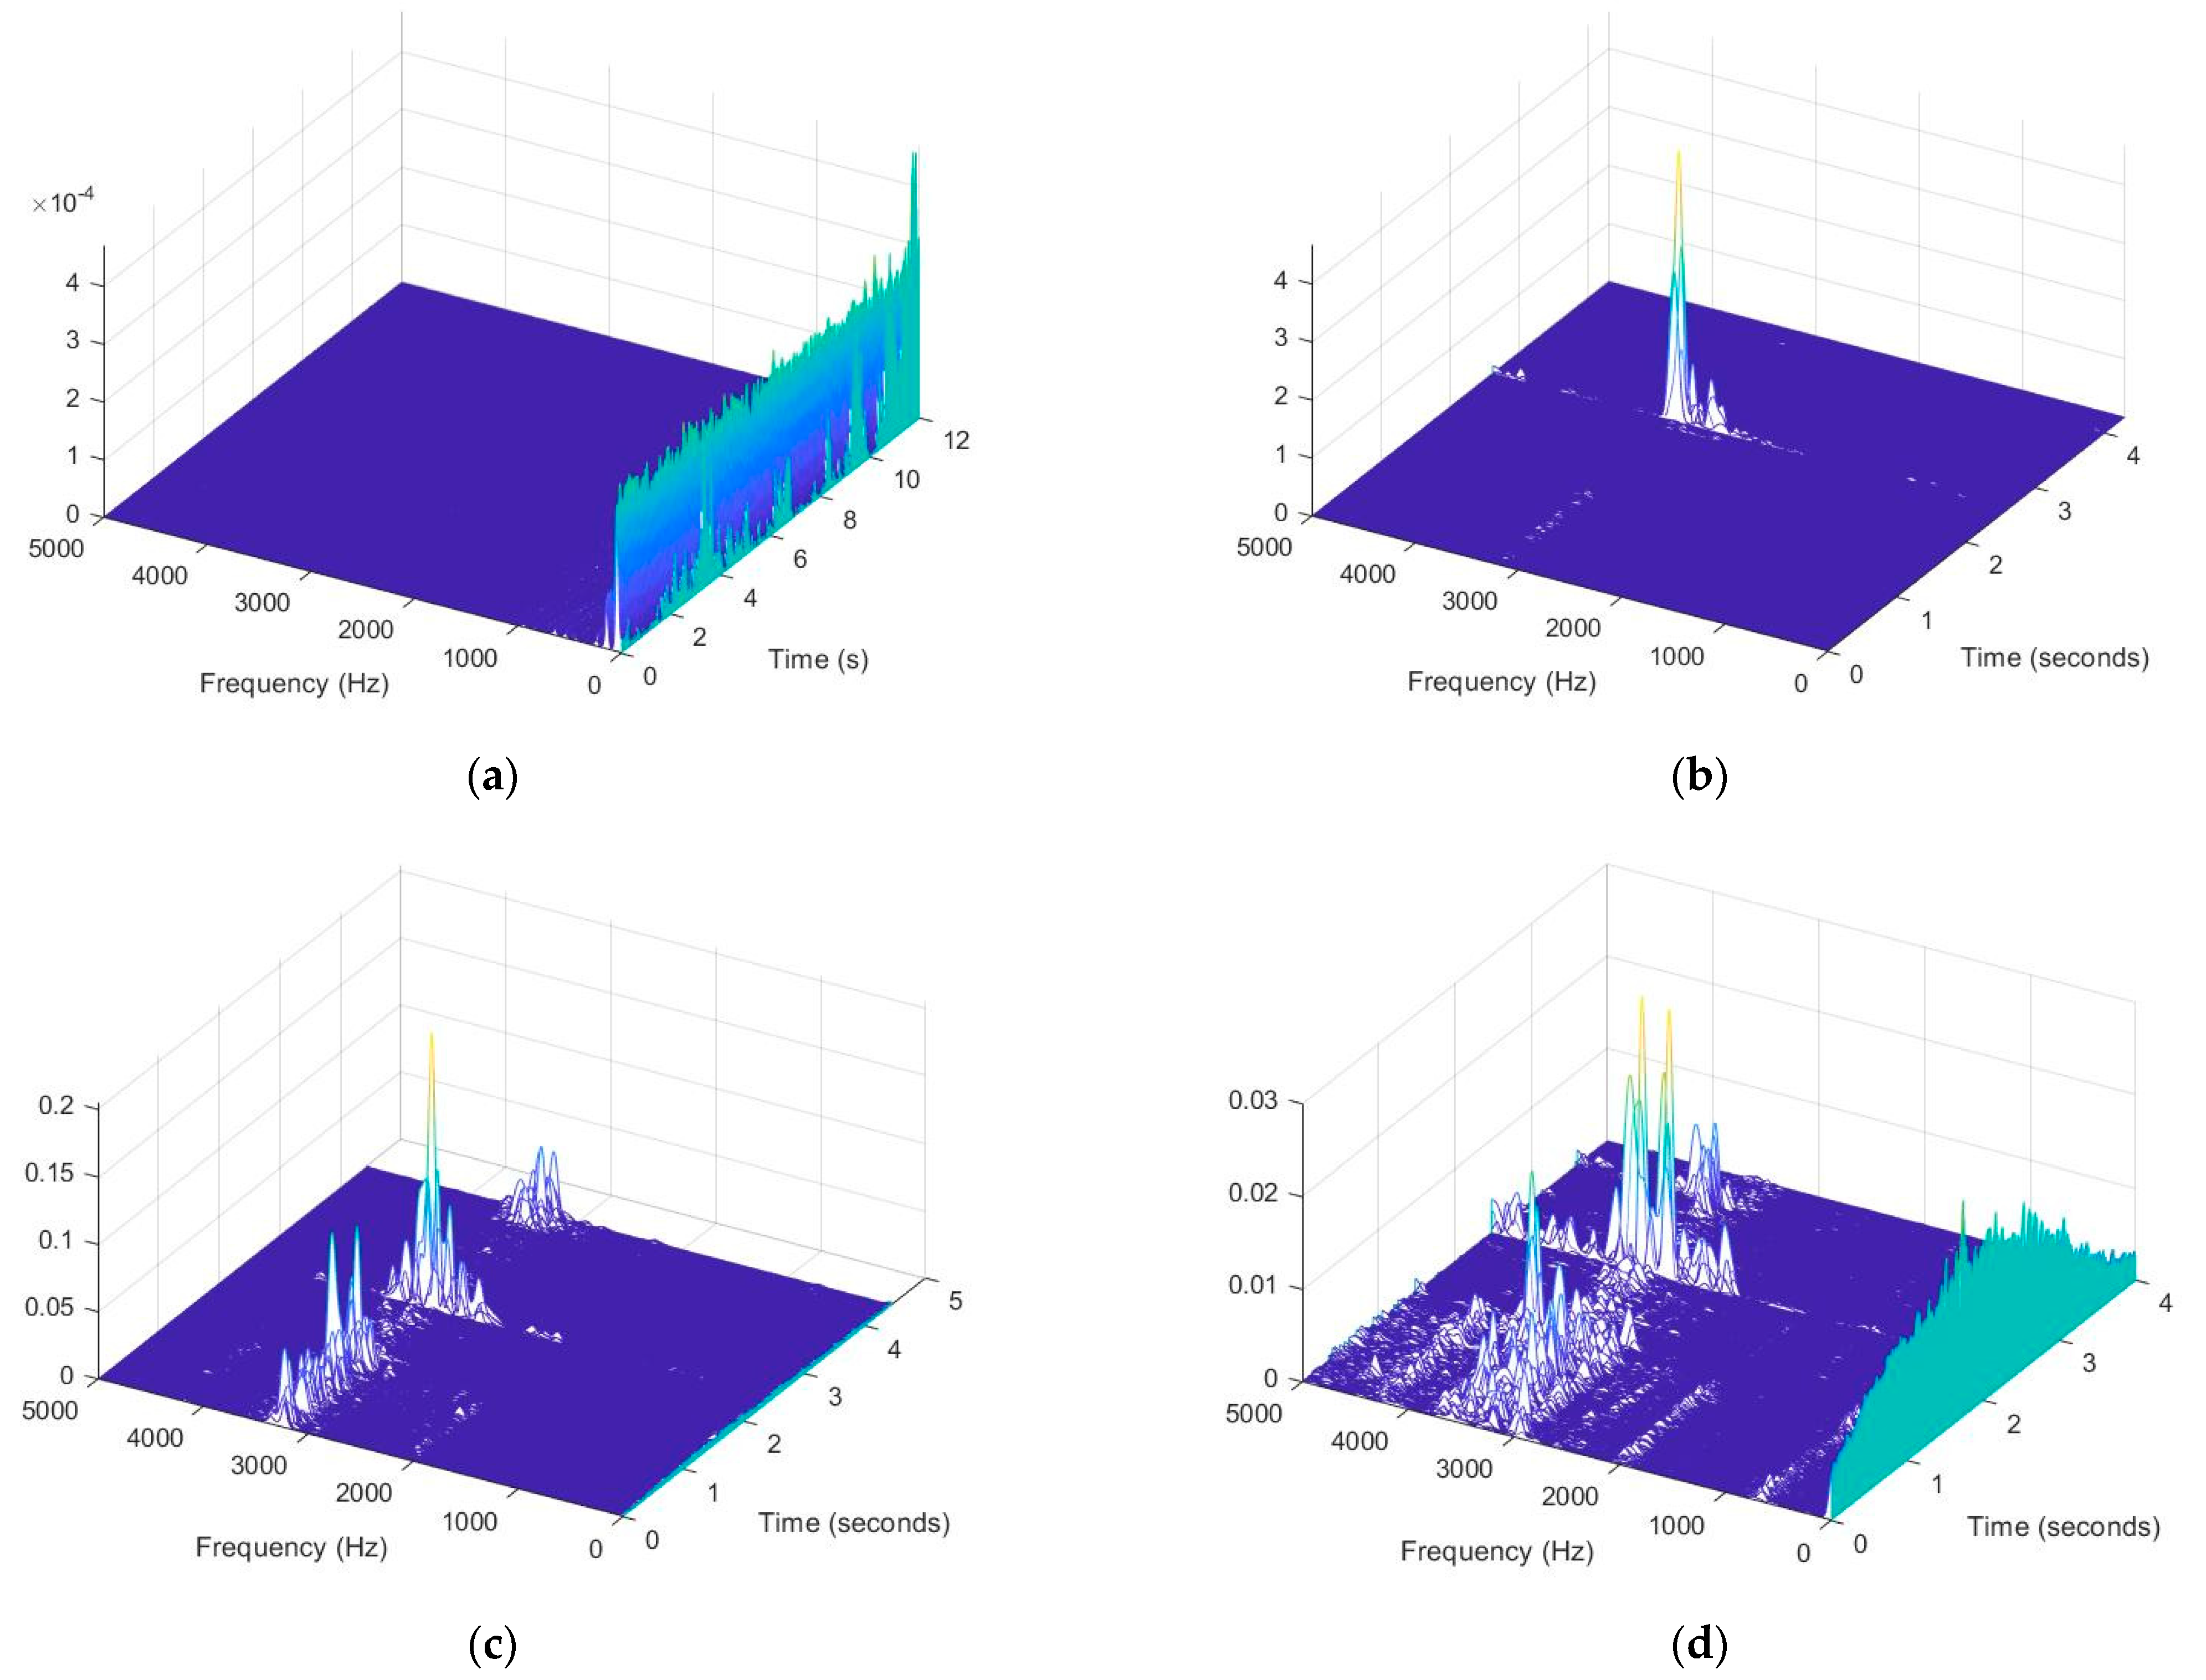
For a better representation of results, a waterfall plot was created. A waterfall plot is a graphical representation commonly used in signal processing and analysis to visualize the frequency content and changes in amplitude of a signal over time or frequency. It is particularly useful for displaying the spectral characteristics of time-varying signals, such as those encountered in vibration analysis, audio processing, and radar.
Figure 13 presents the created waterfall plots.
The results presented in
Figure 13 confirm all previous findings, further highlighting the nature of the changes in the spectrograms described above. In each of the presented cases, there were components with low frequencies (below 100 Hz), while for the pressing torque itself, there were components with frequencies of approximately 3000–3500 Hz (
Figure 13b–d).
The analysis performed in this study shows that the vibration level depended on some production parameters (number of parts simultaneously produced, press pressure, etc.). These data are part of a recipe containing a set of parameters and press settings for a specific part. Therefore, vibration measurements can be used as an element of controlling the settings of production parameters. Additionally, real-time vibration monitoring can be used to diagnose the technical condition of a hydraulic press and help develop a predictive motion maintenance system. An increase in vibration values or a change in their frequency may indicate an approaching emergency condition.
It is worth noting that the proposed measuring system was tested during serial production at a production plant located in the southern part of Poland. The possibility of changing the operating parameters of the press was therefore limited, so only the press pressure and number of parts simultaneously produced were taken into account in the analysis. In order to determine in detail the impact of press pressure on the form of vibrations, a number of tests should be carried out with variable input parameters. As a means to have full control over the optimal values of press operating parameters, which cause minimal vibration values, this system should already be implemented at the machine production stage and fine-tuned at the startup stage for the target user (production plant).
6. Conclusions
Hydraulic presses are subject to mechanical vibrations, which can be monitored using accelerometers. Accelerometers are mounted at various locations on the press where significant vibrations are expected. This may include the press frame, piston cone, head, slide, or other structural elements. Point mounting at specific locations allows for precise vibration measurements in these areas. In the analyzed example, it was proven that the mounting location within the press body does not affect the recorded acceleration values. Accelerometers record acceleration in three spatial directions (x, y, and z axes). In the case of a hydraulic press, vibrations along the axis associated with the movement of the piston and the overall structure of the press are most important. Time waveform analysis is a basic tool. For a deeper assessment of accelerations, more advanced signal analysis techniques such as Fourier or Falco analyses should be applied to transform the time signal into a frequency plot. This approach allows for the direct identification of dominant vibration frequencies. They can be associated with piston movement, structure resonance, or other factors. It is worth noting that different press operations, such as forming or cutting, can generate different vibration patterns. Knowing the vibration characteristics allows correlating this information with press operation during the production process. For example, vibrations associated with specific phases of pressing operations can be identified. Monitoring hydraulic press vibrations allows for enhancing its operation, identifying potential mechanical problems, and planning maintenance. In case of abnormalities, vibration monitoring can aid in quick diagnosis and repair.
In summary, this study demonstrated the significance of vibration monitoring in hydraulic presses and showcased the capabilities of advanced measurement systems in providing valuable insights into machine performance and health. The utilization of a sophisticated measurement system comprising accelerometers and data acquisition capabilities enables precise monitoring of vibrations, facilitating early detection of mechanical issues and proactive maintenance planning. Experimental studies conducted in various operating conditions reveal significant differences in vibration characteristics, emphasizing the importance of analyzing vibration data for understanding machine dynamics. The optimized configuration of the measurement system, coupled with comprehensive signal analysis techniques, contributes to improved production efficiency and reliability of hydraulic press equipment. By leveraging advanced measurement technology, signal processing and analysis, manufacturers can enhance productivity, minimize downtime, and ensure the longevity of their hydraulic press machinery, thereby improving overall operational efficiency and profitability. However, to identify the mentioned parameters, advanced signal analysis methods in the form of time series should be applied.
In the next stage of research, attempts should be made to develop patterns of vibration characteristics for individual operating parameters and to develop an automatic system of their classification based on artificial intelligence algorithms, which will contribute to the improvement of the predictive maintenance system for hydraulic presses.


