Article

Evaluation Model of Rice Seedling Production Line Seeding Quality Based on Deep Learning

1
Institute of Agricultural Information and Rural Economy, Sichuan Academy of Agricultural Sciences, Chengdu 610011, China
2
Crop Research Institute, Sichuan Academy of Agricultural Sciences, Chengdu 610066, China
*
Author to whom correspondence should be addressed.
Appl. Sci. 2024, 14(7), 3098; https://doi.org/10.3390/app14073098
Submission received: 4 March 2024 / Revised: 2 April 2024 / Accepted: 3 April 2024 / Published: 7 April 2024
(This article belongs to the Special Issue AI,IoT and Remote Sensing in Precision Agriculture)

Abstract

:
A critical precondition for realizing mechanized transplantation in rice cultivation is the implementation of seedling tray techniques. To augment the efficacy of seeding, a precise evaluation of the quality of rice seedling cultivation in these trays is imperative. This research centers on the analysis of rice seedling tray images, employing deep learning as the foundational technology. The aim is to construct a computational model capable of autonomously evaluating seeding quality within the ambit of intelligent seedling cultivation processes. This study proposes a virtual grid-based image segmentation preprocessing method. It involves dividing the complete image of a rice seedling tray into several grid images. These grid images are then classified and marked using an improved ResNet50 model that integrates the SE attention mechanism with the Adam optimizer. Finally, the objective of detecting missing seeding areas is achieved by reassembling the marked grid images. The experimental results demonstrate that the improved ResNet50 model, integrating the SE attention mechanism and employing an initial learning rate of 0.01 over 50 iterations, attains a test set accuracy of 95.82%. This accuracy surpasses that of the AlexNet, DenseNet, and VGG16 models by respective margins of 4.55%, 2.07%, and 2.62%. This study introduces an innovative model for the automatic assessment of rice seeding quality. This model is capable of rapidly evaluating the seeding quality during the seedling phase; precisely identifying the locations of missing seeds in individual seedling trays; and effectively calculating the missing seed rate for each tray. Such precision in assessment is instrumental for optimizing seedling processes

1. Introduction and Related Work

1.1. Introduction

Rice is pivotal among global cereal crops, underpinning the sustenance of the majority of the world’s populace, particularly in China, where it is the chief dietary staple. Ensuring a stable rice supply is vital for the food security of China. The established methodologies of rice production have historically demanded intensive labor, spanning the complete spectrum of activities from initial planting and meticulous field management to the final stages of harvesting and processing [1]. Recently, there has been a significant shift towards mechanization in rice production. This evolution has been crucial in increasing productivity and efficiency while simultaneously reducing both operational costs and labor reliance in rice cultivation practices [2].
Rice seedling production lines are intricately designed systems for automating the germination and nurturing of rice seedlings. These lines incorporate an array of mechanical devices, dedicated to the bulk production of uniform and healthy rice seedlings ready for transplantation into fields. Typically, these processes start with the seeding phase, where a mechanized seeder distributes rice seeds into seedling trays [3]. However, due to the random elements inherent in automated seeding, some areas within the trays may exhibit missed seeding. These gaps fail to yield normal seedlings, thus making the precise identification and enumeration of such areas a focal point in the production management of mechanized rice, as well as a crucial factor for targeted supplementary seeding.

1.2. Related Work

To date, a multitude of studies have been dedicated to evaluating the quality of rice seeding, incorporating diverse methodologies to identify instances of seed omission during the sowing process. These methods vary in approach and accuracy, offering a range of strategies to ensure optimal seed distribution and maximize agricultural efficiency. Among these, Wang An et al. [4] have proposed a method for assessing the quality of seed sowing in rice seedling trays based on an improved shape factor. This method employs threshold segmentation, morphological algorithms, and mask positioning techniques to extract the contours of seeds within each cell of the seedling tray. By employing connected component detection, it calculates the number of seeds in each cell, providing valuable data for subsequent supplementary sowing. Dong Wenhao et al. [5] developed a fixed threshold segmentation algorithm to differentiate grid images from seed images within seedling tray photographs. They also devised a technique to extract grid line pixel coordinates from grid images, which entails scanning contours within each image to inspect seed presence in cells, thereby calculating the number of misses and ultimately determining the missing rate of hybrid rice seeds.
The evaluation of seed quality is equally crucial for crops beyond rice. Researchers worldwide have also endeavored to employ deep learning techniques to detect instances of missed seeding in trays for various crops, achieving notable progress. Bai Jinqiang et al. [6] have developed a sweetcorn seed detection method based on a voting mechanism, designed to identify missing seeds in moving seedling trays. This method has demonstrated favorable results in experimental settings. Gao Junpeng et al. [7] have innovated an automated supplementary seeding apparatus employing machine vision, adept at identifying unseeded spots in trays even at high velocities. This apparatus, when integrated into a tray-type leek seeding machine, accomplishes supplementary seeding, reducing the rate of unseeded tray holes from an initial 5.37% down to 0.89%. Concurrently, Zeyu Yan et al. [8] proposed a perception method for tomato trays, leveraging the YOLOv5x model to detect missing seeds and fill vacant cells. They developed a detection and supplementary seeding mechanism for tomato plug trays and trialed it within a greenhouse. The findings indicated a mean detection precision of 92.84% and a successful re-plantation efficacy of 91.7% on the trays. Zhang Weipeng et al. [9] proposed a machine vision-based method for detecting missed seeding, utilizing small-diameter and irregularly shaped cabbage, tomato, and radish seeds as experimental subjects. The accuracy of this method in monitoring seed misplacement for vegetable seeds reached 92.5%.
Subsequent to analyzing the literature above, it is discernible that the application of machine vision for missed seeding detection is comparatively advanced in diverse agricultural productions. Nonetheless, the studies mentioned above are subject to certain limitations. Firstly, most of the relevant research relies on traditional machine vision techniques such as threshold segmentation, morphological algorithms, and SIFT for seed misplacement detection. These methods often lack the accuracy, generalization ability, and capacity to handle complex scenarios characteristic of deep learning approaches. Additionally, the prevalent focus is on grid-patterned seeding trays, which offer relative ease in positioning and detection. Contrastingly, most contemporary rice seeding trays do not conform to a grid pattern and present a more stochastic seed distribution, increasing the complexity of detection, with scant research addressing seeding quality detection for this tray type. Detecting unseeded areas in rice seeding trays can empower farmers and producers to monitor production, analyze pertinent data, and render decisive support for reseeding tasks [10]. Therefore, this research centers on the analysis of rice seedling tray images, employing deep learning as the foundational technology. The aim is to construct a computational model capable of autonomously evaluating seeding quality within the ambit of intelligent seedling cultivation processes. This study proposes a virtual grid-based image segmentation preprocessing method. It involves dividing the complete image of a rice seedling tray into several grid images. These grid images are then classified and marked using an improved ResNet50 model that integrates the SE attention mechanism with the Adam optimizer. Finally, the objective of detecting missing seeding areas is achieved by reassembling the marked grid images.
This study aims to design and implement a evaluation model of rice seedling production line seeding quality based on improved ResNet50. This work is organized as follows: Section 2 is dedicated to introducing the dataset and outlining the design of the improved model. Section 3 describes the experimental process of model enhancement and presents the results of comparative experiments. Section 4 then thoroughly explores the strengths and limitations of the proposed model. Section 5 provides a summary and conclusion.

2. Materials and Methods

This study’s proposed approach encompasses two principal components: training and implementation. In the training stage of the model, there are five essential steps. Initially, preprocessing the gathered image dataset involves segmenting the original images into various rectangular segments. Subsequently, these segments are classified and labeled. The third step is to augment the dataset, particularly for categories with fewer images, using data augmentation techniques. In the fourth step, these labeled image segments are proportionally distributed into training, validation, and test sets. The final step entails training the model with these categorized image blocks.
During the practical implementation stage of the model, it encompasses five steps. Initially, input images are segmented into a series of rectangular blocks, conforming to predefined parameters. Subsequently, these image blocks are input into a trained improved ResNet50 model. The third step involves categorizing the image blocks, with missed seeding blocks receiving a blue overlay. Fourth, these labeled blocks are combined with two additional types of unlabeled blocks to form a unified image, highlighting seedless areas in blue. The final step includes counting the seedless blocks and using pre-trained parameters to calculate the missed seeding rate and generate the consolidated image. The complete design process is illustrated in Figure 1.

2.1. Image Dataset

2.1.1. Image Acquisition

In this research, the imagery of rice seedling tray sowing was gathered from the Rice Seedling Cultivation Base at the Crop Research Institute, Sichuan Academy of Agricultural Sciences. Captured within the confines of a rice seedling production workshop, all photographs were taken using the iPhone 12 Pro’s native camera (Apple, Cupertino, CA, USA). To address the sowing machine’s stochastic nature, our team employed three distinct seeding techniques: dense, uniform, and sparse, creating zones of missed sowing in the trays. This methodology was pivotal in optimizing the training of our convolutional neural network model, as illustrated in Figure 2.
Furthermore, to more accurately replicate the authentic conditions of rice seedling production lines, our study involved selecting two varieties of rice, two seed coating colors, and two soil types (substrate soil and soil). This selection facilitated the creation of eight distinct image categories through various combinations, as demonstrated in Figure 3. For photographic documentation, each sowing method—dense, uniform, and sparse—was represented in five images, adhering to a proportional distribution of 1:1:1. Consequently, each category comprised 15 images, culminating in a comprehensive collection of 120 images. This approach enabled us to effectively simulate a broader spectrum of scenarios typically encountered on production lines with constrained resources.

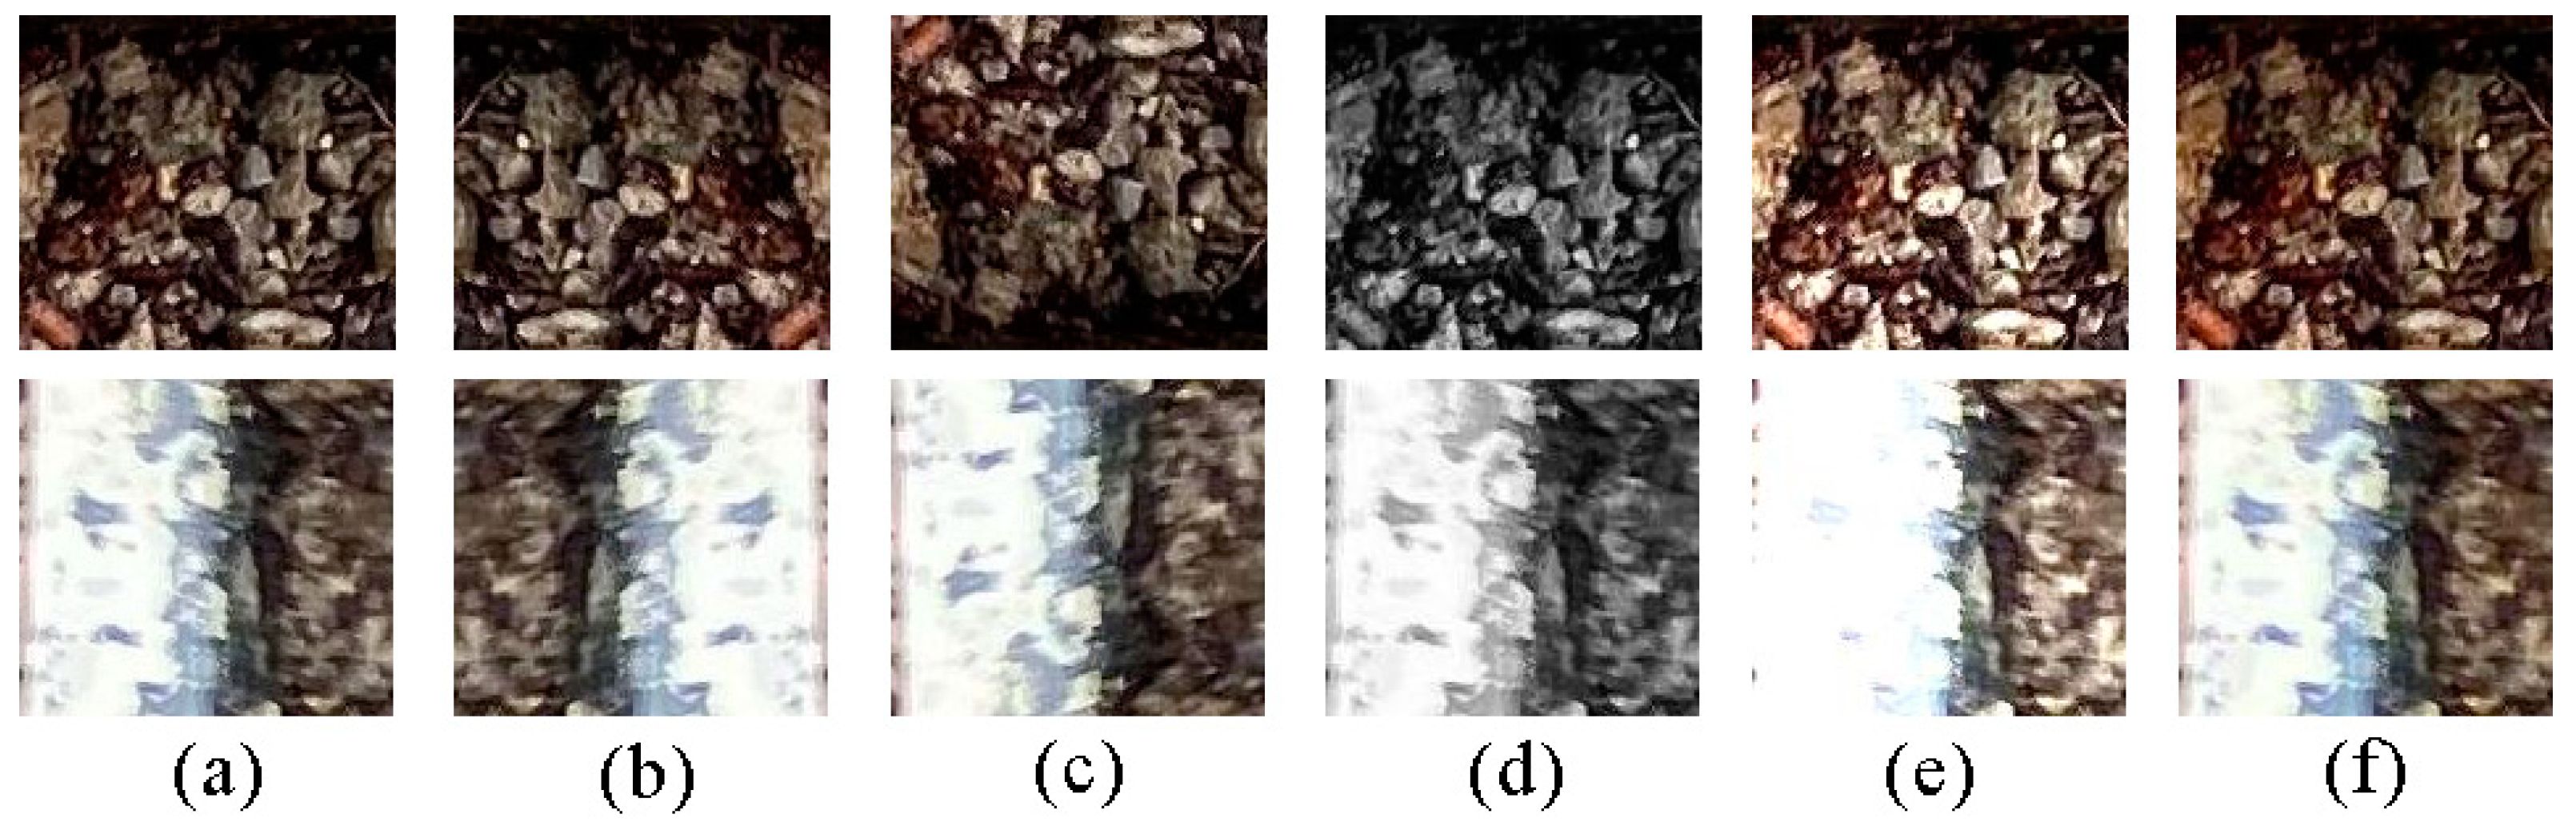
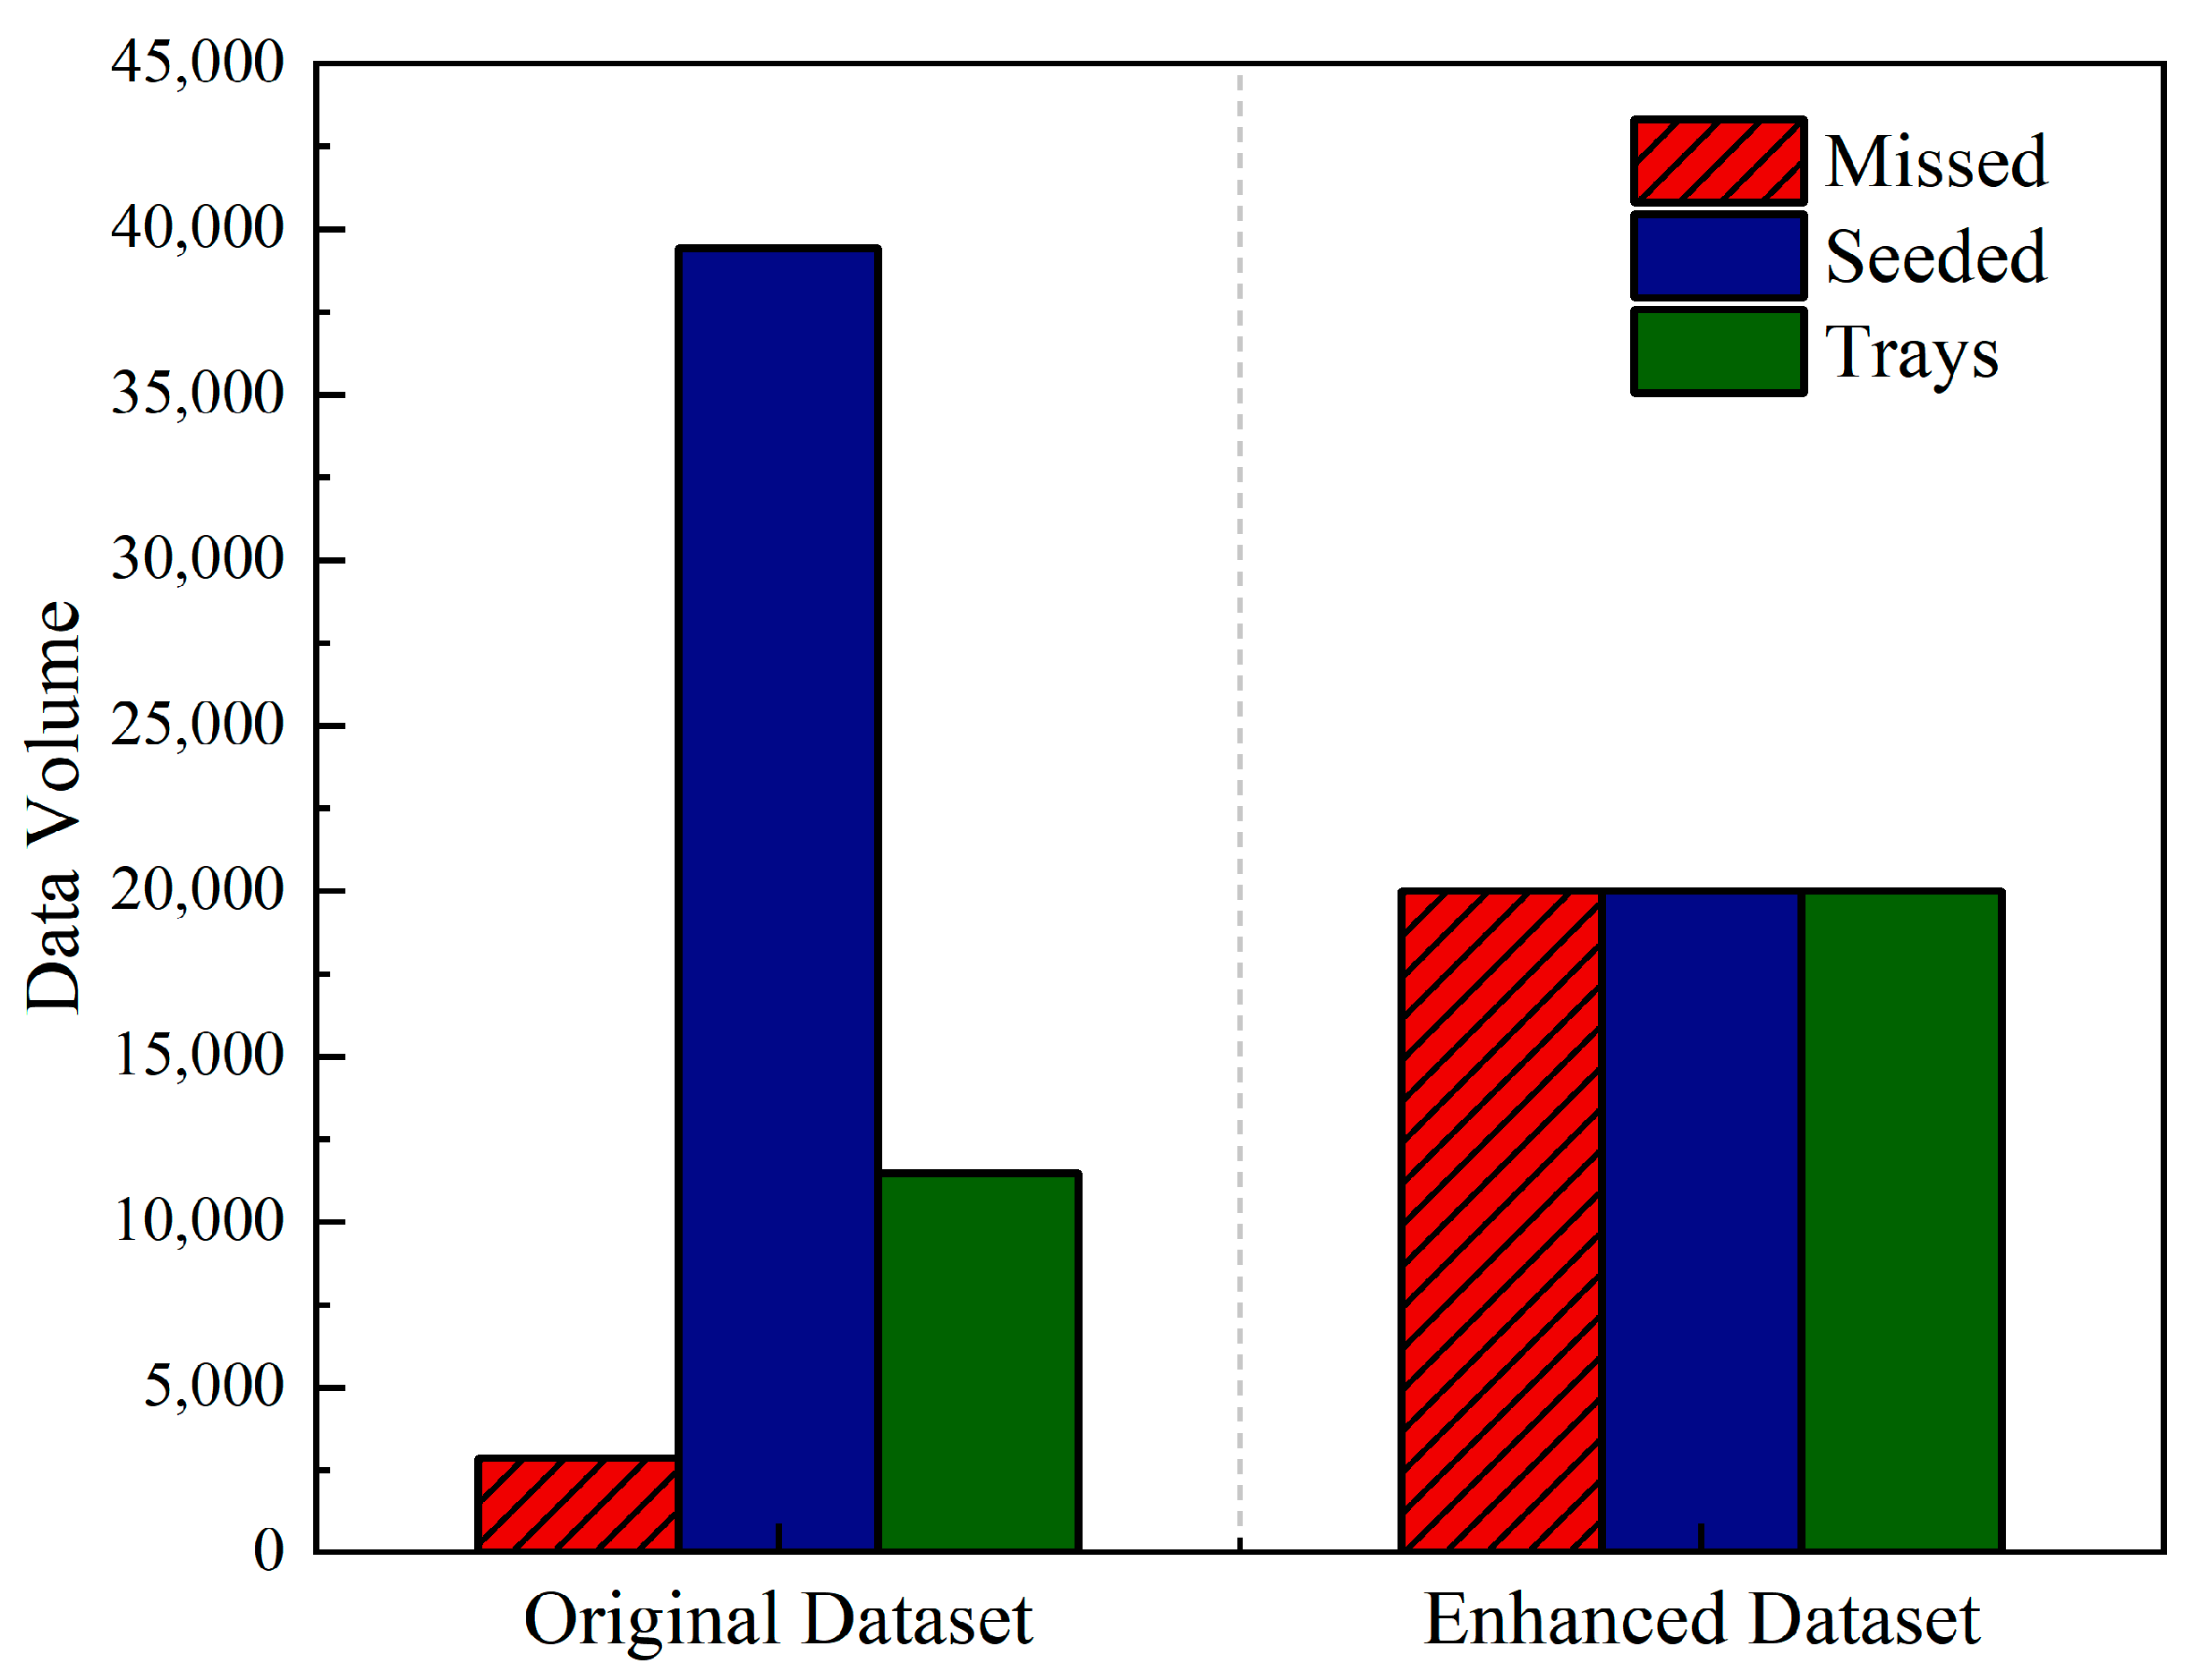
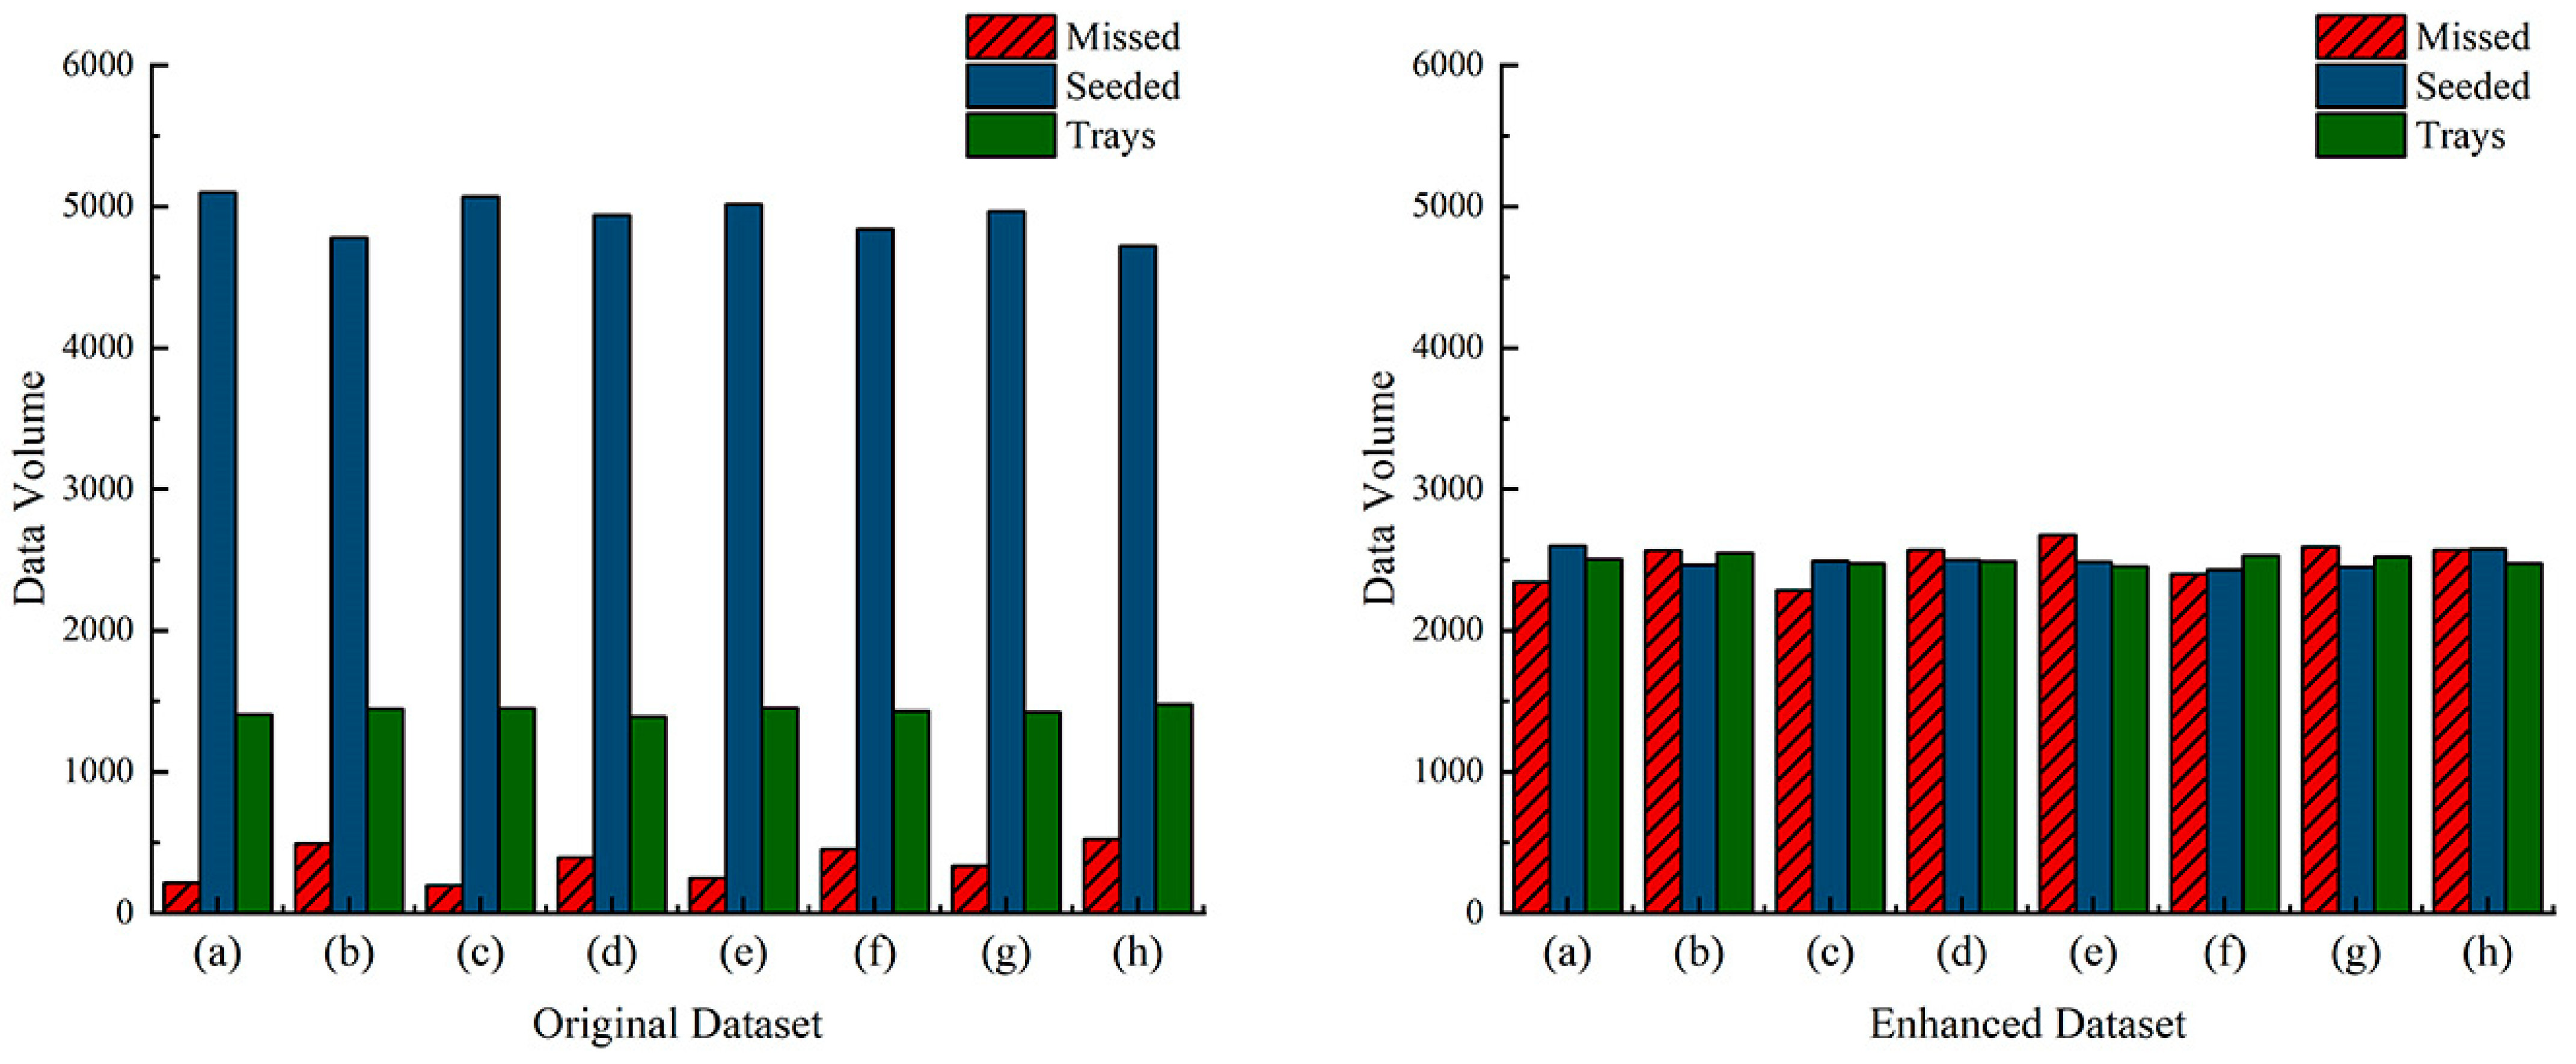
2.1.2. Data Preprocessing

The efficacy of the rice seedling tray sowing quality model hinges on accurately locating and identifying areas of missed sowing, a task generally encompassed by object detection or semantic segmentation. The challenge arises due to the substantial overlap of rice seeds during sowing and the consequent complexity of edge extraction, rendering object detection suboptimal for this purpose. Reflecting China’s standard rice seedling machine transplanting grids of 16 × 28 or 24 × 42, our study introduces a novel virtual grid-based image segmentation preprocessing technique. This method segments a full seedling tray image into multiple grid images for categorization and annotation by our model, facilitating the precise detection of missed sowing areas. As per the machine transplanting standards, the preprocessing stage involves segmenting the complete tray image into a 16 × 28 grid pattern, as illustrated in Figure 4, resulting in 448 individual grid images per split image.

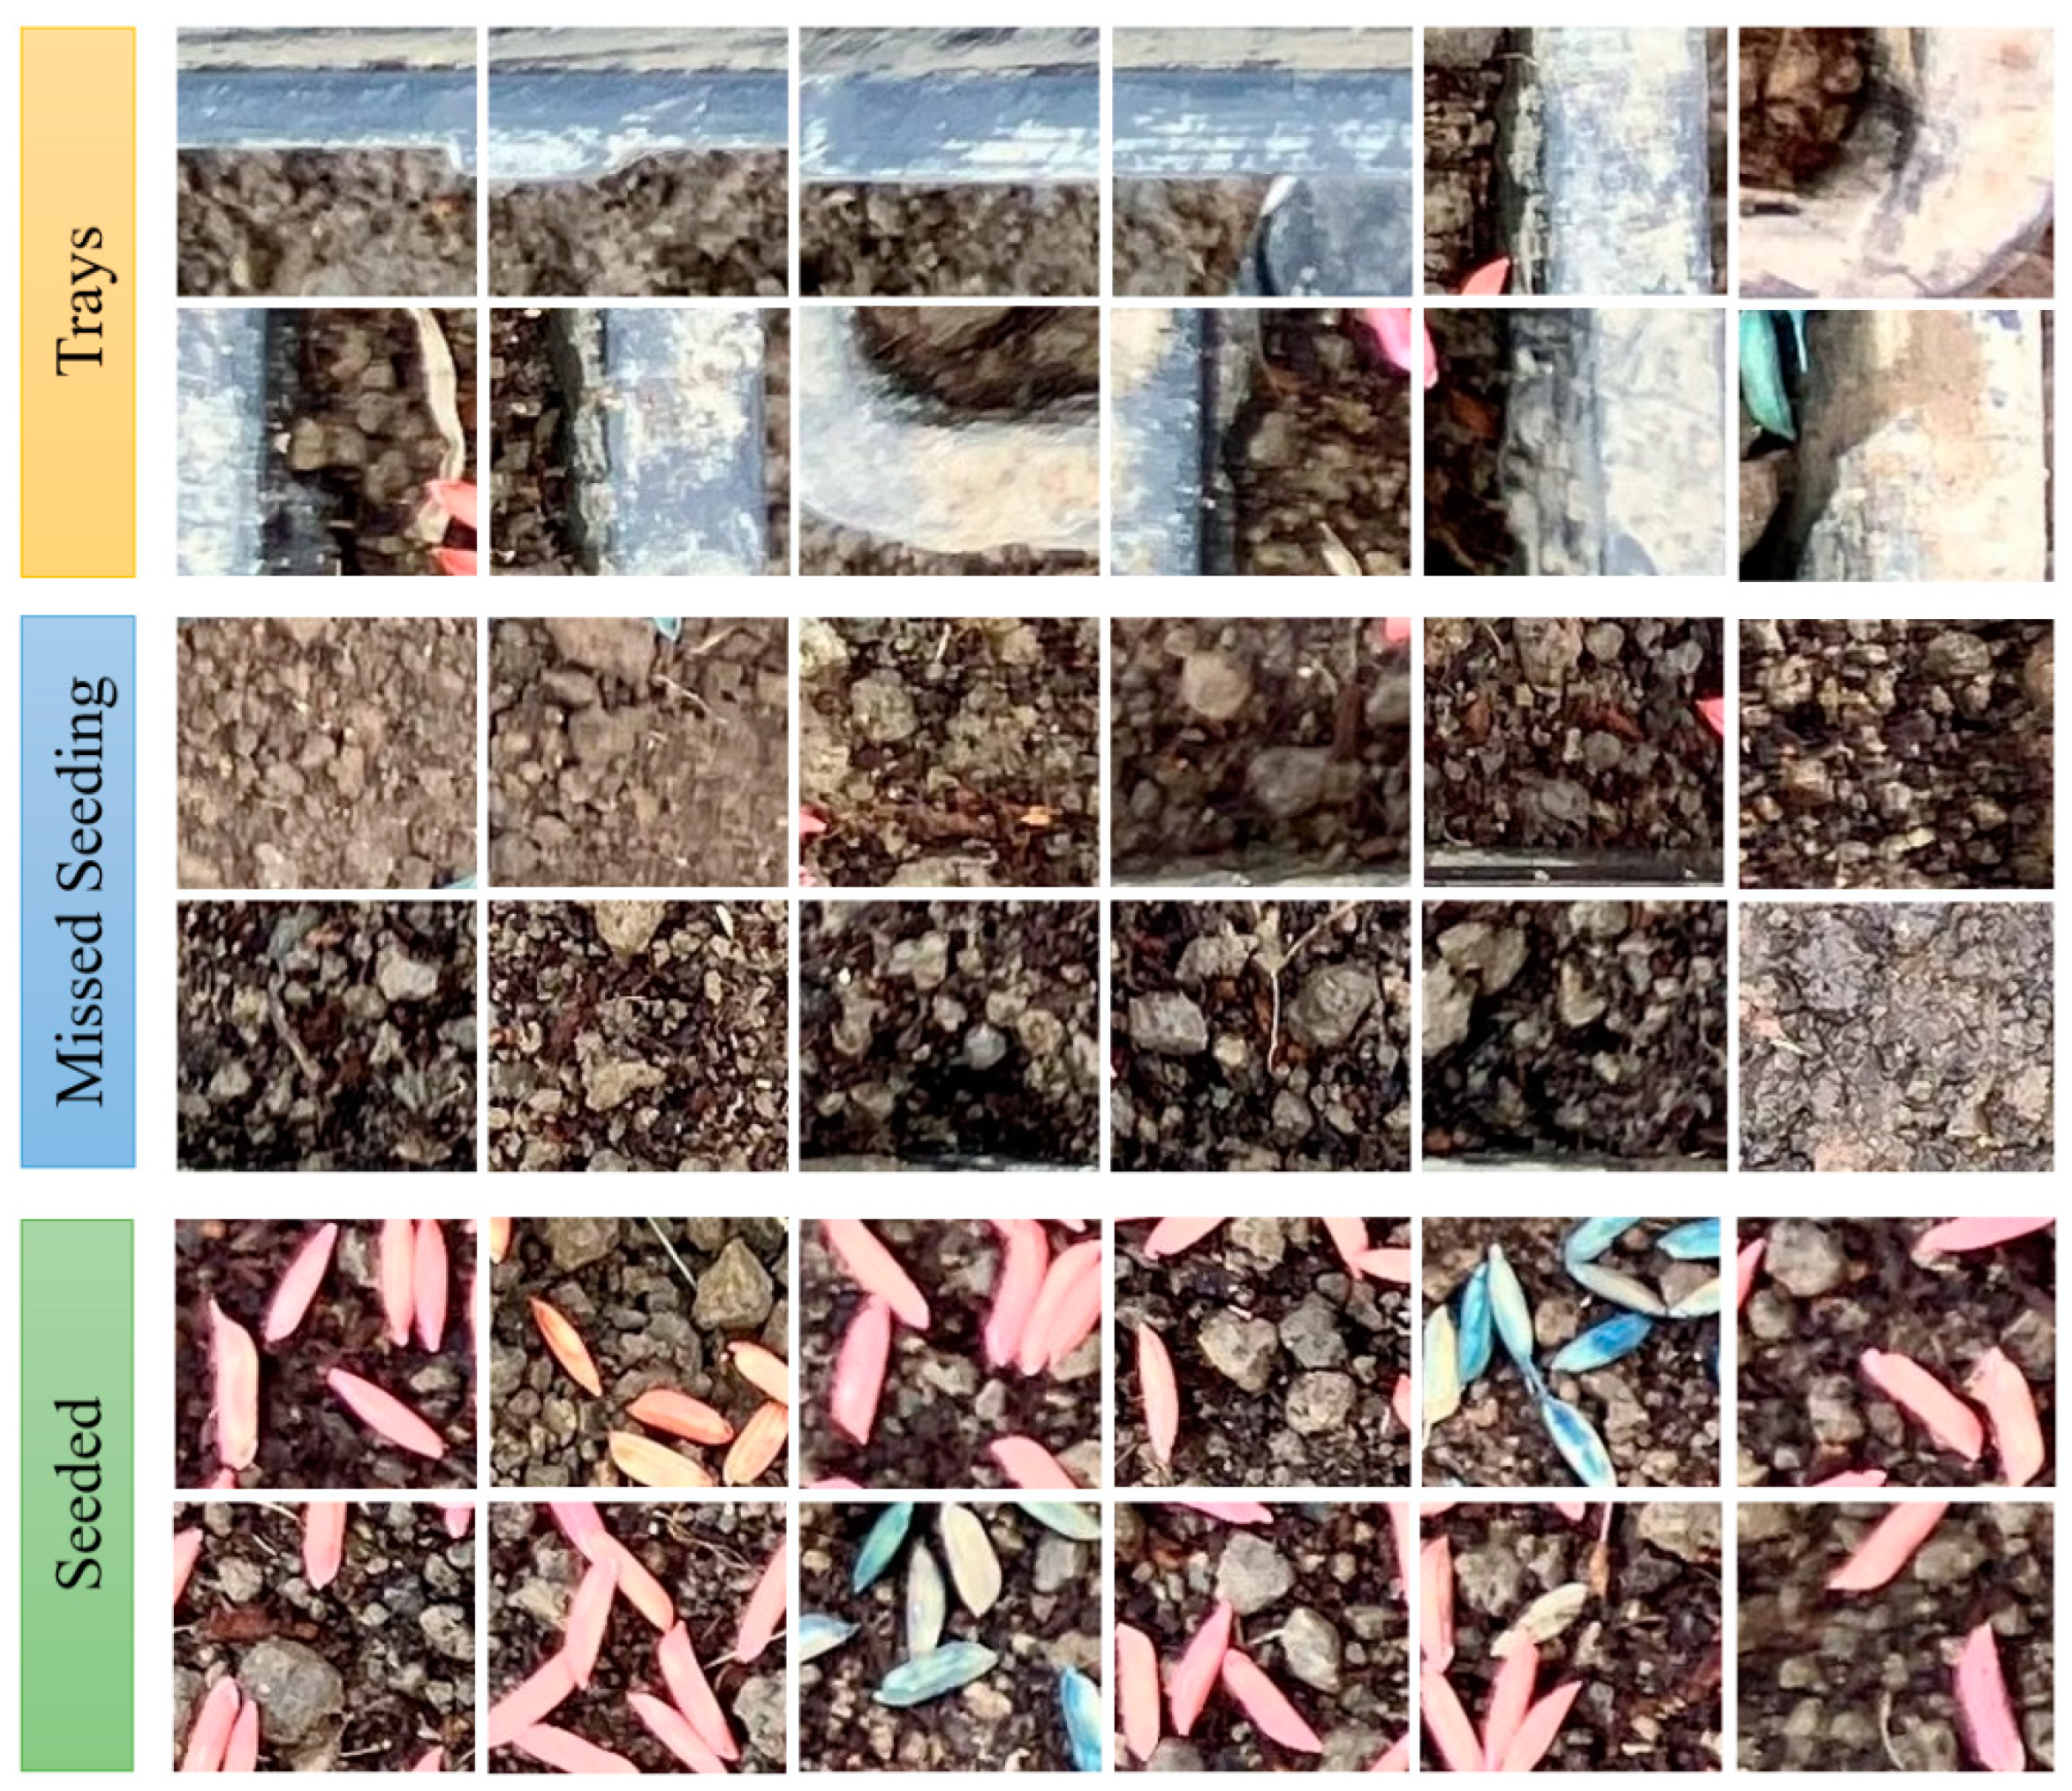
2.1.3. Data Annotation

Upon segmenting the 120 seedling tray images into a grid of 16 × 28, the study generated a comprehensive collection of 53,760 individual grid images. These images were then meticulously categorized based on their distinct characteristics into three classifications, trays, seeded, and images missed seeding, as illustrated in Figure 5.
In the segmented image dataset, more than 70% of the images contained seeds, with trays and images missed seeding being comparatively less common. To address the potential decline in model accuracy caused by this data imbalance, the study implemented data augmentation strategies, including horizontal and vertical flipping, along with adjustments in brightness and saturation, as illustrated in Figure 6.
To balance the dataset, the number of images both without seeds and with trays was augmented to reach 20,000 each. Concurrently, a random undersampling technique was applied to decrease the quantity of images with seeds, achieving an equal distribution of 20,000 images across each of the three categories, culminating in a total of 60,000 images. Subsequently, the dataset was methodically partitioned into training, validation, and test sets in an 8:1:1 ratio, comprising 48,000, 6000, and 6000 images respectively. The balanced dataset is shown in Figure 7.
To confirm the even distribution of the augmented dataset and ensure comprehensive coverage of scenarios, the annotated data for the three classes in this study were categorized into eight combinations as described in Section 2.1.1. The distribution of the resulting dataset is presented in Figure 8.
As depicted in Figure 8, the original image dataset exhibits a notable scarcity of images depicting missing seeds or seedling trays compared to those containing seeds. In the group with the most significant difference in data volume, images with seeds comprise 76% of the total for that category. However, following the application of data augmentation and random undersampling techniques to rebalance the dataset, the maximum disparity in image counts does not exceed 10%. Consequently, the dataset achieves a nearly uniform distribution, effectively covering all categories within the experimental environment.

2.2. Model Construction

2.2.1. ResNet50

In traditional convolutional neural networks (CNNs), a notable limitation arises during model training: an inability to enhance accuracy as the network depth increases. This challenge was addressed in 2015 by He Kaiming and colleagues with the introduction of the ResNet model. ResNet, through the implementation of residual mappings, effectively overcomes the prevalent issues of gradient vanishing and explosion in deep neural networks, facilitating the training of more profound network layers [11,12]. The essence of the ResNet model is encapsulated in its shortcut connection structure. In this design, the output value x, after encountering the first weight layer, acquires a residual mapping F(x). As it proceeds to the second weight layer via the ReLU activation function, the model incorporates the identity mapping of the input x, culminating in the ideal mapping F(x) + x. The superiority of this residual structure lies in its ability to enhance the sensitivity of the transmission between the initial input x and the combined output F(x) + x [13].
Within the ResNet series, models are classified by their layer depth, including ResNet18, ResNet34, ResNet50, ResNet101, and ResNet152, with the first two being shallow networks and the latter three deeper. ResNet50, in comparison to ResNet18 and ResNet34, boasts a deeper network structure, offering superior advantages in the realm of feature extraction for image classification [14,15]. While ResNet101 and ResNet152 offer even greater depth, their operational efficiency does not match that of ResNet50, and their effectiveness in image classification shows negligible differences. In view of the performance specifications of the experimental platform used in this study and the complexity of identifying missing sowing areas in rice seedling trays, the ResNet50 model has been selected as the foundation for further enhancements in this research.

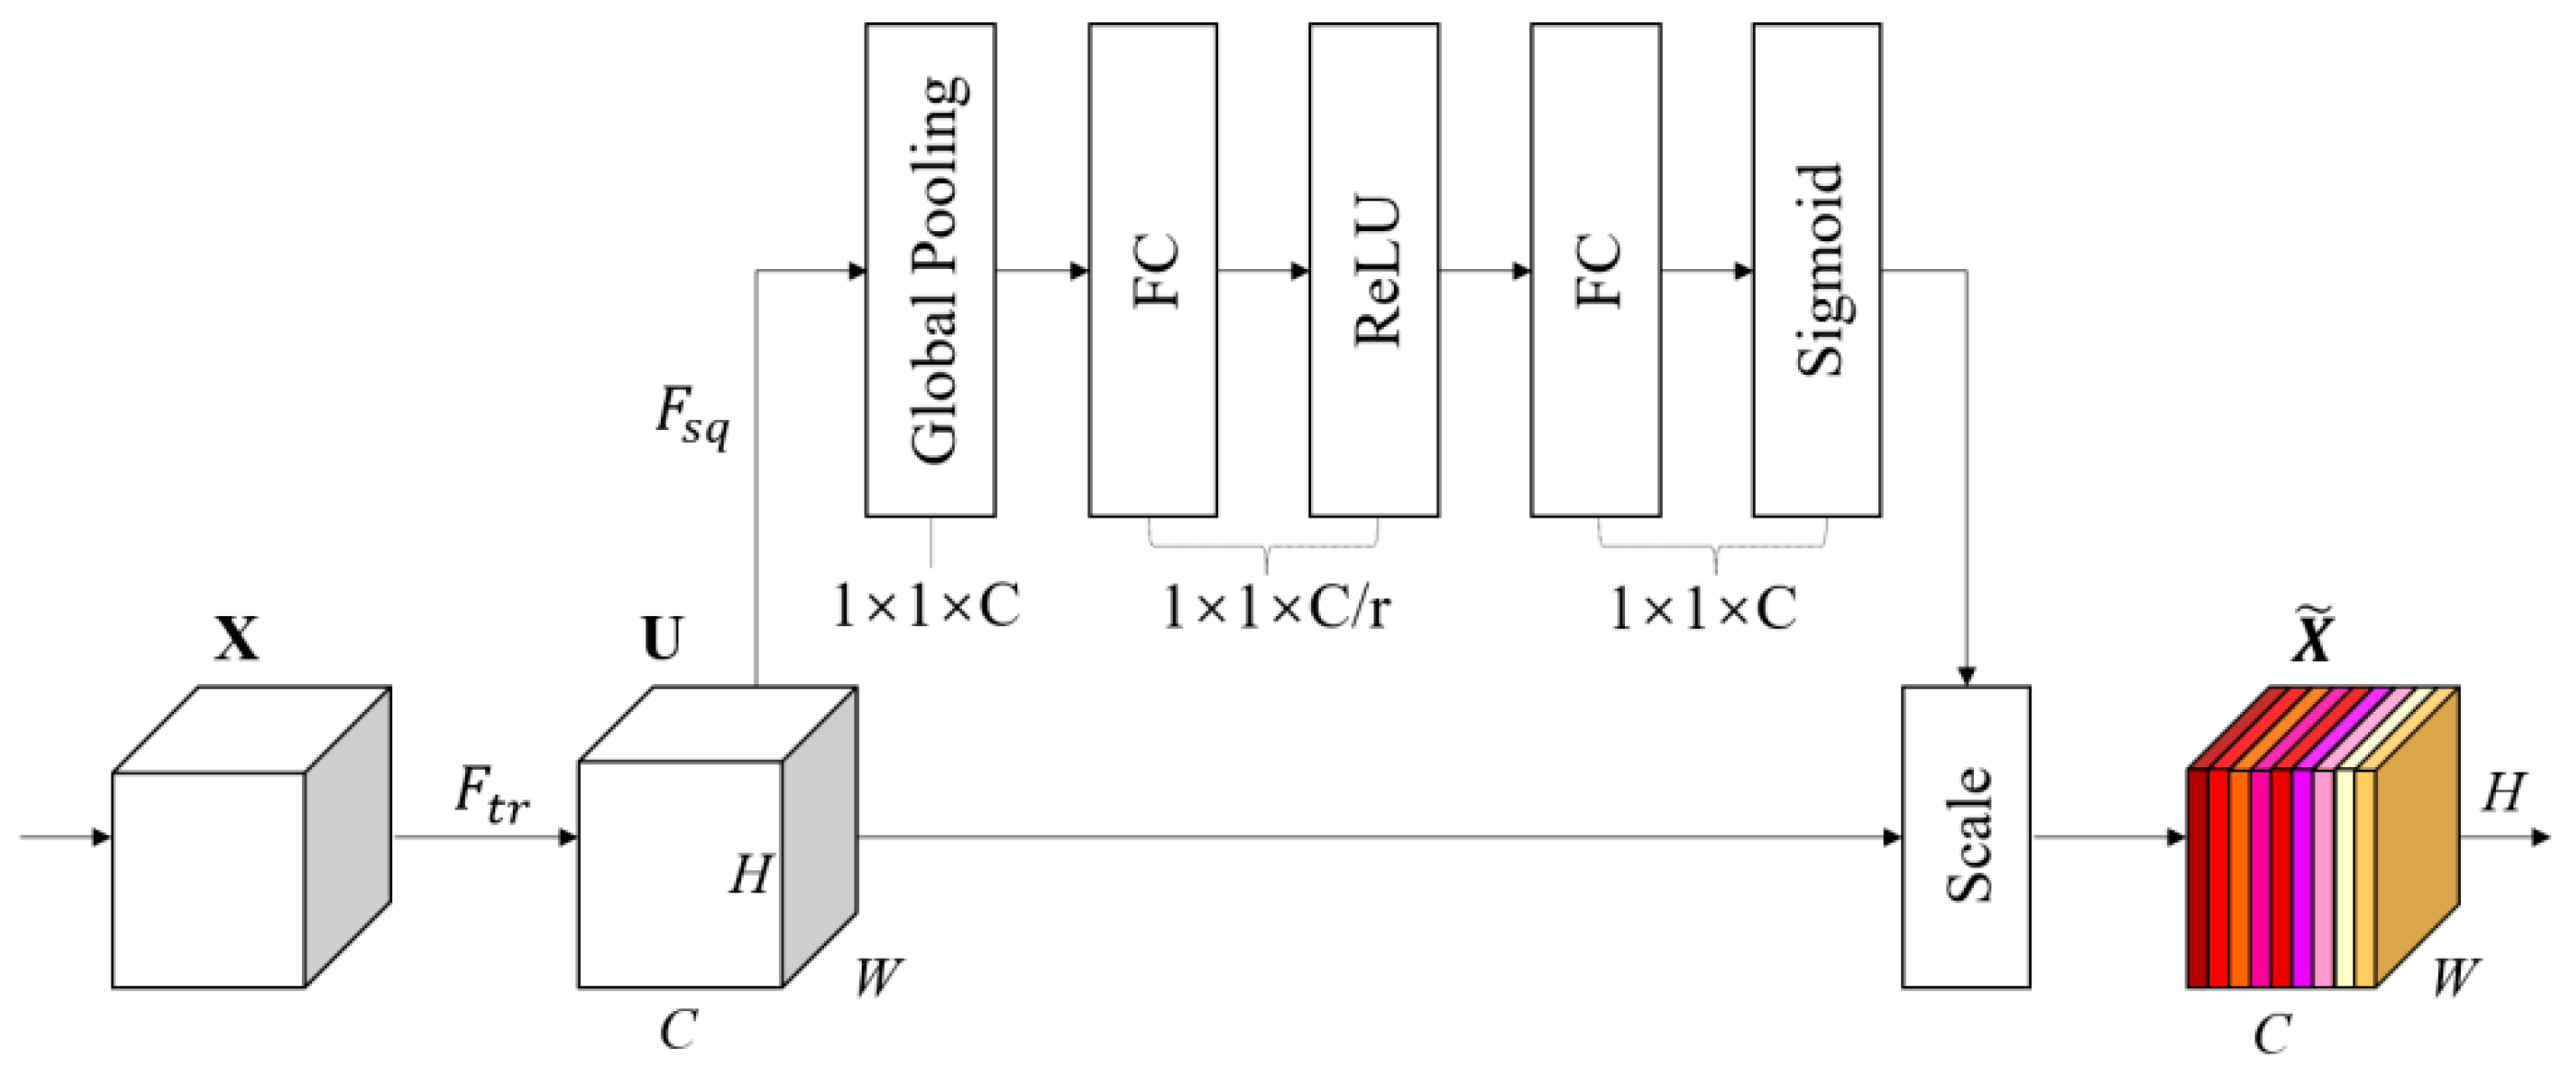
2.2.2. SE Attention Mechanism

In this experiment, the uniformity of the original image capture environment within the rice seedling production workshop presents a significant challenge in image data feature extraction. The attention mechanism, mirroring the selective focus of human vision, concentrates on salient features while disregarding less critical information, thereby optimizing recognition performance [16]. This mechanism encompasses both channel and spatial attention, the former being crucial in directing the model’s focus towards channels most beneficial for classification. Pertinent to this study’s focus on classifying missed sowing areas in rice seedling trays, the ResNet50 model was improved with a squeeze-and-excitation network (SE). This enhancement aims to improve the model’s proficiency in extracting features from tray images [17], with the network architecture of the channel attention mechanism depicted in Figure 9.
The SE module primarily consists of three steps. In the first step, a feature map X is processed through the Ftr convolution to obtain a feature map U of size H × W × C. Feature map U is then compressed through Fsq to yield a 1 × 1 × C output, which is achieved by global average pooling, compressing the two-dimensional features of each channel into a single real number [18]. Its expression is given in Equation (1):
z c = F s q ( u c ) = 1 W × H i = 1 W j = 1 H u c ( i , j )
W and H represent the width and height of the feature map, respectively; uc represents the input feature map; c represents the number of feature channels; i and j represent the row and column values of the feature data, respectively; and zc is the output data feature value.
In the second step, the 1 × 1 × C matrix activated by Fex is regarded as z, giving each channel different weights. The z matrix passes through a fully connected layer, reducing its dimensions to C/r, where r is the scaling size parameter. After activation by the ReLU function, it passes through another fully connected layer to restore its dimensions to C, maintaining consistency between input and output channels. Finally, the sigmoid function is used to calculate the feature weights s, as expressed in Equation (2):
s = F e x ( z , W ) = σ ( g ( z , W ) ) = σ ( W 2 δ ( W 1 z c ) )
Wherein δ represents the ReLU activation function, σ denotes the sigmoid function, and s is the feature weight.
The third step involves multiplying the output s from the previous step with the original feature data, thereby implementing a weighted calibration of the channel’s original data features, as expressed in Equation (3):
x ~ c = F s c a l e ( u c , s c ) = s c u c
In the equation presented, uc denotes the c-th channel of the feature map U, while sc signifies the c-th channel of the 1 × 1 × C weight matrix. The term Fscale refers to the calibration operation applied within this context.

2.2.3. Optimizer

Throughout the model’s training, loss values are initially calculated via forward propagation and subsequently through backpropagation for a gradient determination of the parameters. The function of the optimizer is pivotal in this context as it employs the gradients to refine the parameters, consistently reducing the loss. The Adam (adaptive moment estimation) optimizer represents an integration of the strengths found in adaptive learning rate gradient descent and momentum-based gradient descent algorithms. It is designed to effectively handle sparse gradients while simultaneously addressing the challenges of gradient fluctuation [19].
In the process of updating loss gradients, the Adam optimizer is designed to adaptively modify learning rates based on individual parameters [20]. To augment the convergence efficiency of the model, this study has refined the ResNet50 model by incorporating cosine annealing into the Adam optimizer. This addition serves to decay the learning rate, thereby optimizing the performance of the Adam optimizer.

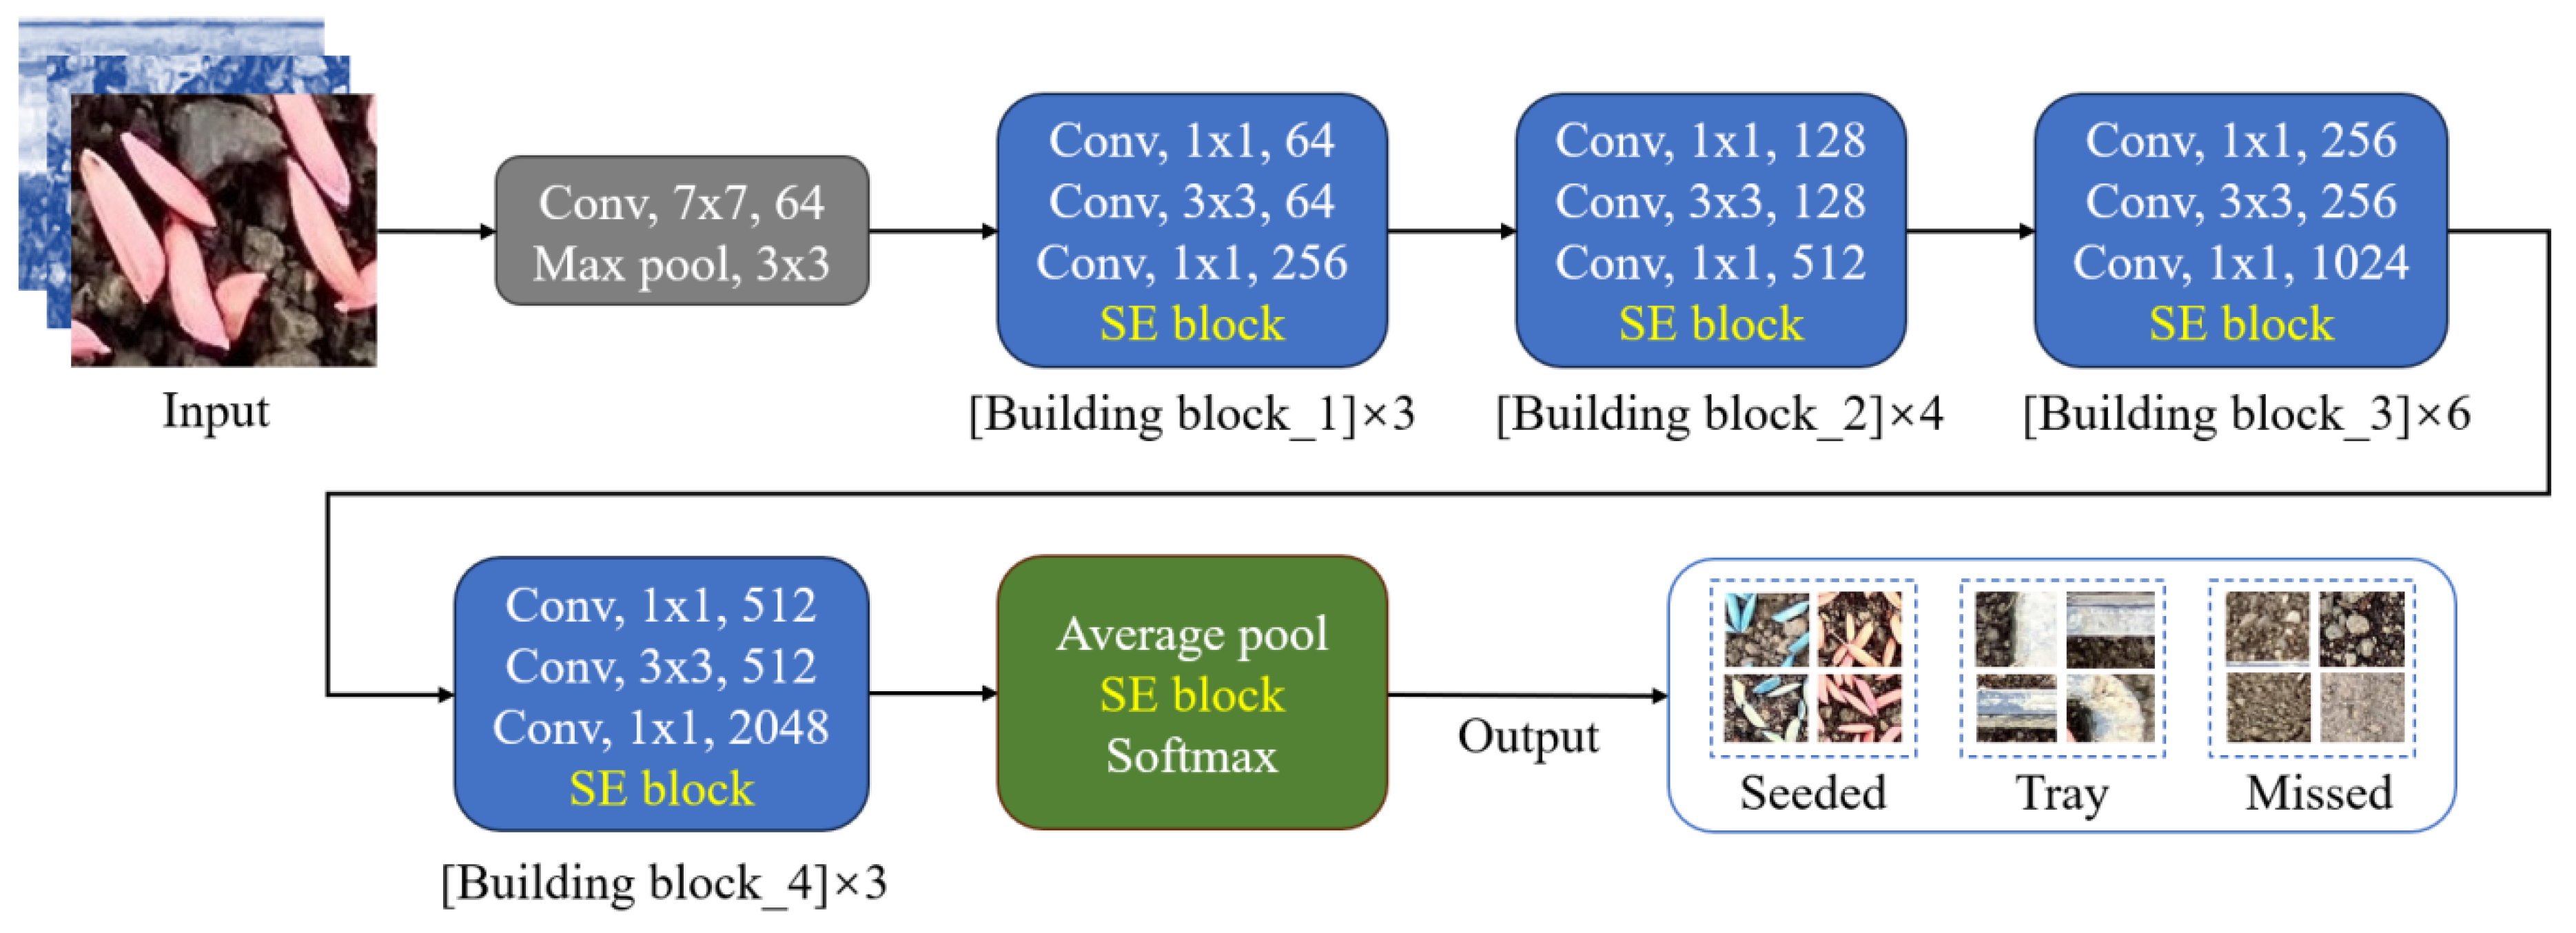
2.2.4. Improved ResNet50

In the enhanced version of the ResNet50 model, a fusion of the channel attention mechanism with the Adam optimizer is realized. SE channel attention is integrated at the termination point of each residual block to improve the model’s feature extraction capabilities for rice sowing imagery. The architecture of this improved ResNet50 model is presented in Figure 10.
‘Conv’ in this model refers to the convolutional layer of the neural network, and ‘Conv, 7 × 7, 64’ designates a convolutional layer with a kernel size of 7 × 7 and a channel count of 64. Additionally, the model incorporates ‘Max pool’ for the max pooling layer, ‘SE block’ as the attention mechanism layer, ‘Average pool’ for average pooling, and ‘Softmax’ as the fully connected layer. The complete model is composed of four groups of building blocks, with the specific count of building blocks in each group being 3, 4, 6, and 3.

3. Results

This chapter is dedicated to validating the improved ResNet50 model’s capability in accurately recognizing the self-developed dataset pertaining to rice seedling sowing quality. To this end, a series of experimental methods will be employed, such as the optimization of model parameters, a comparative analysis of model performance, and the use of confusion matrices. Additionally, the chapter aims to showcase the relative performance advantages of the improved ResNet50 model over other standard models commonly used in this domain.

3.1. Experimental Platform and Parameter Settings

The experimental platform utilized in this study is the Python-based Pytorch deep learning framework, operated on the Ubuntu 20.04 system. The training and testing of all models were conducted using an NVIDIA Quadro RTX 4000 (NVIDIA, Santa Clara, CA, USA). To preserve the independence of the experimental conditions, model training was executed in a virtual environment set up through Anaconda. The comprehensive configuration of this experimental environment is outlined in Table 1.

3.2. Experimental Evaluation Indices

The rice seedling tray sowing quality estimation model constructed in this study employs commonly used metrics in classification tasks such as validation set accuracy, test set accuracy, average precision, average recall, F1 score, average detection time, and confusion matrix as evaluation criteria for this experiment.

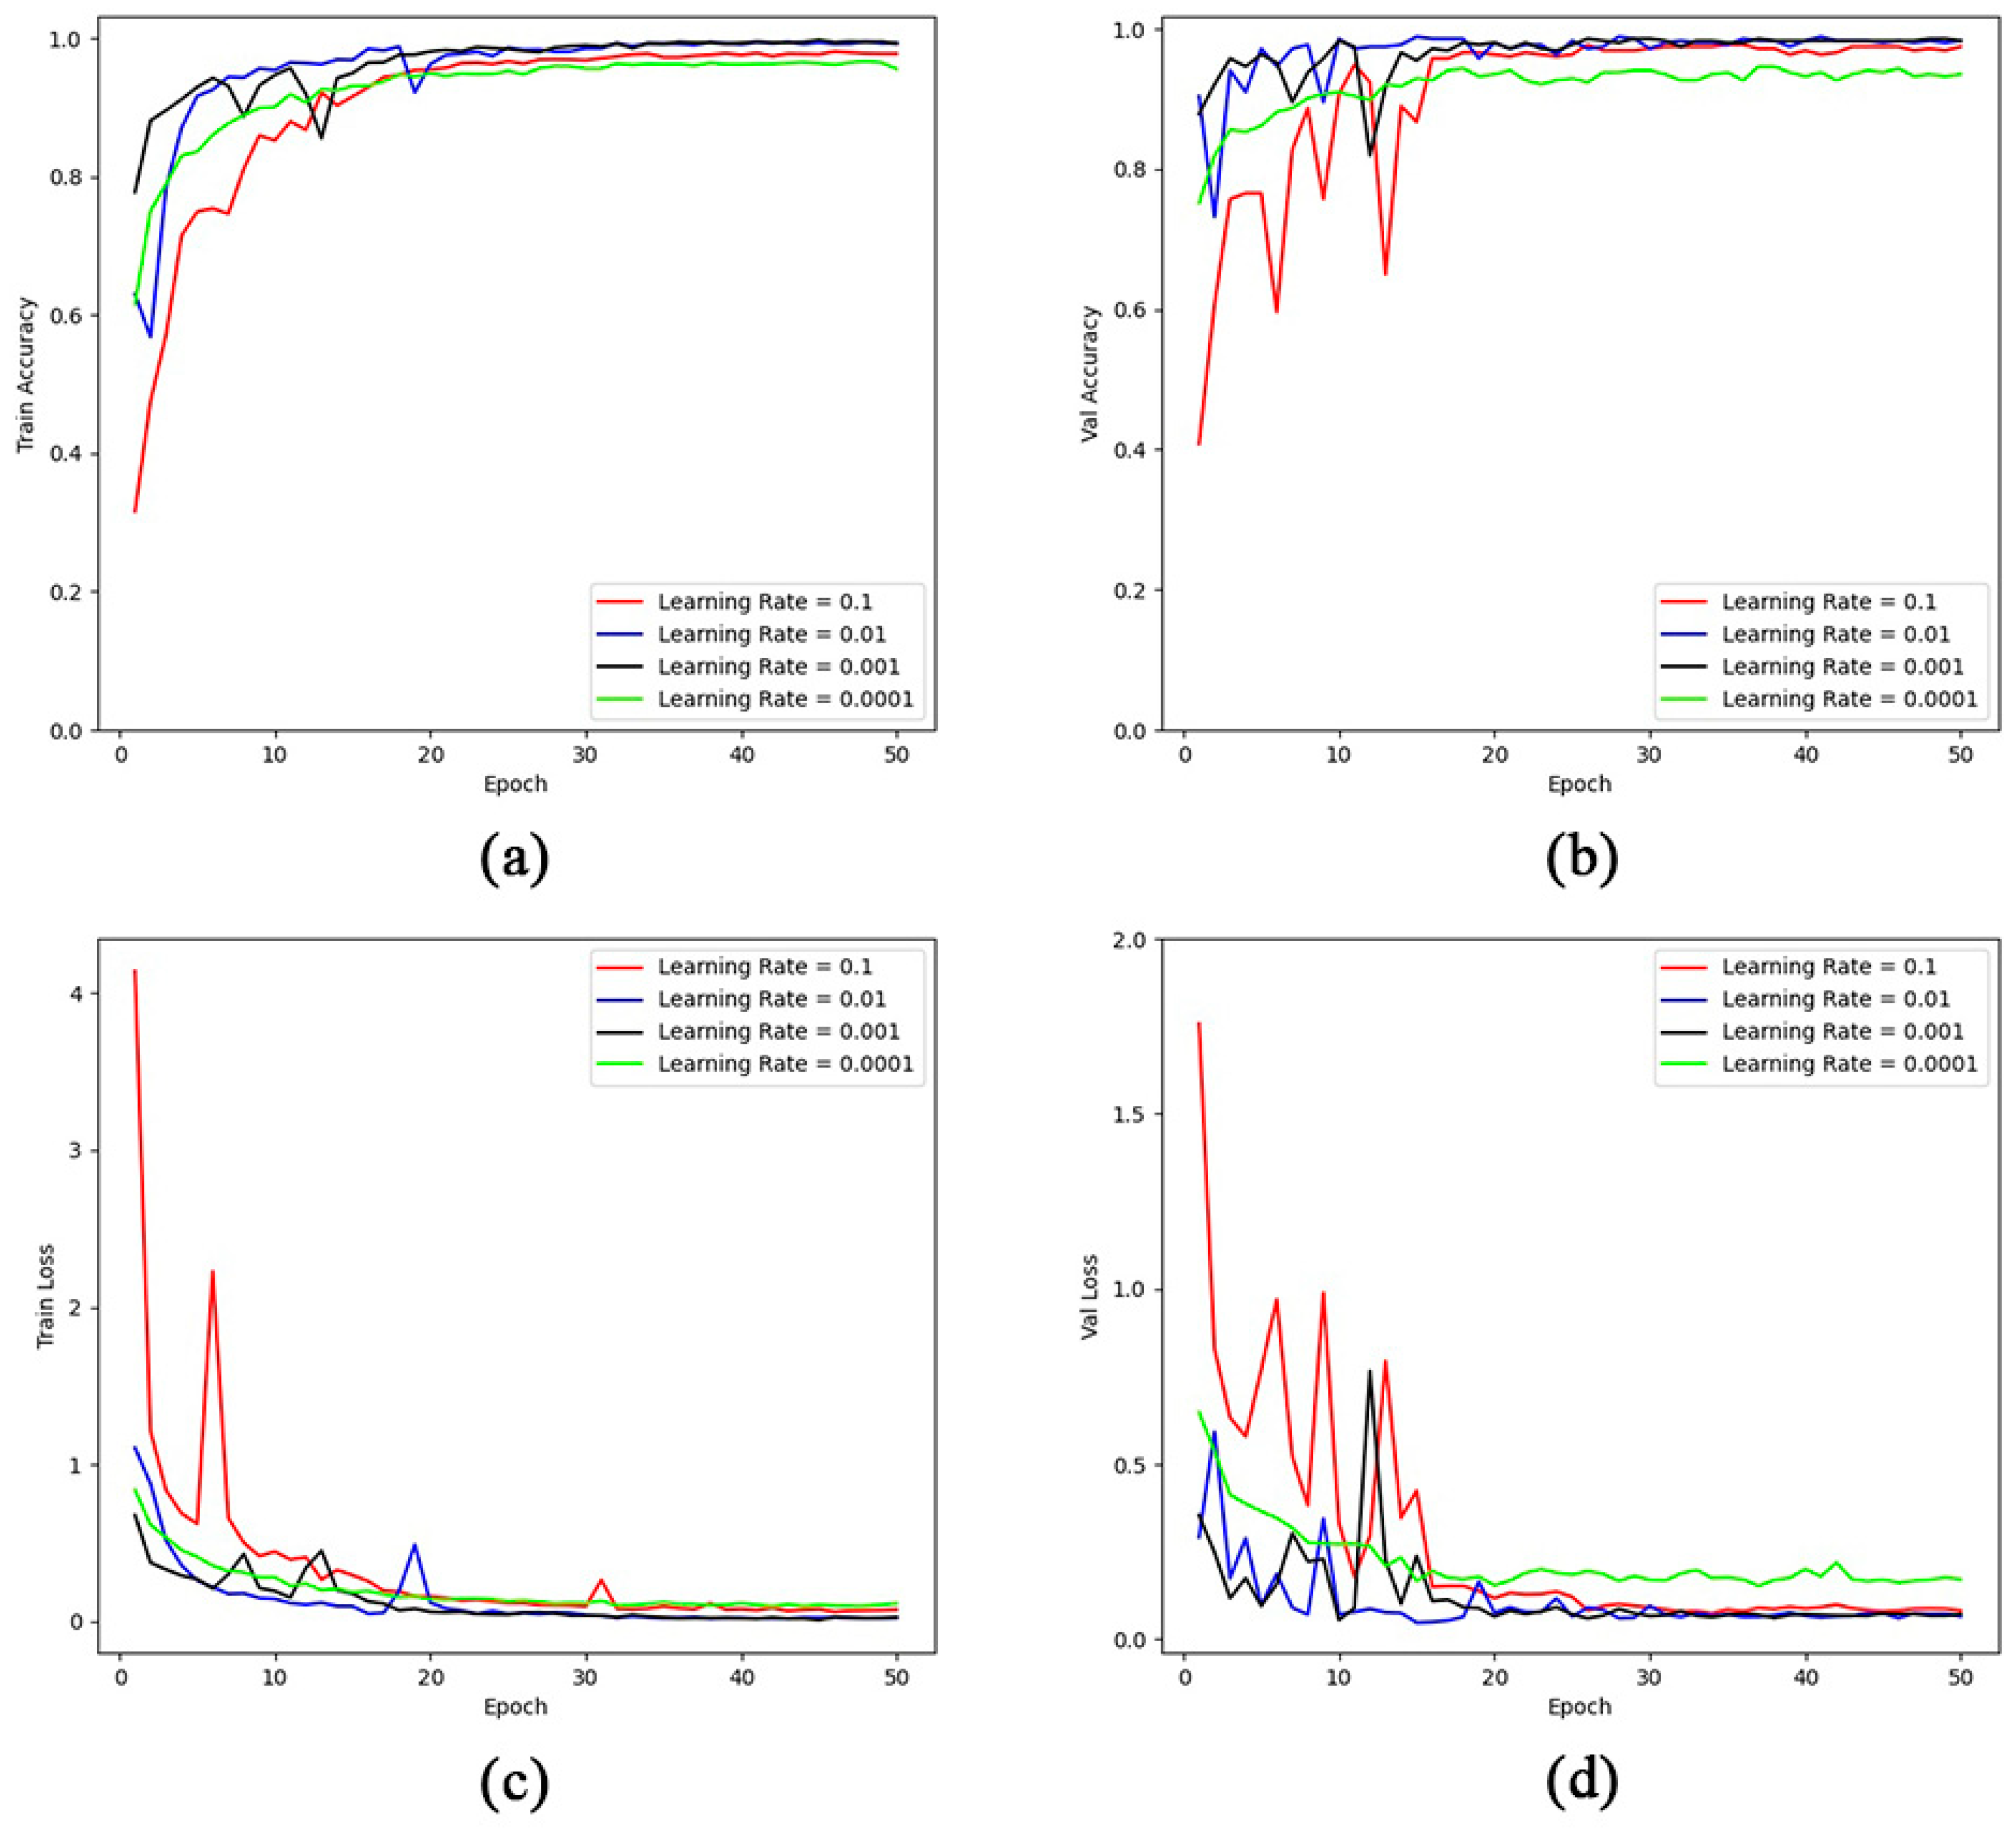
3.3. Comparison of the Results of Different Parameters

The learning rate, a pivotal parameter in model training, reflects the speed of updates made to the model weights. This study involved an experimental comparison of different learning rates to determine the most efficient one. Learning rates of 0.1, 0.01, 0.001, and 0.0001 were experimented with, and the accuracy of the training process, along with the loss function curves, is illustrated in Figure 11.
Figure 11 demonstrates that the model exhibits its best performance with a learning rate of 0.01, marked by the quickest convergence in the loss function and achieving a validation set accuracy of 98.87%. In terms of iteration counts, the model steadily converges upon reaching 50 iterations with an initial learning rate of 0.01. Therefore, these conditions—a 0.01 learning rate and 50 iterations—are selected as the training parameters for the Adam optimizer in the improved ResNet50 model, with the specific parameters detailed in Table 2.

3.4. Comparison of the Results of Different Optimizers

To assess the influence of different optimizers on the enhanced model, ResNet50 was subjected to a series of comparative experiments using various optimizers, all within identical dataset and parameter configurations. The models include Adagrad-ResNet50, utilizing the Adagrad optimizer; RMSprop-ResNet50, employing the RMSprop optimizer; SGD-ResNet50, using the SGD optimizer; and Adam-ResNet50, which operates with the Adam optimizer. The outcomes of these four comparative experimental groups are presented in Table 3.
An analysis of the results in Table 3 reveals that the model utilizing Adam as the optimizer notably outperformed the counterparts using Adagrad, RMSprop, and SGD optimizers. Specifically, the Adam-optimized model achieved a 5.95%, 1.21%, and 2.08% higher accuracy on the training set and 6.86%, 1.45%, and 2.15% higher on the validation set compared to Adagrad, RMSprop, and SGD, respectively. This clearly demonstrates the efficacy of Adam in enhancing the performance of the improved model.

3.5. Comparison of the Results of Different Models

In a bid to further validate the improved ResNet50 model’s capabilities, it was contrasted with leading models in image classification, specifically AlexNet, DenseNet, and VGG16, through comparative experiments. These assessments, carried out under identical dataset and operational conditions, focused on evaluating training accuracy, validation accuracy, test accuracy, and average detection time. The experimental comparison results for these various classification models are presented in Table 4.
From the data presented in Table 4, it is clear that the improved ResNet50 model exhibits an increased accuracy in the training set by 2.29%, 2.14%, 3.88%, and 0.06% compared to ResNet50, AlexNet, DenseNet, and VGG16, respectively. It also shows a notable improvement in validation set accuracy, with a 3.46%, 1.73%, and 2.85% increase over ResNet50, AlexNet, and DenseNet, respectively, and maintaining parity with VGG16. For test set accuracy, it records gains of 3.38%, 4.55%, 2.07%, and 2.62%, respectively. Improvements in average precision were noted at 5.65%, 5.91%, 3.56%, and 4.16%, respectively. Similarly, there were enhancements in the average recall by 5.43%, 4.55%, 2.06%, and 2.63%, respectively. Additionally, the F1 score displayed increases of 5.54%, 5.23%, 2.81%, and 3.39%, respectively. Despite the close training and validation set accuracies of the VGG16 model to the improved model, its lower test set accuracy indicates the likelihood of overfitting during training. In terms of computational efficiency, the improved ResNet50 model has a shorter detection time compared to AlexNet and DenseNet but is slightly slower than VGG16. Nevertheless, with all models performing under the RTX 4000 chip, the maximum disparity in average detection times is less than 20 ms, ensuring compliance with the speed requirements of production environments. These results affirm that the performance of the improved ResNet50 model is more advanced compared to other conventional classification models in the domain of the rice sowing dataset.

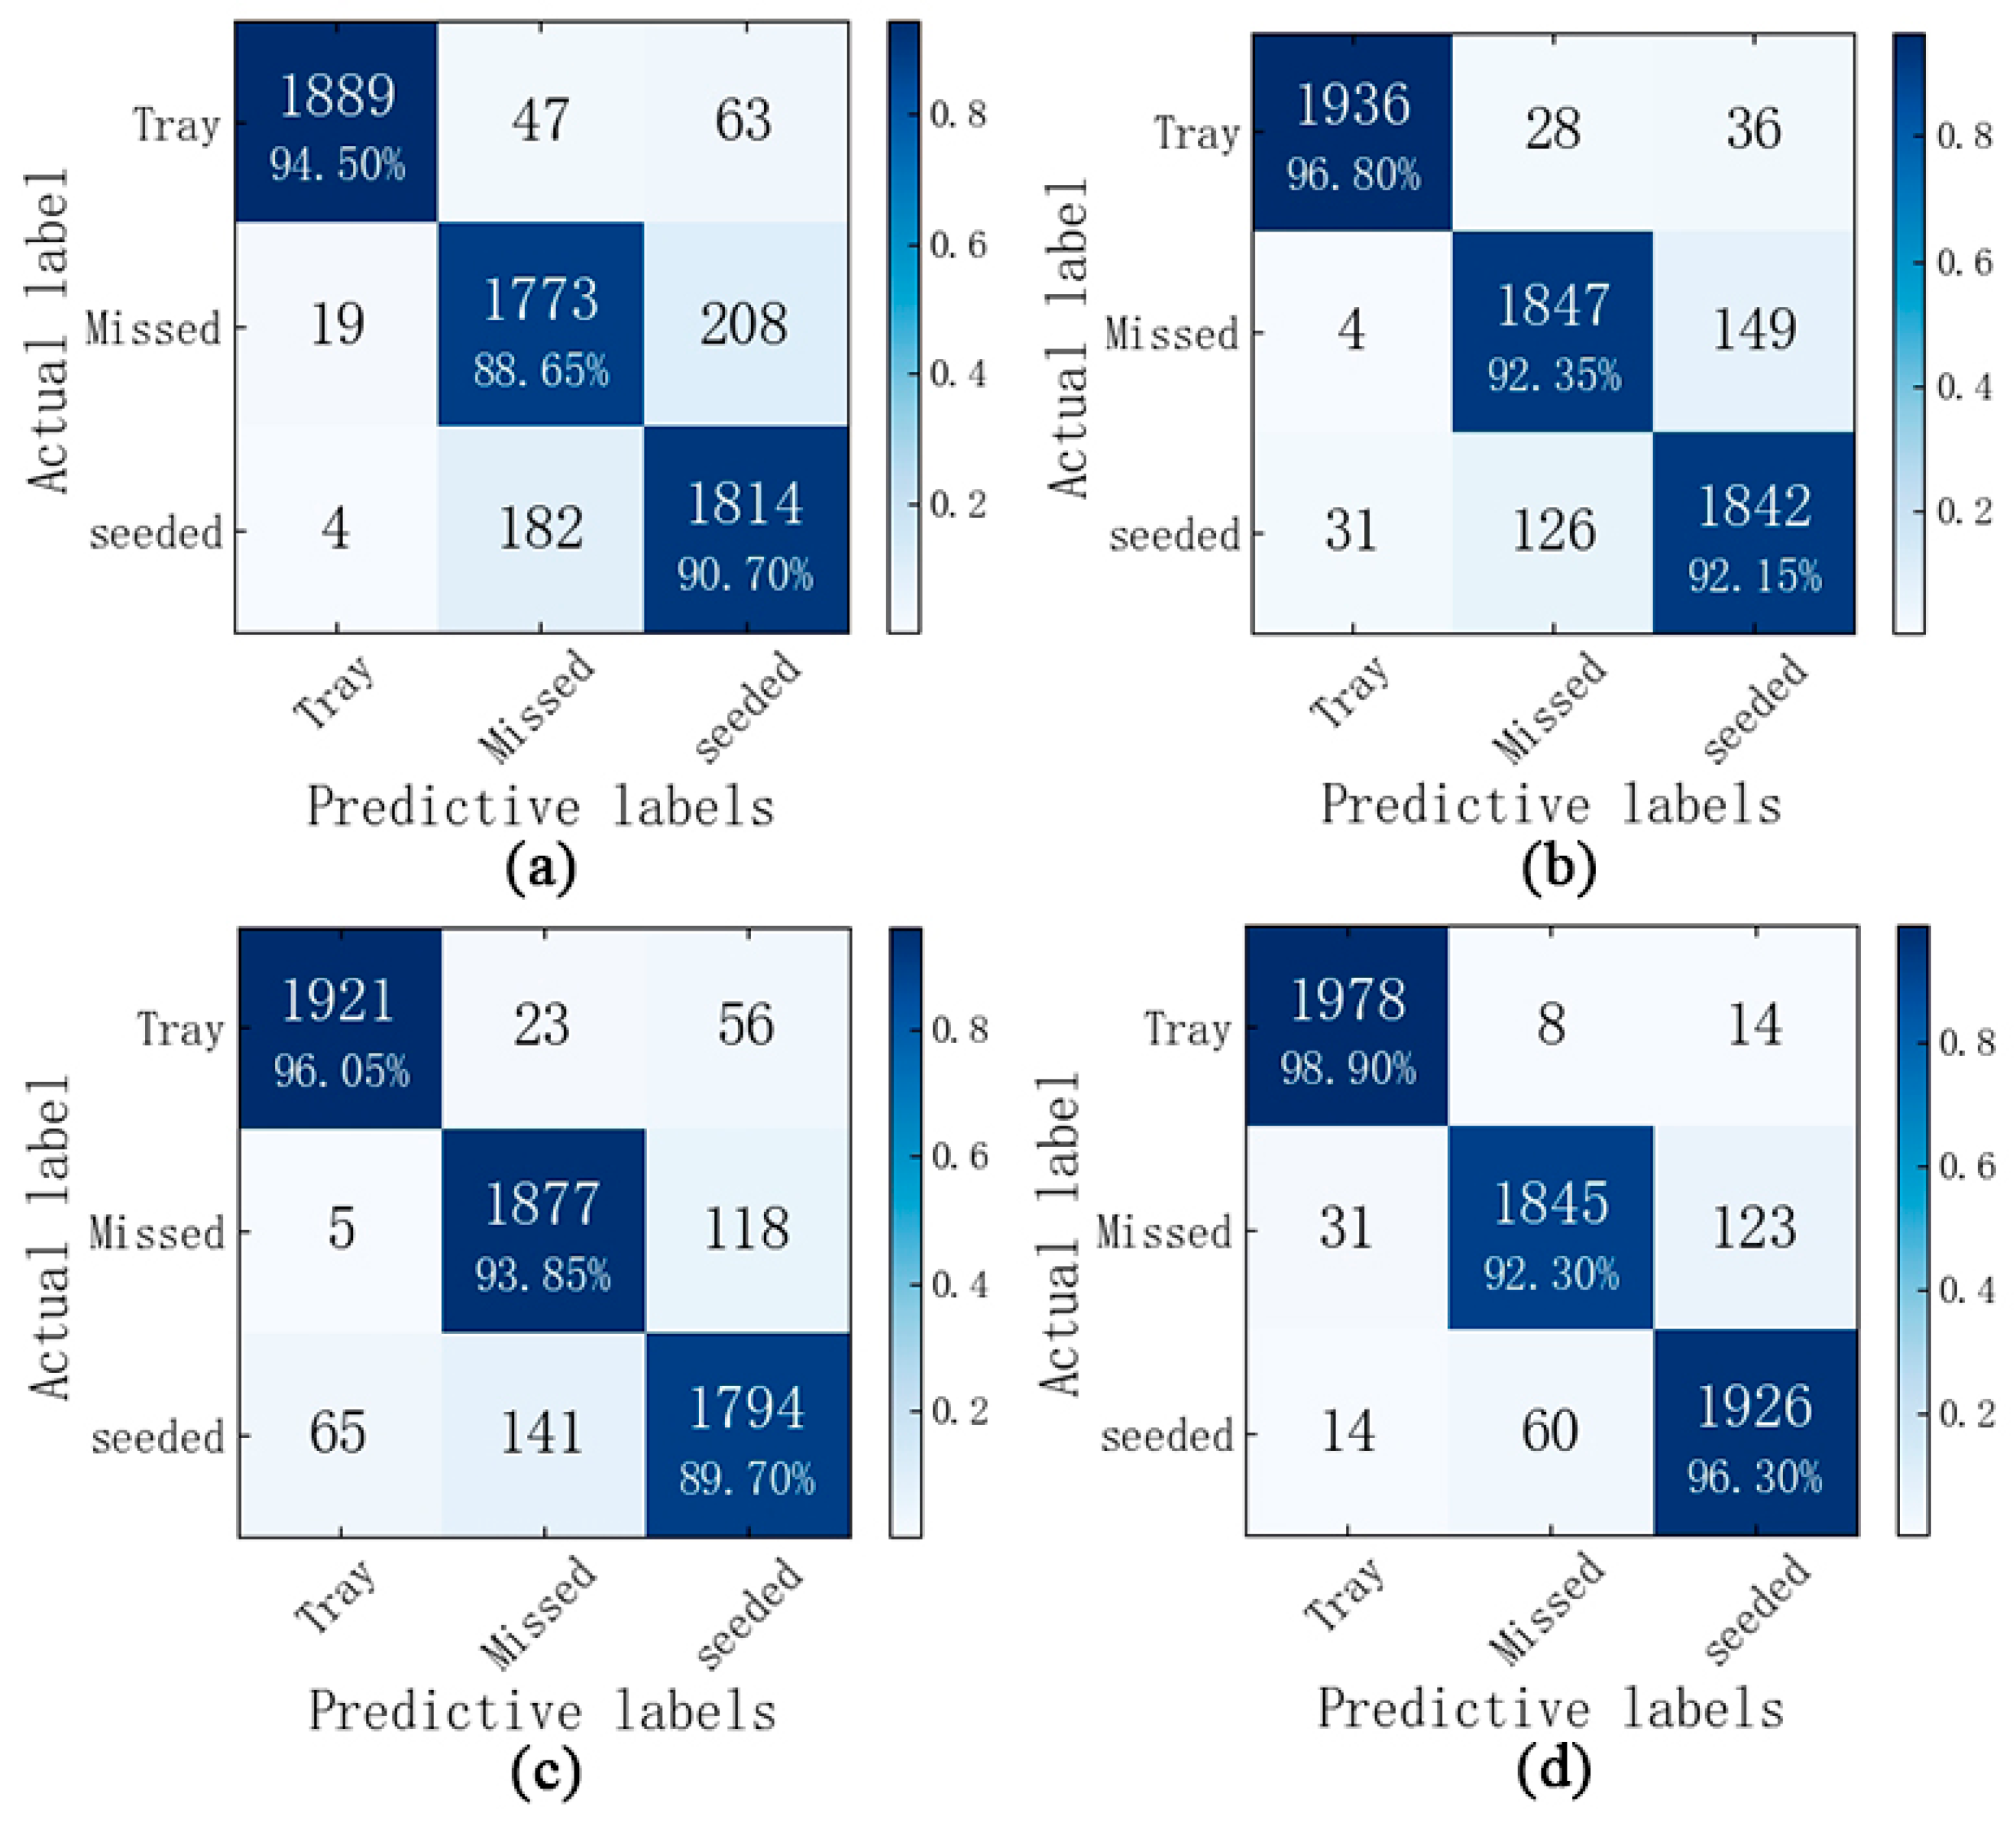
3.6. Confusion Matrix

In assessing image classification models, the confusion matrix is an essential indicator. This study undertook confusion matrix comparative experiments to further evaluate the accuracy of different models in classifying three types of grid images. The models compared included the widely used AlexNet, DenseNet, and VGG16, alongside the improved ResNet50 model. The testing involved 2000 images from each of the three categories: images with trays, without seeds, and with seeds. The confusion matrices generated from these tests are displayed in Figure 12.
The confusion matrix experiments for each model, as shown in Figure 12, reveal a notable probability of models erroneously identifying images with trays as those with seeds. This misjudgment is primarily because, during seeding, some seeds end up on the edges of the seedling trays, and when these edges with abundant seeds are sliced, models are more likely to classify them as images with seeds. As evident in Figure 11d, the recognition rates for this study’s model are 98.90% for images with trays and 92.30% and 96.30% for images without seeds and with seeds, respectively. This is mainly due to the fine seed edges in some images without seeds, leading to misclassifications, a challenge also identified in other models. In summary, the enhanced ResNet50 model equipped with the SE attention mechanism shows superior recognition performance compared to its counterparts.

3.7. Analysis of Results

To further assess the improved ResNet50 model’s capability in accurately detecting eight categories of images, distinguished by various rice varieties, seed coating colors, and soil combinations, this research involved inputting entire seedling tray images into the model. These images were then reconstructed from the categorized grid images to form complete seedling tray visuals. As noted in Section 2.1.2, the typical grid sizes for mechanical rice seedling transplantation are 16 × 28 and 24 × 42. Accordingly, the study employed two sets of parameters to evaluate the eight image categories. The results for the tests conducted with the 16 × 28 parameter configuration are illustrated in Figure 13.
As demonstrated in Figure 13, the model developed in this study shows commendable performance in detecting areas of missed sowing in seedling trays. It accurately identifies regions where missed sowing exceeds the dimensions of the detection grid. Figure 13e,f reveal a couple of instances where the model misidentified seeded areas as missed sowing zones. This infrequent misjudgment, particularly in the case of Variety 2 with red coating, is likely due to the seed coating’s color blending with the soil. Moreover, in the central area of Figure 13f, a large missed sowing region was overlooked by the model, possibly because the image segmentation divided this area into two grids, each having seed edges, thereby creating an undetected unsown section at their intersection. The testing outcomes using the 24 × 42 parameter configuration are depicted in Figure 14.
As indicated in Figure 14, segmenting the eight types of images into 24 × 42 grids has improved the model’s ability to detect missed sowing areas in seedling trays compared to the 16 × 28 grid parameter. The model successfully identified areas that were previously undetected under the 16 × 28 setting. However, this increased detection precision also led to some challenges. For instance, in Figure 14e, certain sections of the seedling tray’s upper edge were erroneously marked as missed sowing areas, likely due to their excessively dark color.

4. Discussion

4.1. Comparison with Related Studies

The rice seedling tray seeding quality detection method proposed by Wang An et al. [4] is influenced by the number of seeds in each planting hole. The detection accuracy of the number of seeds, ranging from zero to three particles in each single connected region, reached 95%, while the detection accuracy of the number of seeds exceeding four particles in each single connected region was up to 90%. Dong Wenhao et al. [5] introduced a fixed threshold segmentation algorithm, which examines whether there are seeds in each planting hole by scanning the contour of each small block in the image. This algorithm is then utilized to calculate the mis-seeding rate of hybrid rice seeding, achieving an average accuracy of 94.67% in mis-seeding rate detection. Despite being unaffected by seed quantity, the method requires stable lighting during image acquisition, and experiments were conducted under ideal conditions. This comparison with related studies highlights the strength of our research model: it does not rely on extracting contours of seedling tray planting holes and is impervious to the influence of seed quantity. Furthermore, the ResNet50 model enhanced with the SE attention mechanism exhibits robust generalization, enabling the consistent detection of mis-seeding rates across diverse soil types, crop varieties, and seed coatings.

4.2. Advantages of Our Model

This study introduces a method for assessing rice sowing quality based on a refined version of the ResNet50 model. The experimental outcomes detailed in Section 3.7 clearly indicate that the improved ResNet50 model excels in the task of rice sowing quality detection. In comparison trials, this improved ResNet50 model outshines classic models such as AlexNet, DenseNet, and VGG16, particularly in detecting missed sowing areas within seedling trays. The standout performance of the improved ResNet50 model in this specific task can be ascribed to three key factors:
(1)
This study leverages the superior ResNet50 model as the base for feature extraction in rice seedling tray images. The use of a residual neural network design is pivotal in enabling smoother information flow and preventing the vanishing gradient issue, which enhances the network’s stability during training. This method also contributes to a reduction in the number of parameters, significantly increasing the efficiency of the model’s operation [21,22].
(2)
For the detection of missed sowing areas in rice seedling tray images, characterized by the random distribution of seeds, this study introduces the SE (squeeze-and-excitation) channel attention mechanism. This mechanism aims to heighten the model’s focus on areas with distinct features. Furthermore, the model employs the Adam optimizer, distinguished for its ability to adjust learning rates adaptively based on different parameters during the process of updating loss gradients. This feature of the Adam optimizer significantly increases the model’s concentration on pivotal regions [23].
(3)
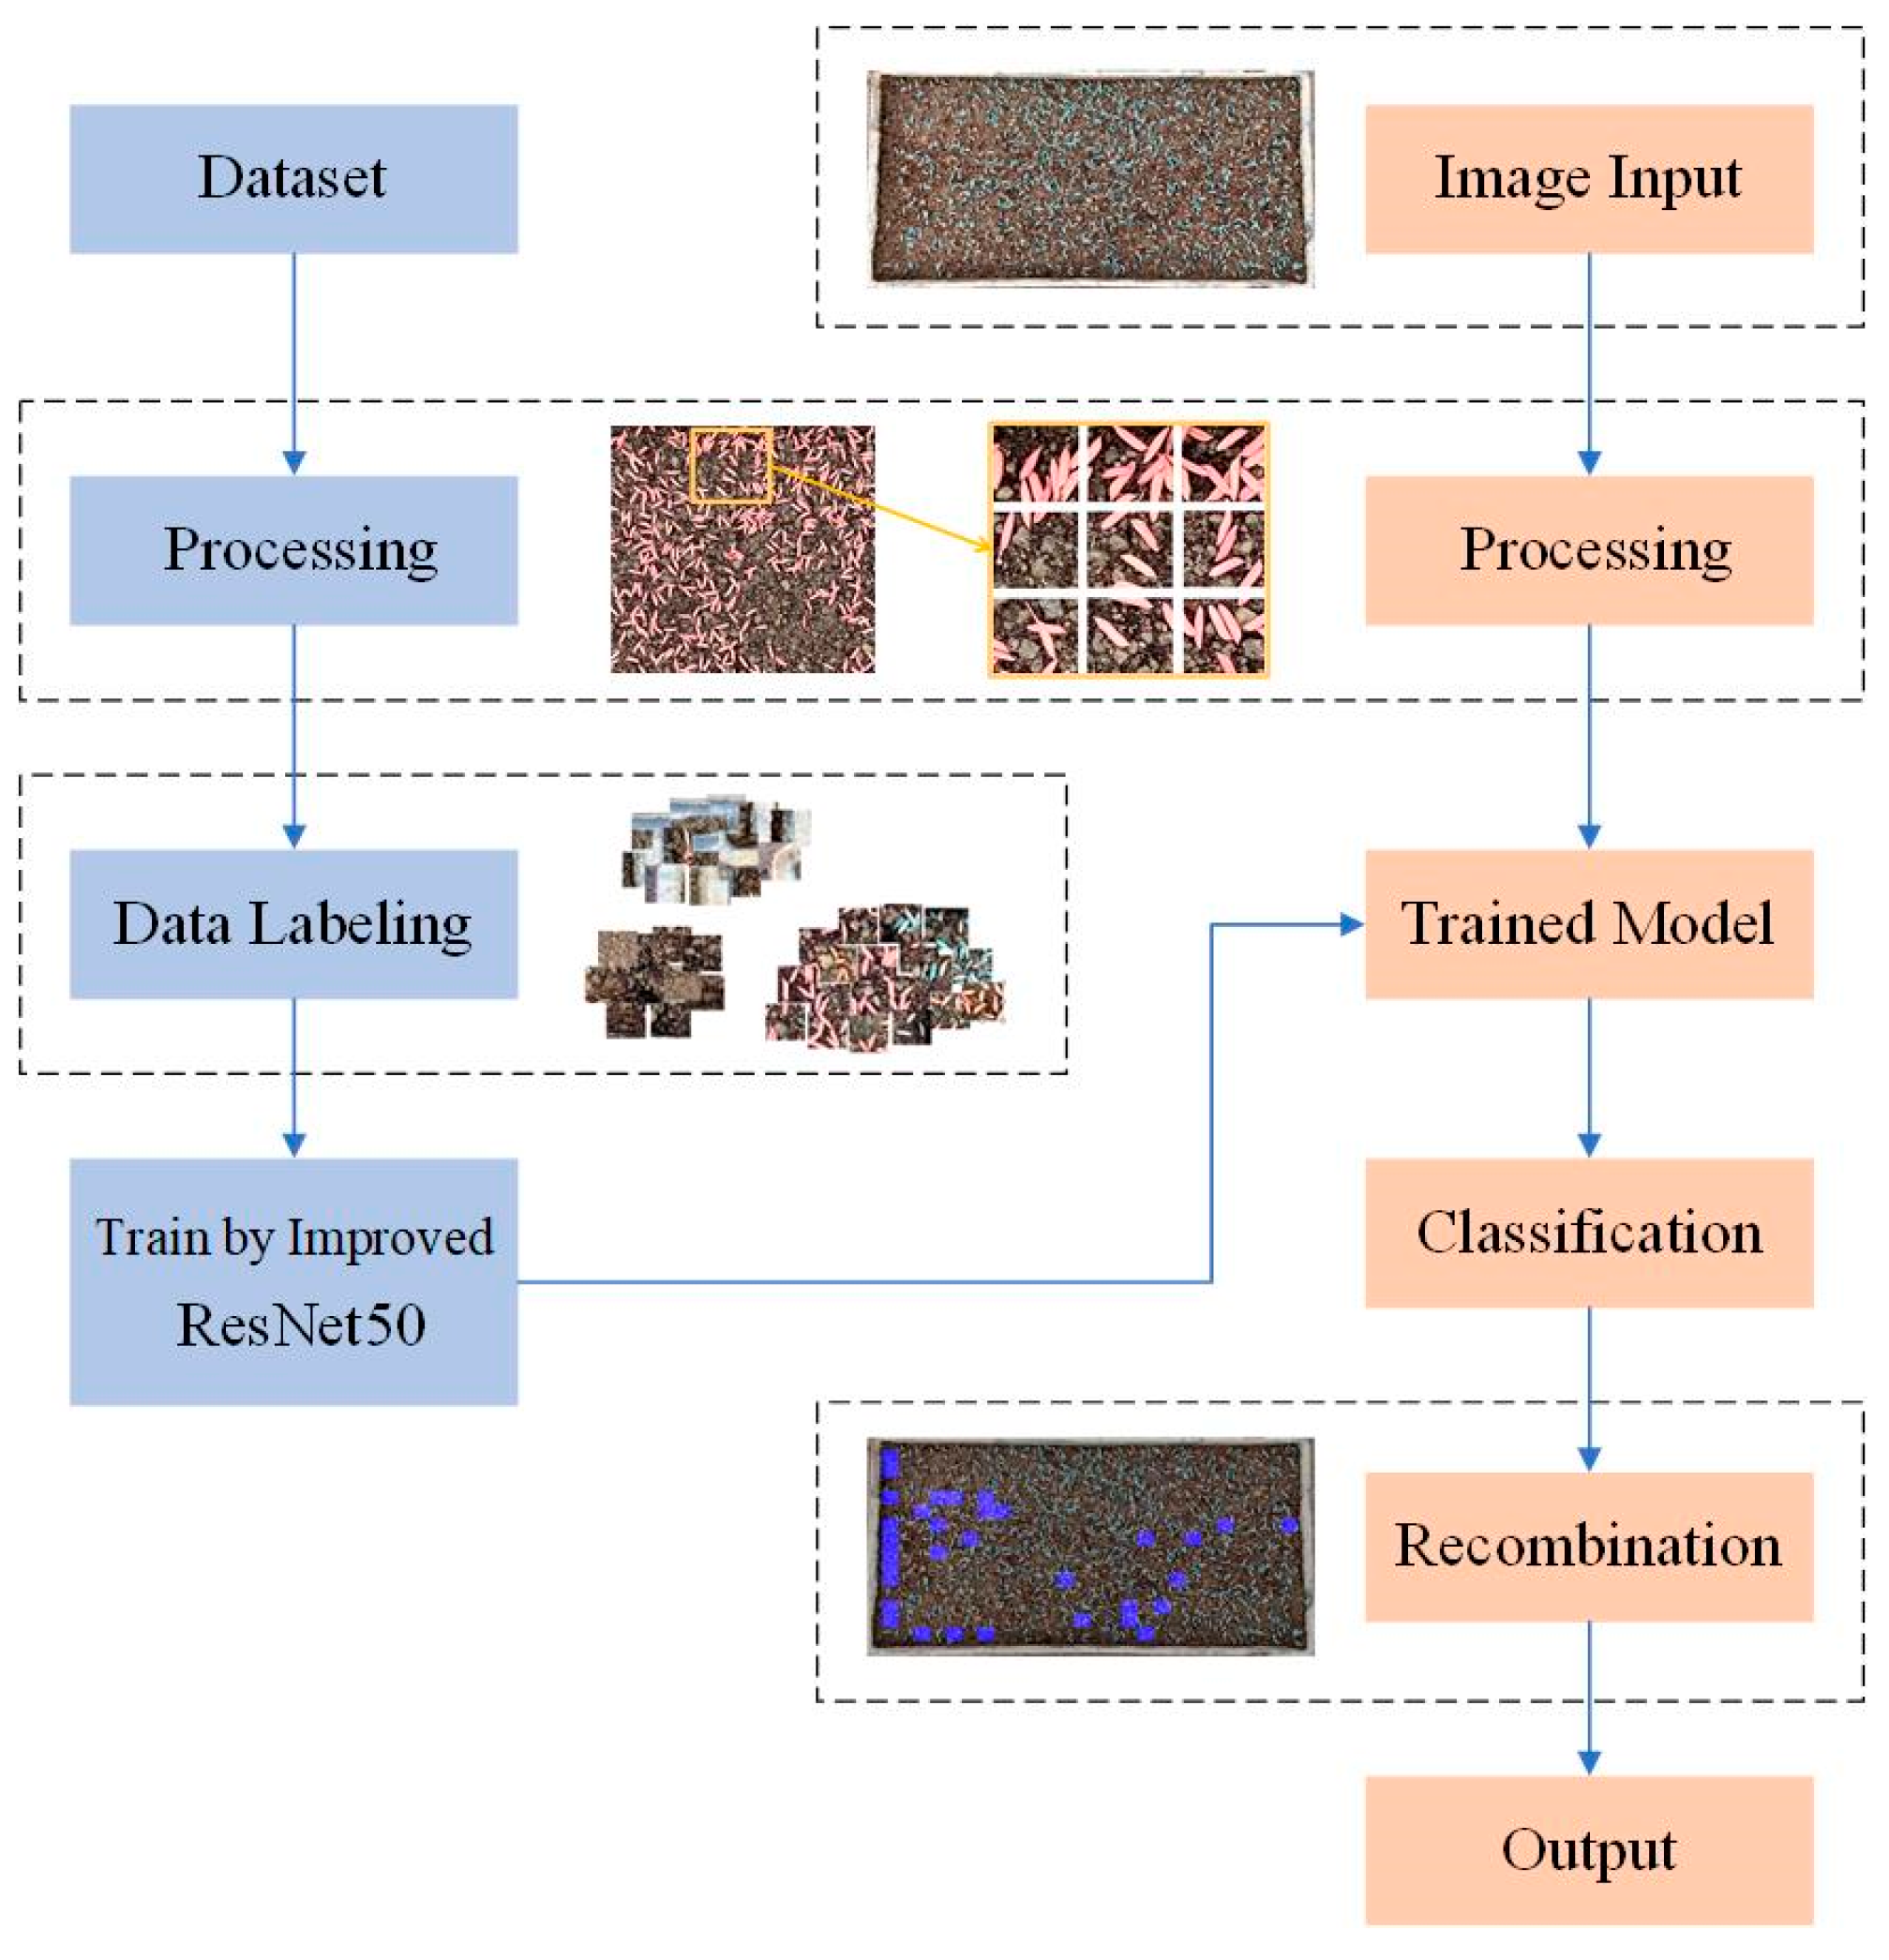
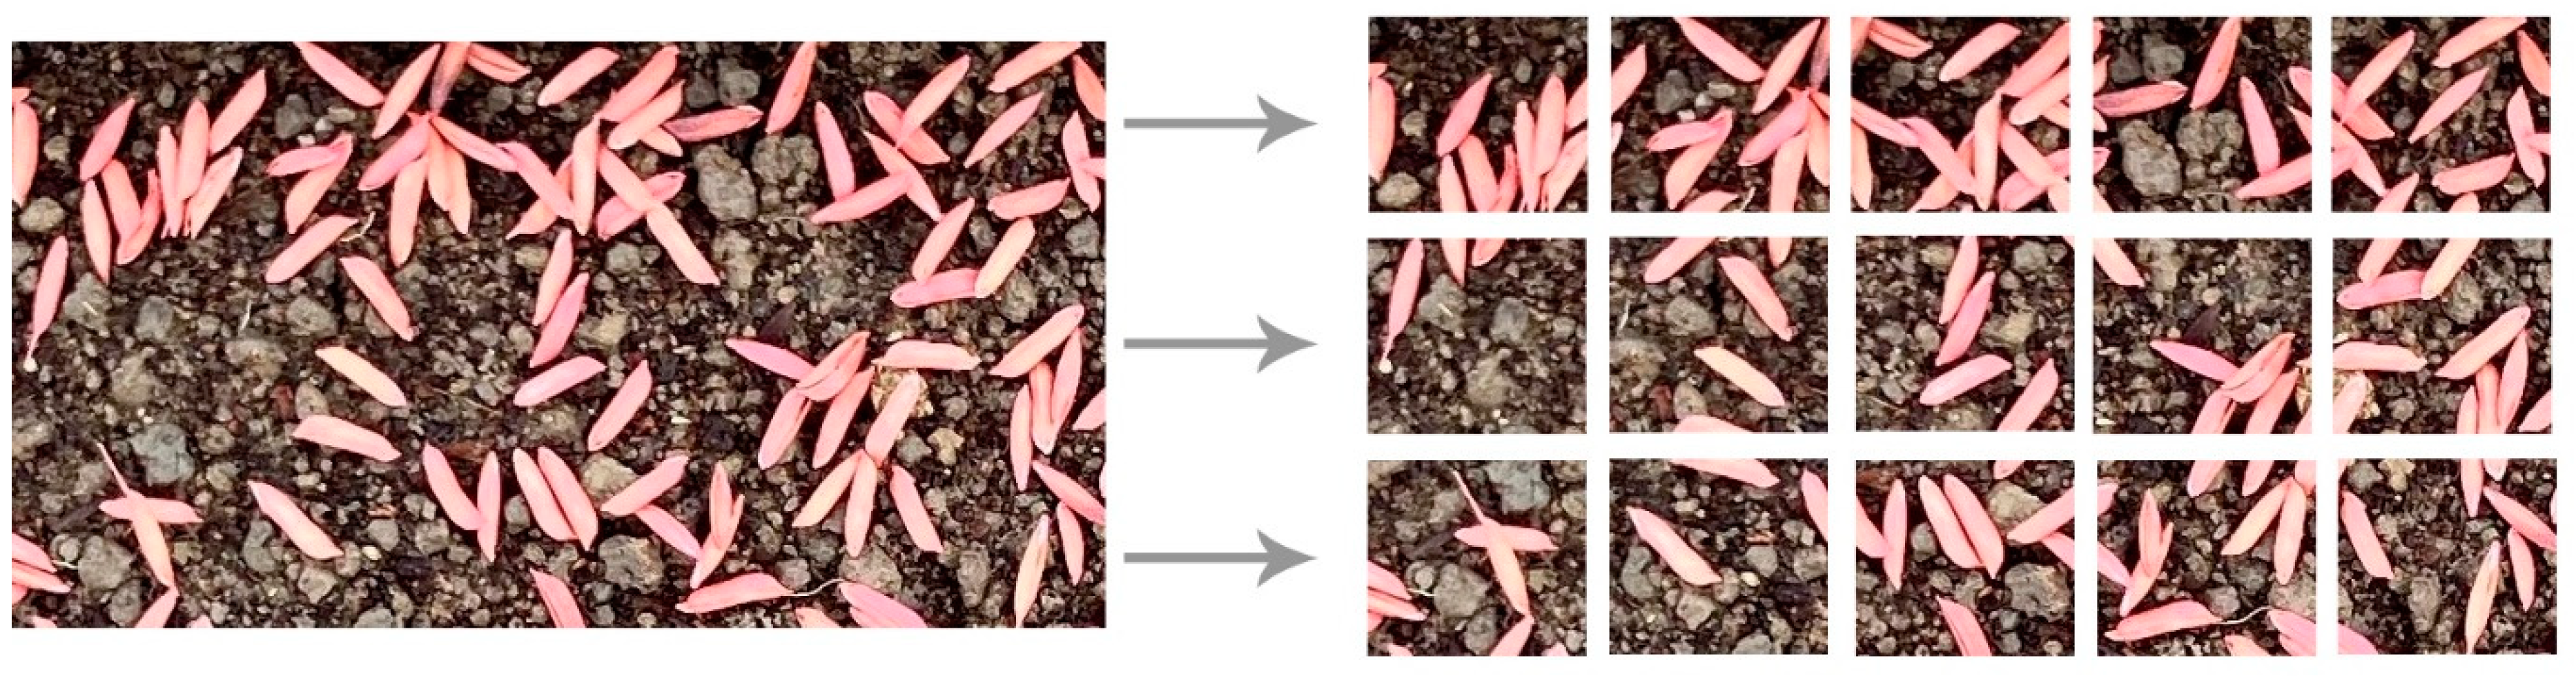
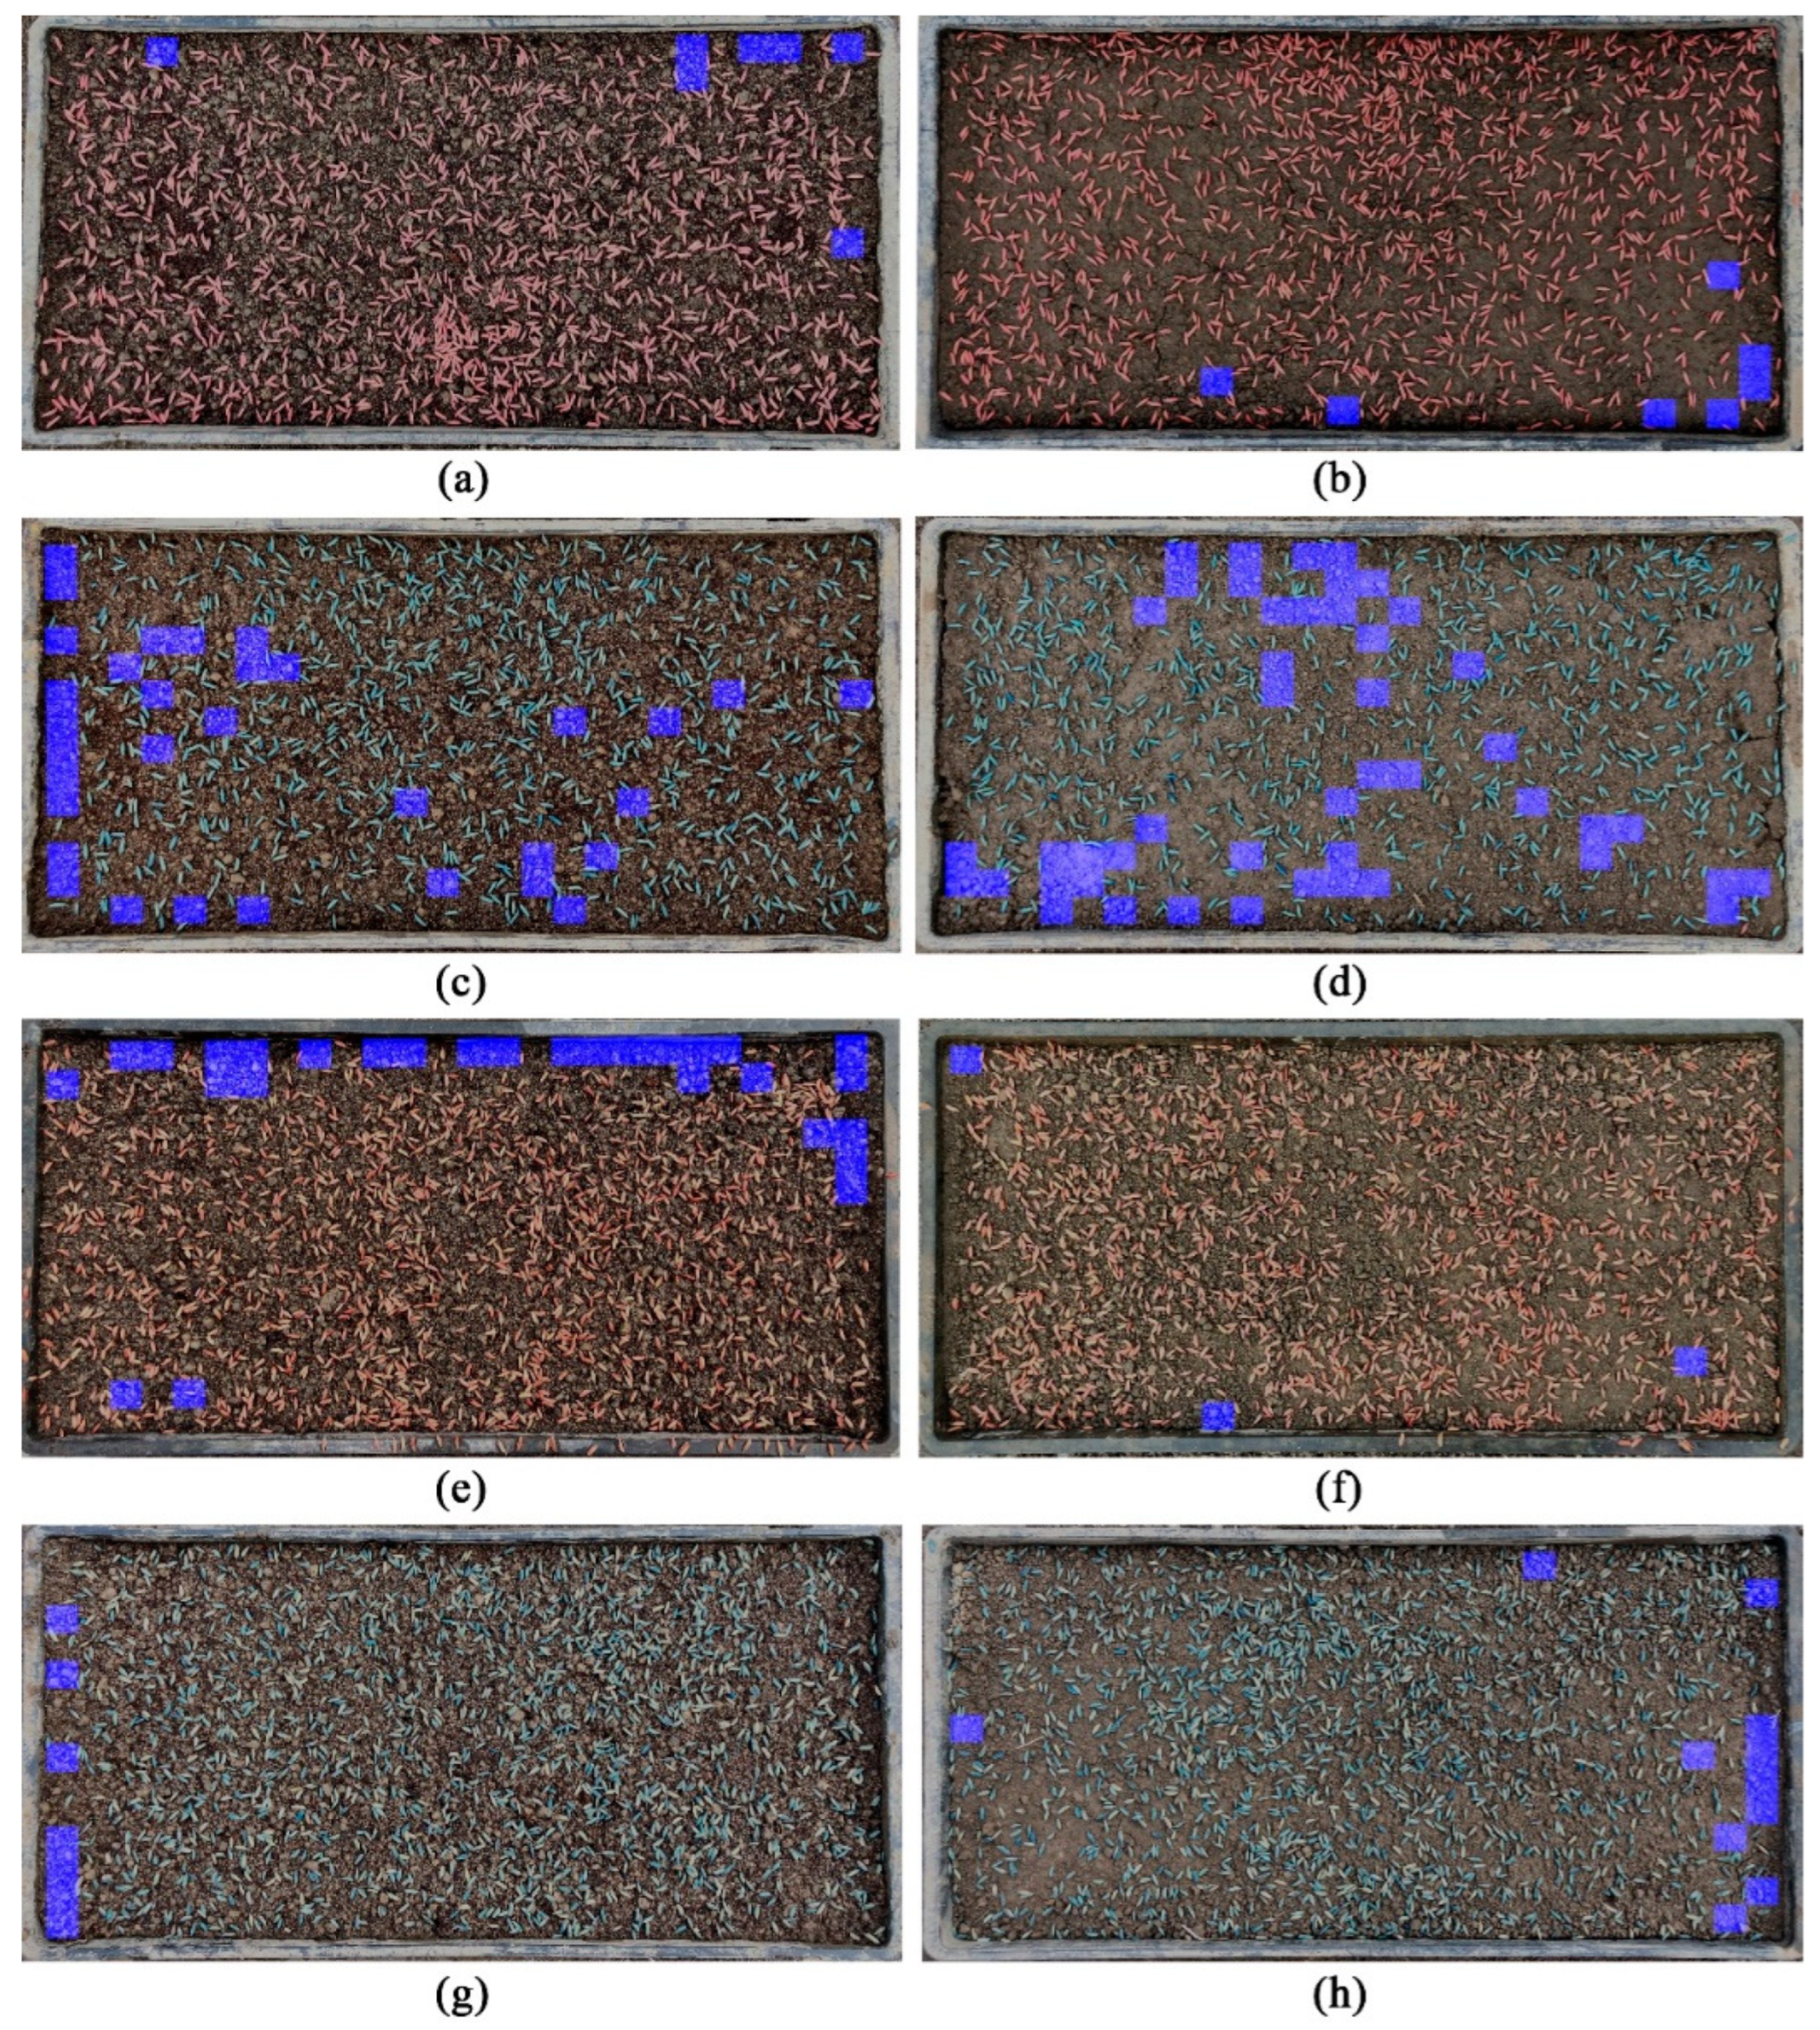
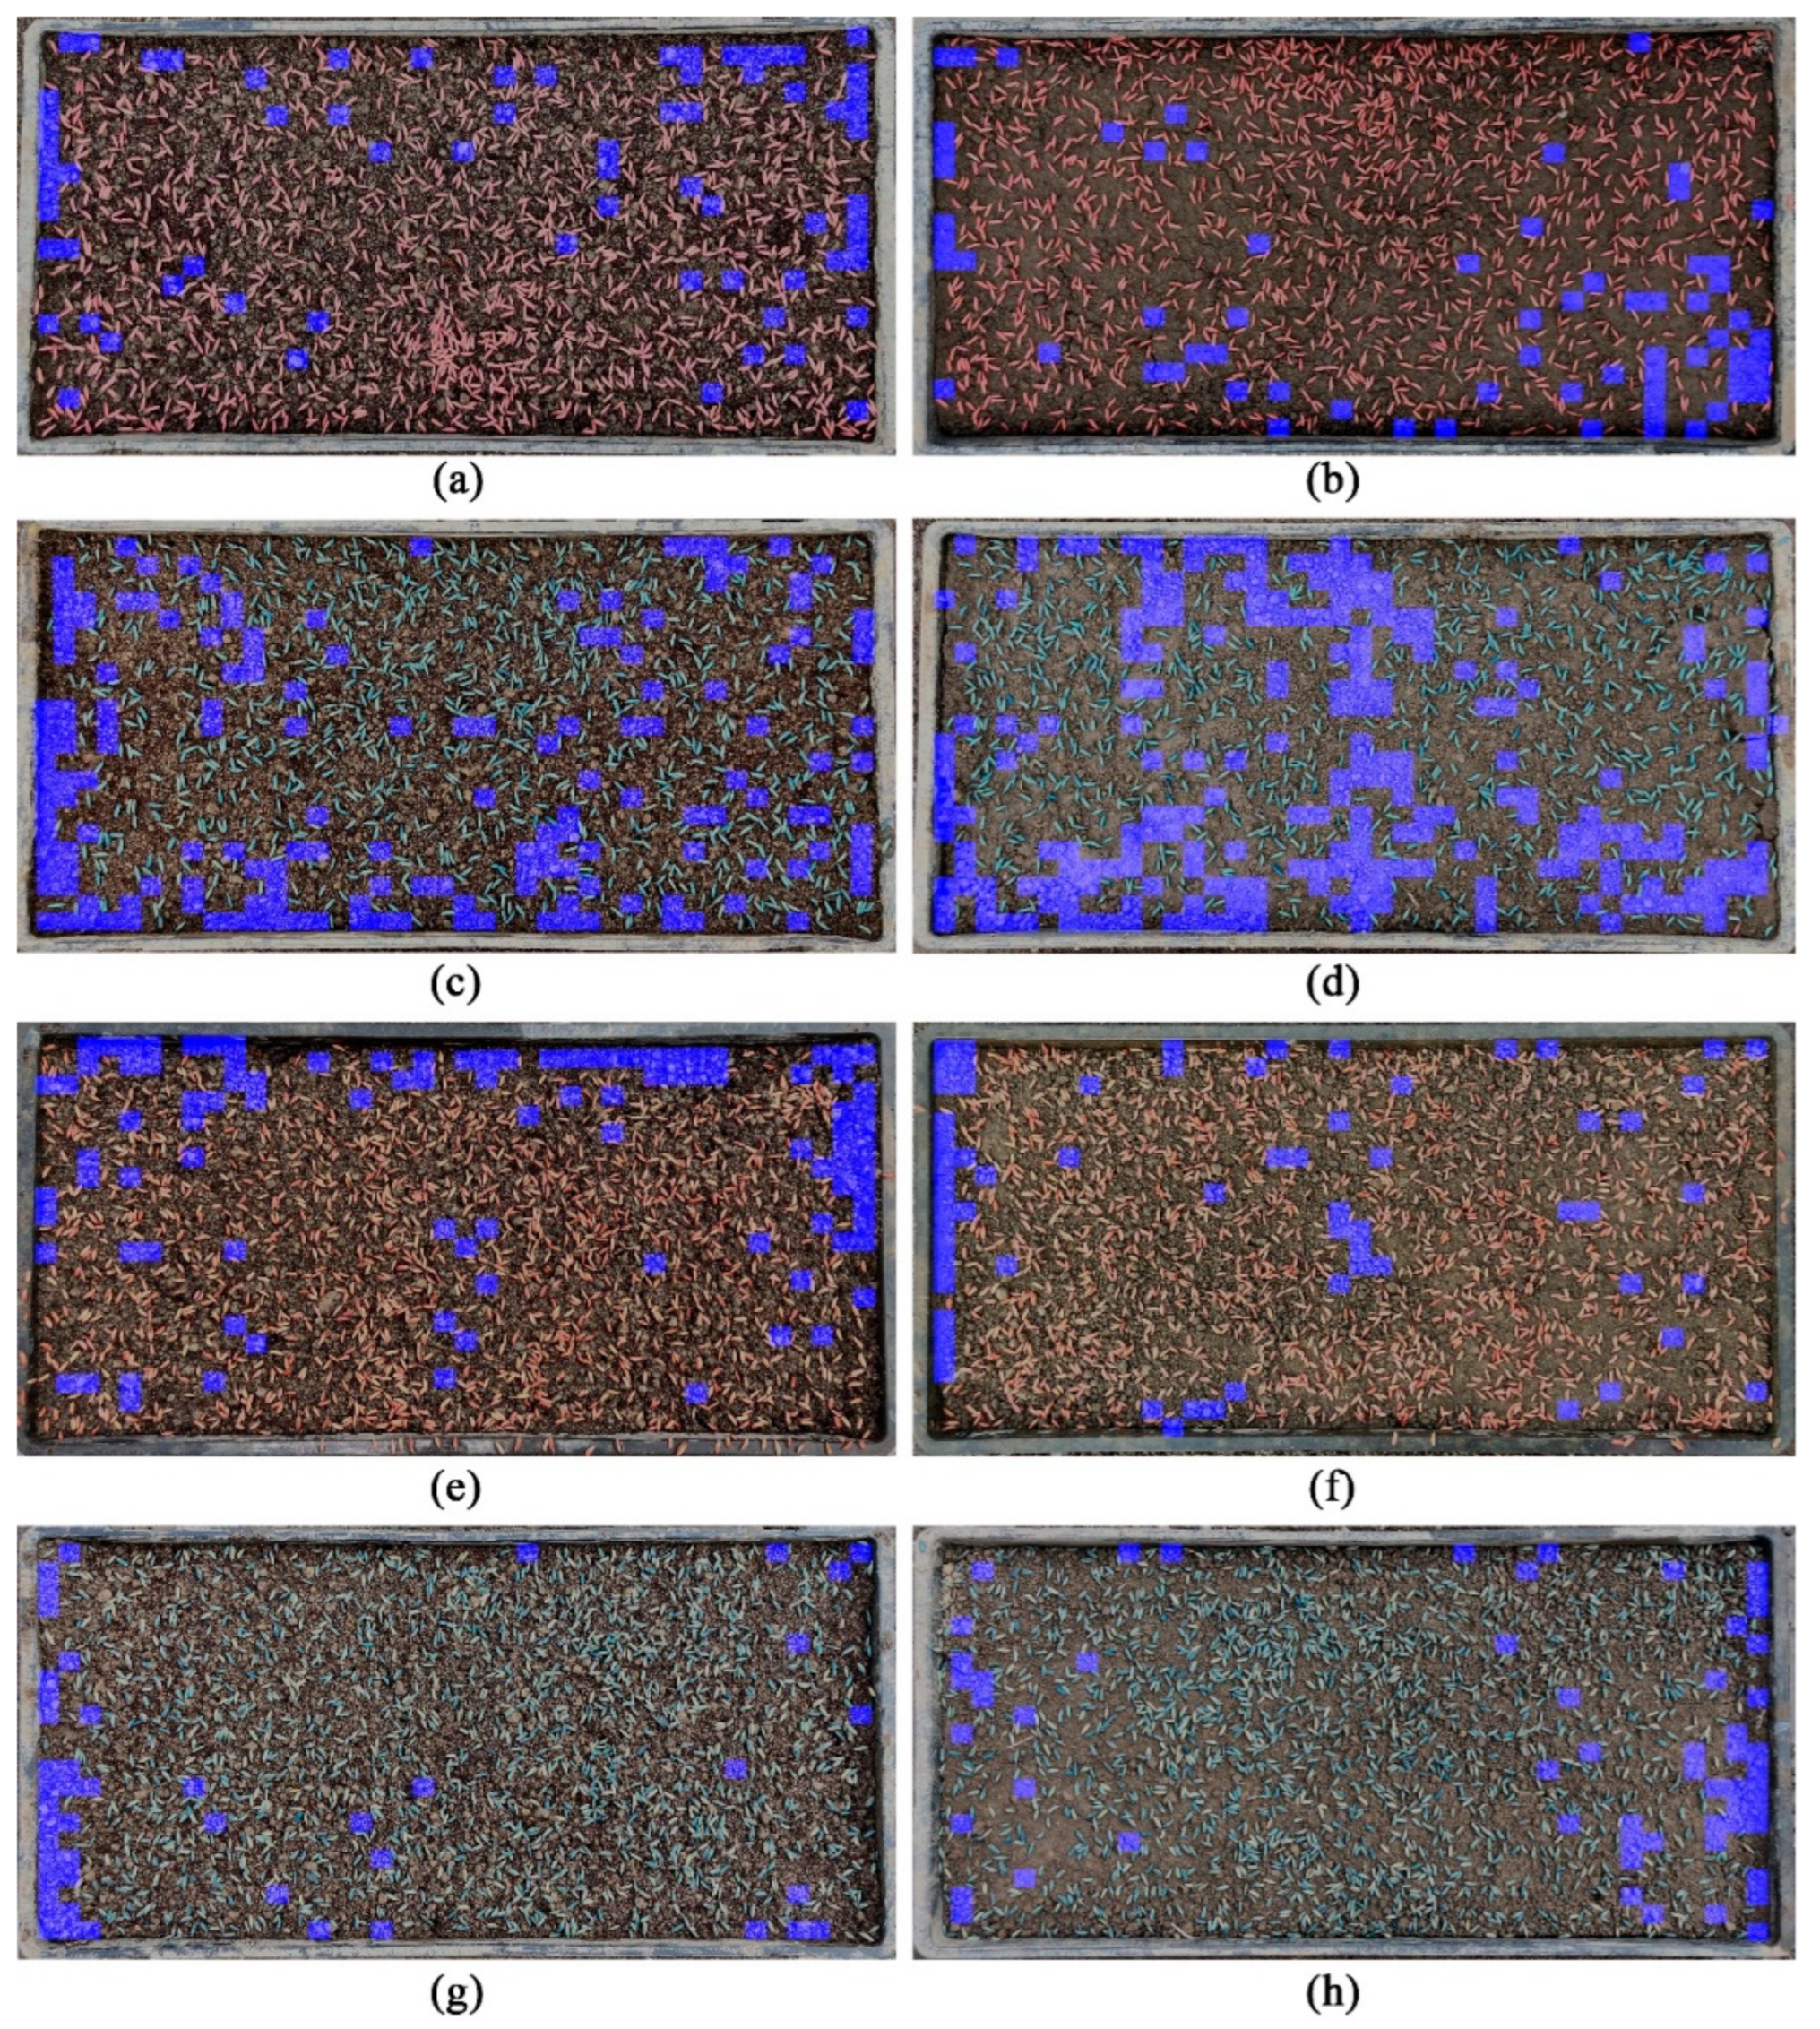
The detection of missed sowing areas in seedling trays typically falls under the realm of object detection or semantic segmentation. However, the challenge of overlapping rice seeds during sowing and the complexities in edge extraction render object detection less effective for this purpose. This research introduces a novel preprocessing approach using virtual grid-style image segmentation. The process entails dividing a full seedling tray image into multiple grid images, which are subsequently categorized and annotated using the model developed in this study. Reassembling these annotated grid images culminates in the successful detection of missed sowing areas. This technique not only achieves the precise detection of these areas but also surpasses the efficiency of conventional object detection methods, laying a solid foundation for the model’s integration into rice production lines.

4.3. Limitation of Our Work

In this study, the proposed rice sowing quality detection model effectively identifies missed sowing areas in seedling trays, but it also presents several critical issues for further investigation.
(1)
The virtual grid-style image segmentation preprocessing method, while boosting model efficiency and precision, adversely affects the recall rate in certain situations. This challenge is exemplified when large unsown areas exist between adjacent grid images with seed presence at their periphery, leading to these areas being undetected. The problem arises as the model treats each grid image independently, failing to recognize the larger missed sowing area formed by the combination of two grids. One potential solution explored was replacing grid segmentation with grid convolution to improve recall. However, this method substantially extends the detection time, which is impractical for the fast-paced environment of rice seedling production lines. Therefore, balancing the enhancement of recall rate while maintaining rapid detection speed will be a primary focus for future research endeavors.
(2)
The assessment of seeding quality in rice seedling production lines involves multiple factors. While this research model predominantly addresses missed seeding during rice seed sowing, it is crucial to note that the issue of seed overlap due to excessive sowing also warrants attention. Excessive seed overlap can intensify competition during seedling cultivation, thereby impacting seed growth and development. Consequently, future research endeavors will prioritize addressing the problem of excessive seed overlap while identifying areas of missed seeding.

5. Conclusions

The study proposes a sophisticated method for rice sowing quality detection, based on a modified ResNet50 model, applied to eight types of images obtained from the actual environment of rice seedling production lines. Enhancements to the original ResNet50 model include the incorporation of the SE attention mechanism, the use of the Adam optimizer, and the application of cosine annealing to adjust the learning rate, all directed towards the accurate identification of missed sowing areas in seedling trays. The main research conclusions are as follows:
(1)
A significant outcome of this research is the introduction of a virtual grid-style image segmentation preprocessing method, which shifts the focus from object detection to classification in the detection of missed sowing areas. This approach substantially improves the model’s precision and operational efficiency, demonstrating outstanding performance even with small-scale training datasets.
(2)
Upon enhancing the ResNet50 model with the SE attention mechanism and selecting an initial learning rate of 0.01 with 50 iteration cycles using the Adam optimizer, the model attained a test set accuracy of 95.82%. This marks a substantial improvement in test set accuracy compared to the AlexNet, DenseNet, and VGG16 models, with respective increases of 4.55%, 2.07%, and 2.62%.
(3)
The capability to detect missed sowing areas in rice seedling trays is invaluable for assisting farmers and producers in monitoring their production progress and analyzing pertinent data. This serves as a robust foundation for making informed decisions regarding reseeding operations. The model for automatic evaluation of rice sowing quality, introduced in this research, facilitates rapid assessment of sowing quality within the intelligent seedling cultivation process. It not only accurately identifies and quantifies missed seeding in individual trays but also has the potential to be integrated with image acquisition systems on production lines in the future. Such integration will make it a critical element in rice seedling production lines, thereby contributing significantly to the scientific cultivation of rice seedlings.

Author Contributions

Conceptualization, Y.L., P.H. and C.Z.; methodology, P.H.; software, Y.L., Y.C., C.Z. and S.D.; validation, Y.L. and Y.C.; data curation, S.D.; writing—original draft, Y.L. All authors have read and agreed to the published version of the manuscript.

Funding

This work was supported by Sichuan Provincial Financial Independent Innovation Special Project—Application Research of Spatiotemporal Big Data Analysis in Agricultural Production Services (2022ZZCX034), National Industrial Technology System Sichuan Meat Sheep Innovation Team (SCCXTD-2023-14).

Institutional Review Board Statement

Not applicable.

Informed Consent Statement

Not applicable.

Data Availability Statement

The data presented in this study are available on request from the corresponding author due to our image datasets are self-built.

Conflicts of Interest

The authors declare no conflicts of interest.

References

  1. Muthayya, S.; Sugimoto, J.D.; Montgomery, S.; Maberly, G.F. An overview of global rice production, supply, trade, and consumption. Ann. N. Y. Acad. Sci. 2014, 1324, 7–14. [Google Scholar] [CrossRef] [PubMed]
  2. Wu, W.; Li, Z.; Xi, M.; Tu, D.; Xu, Y.; Zhou, Y.; Zhang, Z. Ratoon rice system of production: A rapid growth pattern of multiple cropping in china: A review. Plants 2023, 12, 3446. [Google Scholar] [CrossRef] [PubMed]
  3. Zheng, H.; Li, B.; Chen, Y.; Tang, Q. Elastic sowing dates with low seeding rate for grain yield maintenance in mechanized large-scale double-cropped rice production. Sci. Rep. 2020, 10, 9185. [Google Scholar] [CrossRef] [PubMed]
  4. Wang, A.; Ding, X.; Ma, X.; Chen, Y.; Zhou, H. Research on the method of seeding quantity detection in potted seedling tray of super rice based on improved shape factor. Trans. Chin. Soc. Agric. Mach. 2015, 46, 29–35. [Google Scholar]
  5. Dong, W.; Ma, X.; Li, H.; Tan, S.; Guo, L. Detection of performance of hybrid rice pot-tray sowing utilizing machine vision and machine learning approach. Sensors 2019, 19, 5332. [Google Scholar] [CrossRef] [PubMed]
  6. Bai, J.; Hao, F.; Cheng, G.; Li, C. Machine vision-based supplemental seeding device for plug seedling of sweet corn. Comput. Electron. Agric. 2021, 188, 106345. [Google Scholar] [CrossRef]
  7. Gao, J.; Li, Y.; Zhou, K.; Wu, Y.; Hou, J. Design and optimization of a machine-vision-based complementary seeding device for tray-type green onion seedling machines. Agronomy 2022, 12, 2180. [Google Scholar] [CrossRef]
  8. Yan, Z.; Zhao, Y.; Luo, W.; Ding, X.; Li, K.; He, Z.; Shi, Y.; Cui, Y. Machine vision-based tomato plug tray missed seeding detection and empty cell replanting. Comput. Electron. Agric. 2023, 208, 107800. [Google Scholar] [CrossRef]
  9. Zhang, W.; Zhao, B.; Gao, S.; Ji, Y.; Zhou, L.; Niu, K.; Qiu, Z.; Jin, X. Online Recognition of Small Vegetable Seed Sowing Based on Machine Vision. IEEE Access 2023, 11, 134331–134339. [Google Scholar] [CrossRef]
  10. Zhou, H.; Li, C.; Zhang, B.; Wang, H.; Li, X. Decision and experiment on intelligent reseeding system of rice bowl nursing seedling. Trans. Chin. Soc. Agric. Mach. 2020, 51, 122–129. [Google Scholar]
  11. He, K.; Zhang, X.; Ren, S.; Sun, J. Deep residual learning for image recognition. In Proceedings of the 2016 IEEE Conference on Computer Vision and Pattern Recognition (CVPR), Las Vegas, NV, USA, 27–30 June 2016. [Google Scholar]
  12. Li, X.; Rai, L. Apple leaf disease identification and classification using resnet models. In Proceedings of the 2020 IEEE 3rd International Conference on Electronic Information and Communication Technology (ICEICT), Shenzhen, China, 13–15 November 2020. [Google Scholar]
  13. Li, B.; He, Y. An improved resnet based on the adjustable shortcut connections. IEEE Access 2018, 6, 18967–18974. [Google Scholar] [CrossRef]
  14. Archana, U.; Khan, A.; Sudarshanam, A.; Sathya, C.; Koshariya, A.; Krishnamoorthy, R. Plant disease detection using resnet. In Proceedings of the 2023 International Conference on Inventive Computation Technologies (ICICT), Lalitpur, Nepal, 26–28 April 2023. [Google Scholar]
  15. Zhuo, L.; Yuan, S.; Li, J. Pedestrian multi-attribute collaborative recognition method based on ResNet50 and channel attention mechanism. Meas. Control Technol. 2022, 41, 1–8. [Google Scholar]
  16. Hu, J.; Shen, L.; Sun, G. Squeeze-and-excitation networks. IEEE Trans. Pattern Anal. Mach. Intell. 2020, 42, 2011–2023. [Google Scholar] [CrossRef]
  17. He, J.; Jiang, D. Fully automatic model based on se-resnet for bone age assessment. IEEE Access 2021, 9, 62460–62466. [Google Scholar] [CrossRef]
  18. An, Q.; Wang, K.; Li, Z.; Song, C.; Tang, X.; Song, J. Real-time monitoring method of strawberry fruit growth state based on yolo improved model. IEEE Access 2022, 10, 124363–124372. [Google Scholar] [CrossRef]
  19. Wan, P.; Zhao, J.; Zhu, M.; Tan, H.; Deng, Z. Freshwater fish species identification method based on improved ResNet50 model. Trans. Chin. Soc. Agric. Eng. 2021, 37, 159–168. [Google Scholar]
  20. Kohli, H.; Agarwal, J.; Kumar, M. An improved method for text detection using adam optimization algorithm. Glob. Trans. Proc. 2022, 3, 230–234. [Google Scholar] [CrossRef]
  21. Du, X.; Si, L.; Li, P.; Yun, Z. A method for detecting the quality of cotton seeds based on an improved ResNet50 model. PLoS ONE 2023, 18, e0273057. [Google Scholar] [CrossRef] [PubMed]
  22. Liang, J.; Jiang, W. A ResNet50-dpa model for tomato leaf disease identification. Front. Plant Sci. 2023, 14, 1258658. [Google Scholar] [CrossRef]
  23. Kim, S.; Lim, J.; Shin, M.; Jung, S. Se-resnet-vit hybrid model for noise classification in adhesive patch-type wearable electrocardiographs. Annu. Int. Conf. IEEE Eng. Med. Biol. Soc. 2023, 2023, 38082768. [Google Scholar]
Figure 1. Proposed model’s architecture.
Applsci 14 03098 g001
Figure 2. Three distinct seeding method. (a) Intensive seeding, (b) uniform sowing, (c) sparse sowing.
Applsci 14 03098 g002
Figure 3. Eight distinct image categories. (a) Variety 1 + red coating + substrate soil, (b) Variety 1 + red coating + soil, (c) Variety 1 + blue coating + substrate soil, (d) Variety 1 + blue coating + soil, (e) Variety 2 + red coating + substrate soil, (f) Variety 2 + red coating + soil, (g) Variety 2 + blue coating + substrate soil, (h) Variety 2 + blue coating + soil.
Applsci 14 03098 g003
Figure 4. Image segmentation.
Applsci 14 03098 g004
Figure 5. Three types of images after labeling.
Applsci 14 03098 g005
Figure 6. Data enhancement. (a) original image, (b) flip horizontal, (c) flip vertical, (d) grayscale, (e) brightness, (f) saturation.
Applsci 14 03098 g006
Figure 7. Comparison between the original dataset and the enhanced dataset.
Applsci 14 03098 g007
Figure 8. Data distribution of raw data and enhanced data. (a) Variety 1 + red coating + substrate soil, (b) Variety 1 + red coating + soil, (c) Variety 1 + blue coating + substrate soil, (d) Variety 1 + blue coating + soil, (e) Variety 2 + red coating + substrate soil, (f) Variety 2 + red coating + soil, (g) Variety 2 + blue coating + substrate soil, (h) Variety 2 + blue coating + soil.
Applsci 14 03098 g008
Figure 9. SE channel attention mechanism.
Applsci 14 03098 g009
Figure 10. Improving the Resnet50 Model Structure.
Applsci 14 03098 g010
Figure 11. The impact of different learning rates on the model. (a) Training accuracy at different learning rates, (b) validation accuracy at different learning rates, (c) training loss at different learning rates, (d) validation loss at different learning rates.
Applsci 14 03098 g011
Figure 12. Confusion matrix of different models. (a) AlexNet, (b) DenseNet, (c) VGG16, (d) improved ResNet50.
Applsci 14 03098 g012
Figure 13. Detection results at 16 × 28 parameters. (a) Variety 1 + red coating + substrate soil, (b) Variety 1 + red coating + soil, (c) Variety 1 + blue coating + substrate soil, (d) Variety 1 + blue coating + soil, (e) Variety 2 + red coating + substrate soil, (f) Variety 2 + red coating + soil, (g) Variety 2 + blue coating + substrate soil, (h) Variety 2 + blue coating + soil.
Applsci 14 03098 g013
Figure 14. Detection results at 24 × 42 parameters. (a) Variety 1 + red coating + substrate soil, (b) Variety 1 + red coating + soil, (c) Variety 1 + blue coating + substrate soil, (d) Variety 1 + blue coating + soil, (e) Variety 2 + red coating + substrate soil, (f) Variety 2 + red coating + soil, (g) Variety 2 + blue coating + substrate soil, (h) Variety 2 + blue coating + soil.
Applsci 14 03098 g014
Table 1. The experimental environment in this paper.
Experimental ToolSpecific Model
CPUIntel Xeon(R) Silver 4210 CPU @ 2.4 GHz (Intel, Santa Clara, CA, USA)
GPUNVIDIA Quadro RTX 4000
RAM128 G
Operating SystemUbuntu 20.04
Programming LanguagePython 3.8
FrameworkPytorch 1.10.0
Virtual EnvironmentAnaconda 2.0.3
Table 2. Hyperparameter setting in this paper.
HyperparameterDetail Setting
Loss FunctionThe Cross-Entropy Loss Function
OptimizerAdam
Initial Learning Rate Value0.01
Batch Size32
The Number of Epoch50
Table 3. The impact of different optimizers on ResNet50.
ModelEpochRate ValueTrain Accuracy/%Val Accuracy/%
Adagrad-ResNet50500.0193.57%92.01%
RMSprop-ResNet50500.0198.31%97.42%
SGD-ResNet50500.0197.44%96.72%
Adam-ResNet50500.0199.52%98.87%
Table 4. Recognition efficiency of different models.
ModelTrain Accuracy/%Val Accuracy/%Test Accuracy/%Average
Precision/%
Average
Recall/%
Average
F1_Score/%
Average Detection (ms)
ResNet5097.23%95.41%92.44%91.71%90.40%91.05%7.5412
AlexNet97.38%97.14%91.27%91.45%91.28%91.36%18.2530
DenseNet95.64%96.02%93.75%93.80%93.77%93.78%28.2884
VGG1699.46%98.87%93.20%93.20%93.20%93.20%3.5903
Improved ResNet5099.52%98.87%95.81%97.36%95.83%96.59%14.3897
Disclaimer/Publisher’s Note: The statements, opinions and data contained in all publications are solely those of the individual author(s) and contributor(s) and not of MDPI and/or the editor(s). MDPI and/or the editor(s) disclaim responsibility for any injury to people or property resulting from any ideas, methods, instructions or products referred to in the content.

