Article

Improved Long-Term Forecasting of Passenger Flow at Rail Transit Stations Based on an Artificial Neural Network

School of Civil and Transportation Engineering, Hebei University of Technology, Tianjin 300401, China
*
Author to whom correspondence should be addressed.
Appl. Sci. 2024, 14(7), 3100; https://doi.org/10.3390/app14073100
Submission received: 3 March 2024 / Revised: 28 March 2024 / Accepted: 2 April 2024 / Published: 7 April 2024

Abstract

:
When new rail stations or lines are planned, long-term planning for decades to come is required. The short-term passenger flow prediction is no longer of practical significance, as it only takes a few factors that affect passenger flow into consideration. To overcome this problem, we propose several long-term factors affecting the passenger flow of rail transit in this paper. We also create a visual analysis of these factors using ArcGIS and construct a long-term passenger flow prediction model for rail transit based on a class neural network using an SPSS Modeler. After optimizing relevant parameters, the prediction accuracy reaches 94.6%. We compare the results with other models and find that the neural network model has a good performance in predicting long-term rail transit passenger flow. Finally, the factors affecting passenger flow are ranked in terms of importance. It is found that among these factors, bicycles available for connection have the biggest influence on the passenger flow of rail stations.

1. Introduction

With the advantages of large capacity, convenience, safety, and reliability, as well as non-pollution, urban rail transit has gradually become the main mode of travel for residents of large- and medium-sized cities. According to statistics, in 2022, a total of 1080.63 km of new urban rail transit operating lines will be added nationwide, with 25 new operating lines in China [1]. As the scale of the rail transit line network continues to expand, a large number of passengers drive the long-term development of economic benefits along the line, such as rail transit near the surrounding buildings, housing prices, and other long-term impacts in the coming decades. Similarly, the building facilities around the station with the nature of long-term existence, transportation connection mode, etc., will also play a long-term impact on the station passenger flow. Therefore, when the rail transit company is planning a new station or opening a new line, it needs to carefully consider the location of the station, as well as the scale of the station construction, and the long-term influence of its surrounding passenger flow is a very important reference index. Through the consideration of various long-term influencing factors, the purpose of the accurate prediction of rail transit passenger flow can be achieved.
The current research on passenger flow prediction for rail transit mainly focuses on short-term passenger flow prediction for completed lines or stations [2,3,4], as well as the prediction and distribution of OD (Origin–Destination) travel routes for passengers [5,6,7,8]. When planning and constructing a new rail transit line or station, due to the lack of historical passenger flow data, the influence factors of passenger flow at this time become the indicators for the future long-term evaluation of the line or station. Wen Huimin et al. used the CART regression tree to analyze the influence factors of passenger flow changes caused by the access of new rail transit lines to other public transportation [9]. Wang Yuping et al. analyzed the influence mechanism and influence degree of changes in land use along the line, traffic connection, rail transit service level, and fare policy on urban rail transit passenger traffic and found that the passenger flow of a single rail transit line develops more slowly at the initial stage, and the cultivation period is longer [10]. Lu et al. put forward a new method based on transfer information entropy (TIE), which is an indicator for the future long-term evaluation of the rail transit entropy (TIE) causal inference method used to determine the causal relationship between influencing factors and rail transit passenger flow, which can be used to derive the interaction between influencing factors and passenger flow after comparing with correlation analysis [11]. After analyzing passenger traffic and its influencing mechanism, various scholars have established models to predict the passenger flow. Yu et al. divided the city into several areas with similar internal traffic attributes and moderate spatial scales to obtain more accurate influencing factors of passenger flow and proposed a passenger flow prediction model based on Xgboost for new lines in stations [12]. He et al. proposed a model to predict the passenger flow of a new station based on the pattern of the station’s historical passenger data and the attribute evaluation of the new station. After assessing the attributes of the stations, they proposed a passenger flow prediction method based on the attributes of the stations [13]. Lin et al. used Pearson’s correlation analysis to study the intrinsic relationship between the built environment around the station and the passenger flow of the station and established a passenger flow prediction model with multilayer perceptron (MLP), and the results of their study can be used for the newly built rail stations that do not have historical passenger flow data [14]. Asif et al. combined a Genetic Algorithm with an artificial neural network model and a locally weighted regression model to achieve highly accurate prediction results for short-term traffic flow on urban roads [15].Due to the unstable dependence of passenger flow in the long or short term, it is necessary to predict passenger flow using models that can capture different time series. Lin et al. used mathematical and artificial neural network methods to predict the passenger flow of the subway based on the land use around the subway [16]. After a large number of validations, compared with other models, Long Short-Term Memory (LSTM) can effectively capture the long-term and short-term characteristics of traffic volume [17,18,19]. However, the selection of influencing factors in these studies is relatively one-sided and only focuses on whether some specific factors have an impact on the passenger flow of rail transportation, and it is difficult to achieve the effect of long-term prediction on the passenger flow of the new stations or the opening of the new line.
There are many factors affecting the passenger flow of rail transit, and many of them have the effect of influencing the passenger flow of rail transit in the long term, which, in turn, achieves the purpose of long-term passenger flow prediction. To the best of our knowledge, there are few studies on the long-term prediction of rail transit passenger flow, and it is especially important to analyze the factors that affect rail transit passenger flow in the long term. In this paper, we try to analyze the long-term factors affecting the passenger flow of rail transit and use them to make long-term predictions of passenger flow. The main contributions of this paper are as follows:
(1) First of all, the topological characteristics of the rail transit stations and line networks and the external environmental factors that have a long-term impact on passenger flow are taken as the basic data, and the visual analysis of the influencing factors is carried out using ArcGIS and the SPSS Modeler. The relationship between these factors and passenger flow is explored;
(2) Secondly, the passenger flow prediction model based on a neural network is constructed, and the prediction results are compared with other models to verify the superior performance of this paper’s model in predicting passenger flow;
(3) Finally, from the analytical results of the model, we compare the importance of the influence of these factors on passenger flow.
The rest of this paper is organized as follows. Section 2 describes the data sources used in this study, performs data visualization, and analyzes the relationship between the influencing factors and passenger flow. Section 3 describes the principle of the neural network-like model and its construction method. Section 4 shows the prediction results of the model and analyzes them in comparison with other models, and the predictive analysis leads to the order of importance of the influencing factors. Section 5 makes a relevant comparison between the differences between this paper and other studies and discusses the research focus of this paper. Finally, Section 6 summarizes the contributions and limitations of this paper and the outlook for future work.

2. Analysis of Influencing Factors

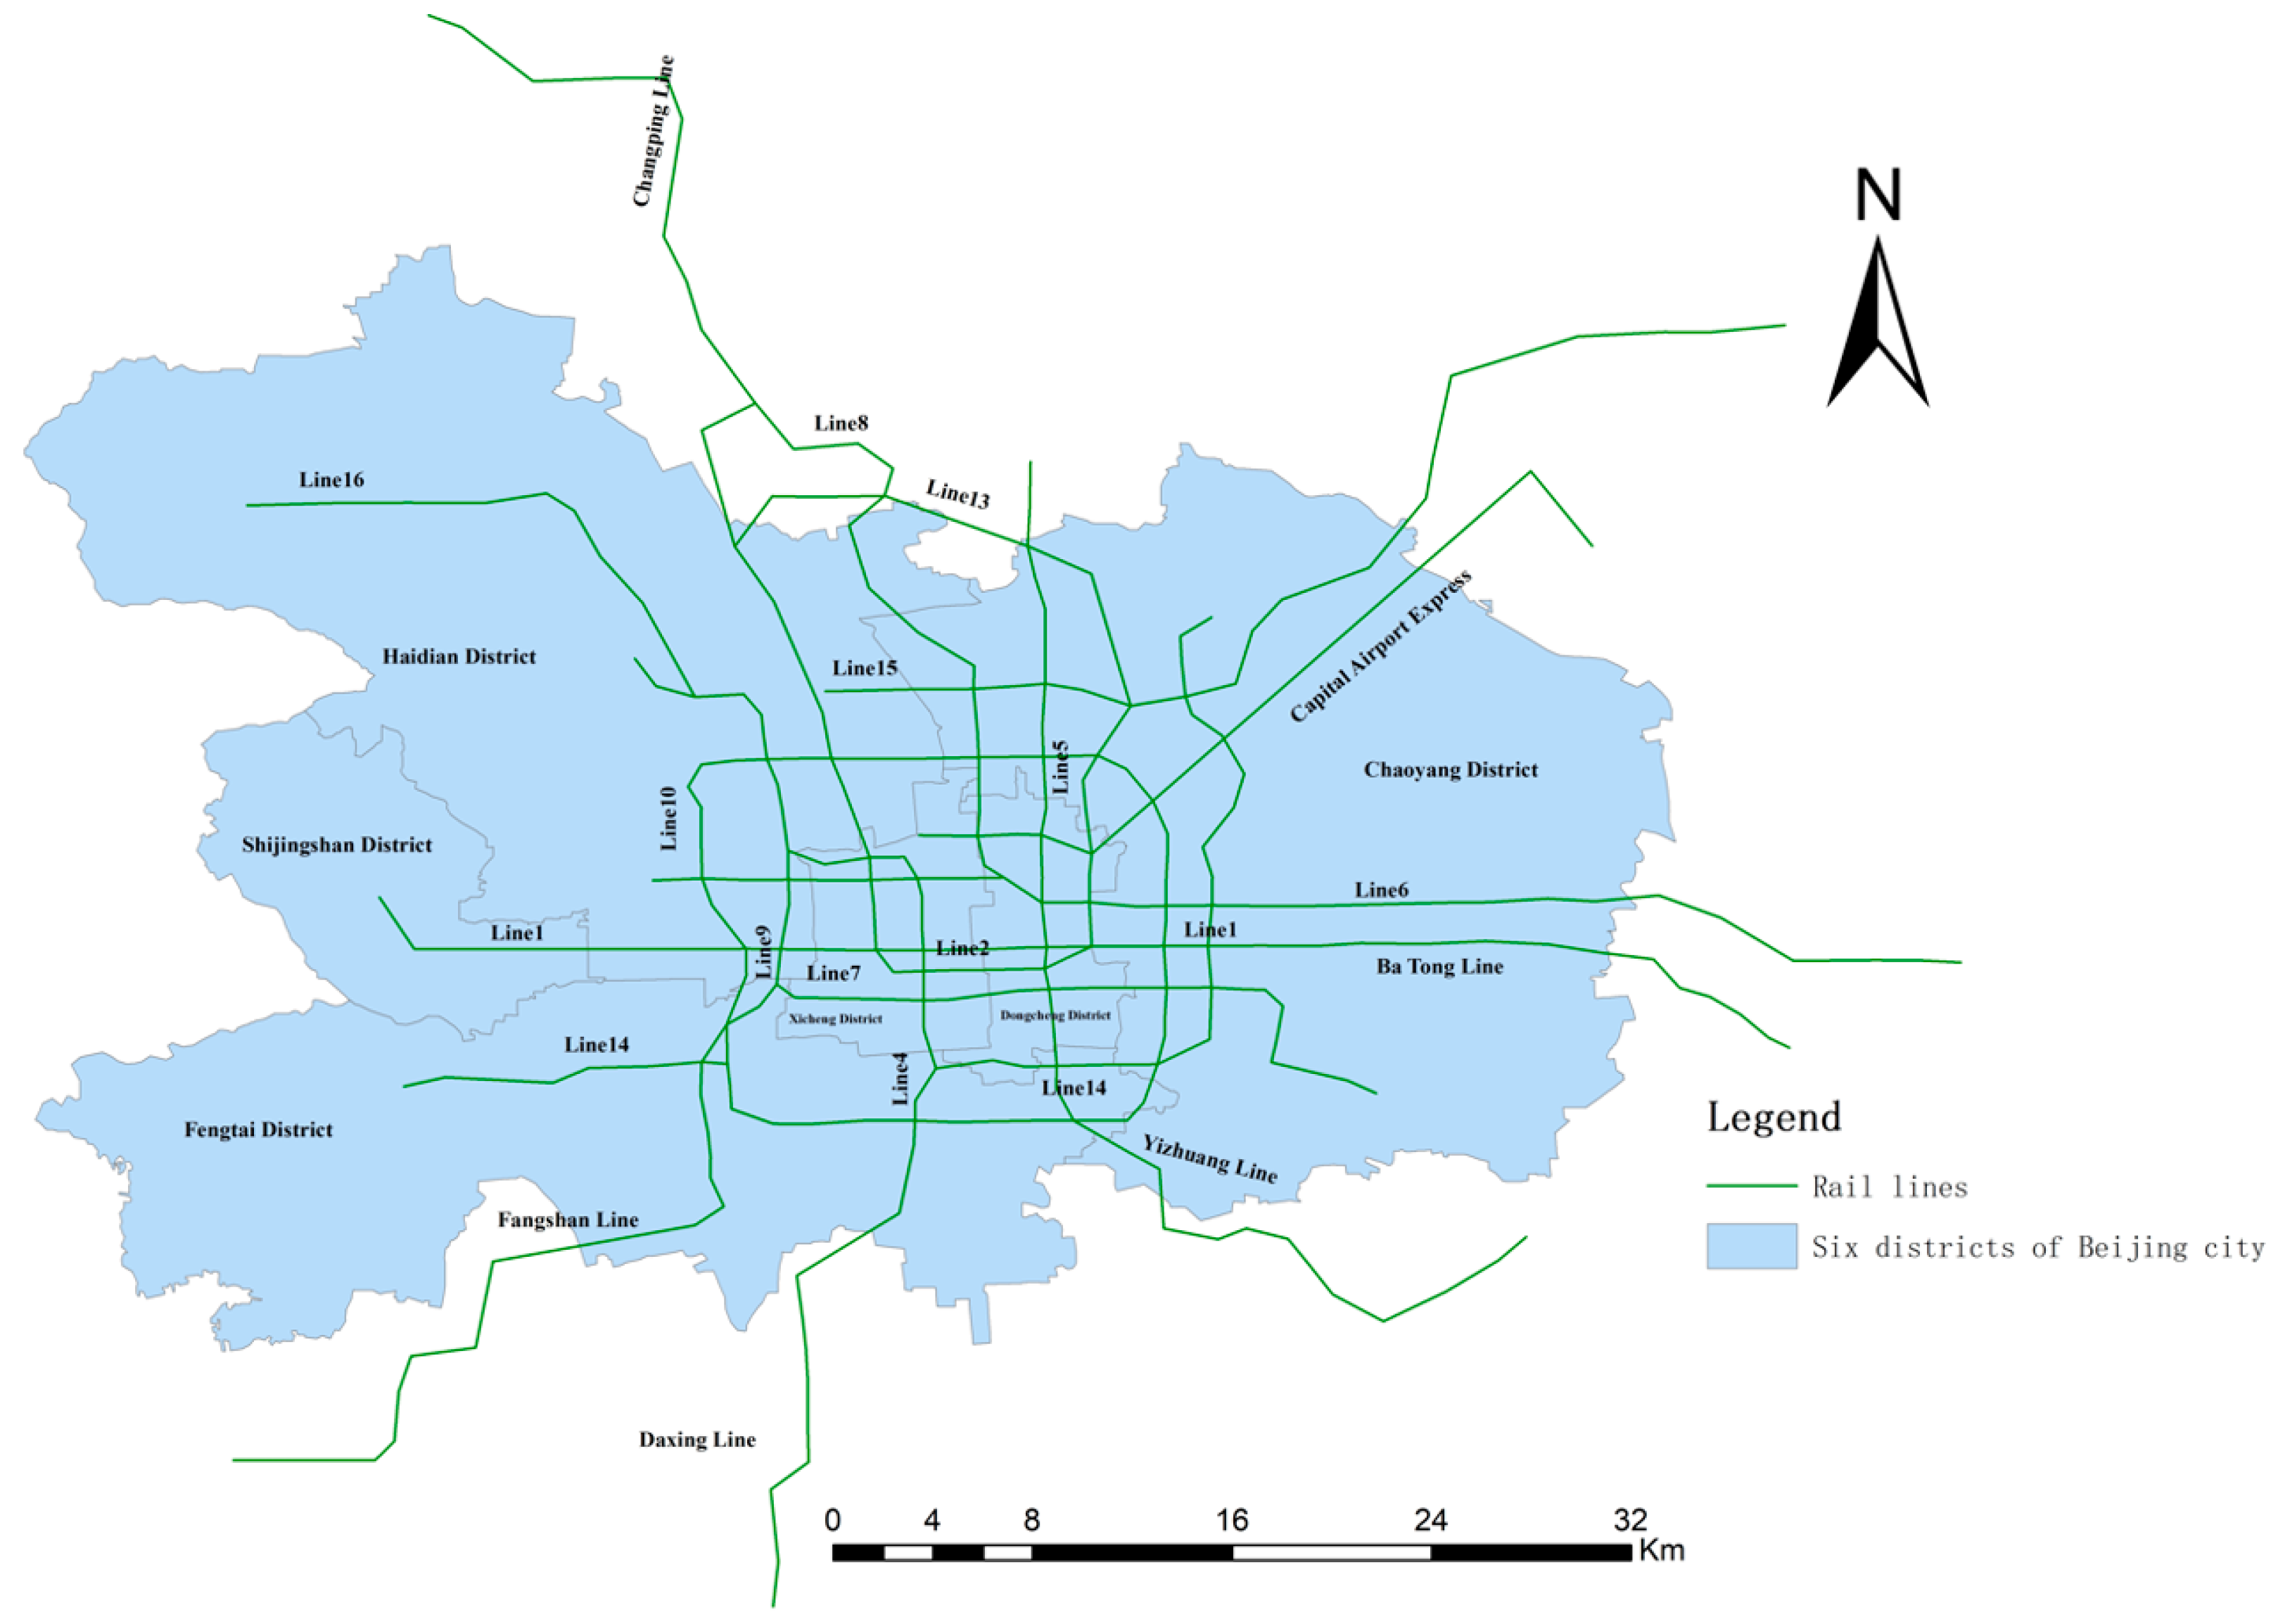
2.1. Subjects and Data Sources

The Beijing rail transit Lines 1, 2, 4, 5, 6, 7, 8, 9, 10, 13, 14, 15, 16, Fangshan Line, Changping Line, Daxing Line, Batong Line, Yizhuang Line, Capital Airport Line, which have been put into operation in 2019 and are the objects of this study, result in a total of 19 lines and 288 stations. The Beijing rail transit line map is shown in Figure 1.
These stations have a huge passenger flow, which can easily cause station congestion, and the size of the rail transit passenger flow is affected by the characteristics of the station itself, the environment around the station, and the convenience of transferring in the long term. Therefore, combining the spatial geographic information of Beijing’s rail transit stations, four long-term influencing factors are selected, namely, station connectivity characteristics, station peripheral connection characteristics, station peripheral population characteristics, and station peripheral attraction characteristics, and each of them is further subdivided into a total of ten influencing factors. Data sources and calculation methods are shown in Table 1.

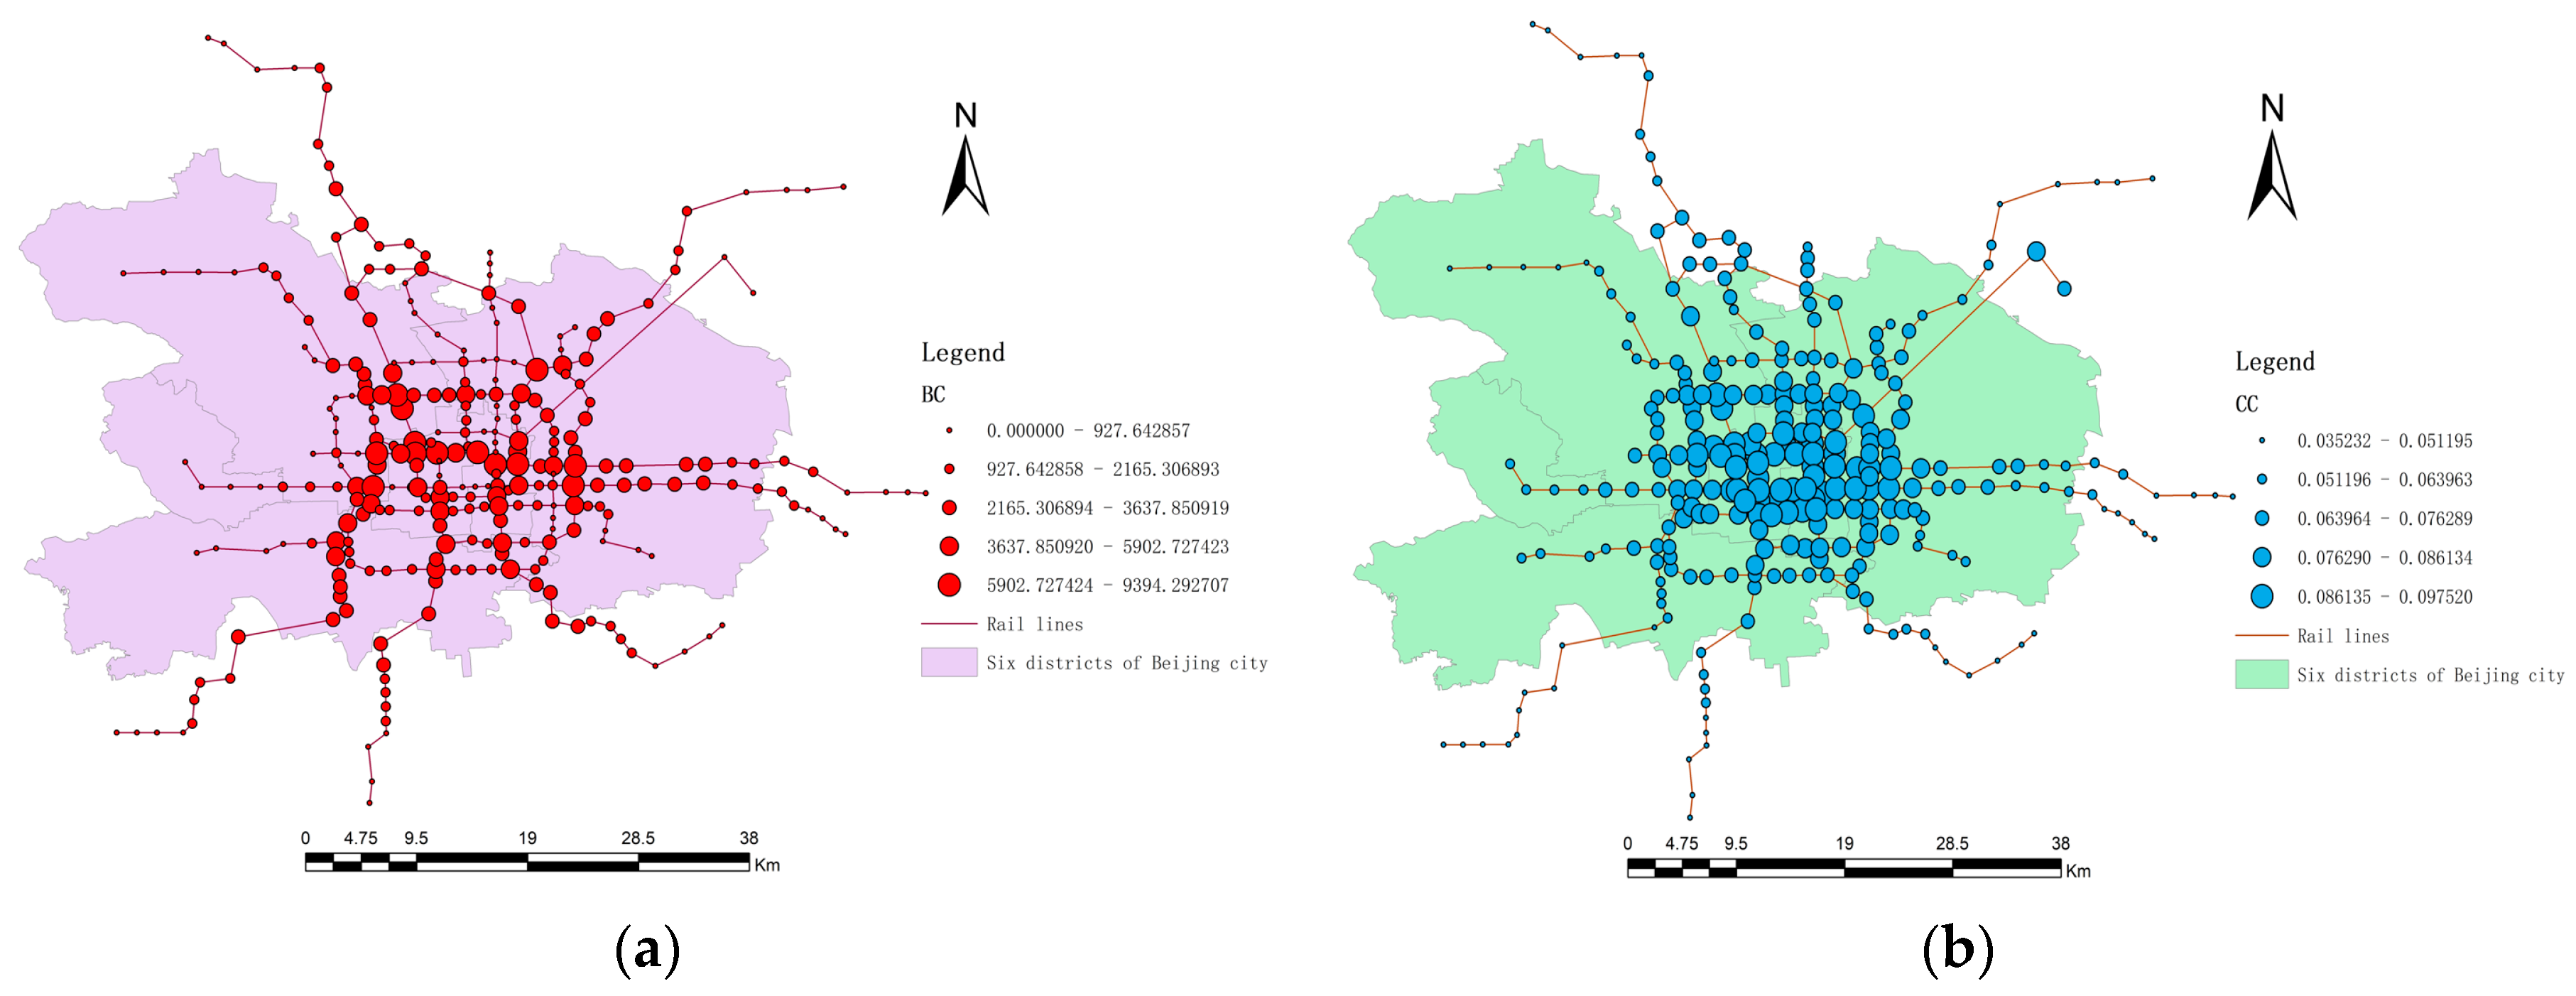
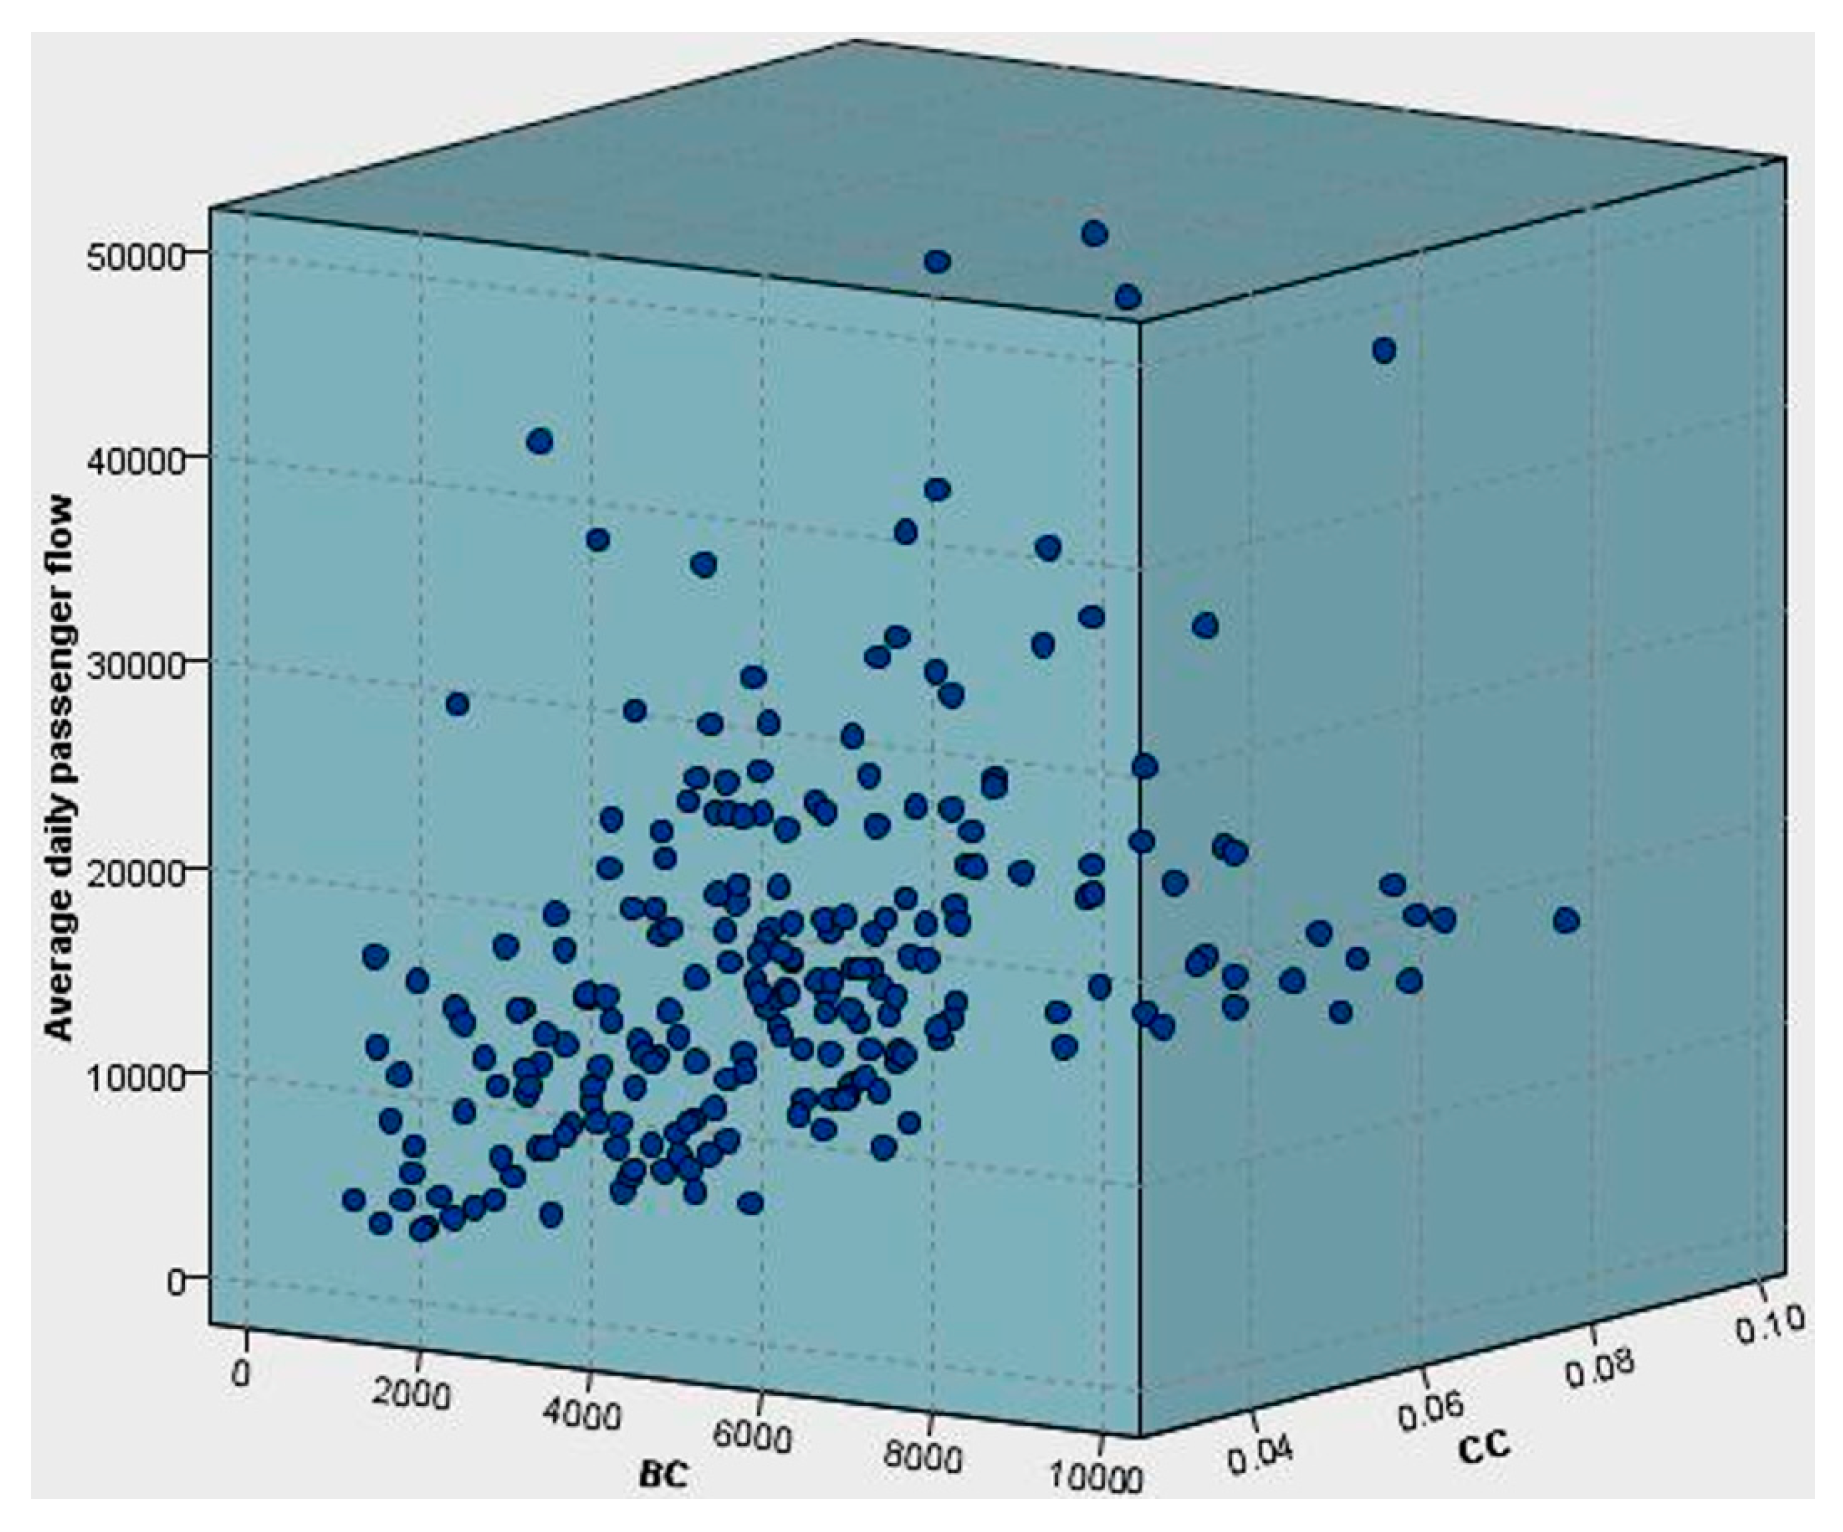
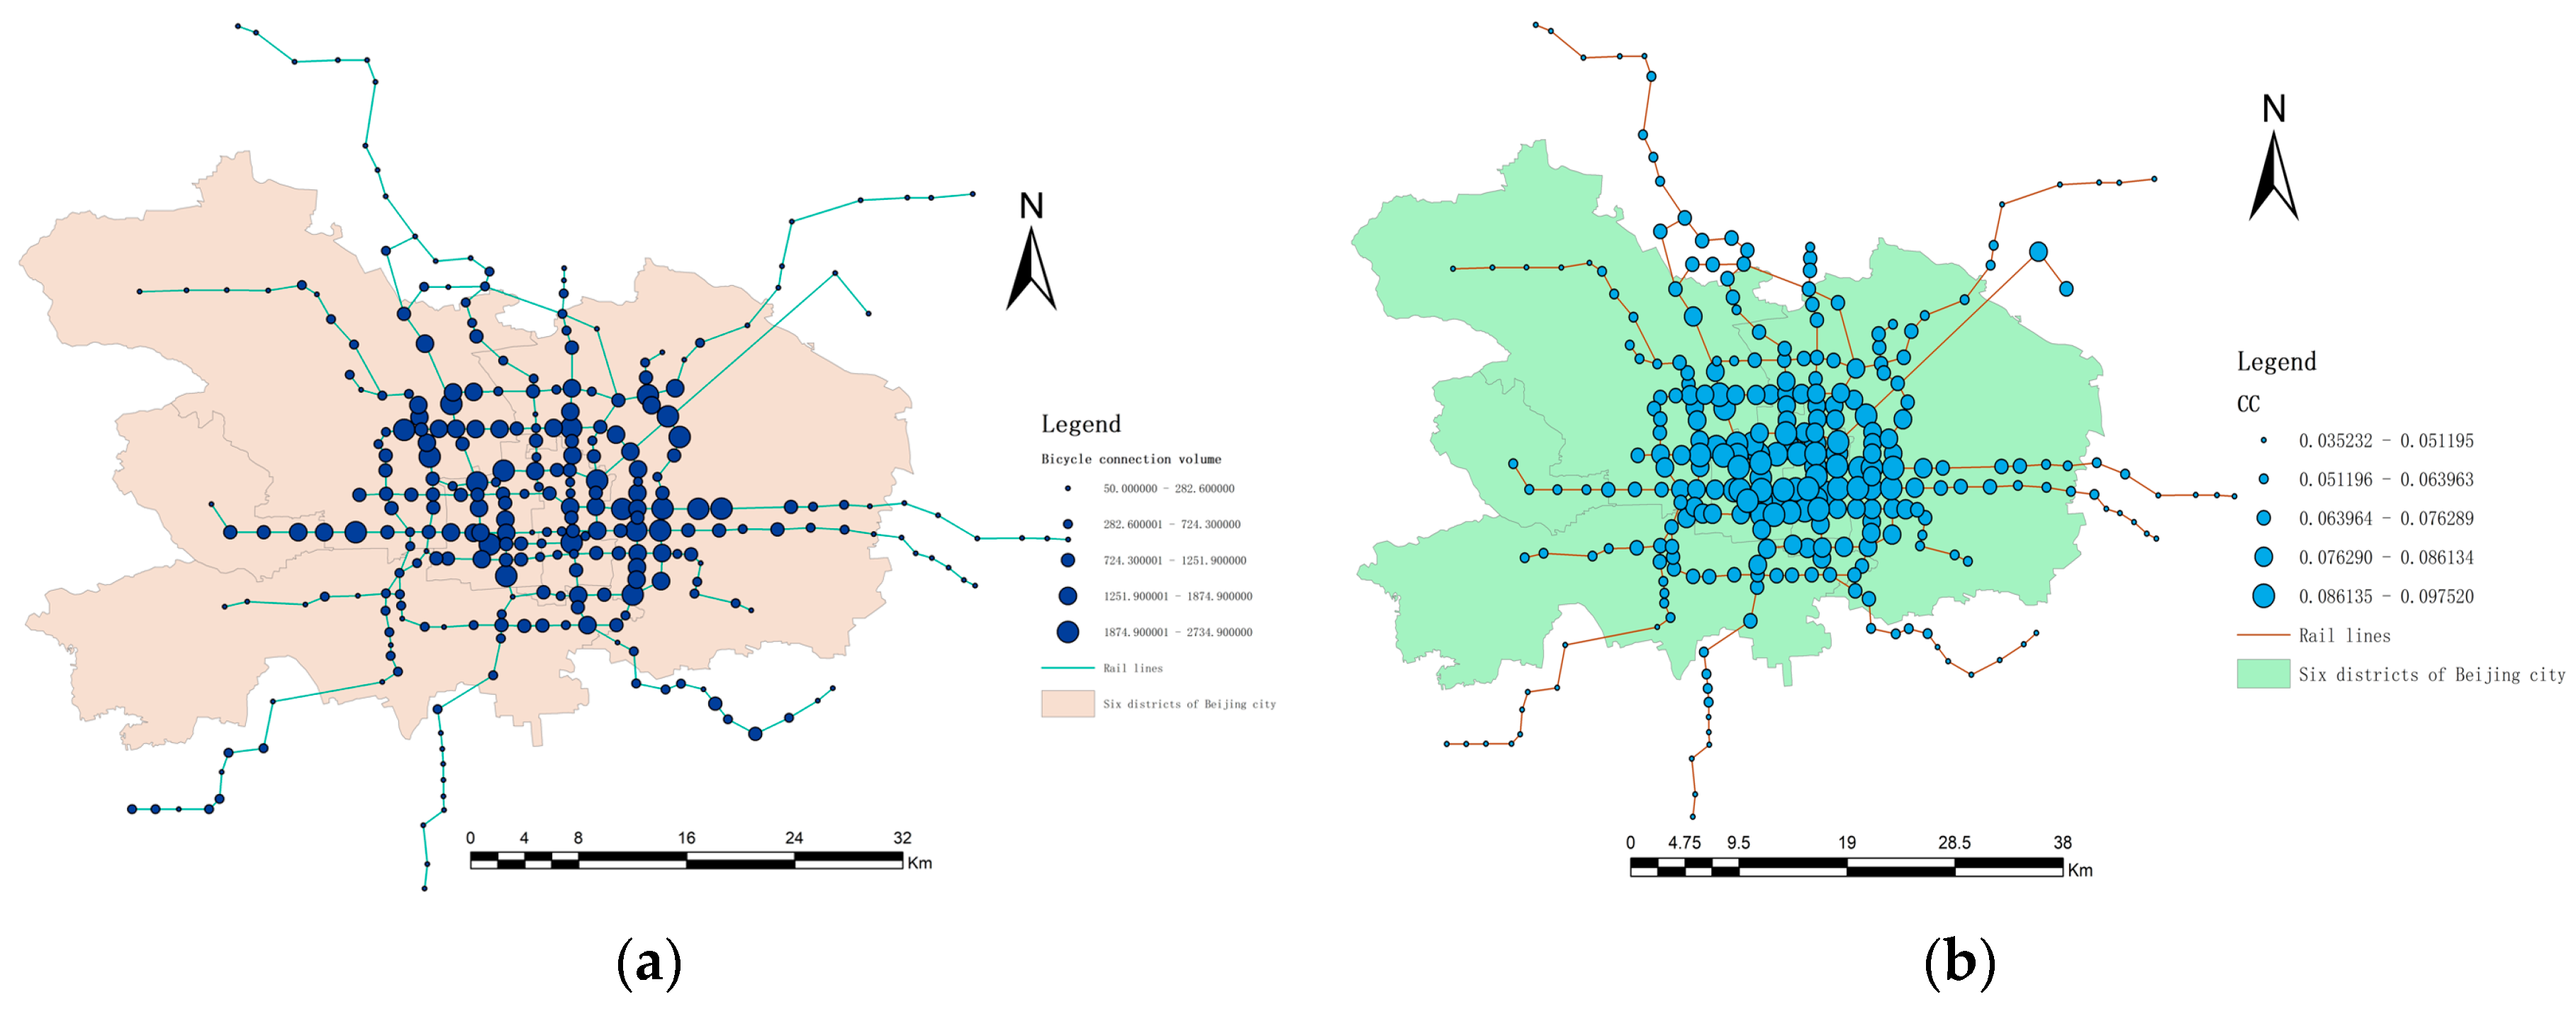
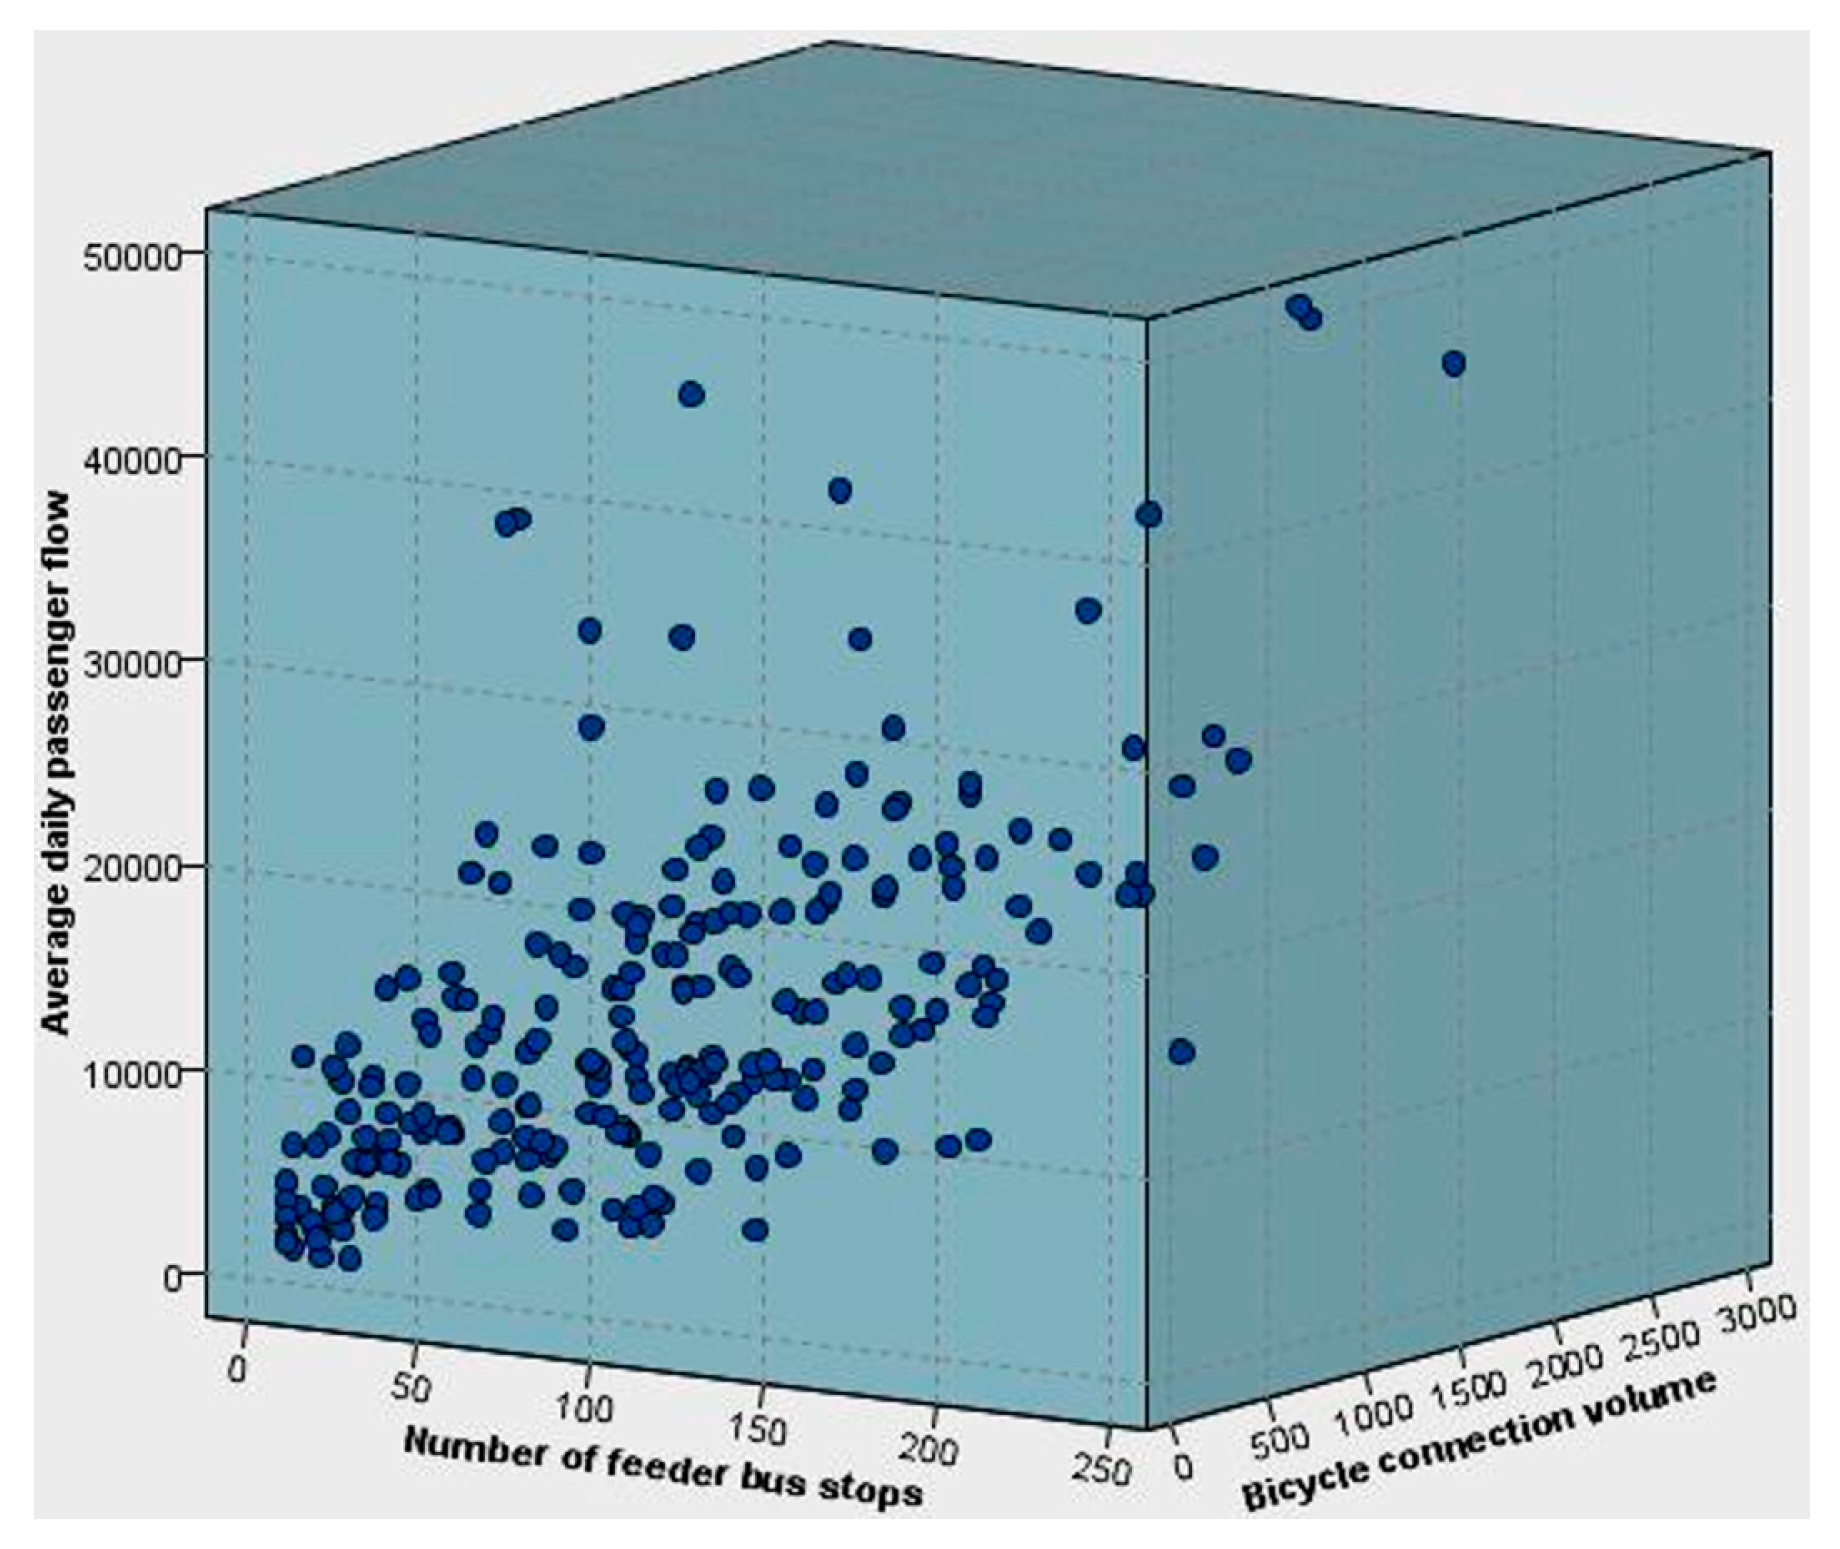
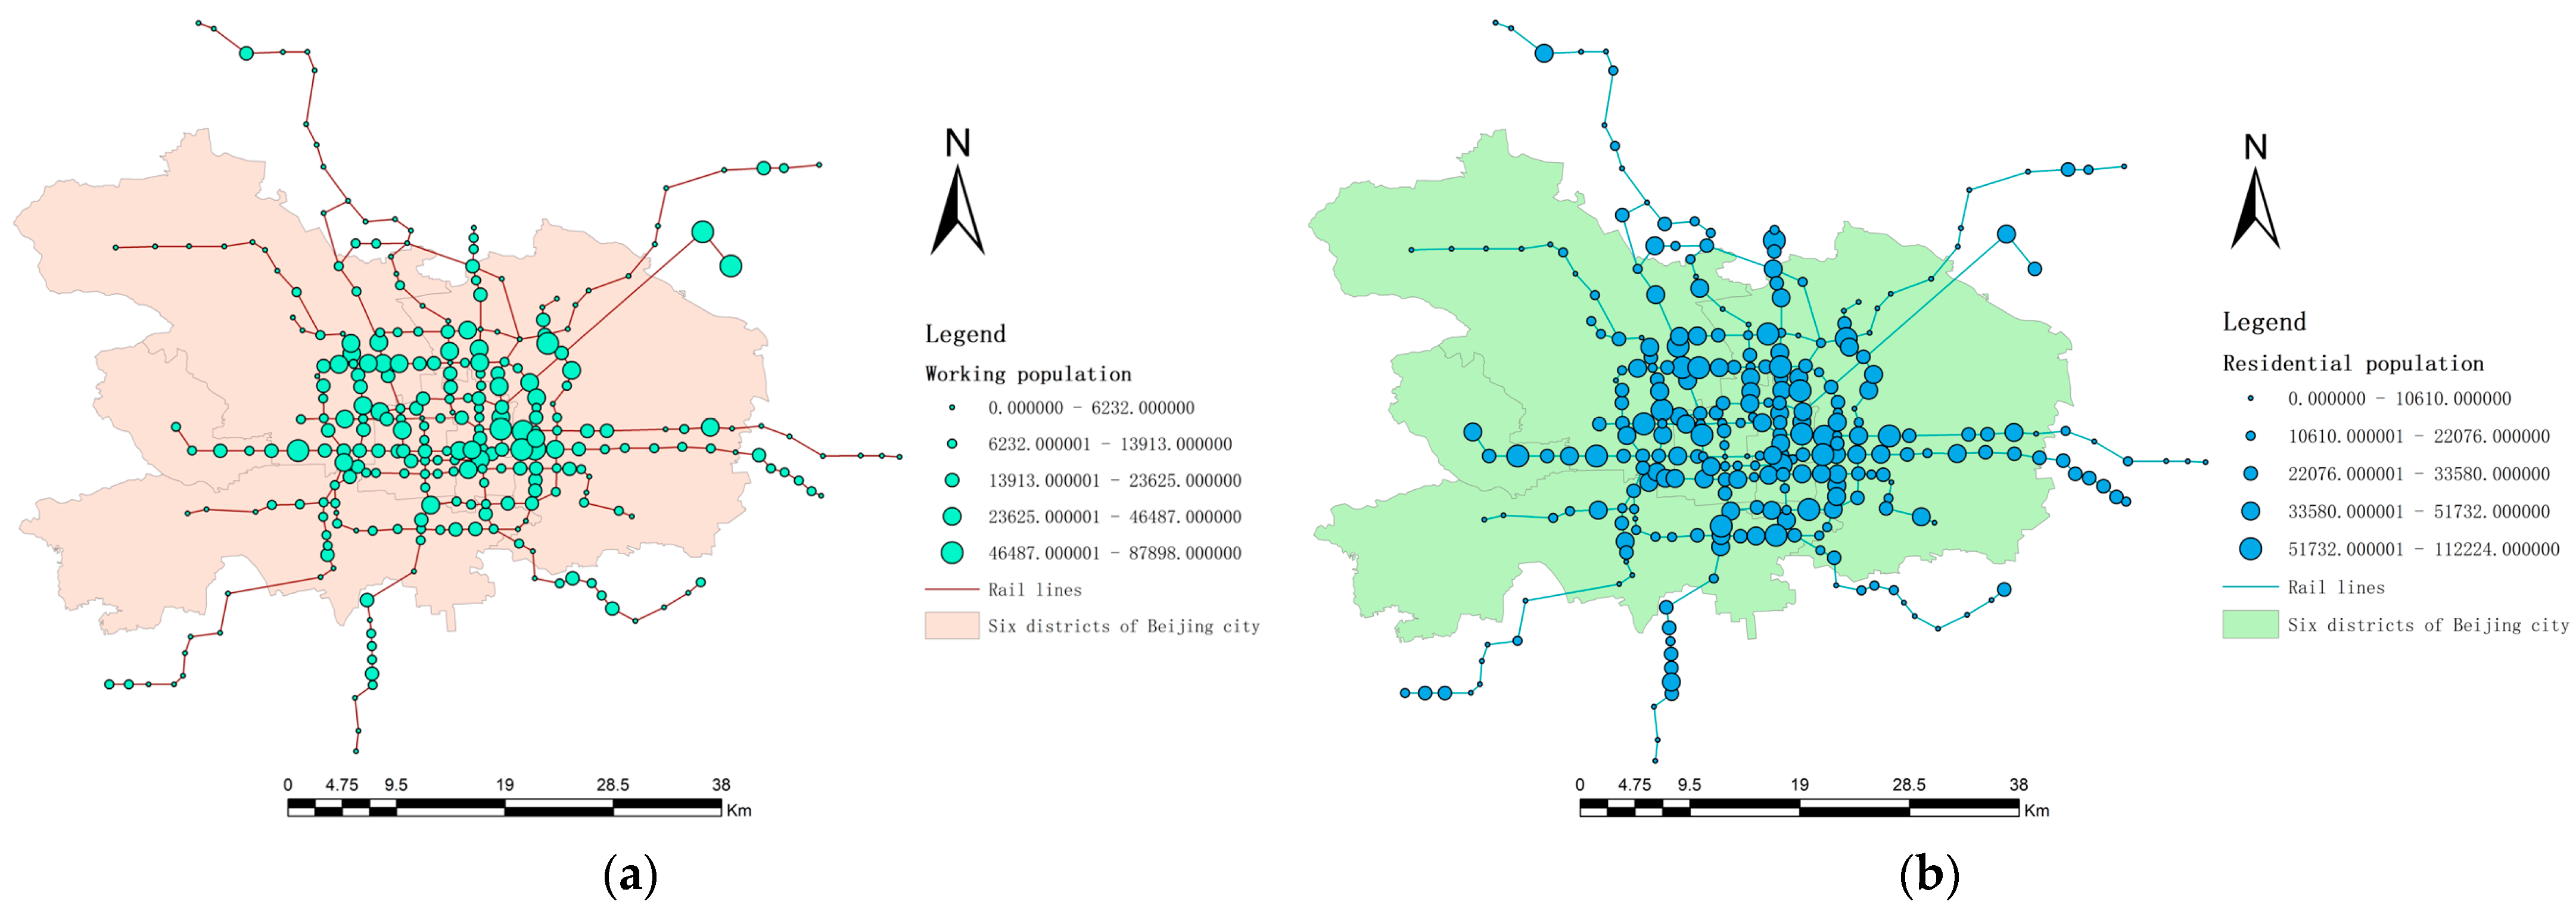
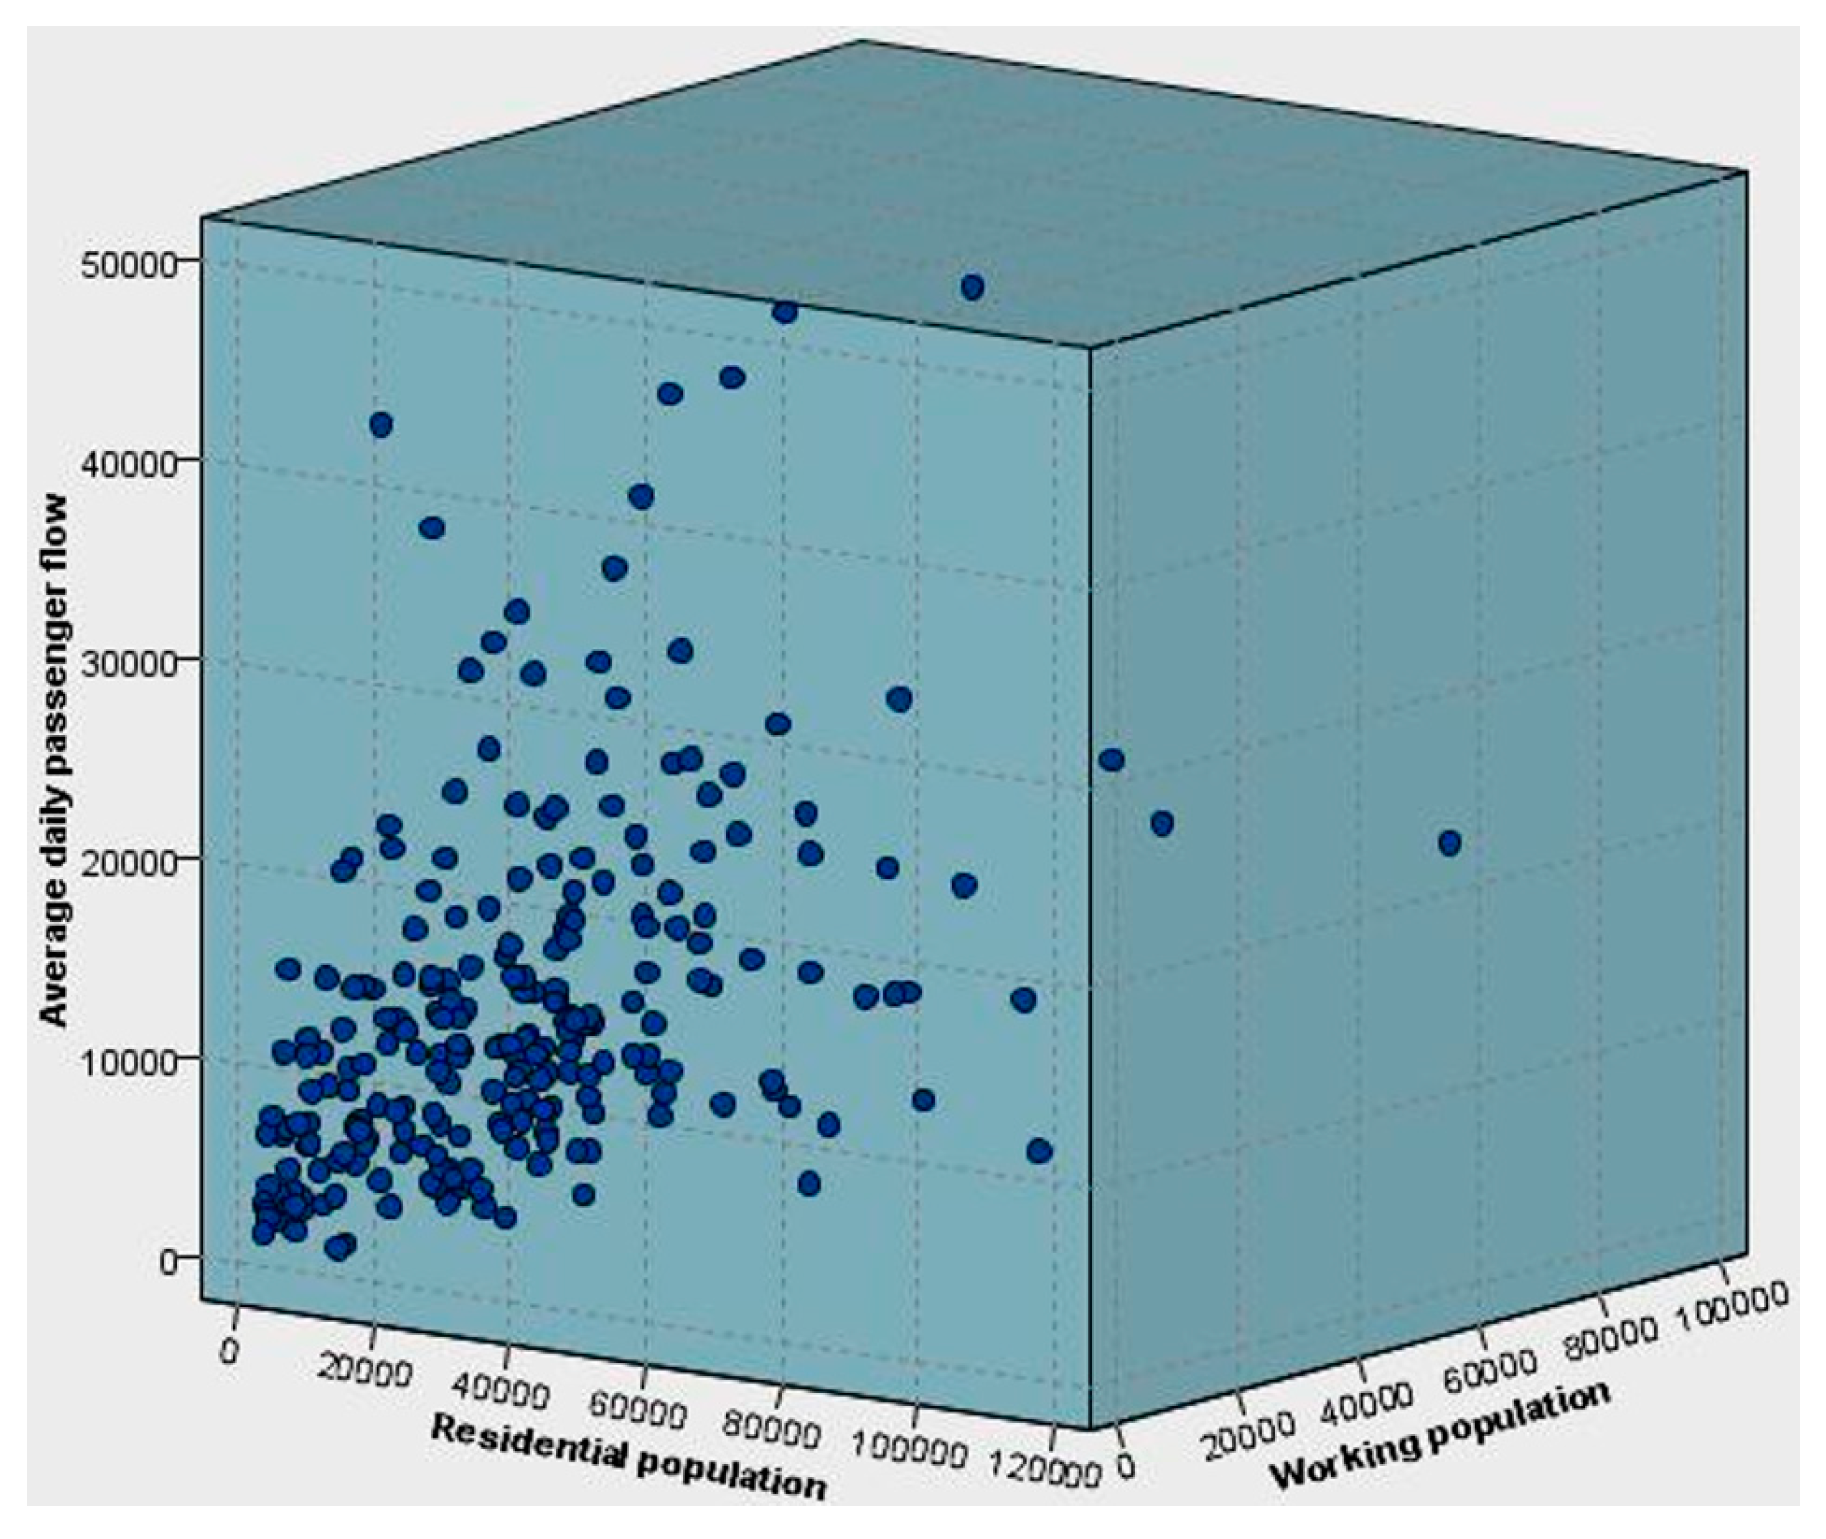
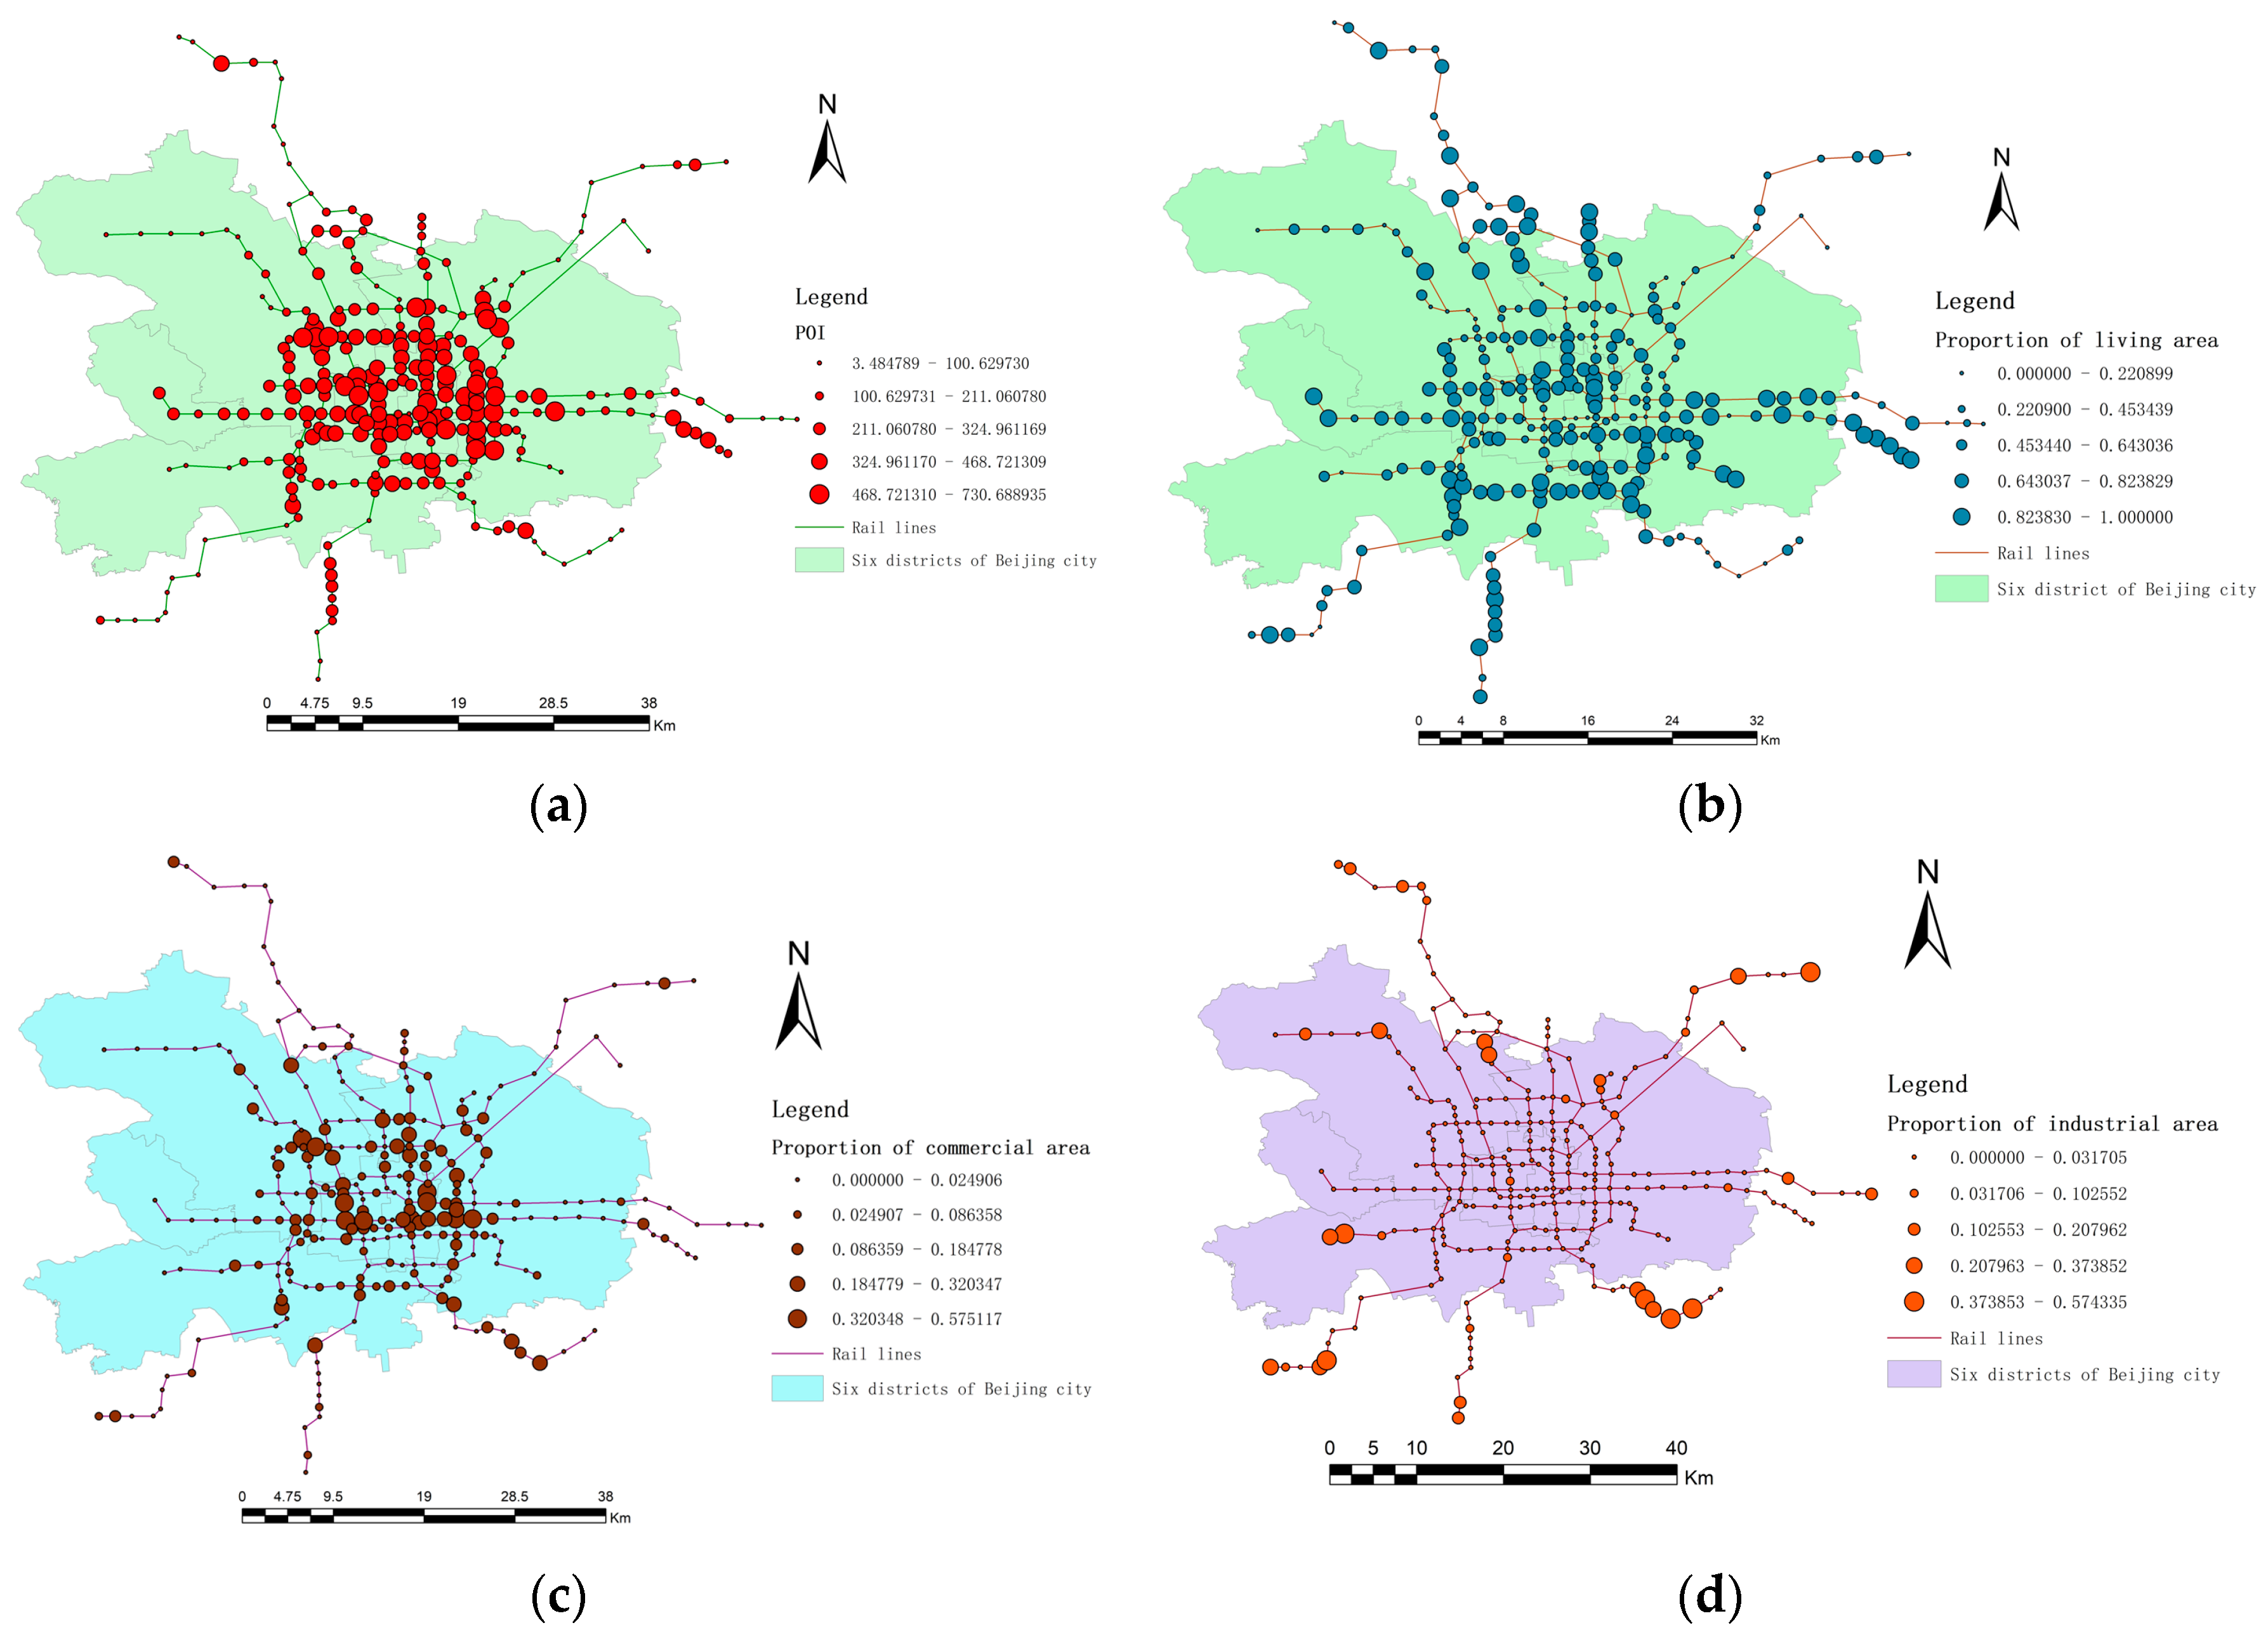
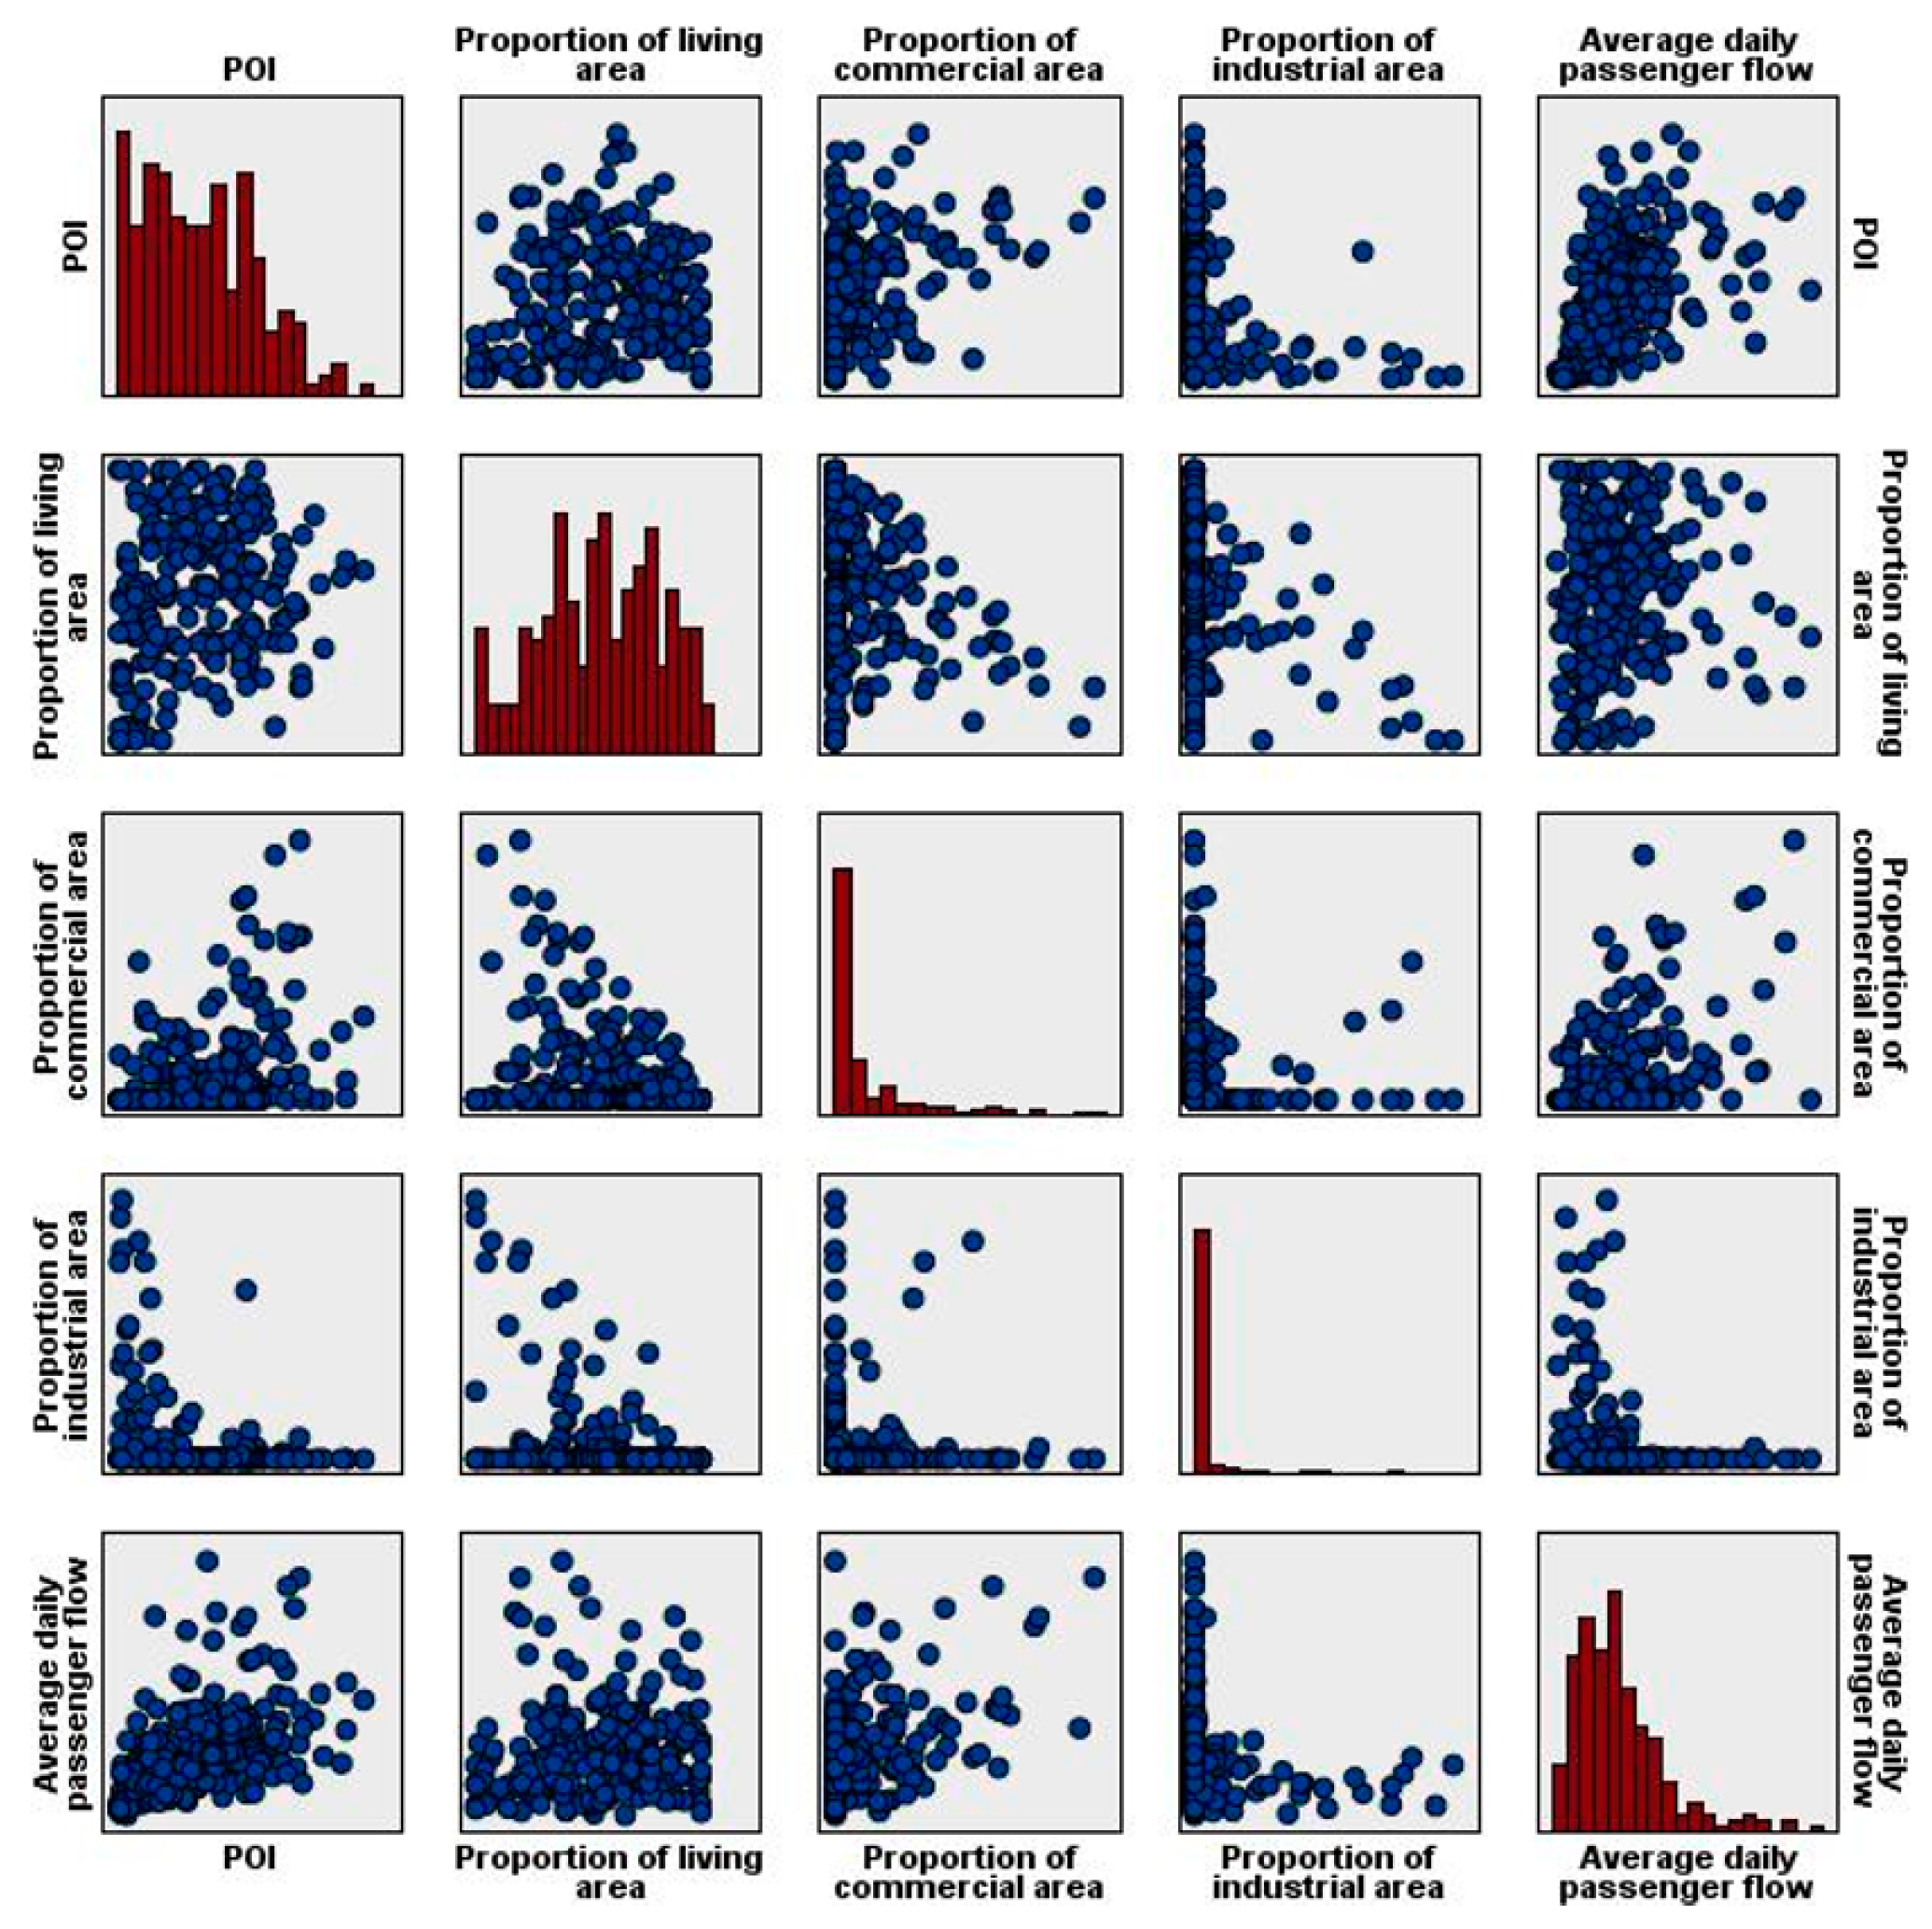
2.2. Distribution and Relevance of Influencing Factors

In order to better reflect the distribution size of each influencing factor in each station from the whole, ArcGIS was utilized to map each influencing factor and indicate the quantity by the size of the graded symbols; the larger the point, the larger the quantity of the factor. At the same time, the SPSS Modeler was used to establish three-dimensional diagrams and matrix diagrams to visualize and analyze the correlation between each influencing factor and passenger flow.
Connectivity properties. (1) Betweenness centrality (BC) [20,21] is usually measured in terms of the number of points and edges, and BC solves the global problem of planning the optimal distances between stations to make the entire metro network balanced. The centrality of the median reflects the connectivity performance of the station, as well as the importance of the station, which, in turn, affects the ease of transferring passengers at that station. The easier it is for passengers to transfer, the more they save on travel costs, which indirectly attracts a large number of passengers to the station. As shown in Figure 2a, the number of points on Line 6 and Line 4 located within the third ring road of the city center and Line 14 in the eastern Chaoyang District are larger, indicating that the connectivity of these stations is stronger.
(2) Cluster centrality (CC) [22,23] is usually measured by the clustering coefficient, which is expressed as the ratio of the actual number of edges of a node in the network with the surrounding nodes to the maximum of the theoretical number of edges, reflecting the degree of aggregation of the subway network sites and being more concerned with the local characteristics. The higher the clustering centrality, the more concentrated the stations in the area. There are a large number of building facilities in the area, shortening the distance from the station to the destination for passengers, providing convenience for travelers, and thus indirectly attracting a large number of passenger flows. As shown in Figure 2b, the number of points is larger in the stations on Line 1, Line 2, Line 4, Line 5, and Line 6, which are located within the second ring road of the city center, indicating that when the clustering coefficients of these stations are larger, the denser the stations are in the area.
After the new rail transit line is connected or the new station is built, the original network topology characteristics will be changed. Therefore, the topological characteristics have a long-term impact on the entire network structure, and as the structure continues to change, the convenience of passenger travel will also change. Figure 3 also shows that the closer to the city center, the greater the value. It shows that the rail transit stations in the center of Beijing bear a large amount of passenger flow, which is of great significance to the whole subway network. At the same time, it can be concluded in Figure 3 that the betweenness centrality and clustering centrality of the site are positively correlated with passenger flow.
Connection characteristics. (1) Bicycles available for connections: the advantages of low-carbon, convenient, and fast-shared bicycles have gradually become the main mode of transportation for residents’ short- and medium-distance travel. Usually, the threshold for walkers to reach the station is 15 min, and the walking connection range is 1.25 km at a speed of 5 km/h [24]. Deploying a large number of shared bicycles around the rail transit stations is a key measure to solve the last-mile problem of travelers. The larger the number of bicycle connections around the station, the more convenient it is for passengers to transfer, which attracts a large number of passengers to the station [25,26]. As shown in Figure 4a, the larger number of stations on Lines 2 and 4 in the western part of the second ring road of the city center, Lines 10 and 14 in the eastern and northeastern part of the fourth ring road, and Line 10 in the northwestern part of the city center, suggests that the larger amount of bicycle connections around the stations provide a convenient means of transferring passengers to their final destinations after exiting the station.
(2) Number of connecting bus stops. Buses, as a means of transportation for long distances, are the main mode of travel for travelers from rail stations to more remote areas. Due to Beijing’s special geographic location, even houses in the outer ring are still very expensive. However, there is still a large population that prefers to work in Beijing, so they settle in towns around Beijing, such as Yanjiao in Hebei Province. As shown in Figure 4b), the outer ring suburb area located in the eastern direction of the Batong Line has more bus connections compared to bicycle connections. This is due to the fact that this area is the transportation link between Beijing and Yanjiao town. Most travelers living in Yanjiao, Hebei Province, take the bus to Beijing every morning and then take the subway to their workplace. Similarly, the bus stops near Line 4 in the southern suburban area also provide efficient transfers for out-of-town travelers.
Figure 5 clearly shows that the number of connections around the stations within the third ring is the densest. Due to the large number of office areas in the center of Beijing, during the morning peak period, travelers take rail transit to their corresponding destination and then transfer the shared bicycle or bus to their final destination again, which effectively saves travel time. It can be seen in Figure 5 that the number of bicycle connections is positively correlated with the number of connecting bus stations and the average daily passenger flow of the subway. Shared bicycles and buses are the main modes of transportation for green travel at present, and their connection volume will affect the traffic volume of the site for a long time [27].
Population characteristics. (1) Working population: As shown in Figure 6a, the he closer to the center of Beijing, the higher the working population, and travelers take the subway to work in the daytime and take the subway to return to their residence in the evening, so it is the main source of rail transit passenger flow.
(2) Residential population: As shown in Figure 6b, the residential population in the inner ring of Beijing is relatively small compared to that in the outer ring of the city, and the residents living in the inner ring have a smaller range of activities and mainly move more during the peak hours, which has a smaller impact on rail transit passenger flow compared to the working population.
The flow of people near the rail transit station is the direct source of the station’s passenger flow, which is the most important link affecting the station’s passenger flow. As shown in Figure 7, the working population and the residential population show a positive correlation for the subway’s passenger flow. The long-term mobility of the population directly affects the planning and design of rail transit stations in the coming decades.
Attractive features. (1) POIs (Points of Interest): Hospitals, schools, restaurants, and entertainment buildings around the rail transit station can each be abstracted as a geographic entity point and as the main destination for most travelers. The higher the density value of these points, the greater the number of people attracted, which brings a large number of passengers to the nearby rail transit station [28]. As shown in Figure 8a, stations located within the fourth ring road of the city center have relatively large POI values in their vicinity. This is also due to the fact that there are more people in the area who are engaged in different activities, such as working, going to school, going to the doctor, and having fun, which stimulates the development of local infrastructure, and, conversely, these facilities stimulate a large number of people to travel to these areas.
(2) Percentage of residential area: The larger the residential area around a rail transit station, the larger the population, and the larger the number of residents, the more urban residents go to the rail transit station on foot or by bicycle, which brings a large number of passengers to the station.
(3) Commercial area ratio: Commercial facilities are also mainly concentrated in the city center. The larger the area of the commercial area around the rail transit station, the greater the attraction of passenger traffic, thus attracting a large number of passengers to the station. As shown in Figure 8c, the number of commercial areas near the stations located in the southwest of the city center on Line 2, Line 4, the southeast of Line 2, Line 10, the northwest of Line 10, and the outer ring of Yizhuang Line is larger, and thus the passenger flow near the stations will be relatively larger.
(4) The proportion of industrial area: Due to the special characteristics of industrial facilities, most of the industrial buildings in Beijing are distributed in the Outer Ring Road, and these industrial areas have a certain working population, and most of the staff will choose rail transportation as the main mode of travel, which also brings a certain amount of passenger flow to the nearby stations.
As can be seen in Figure 9, the POI density value around the station has a greater impact on the metro passenger flow, showing a strong positive correlation. The correlation between commercial area ratio, residential area ratio, and passenger flow is weak. The ratio of industrial area does not show a linear correlation with metro passenger flow. Usually, building facilities will remain for a long time without special circumstances, but commercial buildings may close down at any time, which generates irregularity in population flow. The industrial buildings are located in the outer ring suburbs and other areas, the population is small, and the correlation with the passenger flow of rail transit is not strong. The pre-planning of rail transit lines and stations is mainly based on whether or not the nearby buildings and facilities will bring a large number of passengers to the station. Therefore, building facilities have a long-term effect on the passenger flow of rail transit.

3. Research Methods and Model Construction

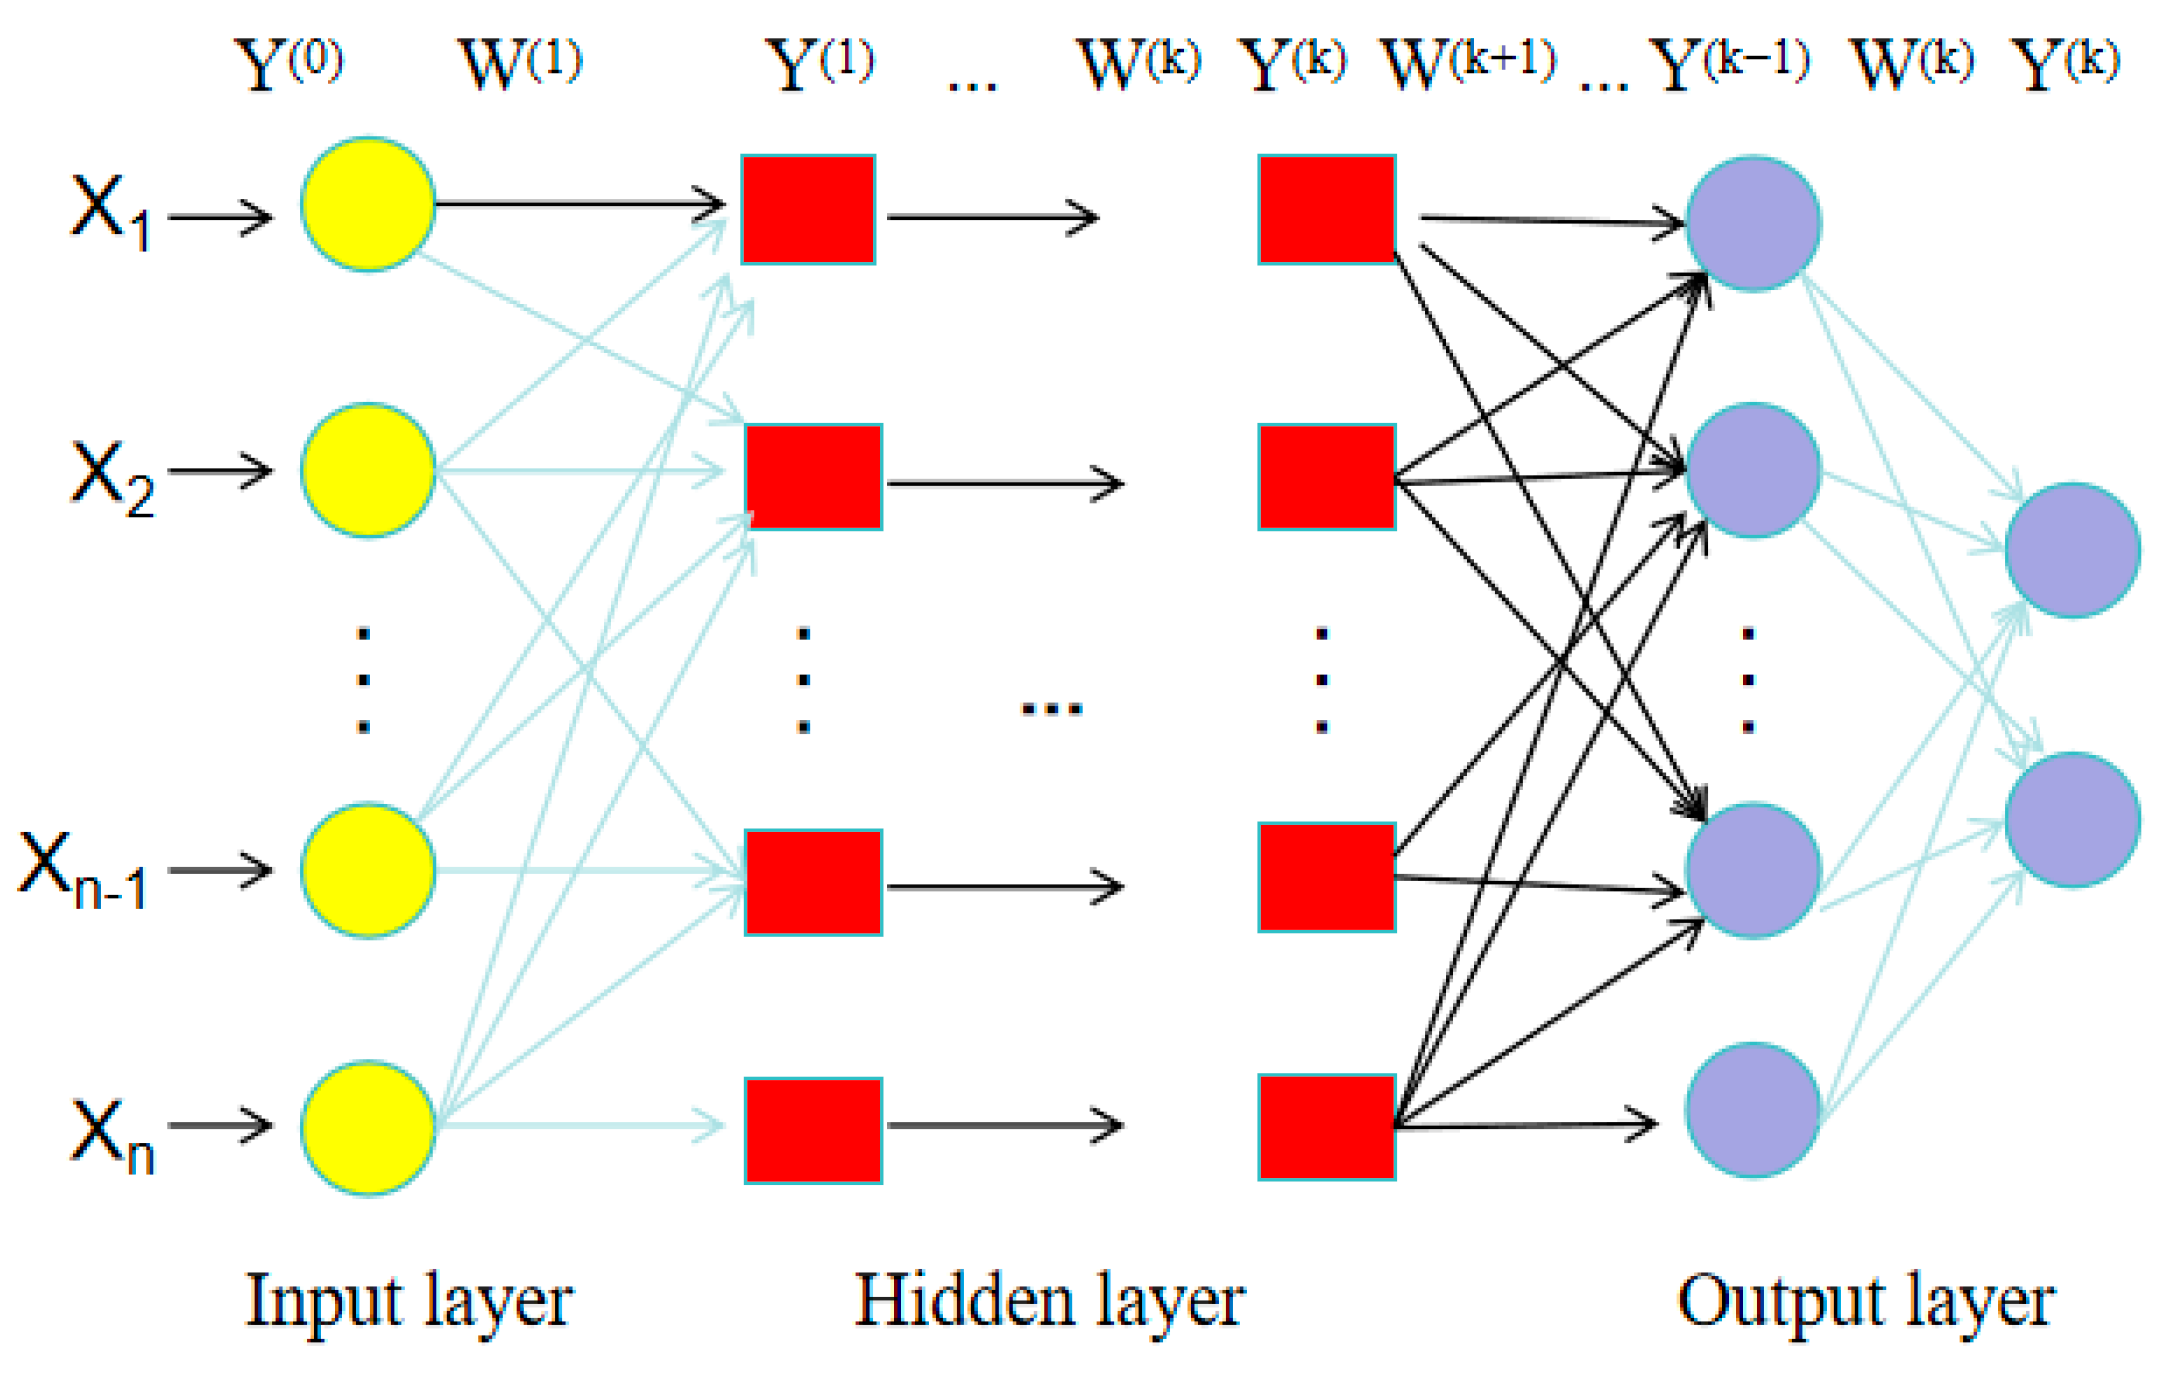
3.1. Research Method

The power of an artificial neural network is that it has a strong learning capability. After obtaining a training set, it can extract the features of each part of the observed thing by learning, connect the features to each other with different network nodes, and change the strength of each connection by training the network weights of the connections until the output of the top layer obtains the correct answer [29,30]. Its structure is shown in Figure 10.
Each neuron in the input layer represents an influencing factor, and the data corresponding to these factors are built into the matrix Y = ( X 1 , X 2 , X 3 , X 4 . ) k , which is input into the neural network-like model, assuming that the number of layers of the neural network is K (k > 1) and the number of nodes in each layer from the input layer to the output layer is m 0 , m 1 , m 2 , m 3 , . m k , respectively. The dimension of the input vector is m 0 , the output vector is m k , and the output vectors for each layer of the network are, respectively, denoted as follows:
Input   layer   Y ( 0 ) = [ Y 1 ( 0 ) , Y 2 ( 0 ) , . , Y m 0 ( 0 ) ] T   a = 1
Hidden   layer   Y ( 1 ) = [ Y 1 ( 1 ) , Y 2 ( 1 ) , . , Y m 1 ( 1 ) ] T   a = 1
Hidden   layer   2   Y ( 2 ) = [ Y 1 ( 2 ) , Y 2 ( 2 ) , . , Y m 2 ( 2 ) ] T
Output   layer   Y ( K ) = [ Y 1 ( K ) , Y 2 ( K ) , . , Y m k ( K ) ] T
After that, define the weight matrix with a bias vector for each layer.
W ( 1 ) R m 1 × m 0   b ( 1 ) R m 1 × 1
W ( 2 ) R m 2 × m 1   b ( 2 ) R m 2 × 1
W ( K ) R m k × m K 1   b ( K ) R m K × 1
Choose the activation function for each layer; common activation functions are Sigmoid, Tanh, Relu, etc., and keep the function consistent for each layer. Finally, derive the common expression for all layers, except the output layer, for the Kth layer.
n e t i ( k ) = j = 1 m k 1 W i , j ( k ) Y j ( k 1 ) + b i ( k ) , ( 1 i m k )
n e t ( k ) = W ( k ) Y ( k 1 ) + b ( k )
n e t ( k ) = [ n e t 1 ( k ) , n e t 2 ( k ) , . , n e t m k ( k ) ] T
Y ( k ) = f ( k ) ( n e t ( k ) ) = [ Y 1 ( k ) , Y 2 ( k ) , . , Y m k ( k ) ] T

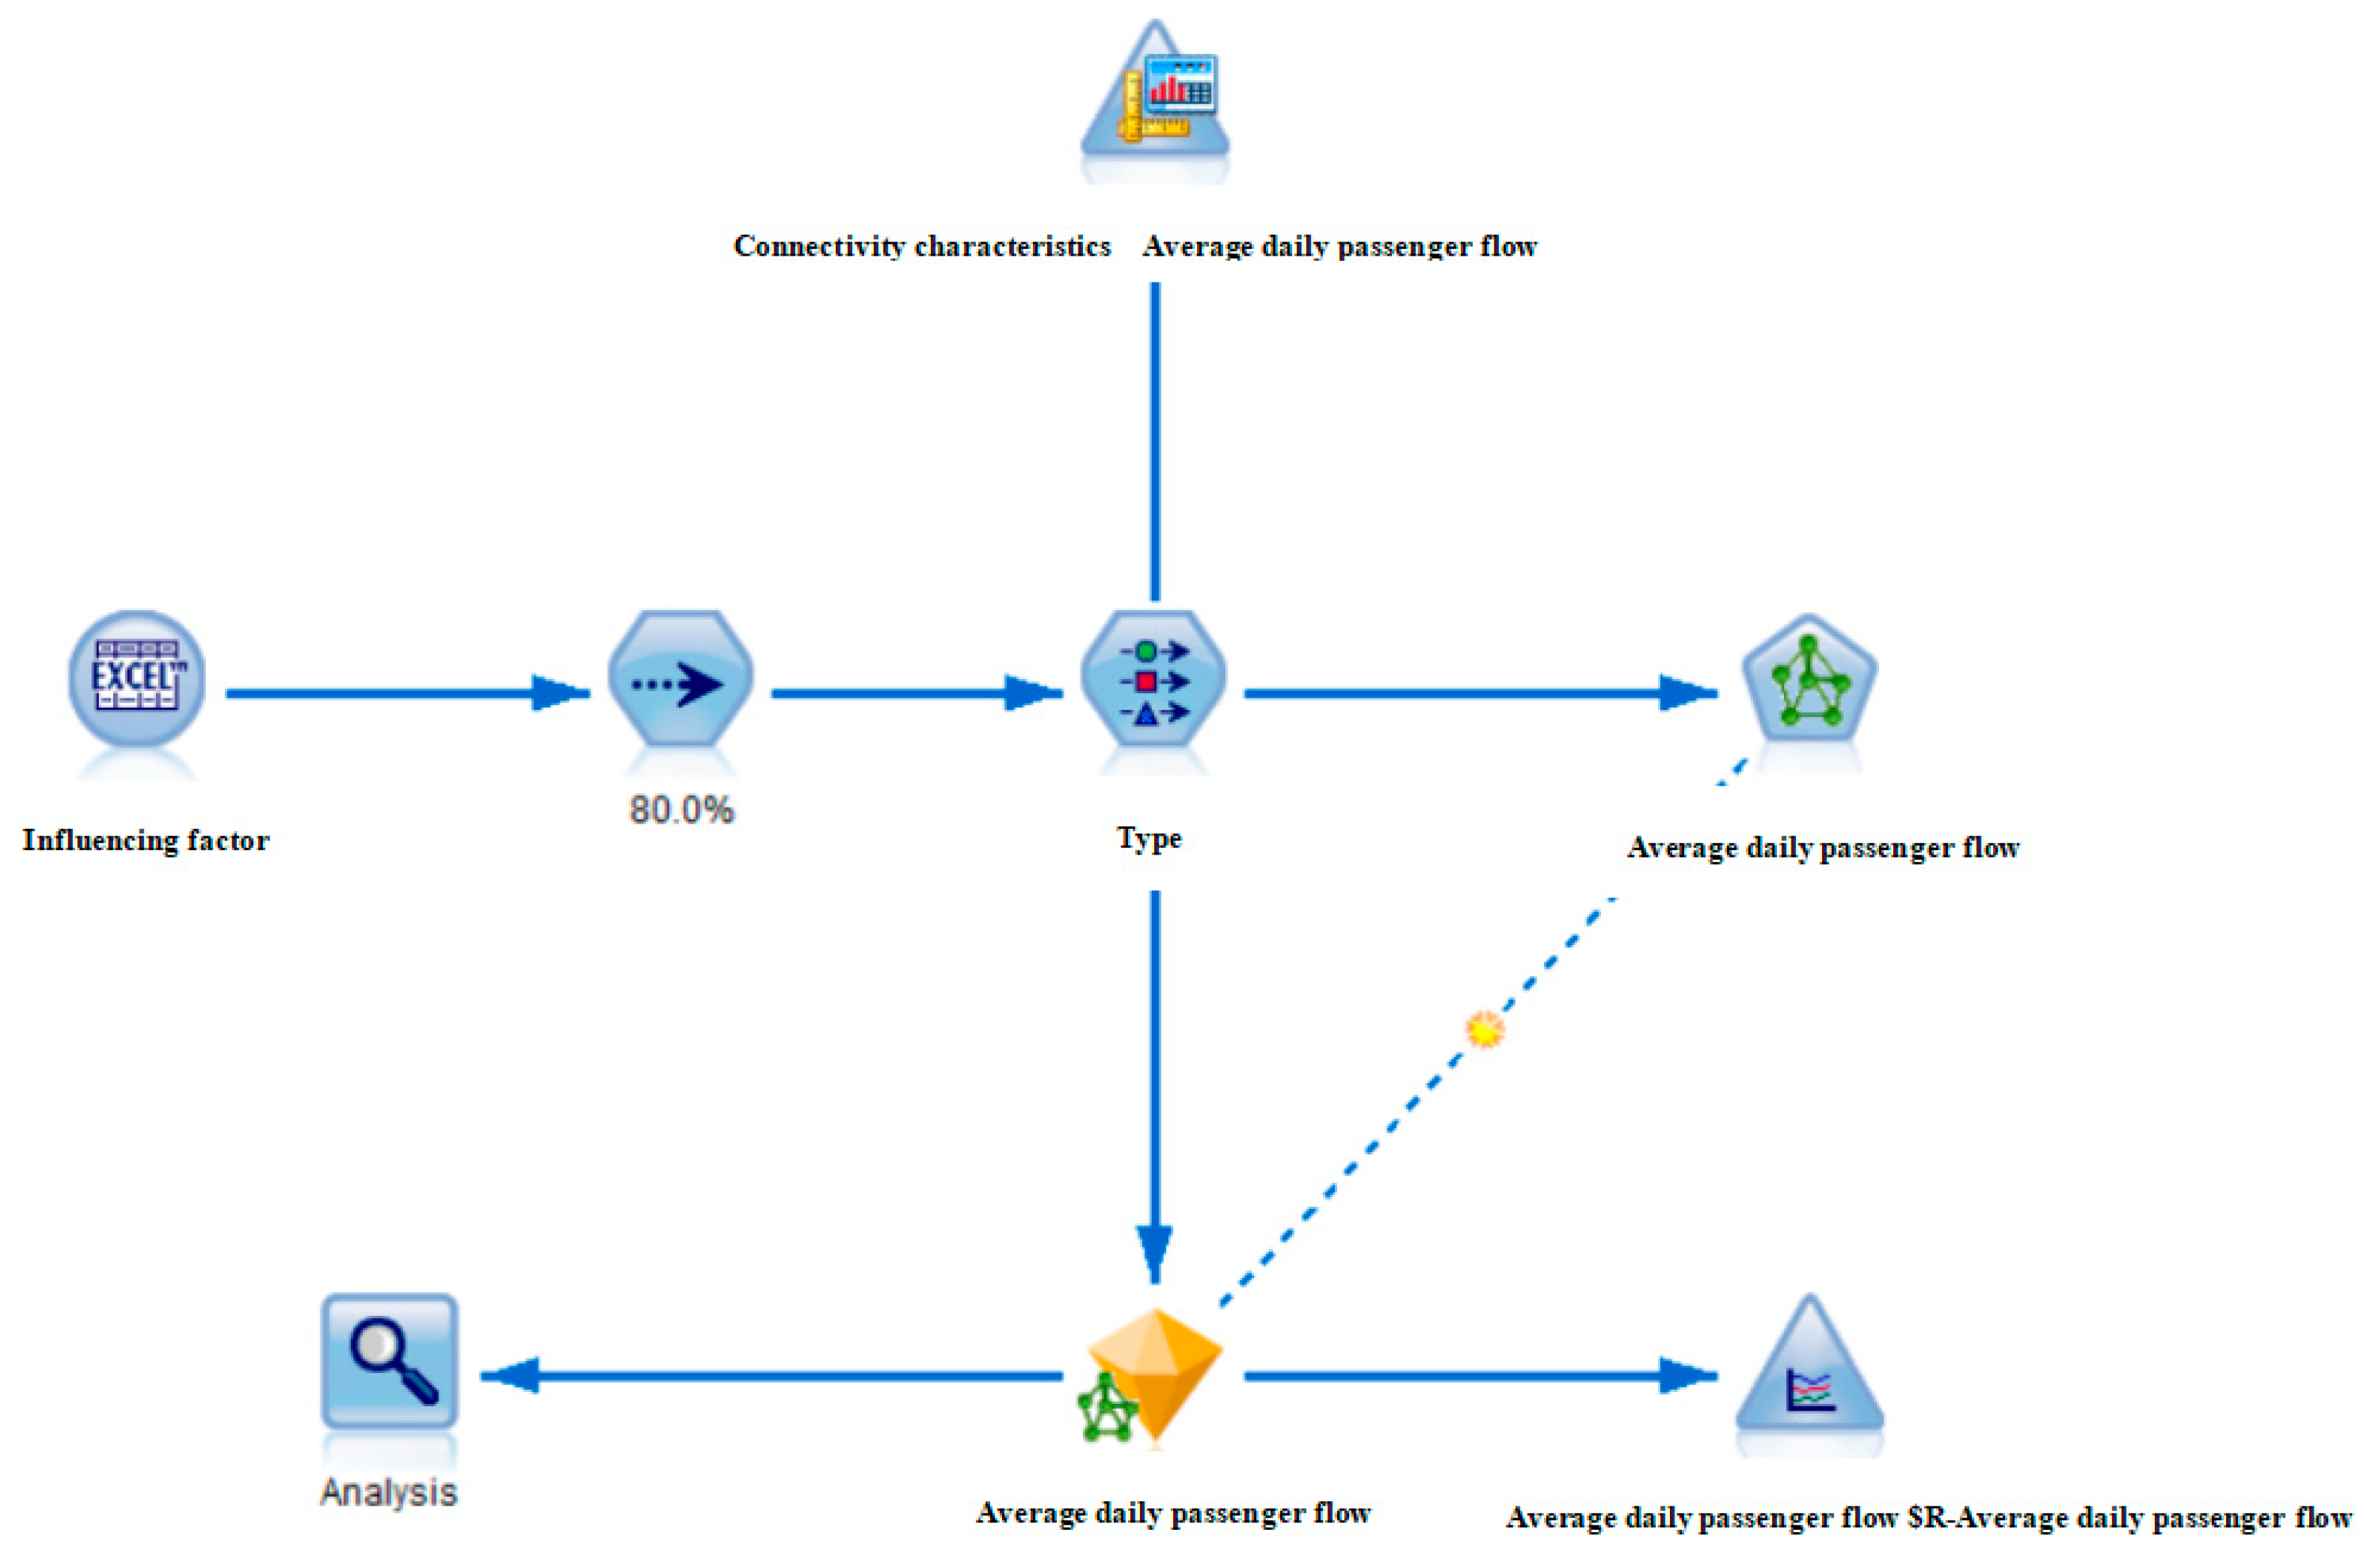
3.2. Model Construction

The SPSS Modeler 18.0 (Statistical Product and Service Solutions Modeler) is a data mining work platform, and this paper relies on this platform for model construction. The modeling idea is to import the source file data first, randomly select 80% of the data as training samples, and then establish the field types of the influencing factors. Use ten-factor variables as input fields, the average daily passenger flow as the target field, and then select the class of neural network models used, and then, finally, the target passenger flow prediction results are visualized with multi-curve graphs and predictive analysis as the visualization output. At the same time, in order to visualize and analyze the relationship between the influencing factors and the passenger flow, the Graph tab selects the graphical version of the node, and the visualization type selects the 3D scatterplot and scatterplot matrix (SPLOM). From the idea of building the model as in Figure 11, in the construction tab of the neural network-like model node, the boosting algorithm in the objective is selected to enhance the accuracy of the model, thus creating a whole, from which a sequence of models is generated to obtain more accurate predictions. Afterwards, after continuous comparison and adjustment, the network model is selected for the multilayer perceptron, and the number of hidden layers is automatically calculated by the SPSS Modeler for the number of cells. The stopping rule applied for the multilayer perceptron was chosen to use a maximum training time of 15 min. In the overall tab, the default merge rule used for continuous targets is the mean and the number of component models used for boosting is 25. Finally, in the advanced tab, missing values in the predictor variables are selected to be deleted in columns and, finally, random seeds are generated.

4. Result

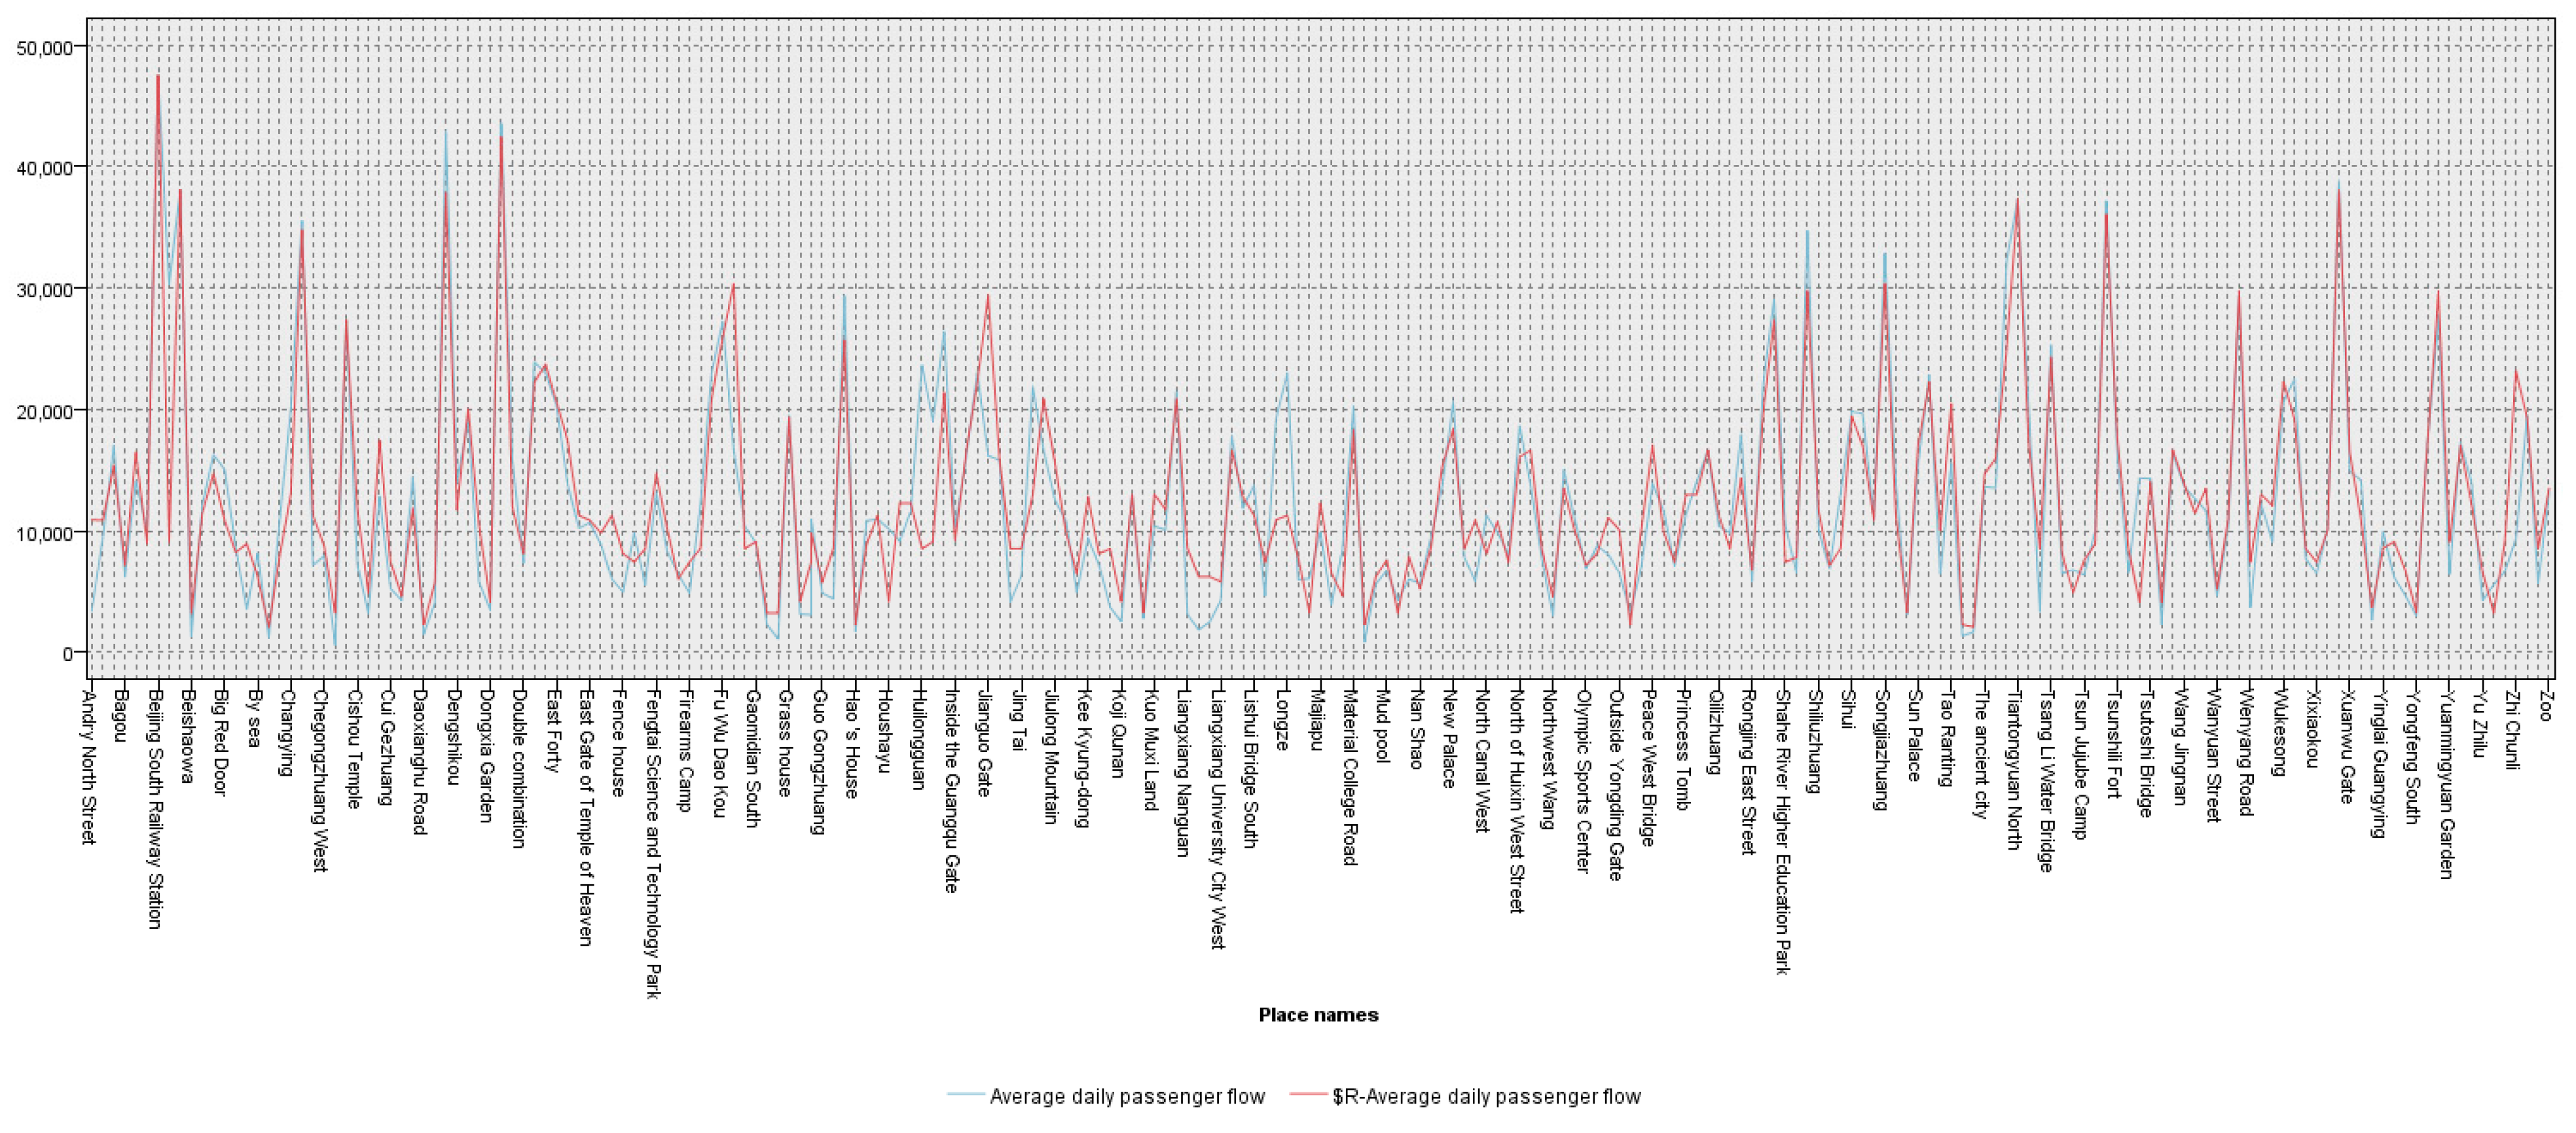
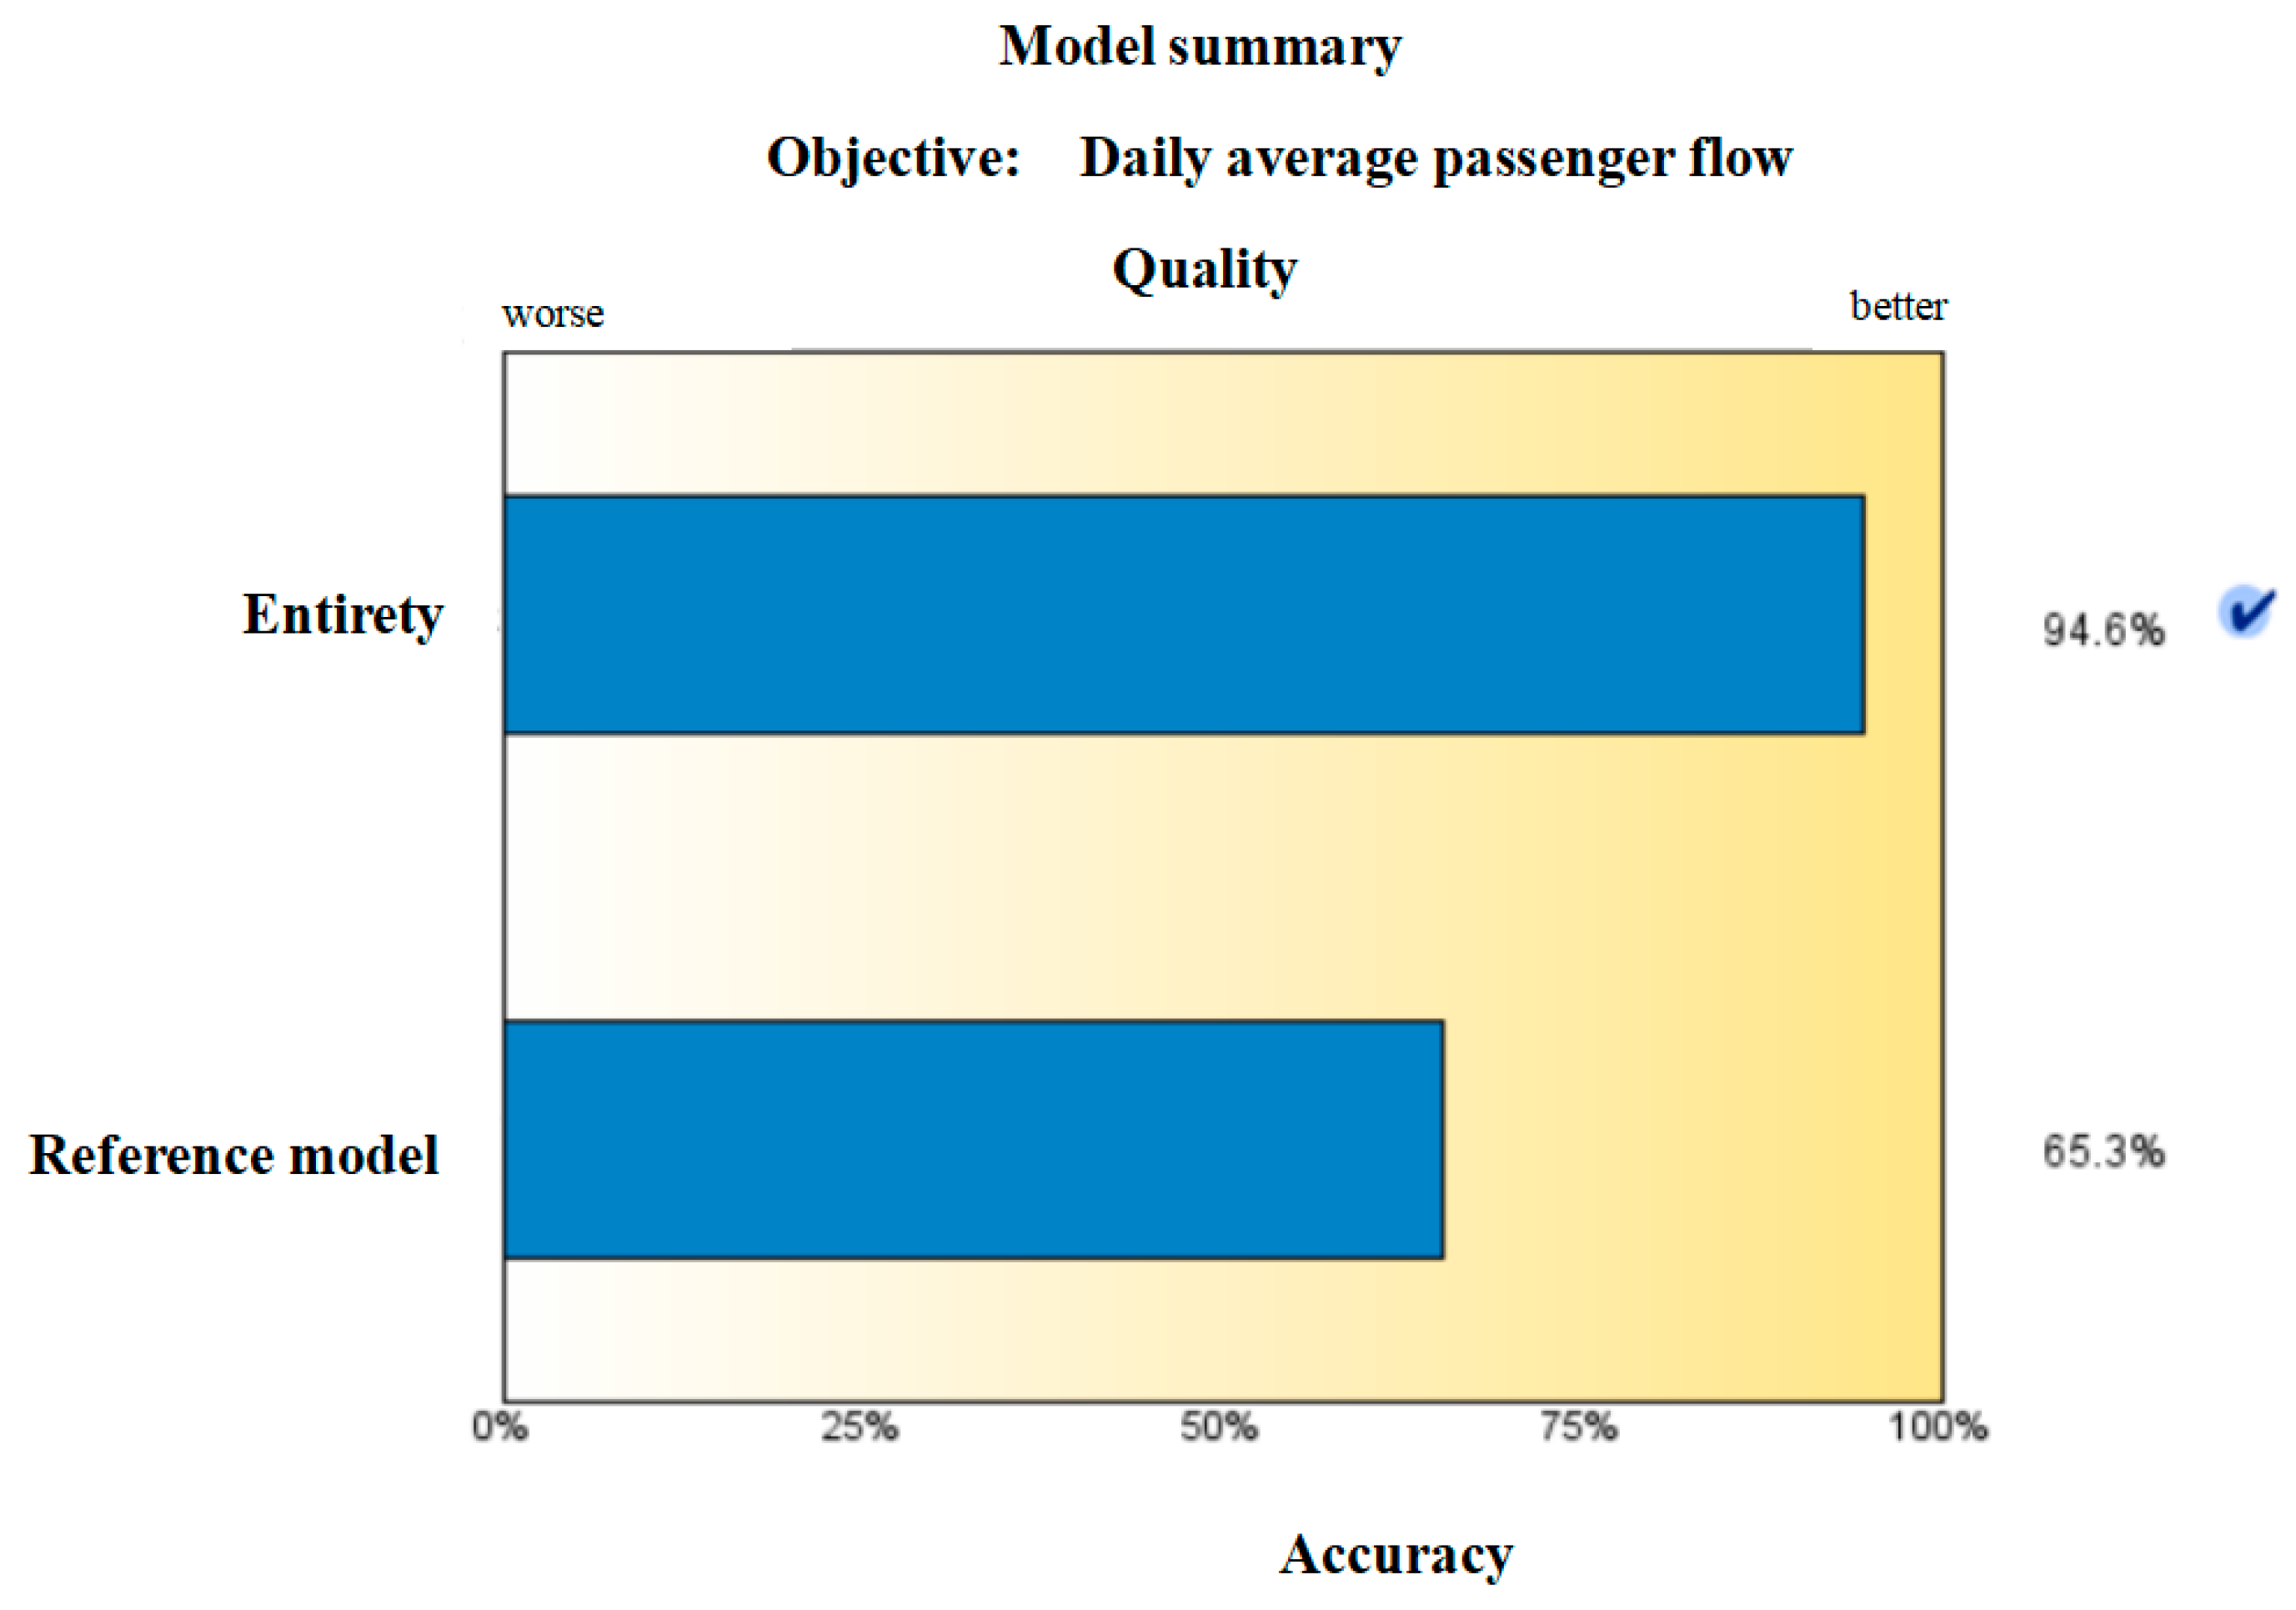
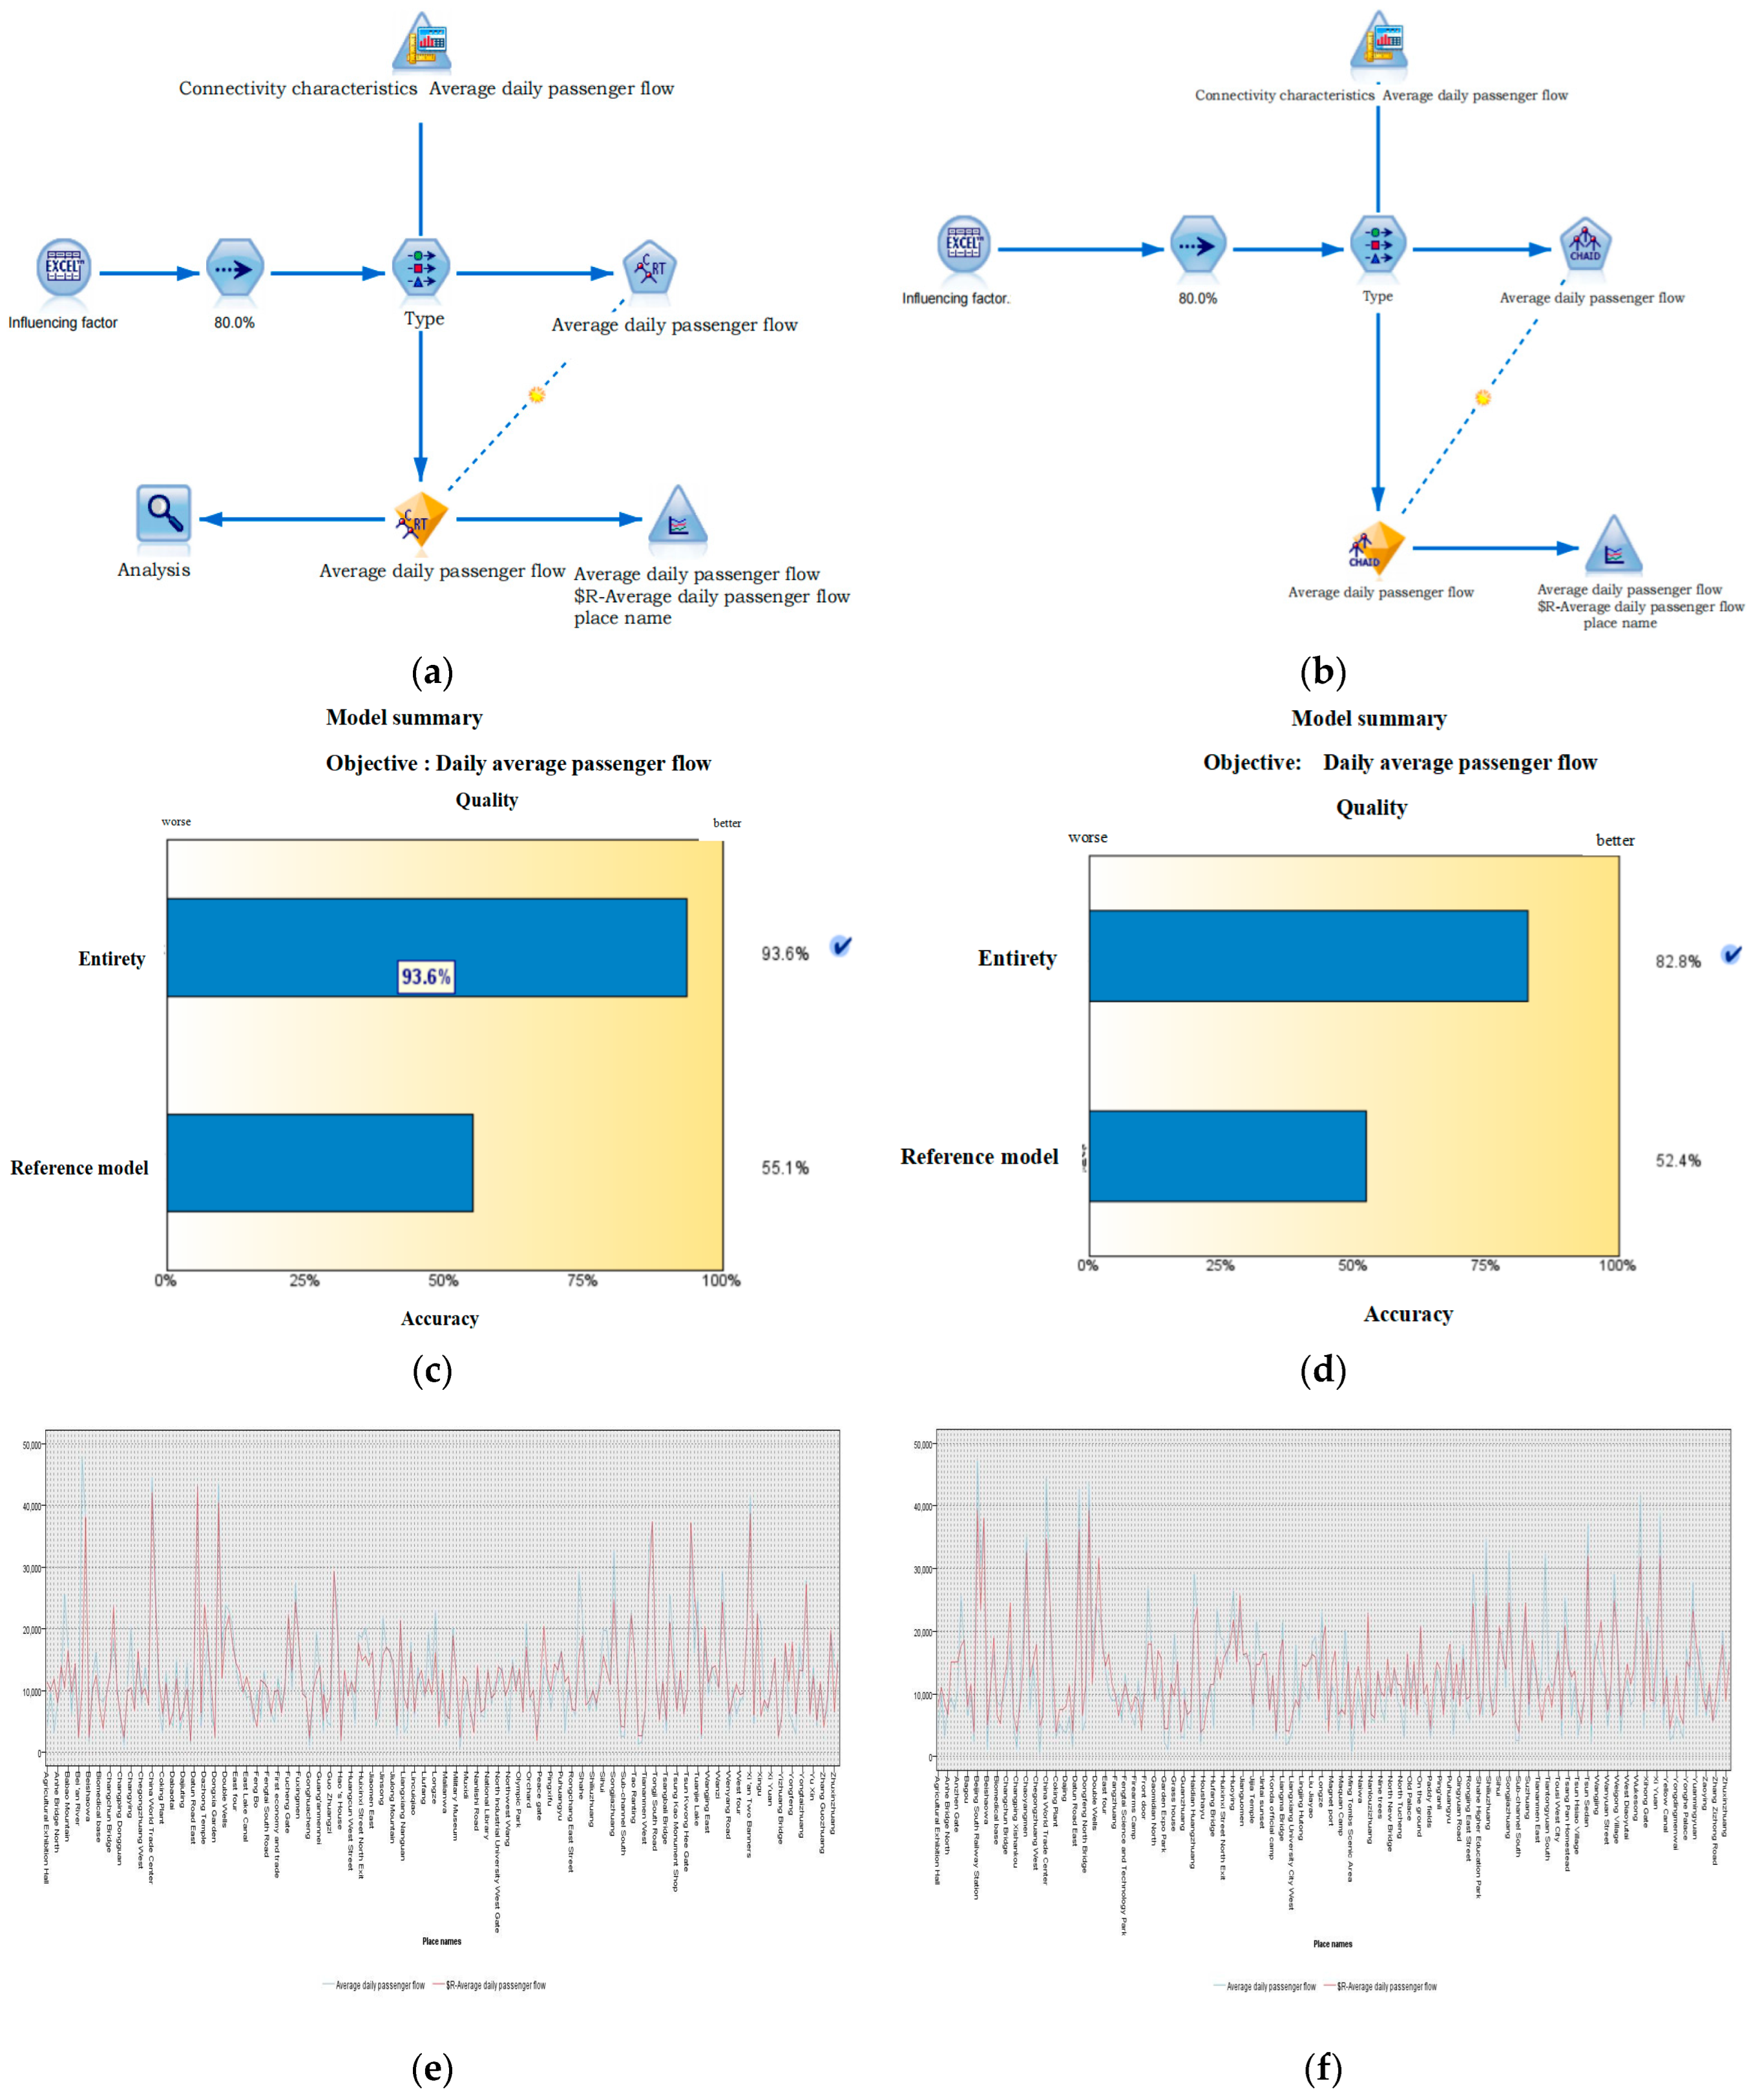
4.1. Model Validation

In order to verify the applicability of the software model to the data set, the remaining 20% of the data are used as the basis for model validation, i.e., the predicted results are compared with the actual results, with the blue curve representing the actual value of the average daily flow and the red curve representing the predicted value of the average daily flow, as shown in Figure 12. In order to improve the prediction accuracy, a whole was created using the boosting algorithm and a sequence of models was generated by it for prediction. And compared to the standard reference model, the model sequence has a higher prediction accuracy although it takes longer to construct and score. For the goal of continuity of daily average passenger flow, accuracy is defined as the ratio of 1 minus the average absolute error in prediction (absolute mean of predicted value minus observed value) to the range of predicted value (maximum predicted value minus minimum predicted value), and the overall accuracy of daily average passenger flow obtained from the model summary is 94.6%, as shown in Figure 13.

4.2. Comparison of Prediction Models

Previously, some researchers used the CART regression tree to analyze the influence factors of subway passenger flow, but the results were not very good. Meanwhile, in order to maintain the uniformity of the model results, this paper chooses the CART tree model and the Chaid tree model in SPSS Modeler software 18.0 to predict the same data set. The idea of model construction is similar to the class neural network, as shown in Figure 14a,b.
For the CART regression tree, 80% of the data are still randomly selected as the training set and the remaining 20% as the test set. In this model’s node attributes, the main goal is to enhance the model’s accuracy by using boosting algorithm and a sequence of models was generated. Although it requires a longer training time, the enhancement method can significantly improve the accuracy of the decision tree model. After continuously adjusting the parameters, the maximum tree depth is chosen to be 16, pruned trees are selected to prevent data overfitting, and, finally, random seeds are clicked to be generated. The prediction accuracy of the final model output and the comparison curves with the actual results are plotted in Figure 14c,e.
For the Chaid tree model, the training set and test set division of the data remain the same as the other two. In the node attributes of this model, enhancement of model accuracy is still chosen as the main goal. The tree growth algorithm is chosen to be exhaustively Chaid, and the maximum tree depth is customized to be 17. Due to the small sample size in this paper and for continuous targets, the method specified for calculating the chi-square statistic is the likelihood ratio. Finally, click Generate Random Seeds. The prediction accuracy of the model output and the comparison curve with the actual results are plotted in Figure 14d,f.
After comparing the model prediction results, the prediction accuracy of the CART tree model is 93.6%, and the prediction accuracy of the Chaid tree model is 82.8%, which indicates that the neural network-like model is significantly better than the other three models, and it can be better applied to long-term passenger flow prediction of rail transit stations in this study.

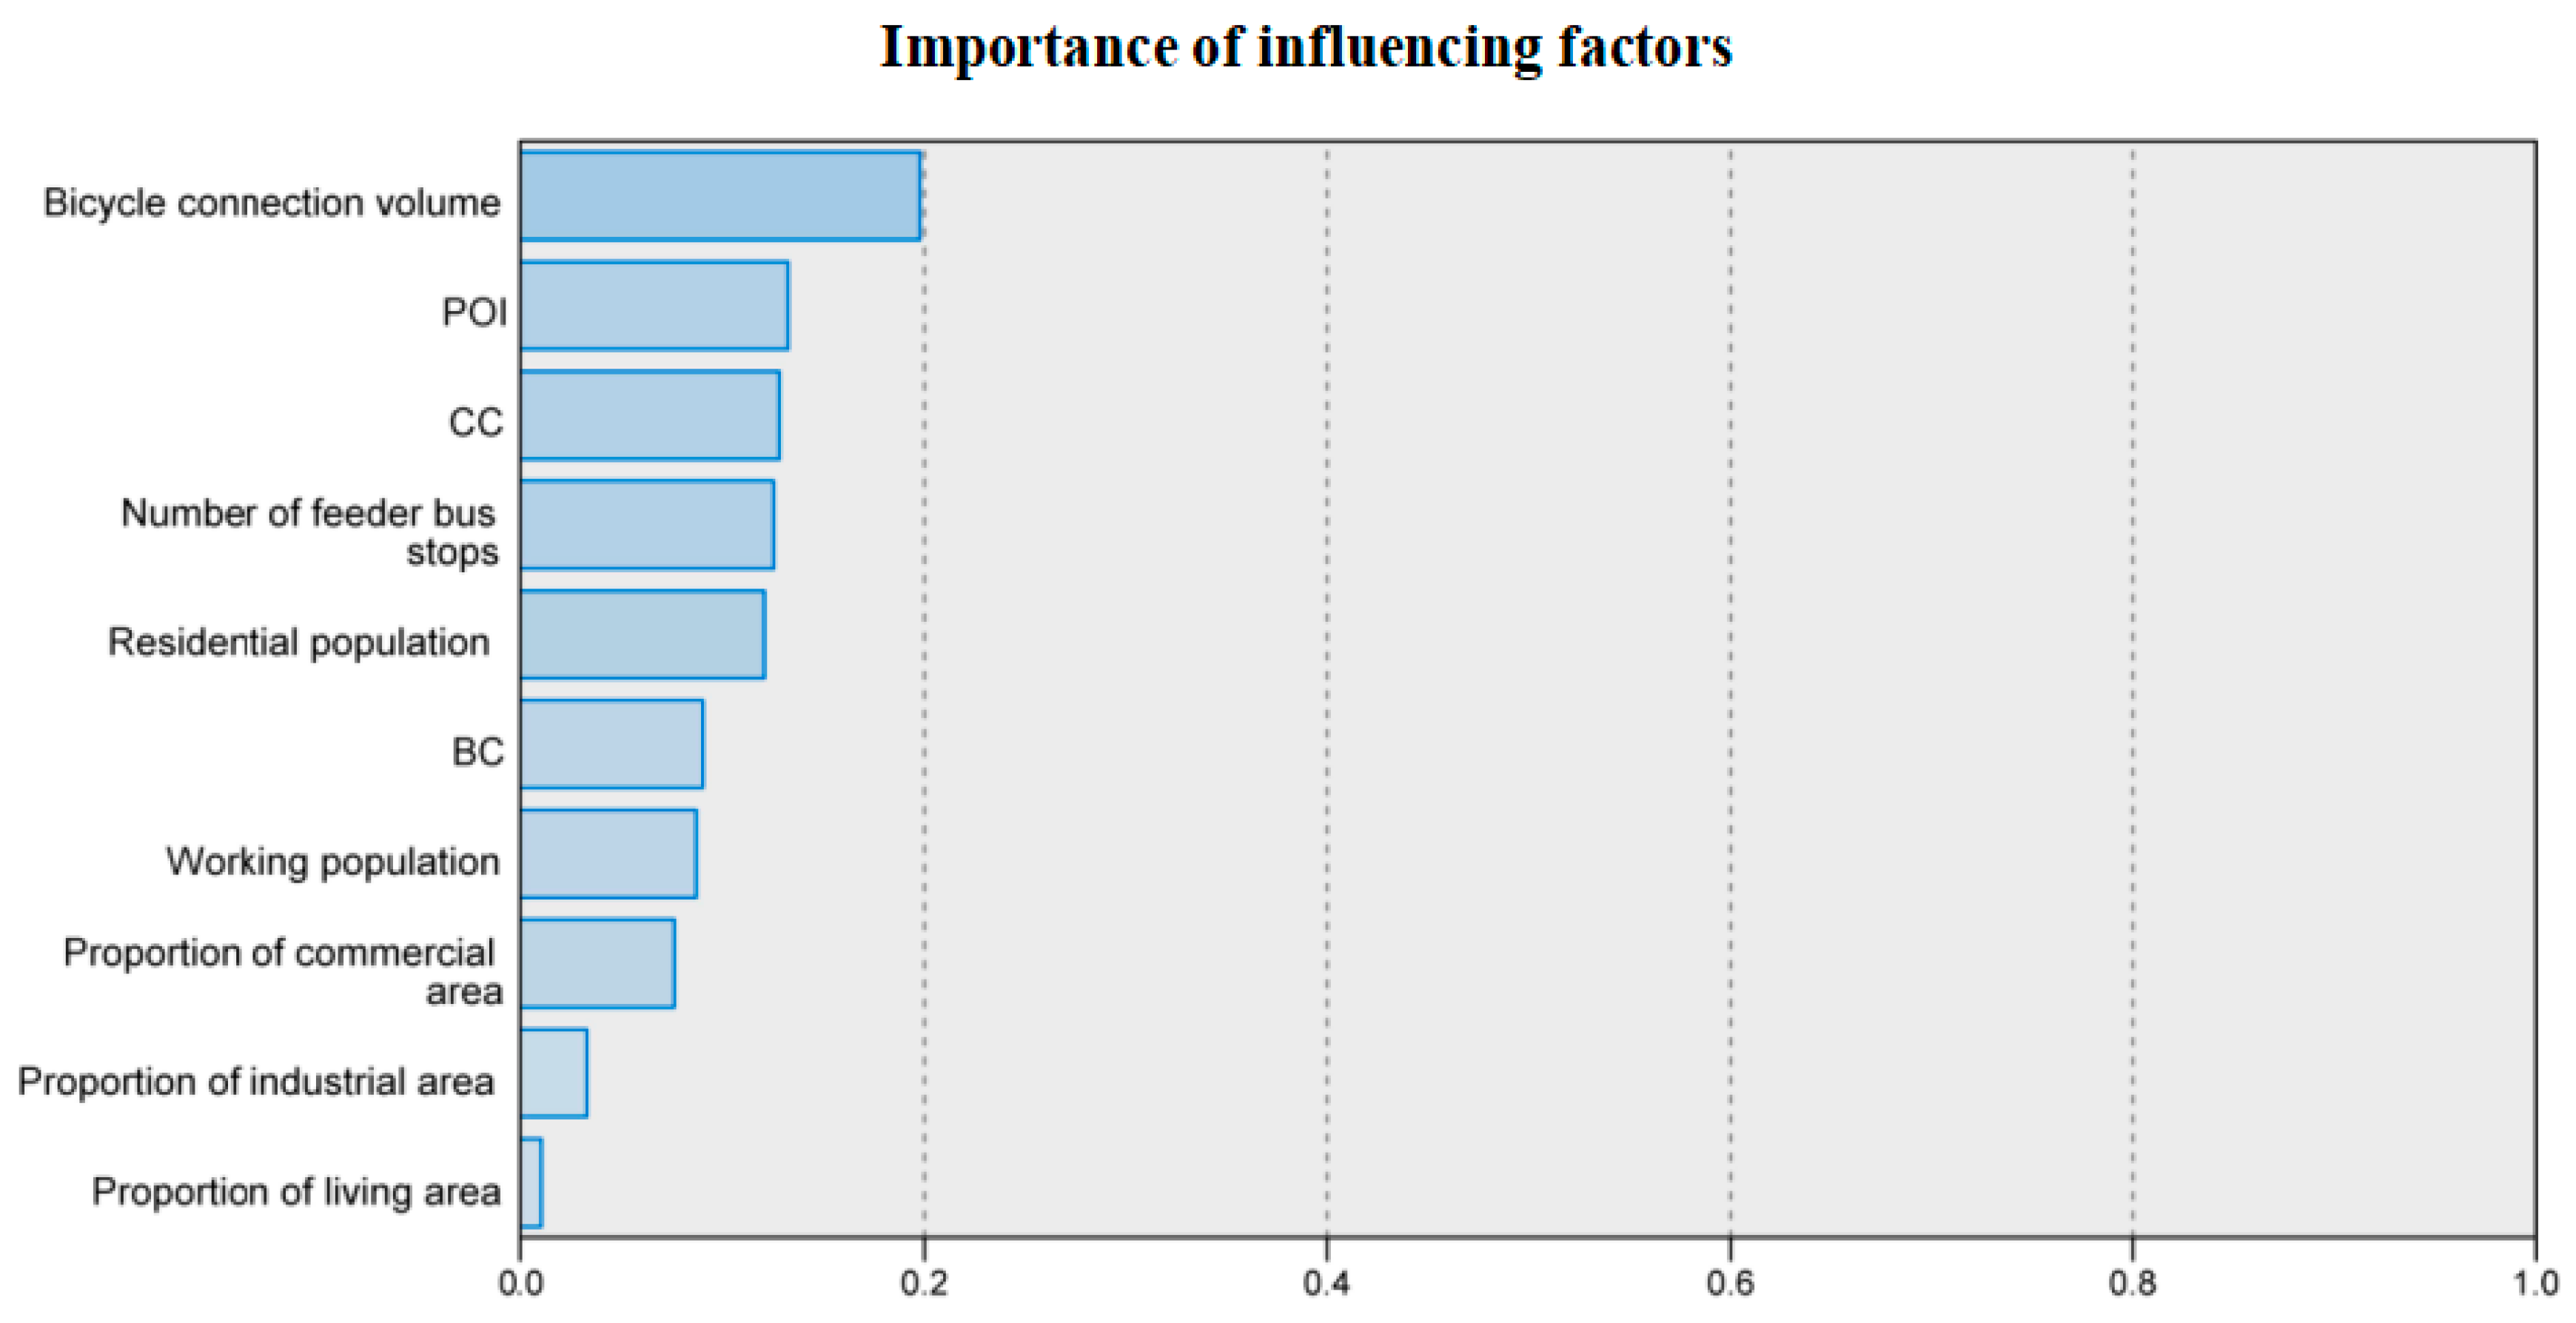
4.3. The Importance of Influencing Factors

After prediction by the SPSS Modeler, the order of importance of the predictor variables is derived from the analysis module. In Figure 15, it can be concluded that the amount of bicycle connections has the strongest degree of importance for rail transportation passenger flow. Bicycle sharing is the most important transfer tool to solve the primary or last-mile problem of urban residents, and it is the main way to solve the problem of road traffic congestion in large cities, reduce travel time, and improve travel efficiency. POI density, which ranks second in importance, is one of the main factors considered by the metro company when planning station locations and routes in the early stages, and the metro lines passing through or stations arranged in the vicinity of buildings and facilities with a strong attraction to the population bring a large number of passengers to the newly built stations. The last two factors, industrial area and residential area, have the least impact on passenger flow. The closer the city center is to the city, the higher the population is, and due to the special characteristics of the industrial buildings and facilities, they are located outside the city center, and the smaller population has less impact on the metro passenger flow. Residential areas are usually a certain distance away from subway stations, and residents often choose to share bicycles, walk to nearby subway stations, or go to bus stops closer to their residential areas and take buses to travel, so the proportion of residential areas has the least impact on subway passenger flow.

5. Discussion

Previous studies on rail transit passenger flow forecasting focus more on model innovation and the lack of in-depth analysis of the input data, such as factors affecting long-term rail transit passenger flow, the network structure and distribution of stations, and the interaction between stations. Even though certain previous studies on related topics have chosen influencing factors that are more similar to those in this paper, they have not visualized the specifics of each influencing factor, nor have they provided a more objective and comprehensive explanation of why certain regional rail stations have a large distribution of that influencing factor. In addition, compared with previous studies, this paper also takes a more long-term perspective to explore the effect of how these factors have a long-term impact on passenger flow.
For example, this paper analyzes the reasons for the high number of bus stops in the eastern part of Batong Line through fieldwork. Combined with the specificity of Beijing’s geographic location and the inner thoughts of the working population, this phenomenon will continue for a long time, and it is difficult to make temporary changes to it. Therefore, the number of bus stops in this area has a long-term impact on rail transit passenger flow. Various types of building facilities and existing subway stations will not be demolished in a short period of time, so they have a long-term effect on rail transit passenger flow in the neighborhood. After summarizing the importance of each influencing factor on passenger flow, this paper objectively and comprehensively analyzes why the number of shared bicycles and the proportion of residential areas are the most and least important factors affecting the passenger flow of rail stations. Finally, this paper also divides the attraction features into different types of building facilities, visualizes them separately, and explains why they affect subway passenger flow.
This paper proposes that long-term factors affecting passenger flow of rail stations depend on metro network structure and the external environment of the stations and finds that the correlation between them is clearly demonstrated through visualized analysis. In terms of the metro network, when a new station is added, the increase in network nodes will destabilize the original network, leading to changes in passenger flow. In terms of the external environment of stations, different types of facilities will generate passenger flow, and various means of transportation around the stations also provide travelers with transport convenience. Therefore, it is necessary to have a comprehensive consideration of network topology characteristics and the external environment on passenger flow. This paper achieves over 90% accuracy in predicting passenger flow using SPSS Modeler software 18.0 and class neural networks, indicating that neural networks work well for nonlinear data prediction.
Therefore, in view of the fact that new rail stations require long-term planning for the next few decades, it is very necessary to analyze the factors that will have a long-term impact on passenger flow, especially for certain special areas, in order to provide substantial reference recommendations for the construction of rail stations.

6. Conclusions

This paper uses neural network modeling to determine the factors affecting the long-term passenger flow of rail transit and the relationship between them. First of all, this paper uses ArcGIS to clearly demonstrate the distribution and numerical value of each factor and finds that the number of factors at each station is positively correlated with the size of passenger flow at that station. In addition, a rail passenger flow prediction model based on a class neural network is constructed using an SPSS Modeler. After running the model, the results are shown in the form of multiple line graphs and attributes of factors, with a prediction accuracy of 94.6%. After that, the Chaid tree model and the CART tree model are used for prediction, respectively, and the results show that the neural network-like model has a stronger reliability. Finally, the results of the model run also yielded a strong or weak relationship between these long-term influences and flow. This paper is able to demonstrate the interrelationship between several long-term factors and station passenger flow, predict the long-term passenger flow of current stations using the historical passenger flow data, and provide a strong reference for future urban planning and construction. The conclusions drawn are as follows:
(1) Topological characteristics of the subway network, the environment of stations, and the connection of transportation modes around stations can influence the passenger flow of stations. These factors have a long-term influence on the passenger flow of stations. As Beijing is special in geographic location, ArcGIS can better reflect the distribution of various factors in each place and also highlight the special geographic location of Beijing;
(2) The neural network method works well in predicting nonlinear data, such as spatio-temporal passenger flow. Due to the temporal and spatial characteristics of subway passenger flow, constant changes, and nonlinear characteristics, the artificial neural network used in this paper can make a good prediction on large-scale data processing and is easier to conduct;
(3) Different factors have different influences on subway passenger flow. The convenience of connection by shared bicycles and buses has the biggest influence on subway passenger flow. Due to the special geographic location of Beijing, the proportion of industrial area and the proportion of residential area around rail stations have the least influence on passenger flow.
This paper explores long-term factors affecting the passenger flow of rail transit and the correlation between them with the hope of providing guidance and suggestions for rail transit companies in planning and constructing new subway lines and stations, as well as configuring the surrounding transportation transfer tools and providing a reference basis for the construction of a TOD smart city. However, this paper also has many limitations, for which more in-depth research is needed. First, it does not consider the long-term impact of origin and destination (OD) in a specific region on the rail transit passenger flow. In the future, it is necessary to consider the starting and ending points of travelers so as to more accurately grasp the travel pattern of passengers and improve the prediction accuracy. Second, as the passenger flow of rail transit is complex and varied, we may need to divide travelers into different age groups so that we may be able to investigate and analyze the factors that affect their choice of transportation modes to improve the accuracy of prediction and provide richer and more reliable input variables for this study. Third, because this paper focuses more on exploring the mechanism between factors and passenger flow, the design of the model is not novel enough due to the limitation of the SPSS Modeler; in the future, we will design a superior combined model so as to achieve an all-around analysis and prediction. Fourth, due to the ongoing construction of rail transit in Beijing, the subway line network and people’s travel patterns are going through changes. It is necessary to analyze the passenger flow of more representative subway lines and stations in real time so as to more accurately assess the current development of Beijing’s rail transit and effectively alleviate traffic congestion on urban roads and congestion in subway stations.

Author Contributions

Conceptualization, Z.D. and W.Y.; methodology, Z.D. and W.Y.; validation, W.Y.; investigation and supervision, Z.D.; writing—original draft preparation, W.Y.; review, Y.Y., J.G. and X.M. All authors have read and agreed to the published version of the manuscript.

Funding

This research was supported by the Science and Technology Project of Hebei Provincial Department of Transportation (No. TH-201914).

Institutional Review Board Statement

Not applicable.

Informed Consent Statement

Not applicable.

Data Availability Statement

The data presented in this study are available upon request from the corresponding author. The data are not publicly available due to privacy.

Acknowledgments

The authors wish to thank the reviewers for their valuable comments and suggestions concerning this manuscript.

Conflicts of Interest

The authors declare that this study was conducted without any commercial or financial relationships that could be perceived as potential conflicts of interest.

References

  1. Fast Report of Urban Rail Transit Operation Data in 2022. Available online: https://www.gov.cn/xinwen/2023-01/20/content_5738226.htm (accessed on 4 September 2023).
  2. Liu, D.; Wu, Z.; Sun, S. Study on Subway passenger flow prediction based on deep recurrent neural network. Multimed. Tools Appl. 2022, 81, 18979–18992. [Google Scholar] [CrossRef]
  3. Dong, N.; Li, T.; Liu, T.; Tu, R.; Lin, F.; Liu, H.; Bo, Y. A method for short-term passenger flow prediction in urban rail transit based on deep learning. Multimed. Tools Appl. 2023, 1–23. [Google Scholar] [CrossRef]
  4. Li, S.; Liang, X.; Zheng, M.; Chen, J.; Chen, T.; Guo, X. How spatial features affect urban rail transit prediction accuracy: A deep learning based passenger flow prediction method. J. Intell. Transp. Syst. 2023. [Google Scholar] [CrossRef]
  5. Huang, X.; Wang, Y.; Lin, P.; Yu, H.; Luo, Y. Forecasting the All-Weather Short-Term Metro Passenger Flow Based on Seasonal and Nonlinear LSSVM. Promet-Traffic Transp. 2021, 33, 217–231. [Google Scholar] [CrossRef]
  6. Yao, X.M.; Zhao, P.; Yu, D.D. Real-time origin-destination matrices estimation for urban rail transit network based on structural state space model. J. Cent. South Univ. 2015, 22, 4498–4506. [Google Scholar] [CrossRef]
  7. He, Z.; Huang, J.; Du, Y.; Wang, B.; Yu, H. The prediction of passenger flow distribution for urban rail transit based on multi-factor model. In Proceedings of the IEEE International Conference on Intelligent Transportation Engineering, Singapore, 20–22 August 2016; pp. 128–132. [Google Scholar] [CrossRef]
  8. Cai, X.C. Research on Passenger Flow Assigmnent Model and Algorithm of Urban Rail Transit. Master’s Thesis, Beijing Jiaotong University, Beijing, China, 2011. [Google Scholar]
  9. Wen, H.; Zhu, S.; Sun, J.; Zhang, J.; Zhang, J. Assessment of Impact Factors on Passenger Attraction of New Metro Line. J. Transp. Syst. Eng. Inf. Technol. 2023, 23, 282–289. [Google Scholar]
  10. Wang, Y.; Ma, C. Influencing factors and development trends of urban rail transit passenger flow. J. Chang. Univ. (Nat. Sci. Ed.) 2013, 33, 69–75. [Google Scholar] [CrossRef]
  11. Lu, W.B.; Zhang, Y.; Ma, C.Q.; Zhou, B.J.; Wang, T. Measuring the relationship between influence factor and urban rail transit passenger flow: Correlation or causality? J. Urban Plan. Dev. 2022, 148, 05022025. [Google Scholar] [CrossRef]
  12. Yu, H.-T.; Jiang, C.-J.; Xiao, R.-D.; Liu, H.-O.; Lv, W. Passenger Flow Prediction for New Line Using Region Dividing and Fuzzy Boundary Processing. IEEE Trans. Fuzzy Syst. 2019, 27, 994–1007. [Google Scholar] [CrossRef]
  13. He, Z.; Wang, B.; Huang, J.; Du, Y. Station passenger flow forecast for urban rail transit based on station attributes. In Proceedings of the IEEE 3rd International Conference on Cloud Computing and Intelligence Systems 2014, Shenzhen, China, 27–29 November 2014; pp. 410–414. [Google Scholar] [CrossRef]
  14. Lin, L.; Gao, Y.; Cao, B.; Wang, Z.; Jia, C. Passenger Flow Scale Prediction of Urban Rail Transit Stations Based on Multilayer Perceptron (MLP). Complexity 2023, 2023, 1430449. [Google Scholar] [CrossRef]
  15. Raza, A.; Zhong, M. Lane-based short-term urban traffic forecasting with GA designed ANN and LWR models. Transp. Res. Procedia 2017, 25, 1430–1443. [Google Scholar] [CrossRef]
  16. Lin, C.; Wang, K.; Wu, D.; Gong, B. Passenger Flow Prediction Based on Land Use around Metro Stations: A Case Study. Sustainability 2020, 12, 6844. [Google Scholar] [CrossRef]
  17. Yang, D.; Chen, K.R.; Yang, M.N.; Zhao, X.C. Urban rail transit passenger flow forecast based on LSTM with enhanced long-term features. IET Intell. Transp. Syst. 2019, 13, 1475–1482. [Google Scholar] [CrossRef]
  18. Zhao, J.; Qu, H.; Zhao, J.; Jiang, D. Towards traffic matrix prediction with LSTM recurrent neural networks. Electron. Lett. 2018, 54, 566–568. [Google Scholar] [CrossRef]
  19. Cetiner, B.G.; Sari, M.; Borat, O. A neural network based traffic-flow prediction model. Math. Comput. Appl. 2010, 15, 269–278. [Google Scholar] [CrossRef]
  20. Kim, Y.; Park, H.; Choi, W.; Yook, S.-H. Jamming mechanism on the scale-free network with heterogeneous node capacity. Eur. Phys. J. B 2015, 88, 192. [Google Scholar] [CrossRef]
  21. Riondato, M.; Upfal, E. Abra: Approximating betweenness centrality in static and dynamic graphs with rademacher averages. ACM Trans. Knowl. Discov. Data (TKDD) 2018, 12, 61. [Google Scholar] [CrossRef]
  22. Li, M.; Yu, W.; Zhang, J. Clustering Analysis of Multilayer Complex Network of Nanjing Metro Based on Traffic Line and Passenger Flow Big Data. Sustainability 2023, 15, 9409. [Google Scholar] [CrossRef]
  23. Borgatti, S. Centrality and network flow. Soc. Netw. 2005, 27, 55–71. [Google Scholar] [CrossRef]
  24. Zhang, N.; Dai, J.; Zhang, X. Walking Affect Area of Rail Transit Station Based on Multinomial Logit Mode. Urban Mass Transit 2012, 15, 46–49. [Google Scholar] [CrossRef]
  25. Zhu, Z.; Zhang, Y.; Qiu, S.; Zhao, Y.; Ma, J.; He, Z. Ridership Prediction of Urban Rail Transit Stations Based on AFC and POI Data. J. Transp. Eng. Part A Syst. 2023, 149, 9. [Google Scholar] [CrossRef]
  26. Liu, W.; Zhao, J.; Jiang, J.; Li, M.; Xu, Y.; Hou, K.; Zhao, S. Investigating the Multiscale Impact of Environmental Factors on the Integrated Use of Dockless Bike-Sharing and Urban Rail Transit. Promet Traffic Transp. 2023, 35, 886–903. [Google Scholar] [CrossRef]
  27. Zhang, Y. Research on Passenger Flow Forecasting of Bus Stations under the New Metro Line Based on Machine Learning. Master’s Thesis, Beijing Jiaotong University, Beijing, China, 2011. [Google Scholar]
  28. Chen, E.; Ye, Z.; Wang, C.; Zhang, W. Discovering the spatio-temporal impacts of built environment on metro ridership using smart card data. Cities 2019, 95, 102359. [Google Scholar] [CrossRef]
  29. Wu, Y.-C.; Feng, J.-W. Development and Application of Artificial Neural Network. Wirel. Pers. Commun. 2018, 102, 1645–1656. [Google Scholar] [CrossRef]
  30. Ding, S.; Li, H.; Su, C.; Yu, J.; Jin, F. Evolutionary artificial neural networks: A review. Artif. Intell. Rev. 2013, 39, 251–260. [Google Scholar] [CrossRef]
Figure 1. Beijing rail transit.
Applsci 14 03100 g001
Figure 2. Connectivity characteristics. (a) Betweenness centrality. (b) Clustering centrality.
Applsci 14 03100 g002
Figure 3. Connectivity characteristics and passenger flow correlation.
Applsci 14 03100 g003
Figure 4. Connection characteristics. (a) Bicycles available for connection. (b) Number of connecting bus stops.
Applsci 14 03100 g004
Figure 5. Connection characteristics and passenger flow correlation.
Applsci 14 03100 g005
Figure 6. Characteristics of the population. (a) Working population. (b) Residential population.
Applsci 14 03100 g006
Figure 7. Population characteristics and passenger flow correlation.
Applsci 14 03100 g007
Figure 8. Attractive characteristics. (a) POI. (b) Proportion of living area. (c) Proportion of commercial area. (d) Proportion of industrial area.
Applsci 14 03100 g008
Figure 9. Attractive characteristics and passenger flow correlation.
Applsci 14 03100 g009
Figure 10. Network diagram.
Applsci 14 03100 g010
Figure 11. Model construction.
Applsci 14 03100 g011
Figure 12. The fitting diagram of the predicted results and the actual values.
Applsci 14 03100 g012
Figure 13. The overall prediction accuracy of the model.
Applsci 14 03100 g013
Figure 14. Model construction and predicted results. (a) CART tree model construction. (b) Chaid tree model construction. (c) CART tree prediction results. (d) Chaid tree prediction results. (e) Predicted and actual results for the CART tree. (f) Predicted and actual results for the Chaid tree.
Applsci 14 03100 g014
Figure 15. The order of importance of influencing factors.
Applsci 14 03100 g015
Table 1. Influencing factors and their calculation methods.
Influencing FactorsData SourceCalculation Formula
POIGoddard map crawling POI facility points D i = N i / S i
Di is the density of a facility around the station, Ni is the number of facility points near the station, and Si is the area of the study area
Number of connecting bus stopsGaode map crawls the number of stops
Bicycles available for connectionGaode map crawls pickup points
Population characteristicsBaidu Wise-Eye Population Data
Cluster centrality (CC)Expressed as aggregation coefficient C i = 2 e i k i ( k i 1 ) The clustering coefficient of node i with degree k i , where e i is the number of edges between neighboring nodes of node i
Betweenness centrality (BC)Node median B C i = s i t n s t i g s t : n s t i denotes the number of paths passing through node i and is the shortest path; g s t denotes the number of shortest paths connecting s and t
Railway line network and stationsopenmaptiles.org
Disclaimer/Publisher’s Note: The statements, opinions and data contained in all publications are solely those of the individual author(s) and contributor(s) and not of MDPI and/or the editor(s). MDPI and/or the editor(s) disclaim responsibility for any injury to people or property resulting from any ideas, methods, instructions or products referred to in the content.

