Article

One-Dimensional Modeling of the Pressure Loss in Concrete Pumping and Experimental Verification

1
School of Mechanical Engineering, Hunan University of Science and Technology, Xiangtan 411201, China
2
Zoomlion Heavy Industry Science and Technology Development, Changsha 410013, China
*
Author to whom correspondence should be addressed.
Appl. Sci. 2024, 14(7), 3101; https://doi.org/10.3390/app14073101
Submission received: 27 February 2024 / Revised: 29 March 2024 / Accepted: 4 April 2024 / Published: 7 April 2024

Abstract

:
An accurate formula for calculating the pressure loss in concrete pumping plays a significant guiding role in the design and service process of pump trucks. Based on the flow characteristics of concrete pumping, a straight pipe one-dimensional model for the pressure loss is developed, in which both the viscous force of the mortar in the lubrication layer and the blocking effect of coarse aggregate particles are considered. First, the complex geometrical shapes of the aggregate particles are geometrically reconstructed by using a HandySCAN noncontact scanner and the reverse modeling software Geomagic Design X (v.19.0.2). Then, the equivalent spherical size of nonspherical aggregate particles is calculated according to the equal hydraulic radius principle. The blocking effect of the aggregate particles is converted into the wall roughness. Finally, an explicit expression for the pressure loss in concrete pumping is deduced by using Modi’s equation, Bernoulli’s equation, and Darcy’s formula, and the calculated value is compared with the measured value at a corresponding experimental site. The results indicate that the pressure loss values calculated with the one-dimensional flow model are closer to the actual pumping pressure loss values. The relative error between the results and the actual pumping pressure loss value is about 20.2%.

1. Introduction

With the rapid progress of urbanization, the demand for concrete pumping technology is increasing, while the modern concrete pumping technology has significant advantages [1]: wide application range, high pumping flexibility, and reduction in the pouring time. The modern concrete pumping technology has gradually replaced the traditional and become an important technical means in construction. Therefore, the study of pressure loss during pumping has become more and more important and has been a major concern in this field [2]. The concrete can be transported to the designated pouring location mainly by rely on pumping pressure provided by a pump truck [3,4]. But the process of pumping in the pipe is complicated, and excessive fluctuation of pumping pressure is extremely unfavorable, which will cause a series of problems such as pipeline rupture, and even cause pumping failure. Therefore, the pumping pressure provided by the pump truck is important in the concrete pumping process [5]. The pressure loss of concrete during pumping is an important reference standard for the regulation of pumping pressure. There are many factors affecting the pressure loss, including pipe geometry, pumping flow, lubricating layer, and aggregate particle size [6].
Related scholars have launched a series of research into the rheological characteristics of concrete aggregate particles in the pumping process [7], such as rheological behavior analysis [8], pumping model construction [9], and pressure loss impact analysis [10]. In the pumping process, the concrete in the pumping pipe moves forward in the pump pipe under the action of pressure. The aggregates and mortar generate a nonuniform shear field under the combined effect of the pumping pressure and friction on the pipe wall. The aggregate particles move from high shear force area to low shear force area, and the mortar is squeezed to the pipe wall through the aggregate gaps, causing the concrete in the pumping pipe to be divided into a lubrication layer and a plunger layer [10,11]. Some scholars used ultrasonic detection to measure the thickness of the lubrication layer at different flow rates, discovering that the flow behavior of the lubrication layer is similar to that of mortar [12]. Therefore, the rheological properties of the lubricating layer can be characterized by measuring the rheological parameters of mortar. Some scholars also used different experimental tools to study the flow characteristics of the lubrication layer, and found that the roughness of the pipe wall also significantly affected the flow of concrete in the pipe [13]. According to the flow characteristics of the lubricating layer, the content of aggregate particles in the lubricating layer is much less than that in the plunger layer. Therefore, the lubricating layer thickness can be obtained by observing the flow difference between the lubricating layer and the plunger layer [14]. With the deepening of the understanding of the lubrication layer, scholars proposed a variety of methods to measure the thickness of the lubricating layer, such as ultrasonic wave (UVP) and particle image velocimetry (PIV) [15]. Their study results found that the thickness of the lubricating layer was between 1 and 5 mm.
According to the rheological characteristics in the concrete pumping process, Choi et al. [16] measured the thickness of the lubrication layer using an ultrasonic detection method under different concrete grades and aggregate sizes. The results indicate that the pipeline flow of pumping concrete was significantly affected by the coarse aggregate particles, but the thickness of the lubrication layer does not change much. Hu et al. [17] used the ASTM C109 flowmeter experimental method to study the effects of the concrete sand–cement ratio, water–cement ratio, and aggregate sizes on the flowability of mortar, and established a prediction model for mortar flowability. Cui et al. [18] found that the pumping concrete resistance in the conveying process consists of adhesion and friction, the adhesion coefficient and velocity coefficient are mainly affected by the slump of the concrete, and the formula for the pumping pressure loss can be deduced according to the force balance. Kwon et al. [19] considered the thickness of the lubrication layer and deduced equations for calculating the flow rate and pressure loss. Liu et al. [20] established a pipeline direction-finding pressure model by considering the influence of viscous loss and combining Bernoulli’s equation. These experimental and modeling results provide insights for the analysis of coarse aggregates in pumping rheological properties.
Coarse aggregate particles’ shape [21] and distribution characteristics [22] affect the rheological properties of concrete, which directly affect the pumping pressure loss [23]. Choi et al. [24] used three different coarse aggregate sizes to run the 170 m and 1000 m pumping circuit tests to measure the pumping pressure at the same flow rates, and the results showed a linear relationship between the pumping pressure and flow rate. Zhan et al. [25] used the degree of sphericity and shape index to characterize the shape of coarse aggregate particles, researched the influence of its shape on the flowability of concrete, and found that as the shape index and the degree of sphericity increased, the concrete became less viscous and better liquidity. Cao et al. [26] studied the influence of the coarse aggregate volume fraction on the concrete pumping pressure based on the discrete element method. The results showed that the topography characteristics of the lubricating layer and coarse aggregate in the pipe have a great influence on the pumping pressure loss. However, few researchers have considered the effect of coarse aggregate particles on the blocking effect of mortar in the lubricating layer. Because the aggregate particle size is larger than the lubrication layer thickness, the blocking effect of the aggregate particles increases the vortices in the lubrication layer. The exposed aggregate particles in the lubrication layer are considered multiple localized obstructions. These obstructions will affect the distribution of the mortar flow pattern in the lubrication layer and the concrete pumping pressure loss.
According to the above discussion, the focus of this paper is to study the pressure loss caused by the blocking effect of coarse aggregate. The flow characteristics of the pumping concrete lubrication layer and plunger layer are combined with the concrete coarse aggregate particle distribution characteristics. The aggregate particle blocking effect is converted into the wall roughness by means of the aggregate particle equivalent size. Bernoulli’s equation is used to construct a one-dimensional flow model for the concrete pumping pressure loss, and expressions for pressure loss calculations are derived via Darcy’s and Modi’s formulas. A project pumping pipeline is taken as a research object, strain electrical measurement technology is used to measure the pressure of the pumping pipeline, and the calculation accuracy of the equivalent one-dimensional flow model is tested and analyzed.

2. Empirical Formula for the Concrete Pumping Pressure Loss

Assuming that concrete is an incompressible fluid, the flow of concrete in a pipeline is a plunger flow. The performance of the concrete in the pipe flow is unchanged, and the frictional resistance between the concrete and the pipe wall and the internal bond strength of the concrete are the main sources of pressure loss during the transportation process. According to the empirical formula of Morinaga [27], the drag of flow f is
f = k 1 + k 2 1 + t 2 t 1 v
Here, k1 is the coefficient of adhesion (unit: Pa), which is the resistance coefficient caused by the concrete sticking to the pipeline, k2 is the speed coefficient (unit: Pa·s/m), which is the resistance coefficient caused by the speed of the concrete flow in the pipeline, v is the average flow velocity of the concrete, t1 is the time for the pumping piston to push the concrete to flow, and t2 is the switching time of the distribution valve; t2/t1 is generally taken as 0.3. The larger k1 is, the greater the thrust required for transformation of the concrete state of motion, and the larger k2 is, the more difficult it is to improve the concrete delivery; k1 and k2 [27] are related to the concrete match ratio, the smoothness of the pipe wall, etc. In engineering, the concrete slump S is commonly used for calculation:
k 1 = 300 S
k 2 = 400 S
Concrete in the pumping pipe is in the form of a plunger flow. For example, for the concrete unit dx of pumping in a cross-section section of a straight pipe, the concrete unit is subjected to the axial pressure difference in the pipe, inertial force of the plunger flow, resistance to flow of the plunger flow, and gravity force of the concrete, as shown in Figure 1. In the figure, z1 is the height of the axial center of cross-flow section x + dx from the reference datum, z2 is the height of the axial center of cross-flow section x from the reference datum, p + dp is the average pressure in cross-flow section x + dx, p is the average pressure in cross-flow section x, and R is the inner diameter of the pumping pipe.
The axial pressure difference in the concrete unit pipe is
p π R 2 p + d p π R 2 = π R 2 d p
The plunger flow resistance is
2 π R d x f = 2 π R k 1 + k 2 ( 1 + t 2 t 1 ) v d x
The plunger flow inertia force is
π R 2 d x ρ d v / d t
The concrete gravity is
π R 2 ρ g sin θ d x
According to the force analysis of the concrete unit of the straight pipe section, the combined force ∑F in the axial direction of the concrete unit is given by Equations (4)–(7):
F = π R 2 d p 2 π R k 1 + k 2 1 + t 2 t 1 v d x π R 2 d x ρ d v / d t π R 2 ρ g sin θ d x
In the above, ρ is the density of the concrete, θ is the angle between the pumping pipe and the reference datum, and dv/dt is the concrete acceleration.
For the plunger pump form, it is generally accepted that the flow rate of concrete in one stroke is basically constant, i.e., dv/dt = 0, and that the pumped concrete is in uniform motion, i.e., ∑F = 0; thus, the following is obtained:
d p = 2 R k 1 + k 2 ( 1 + t 2 / t 1 ) v d x + ρ g sin θ d x
Considering the pulse periodicity in the pumping system and the concrete flow properties inside the pipeline, the above equation is integrated over x between the two ends. Assuming that the axial length of the two cross-flow sections is l, the expression for the pumping pressure difference between the two cross-flow sections is
Δ p c = 2 R k 1 + k 2 ( 1 + t 2 / t 1 ) v l + ρ g ( z 2 z 1 )

3. Concrete Pumping One-Dimensional Flow Model Construction

According to the analysis of the rheological behavior in concrete pumping, the concrete in the pumping pipe is divided into a lubrication layer and a plunger layer. The flow behavior of the lubrication layer is similar to that of mortar, and the plunger layer as a whole moves forward in the pumping pipe direction in the form of a plunger flow. In other words, the fluid medium in the lubrication layer is mainly mortar, and the fluid medium in the plunger layer is mainly a mixture of aggregate particles and mortar. The lubrication layer gradually transitions to the plunger layer when coarse aggregate particles begin to appear in the bottom layer of the pumping pipe. Due to the viscosity of concrete, the flow velocity of the lubrication layer in contact with the pumping pipe wall is zero, and the flow velocity of the lubrication layer in contact with the plunger layer is the concrete pumping flow rate. The aggregate particles and the mortar in the plunger layer flow forward as a whole in the form of a plunger flow. There is no relative motion between the aggregate particles and the mortar in the plunger layer, and the friction between the aggregate particles and the mortar can be neglected. Therefore, the concrete pumping pressure loss is mainly concentrated in the lubrication layer region, for example, in the friction between the lubrication layer and the pipe wall, the friction between the lubrication layer and plunger layer due to their relative movement, and the friction of the mortar in the lubrication layer generated by slip. The specific factors affecting the pumping pressure loss include the pipe wall roughness, lubrication layer thickness, aggregate particle shape and size, lubrication layer kinematic viscosity coefficient, Reynolds number, and concrete pumping speed. Because the roughness of the pipe wall is much smaller than the coarse aggregate particle size, the frictional resistance generated by the pipe wall is less than the viscous force between the coarse aggregate particles and the lubrication layer, and the pipe wall frictional resistance is ignored in this paper. To analyze the effect of coarse aggregate particles on pressure loss facilitation, it is assumed that the coarse aggregate particles occupy the critical layer of the lubrication layer and the plunger layer and that coarse aggregate particles of various shapes are equivalent to spherical particles with equal particle sizes. According to the above assumptions, a typical straight pipe is taken as an example to establish a one-dimensional flow model for concrete pumping, as shown in Figure 2. In the figure, v is the concrete pumping flow rate, l is the length between the selected control region cross-flow section 1 and cross-flow section 2, z1 is the height of the axis of cross-flow section 1 from the reference datum, z2 is the height of the axis of cross-flow section 2 from the reference datum, p1 is the average pressure in cross-flow section 1, p2 is the average pressure in cross-flow section 2, d is the inner diameter of the pumping pipeline, δ is the thickness of the lubrication layer, K is the equivalent particle size of the coarse aggregate particles, and τ0 is the viscous force of the lubrication layer and the plunger layer.

3.1. Pressure Loss Analysis with the One-Dimensional Flow Model for Concrete Pumping

After concrete pumping for a period of time, the concrete pumping flow and pumping pressure no longer change with time, and the flow of concrete in the pumping pipe is a constant flow. The average flow velocity in each cross-flow section of different sizes and directions remains unchanged in the straight pumping section, so the concrete pumping is a uniform flow. Along the concrete pumping direction, the pressure distribution in each section of the pumping pipe satisfies Bernoulli’s equation:
p 1 γ + v 1 2 2 g + z 1 = p 2 γ + v 2 2 2 g + z 2 + h f
In the above, hf is the head loss of concrete pumping from cross-flow section 1 to cross-flow section 2, γ is the volume weight of the mortar, v1 is the flow velocity in cross-flow section 1, and v2 is the flow velocity in cross-flow section 2. The straight pumping pipe is assumed to be a uniform pipe, and according to the continuity equation,
v 1 = v 2 = v
Then, the pressure difference Δpm between cross-flow sections 1 and 2 is
Δ p m = p 1 p 2 = h f γ + ( z 2 z 1 ) γ
In a typical straight pumping pipe, the pumping pressure loss uniformly increases along the pumping length, and the pumping pressure loss is friction loss. According to the Darcy formula of fluid dynamics, the concrete pumping pressure loss pf through cross-flow section 1 to cross-flow section 2 is
p f = h f γ = λ l d e ρ s v 2 2
Here, λ is the resistance coefficient, which is to be found, de is the equivalent diameter of the lubrication layer, and ρs is the mortar density.
The lubrication layer is an annular area formed by the wall of the pumping pipe and the plunger layer, and the equivalent diameter de is
d e = 4 × π d 2 π ( d 2 δ ) 2 π d + π ( d 2 δ ) × 1 4 = 2 δ
The friction loss coefficient λ and Reynolds number are related to the relative roughness of the coarse aggregate particles. The Reynolds number affects the lubrication layer movement in the flow pattern, and the relative roughness of the coarse aggregate particles directly affects the flow state of the region around the coarse aggregate particles, usually due to the abrupt change in the coarse aggregate structure around the coarse aggregate particles. When the coarse aggregate equivalent particle size is greater than the thickness of the lubrication layer, the mortar is detached from the particles and flows into the area around the particles, so vortices of different sizes are easily formed around the particles, which affect the lubrication layer movement in the flow pattern. The Reynolds number Re and coarse aggregate particle relative roughness Kd are
R e = v d e υ
υ = u ρ S
K d = K d e
where v is the mortar kinematic viscosity coefficient and u is the mortar dynamic viscosity coefficient. The mortar kinematic viscosity coefficient u can be directly calculated using the slump [28], which is expressed as
u = ρ s g × T 100 × 0.117 S 1 20.86 × 10 3
Here, ρs is the density of the mortar, T100 is the time required for the cement paste to slump 100 mm, and S1 is the slump of the mortar.

3.2. Calculation of the Equivalent Diameter of Nonspherical Particles

The variation in the flow velocity within the lubrication layer is mainly concentrated within the flow layer around the coarse aggregate particles, and the friction loss in which mechanical energy is converted into heat energy is also mainly concentrated in this region, that is, in the contact area between the lubrication layer and the coarse aggregate particles. Additionally, the size of the coarse aggregate particles affects the friction loss in pumping. The hydraulic radius is used in hydrodynamics to construct a connection between them, and the hydraulic radius R1 is
R 1 = V a S a
Here, Va is the volume of coarse aggregate particles, and Sa is the surface area of coarse aggregate particles. Coarse aggregate particles have complex shapes and different sizes, and the particle volume and surface area are difficult to directly measure. In this paper, a number of coarse aggregate particles are randomly selected, and the volume of the coarse aggregate particles Vc is measured via the drainage method.
V c = i k V i
Here, k is the number of coarse aggregate particles selected, and Vi is the drainage volume of the i-th coarse aggregate particle.
Based on the volume of aggregate particles, the average density is
ρ c = m C V C
For aggregate particles with complex shapes, a HandySCAN noncontact 3D laser scanner and the reverse modeling software Geomagic Design X(v.19.0.2) are used for geometric reconstruction, as shown in Figure 3. By using the geometric surface area statistics function of the 3D CAD 2023 software, the total surface area Sa of the selected aggregate particles is calculated.
S a = i k S i
Here, Si is the surface area of the i-th aggregate particle counted by the 3D software.
Figure 3. 3D geometric reconstruction of coarse aggregates.
Applsci 14 03101 g003
Let the hydraulic radius of nonspherical particles be equal to that of spherical particles; then, the equivalent diameter K of nonspherical particles is calculated as follows:
K = 6 V a S a

3.3. Calculation of the Pressure Loss Based on Modi’s Equation

As the equivalent particle size of the coarse aggregates is larger than the thickness of the lubrication layer, the coarse aggregate particles in the lubrication layer are directly exposed, and the vortices around the coarse aggregate particles directly affect the flow of the mortar in the lubrication layer; thus, the flow pattern in the lubrication layer is turbulent. According to the turbulent friction loss coefficient calculation formula, Modi’s formula is used to calculate the friction loss coefficient λ. Modi’s formula, as an empirical formula applicable to turbulent smooth zones, turbulent transition zones, and turbulent rough zones, is widely applicable, simple to calculate, and widely used in the field of fluid dynamics. According to the Reynolds number Re and the relative roughness of the coarse aggregates Kd, the resistance coefficient λ is
λ = 0.0055 1 + 20 , 000 K d + 10 6 R e 1 / 3
Therefore, the pressure loss pf in concrete pumping through cross-flow section 1 to cross-flow section 2 is
p f = 0.0055 1 + 20 , 000 K d + 10 6 R e 1 3 l ρ s v 2 2 d e
The pressure difference Δpm of concrete pumped through cross-flow section 1 to cross-flow section 2 is
Δ p m = 0.0055 1 + 20 , 000 K d + 10 6 R e 1 3 l ρ s v 2 2 d e + z 2 z 1 γ

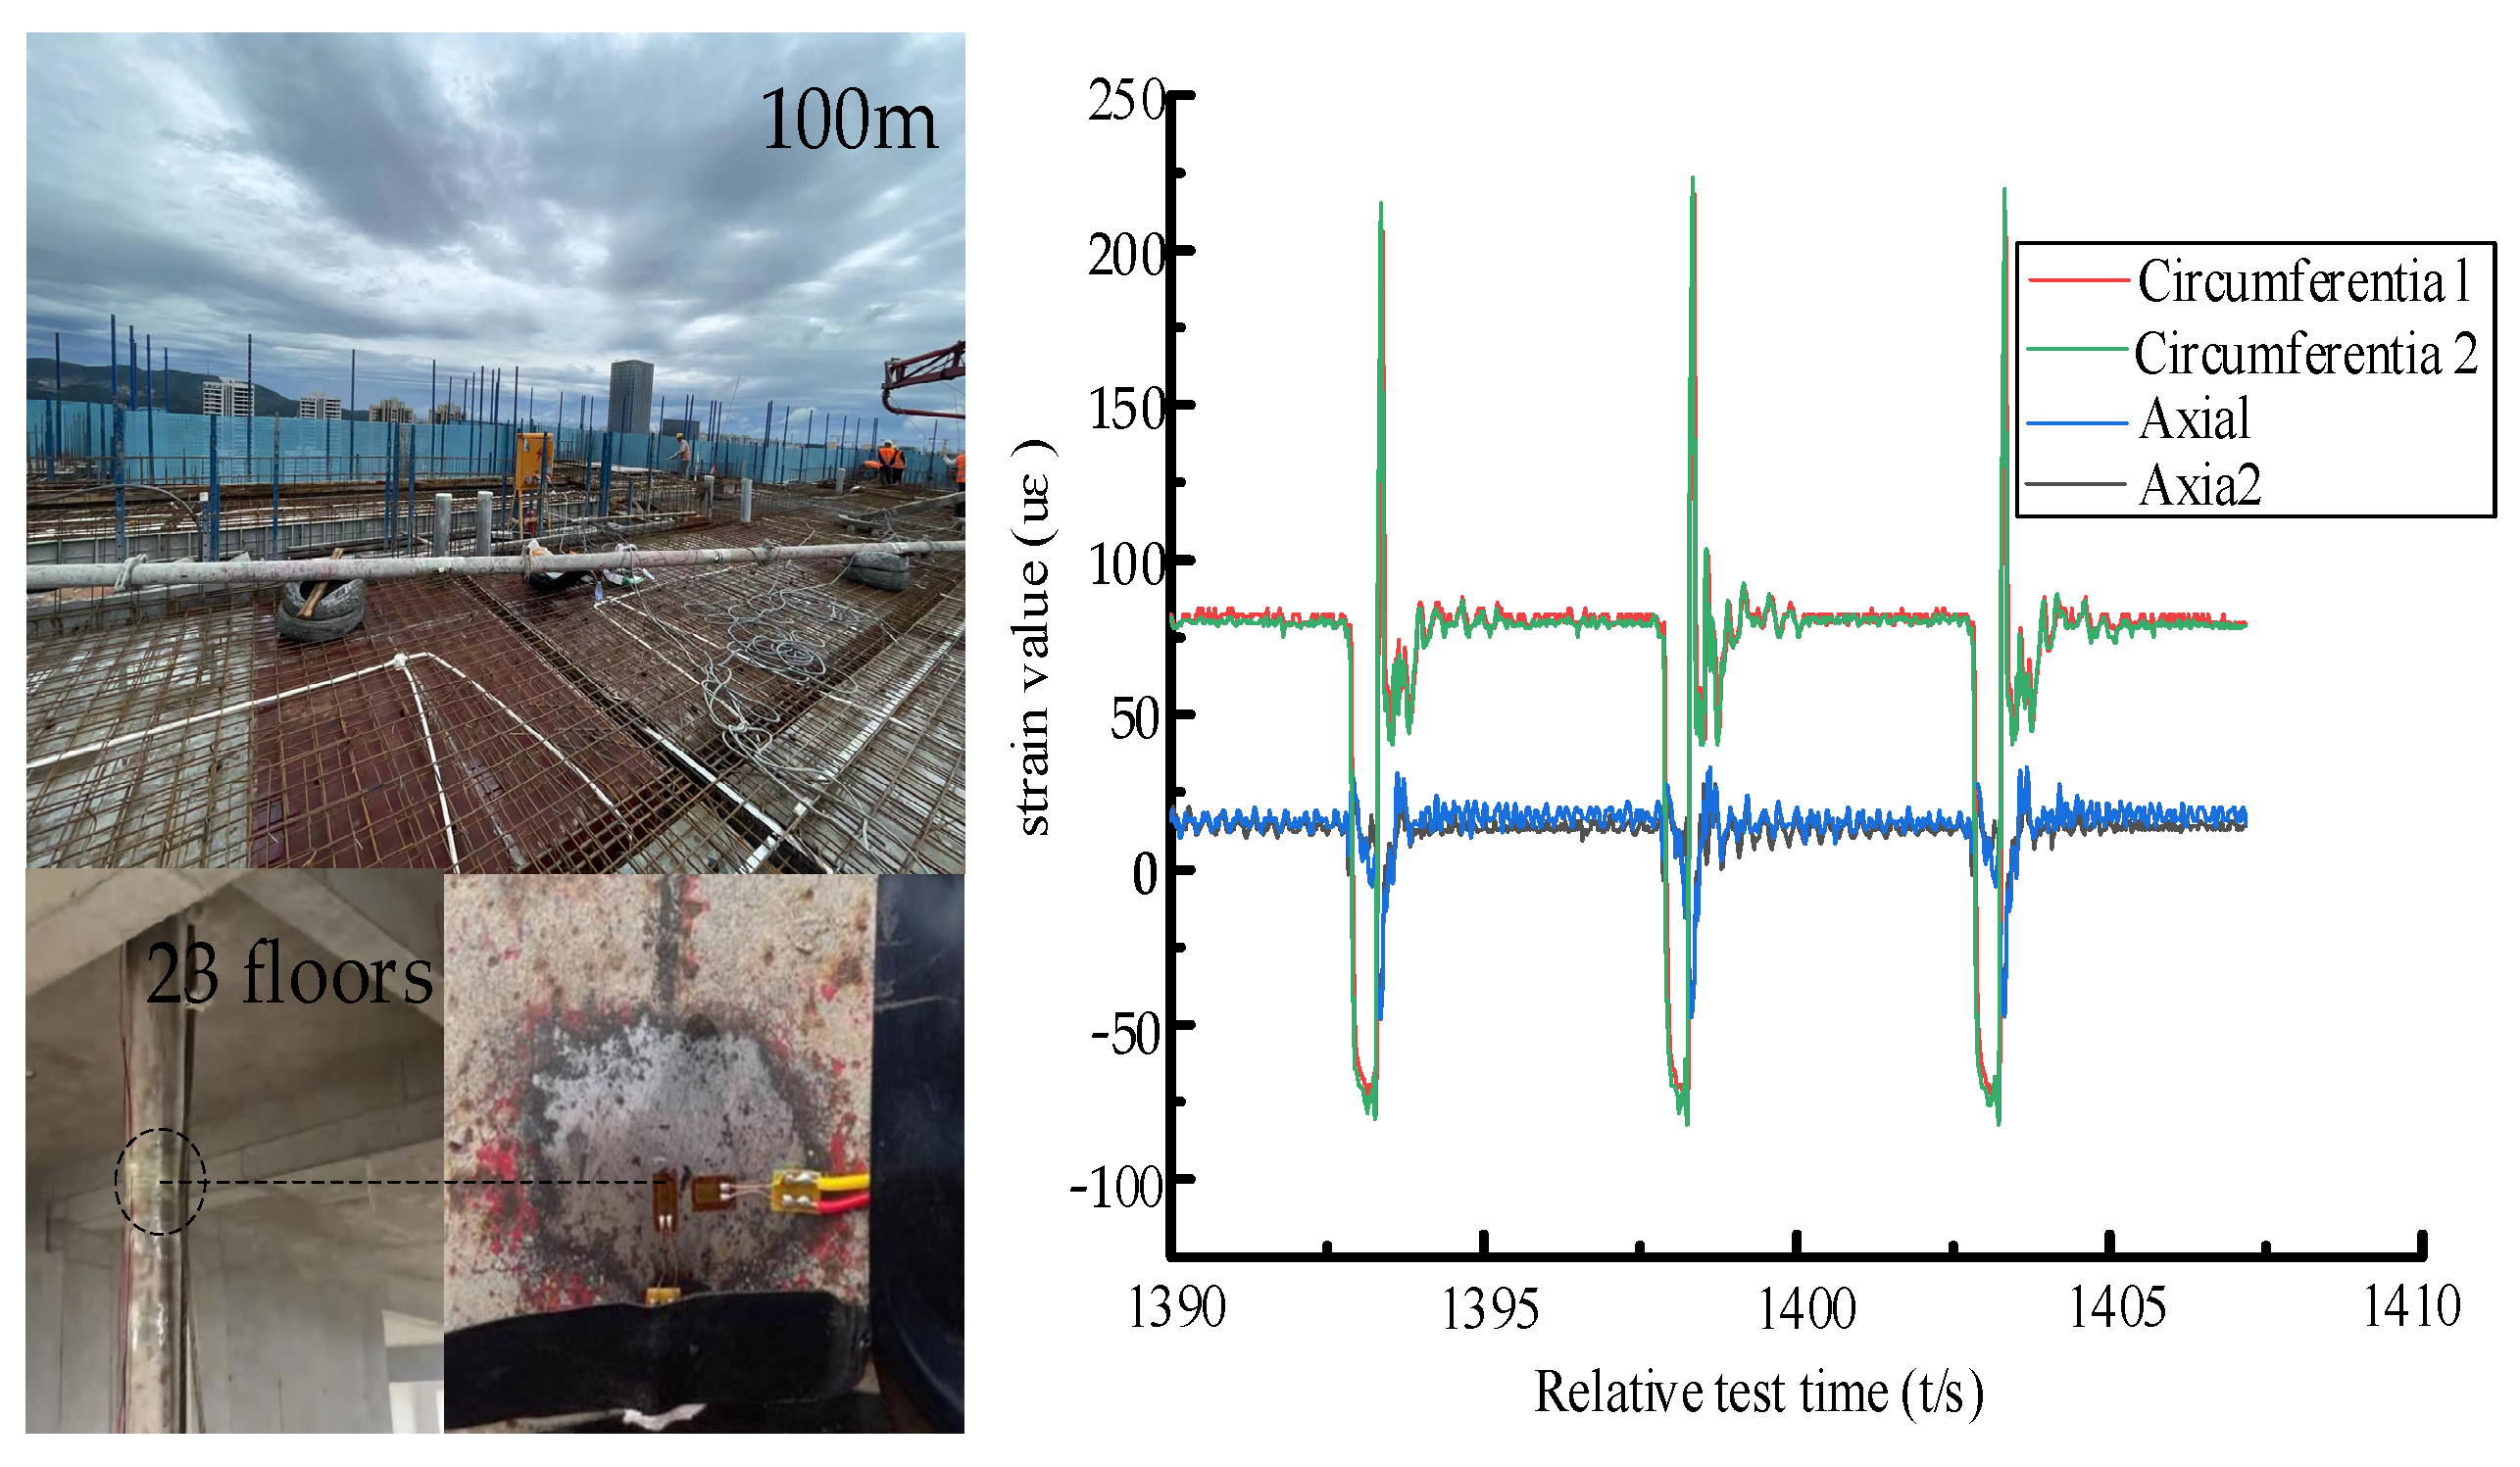
4. Experimental Measurements of the Concrete Pumping Pressure Loss

The concrete pumping process causes circumferential and axial deformation of the pumping pipe. The strain is the external manifestation of the effect between the concrete and the inner wall of the pipeline, reflecting the stress variation law under the interaction between concrete and the inner wall of the pipeline. Based on the strain data monitored under field conditions, according to the generalized Hooke law, the circumferential stress σθ and axial stress σZ in the pumping pipeline wall are
σ θ = E 1 ν 2 ε θ + ν ε Z
σ z = E 1 ν 2 ε Z + ν ε θ
where E is the modulus of elasticity, εθ is the circumferential strain, εZ is the axial strain, and ν is Poisson’s ratio.
The wall thickness of the pumping pipe is set to h, and the inner wall of the pipeline is subjected to a homogeneous pressure p. According to the mechanics of materials, the circumferential stress σθ at any point along the pipe diameter is
σ θ = p a 2 b 2 a 2 1 + b 2 4 r 2
Along the concrete pumping direction, a pumping pipe section of length l is selected, axial and circumferential strain gauges are arranged at cross-flow sections 1 and 2, and the axial and circumferential strains are measured as εθ1, εZ1, εθ2, and εZ2. As shown in Figure 4, the pressure difference Δpn between cross-flow sections 1 and 2 is
Δ p n = E b + a h ε θ 2 ε θ 1 + ν ε z 2 ε z 1 a 2 1 ν 2 1 + b 2 / 4 r 2
According to the Concrete Pumping Construction Technical Regulations (JGJ/T10-2011) [29], the conversion coefficient of the circumferential pressure and axial pressure in the pumping pipe is 0.9. The circumferential pressure pn calculated by Equation (31) needs to be converted into an axial pressure, and the axial pressure Δpe can be expressed as follows:
Δ p e = Δ p n 0.9

5. Analysis of Results

5.1. Analysis of Experimental Results

A high-rise residential building under construction with 32 floors and a total floor height of 100 m is taken as the object of study. The site uses a certain type of truck-mounted pump; the maximum theoretical conveying capacity of the pump is 90 m3/h, the pumping concrete cylinder diameter is 230 mm, and the conveying cylinder stroke is 1600 mm. The pumping pipe has an internal diameter of 125 mm, a wall thickness of 10 mm, an elastic modulus of 210 GPa, and a Poisson’s ratio of 0.3. The pumping pressure is adjusted according to the construction floor, with a minimum pressure of 10 MPa and a maximum pressure of 20 MPa. In the experiment, the concrete used for on-site pumping is ordinary commercial C30 concrete produced by a manufacturer in Wuhan, and the experiments are carried out according to the standard “Slump Test of Concrete Mixes (T0511-94)” specifications. The mix ratios are shown in Table 1.
The slump experiment is mainly used to observe the slump shape of concrete and mortar under the action of dead weight, to determine their flow characteristics. Sampling of the mixer truck before the experiment is required. Before sampling, the mixer truck rapidly rotates at a rate of 20–30 rpm for 30 s so that the concrete in the mixer truck is fully mixed, and the tank opening is opened so that the concrete mixture is discharged into a trolley, completing the sampling before pumping. The concrete and mortar in the cart are tested for several times, respectively, and a stopwatch is used to record the time T100 when the mortar slump reaches 100 mm. The slump experimental results are shown in the table.
In this study, the average flow rate of concrete in the conveying pipe is measured to be 0.905 m/s. The average density of the concrete is measured to be 2400 kg/m3, and the average density of cement mortar is 2182 kg/m3. The measured slumps of the concrete and mortar are shown in Table 2. The average slump S of the concrete is 210 mm, the measurement process of the mortar is the same as that of the concrete, and the average slump S1 of the mortar is 230 mm.
According to Equations (2), (3), and (10), the empirical formula giving the pressure loss per unit length is calculated as follows:
Δ p c = 10033   Pa 0.01   MPa
According to the coarse aggregate particle size of the same specifications to meet the concrete grade, a gravel pile of 5~25 mm coarse aggregates is randomly selected several times, and Figure 5 shows the actual particle size distribution of coarse aggregates obtained through sampling analysis.
The randomly sampled aggregate particles are classified into three fractions according to their elongated, vertebral, or flake shape, and the randomly sampled aggregate particles are divided into three components: strip, cone, and schistose. Particles are randomly selected from each component, and the total mass of the coarse aggregates selected from the three components is measured. The average mass of the coarse aggregate particles is considered to be the average mass of the particles when the average mass of the particles is within a 5% error after repeated experiments. Based on the coarse aggregate particles extracted, the average mass of 18 aggregate particles is measured to be 138.60 g. A HandySCAN noncontact 3D laser scanner combined with Geomagic Design X (v.19.0.2) software is used to statistically determine that the average surface area of the 18 coarse aggregate particles is 22,335.89 mm2, the average density of the aggregate particles is 2360 kg/m3, and, according to Equations (21) and (24), the equivalent particle size of the coarse aggregates K is 15.80 mm. The time required for cement mortar to slump 100 mm is 0.08 s. According to Equation (19), the mortar kinematic viscosity coefficient u is 10.6 Pa·s. According to Equations (16)–(18), the Reynolds number Re is 0.611, and the relative roughness of the coarse aggregates Kd is 2.393 mm. Thus, according to Equation (25), the resistance coefficient λ is 0.66. Based on the pipeline length l, the pumping velocity v, the mortar kinematic viscosity coefficient u, and the mortar density ρs, the pressure loss per unit length is calculated by the pumping one-dimensional flow model as follows:
Δ p m = 0.022   MPa
When a pump truck pumps concrete, the force conditions close to the pumping inlet of the pipeline generated by the impact of the plunger pump and concrete reflux are complex. A straight pumping pipe section with a relatively stable concrete flow pattern is selected for the stress–strain test. The strain monitoring system is mainly composed of three parts: resistive strain gauges, a DHDAS dynamic signal acquisition system, and a data storage system. Additional lab equipment includes 502 glues, sandpaper, a level, alcohol, connecting wires, 703 silica gel, etc.
During the pumping of concrete by the pump truck, the pipeline near the pumping inlet is subjected to the impact of the plunger pump and the return flow of concrete, which makes the force situation complicated. In this paper, the pumping straight pipe section with relatively stable concrete flow pattern is selected to carry out the strain test. The height of the pipeline with strain gauge is 70 m above the ground, and the distance between the two monitoring points is 1.5 m. The type of resistance strain gauge is BX120-3AA, and the strain gauge arrangement is bidirectional vertical circumferential and axial arrangement. After pasting firmly on site, the pasting quality of the strain gauge is checked. If the deviation is too large, polishing and pasting is repeated, and if the paste quality is good, the strain gauge is waterproof and insulated with 703 silica gel. Considering the temperature compensation, a PC computer and DHDAS dynamic signal acquisition and analysis software are used to collect data on the strain of the monitored pipe section, and the sampling frequency is 50 Hz. The testing of pump tube strain is repeated many times, and the circumferential and axial strain changes monitored at the two monitoring points are shown in Figure 6.
The experimental results show that the circumferential strain varies between 84 and 93 μm, and the axial strain varies between 13 and 22 μm. Taking the values of the stable section and analyzing them, the circumferential strain at measurement point 1 is 87.4 μm and the axial strain is 17.4 μm, whereas the circumferential strain at measurement point 2 is 85.2 μm and the axial strain is 15.6 μm. The calculated circumferential pressure at measurement points 1 is 6.566 MPa, and that at measurement point 2 is 6.372 MPa. According to Equations (28)–(32), the pressure loss per unit length is obtained as follows:
Δ p e = 0.0263   MPa
The pressure loss per unit length values obtained from empirical equations, the one-dimensional flow model, and experiments are compared. The smallest pressure loss is obtained with the empirical formulas, which is approximately 62.0% of the actual measured pressure loss. The calculated pressure loss is small for the following reasons. First, the resistance term consists of the frictional resistance between the concrete and the pipe wall during the conveying process and the bonding force inside the concrete. Second, the concrete pumping process is regarded as the overall movement of the plunger flow. The frictional resistance is concentrated in the contact area between the concrete and the pipe wall, ignoring the blocking effect on the mortar in the lubrication layer produced by the coarse aggregate particles. The pressure loss calculated by the one-dimensional flow model is relatively close to the experimental value, and the relative difference is only 20.2%. The results indicate that the source of pressure loss considered in the construction of the one-dimensional flow model is basically the same as that in the real situation. The pressure loss mainly comes from the frictional resistance generated by the relative motion of the mortar in each layer in the lubrication layer, as well as from the large number of vortices generated by large aggregate particles, and the large wall roughness blocking effect increases the pressure loss. In this model, the transition zone between the lubrication layer and the plunger layer is not considered. Therefore, the pressure loss generated in this part is neglected, resulting in the pressure loss calculated by the one-dimensional flow model being smaller than the experimental value. In addition, in the calculation of the pressure loss values by the empirical formulas and the one-dimensional flow model, the pumping concrete is assumed to be in an ideal state, and its flow state is assumed to be a constant flow. However, the actual pumping process of concrete involves intermittent plunger movement, and its flow state is a nonconstant flow. The concrete close to the exit area of the ram pump is more affected by the impact of the ram pump and the gravity return of the concrete, resulting in a high pressure loss. In contrast, the exit area at the far end of the ram pump is less affected and has a relatively small pressure loss per unit length. Combined with engineering experience, in the area near the pumping exit area, the fluctuation degree of the concrete flow with time is small. However, due to the pumping space, cost, and other factors, the pumping outlet concrete flow in engineering practice has not reached the ideal constant state. In other words, the experimentally measured pressure loss is slightly greater than the value in the ideal state of pressure currently.

5.2. Example Validation and Analysis

Due to the coarse aggregate grading shape of S25-A25 concrete in reference [24] being unknown, the equivalent coarse aggregate diameter of 15.8 mm is adopted based on the data obtained from the experiment in the previous section. In the reference, the pumping pressure loss was measured by 170 m horizontal pumping circuit experiment and lubrication layer thickness of S50-A25 concrete using the ultrasonic velocity profile (UVP) method.
The BSA2110HP-D pump truck is used in the field, and the pump pipe with a diameter of 125 mm and a wall thickness of 7.7 mm is selected. A rheometer is used to measure the thickness of the lubricating layer. The material composition of S50-A25 concrete is shown in Table 3.
The density of cement is 3150 kg/m3, the density of coarse aggregate is 2610 kg/m3, the density of mortar ρs is 2100 kg/m3, the size of sand is 0.08–5 mm, and the maximum aggregate size is 25 mm. To validation the accuracy of the model, the pressure loss measured in the pumping circuit experiment is compared with the calculation results of the pump pressure loss one dimensional flow model.
In the literature, the pumping flow in the concrete conveying pipe is 42 m3/h, the viscosity of the lubricating layer is 2.50 Pa·s, measured by rheometer, and the thickness of the lubricating layer is 2.09 mm, measured by the ultrasonic (UVP) velocity profile method. According to Equation (15), the equivalent diameter is twice the thickness of the lubricating layer, and its value is 4.18 mm. According to Equation (18), the relative roughness of the coarse aggregates Kd is 3.7799. According to Equations (16)–(18), the Reynolds numbers Re is 3.3392, and according to Equation (25), the resistance coefficient λ is 0.4021. According to Equation (27), the pressure loss per unit length is calculated by the pumping one-dimensional flow model as follows:
Δ p e = 0.02284 MPa
The measured pressure loss value in the reference is 0.02823, and the relative error between the measured value and the calculated value is 19.09%. The results show that the calculated pressure loss of the pumping one-dimensional model flow is basically the same as the actual pressure loss. These comparison results verify the feasibility of one-dimensional flow model pumping. The pressure loss mainly comes from the frictional resistance generated by the relative motion of each layer of mortar and the lubrication layer, as well as from the large number of vortices generated by large aggregate particles and the large wall roughness blocking effect. It is worth noting that the construction of the one-dimensional flow model in this study does not consider the transition region between the lubrication layer and the plunger layer. Therefore, the pressure loss caused by this part is ignored, which leads to the calculation result of the one-dimensional model flow model being smaller than the measured value.

6. Conclusions

  • In this paper, based on the characteristics of concrete pumping flow, considering the viscous force of mortar and the blocking effect of coarse aggregate particles in the lubricating layer, a one-dimensional model of concrete pumping pressure loss was established.
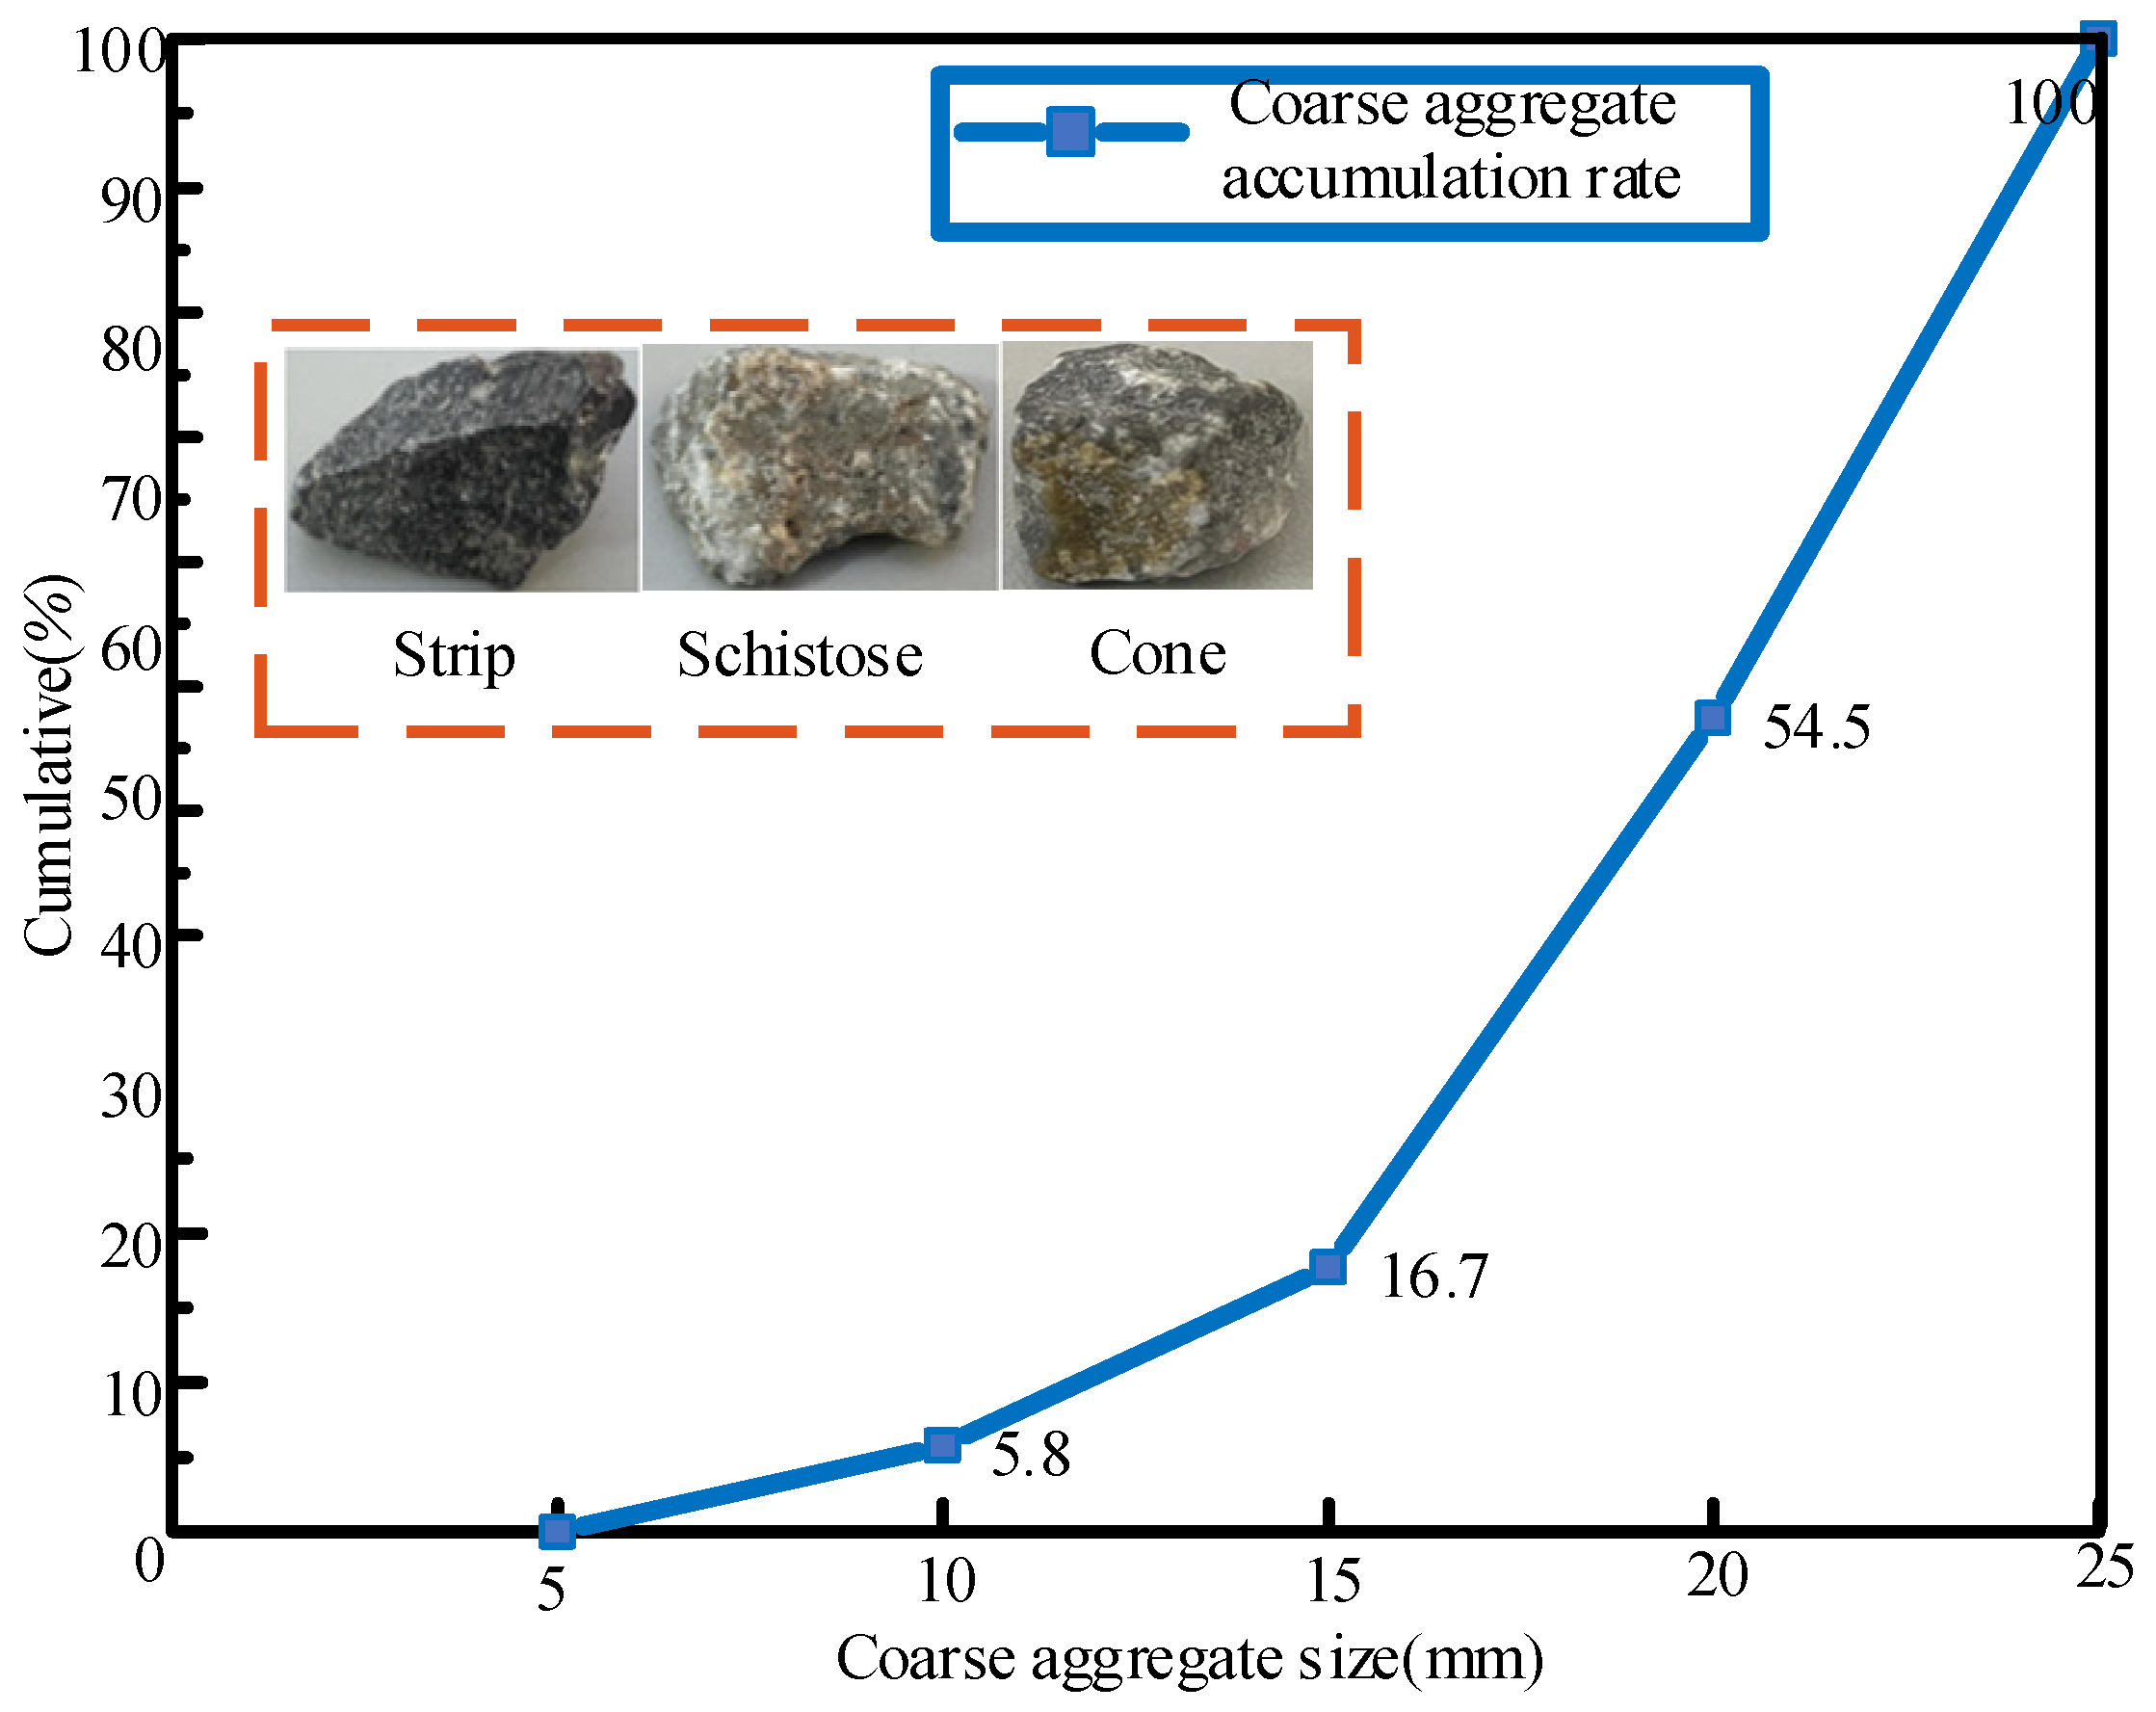
  • In this paper, the HandySCAN noncontact scanner and reverse modeling software Geomagic Design X (v.19.0.2) were used to reconstruct the complex geometrical shapes of the aggregate particles, and the blocking effect of coarse aggregate particles on the flow state of concrete was measured by equivalent particle size.
  • Based on a comparison of the values calculated with empirical equations and the measured values in the field, the relative error between the calculated pressure loss value and the measured value is about 20.2%. The results indicate that the sources of pressure loss considered in this study are basically the same as those in real situations.

Author Contributions

X.Z.: Methodology, formal analysis, writing—original draft. G.G.: Conceptualization, funding acquisition, writing—review and editing. M.W.: Resources, project administration. J.D.: Writing—review and editing, project administration, supervision. All authors have read and agreed to the published version of the manuscript.

Funding

This work is supported by National Natural Science Foundation of China (grant no. 51805163).

Institutional Review Board Statement

Not applicable.

Informed Consent Statement

Not applicable.

Data Availability Statement

The datasets generated or analyzed during this study are available from the corresponding author on reasonable request.

Conflicts of Interest

The authors declare that they have no conflicts of interest to report regarding the present study.

References

  1. Li, F.; Shen, W.; Yuan, Q.; Hu, X.; Li, Z.; Shi, C. An overview on the effect of pumping on concrete properties. Cem. Concr. Compos. 2022, 129, 104501. [Google Scholar] [CrossRef]
  2. Chen, J.; Xie, H.; Guo, J.; Chen, B.; Liu, F. Preliminarily experimental research on local pressure loss of fresh concrete during pummping. Measurement 2019, 147, 106897. [Google Scholar] [CrossRef]
  3. Secrieru, E.; Mohamed, W.; Fataei, S.; Mechtcherine, V. Assessment and prediction of concrete flow and pumping pressure in pipeline. Cem. Concr. Compos. 2020, 107, 103495. [Google Scholar] [CrossRef]
  4. Lee, J.S.; Kim, E.S.; Jang, K.P.; Park, C.K.; Kwon, S.H. Prediction of concrete pumping based on correlation between slump and rheological properties. Adv. Concr. Constr. 2022, 13, 395–410. [Google Scholar]
  5. Guo, L.; Liu, Y.; Wang, X.; Fu, L.; Jiang, K. Design of CFRP-steel hybrid structure pipeline for concrete pumping under ultrahigh pressure. Procedia Struct. Integr. 2019, 22, 194–200. [Google Scholar] [CrossRef]
  6. Wang, Q.; Pan, C.; Liang, Y.; Gan, W.; Ho, J. Pumping lightweight aggregate concrete into high-rise buildings. J. Build. Eng. 2023, 80, 108069. [Google Scholar] [CrossRef]
  7. Feys, D.; De Schutter, G.; Fataei, S.; Martys, N.S.; Mechtcherine, V. Pumping of concrete: Understanding a common placement method with lots of challenges. Cem. Concr. Res. 2022, 154, 106720. [Google Scholar] [CrossRef]
  8. Hao, J.; Jin, C.; Li, Y.; Wang, Z.; Li, H. Simulation of motion behavior of concrete in pump pipe by dem. Adv. Civ. Eng. 2021, 2021, 3750589. [Google Scholar] [CrossRef]
  9. Shin, T.Y.; Kim, Y.H.; Park, C.B.; Kim, J.H. Quantitative evaluation on the pumpability of lightweight aggregate concrete by a full-scale pumping test. Case Stud. Constr. Mater. 2022, 16, e01075. [Google Scholar] [CrossRef]
  10. Tavangar, T.; Hosseinpoor, M.; Marshall, J.S.; Yahia, A.; Khayat, K.H. Discrete-element modeling of shear-induced particle migration during concrete pipe flow: Effect of size distribution and concentration of aggregate on formation of lubrication layer. Cem. Concr. Res. 2023, 166, 107113. [Google Scholar]
  11. Xiang, X.; Liu, X.; Ding, F.; Zhang, L. Characteristics and mechanism of the particle migration subject to the shear flow of concrete flow under pressure. J. Build. Eng. 2023, 79, 107693. [Google Scholar]
  12. Choi, M.; Roussel, N.; Kim, Y. Lubrication layer properties during concrete pumping. Cem. Concr. Res. 2013, 45, 69–78. [Google Scholar] [CrossRef]
  13. Le, H.D.; Kadri, E.H.; Aggoun, S.; Vierendeels, J.; Troch, P.; De Schutter, G. Effect of lubrication layer on velocity profile of concrete in a pumping pipe. Mater. Struct. 2015, 48, 3991–4003. [Google Scholar] [CrossRef]
  14. Secrieru, E.; Fataei, S.; Schröfl, C.; Mechtcherine, V. Study on concrete pumpability combining different laboratory tools and linkage to rheology. Constr. Build. Mater. 2017, 144, 451–461. [Google Scholar] [CrossRef]
  15. Kim, K.Y.; Kim, Y.J.; Choi, M.S. Horizontal–vertical ratio for concrete pumping pipe. Case Stud. Constr. Mater. 2022, 16, 996. [Google Scholar] [CrossRef]
  16. Choi, M.S. Numerical prediction on the effects of the coarse aggregate size to the pipe flow of pumped concrete. J. Adv. Concr. Technol. 2014, 12, 239–249. [Google Scholar] [CrossRef]
  17. Hu, J.; Wang, K. Effect of coarse aggregate characteristics on concrete rheology. Constr. Build. Mater. 2011, 25, 1196–1204. [Google Scholar] [CrossRef]
  18. Cui, W.; Tang, Q.W.; Song, H.F. Effects of Viscosity on Pumping Concrete Behavior Using Computational Fluid Dynamics Method. ACI Mater. J. 2021, 118, 117–126. [Google Scholar]
  19. Kwon, S.H.; Park, C.K.; Jeong, J.H. Prediction of concrete pumping: Part II-Analytical prediction and experimental verification. ACI Mater. J. 2013, 110, 657. [Google Scholar]
  20. Lu, X.; Zhang, W.; Xu, L.; Chen, Y. A lateral pressure prediction model for bottom-up pumping of SCC in large-diameter steel tubes based on Bernoulli's Principle. Case Stud. Constr. Mater. 2023, 19, 2470. [Google Scholar] [CrossRef]
  21. Zhuang, W.; Li, S.; Deng, Q.; Chen, M.; Yu, Q. Effects of coarse aggregates size on dynamic characteristics of ultra-high performance concrete: Towards enhanced impact resistance. Constr. Build. Mater. 2024, 411, 134524. [Google Scholar] [CrossRef]
  22. Liu, G.; Guo, X.; Cheng, W.; Chen, L.; Cui, X. Investigating the migration law of aggregates during concrete flowing in pipe. Constr. Build. Mater. 2020, 251, 119065. [Google Scholar] [CrossRef]
  23. Tavangar, T.; Hosseinpoor, M.; Yahia, A.; Khayat, K.H. Computational Investigation of Concrete Pipe Flow: Critical Review. ACI Mater. J. 2021, 118, 203–215. [Google Scholar]
  24. Choi, M.S.; Kim, Y.J.; Jang, K.P.; Kwon, S.H. Effect of the coarse aggregate size on pipe flow of pumped concrete. Constr. Build. Mater. 2014, 66, 723–730. [Google Scholar] [CrossRef]
  25. Zhan, Y.; Gong, J.; Huang, Y.; Shi, C.; Zuo, Z.; Chen, Y. Numerical study on concrete pumping behavior via local flow simulation with discrete element method. Materials 2019, 12, 1415. [Google Scholar] [CrossRef] [PubMed]
  26. Cao, G.; Zhang, H.; Tan, Y.; Wang, J.; Deng, R.; Xiao, X.; Wu, B. Study on the Effect of Coarse Aggregate Volume Fraction on the Flow Behavior of Fresh Concrete via DEM. Procedia Eng. 2015, 102, 1820–1826. [Google Scholar] [CrossRef]
  27. Morinaga, S. Pumpability of concrete and pumping pressure in pipelines. In Proceedings of the Rilem Seminar, Leeds, UK, 22–24 March 1973; Volume 7, pp. 1–39. [Google Scholar]
  28. Hu, X.F.; Su, Z.X. The method of modified slump cone measuring fluidity of fresh concrete. Concrete 2006, 8, 64–69. [Google Scholar]
  29. JGJ/T 10; Technical Specification for Construction of Concrete Pumping. Ministry of Housing and Urban-Rural Development of the People’s Republic of China: Beijing, China, 2011.
Figure 1. Schematic diagram of stress analysis of the concrete unit in a straight pipe section.
Applsci 14 03101 g001
Figure 2. Schematic diagram of the one-dimensional flow model for concrete pumping.
Applsci 14 03101 g002
Figure 4. Layout of the measurement points and stress distribution.
Applsci 14 03101 g004
Figure 5. Actual aggregate particle modeling and size distribution.
Applsci 14 03101 g005
Figure 6. On-site experimental testing and experimental results.
Applsci 14 03101 g006
Table 1. Content of each component in C30 concrete.
Concrete TypeCement (kg)Water
(kg)
Fly Ash II.
(kg)
Mineral Powder
(kg)
Water-Reducing Agent
(kg)
Sand
(kg)
Coarse Aggregates
(kg)
Wet Bulk Density
(kg)
C302001026070910319192400
Table 2. Slump experiment results.
Experiment No.1234
Slump of concrete/mm212210205213
Slump of mortar/mm225230232235
Table 3. Content of each component in S25-A25 concrete.
Cement CEMI52.5N
(kg/m3)
Fly Ash (kg/m3)Blast Furnace Slag (kg/m3)Water-Reducing AgentSand
(kg/m3)
Coarse Aggregates (kg/m3)Maximum Aggregate Size (mm)
350502250.3373687125
Disclaimer/Publisher’s Note: The statements, opinions and data contained in all publications are solely those of the individual author(s) and contributor(s) and not of MDPI and/or the editor(s). MDPI and/or the editor(s) disclaim responsibility for any injury to people or property resulting from any ideas, methods, instructions or products referred to in the content.

