Article

Fault Diagnosis Method of Box-Type Substation Based on Improved Conditional Tabular Generative Adversarial Network and AlexNet

School of Mechanical and Precision Instrument Engineering, Xi’an University of Technology, Xi’an 710048, China
*
Author to whom correspondence should be addressed.
Appl. Sci. 2024, 14(7), 3112; https://doi.org/10.3390/app14073112
Submission received: 12 March 2024 / Revised: 31 March 2024 / Accepted: 5 April 2024 / Published: 8 April 2024
(This article belongs to the Section Applied Physics General)

Abstract

:
To solve the problem of low diagnostic accuracy caused by the scarcity of fault samples and class imbalance in the fault diagnosis task of box-type substations, a fault diagnosis method based on self-attention improvement of conditional tabular generative adversarial network (CTGAN) and AlexNet was proposed. The self-attention mechanism is introduced into the generator of CTGAN to maintain the correlation between the indicators of the input data, and a large amounts of high-quality data are generated according to the small number of fault samples. The generated data are input into the AlexNet model for fault diagnosis. The experimental results demonstrate that compared with the SMOTE and CTGAN methods, the dataset generated by the self-attention-conditional tabular generative adversarial network (SA-CTGAN) model has better data relevance. The accuracy of fault diagnosis by the proposed method reaches 94.81%, which is improved by about 11% compared with the model trained on the original data.

1. Introduction

As a crucial piece of equipment in the power system’s transmission and distribution chain, the box-type substation performs a vital role in voltage regulation and electricity distribution, with widespread applications in urban and rural areas, industrial and mining enterprises, and public buildings. Because the box-type substation is mainly installed outdoors, its operating environment is complex and changeable, making it very susceptible to damage from natural factors and external forces. Therefore, combined with its own internal equipment diversity, there will be a variety of fault problems in the operation process, leading to various challenges in maintenance and management. This undoubtedly poses a severe challenge to the stability and reliability of the power supply system, directly affecting the safety of daily electricity use and the production efficiency of enterprises. Therefore, timely, effective, and reliable health monitoring of box-type substations is of great significance for the safe operation of the power system.
At present, the traditional manual inspection mode requires that the inspection personnel have certain prior knowledge and experience. Furthermore, the box-type substation structure is complex, and there are numerous components, which makes the inspection task extremely challenging. In addition, traditional regular inspections have inherent lags, which not only seriously reduce work efficiency and increase unnecessary costs but also make it difficult to detect and troubleshoot hidden faults in time. Therefore, the research of fault diagnosis technology has gradually become a research hotspot.
Fault diagnosis technology aims to identify both the normal and abnormal conditions of equipment, whether globally or locally, by monitoring and analyzing its operational status. In the case of malfunction, the technology can also classify the fault and pinpoint the faulty component accurately. Currently, the mainstream fault diagnosis techniques primarily include methods based on physical models, statistical models, and artificial intelligence. Among them, fault diagnosis technology based on deep learning has received widespread attention due to its high diagnostic accuracy and the popularity of data acquisition technology, without needing a deep understanding of the physical model of the diagnostic object. However, deep learning-based fault diagnosis methods face a challenge in practical applications: they rely on massive data accumulation. Since box-type power distribution equipment spends most of its time in normal operating conditions, fault samples are scarce, resulting in an imbalance between healthy samples and fault samples, which can affect diagnostic performance. To address this issue, current research tends to adopt generative adversarial networks (GANs). This approach directly addresses the problems of small sample sizes and class imbalance from the input source layer, simplifying complex data sampling and processing procedures while avoiding the tedious task of building specialized diagnostic models for different diagnostic objects.
Therefore, for highly integrated and complex equipment, such as box-type substations, this article utilizes collected historical data of box-type substations to construct a data derivation model based on the improved CTGAN. Replacing the two fully connected layers in the CTGAN generator with self-attention layers transforms the static weights generated in the CTGAN generator into dynamic weights that are free from positional dependencies during data input, enabling better preservation of the correlation between different features. By learning the relationship matrix between input features through the self-attention mechanism, the correlation between different features is maintained, thereby improving the drawback of CTGAN’s failure to model the dependency relationships between each feature. This approach generates more high-quality data from a limited number of faulty samples. By employing the data derivation method, the sample data are enriched, effectively addressing the problem of small samples in the fault diagnosis of box-type substations and thus enabling precise prediction of the equipment status of box-type substations.
The remainder of this paper is structured as follows. Section 2 presents an overview of the current research status on fault diagnosis and deep learning-based fault diagnosis methods, both domestically and internationally. It further identifies the key research areas and existing shortcomings. In Section 3, the primary faults associated with the research subject, the box-type substation, are analyzed and categorized, laying the foundation for subsequent data analysis. Section 4 elaborates on the fundamental principles of generative adversarial networks and self-attention mechanisms and establishes an SA-CTGAN data derivation model based on these principles, along with a corresponding structural diagram. To assess the model’s derived data performance in future applications, Section 5 introduces the AlexNet fault diagnosis model, detailing its network architecture. Subsequently, Section 6 designs a comparative experiment through case studies to evaluate the model’s performance. Finally, Section 7 offers concluding remarks on the overall research.

2. Research Status

2.1. Current Research Status of Fault Diagnosis Methods

Fault diagnosis technology is a technique that monitors and analyzes the operational status of equipment to determine whether it is functioning normally or abnormally in its entirety or specific parts. It categorizes the abnormalities and faults that occur in the equipment and pinpoints the faulty components. Currently, the mainstream fault diagnosis technologies are mainly divided into physical model-based diagnosis methods [1], statistics-based diagnosis methods [2], and artificial intelligence-based diagnosis methods.
(1)
Physical models
The diagnosis method based on a physical model usually has high diagnostic accuracy but lacks universality. It requires that the mathematical model of the object system be known, and as the structures of various equipment become increasingly complex and integrated, it is difficult to establish accurate mechanistic models. Therefore, the development and promotion of fault diagnosis methods based on physical models have been limited to a certain extent, and there is also less related research.
(2)
Statistical models
The statistical model-based fault diagnosis method necessitates neither a profound comprehension of the equipment or the system’s structure and principles nor the establishment of intricate mechanisms or mathematical models, thus exhibiting high universality. However, it lacks clarity in the physical significance of diagnosed faults, offers limited interpretation, and possesses slightly lower diagnostic accuracy compared to methods rooted in physical models. The diagnosis method based on the artificial network can excavate the fault knowledge contained in the data by analyzing massive amounts of data and self-learning to realize fault diagnosis, which has stronger explanatory properties than the first two diagnostic methods.
(3)
Artificial intelligence
Fault diagnosis methods based on artificial intelligence can be divided into fault diagnosis methods based on expert systems [3], diagnosis methods based on shallow machine learning [4,5], and fault diagnosis methods based on deep learning [6,7]. The diagnosis method based on the expert system uses expert knowledge and experience to form a knowledge base, so the diagnostic model has the judgment ability similar to that of experts and can take into account the uncertain factors in the future and the special situation of the diagnostic object, but it requires a large amount of knowledge accumulation and revision, and it is difficult to establish a perfect diagnostic knowledge base. Both shallow machine learning and deep learning-based fault diagnosis methods rely on their feature extraction capabilities to mine the hidden information from the data to complete the fault diagnosis work, but with the increasing amount and dimension of data, the deep learning method has better performance than the shallow machine learning method [8]. Benefiting from the massive device state detection data and the rapid development of artificial neural networks, deep learning has been widely used in the field of fault diagnosis due to its excellent feature learning ability.
The above research indicates that due to the lack of the need for a deep understanding of the precise physical model of the diagnostic object or system and the widespread application of data acquisition technology, fault diagnosis techniques based on deep learning have garnered the most widespread attention in related fields due to their high accuracy. Therefore, this article takes the box-type substation, a key piece of equipment in the distribution network, as an example to conduct research on fault diagnosis methods for distribution network equipment based on deep learning methods.

2.2. Research Status of Small Sample Issues in Fault Diagnosis

Deep learning-based fault diagnosis methods rely heavily on vast amounts of data accumulation. However, in practical application scenarios, equipment often operates normally under most conditions, resulting in a scarcity of fault samples. This imbalance between fault samples and healthy samples leads to a decline in the performance of deep learning-based fault diagnosis methods. In response to this issue, numerous scholars have proposed various solutions.
(1)
Research on methods based on data preprocessing and model structure
Some scholars adopted sampling technology to solve the problems of sparse input data and class imbalance in diagnostic models, which effectively improves the diagnostic performance of the model [9,10]. However, sampling technology has the potential to alter the distribution of the original data-set, resulting in distortion of the model, which will reduce the accuracy of fault diagnosis. Jia [11] designed a new learning mechanism to train the deep neural network by improving the loss function so that the deep neural network can maintain the accurate feature representation driven by the consistency of trend features and ensure the accurate fault classification driven by the consistency of the fault direction. The accuracy of this method can reach about 90% with only 100 samples polluted by strong noise. Zhang [12] proposed a compact convolutional neural network fault diagnosis model based on multi-scale feature extraction. This model utilized the multi-scale feature extraction unit to extract fault features of different time scales and comprehensively analyze them through the compact neural network, allowing for the extraction of more sensitive features with relatively shallow structures. This improvement led to enhanced diagnostic accuracy under conditions of small samples. Zhao [13] added a classification branch to the Siamese network, replaced the Euclidean distance measurement with a network measurement, and constructed an improved fault diagnosis model based on the Siamese neural network, consisting of a feature extraction network, a relationship measurement network, and a fault classification network. The similarity of the extracted features is measured by the relationship measurement network, which effectively guarantees the accuracy of fault diagnosis in the case of small samples. Xu [14] introduced a vision transformer model that incorporates multi-information fusion and leverages a time frequency representation graph. This model first decomposes the original vibration signal into various sub-signals of different scales through a discrete wavelet transform. Subsequently, it converts these sub-signals into time–frequency representation graphs using a continuous wavelet transform. Finally, the model serially inputs these graphs into its framework for accurate fault diagnosis. The experimental results show that this method can diagnose the fault of small sample bearing and has strong universality and robustness. Chen [15] combined wavelet and depthwise separable convolutional neural networks to design a few-parameter branch for time–frequency feature extraction. This branch captured fault features from a limited number of samples to realize fault diagnosis under small samples together with regular convolution.
(2)
Research on methods based on transfer learning
The process of dealing with small samples and class imbalanced problems by data preprocessing and improved neural networks is often complex and less versatile. The rise of transfer learning [16] provides a new direction for solving this problem. Liu [17] introduced a generalized transfer framework equipped with evolutionary capabilities, aimed at tackling the challenge of limited fault samples in industrial process fault diagnosis. The framework employs a transfer learning strategy combined with the adaptive mixup method to adaptively expand the fault samples to ensure the number and diversity of extended samples and uses the transformation matrix as the evolutionary channel to reduce the diagnostic error with the increase in fault samples without retraining the framework. Based on simulation data, Dong [18] proposed a fault diagnosis method combining convolutional neural networks and parameter transfer strategies, which avoids the problem of diagnosis accuracy caused by insufficient model training under small samples. Fu Song [19] constructed an engine fault diagnosis framework combining deep auto-encoders with transfer learning. The framework uses a deep auto-encoder to establish an engine fault feature extraction model with sufficient samples and transfer learning to extract features in small samples, using a support vector machine as a classifier to complete fault classification of small samples. Zhang [20] used a global average pooling layer instead of the fully connected layer to reduce the number of parameters to be trained in the convolutional neural network. Based on the improved transfer learning method of pre-training and fine tuning, it avoids the problem of overfitting in the case of small samples and the fault diagnosis task in the same scenario. The classification accuracy of the method was 92.25% when fine tuning was performed with 1% of the training set data in the target domain. Xiao [21], based on the transfer learning framework, added a large amount of source data with different distributions as training data to the target data and used the convolutional neural network as the base learner to update the weights of the training samples by employing the improved Tr AdaBoost algorithm. This formed a high-performance diagnostic model, improving the diagnostic accuracy in case of insufficient data in the target domain.
(3)
Research on methods based on generative adversarial learning
Transfer learning has a significant effect on the fault diagnosis of small samples, but it is difficult to find a suitable adaptive source domain for fault diagnosis knowledge transfer in equipment with complex structures (for example, the lack of fault data is common in the box-type substation targeted in this paper). With the emergence of GANs [22], more and more scholars have been focusing on the input source layer to solve the problem of fault diagnosis of small samples. Some scholars [23] expanded the bearing vibration signal of small samples using WGAN with a gradient penalty as the data generation model and used the expanded samples as the input of the self-attention convolutional neural network for fault diagnosis. This effectively improved the accuracy of bearing fault diagnosis under small samples. The scholars in [24] proposed a fault diagnosis method combining a generative adversarial network with transfer learning, which used a generative adversarial network to generate dummy samples with similar fault characteristics to actual engineering monitoring data and then introduced domain adaptation regular term constraints in the residual network training process to form a deep transfer fault diagnosis model. This effectively addressed the problem of low accuracy of the fault diagnosis model caused by insufficient available data of mechanical equipment and large data distribution differences under multiple working conditions in practical applications. Huang [25] introduced a dropout layer into the auxiliary classifier generative adversarial network (AC-GAN) to prevent the model from generating duplicate samples and added a convolutional layer to the AC-GAN discriminant to improve the anti-noise ability of the discriminator. This was performed to enhance the performance of the auxiliary classification generative adversarial network and generate a large number of high-quality fault samples. This approach solves the problem of a low fault recognition rate in the case of small samples. XU [26] introduced conditional constraints to the semi-supervised generative adversarial networks and optimized the loss function to enhance its guidance for the generator and discriminator, thereby improving the generative adversarial network. The generative model and semi-supervised learning ability of the model were utilized to solve the problem of insufficient data samples and sample labeling in fault diagnosis. Zhang [27] proposed a multi-module generative adversarial network augmented with an adaptive decoupling strategy. This strategy uses an adaptive learning method to update the initialized random noise of the generator, enabling it to obtain a better combination for generating samples. Additionally, a reconstruction module provides stronger constraints for the generator, which greatly improves the quality of the generated samples.
Based on the above research, it can be seen that the solution utilizing generative adversarial networks can directly address the issues of small sample size and class imbalance in fault diagnosis from the input source layer, reducing the complexity of data sampling and processing procedures. It also avoids the complicated process of building specific diagnostic models for different diagnostic objects. Consequently, focusing on complex integrated equipment such as box-type substations, this project constructs a data derivation model based on generative adversarial networks, aiming to solve the problem of small sample size in fault diagnosis of a box-type substation.
To address the challenge of training a high-performance fault diagnosis model with small samples, this paper proposes a fault diagnosis method for box-type substations based on an improved CTGAN and AlexNet network. In this method, the self-attention mechanism is added to the generator of CTGAN. The SA-CTGAN data derivation model is constructed, and the data are enriched and enhanced based on the original samples, particularly those with fewer samples. This, in turn, addresses the imbalance of health status data and fault status data categories, as well as the scarcity of fault data, all at the input source level. Finally, the expanded data are used as the input for the AlexNet fault diagnosis model to complete the fault diagnosis task of the box-type substation.

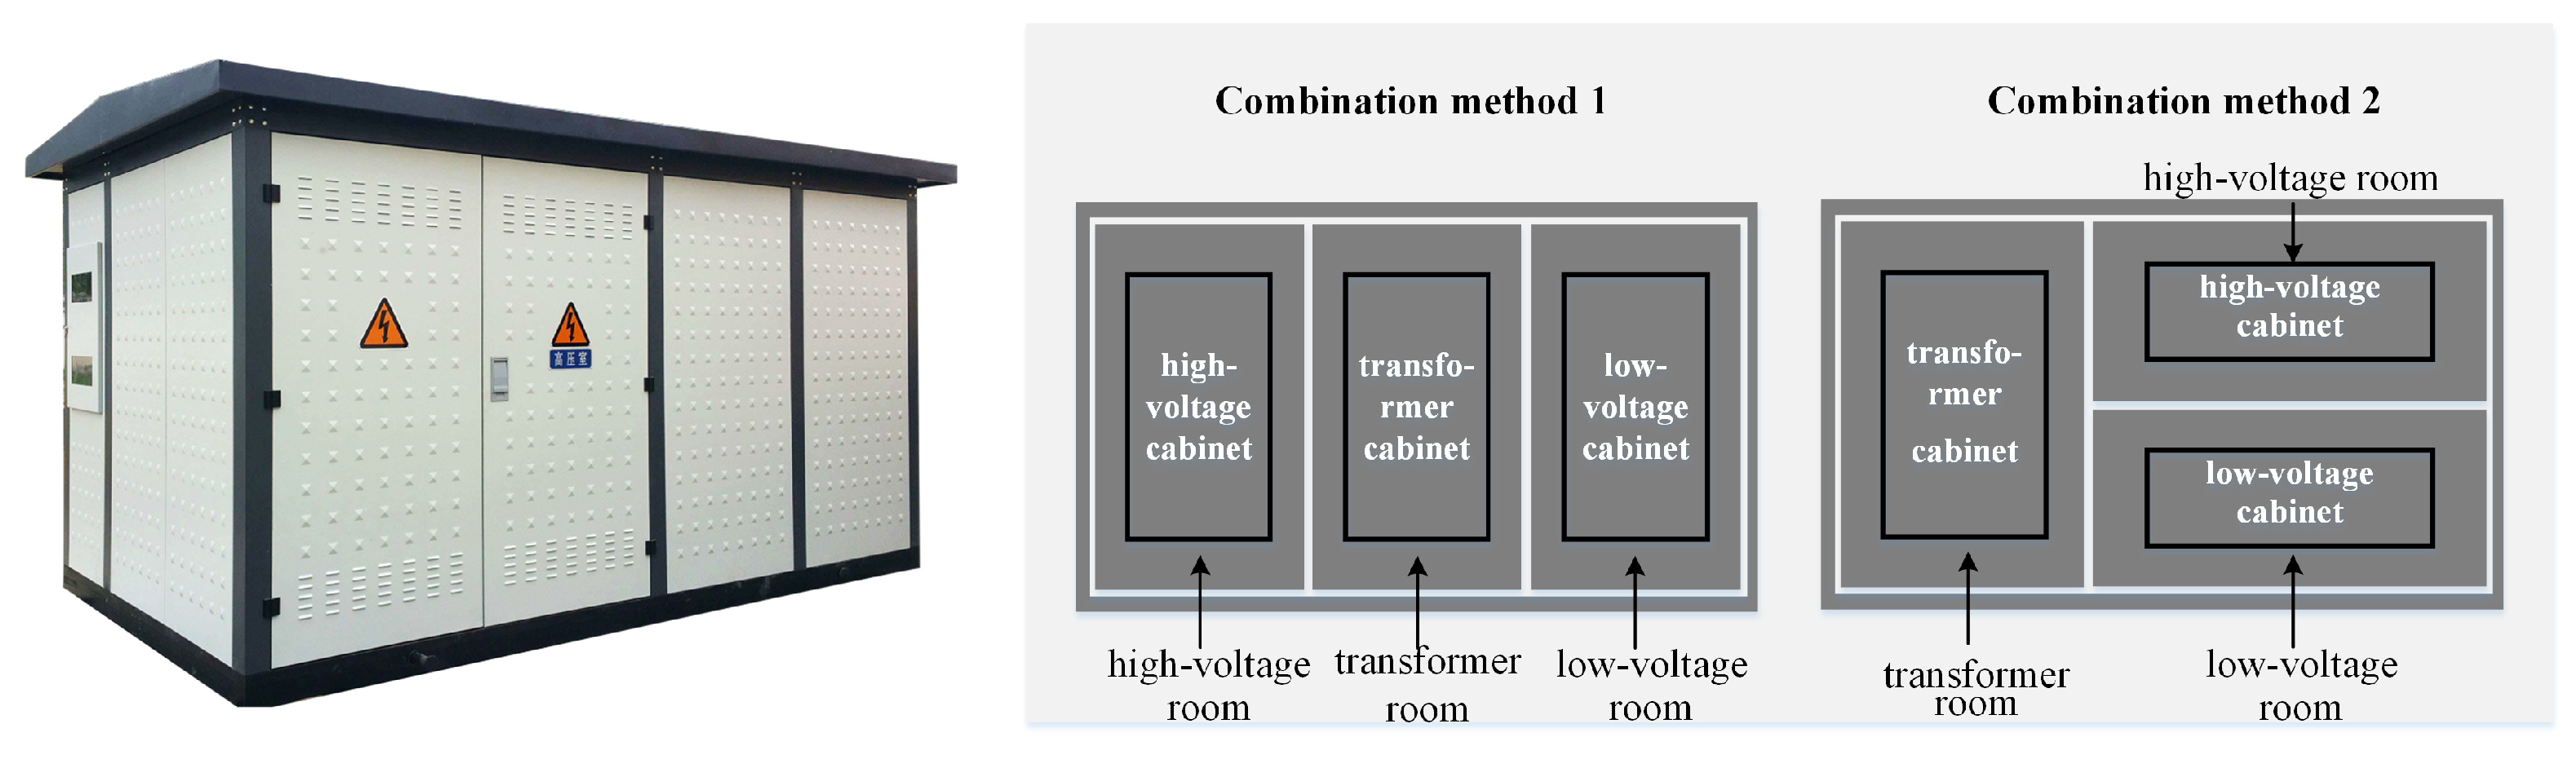
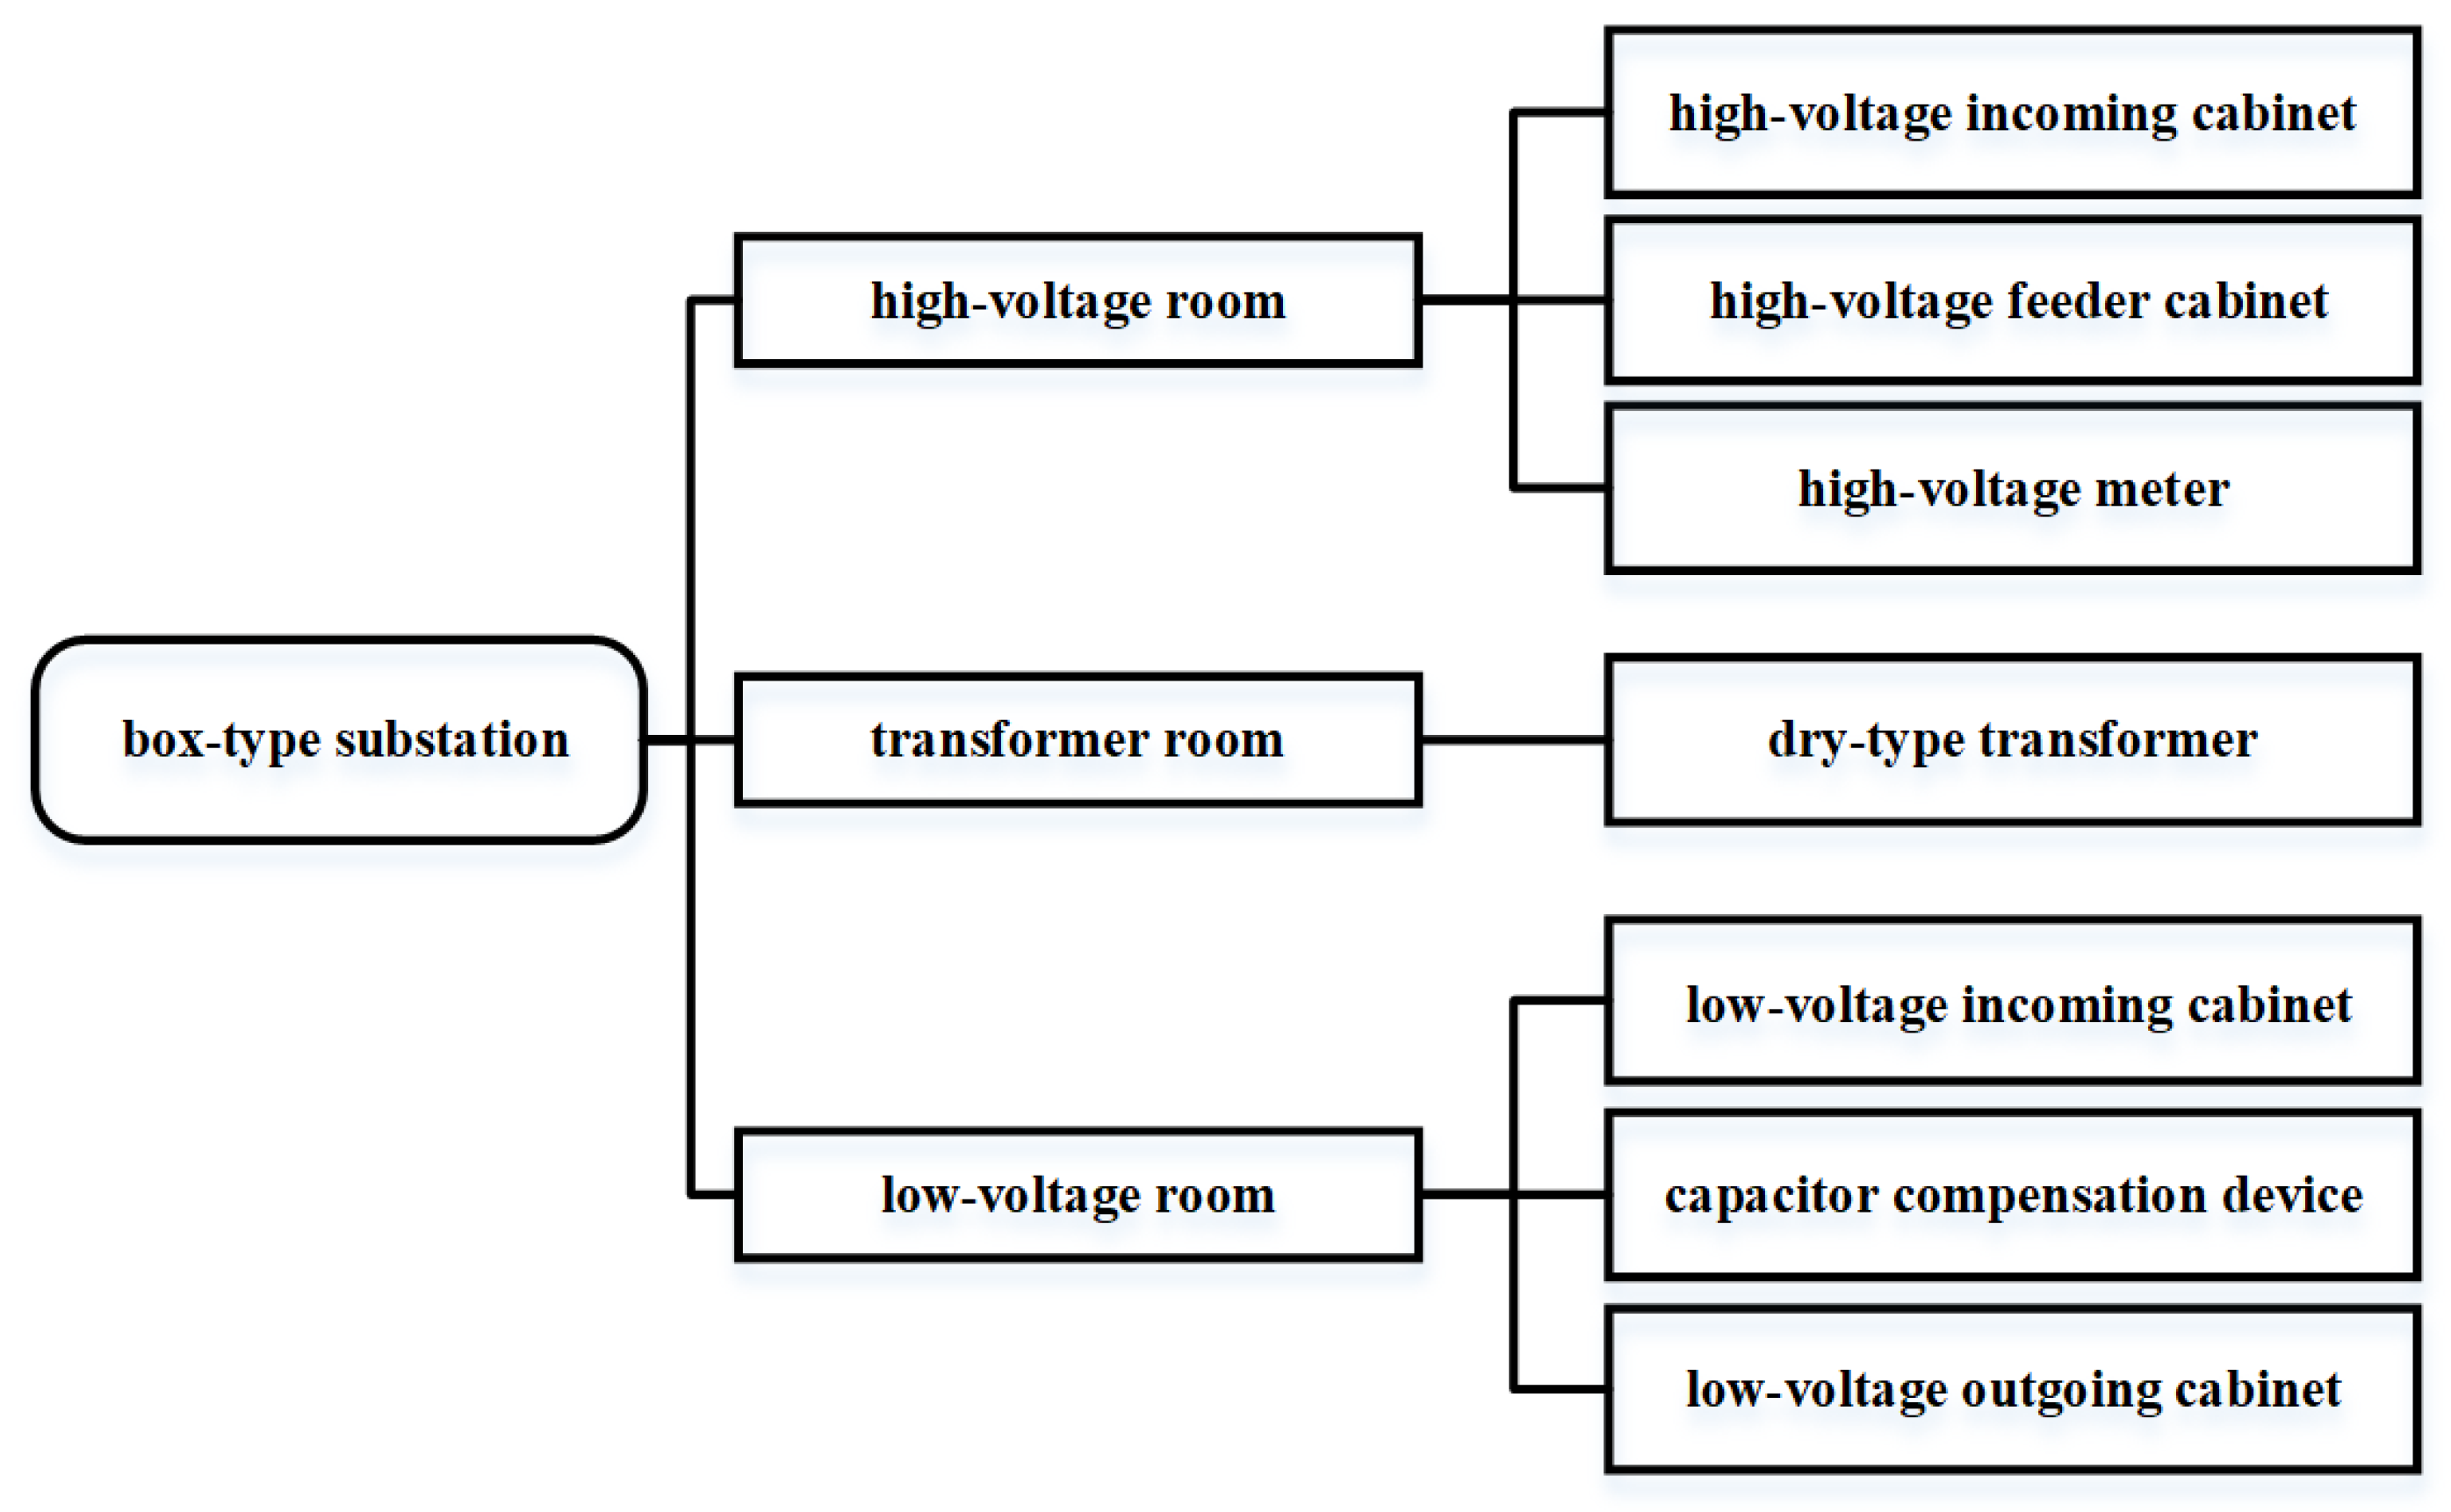
3. Main Fault Analysis of the Box-Type Substation

The box-type substation, also known as a pre-installed substation, is a kind of distribution transformer. It is a factory-prefabricated indoor and outdoor compact distribution device arranged according to a certain wiring scheme, and it is an organic combination of transformer step-down, low-voltage distribution, and other functions. It is especially suitable for the construction and transformation of urban power grids and has a series of advantages, such as strong completeness, small size, minimal land occupation, deep penetration into the load center, improved power supply quality, reduced loss, a short power transmission cycle, flexible site selection, strong adaptability to the environment, and convenient installation.
The box-type substation is composed of three parts: a high-voltage room, a transformer room, and a low-voltage room. There are two combinations, as shown in Figure 1. The high-voltage room consists of a high-voltage incoming cabinet, a high-voltage meter, and a high-voltage feeder cabinet. The dry-type transformers are generally placed in transformer rooms. The low-voltage room is composed of a low-voltage incoming cabinet, a capacitor compensation device, and a low-voltage outgoing cabinet.
The layout and structure are shown in Figure 1 and Figure 2, respectively.
To facilitate the timely location of fault components in the box-type substation, based on the overall structure and common faults of the box-type substation, the health state type can be divided into seven categories: normal operation F1, high-voltage circuit breaker fault F2, high-voltage arrester fault F3, dry-type transformer fault F4, low-voltage incoming circuit breaker fault F5, low-voltage outgoing circuit breaker fault F6, and capacitor arrester fault F7. On this basis, fault diagnosis research is carried out, and 24 indicators, as shown in Table 1, are collected as data support for data mining.

4. Research on the Data Derivation Method Based on CTGAN

GANs are typical data generation methods used to address issues such as small sample sizes or unbalanced data categories. They generate high-quality samples through adversarial competition between their generative network and discriminative network, but they are currently mainly applied to image-based data. CTGAN is a variant of GAN that can model and sample the class table data distribution. CTGAN overcomes the long-tail distribution and multi-mode distribution by taking advantage of normalization across patterns and designing a condition generator that is trained by sampling to deal with unbalanced discrete columns and generate high-quality tabular data. The box-type substation monitoring data collected in this paper have the same properties and characteristics as the tabular data regulated by CTGAN, so this paper establishes a data-derived model based on CTGAN. Due to the insufficient modeling of the relationship between the features of high-dimensional samples by CTGAN, the correlation between the dimensions of the generated samples cannot be maintained, so this paper introduces the self-attention mechanism into the generator of CTGAN to maintain the coupling relationship between features and establishes an SA-CTGAN data-derived model to enhance the original data and improve the accuracy of fault diagnosis.

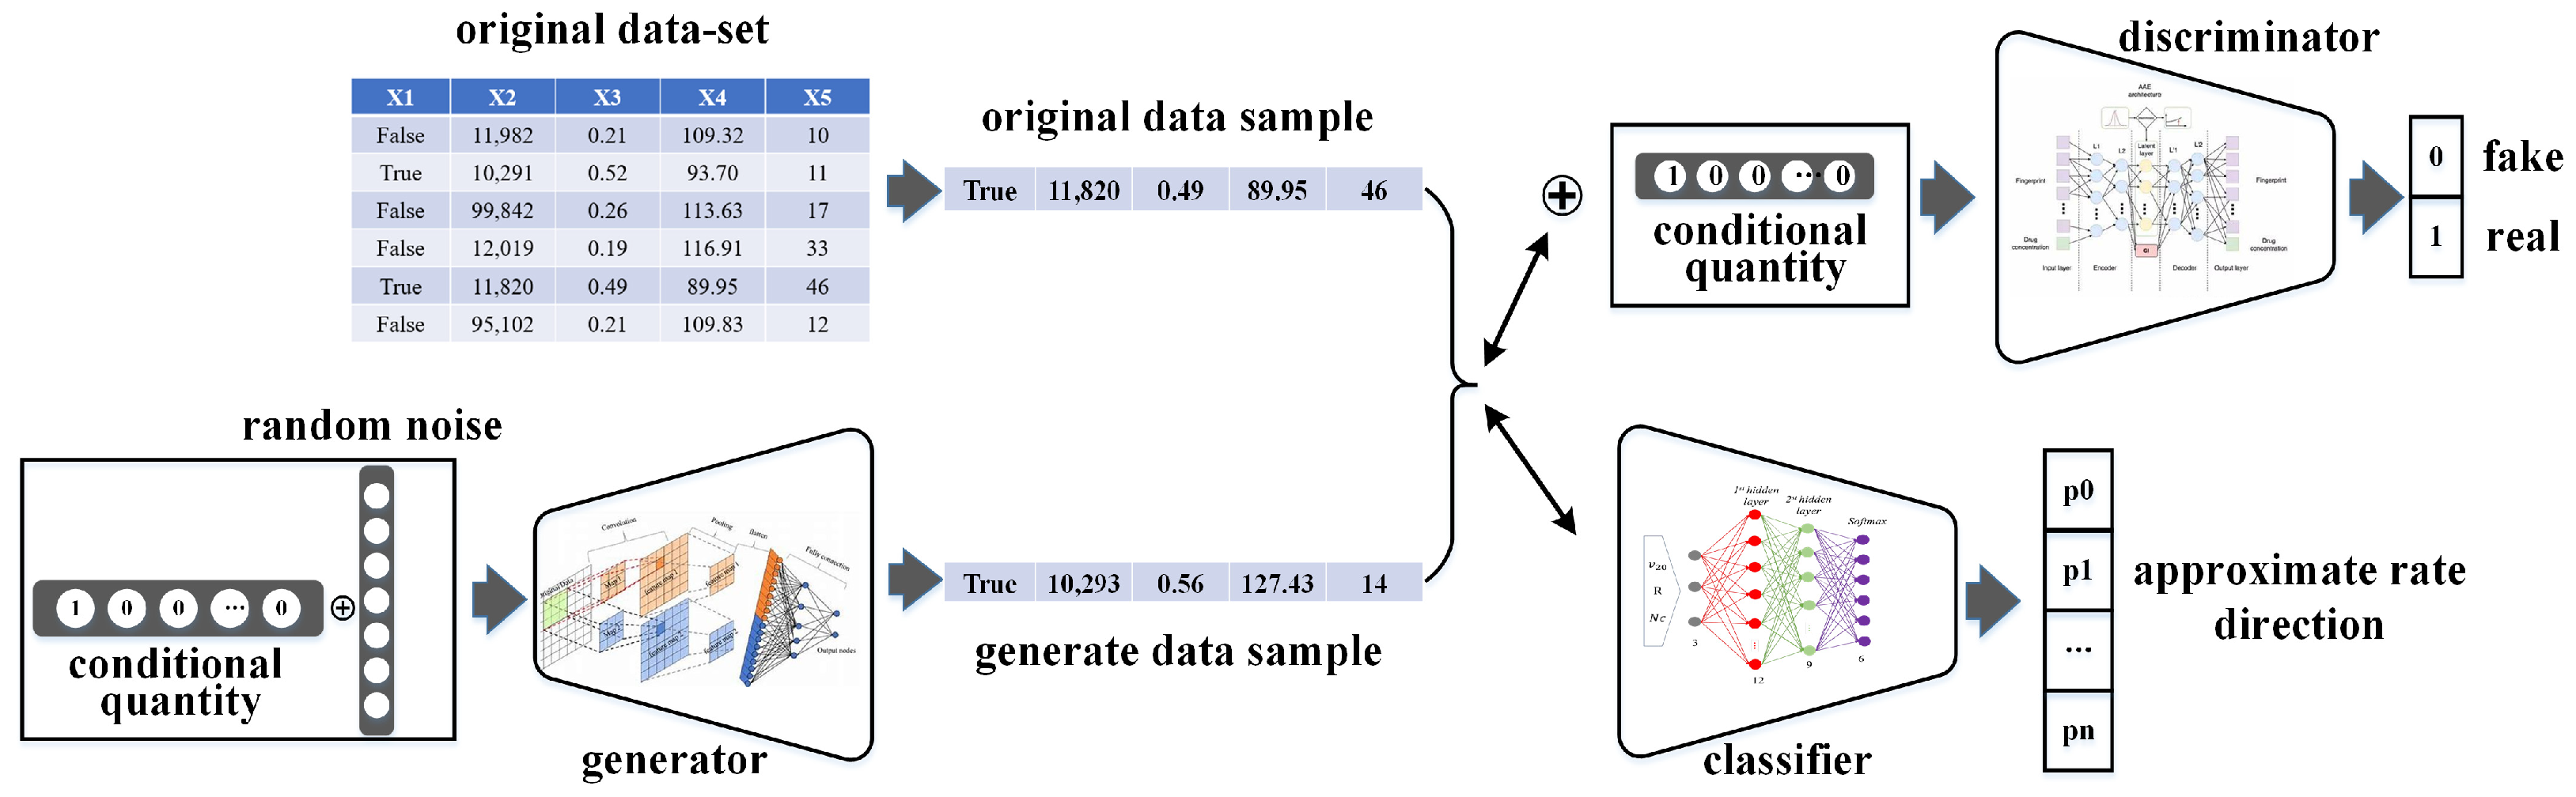
4.1. Principle of CTGAN

To complete the task of generating tabular data, CTGAN enhances the training process through normalization for patterns and framework changes for patterns and solves the problem of data imbalance using conditional generators and sampling training. By combining Gaussian mixture models with VAE, CTGAN is capable of learning the latent representations of data and generating new tabular data samples. This combined approach helps solve the problems of data encoding and generation and improves the sample efficiency and quality of the model.
CTGAN consists of two models that present a competitive game relationship: the generative model G, which captures the distribution of data, and the discriminative model D, which estimates the probability of the sample coming from the original data. The G network generates fault samples by transmitting random noise through a multi-layer perceptron, and the D network is also composed of a multi-layer perceptron, learning and judging whether the samples come from the model distribution or the original data distribution. Under the definition of G and D by the multi-layer perceptron, the whole system can be trained by the backpropagation mechanism, and the two achieve an antagonistic game balance. In addition, there is an encoder that models the raw data, and a classifier trained on the raw data to better interpret the semantic integrity of the data. The CTGAN structure is shown in Figure 3.
The CTGAN training process is as follows:
Step 1: Random noise z and conditional vectors are input into the generator to generate data G(z) in the specified format;
Step 2: The original data sample x is modeled through the encoder and input into the discriminator together with the generated data G(z) and the conditional vector;
Step 3: The discriminator distinguishes the original data sample x and the generated data sample G(z), respectively, and then updates the weight of the discriminator D through the backpropagation of the loss function; that is, the discriminator continuously improves its ability to discriminate generated data samples;
Step 4: According to the output of the discriminator, constantly adjust the parameters of generator G; that is, improve the ability of the generator to generate data, making the data generated as consistent as possible with the original data so that the discriminator cannot correctly discriminate;
Step 5: Repeat Step 1~Step 4 until the loss function of the discriminator converges within a certain number of iterations and stops training.

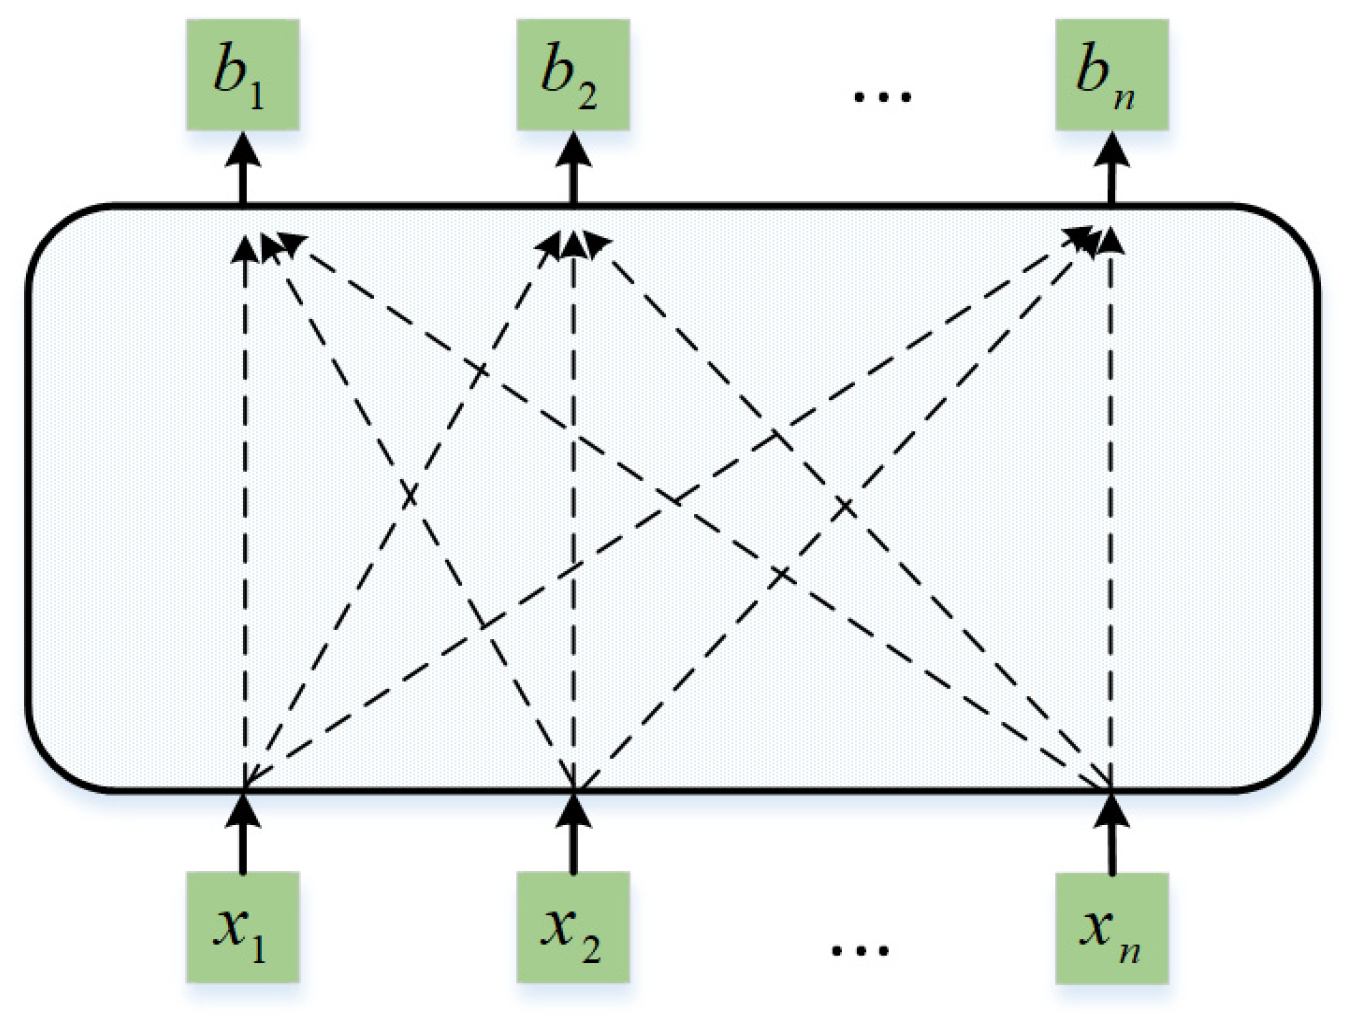
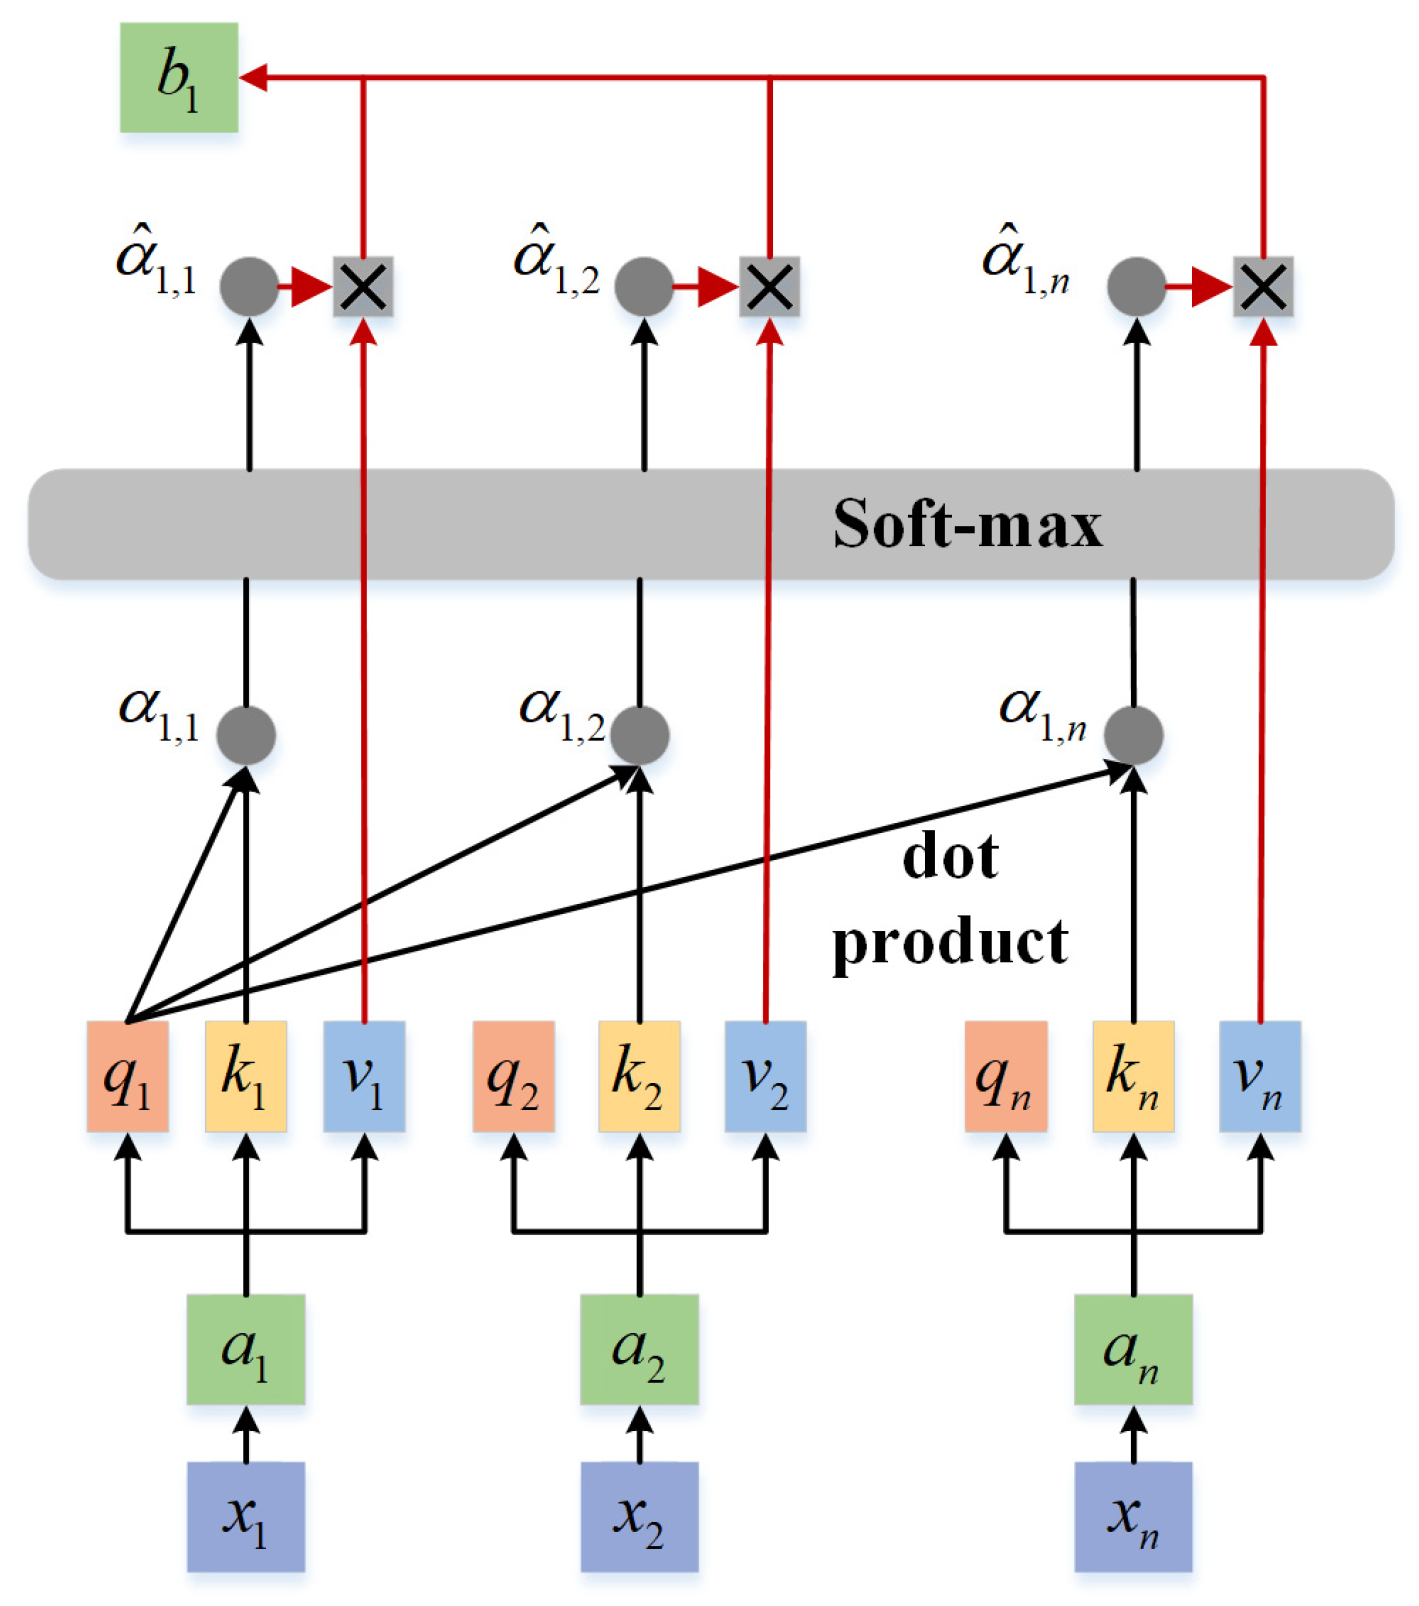
4.2. Principle of the Self-Attention Mechanism

In high-latitude data, there is often a certain correlation between different dimensions. When mining key features, the influence of other features on this correlation cannot be ignored, so the self-attention mechanism needs to be used.
Self-attention allows each unit to capture the overall information, while different units can be calculated or processed in parallel, which can be understood as self-attention, find the relationship between each feature and consider whether one feature will have an impact on the other. The basic principle is shown in Figure 4.
The workflow for self-attention is shown in Figure 5.
The thought steps are as follows:
Step 1: Transform the input X through the linear transformation matrix W q , W k , and W v into Q , K , and V , where Q is the query vector, K is the key vector, and V is the value vector.
Step 2: Calculate the similarity by the dot product operation of Q and K .
α i , j = q i · k j
Step 3: SoftMax normalization of the similarity obtained in Step 2.
α ^ i , j = exp ( α i , j ) / j exp ( α i , j )
Step 4: Calculate the comprehensive output B of each unit after self-attention.
b i = i α i , j v i

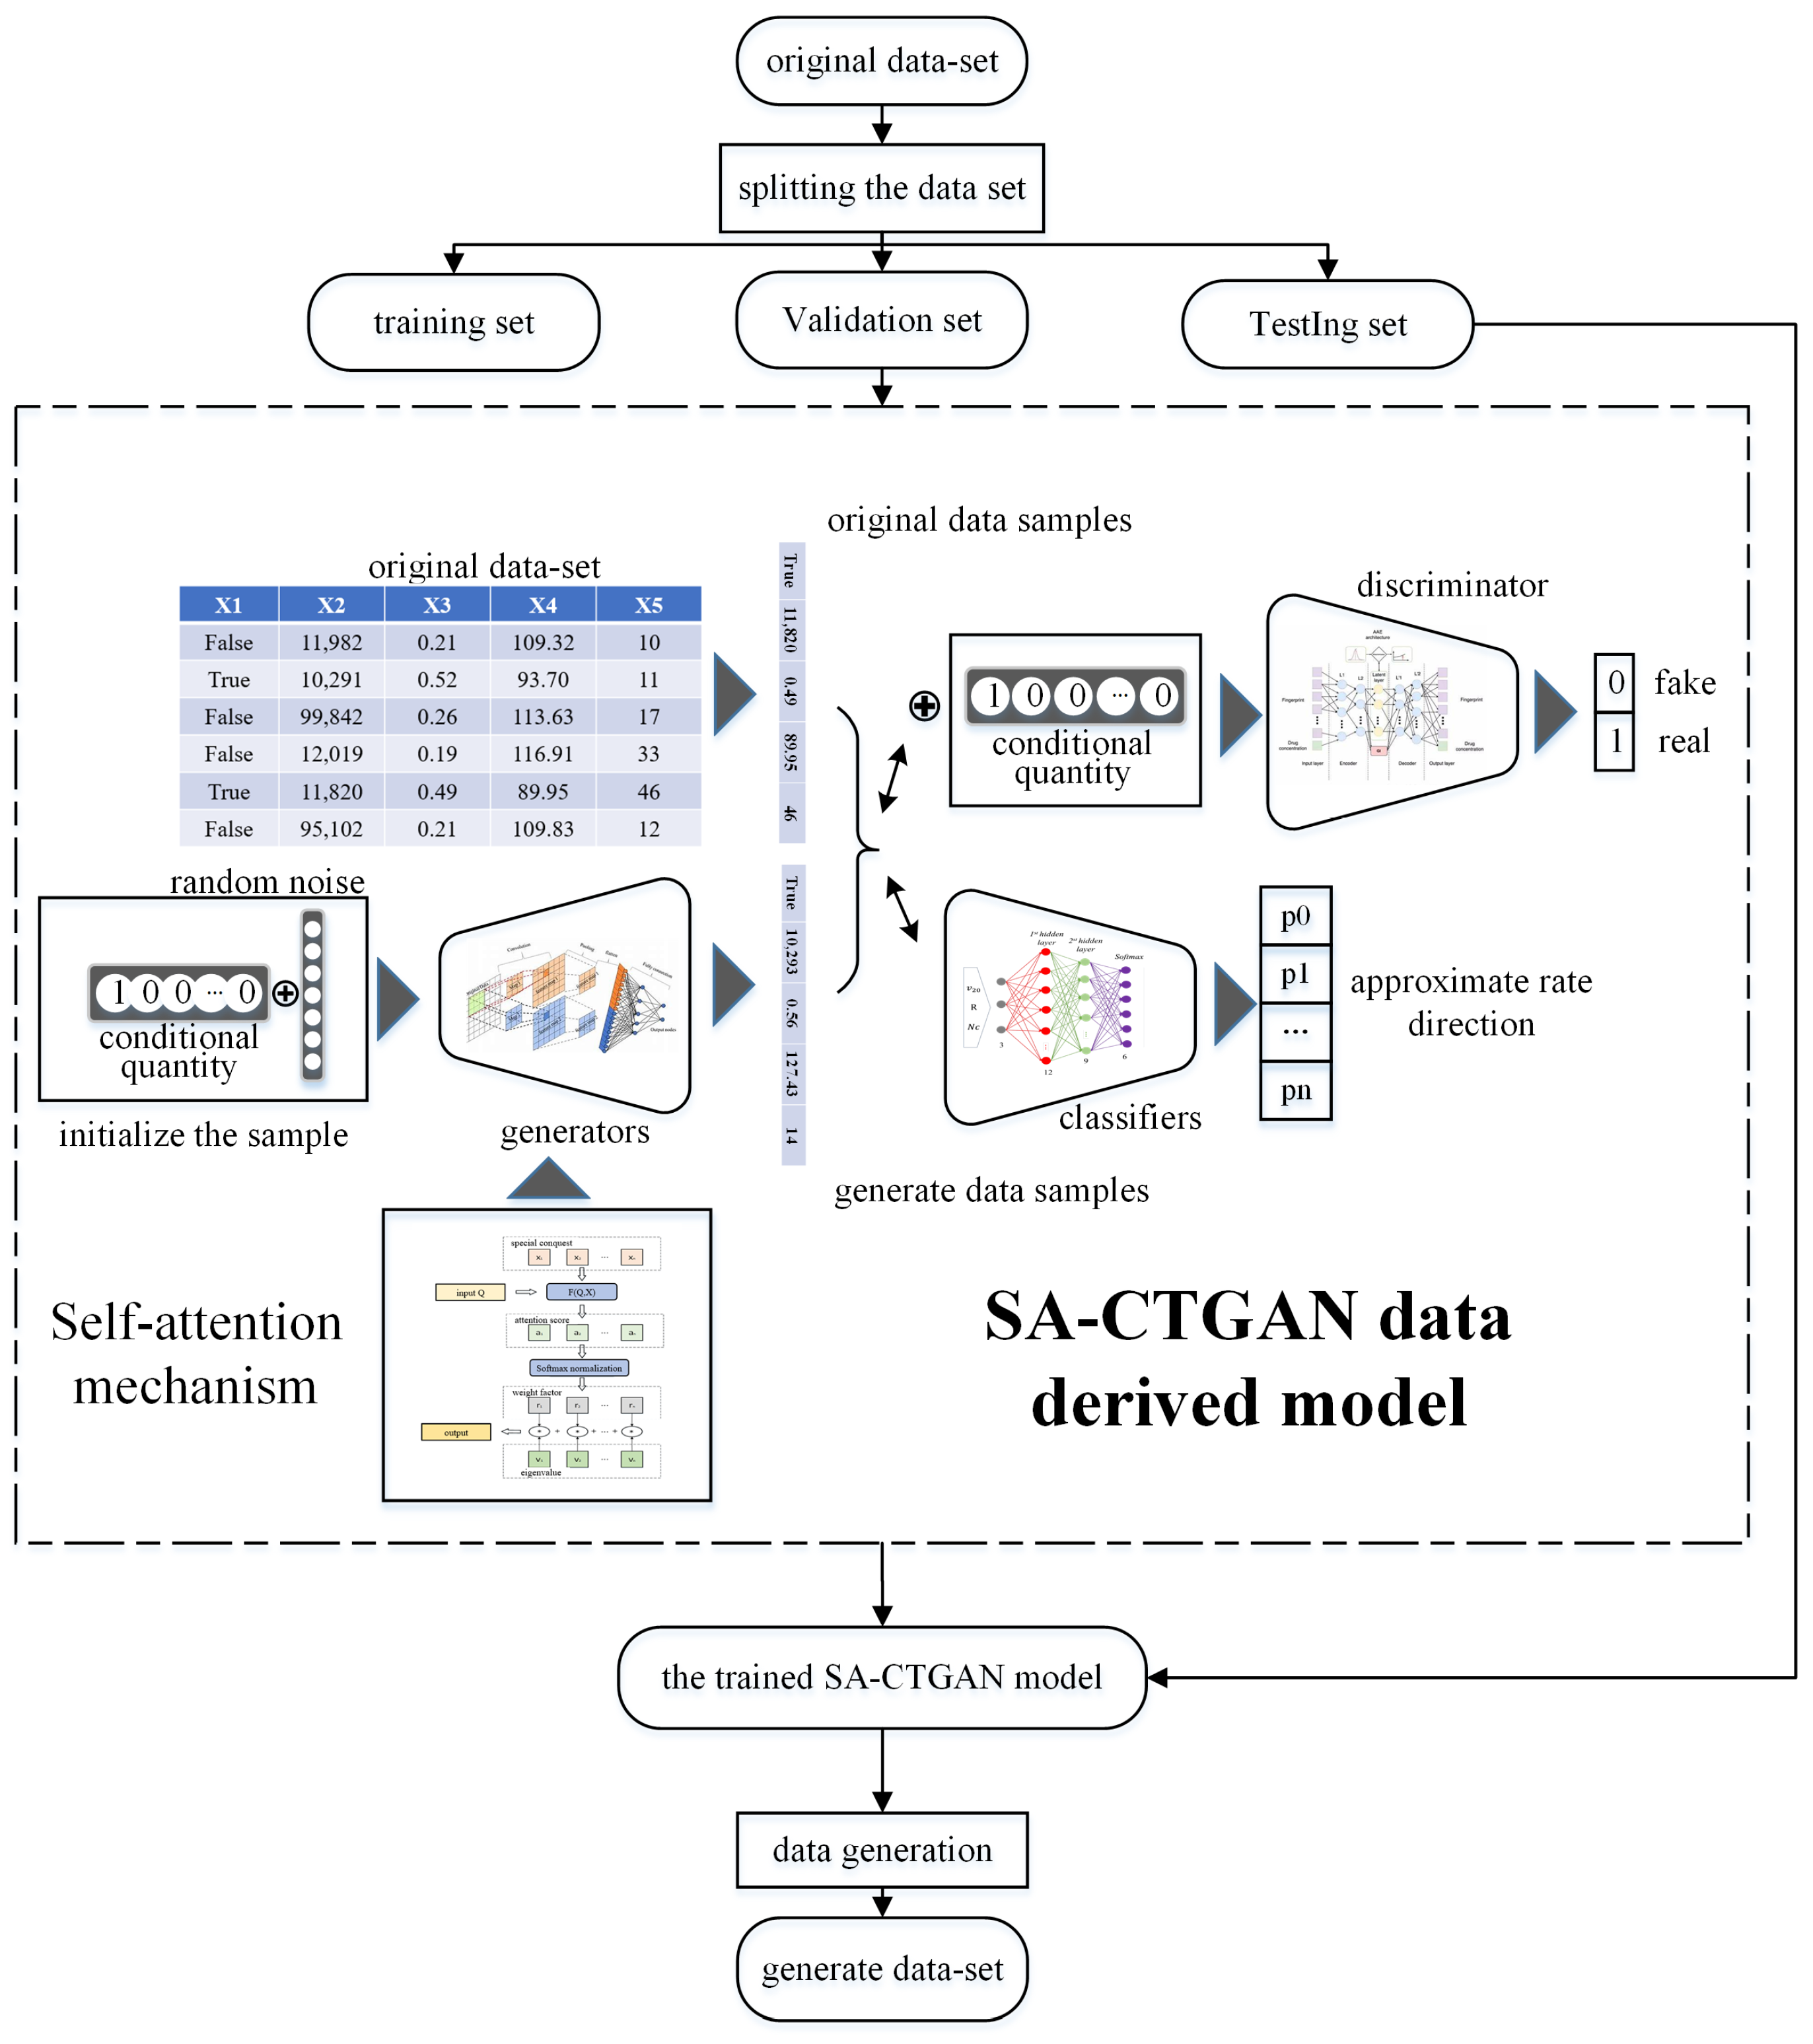
4.3. SA-CTGAN Data-Derived Model

Although CTGAN can generate data based on conditional vectors through the classifier and capture the general distribution of each variable well through the encoder, it does not model the dependency relationship of each feature. It only captures the possible connections between the features through two fully connected hidden layers in the generator, which is ineffective because there is a strong correlation among the indicators in the monitoring dataset of box-type substations. Using CTGAN to generate fault samples for box-type substations may produce suboptimal results. The weights of the fully connected layers in the CTGAN generator are determined based on position, meaning that the weight generation is static. In contrast, the weight generation of self-attention is dynamic, which frees it from positional dependency during data input and better maintains the correlation among different features. This paper inducts self-attention in generator G to construct the SA-CTGAN model. Specifically, it replaces the two fully connected layers in the generator of CTGAN with self-attention layers. The model can learn the relationship matrix between the input features through the self-attention mechanism to maintain the correlation between different features and make the data generated by CTGAN closer to the real data. The model of SA-CTGAN data-derived model is shown in Figure 6.

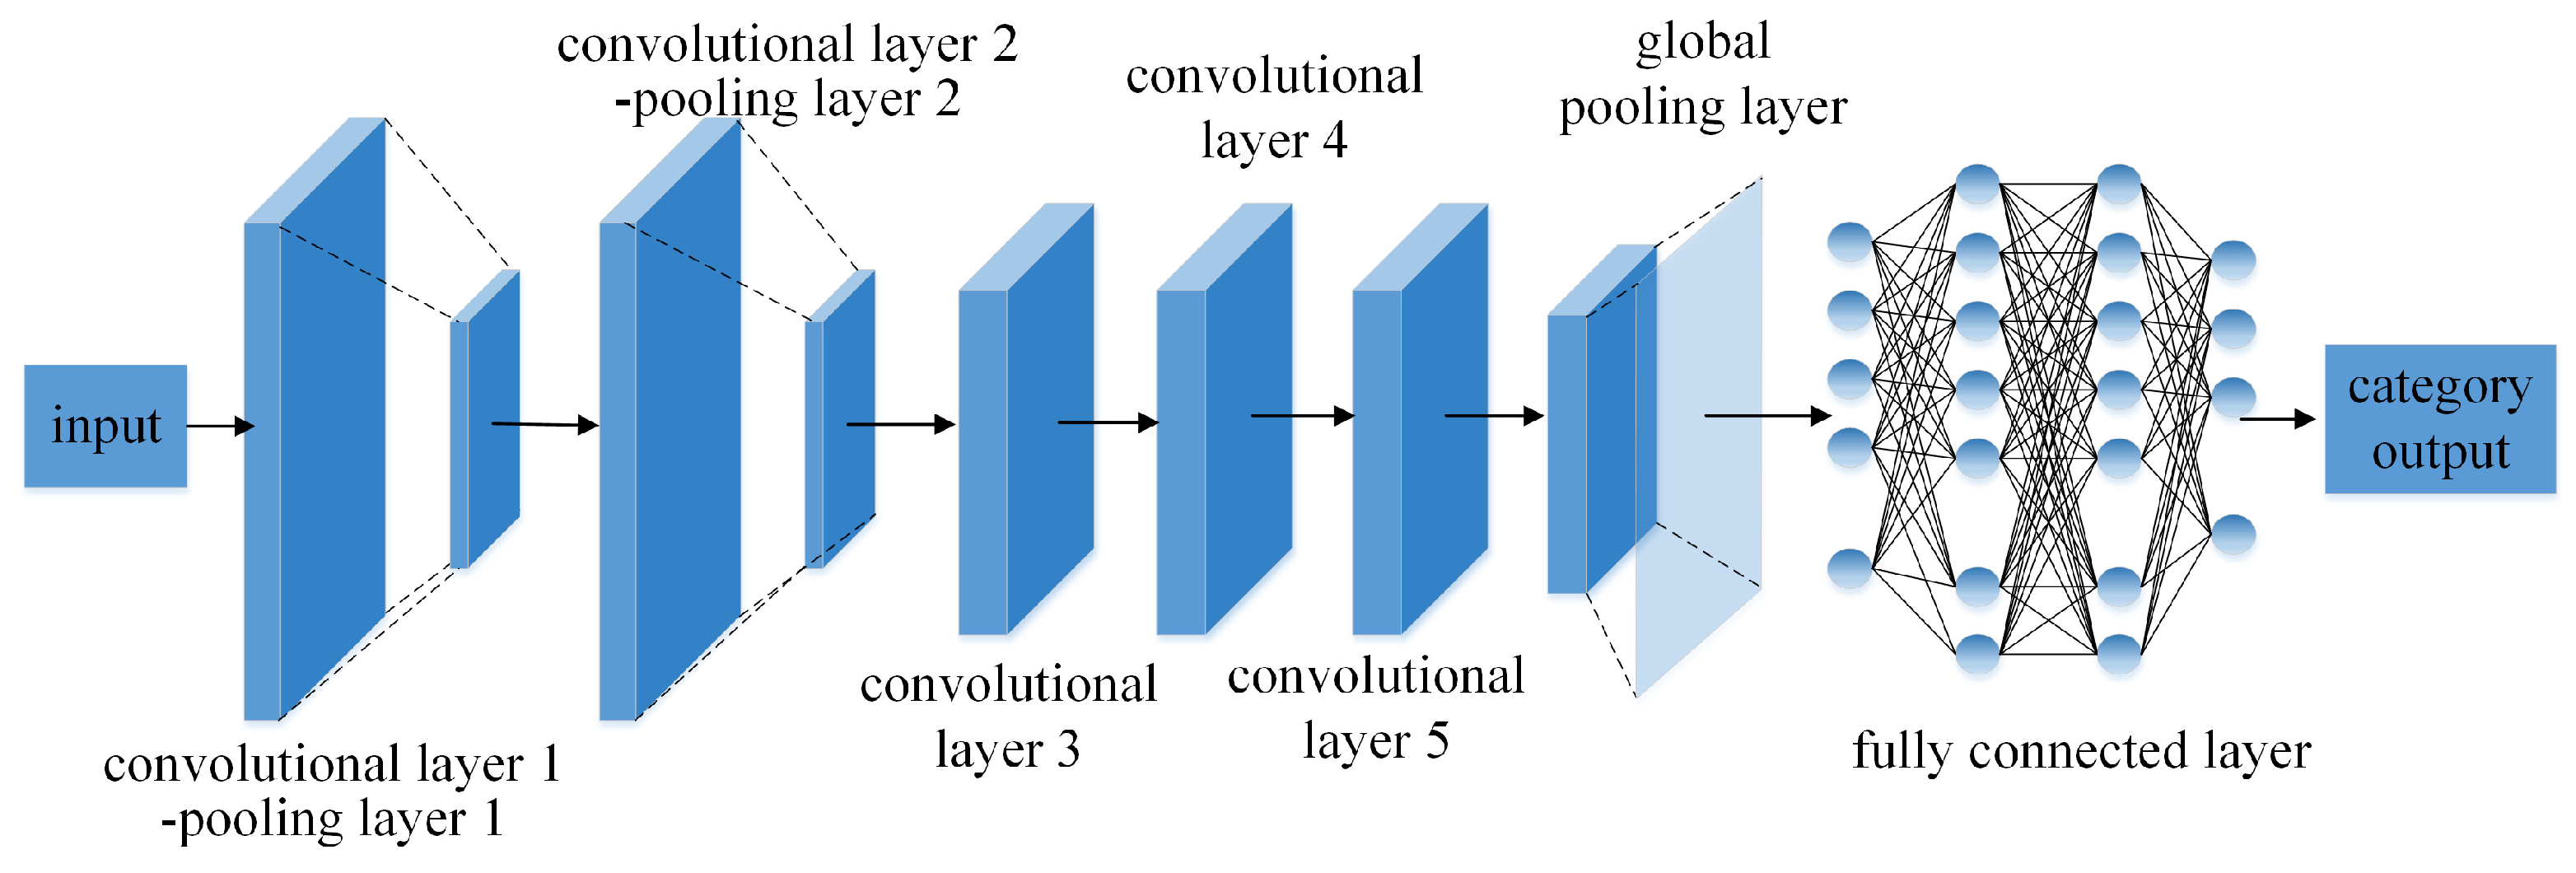
5. AlexNet Fault Diagnosis Model

AlexNet is a classical convolutional neural network model that can extract and classify depth features, and it is widely used in the field of fault diagnosis. AlexNet uses the ReLU activation function instead of Tanh and Sigmoid to speed up training, solving the gradient vanishing problem of deep networks. At the same time, AlexNet uses overlapping maximum pooling operations to avoid the fuzzy effect of average pooling, and the step size is smaller than the size of the pooling kernel so that it can extract features in more detail. In addition, AlexNet uses Local Response Normalization (LRN) to create a competition mechanism for the activity of local neurons, making neurons with larger responses more active and inhibiting those with less feedback, thereby enhancing the generalization ability of the model.
In this paper, the box-type substation fault diagnosis model is established based on the AlexNet network model, which comprises a total of eight layers, five convolutional layers, and three fully connected layers. Finally, the samples are classified by the SoftMax classifier, as shown in Figure 7.
The one-dimensional convolution and pooling layers are used to build the AlexNet network, and TensorFlow 2.0 is used to build the network model for completing the fault diagnosis task. The model structure is shown in Table 2.
Next, train the model in using the Adaptive Gradient Algorithm (Adagrad) as the optimizer and categorical cross entropy as the loss function.

6. Experiment and Result Analysis

6.1. Evaluation Indicators of the Data-Derived Effect

The model was evaluated by calculating the similarity between the generated data-set and the original data-set, and the performance effect of the model was evaluated from two perspectives: similarity of data distribution and correlation of different dimensions.
(1)
KL divergence
Kullback–Leible (KL) divergence, also known as relative entropy, is a metric used to measure the similarity of two probability distributions, can used to express the difference or similarity between two distributions, and is calculated as follows:
D K L ( P | | Q ) = i P ( x i ) log P ( x i ) Q ( x i )
The smaller the KL divergence, the higher the similarity between P and Q .
(2)
Mean Cosine Similarity
Cosine similarity (CS) is the cosine value of the angle between two n-dimensional vectors in n-dimensional space, which is equal to the dot product (vector product) of the two vectors divided by the product of the length (size) of the two vectors. The cosine similarity between n-dimensional vectors A and B is calculated as follows:
Similarity ( A , B ) = A B A × B = i = I n ( A i × B i ) i = 1 n A i 2 × i = 1 n B i 2
In this paper, the cosine similarity between the original data-set and the generated data-set of the same category is calculated, the average cosine similarity is calculated cumulatively, and the data similarity is evaluated by the mean cosine similarity, which is calculated as follows:
S i m i l a r i t y ¯ = i = 1 m j = 1 n S i m i l a r i t y ( R A W i , G E N j ) m × n
where R A W i is the i th indicator vector of the original data and G E N i is the i th indicator vector of the generated data. The value of S i m i l a r i t y ¯ ranges from [−1,1], with −1 being completely different and 1 being completely similar.
(3)
Cumulative deviation of the correlation coefficient
The correlation coefficient is a statistic proposed by the statistician Pearson to measure the degree of linear correlation between two random variables. It is defined as the covariance of two variables divided by the product of their standard deviations as follows:
ρ X i , X i = E [ ( X i E ( X i ) ) ( X j E ( X j ) ) ] E [ ( X i E ( X i ) ) ( X j E ( X j ) ) ] E [ ( X j E ( X j ) ) ( X i E ( X i ) ) ]
The correlation coefficient matrix of the original dataset and the generated dataset is calculated, and then the cumulative deviation of the correlation coefficient of the generated dataset relative to the original dataset is calculated by Equation (8).
S 2 = i = 1 k j = 1 k ( ρ X i , X j R A W ρ X i , X j G E N ) 2
where ρ X i , X j R A W is the correlation coefficient between dimensions X i and X j in the original data and ρ X i , X j G E N is the correlation coefficient between dimensions X i and X j in the generated data. The smaller the cumulative deviation of the correlation coefficient, the more similar the correlation between the different dimensions of the generated data-set and the original data-set.
(4)
Heatmap SSIM metric
A heatmap is a way to express the correlation of different dimensions in a data-set in the form of an image, and the magnitude of the correlation is described by the values of different RGBA components. Therefore, the dimensional correlation between the generated data-set and the original data-set can be evaluated by comparing the heatmap of the original dataset and the generated data-set.
The SSIM (Structure Similarity Index Measure) is an index used to measure the similarity of images, which consists of three parts: luminance, contrast, and structure.
The SSIM of images x and y can be defined as follows:
S S I M ( x , y ) = ( 2 μ x μ y + C 1 ) ( 2 σ x , y + C 2 ) ( μ x 2 + μ x 2 + C 1 ) ( σ x 2 + σ x 2 + C 2 )
where μ x and μ y are the average gray scale of the image x and y, σ x and σ y are the standard deviation of the gray scale of the image x and y, C 1 = ( K 1 L ) 2 , C 2 = ( K 2 L ) 2 , and C 3 = C 2 / 2 , and by experience, K 1 = 0.01 , K 2 = 0.03 , and L , are the dynamic ranges of the pixel value.
The range of the SSIM is [0,1], and the larger the value, the higher the similarity between the two images; that is, the closer the correlation between the original data-set and the generated data-set in different dimensions.

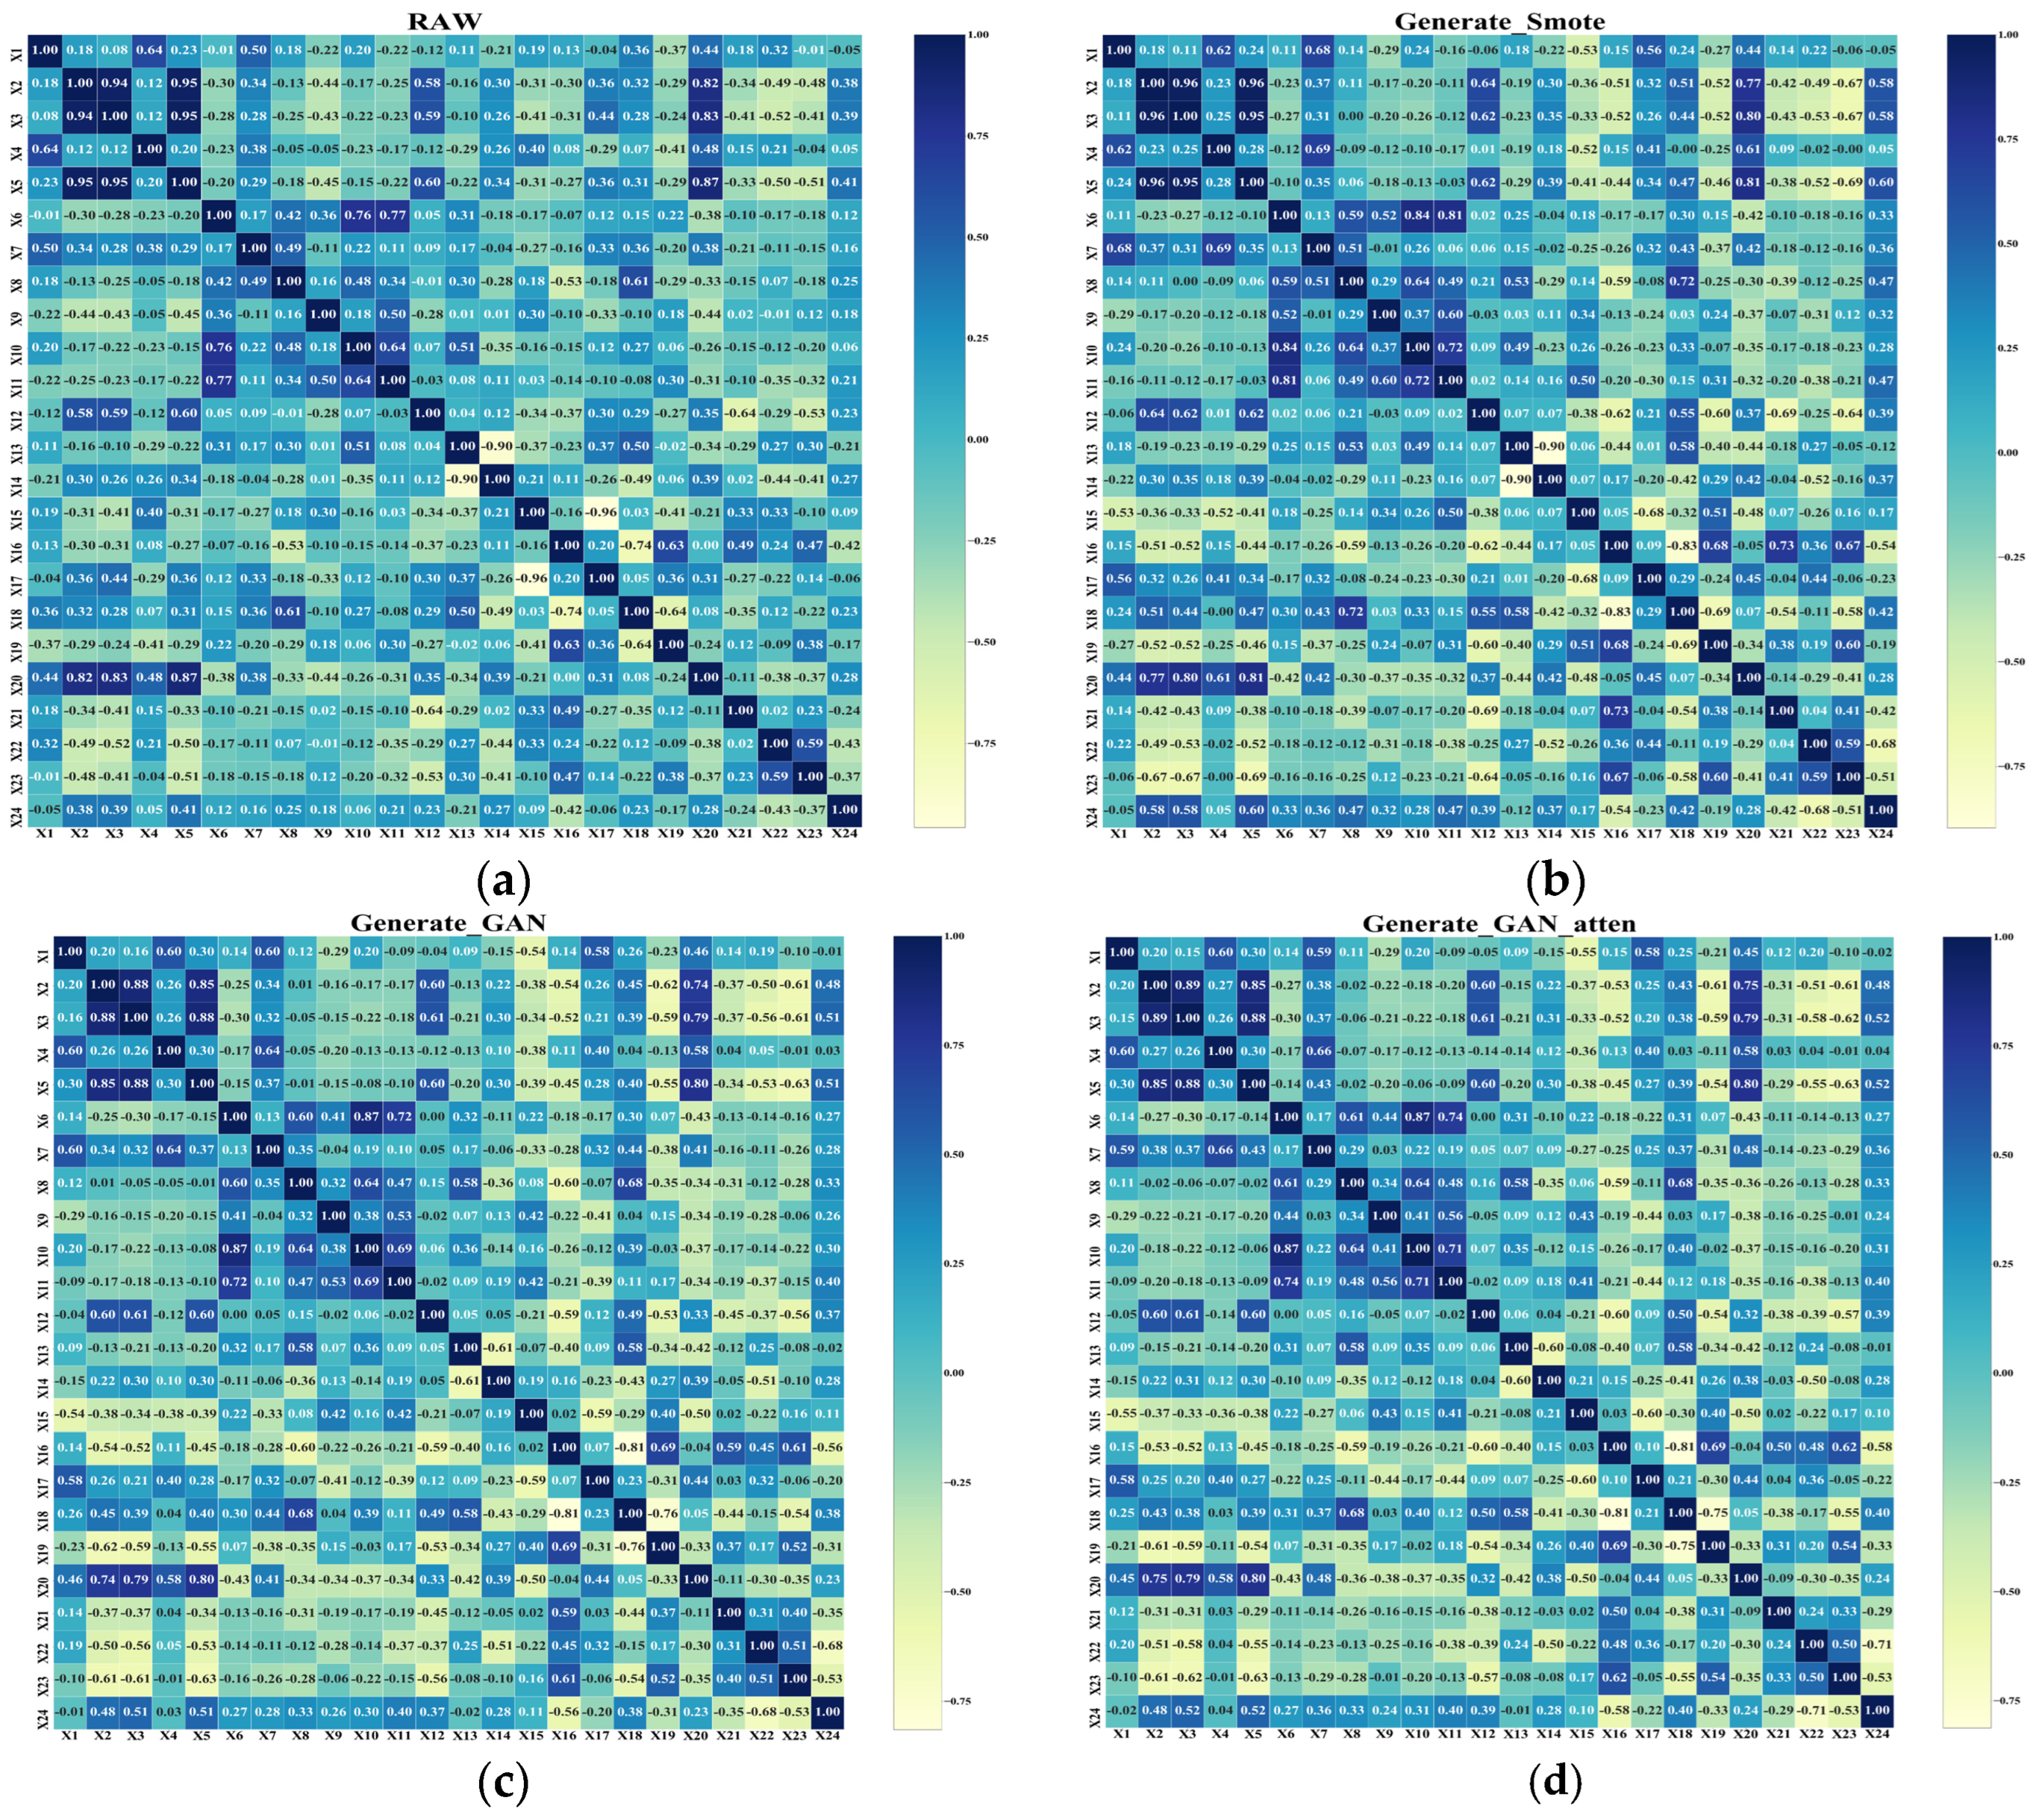
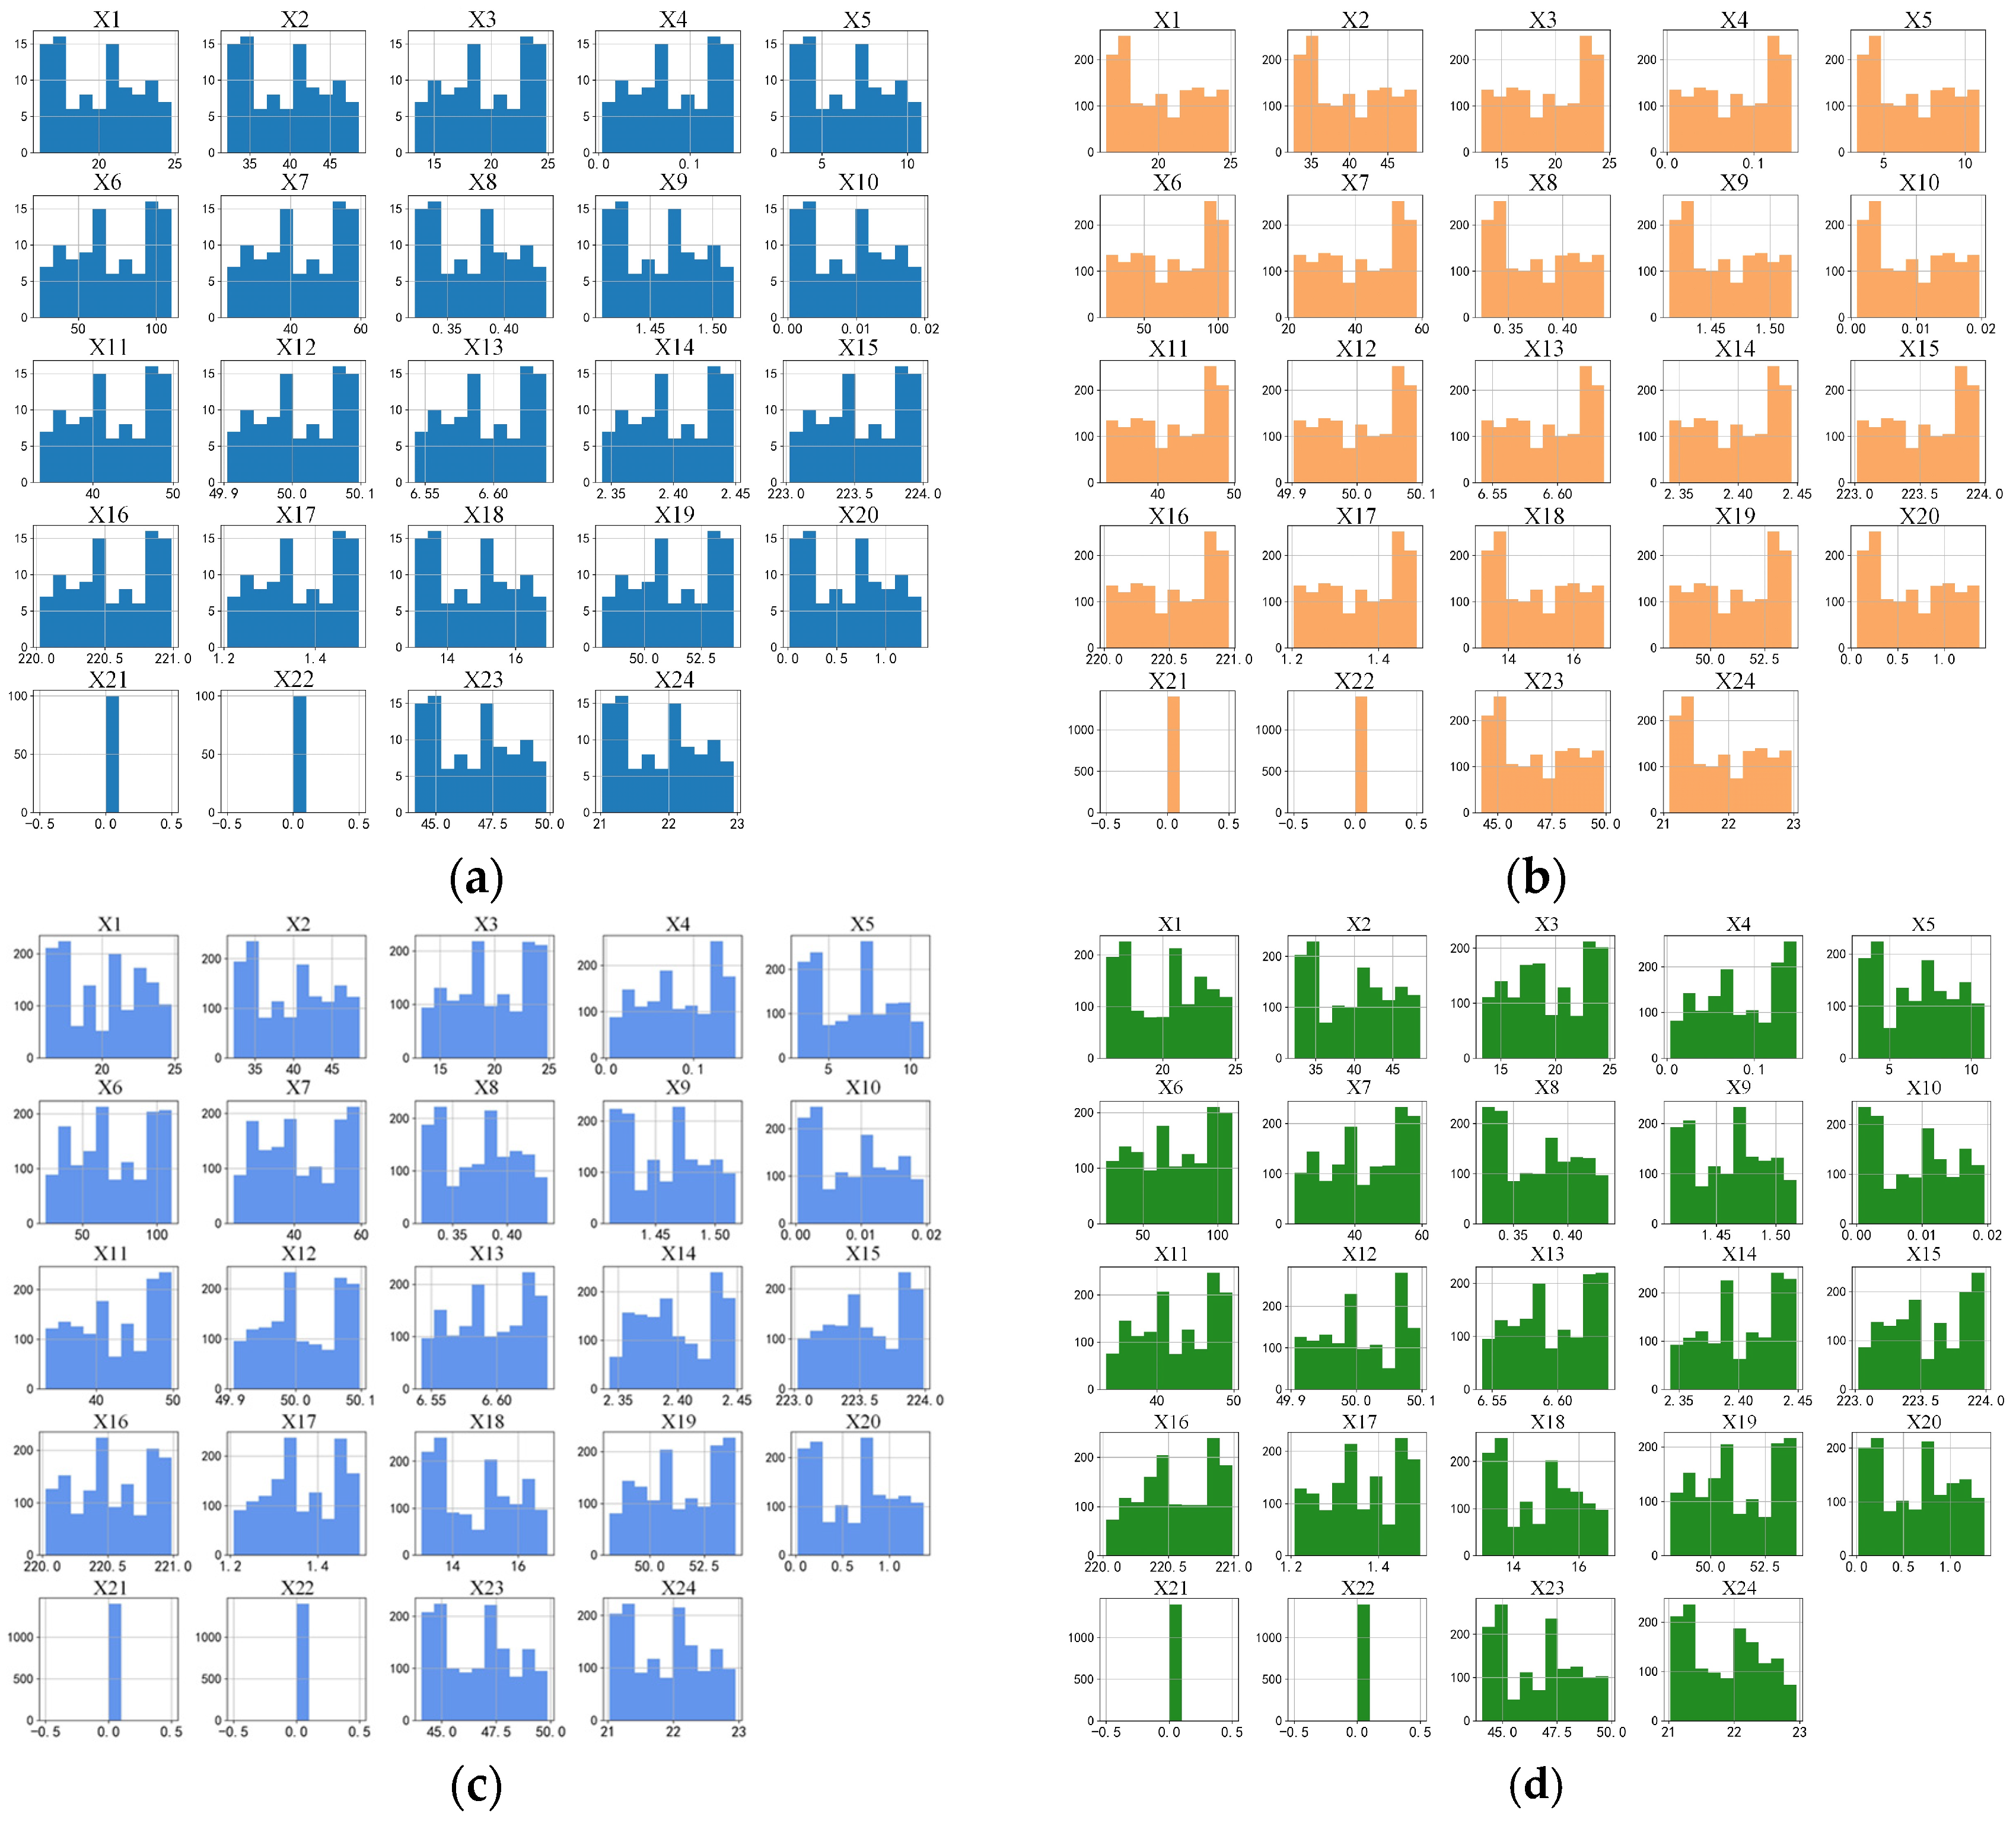
6.2. Comparative Analysis of Data-Derived Models

To verify the performance of SA-CTGAN, a box-type substation acquisition system was established for enterprise A, and a total of 700 different fault data and normal operation data were randomly selected from the database to form a small sample unbalanced data-set. The SMOTE model, CTGAN model, and SA-CTGAN model were used for data derivation experiments.
For the above three data-sets, the number of nearest neighbors of the SMOTE model is set to five. The DE optimization algorithm was used to optimize the number of iterations, training batches, and learning rate in the CTGAN model and the SA-CTGAN model. The amount of the expanded data in all models is set to 1400.
Select the original data and generated data of the fault type of the high-voltage circuit breaker and draw the heatmap of the raw data and the generated data, respectively, as shown in Figure 8, where (a), (b), (c), and (d) are the original data heatmap, the SMOTE- generated data heatmap, the CTGAN-generated data heatmap, and the SA-CTGAN-generated data heatmap, respectively.
Based on the correlation coefficients shown in Figure 8, the correlation coefficient matrix of the data generated by SA-CTGAN is the closest to the original data. To quantitatively compare the data generation effects from the three derived models, four evaluation metrics constructed in Section 6.1 were used to evaluate the derived data of the three models. The evaluation results are shown in Table 3.
By comparing the KL divergence and the mean cosine similarity, it is found that the CTGAN model and SA-CTGAN model are better than the SMOTE model in the similarity of data distribution. Comparing the cumulative deviation of correlation coefficient and the heatmap SSIM metric, the cumulative deviation of the correlation coefficient of the SA-CTGAN model is significantly lower than that of SMOTE and CTGAN, and the heatmap SSIM metric of the SA-CTGAN model is significantly higher than that of SMOTE and CTGAN. It is deduced that the SMOTE model and the CTGAN model are similar in the maintenance of data correlation, the data generated by the SA-CTGAN model with the introduction of the self-attention mechanism is significantly better than the other two models in terms of correlation similarity; that is, the self-attention mechanism can effectively maintain the correlation between different indicators.
Furthermore, draw a distribution histogram, comparing the derived data results through the distribution of 24 indicators, as shown in Figure 9, where (a), (b), (c), and (d) are the distribution of original data, SMOTE-generated data, CTGAN-generated data, and generated data, respectively.
The distribution of the data generated by the three models is roughly similar to that of the original data. Among them, the SMOTE model has the worst generation effect, while the CTGAN model and SA-CTGAN model are better. This is because the SMOTE model can only generate edge data when generating data with positive samples distributed at the edge through sampling, which cannot solve the problem of distribution marginalization.

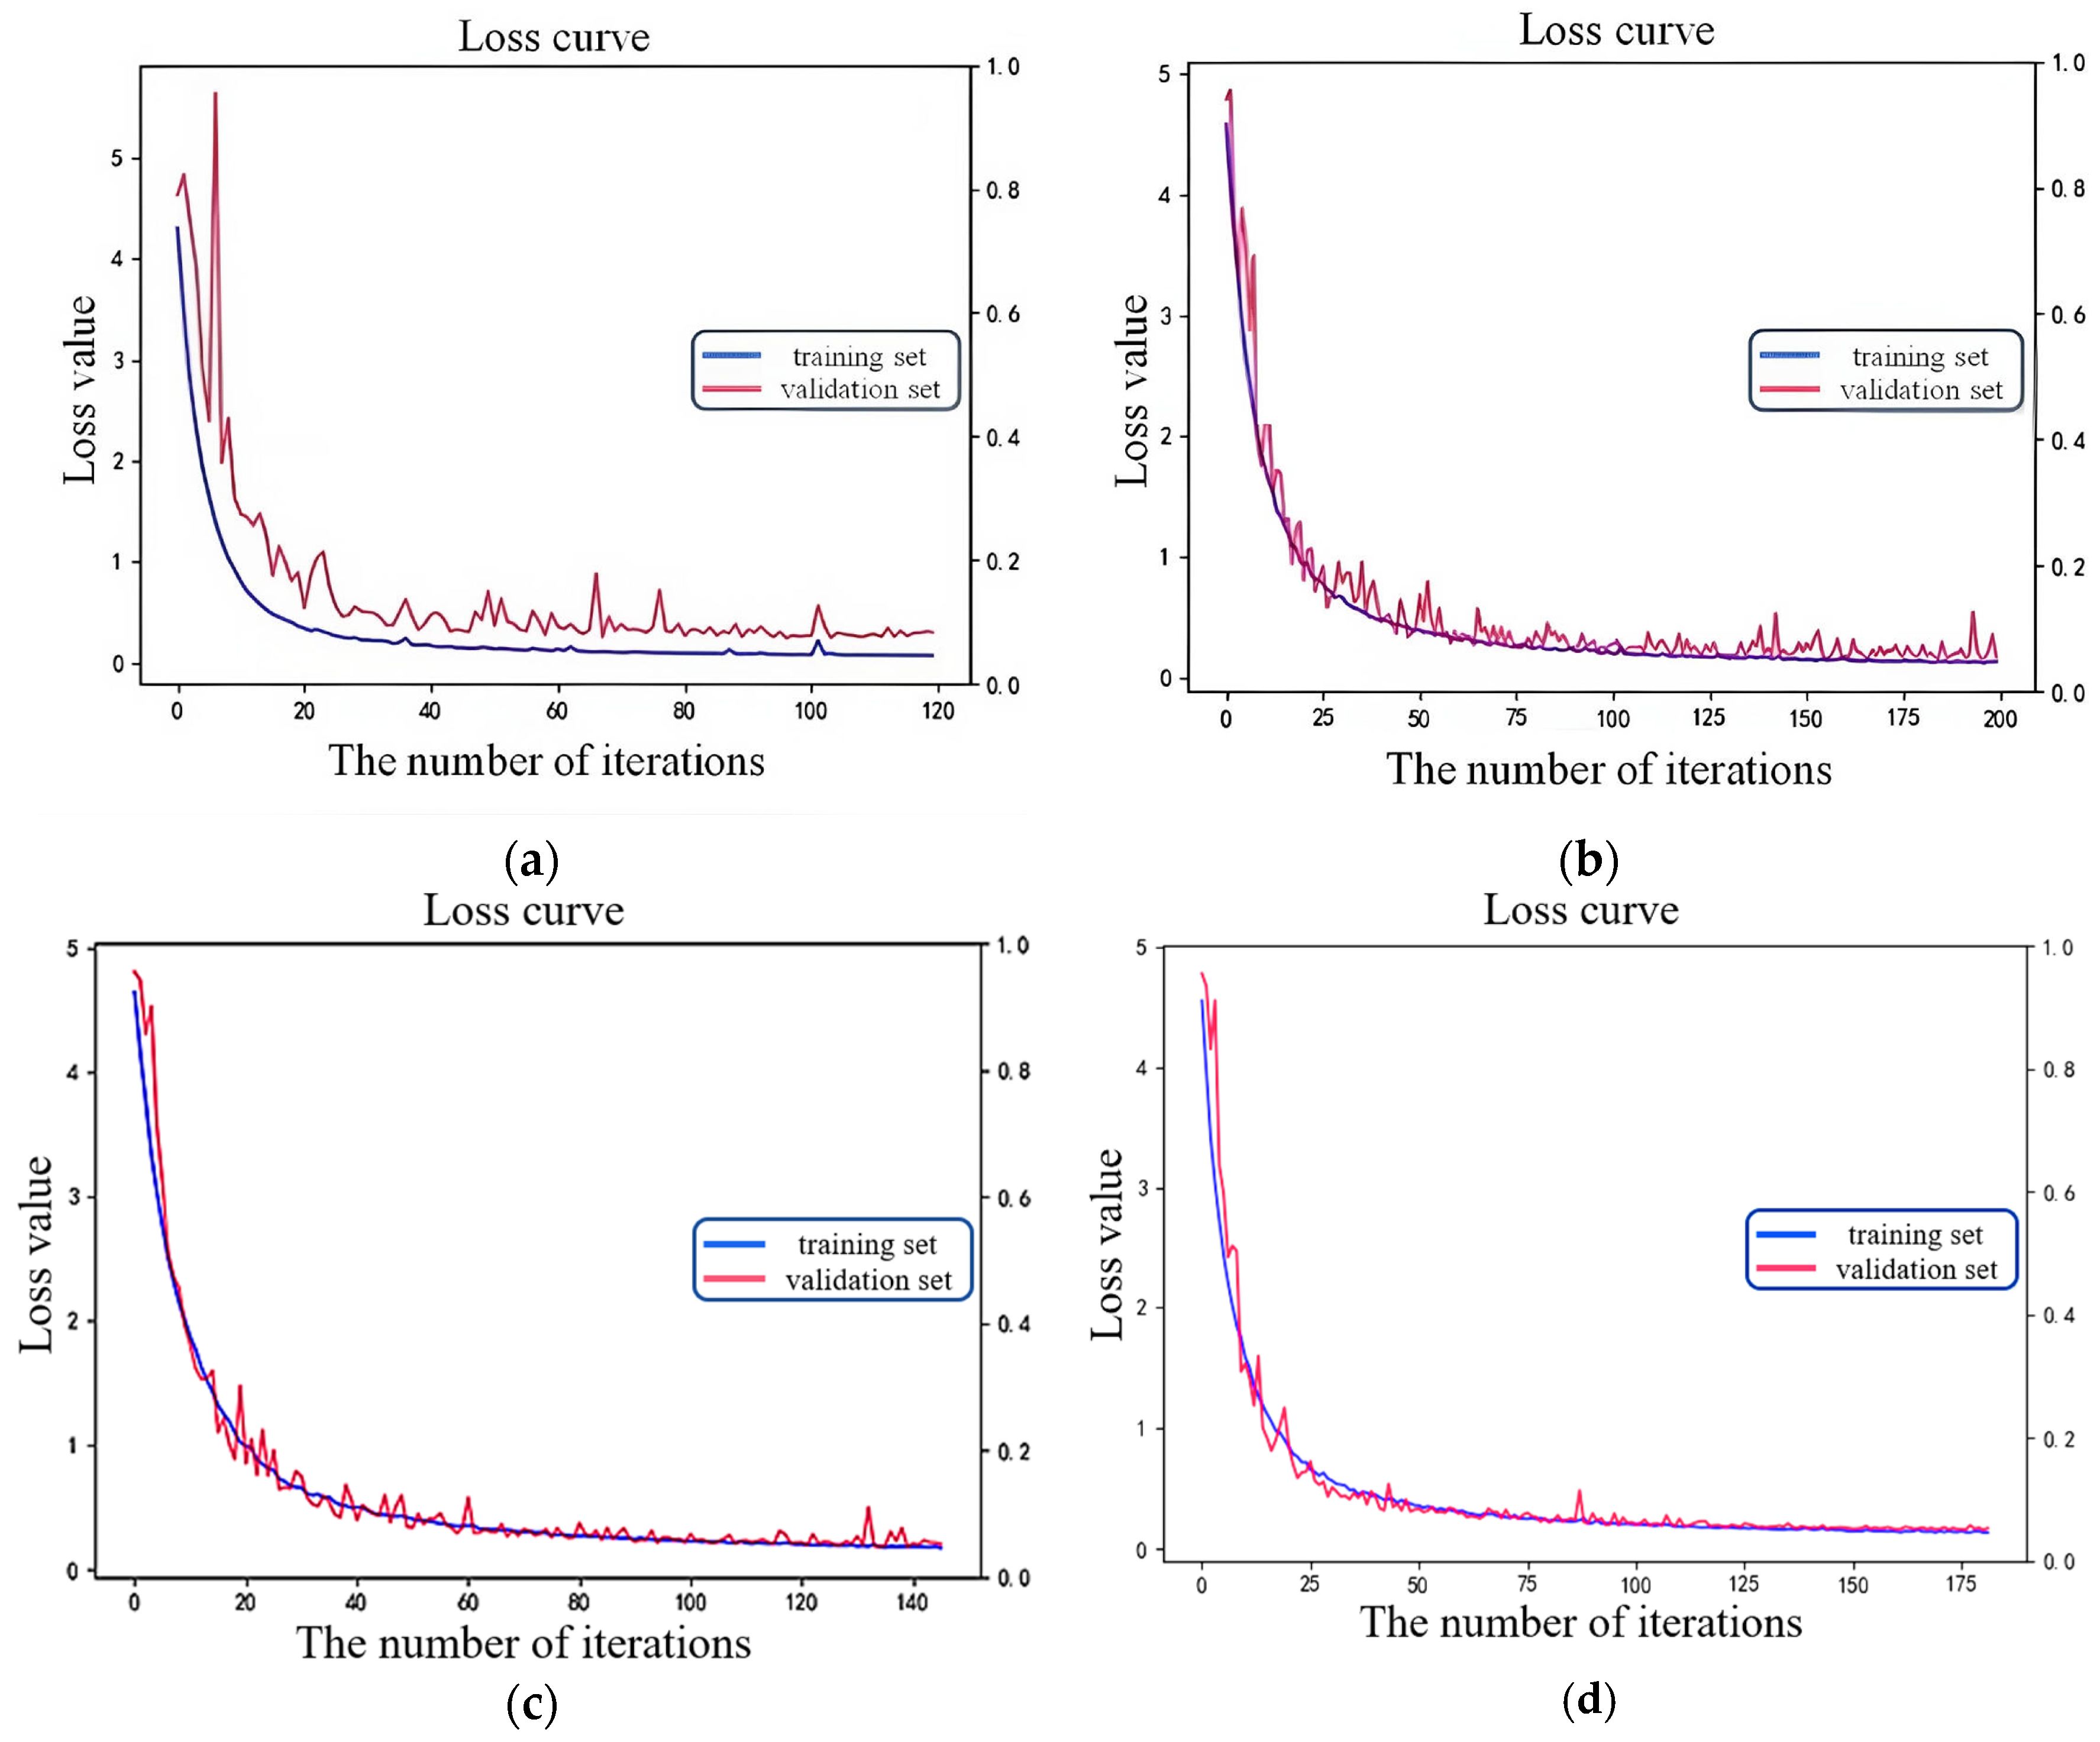
6.3. Fault Diagnosis Case Analysis of Different Datasets

This section will compare the performance of AlexNet using original data, data enhanced by the SMOTE model, the CTGAN model, and the SA-CTGAN model as inputs. The specific scheme is as follows: the original dataset is divided into the training set, verification set, and testing set in a ratio of 7:2:1, which are input into the AlexNet model for training and testing. For the datasets enhanced by the three data-derived models, they are divided into a training set and a validation set according to the ratio of 7:3, while the original data are used as the testing set. The early stopping mechanism is set during model training based on the accuracy of the verification set; if the improvement is less than 0.05% over 20 iterations, the training will be stopped in advance.
The specific iteration process of the four data-sets is shown in Figure 10.
From the perspective of the iterative process, due to the small amount of data in the original data without data enhancement, the early stop mechanism was triggered after 121 iterations, the loss value of the verification set was always greater than that of the training set in the whole iteration process, and there was an obvious oscillation phenomenon. The dataset that underwent data enhancement using SMOTE exhibited the highest number of iterations, albeit with evident oscillation throughout the training process. In contrast, the dataset enhanced with the CTGAN model terminated training after 147 iterations, displaying significantly less oscillation compared to the first two datasets. The data enhanced by the SA-CTGAN model established in this paper experienced 182 iterations, and there are obvious oscillations in the first 50 iterations of the model, but the oscillations gradually disappear after 50 iterations. Table 4 shows the accuracy of the four data-sets.
From the accuracy of the four types of data-sets, it can be seen that the accuracy of the validation set is about 5% lower than that of the training set, and the accuracy of the testing set is about 6.5% lower than that of the training set. This is due to the lack of training data, as the model can only over-extract features unrelated to the direction of diagnosis and only learn the patterns related to the training set data. This pattern is wrong or irrelevant for the new data (validation set and testing set), resulting in the trained model not being universal. The accuracy of other data-augmented datasets is relatively close to that of the training set, validation set, and test set. Among them, the SA-CTGAN model constructed in this paper has the highest data accuracy and the smallest gap between the training set and the test set, which indicates that the model trained with the dataset generated by SA-CTGAN has higher versatility.

7. Conclusions

This article takes the fault diagnosis of box-type substations as an example to study and improve the fault diagnosis model under the conditions of scarce samples and unbalanced classes, aiming to enhance its prediction accuracy. An improved CTGAN data derivation method based on a self-attention mechanism is proposed, which can take into account the strong correlation between the monitoring data features of box-type substations while deriving and enhancing the samples. It solves the problem of CTGAN being unable to model the dependency relationship between various features. The established SA-CTGAN data derivation model can generate enough samples similar to the original data based on a small amount of data to support the training of the fault diagnosis model. Furthermore, a box-type substation fault diagnosis model based on AlexNet is established to verify the proposed SA-CTGAN data derivation model. Experimental results show that compared with SMOTE and CTGAN data derivation models, the model trained with the dataset generated by the SA-CTGAN model has the best performance. The proposed method can effectively improve the fault diagnosis accuracy, and the diagnosis accuracy reaches 94.81%. Compared with the model trained with the original data, the accuracy is improved by about 11%, effectively solving the problem that the high-performance diagnosis model cannot be trained due to the scarcity of box-type substation fault data.

Author Contributions

Methodology, Y.L., M.Y. and X.G.; Formal analysis, D.Z. and S.W.; Writing—original draft, J.Z. All authors have read and agreed to the published version of the manuscript.

Funding

This research was supported by the Key Research and Development Program of Shaanxi (Program No. 2021SF-421, 2021SF-422), the Key Scientific Research Program of Shaanxi Provincial Education Department (Program No. 20JY047), and the Collaborative Innovation Center of Modern Equipment Green Manufacturing in Shaanxi Province, China.

Institutional Review Board Statement

Not applicable.

Informed Consent Statement

Not applicable.

Data Availability Statement

Data is the private engineering data collected from the practical application system.

Conflicts of Interest

The authors declare no conflict of interest.

References

  1. E, D.; Zhang, L. Car Dumper Hydraulic System Fault Diagnosis Based on Multi-block MPCA. Chin. J. Mech. Eng. 2018, 29, 958–964. [Google Scholar]
  2. Qiu, Z.; Min, R.; Wang, D.; Fan, S. Energy features fusion based hydraulic cylinder seal wear and internal leakage fault diagnosis method. Measurement 2022, 195, 111042. [Google Scholar] [CrossRef]
  3. Xu, X.; Yan, X.; Sheng, C.; Yuan, C. A Belief Rule-Based Expert System for Fault Diagnosis of Marine Diesel Engines. IEEE Trans. Syst. Man Cybern. Syst. 2017, 50, 656–672. [Google Scholar] [CrossRef]
  4. Wen, X.; Xu, Z. Wind turbine fault diagnosis based on ReliefF-PCA and DNN. Expert Syst. Appl. 2021, 178, 115016. [Google Scholar] [CrossRef]
  5. Bai, R.; Meng, Z.; Xu, Q.; Fan, F. Fractional Fourier and time domain recurrence plot fusion combining convolutional neural network for bearing fault diagnosis under variable working conditions. Reliab. Eng. Syst. Saf. 2023, 232, 109076. [Google Scholar] [CrossRef]
  6. Jia, S.; Li, Y.; Wang, X.; Sun, D.; Deng, Z. Deep causal factorization network: A novel domain generalization method for cross-machine bearing fault diagnosis. Mech. Syst. Signal. Process. 2023, 192, 110228. [Google Scholar] [CrossRef]
  7. Huang, Y.; Liao, A.; Hu, D.; Shi, W.; Zheng, S. Multi-scale convolutional network with channel attention mechanism for rolling bearing fault diagnosis. Measurement 2022, 203, 111935. [Google Scholar] [CrossRef]
  8. Lei, Y.; Yang, B.; Jiang, X.; Jia, F.; Li, N.; Asoke, K. Applications of machine learning to machine fault diagnosis: A review and roadmap. Mech. Syst. Signal. Process. 2020, 138, 106587. [Google Scholar] [CrossRef]
  9. Zhang, X.; Zhou, J.; Chen, W. Data-driven fault diagnosis for PEMFC systems of hybrid tram based on deep learning. Int. J. Hydrog. Energy 2020, 45, 13483–13495. [Google Scholar] [CrossRef]
  10. Yuan, X.; Chen, S.; Zhou, H.; Sun, C.; Lu, Y. CHSMOTE: Convex hull-based synthetic minority oversampling technique for alleviating the class imbalance problem. J. Inf. Sci. 2023, 623, 324–341. [Google Scholar] [CrossRef]
  11. Jia, P.; Wang, C.; Zhou, F.; Hu, X. Trend Feature Consistency Guided Deep Learning Method for Minor Fault Diagnosis. Entropy 2023, 25, 242. [Google Scholar] [CrossRef] [PubMed]
  12. Zhang, K.; Chen, J.; Zhang, T.; Zhou, Z. A Compact Convolutional Neural Network Augmented with Multiscale Feature Extraction of Acquired Monitoring Data for Mechanical Intelligent Fault Diagnosis. J. Manuf. Syst. 2020, 55, 273–284. [Google Scholar] [CrossRef]
  13. Zhao, X.; Ma, M.; Shao, F. Bearing fault diagnosis method based on improved Siamese neural network with small sample. J. Cloud Comput. 2022, 11, 79. [Google Scholar] [CrossRef]
  14. Xu, Z.; Tang, X.; Wang, Z. A Multi-Information Fusion ViT Model and Its Application to the Fault Diagnosis of Bearing with Small Data Samples. Machines 2023, 11, 277. [Google Scholar] [CrossRef]
  15. Chen, B.; Zhang, L.; Liu, T.; Li, H.; He, C. Lightweight Network with Variable Asymmetric Rebalancing Strategy for Small and Imbalanced Fault Diagnosis. Machines 2022, 10, 879. [Google Scholar] [CrossRef]
  16. Pan, S.; Tsang, W.; Kwok, T.; Yang, Q. Domain Adaptation via Transfer Component Analysis. IEEE Trans. Neural Netw. Learn Syst. 2011, 22, 199–210. [Google Scholar] [CrossRef] [PubMed]
  17. Liu, J.; Ren, Y. A General Transfer Framework Based on Industrial Process Fault Diagnosis Under Small Samples. IEEE Trans. Industr. Inform. 2021, 17, 6073–6083. [Google Scholar] [CrossRef]
  18. Dong, Y.; Li, Y.; Zheng, H.; Wang, R.; Xu, M. A new dynamic model and transfer learning based intelligent fault diagnosis framework for rolling element bearings race faults: Solving the small sample problem. ISA Trans. 2021, 121, 327–348. [Google Scholar] [CrossRef] [PubMed]
  19. Fu, S.; Zhong, S.; Lin, L. Gas turbine fault diagnosis method under small sample based on transfer learning. CSCD 2021, 27, 3450–3461. [Google Scholar]
  20. Zhang, X.; Yu, D.; Liu, S. Fault Diagnosis Method for Small Sample Bearing Based on Transfer Learning. J. Xi’an Jiaotong Univ. 2021, 55, 30–37. [Google Scholar]
  21. Xiao, D.; Huang, Y.; Qiu, C.; Liu, Z.; Liu, C. Transfer learning with convolutional neural networks for small sample size problem in machinery fault diagnosis. Proc. Inst. Mech. Eng. C 2019, 233, 5131–5143. [Google Scholar] [CrossRef]
  22. Goodfellow, I.; Pouget-Abadie, J.; Mirza, M.; Xu, B.; Warde-Farley, D.; Ozair, S.; Courville, A.; Bengio, Y. Generative Adversarial NetsNeural Information Processing Systems; MIT Press: Cambridge, MA, USA, 2014. [Google Scholar]
  23. He, Q.; Tang, X.; Li, C.; Lu, J.; Chen, J. Bearing Fault Diagnosis Method Based on Small Sample Data under Unbalanced Loads. Chin. J. Mech. Eng. 2021, 32, 1164–1171+1180. [Google Scholar]
  24. He, W.; Chen, J.; Zhou, Y.; Xu, X.; Chen, B.; Guo, b. An Intelligent Machinery Fault Diagnosis Method Based on GAN and Transfer Learning under Variable Working Conditions. Sensors 2022, 22, 9175. [Google Scholar] [CrossRef] [PubMed]
  25. Huang, N.; Yang, X.; Cai, G. A Deep Adversarial Diagnosis Method for Wind Turbine Main Bearing Fault with Imbalanced Small Sample Scenarios. Proc. CSEE 2020, 40, 563–574. [Google Scholar]
  26. Xu, L.; Zheng, X.; Fu, B.; Tian, G. Fault Diagnosis Method of Motor Bearing Based on Improved GAN Algorithm. Dongbei Daxue Xuebao Ziran Kexueban 2019, 40, 1679–1684. [Google Scholar]
  27. Zhang, K.; Chen, Q.; Chen, J.; He, S.; Li, F.; Zhou, Z. A multi-module generative adversarial network augmented with adaptive decoupling strategy for intelligent fault diagnosis of machines with small sample. Knowl. Based Syst. 2022, 239, 107980–107996. [Google Scholar] [CrossRef]
Figure 1. The internal layout of the box-type substation.
Applsci 14 03112 g001
Figure 2. Overall structure of the box-type substation.
Applsci 14 03112 g002
Figure 3. CTGAN structure diagram.
Applsci 14 03112 g003
Figure 4. The principle of the self-attention mechanism.
Applsci 14 03112 g004
Figure 5. Self-attention workflow.
Applsci 14 03112 g005
Figure 6. SA-CTGAN data-derived model.
Applsci 14 03112 g006
Figure 7. AlexNet network model structure.
Applsci 14 03112 g007
Figure 8. Comparison of raw data and generated data heatmap: (a) original data distribution; (b) the generated data distribution of SMOTE; (c) the generated data distribution of CTGAN; (d) the generated data distribution of SA-CTGAN.
Applsci 14 03112 g008
Figure 9. Distribution comparison of original data with data generated: (a) original data distribution; (b) the generated data distribution of SMOTE; (c) the generated data distribution of CTGAN; (d) the generated data distribution of SA-CTGAN.
Applsci 14 03112 g009
Figure 10. The iterative process of different data-sets: (a) original data-set; (b) data-set enhanced by SMOTE; (c) data-set enhanced by CTGAN; (d) data-set enhanced by SA-CTGAN.
Applsci 14 03112 g010
Table 1. Fault indicators of box-type substations.
NumberIndexUnit
X1Box internal temperature°C
X2Box internal humidityRH
X3Water immersion in the boxmL
X4Smoke detection in the boxppm
X5Condensation in the boxmL
X6Contact resistanceΩ
X7Partial dischargepC
X8Dielectric loss rate/
X9Winding absorption ratio/
X10Core ground currentA
X11Core temperature°C
X12FrequencyHz
X13Voltage of the h-v KV
X14Current of the h-vA
X15Incoming line voltage of the l-vV
X16Outgoing line voltage of the l-vV
X17Incoming line current of the l-vA
X18Outgoing line current of the l-vA
X19Busbar temperature°C
X20Neutral currentA
X21Action rejection message/
X22Trip information/
X23Temperature of circuit contacts°C
X24Circuit breaker currentA
Table 2. Network structure.
Network Layer Network Layer Structure
1One-dimensional convolution (convolution kernel:16, Step:1) →
Relu activation → Normalization → Maximum pooling
2One-dimensional convolution (convolution kernel:3, Step:1) →
Relu activation → Normalization → Maximum pooling
3One-dimensional convolution (convolution kernel:3, Step:1) →
Relu activation → Maximum pooling
4One-dimensional convolution (convolution kernel:3, Step:1) →
Relu activation → Maximum pooling
5One-dimensional convolution (convolution kernel:3, Step:1) →
Maximum pooling
6Flatten the layer → Random inactivation (50%) → Fully Connected (Relu)
7Fully Connected (Relu) → (Reu) Random inactivation (50%)
8SoftMax fully connected layer
Table 3. Comparison of model results.
IndexSMOTECTGANSA-CTGAN
KL divergence0.01010.00420.0037
Mean cosine similarity0.84940.87680.8996
Cumulative deviation of the correlation coefficient11.971411.96829.8331
Heatmap SSIM metric0.83650.85270.9135
Table 4. Performances of different input datasets.
AccuracyOriginal DatasetSMOTECTGANSA-CTGAN
Training set89.32%91.47%94.46%94.91%
Validation set84.15%90.78%92.55%94.34%
Testing set82.94%89.94%92.61%94.81%
Disclaimer/Publisher’s Note: The statements, opinions and data contained in all publications are solely those of the individual author(s) and contributor(s) and not of MDPI and/or the editor(s). MDPI and/or the editor(s) disclaim responsibility for any injury to people or property resulting from any ideas, methods, instructions or products referred to in the content.

