
A Study on Improving Sleep Apnea Diagnoses Using Machine Learning Based on the STOP-BANG Questionnaire


Abstract
1. Introduction
2. Related Research
2.1. STOP-BANG
2.2. Application of Machine Learning
3. Experiment
3.1. Data Analisis
3.2. Import Machine Learning
3.2.1. Logistic Regression
| Algorithm 1. Logistic Regression for OSA Diagnosis | |
| 1: | data ← LoadData(”dataFile.csv”) |
| 2: | X ← data.drop([’data’]) |
| 3: | Y ← data[’OSA Diagnosis’] |
| 4: | Xtrain, Xtest, Ytrain, Ytest ← SplitData(X, Y, testSize = 0.2) |
| 5: | C values ← [0.001, 0.01, 0.1, 1, 5, 10] |
| 6: | for each C in C values do |
| 7: | logreg ← LogisticRegression(C = C) |
| 8: | logreg.fit(Xtrain, Ytrain) |
| 9: | Ypred ← logreg.predict(Xtest) |
| 10: | accuracy ← CalculateAccuracy(Ytest, Ypred) |
| 11: | Print(”Accuracy for C=C:”, accuracy) |
| 12: | end for |
3.2.2. Random Forest
| Algorithm 2. STOP-BANG Random Forest | |
| 1: | data ← LoadData(”dataFile.csv”) |
| 2: | X ← data.drop([’data’]) |
| 3: | Y ← data[’OSA Diagnosis’] |
| 4: | Xtrain, Xtest, Ytrain, Ytest ← SplitData(X, Y, testSize = 0.2) |
| 5: | n estimators ← [10, 50, 100, 200, 500, 1000] |
| 6: | for each n in n estimators do |
| 7: | rf ← RandomForestClassifier(n estimators = n) |
| 8: | rf.fit(Xtrain, Ytrain) |
| 9: | Ypred ← rf.predict(Xtest) |
| 10: | accuracy ← CalculateAccuracy(Ytest, Ypred) |
| 11: | Print(”Accuracy for n estimators:”, accuracy) |
| 12: | end for |
3.2.3. SVM
| Algorithm 3. Support Vector Machine for OSA Severity Diagnosis | |
| 1: | data ← read csv(”stopbang”) |
| 2: | X ← data.drop([’OSA’]) |
| 3: | y ← data[’OSA’] |
| 4: | Xtrain, Xtest, ytrain, ytest ← train test split(X, y, test size = 0.2, random state = 42) |
| 5: | for C val in [0.001, 0.01, 0.1, 1, 10, 100] do |
| 6: | model ← SV C(C = C val, kernel =′ linear′) |
| 7: | model.f it(Xtrain, ytrain) |
| 8: | ypred ← model.predict(Xtest) |
| 9: | cm ← confusion matrix(ytest, ypred) |
| 10: | TN, FP, FN, TP ← cm.ravel() |
| 11: | sensitivity ← TP/(TP + FN) |
| 12: | specificity ← TN/(TN + FP) |
| 13: | accuracy ← accuracy score(ytest, ypred) |
| 14: | Print(”Accuracy:”, accuracy) |
| 15: | end for |
3.2.4. KNN
| Algorithm 4. K-Nearest Neighbor for OSA Diagnosis | |
| 1: | data ← read csv(”stopbang”) |
| 2: | X ← data.drop([’OSA’]) |
| 3: | y ← data[’OSA’] |
| 4: | Xtrain, Xtest, Ytrain, Ytest ← train test split(X, Y, test size = 0.3, random state = 42) |
| 5: | for k in [1, …, 29] do |
| 6: | model ← KNeighborsClassifier(n neighbors = k) |
| 7: | model.f it(Xtrain, Ytrain) |
| 8: | Ypred ← model.predict(Xtest) |
| 9: | cm ← confusion matrix(Ytest, Ypred) |
| 10: | TN, FP, FN, TP ← cm.ravel() |
| 11: | sensitivity ← TP/(TP + FN) |
| 12: | specificity ← TN/(TN + FP) |
| 13: | accuracy ← accuracy score(Ytest, Ypred) |
| 14: | Ypred proba ← model.predict proba(Xtest)[:, 1] |
| 15: | auc ← roc auc score(Ytest, Ypred proba) |
| 16: | f1 ← f1 score(Ytest, Ypred) |
| 17: | Print(”Accuracy:”, accuracy) |
| 18: | end for |
4. Result
5. Discussion
6. Conclusions
Author Contributions
Funding
Institutional Review Board Statement
Informed Consent Statement
Data Availability Statement
Conflicts of Interest
References
- Kumar, V.M. Sleep and sleep disorders. Indian J. Chest Dis. Allied Sci. 2008, 50, 129–135. [Google Scholar] [PubMed]
- Kim, H.C. The importance of diagnosis and treatment of snoring and obstructive sleep apnea and the role of dentists. J. Korean Dent. Assoc. 2010, 48, 178–183. [Google Scholar]
- Kim, J.K.; Kim, H.J. Clinical assessment for obstructive sleep apnea and national health insurance criteria for polysomnography. J. Korean Med. Assoc. 2020, 63, 410–419. [Google Scholar] [CrossRef]
- Chiu, H.Y.; Chen, P.Y.; Chuang, L.P.; Chen, N.H.; Tu, Y.K.; Hsieh, Y.J.; Wang, Y.C.; Guilleminault, C. Diagnostic accuracy of the Berlin questionnaire, STOP-BANG, STOP, and Epworth sleepiness scale in detecting obstructive sleep apnea: A bivariate meta-analysis. Sleep Med. Rev. 2017, 36, 57–70. [Google Scholar] [CrossRef] [PubMed]
- Mashaqi, S.; Staebler, D.; Mehra, R. Combined nocturnal pulse oximetry and questionnaire-based obstructive sleep apnea screening—A cohort study. Sleep Med. 2020, 72, 157–163. [Google Scholar] [CrossRef] [PubMed]
- Nagappa, M.; Liao, P.; Wong, J.; Auckley, D.; Ramachandran, S.K.; Memtsoudis, S.; Mokhlesi, B.; Chung, F. Validation of the STOP-BANG questionnaire as a screening tool for obstructive sleep apnea among different populations: A systematic review and meta-analysis. PLoS ONE 2015, 10, e0143697. [Google Scholar] [CrossRef]
- Orbea, C.A.P.; Lloyd, R.M.; Faubion, S.S.; Miller, V.M.; Mara, K.C.; Kapoor, E. Predictive ability and reliability of the STOP-BANG questionnaire in screening for obstructive sleep apnea in midlife women. Maturitas 2020, 135, 1–5. [Google Scholar] [CrossRef]
- Chung, F.; Yegneswaran, B.; Liao, P.; Chung, S.A.; Vairavanathan, S.; Islam, S.; Khajehdehi, A.; Shapiro, C.M. STOP Questionnaire: A Tool to Screen Patients for Obstructive Sleep Apnea. Anesthesiology 2008, 108, 812–821. [Google Scholar] [CrossRef] [PubMed]
- Farney, R.J.; Walker, B.S.; Farney, R.M.; Snow, G.L.; Walker, J.M. The STOP-BANG Equivalent Model and Prediction of Severity of Obstructive Sleep Apnea: Relation to Polysomnographic Measurements of the Apnea/Hypopnea Index. J. Clin. Sleep Med. 2011, 7, 459–465. [Google Scholar] [CrossRef]
- Yang, H.; Park, H. Usefulness of the Berlin, STOP, and STOP-BANG Questionnaires in the Diagnosis of Obstructive Sleep Apnea. J. Sleep Med. 2019, 16, 11–20. [Google Scholar] [CrossRef]
- Rajendra, P.; Latifi, S. Prediction of diabetes using logistic regression and ensemble techniques. Comput. Methods Programs Biomed. Update 2021, 1, 100032. [Google Scholar] [CrossRef]
- Holfinger, S.J.; Lyons, M.M.; Keenan, B.T.; Mazzotti, D.R.; Mindel, J.; Maislin, G.; Magalang, U.J. Diagnostic performance of machine learning-derived OSA prediction tools in large clinical and community-based samples. Chest 2022, 161, 807–817. [Google Scholar] [CrossRef]
- Javeed, A.; Berglund, J.S.; Dallora, A.L.; Saleem, M.A.; Anderberg, P. Predictive power of XGBoost_BiLSTM model: A machine-learning approach for accurate sleep apnea detection using electronic health data. Int. J. Comput. Intell. Syst. 2023, 16, 188. [Google Scholar] [CrossRef]
- Shi, Y.; Zhang, Y.; Cao, Z.; Ma, L.; Yuan, Y.; Niu, X.; Ren, X. Application and interpretation of machine learning models in predicting the risk of severe obstructive sleep apnea in adults. BMC Med. Inform. Decis. Mak. 2023, 23, 230. [Google Scholar] [CrossRef]
- Han, H.; Oh, J. Application of various machine learning techniques to predict obstructive sleep apnea syndrome severity. Sci. Rep. 2023, 13, 6379. [Google Scholar] [CrossRef]
- Bazoukis, G.; Bollepalli, S.C.; Chung, C.T.; Li, X.; Tse, G.; Bartley, B.L.; Armoundas, A.A. Application of artificial intelligence in the diagnosis of sleep apnea. J. Clin. Sleep Med. 2023, 19, 1337–1363. [Google Scholar] [CrossRef]
- Sateia, M.J. International classification of sleep disorders-third edition. Chest 2014, 146, 1387–1394. [Google Scholar] [CrossRef]
- Hwang, M.; Zhang, K.; Nagappa, M.; Saripella, A.; Englesakis, M.; Chung, F. Validation of the STOP-BANG questionnaire as a screening tool for obstructive sleep apnoea in patients with cardiovascular risk factors: A systematic review and meta-analysis. BMJ Open Respir. Res. 2021, 8, e000848. [Google Scholar] [CrossRef] [PubMed]
- Nusinovici, S.; Tham, Y.C.; Yan, M.Y.C.; Ting, D.S.W.; Li, J.; Sabanayagam, C.; Wong, T.Y.; Cheng, C.Y. Logistic regression was as good as machine learning for predicting major chronic diseases. J. Clin. Epidemiol. 2020, 122, 56–69. [Google Scholar] [CrossRef] [PubMed]
- Christodoulou, E.; Ma, J.; Collins, G.S.; Steyerberg, E.W.; Verbakel, J.Y.; Van Calster, B. A systematic review shows no performance benefit of machine learning over logistic regression for clinical prediction models. J. Clin. Epidemiol. 2019, 110, 12–22. [Google Scholar] [CrossRef]
- Rigatti, S.J. Random forest. J. Insur. Med. 2017, 47, 31–39. [Google Scholar] [CrossRef] [PubMed]
- Biau, G.; Scornet, E. A random forest guided tour. Test 2016, 25, 197–227. [Google Scholar] [CrossRef]
- Soman, K.P.; Loganathan, R.; Ajay, V. Machine Learning with SVM and Other Kernel Methods; PHI Learning Pvt. Ltd.: New Delhi, India, 2009. [Google Scholar]
- Osisanwo, F.Y.; Akinsola, J.E.T.; Awodele, O.; Hinmikaiye, J.O.; Olakanmi, O.; Akinjobi, J. Supervised machine learning algorithms: Classification and comparison. Int. J. Comput. Trends Technol. IJCTT 2017, 48, 128–138. [Google Scholar]
- Zhang, Z. Introduction to machine learning: K-nearest neighbors. Ann. Transl. Med. 2016, 4, 218. [Google Scholar] [CrossRef]
- Guo, G.; Wang, H.; Bell, D.; Bi, Y.; Greer, K. KNN model-based approach in classification. In On The Move to Meaningful Internet Systems 2003: CoopIS, DOA, and ODBASE, Proceedings of the OTM Confederated International Conferences, CoopIS, DOA, and ODBASE 2003, Catania, Sicily, Italy, 3–7 November 2003; Springer: Berlin/Heidelberg, Germany, 2003; pp. 986–996. [Google Scholar]


| Value | |
|---|---|
| Age (years) | 45.5 ± 13.3 |
| Sex: Male | 195 (74.4%) |
| Sex: Female | 67 (25.6%) |
| BMI (kg/m2) | 28.2 ± 4.6 |
| Neck circumference (cm) | 39.2 ± 3.9 |
| Waist-to-hip ratio | 0.95 ± 0.1 |
| PSQI score | 11.8 ± 5.5 |
| ESS score | 8.5 ± 3.7 |
| TST (min) | 341.0 ± 50.7 |
| AHI (events/h) | 24.2 ± 20.0 |
| ODI (events/h) | 26.7 ± 23.9 |
| STOP-BANG score | 4.1 ± 1.5 |
| SpO2 nadir (%) | 80.9 ± 8.5 |
| Diagnosis: OSA (AHI < 5) | 53 (20.2%) |
| Diagnosis: OSA (AHI ≥ 5) | 209 (79.8%) |
| Snore | Tired | Observe | Pressure | BMI | Age | Neck | Gender | |
|---|---|---|---|---|---|---|---|---|
| 1 | 221 | 214 | 158 | 155 | 244 | 145 | 145 | 195 |
| 0 | 41 | 48 | 104 | 107 | 18 | 117 | 117 | 67 |
| C value | 0.01 | 0.1 | 1 | 5 |
| Accuracy | 0.87 | 0.94 | 0.91 | 0.92 |
| Sensitivity | 1 | 0.96 | 0.94 | 0.96 |
| Specificity | 0 | 0.42 | 0.71 | 0.71 |
| F1 Score | 0 | 0.59 | 0.81 | 0.81 |
| n_estimators | 10 | 50 | 100 | 200 | 500 |
| Accuracy | 0.84 | 0.84 | 0.85 | 0.84 | 0.85 |
| Sensitivity | 0.86 | 0.88 | 0.88 | 0.9 | 0.9 |
| Specificity | 0.71 | 0.57 | 0.71 | 0.42 | 0.57 |
| F1 Score | 0.78 | 0.69 | 0.78 | 0.58 | 0.69 |
| C value | 0.1 | 1 | 10 | 100 |
| Accuracy | 0.87 | 0.87 | 0.92 | 0.92 |
| Sensitivity | 1 | 1 | 0.96 | 0.96 |
| Specificity | 0 | 0 | 0.71 | 0.71 |
| F1 score | 0.81 | 0.81 | 0.92 | 0.92 |
| K value | 7 | 9 | 11 | 13 |
| Accuracy | 0.92 | 0.92 | 0.94 | 0.96 |
| Sensitivity | 0.71 | 0.71 | 0.85 | 0.71 |
| Specificity | 0.89 | 0.89 | 0.92 | 0.92 |
| F1 Score | 0.96 | 0.93 | 0.95 | 0.96 |
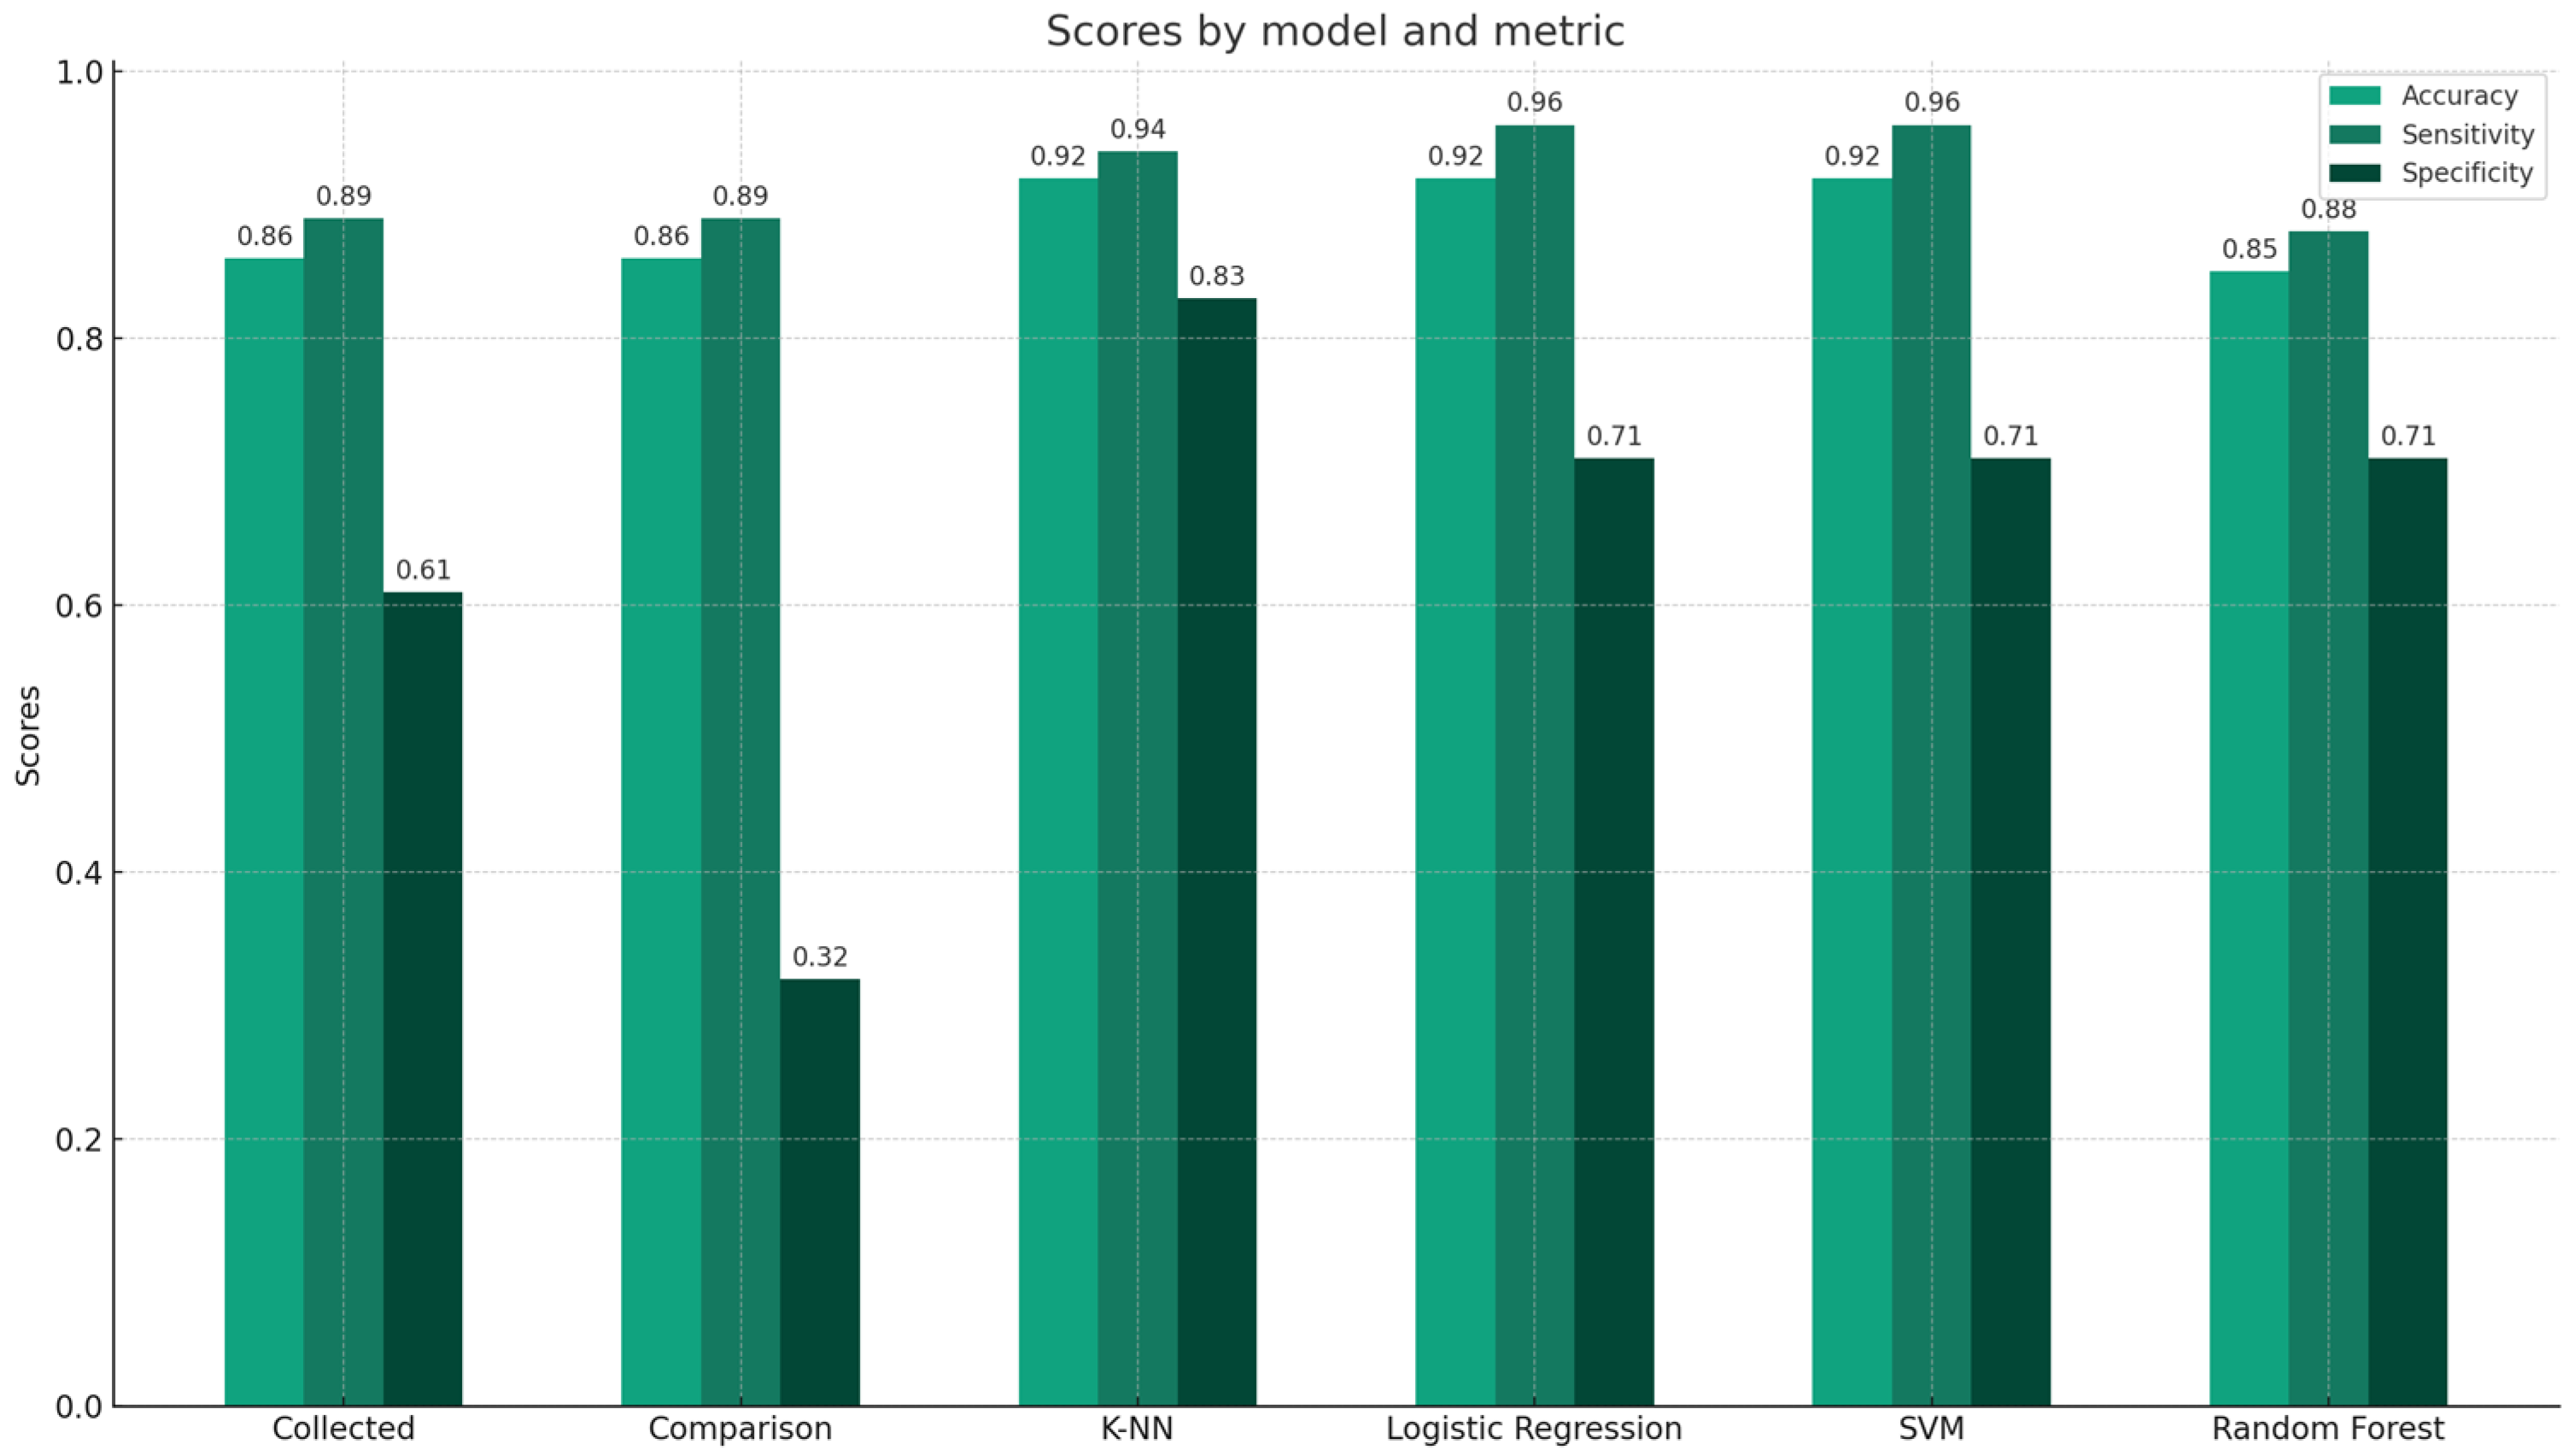
| Collected Data | Comparison Data | K-NN (K Value 11) | Logistic Regression (C = 5) | SVM (C = 10) | Random Forest (n_estimators = 100) | |
|---|---|---|---|---|---|---|
| Accuracy | 0.86 | 0.86 | 0.92 | 0.92 | 0.92 | 0.85 |
| Sensitivity | 0.89 | 0.89 | 0.94 | 0.96 | 0.96 | 0.88 |
| Specificity | 0.61 | 0.32 | 0.83 | 0.71 | 0.71 | 0.71 |
Disclaimer/Publisher’s Note: The statements, opinions and data contained in all publications are solely those of the individual author(s) and contributor(s) and not of MDPI and/or the editor(s). MDPI and/or the editor(s) disclaim responsibility for any injury to people or property resulting from any ideas, methods, instructions or products referred to in the content. |
© 2024 by the authors. Licensee MDPI, Basel, Switzerland. This article is an open access article distributed under the terms and conditions of the Creative Commons Attribution (CC BY) license (https://creativecommons.org/licenses/by/4.0/).
Share and Cite
Choi, M.-S.; Han, D.-H.; Choi, J.-W.; Kang, M.-S. A Study on Improving Sleep Apnea Diagnoses Using Machine Learning Based on the STOP-BANG Questionnaire. Appl. Sci. 2024, 14, 3117. https://doi.org/10.3390/app14073117
Choi M-S, Han D-H, Choi J-W, Kang M-S. A Study on Improving Sleep Apnea Diagnoses Using Machine Learning Based on the STOP-BANG Questionnaire. Applied Sciences. 2024; 14(7):3117. https://doi.org/10.3390/app14073117
Chicago/Turabian StyleChoi, Myoung-Su, Dong-Hun Han, Jun-Woo Choi, and Min-Soo Kang. 2024. "A Study on Improving Sleep Apnea Diagnoses Using Machine Learning Based on the STOP-BANG Questionnaire" Applied Sciences 14, no. 7: 3117. https://doi.org/10.3390/app14073117
APA StyleChoi, M.-S., Han, D.-H., Choi, J.-W., & Kang, M.-S. (2024). A Study on Improving Sleep Apnea Diagnoses Using Machine Learning Based on the STOP-BANG Questionnaire. Applied Sciences, 14(7), 3117. https://doi.org/10.3390/app14073117