1. Introduction
The rapid development of information and communication technology has significantly facilitated the digital transformation of enterprises. This process has also promoted the rapid development of enabling technologies, such as the industrial Internet, digital twins, and industrial big data. Moreover, the increasing demand for personalized products will affect the system, production lines, and products. The enterprise digital transformation is developing towards multi-variety, small-batch, and personalized production, which promotes the realization of intelligent manufacturing, product life cycle monitoring, and “Made in China 2025” [
1]. Aiming at multi-level spans of time/space scales of components in the production line cyber–physical system, order-driven and random disturbances interact in the production process. Moreover, the physical resource allocation/execution and information decision-making reconstruction are loosely related to the control link [
2].
The production mode in discrete manufacturing workshops is different from process production. The production process is usually decomposed into multiple processing tasks to complete, and each of them is applied to specific equipment or resources within the enterprise. It should be noted that tasks with the same process are assigned to one device for processing. At the same time, the production process of discrete manufacturing workshops needs to adapt to changes in customer needs, product forms, and production factors. In discrete workshops, many factors affect production planning, including changes in product types, production delivery dates, and equipment status, thereby adding complexity to the formulation of production plans and the prediction of actual factory capacity. In the past production, factory scheduling and delivery forecasts were mainly evaluated by scheduling personnel based on experience and historical data. However, with the ever-changing demand for product production, the management of production factors, production activity planning, and production process control are becoming increasingly complex. Managing, controlling, predicting, analyzing, and optimizing efficiently, reasonably, and in real time are among the important issues facing discrete manufacturing workshops. Furthermore, before a company builds a new production base and processes new products, realizing the company’s production capacity forecast, delivery date evaluation, and rational production arrangement must be the focus of the company’s work.
Discrete manufacturing workshop production activity planning and production capacity evaluation typically involve two stages [
3,
4]. In the first stage, experienced engineers manage personnel, materials, equipment, processes, and other information in the discrete manufacturing workshop. Material storage, planning arrangements, capacity forecasting, etc., are all evaluated based on personnel experience and historical information and stored on paper media. Information statistics, transmission, query, and analysis are difficult, leading to a lower accuracy rate. However, with the introduction of Enterprise Resource Planning (ERP), Manufacturing Execution System (MES) systems, and computer technology, data statistics, archival, and transmission capabilities have been significantly improved. Since information processing and analysis capabilities are continuously improved, factory informatization has entered the second stage [
5]. According to the material requirement plan, process route, and man-hour quota, the time and workload required for production capacity are given and compared with the capacity provided by the manufacturing workshop. This evaluation shows whether completing the material requirement plan matches the ability. If the utilization rate of the equipment is unacceptable, the master production plan should be adjusted, and the material requirements plan should be regenerated. During this stage, the system can realize production and processing resource constraints, production process allocation, production equipment monitoring, etc. However, due to the lack of real-time interaction and information fusion capabilities, production capacity prediction and delivery dates rely more on historical data for model evaluation [
6].
Before building new factories and processing new products, problems such as a lack of historical data are exposed, making it impossible to predict workshop production capacity accurately. Combining the current requirements of intelligent manufacturing systems, the introduction of digital workshops signifies a change in the elements of traditional manufacturing systems. Moreover, the concept of digital twin workshops has also emerged as the times require [
7]. In the digital twin manufacturing workshop, the data of production factors such as personnel, equipment, materials, and environment in the physical workshop are fully connected to the information world through the workshop Internet of Things (IoT), RFID, and other information means, realizing mutual interconnection and data sharing. Driven by comprehensive production factor data, the simulation, evaluation, and analysis functions of the virtual workshop and workshop service system can optimize the behavior of each factor while considering the status of other factors. This approach supports the linkage and optimal combination of factors necessary to ensure smooth production operations [
8]. The data in the physical space mainly refer to the real data generated by the physical entities of the workshop. Conversely, the data in the information space mainly refer to the data related to the virtual workshop and the workshop service system. These data are not directly collected from the physical space but from virtual workshop data which is based on digital twin data model, algorithm deduction, and system derivation [
9]. With the introduction of digital twin technology, a multi-physical, multi-scale, and multi-probability twin of a discrete manufacturing workshop is established through digital means to achieve deep integration and real-time interaction between physical space and information space, offering a basis for data-driven workshop capacity prediction.
Considering the characteristics of discrete manufacturing workshops, such as the production of many types of products, small batches, and frequent production changes, this paper discusses the problems of inaccurate production capacity forecasts and unfulfilled delivery dates during the factory production process. Based on predictive data, it is possible to optimize production scheduling methods in digital twin systems and provide follow-up suggestions. The modeling method of discrete manufacturing workshops driven by twin data and the establishment process of factor conditions are considered based on the problems faced by discrete manufacturing workshops. In addition, the neural network algorithm to realize accurate predictions of factory production capacity and delivery management is studied based on the interactive fusion of twin space and twin data. Finally, the feasibility of this method is experimentally verified. The main contributions of this paper are in the following three aspects:
Discussing the current production capacity forecasting methods and problems faced by discrete manufacturing workshops and proposing a digital twin-driven discrete manufacturing workshop capacity forecasting system framework;
Innovating the modeling process of discrete manufacturing workshops driven by twin data and proposing a time series prediction algorithm for workshop production capacity based on Long Short-Term Memory (LSTM);
Taking the lead in building a digital twin platform for capacity prediction in discrete manufacturing workshops and conducting digital deployment in actual manufacturing workshops to verify the accuracy of the prediction model.
The subsequent chapters of this paper are arranged as follows: The related work is described in the second section.
Section 3 considers the production mode, management mode, and current production capacity forecasting method of the discrete manufacturing workshop. Moreover, the system framework for capacity forecasting in the discrete manufacturing workshop is presented. In
Section 4, this paper establishes the capacity problem model for discrete workshops driven by digital twins.
Section 5 presents the design of production capacity prediction algorithms driven by twin data, along with a discussion of the constraints and solutions involved in the process of building the information space of discrete manufacturing workshops using digital twin technology.
Section 6 conducts an experiment to validate the feasibility of the proposed approach. Finally, this paper concludes with a summary of the key findings and contributions.
2. Related Works
This section introduces the current related research on aspects of production capacity prediction in discrete workshops, workshop production capacity control driven by twin data, and workshop production capacity prediction algorithms.
2.1. Capacity Forecasting for Discrete Workshops
In a discrete manufacturing workshop, the production process of products is typically divided into multiple processing tasks. Each task is applied to specific equipment or resources within the enterprise, ensuring that tasks with the same process are assigned to the same equipment for processing. The production process route and equipment usage are flexible and variable, and there are many changes in product design, processing requirements, order quantity, production lead time, and other aspects during the production process. The dynamic changes in product types and equipment integration in discrete manufacturing workshops involve relatively complex product processes and equipment processing state constraints, requiring multiple processing workstations for processing and component assembly; the product shape and structure are highly dependent on customer preferences, leading to a high degree of customization.
Ozturk et al. [
10] proposed a branch-and-bound algorithm designed specifically to solve parallel-batch scheduling problems with different processing times, release times, and unit sizes, ensuring that the number of job batches does not exceed the equipment capacity and that the processing time is determined based on the maximum processing time within the batch. Zhou et al. [
11] introduced a knowledge graph-based framework for discrete manufacturing workshop resource allocation, integrating workshop implicit engineering knowledge to support the optimal resource allocation method. During the production and operation process of enterprises, many different varieties and series of products are produced simultaneously, resulting in complex and diverse products and frequent production changes. From the perspective of product processing, the production process in a discrete manufacturing workshop is a complex process formed by the parallel or serial connection of various component-processing subprocesses. This process contains complex constraints and disturbance factors. Therefore, the process control of discrete manufacturing enterprises becomes more complex and variable.
Table 1 provides an overview of the research methods employed by different scholars and highlights their advantages.
In discrete manufacturing workshops, many factors affect production planning, resulting in a very complex formulation of production plans. Workshop capacity prediction and production lead time are often estimated by the planning and scheduling person based on experience. However, any changes in the production process plan frequently lead to insufficient capacity estimation and delayed delivery times. To meet these needs, enterprises must be equipped with highly customized supply networks and create resilient corporate risk management capabilities to improve the decision support system for the design, scheduling, control, and collaborative management of digital manufacturing [
12].
Dengiz et al. [
13] pointed out that simulation modeling is one of the most useful techniques for analyzing and evaluating the dynamic behavior of complex manufacturing systems. They employed virtual simulation analysis modeling to improve productivity in the automotive industry. Benotsmane et al. [
14] used numerical and graphical modeling and simulation, 3D designs, and Tabu search in trajectory space to evaluate and enhance productivity through collaborative robot simulation and artificial intelligence methods. A. Florescu and S. A. Barabas [
15] utilized simulation in the control system of intelligent manufacturing systems to analyze current parameters and predict the requirements of future processing scenarios. In addition, in the customized needs of customers, the complexity of the process and high-quality requirements necessitate the evaluation of workshop production capacity based on multiple factors, such as specific product processes, production equipment status, and disturbance factors. Relying on on-site operators for estimation may lead to significant deviations in processing time and production capacity estimation due to insufficient personnel experience and on-site consideration. Consequently, the goal of achieving timely delivery may fail. S. Kim and K. Ryu [
16] proposed the definition of AI-based statistical analysis technology, which utilizes on-site information to estimate the maximum workshop capacity for the proposed process and improve the competitiveness of the mold industry. Wang et al. [
17] proposed a proactive manufacturing resource allocation (PMRA) method based on intelligent factory production performance prediction. This approach avoids production interruptions or performance degradation issues based on real-time analysis and an accurate prediction of production performance.
Table 1.
Research on production capacity forecasting.
Table 1.
Research on production capacity forecasting.
| Author | Characteristic | Advantage |
|---|
| Ozturk et al. [10] | Production capacity forecast based on equipment capacity, processing time, etc. | For a certain production line, it can quickly predict the production capacity. |
| Wang et al. [17] | Accurate predictions based on real-time analysis and production performance. | Real-time dynamic analysis based on equipment and production line status. |
| Zhou et al. [11] | A resource allocation framework for discrete manufacturing workshops based on knowledge graphs for capacity prediction. | Coordination of all resources in the workshop and evolution of the current production capacity forecast of the workshop based on the knowledge graph. |
| Dengiz et al. [13] | Improving productivity in the automotive industry using hybrid simulation–analytical modeling. | Analysis of the bottleneck of automobile production capacity based on the digital twin system, optimization of the design, and increase in production capacity. |
| This article | Establishing a prediction model for “digital twin data + LSTM network”. Iteratively optimizing the system through twin data and systems and dynamically fitting the production capacity forecast under different states. It has better applicability and reliability. | Full use of the advantages of a virtual and real fusion of digital twin systems and real production lines. With the support of digital twin data, consideration of the constraints of the workshop, and the analysis of production performance under different states and resources. Combined with the LSTM algorithm, facilitation of real-time and accurate analysis of production line capacity. |
Hence, for discrete manufacturing enterprises, effectively estimating production capacity and reasonably predicting delivery time based on production equipment elements, process requirements, and constraints is a critical issue before constructing discrete workshops and undertaking product processing. Once production anomalies occur, production adjustment demands are often released, and production decisions are often based on historical production information, which may result in production interruptions or performance degradation. Capacity prediction is a complex time series prediction problem that considers multiple factor disturbances.
2.2. Workshop Capacity Control Driven by Digital Twins
Discrete manufacturing workshops encounter many challenges and uncontrollable factors in production factor management, production activity planning management, and production process control. When building new factories and processing new products, achieving accurate production control processes is difficult due to a lack of historical data as a reference. Digital twinning has brought digital engineering modeling and simulation into a new era [
18]. Serving as the digital representation of real-world entities and systems, the information space within digital twins can realize the multi-dimensional, multi-scale, and multi-probability simulation process of physical entities. Through the interaction and fusion of twin data, digital twins facilitate the understanding, prediction, optimization, and control of real entities or systems [
19,
20].
The connotations, reference models, applications, and research issues of digital twin-driven intelligent manufacturing have been proposed in [
21]. This application focuses on continuous optimization, proactive maintenance, and continuous data processing throughout the production process. Vachálek et al. [
22] highlighted that the digital twin of industrial production lines could support the existing production structure within the automotive industry and utilize resources effectively through expanded production and planning strategies. Ma et al. [
23] proposed a digital twin-driven production management system for production workshops, enabling the dynamic simulation and optimization of the production process of the manufacturing industry while achieving real-time synchronization, high fidelity, and real virtual integration in network physical production. In response to constantly changing customer demands, rising resource costs, and growing uncertainty, Kunath et al. [
24] integrated the digital twin of manufacturing systems into decision support systems to enhance the order management process. In summary, digital twins achieve statistical, analytical, and optimized decision-making based on twin data through real-time interaction and fusion between the physical and information worlds. By utilizing continuous simulation and iterative input data and constraint conditions, digital twins offer an effective solution to the problem of inaccurate production capacity prediction prior to factory construction and product production and processing.
Due to the asynchronous data between the physical and information spaces in the workshop, a significant delay exists in production process control, resulting in a disconnection from actual production. Defects will be observed when using basic process data (key elements of Industry 4.0) for the fully automated data collection process, as well as the evaluation, quantification, and analysis of collected data. According to the superposition of digital twins and new-generation information technology, the discrete manufacturing physical and digital workshops have achieved bidirectional real mapping and real-time interaction capabilities, fully realizing the management mode encompassing all elements, processes, and businesses within the entire discrete manufacturing workshop. Driven by twin data, continuous iterative optimization is achieved by setting product process routes, production line constraints, production factor conditions, and production process control to achieve the optimal operation mode of workshop production and control. The virtual workshop model and related information can be overlaid and interacted with the physical workshop in real time, thereby simulating the operation process of the physical workshop based on historical time series data. Digital chain technology enables seamless integration, real-time interaction, and fusion between the virtual workshop and the physical workshop, which is expected to drive the production capacity evaluation and prediction of the workshop.
2.3. Prediction Algorithm for Production Capacity in Discrete Workshops
To address the problem of workshop capacity fluctuations with attributes such as large scale, strong NP-hard, non-convex optimization, and randomness, a combined approach employing a digital twin model and a digital twin data-driven approach is proposed to study production capacity prediction algorithms. These algorithms exhibit time sensitivity to meet fast and effective solution requirements, which is particularly crucial. In the past production, since yield prediction is a time series data analysis problem, the main methods included linear regression, exponential smoothing, and time series smoothing. However, with the increasing accuracy requirements of production capacity prediction models, advanced algorithms such as heuristic graph search, simulated annealing, genetic algorithms, and neural networks have emerged. Among them, in the discrete workshop, the ARIMA algorithm is suitable for predicting and analyzing the production capacity of a single product during stable equipment operation, maintaining data stability without production state iteration; RNN can effectively iterate process data and is suitable for processes where the state of products and equipment in discrete workshops is constantly changing. However, due to gradient explosion, convergence cannot be achieved, which is shown in
Table 2.
2.4. Summary of Relevant Research
The above research mainly elaborates on discrete workshop capacity prediction, digital twin modeling, driving decision-making, and capacity prediction algorithms. This clearly illustrates the value and prospects of digital twins in workshop control. It also elaborates on the types and adaptability of production prediction algorithms. However, there is a lack of correlation and architectural systems for establishing digital twin models and capacity analysis. No effective algorithm has been developed to demonstrate the value of data analysis and their application in discrete workshop capacity prediction in digital twins.
This paper establishes a digital twin workshop to simulate the operation and evolution of the workshop in different stages, such as discrete manufacturing production factor management, production plan management, and production process control driven by twin data. Then, it achieves applications, including evaluation, optimization, prediction, and traceability. By integrating production process control with the optimization feedback functions of the twin system, it becomes possible to accurately perceive the current state and future changes in the system, thereby effectively evaluating the workshop’s production capacity and delivery time.
3. System Framework for Capacity Prediction in Discrete Manufacturing Workshop
Discrete manufacturing workshops often allocate and schedule production based on the specific process and equipment status of products, resulting in many constraints on production scheduling and abnormally complex production process control. During the production process, there are many non-standard products due to the large variety of product types, and most production enterprises often have on-site workers for flexible adaptation [
30]. Consequently, data such as production evaluation, scheduling, production capacity prediction, and delivery time prediction rely on the abilities and experience of employees, leading to inaccuracies in predicting the actual production capacity of the workshop. In the production process of discrete manufacturing workshops, a variety of heterogeneous data sources, such as customer data, material data, production activity planning data, equipment status, and time-varying production process control, are involved. Currently, data analysis and processing are only performed manually or through ERP, MES, and other application systems. However, these approaches lack real-time interaction and information fusion, thereby limiting effective control over current production factors, production activity plans, and production process control within the workshop.
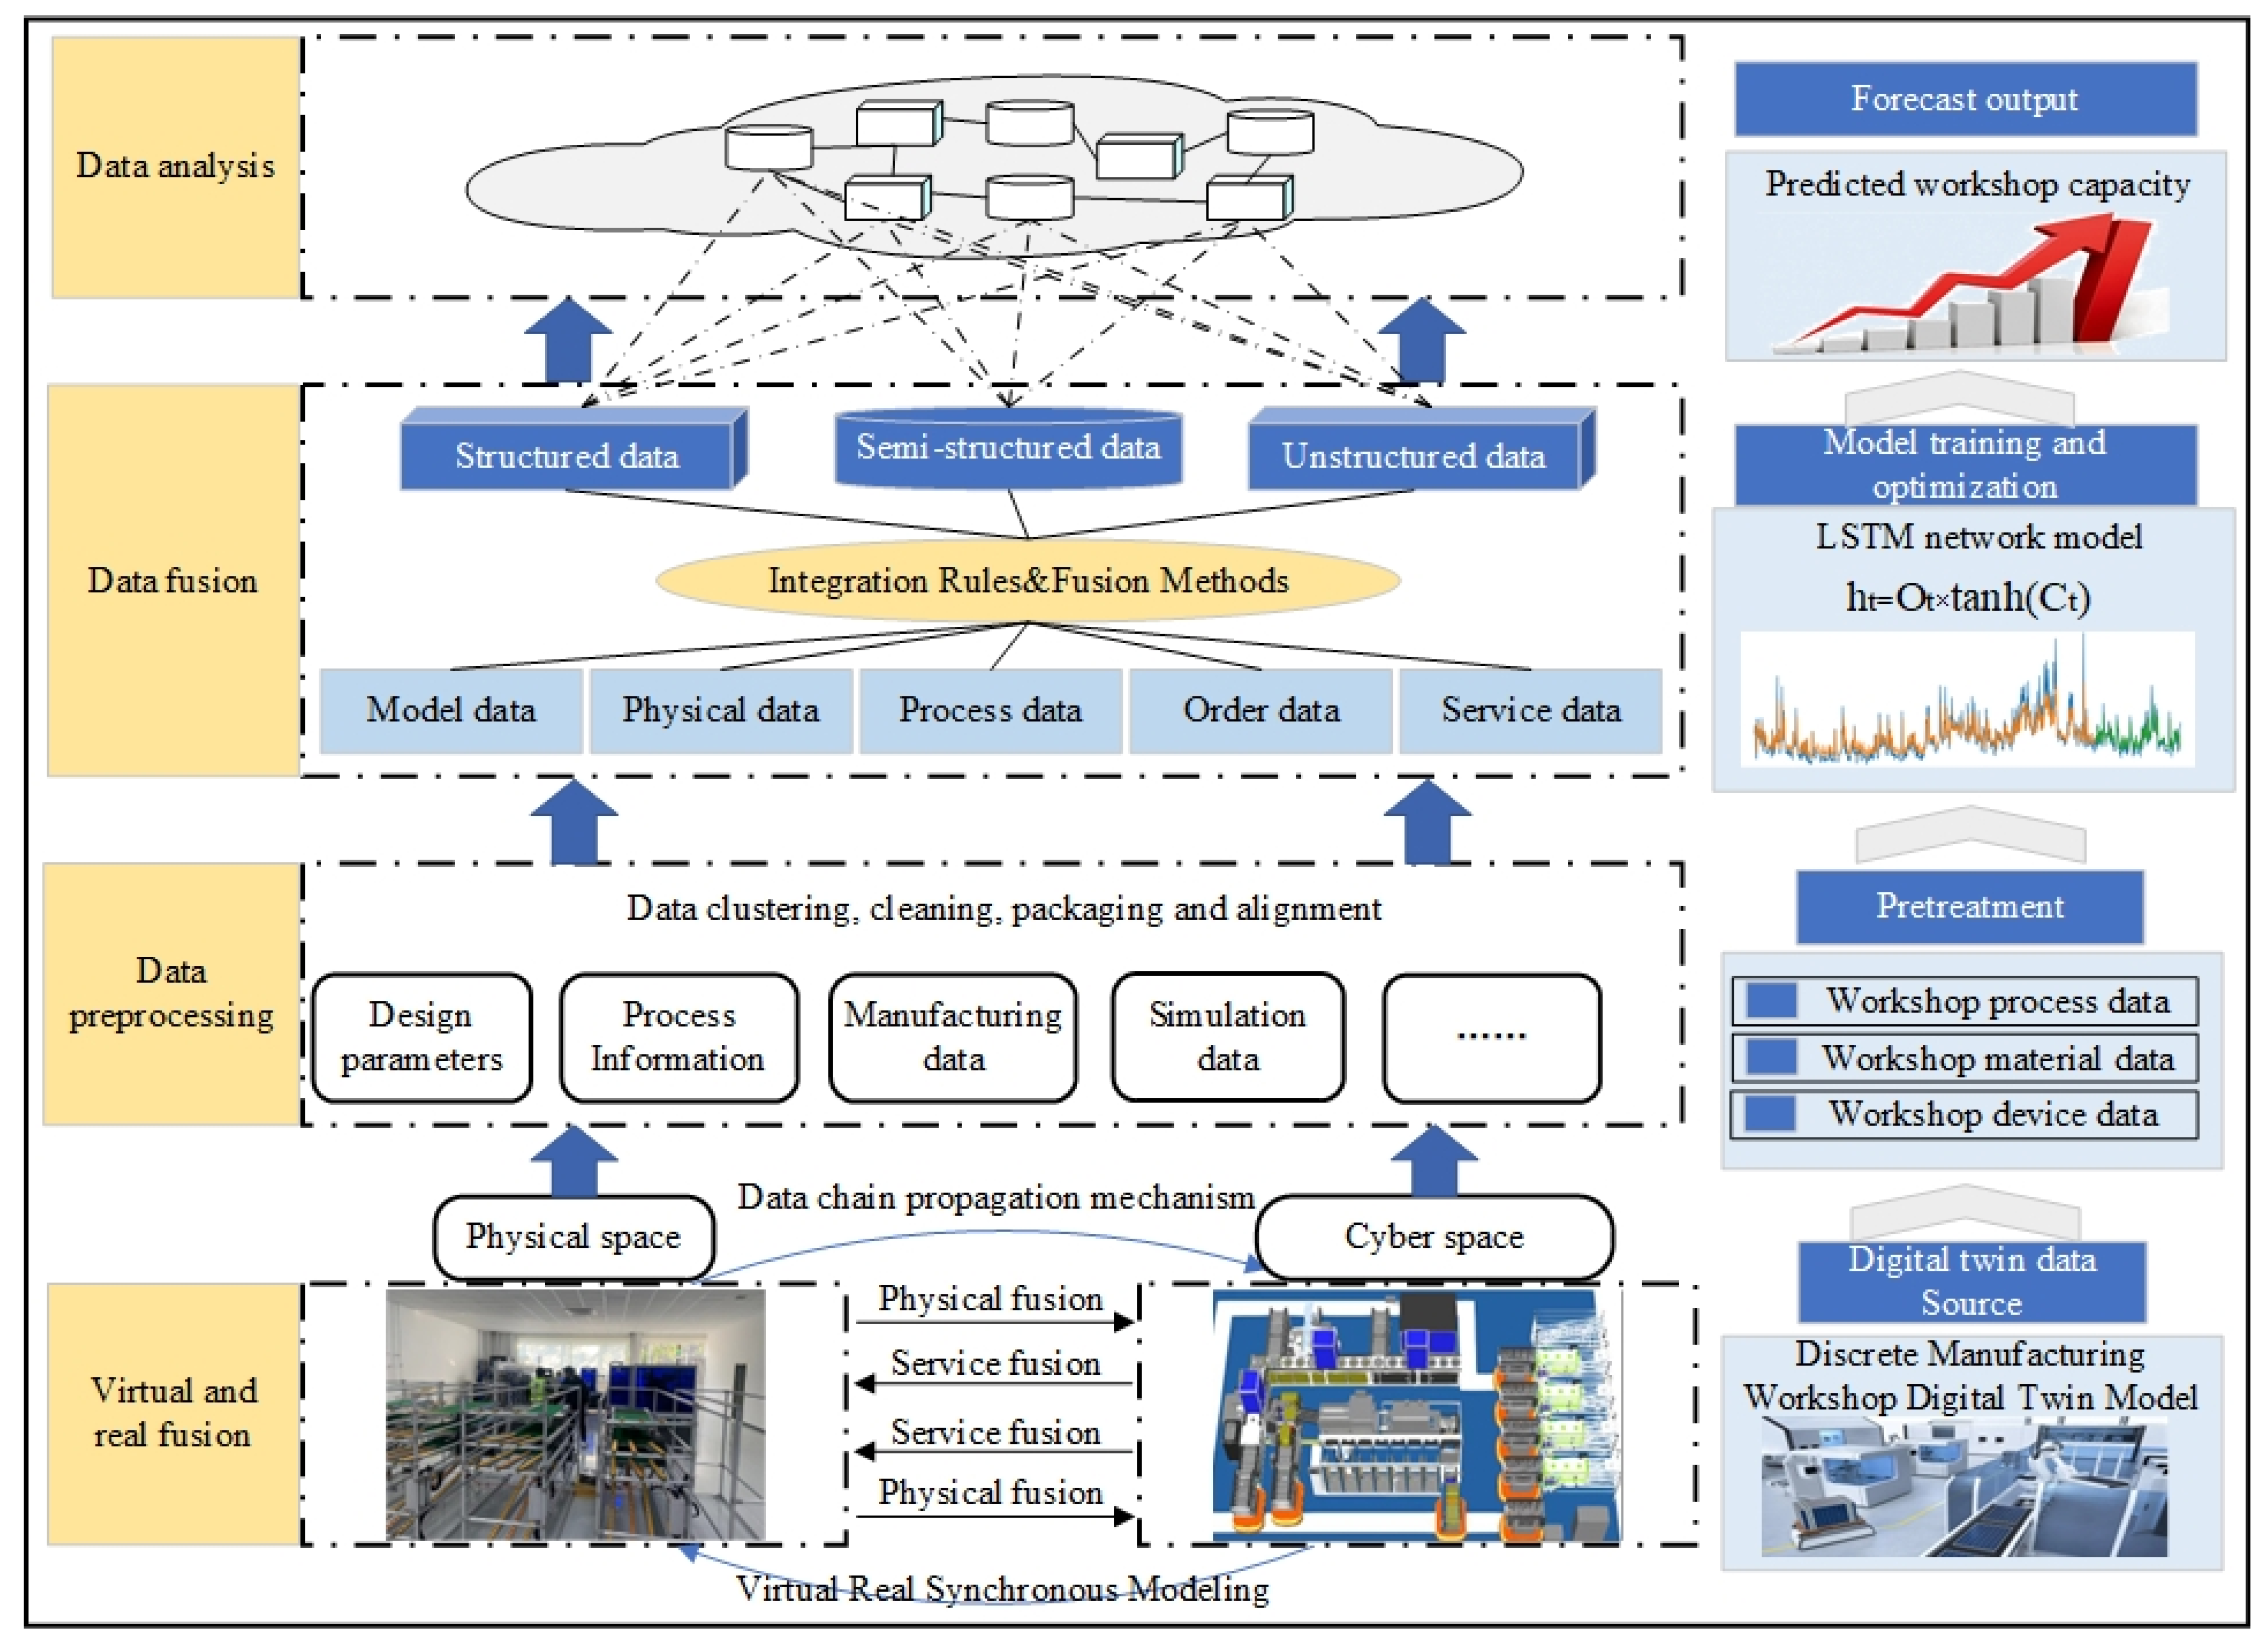
The digital twin of discrete manufacturing workshops represents a digital mapping of discrete workshops, as shown in
Figure 1, providing a system framework for predicting workshop capacity driven by digital twins. Based on the digital twin five-dimensional model theory, the discrete manufacturing workshop twin system involves physical workshops, virtual workshops, service systems, twin data, and connected services. The construction process of the digital twin system includes the construction of production factors, such as the human–machine material environment in the workshop, a production activity plan and process construction that organizes and distributes production factors reasonably, and system modeling processes, i.e., production system monitoring, analysis, and optimization. The digital twin system depicts all elements, processes, and business of the physical workshop, along with real-time interaction and system integration based on twin data. Through a full-factor modeling process based on the twin system, precise characterization of production factors in discrete manufacturing workshops can be achieved, leading to the establishment of a twin model that exhibits virtual and real consistencies. Additionally, a dynamic modeling process based on models and twin data can effectively solve the problem of twin data-driven production process state identification and dynamic iterative modeling. This process enables equipment fault diagnosis and predictive maintenance through iterative analysis based on the real-time status of the production line. Furthermore, the simulation analysis and decision-making of the production process are achieved based on the twin model and data fusion-driven modeling process by establishing constraints and coupling relationships among production factors, models, and data.
The precise prediction of production capacity for discrete manufacturing workshops is shown in
Figure 1. Firstly, a digital twin of discrete workshops is constructed using the software of Process Simulate 16.0.0. This architecture enables real-time interaction between information space and physical space through the utilization of digital chain technology. At this level, virtual and physical space production lines achieve physical fusion based on the same 3D and behavioral models. Based on mutual control between virtual space and physical space, bidirectional data transmission and service integration are achieved. Secondly, the data related to workshop production (cluster analysis, cleaning, and packaging) are preprocessed, which mainly includes workshop process data, workshop material data, and workshop equipment status. Then, the data are fused, and a prediction model is established using a combination of “digital twin data + LSTM network”. Finally, an accurate prediction of workshop production capacity is achieved through a series of data analysis techniques. By integrating all elements, processes, and business control in the production process, as well as the optimization feedback function of the twin system, it is possible to accurately perceive the current state and future changes in the system.
4. Discrete Shop Capacity Model Driven by Digital Twins
The discrete workshop capacity analysis based on digital twins is built on a data-driven twin system simulation model. The mathematical relationship between products and production capacity can be established by simulating the production process of twin systems and iterating the data. The first step in this analysis is to construct a model for discrete workshop production capacity.
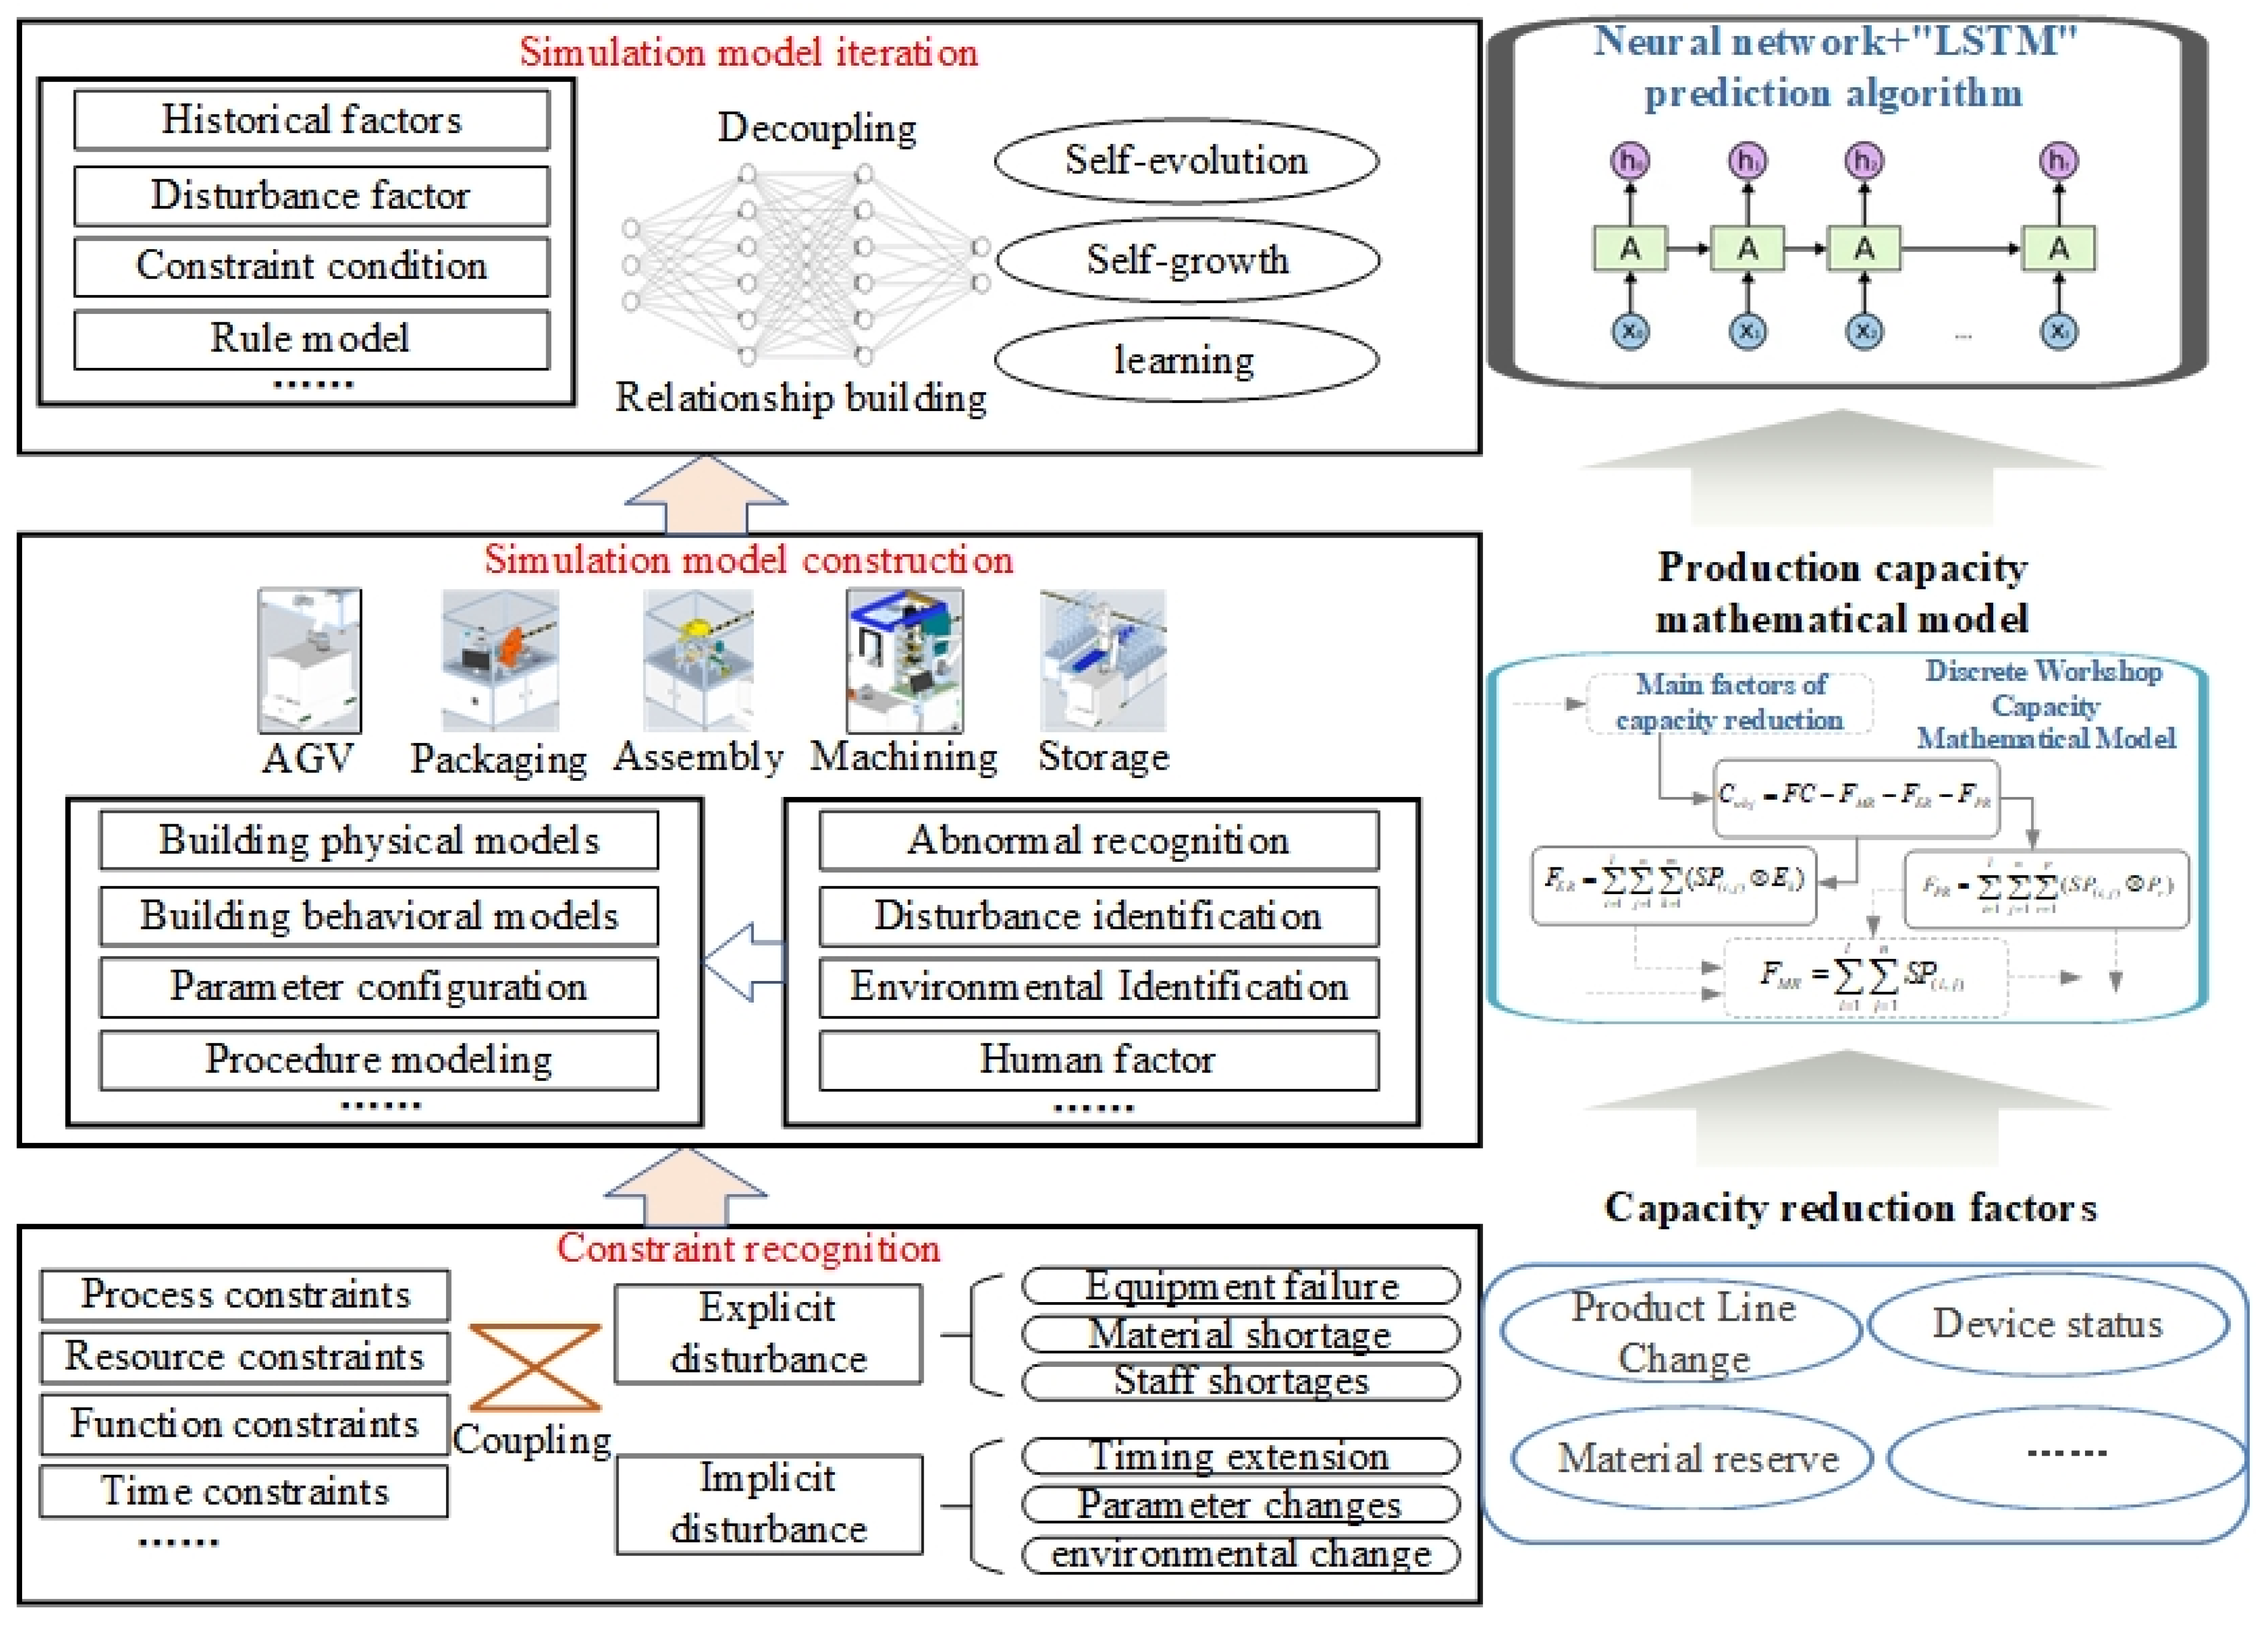
The occurrence of production capacity disturbance factors in discrete manufacturing workshops is random and variable. Twin data can be used in the model based on the fast simulation iteration ability of twin models to iterate production line operation information, collect and analyze production process data, and analyze data based on material pulling. Neural networks and other methods can be used to model the impact of disturbance factors on the production status and then achieve the model establishment of disturbance constraints. The disturbance constraint conditions include explicit and implicit disturbances. The explicit disturbance factors include product line changes, equipment failures, material shortages, and product quality non-conformities. The implicit disturbance factors include encompassing work-hour fluctuations and deviations from the workpiece completion time. Constraints caused by abnormal factors are established by varying the impact of multiple uncertain disturbances on the available production capacity time of the processes in the production system. Hence, this paper presents a mathematical modeling roadmap for workshop capacity driven by digital twins, which is shown in
Figure 2. By clarifying the capacity reduction caused by disturbance factors, a mathematical model for discrete manufacturing workshop capacity is constructed, and prediction algorithms are employed to predict changes in workshop capacity.
Capacity loss involves the identification of production bottlenecks, which can be attributed to various factors, such as delays in work-in-progress flow, process planning, process delays, material storage conditions, and equipment utilization. In a customized environment, the workshop requires considering the priority of orders and the urgency of delivery times. The workshop digital twin system pre-simulates the disturbance factors that affect capacity loss through the previously collected workshop data and calculates the identification and transfer of capacity loss or production bottlenecks caused by uncertain disturbance factors. The production capacity model of a discrete workshop is a typical multi-constraint function constrained by production bottlenecks, as shown in Equation (1).
where
represents the production capacity reduced by insufficient equipment utilization,
indicates the production capacity reduced by process fluctuations, and
denotes the actual production capacity of the workshop.
Material shortages are an important factor in reducing workshop production capacity. For each product, the material requirements of the product,
, are determined by the product type and product process, as shown in Equation (2):
where
represents the finished product caused by missing materials,
is the type of product in the workshop, and
symbolizes the number of processes in the finished product.
Equipment utilization rate, which refers to the ratio of the number of pieces of equipment involved in actual workshop production to the total number of pieces of equipment, is mainly influenced by factors such as the operational status of the equipment, the product types, and the process requirements and can be determined by Equation (3), as follows:
where
represents the set of equipment to be maintained in the
process of workpiece
.
Changes in orders mainly cause a reduction in production capacity caused by process fluctuations. The same category, different models, and different batches of products often exhibit differences, which can introduce fluctuations in the pace of processing changes in the previous process and the connection between the subsequent processes during process planning. These fluctuations, in turn, result in a reduction in workshop production capacity.
represents the interval between the pre- and post-process segments where there is no need to wait and production is blocked. In this part,
.
is shown in Equation (4), in which
represents the mapping between the finished product
and
.
The above equation provides the main three causes of capacity loss. In actual workshops, the occurrence of production capacity disturbance factors is random and not fixed. Thus, the production system may be affected by multiple uncertain disturbance factors together, impacting the time variation in available production capacity. Let
be the loss of available production capacity duration caused by the three production capacity disturbance factors on the
process, as shown in Equation (5).
where
is the
process of a certain
category product,
represents the available production capacity time lost in the
process due to the delay in the flow of work in process in the previous process,
indicates the available production capacity time for the
process due to production line blockage or work-in-process blockage, and
denotes the rework time of the product at the
process. In addition,
is the rework quantity of the product,
symbolizes the time from the occurrence of a fault in the
process to the repair of the fault,
represents the number of failures,
defines the loss of available production capacity time caused by insufficient material supply,
means the loss of available capacity time caused by material handling tool damage, and
refers to the loss of available production capacity time caused by quality issues with the materials on the workstation and failure to replenish them in a timely manner.
Equation (6) defines coupling multiple disturbance factors with production capacity time loss as a link, showing the possible capacity reduction in
, coupling function and capacity availability rate for the
process.
5. Algorithm Design for Capacity Forecasting Driven by Twin Data
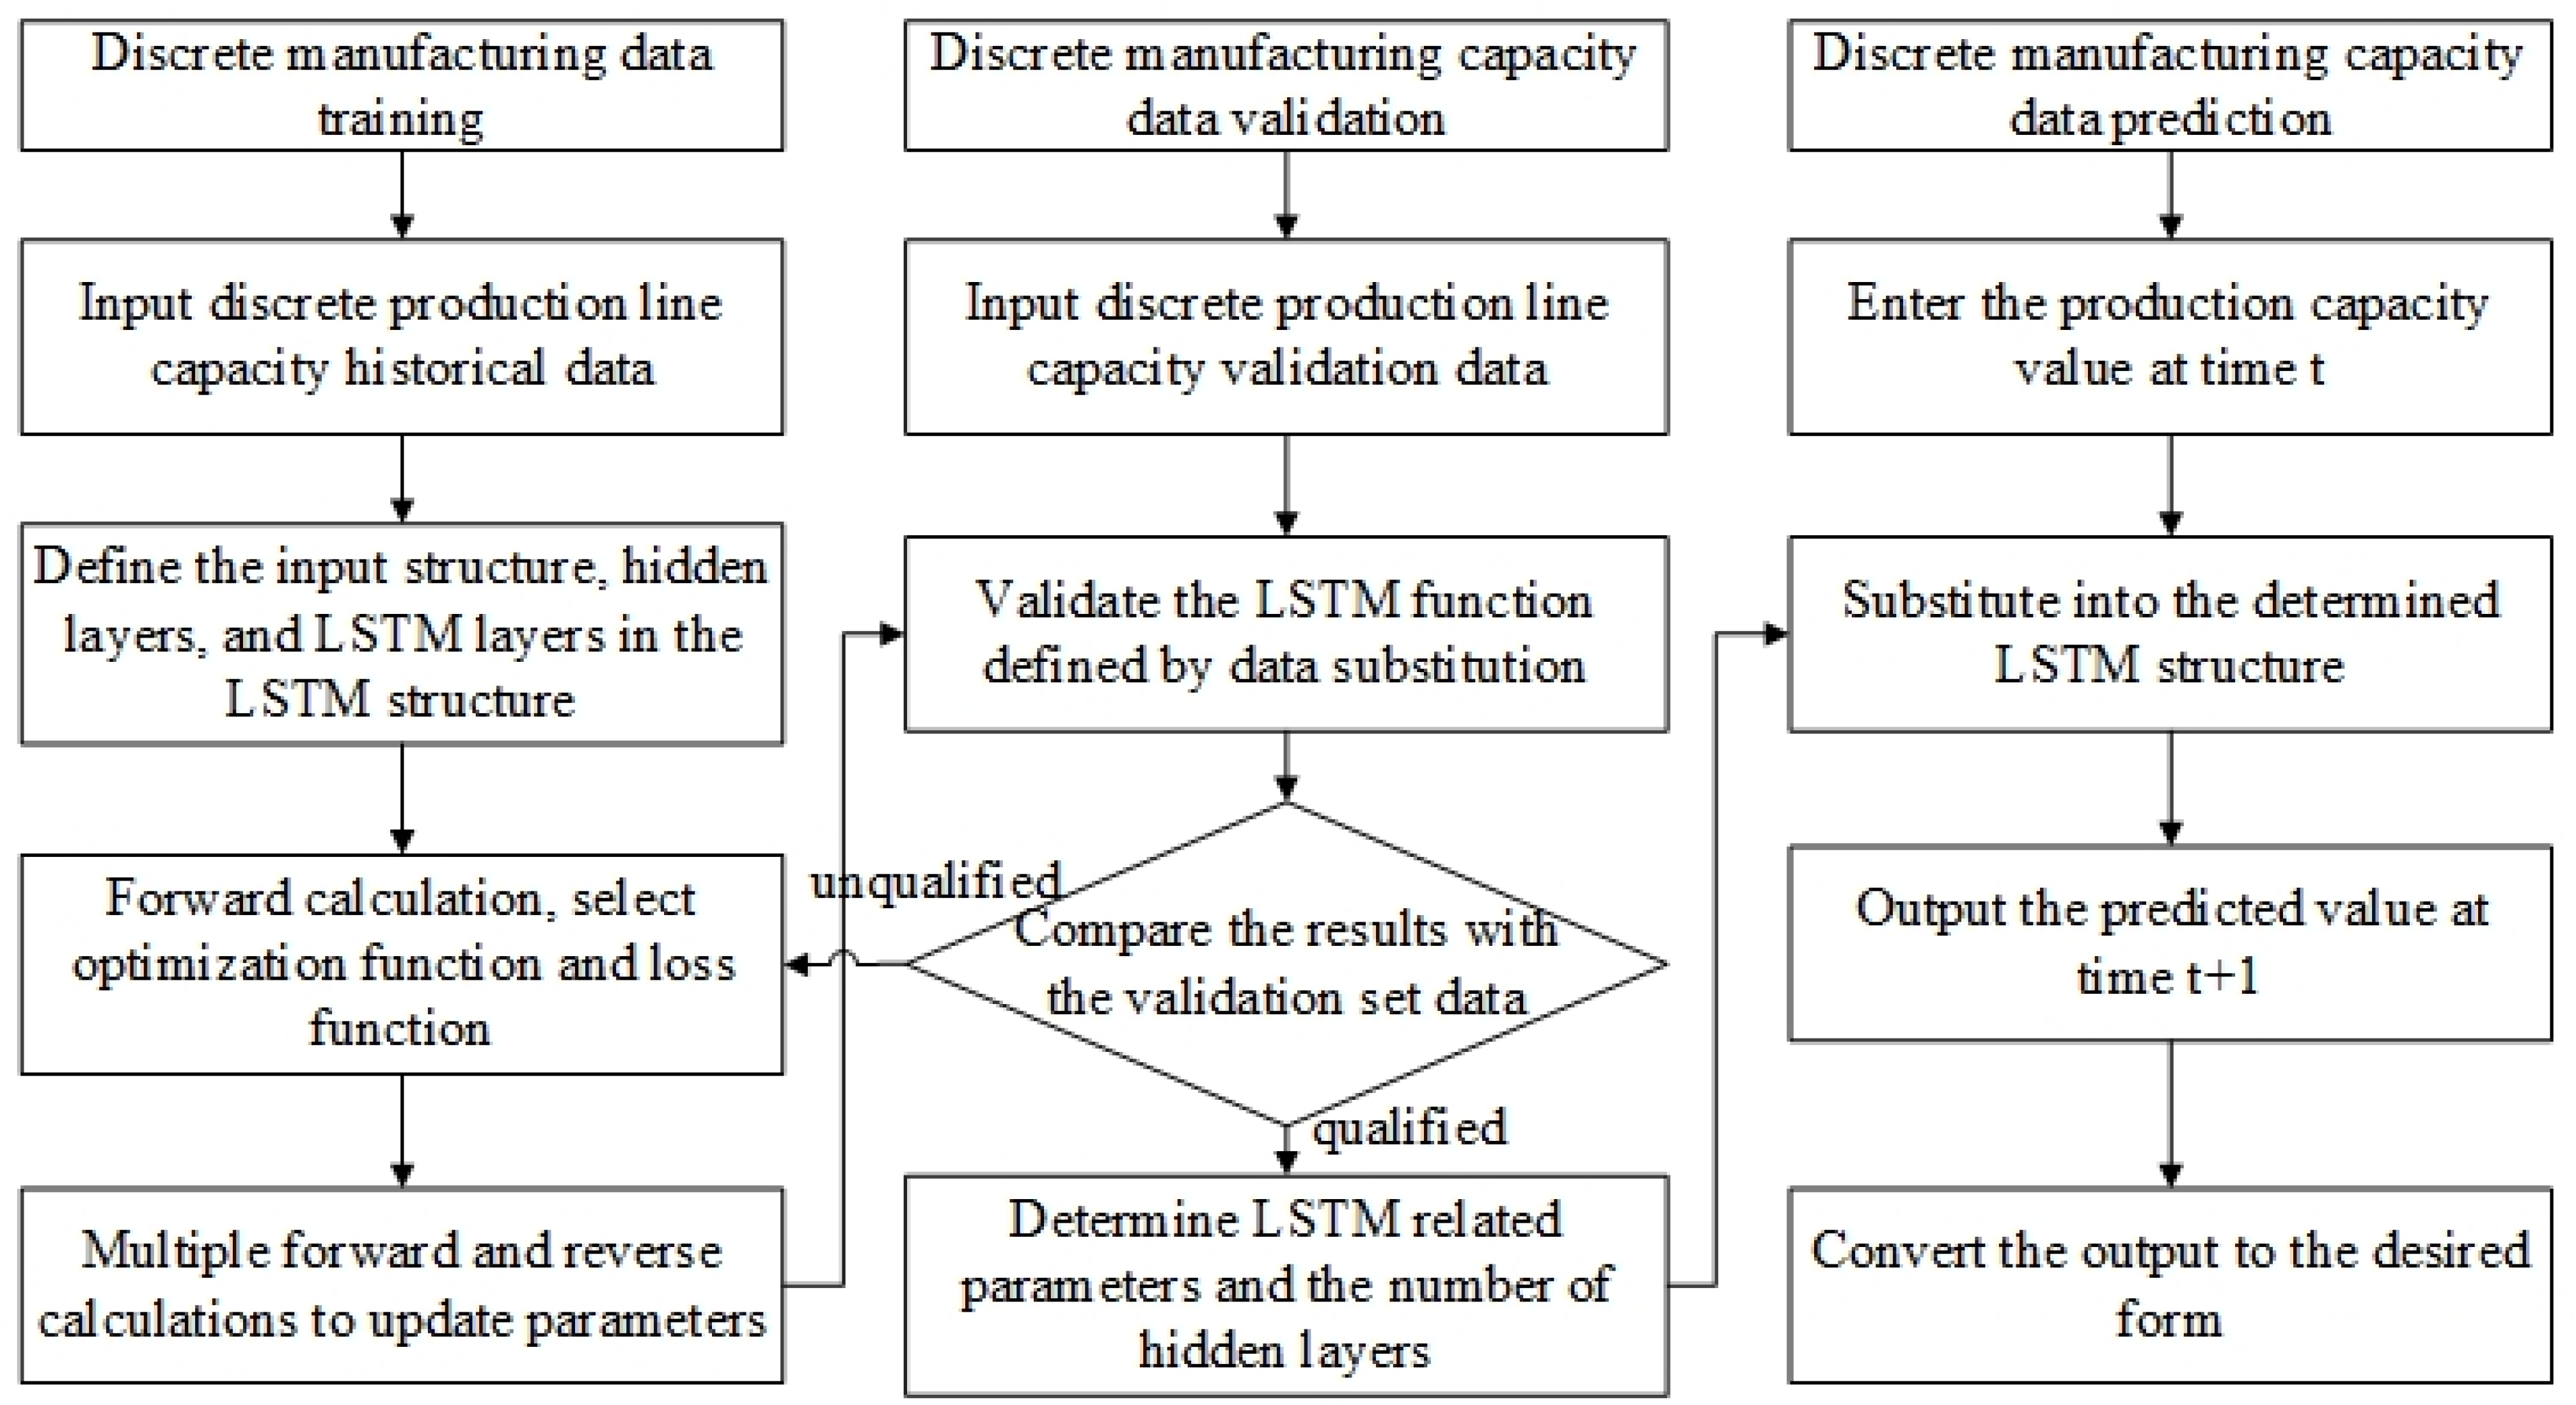
As can be seen in the previous section, a digital twin system is established before constructing a new factory and processing new products based on the construction of high-fidelity simulation models and the integration of constraints such as production factors, production plans, and production process control. Through the digital twin system, various data can be collected to evaluate the production capacity of new factories and new product processing. This prediction method can effectively address problems such as inaccurate predictions and the inability to meet delivery dates due to insufficient historical data and personnel experience. Production capacity analysis based on discrete manufacturing workshops involves the prediction of future production capacity based on twin data operations. Since the digital twin data belong to time series data, after analysis, this paper uses the short-term memory network algorithm of recurrent neural networks (RNNs) to predict production capacity.
LSTM is a temporal recurrent neural network designed to solve the long-term dependency problem of general RNNs, which can address the problems of gradient vanishing and gradient explosion in RNNs. The unique design structure of LSTM makes it suitable for processing and predicting important events with very long intervals and delays in the time series. Recurrent neural networks have the form of repeated module chains of neural networks. In the LSTM chain structure, each module contains four network layers, as shown in
Figure 3. Additionally, LSTM has three gates (information-forgetting gate, input gate, and output gate) to optimize neuronal information.
The output of the result can be expressed as Equation (7):
where
is used to determine the output gate information transmitted by the neurons. From the input
of the previous neuron and the raw input,
is calculated by the activation function and weight parameters. It can be expressed as shown in Equation (8):
where
and
are weight parameters and paranoia parameters, respectively.
In Equation (7),
is the activation function with an output range of [−1, 1]. Moreover, the value range of the derivative function is 0–1, which can effectively solve the problem of gradient disappearance in the cyclic network. The formula can be expressed as shown in Equation (9):
In Equation (8),
represents the activation function, which is a smooth step function and differentiable. It can convert any value between 0 and 1 for binary classification using Equation (10).
in Equation (7) represents the updated information of neurons, which effectively eliminates the long-term dependency problem in neural networks and establishes a more accurate connection between input and output information. The parameter
can be expressed as shown in Equation (11):
where
indicates the forgetting gate information, which determines the information that must be discarded in the network state. In a sequence of data, different data may change in focus over time, forgetting unnecessary and unimportant information, which is also the reason for the emergence of forgetting gates.
can be expressed as shown in Equation (12):
where
and
are input gate information. In the process of neuron update, the first step is to delete information, followed by the update of information. The network update information is obtained by transforming the previous neuron input
and system input
through the activation function of
and
.
can be expressed as shown in Equation (13):
where
can be expressed as shown in Equation (14):
, , and are taken as the input signals and propagate forward along the network. Under the action of each neuron weight, , and the activation function of , the output value of the network coupled with three disturbance factors is obtained through the output layer.
The input time series samples are considered as in the input layer, in which X is the three disturbance factors that affect the workshop production capacity. The output value is subtracted from the actual value to obtain network error b. This error is transmitted backward through the neural network, and the connection weights between neurons in each layer are corrected layer by layer.
The hidden layers in the model are represented as shown in Equation (15):
where
is the value of the
node in the input layer at time
, and
indicates the weight coefficient matrix between the
node in the hidden layer and the
node in the input layer. In addition,
represents the output value of the
node of the hidden layer at time
,
defines the output value of the
node of the hidden layer at time
, and
symbolizes the weight coefficient matrix of the
node of the hidden layer during backpropagation.
The number of hidden layer nodes in the model is set to m, and its output value is
. The model output layer is shown in Equation (16):
where
is the output value of the output layer at time
,
indicates the weight coefficient matrix between the
node of the hidden layer and the
node of the output layer, and
denotes the bias term.
The output layer of the model is shown in Equation (17):
where
represents the actual workshop production capacity,
indicates the predicted value output by the model, and
denotes the number of samples. It mainly needs to determine the five hyperparameters of the model, namely the time steps of the input layer, the dimension of the input layer, the number of hidden layers, the dimension of each hidden layer, and the dimension of the output variable.
The LSTM neural network uses input information,
, and
to form the final output objective function
. By continuously iterating and updating the system, effective prediction results are formed. The iterative process of the LSTM neural network system is defined in Algorithm 1.
| Algorithm 1: Algorithm for LSTM-based production capacity |
Input: Production capacity time series setting.
Output: Time series value of the production forecast. |
| Begin |
| Initialize data by first-order difference |
| Data transformation into supervised learning |
| --------Offline model training process------- |
| Normalize the data set //include , , , and |
| Training the LSTM_model |
| If () then |
| Export the LSTM_model |
| Else |
| Adjusting parameters and re-fitting the LSTM_model |
| End if |
| -------Online model Test process----------- |
| For i in range (normalized test data) |
| X= test_scaled[i, 0: −1] |
| y= test_scaled[i, −1] |
| Forecast_data= forecast_lstm(lstm_model, 1, X) |
| End for |
| Restore the first-order differential data |
| Store predicted values //calculate the and |
| Draw the comparison curve |
| End |
6. Experimental Verification
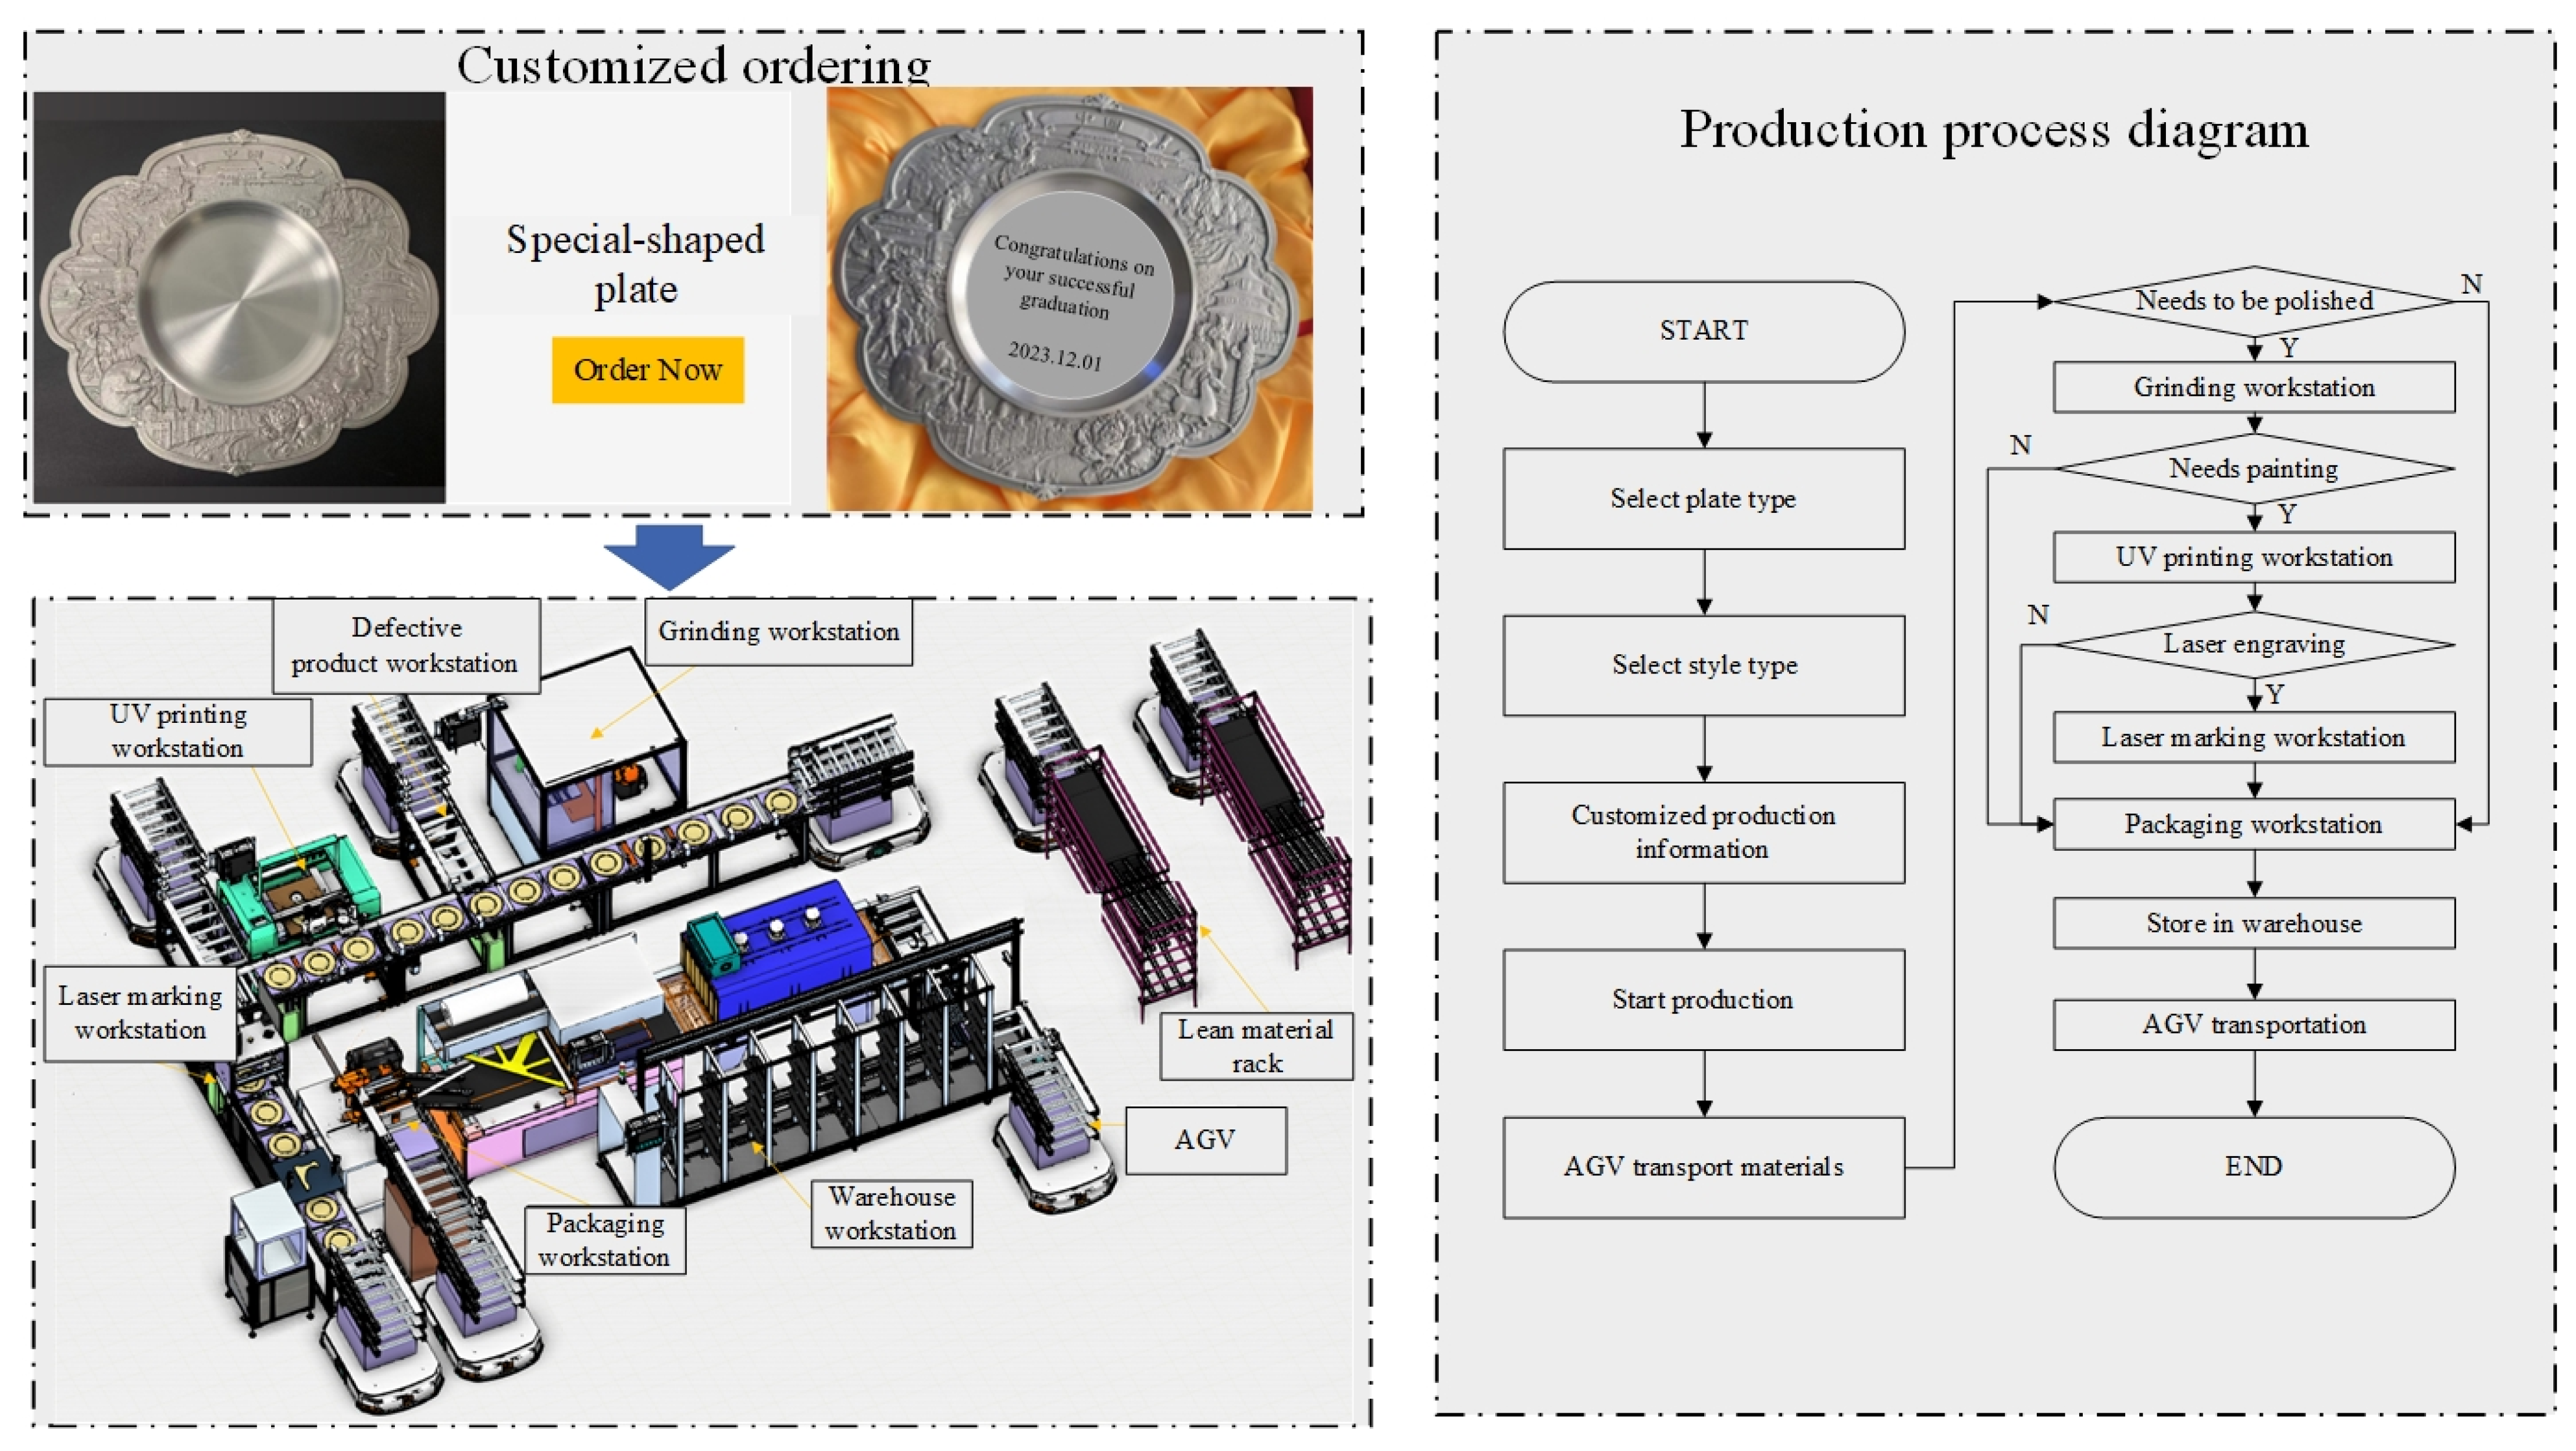
The commemorative disk custom production line exemplifies a small, customized production line that belongs to a typical discrete manufacturing workshop. In the design process, facing the verification process of production line capacity is inevitable. As shown in
Figure 4, the commemorative plate customization production line consists of seven modules, including lean material racks, grinding workstations, UV printing workstations, laser marking workstations, packaging workstations, storage workstations, and AGV workstations. The process is determined by the customer’s order, where customers can choose a specific style of commemorative plate, text, and pattern according to their own needs. Using the RFID tag that facilitates the identification of binding information, the system determines the operational status of each workstation and verifies the completion of customized processing content. Once the processing is completed, all of these products enter the storage system and are subsequently transported to a fixed location by the AGV for delivery.
The twin system modeling approach for the commemorative disk custom production line based on twin data mainly includes three aspects. Among them, in terms of workshop element modeling, the three-dimensional geometric model based on CAD design, production process model, equipment motion model, and robot rule model is assembled and fused into workstation modules, such as storage workstations and assembly workstations. The workshop production line model is formed by assembling the workstation model. Among these models, the geometry, behavior, and rules of equipment and production lines are described. The production process modeling includes collected order data from the order system, actual production data from the simulation system, equipment processing efficiency data, and quality inspection data. According to the processing and fusion of various data, multi-dimensional analysis and optimization of production status can be realized. In terms of constructing the production system model, the complete production process of the commemorative disk custom production line is constructed based on the twin data and the virtual model, which provides effective support for subsequent production process data monitoring and visual analysis.
Since the production capacity is time series data, according to the above twin system model construction, the data are counted for one hour for production capacity statistics, as listed in
Table 3.
This paper utilizes the twin data collected from the production process simulation to realize the entire workshop production capacity prediction process through the LSTM algorithm. And this article depicts the production status analysis process based on the combination of virtual and real models, which can be seen in
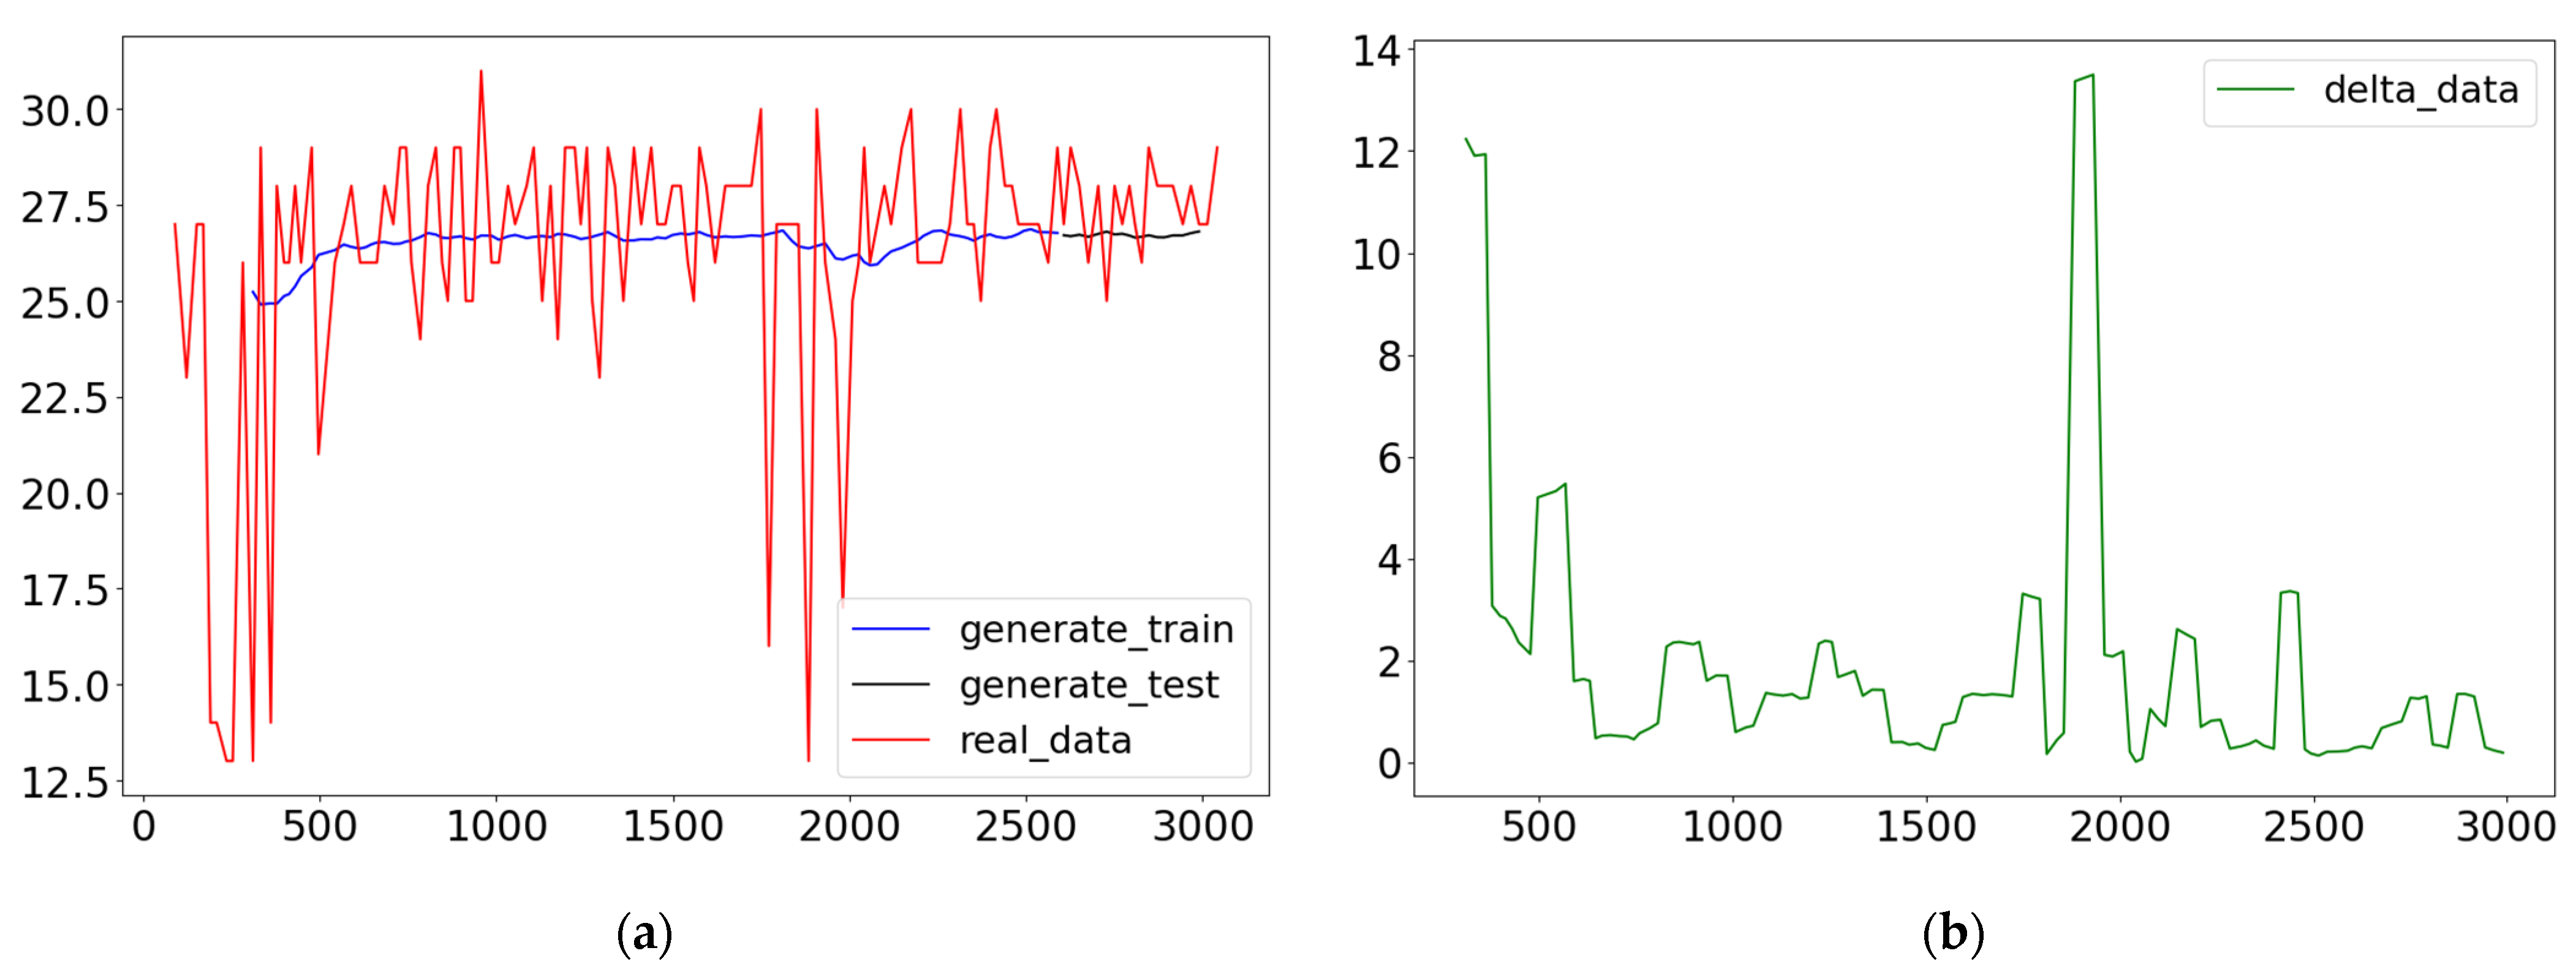
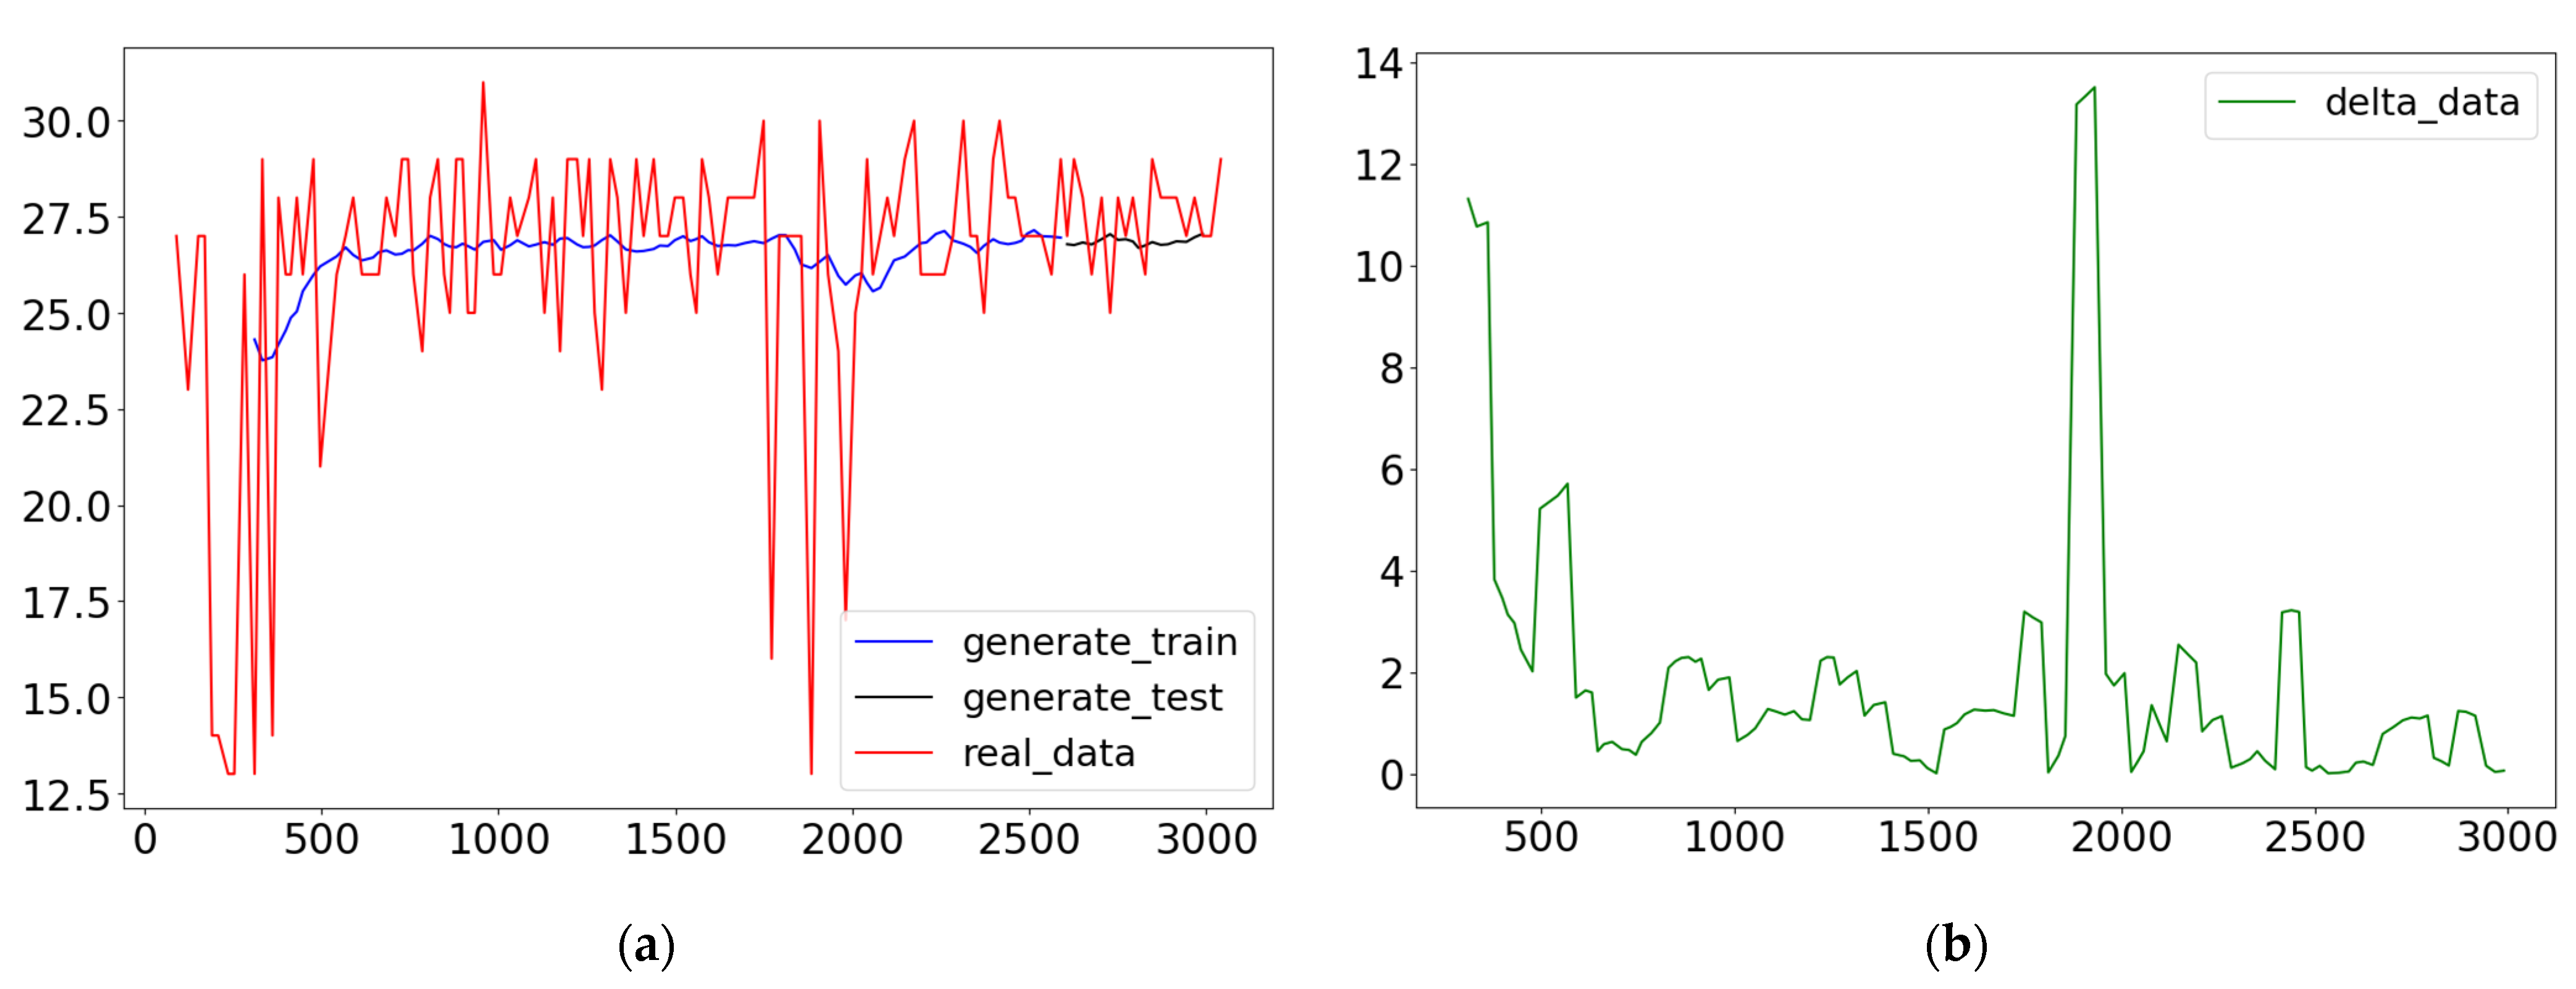
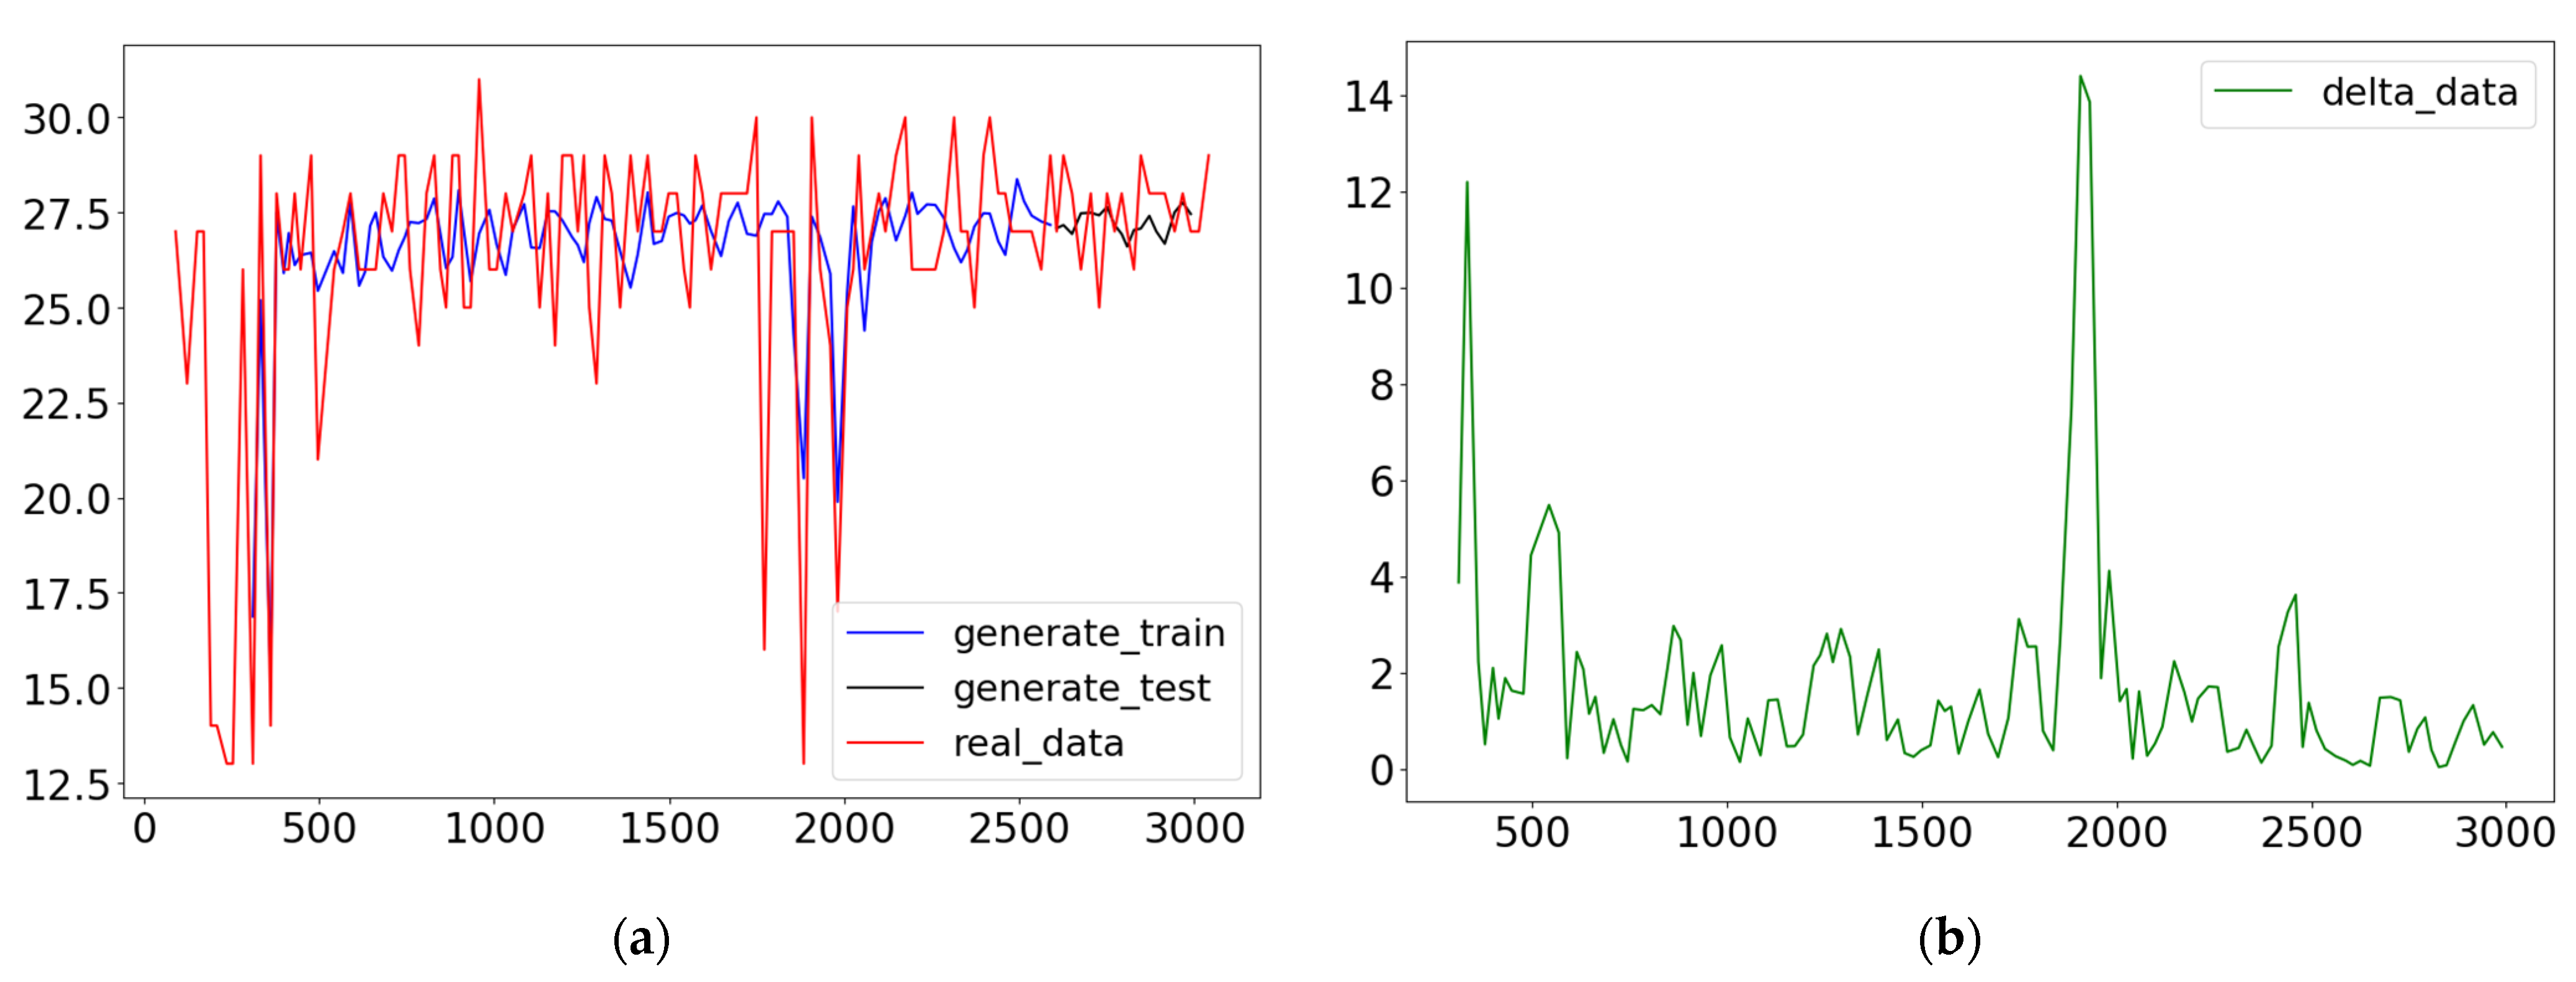
Figure 5. The parameters used in the algorithm include a time window size (N) of 60, a step size of 1, 128 memory units, and three hidden layers. The prediction results are shown in
Figure 6,
Figure 7 and
Figure 8 for 1000, 2000, and 5000 iterations on the model, with the number of neurons set to four.
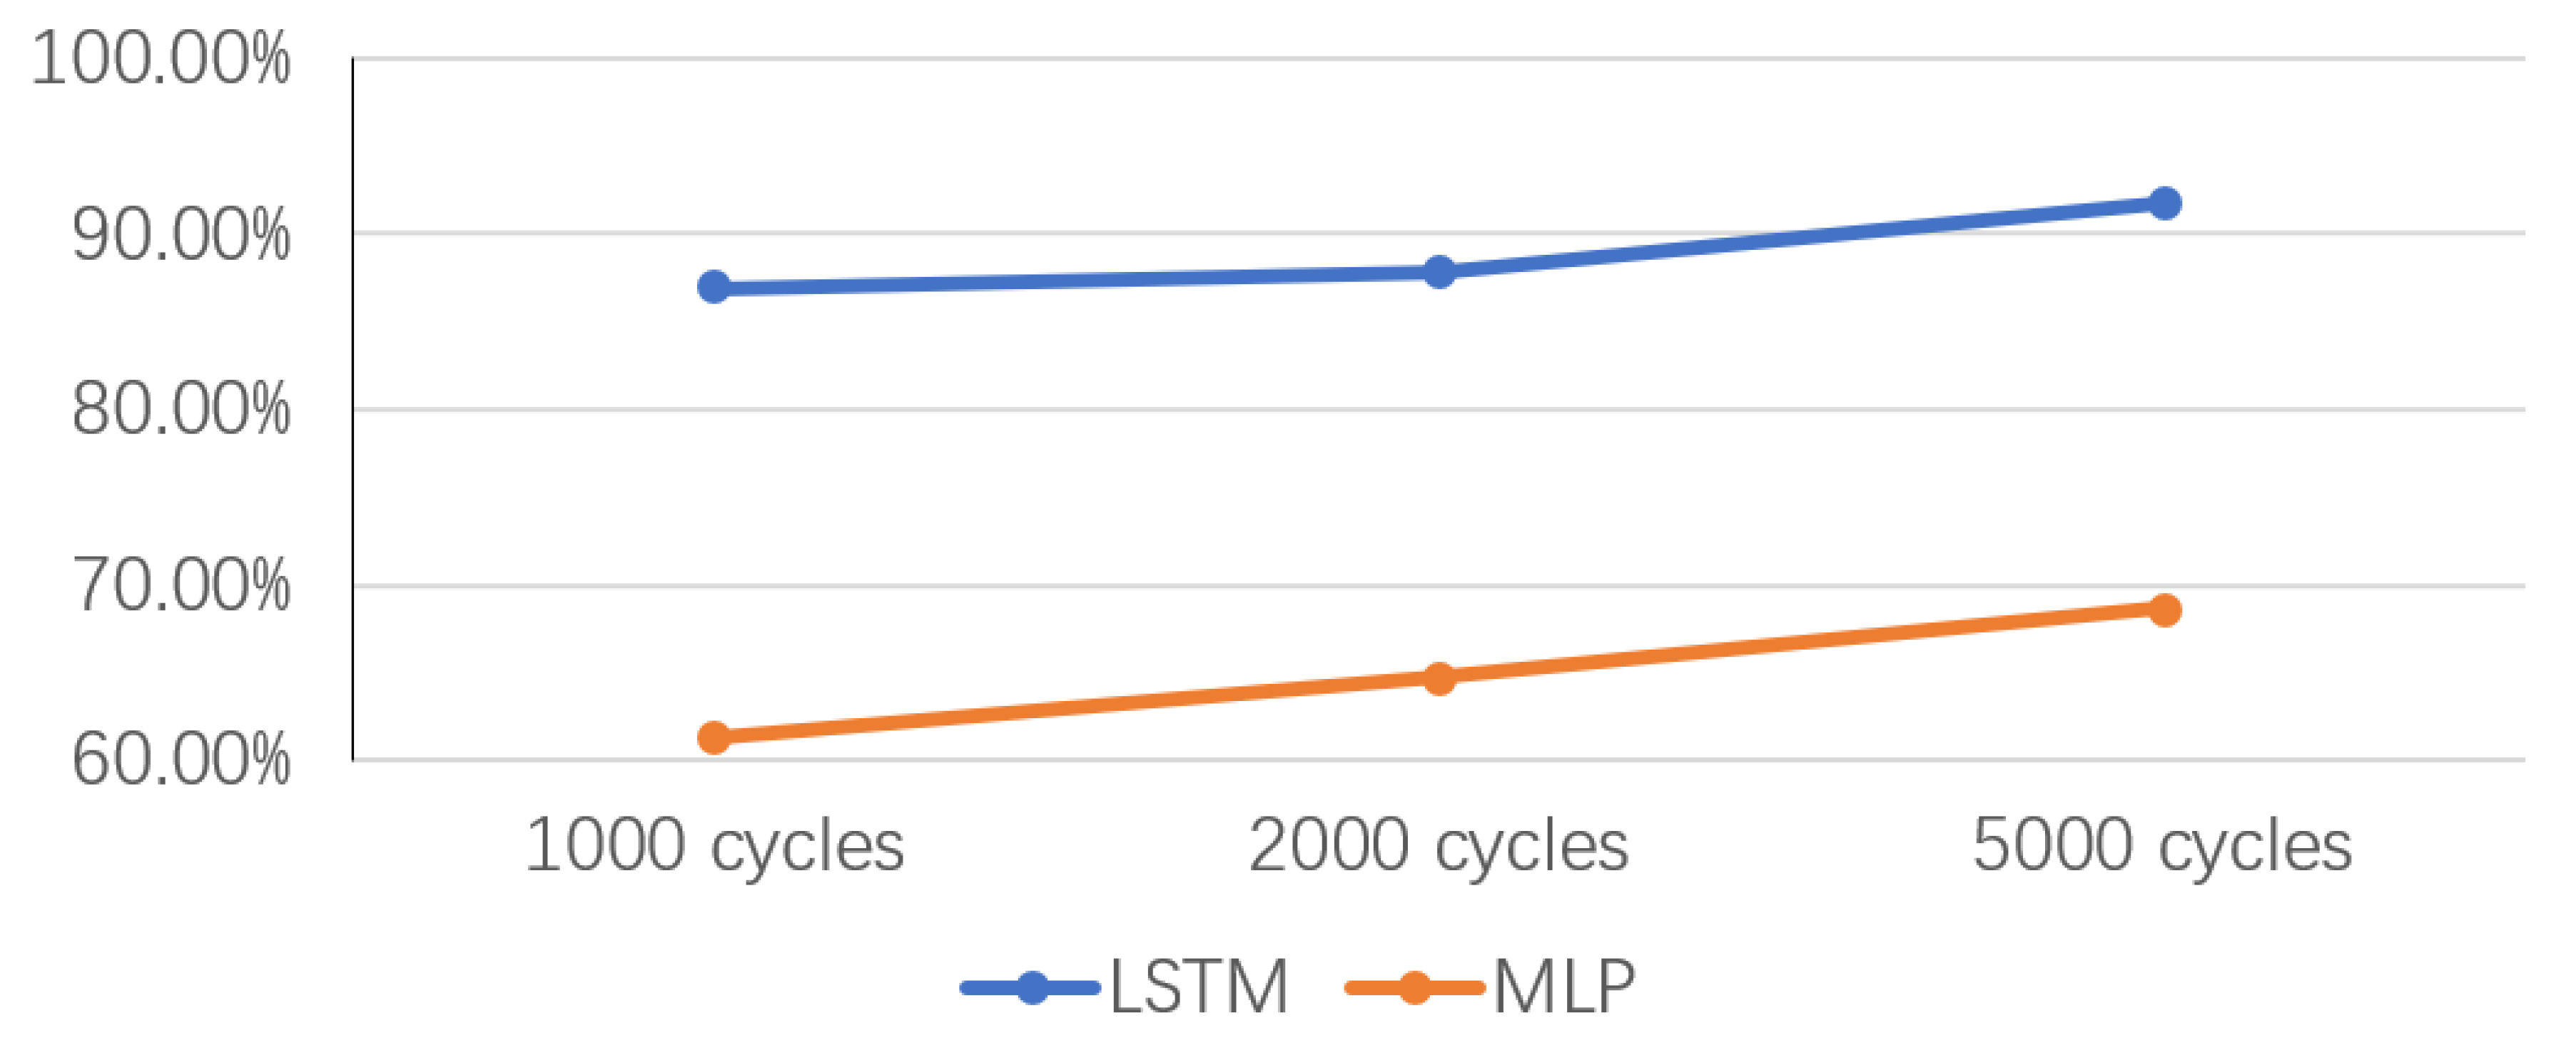
By calculating the algorithm results, the prediction accuracy of the algorithm is 0.869, 0.878, and 0.918, respectively. These results indicate that the system design conforms to the real performance and situation. Furthermore, as the number of iterations increases, the prediction accuracy gradually increases. At the same time, LSTM is a variant of traditional RNNs, which can effectively capture the semantic association between long sequences and alleviate the phenomenon of gradient disappearance or explosion compared with classic RNNs. In addition, the method is controlled by the gate structure, including the forget gate, input gate, cell state, and output gate, and its function is equivalent to adding a “processor” to judge whether the information is useful. It is also worth noting that the LSTM can better handle time series tasks and has better accuracy than a multi-layer perceptron (MLP: an artificial neural network that tends to structure). As shown in
Figure 9, the LSTM has a better performance advantage than the MLP when the number of cycles is the same.


