Article

The Application of Laser-Scanning 3D Model Reconstruction Technology for Visualizing a Decommissioning Model of the Heavy Water Research Reactor

China Institute of Atomic Energy, Beijing 102413, China
*
Authors to whom correspondence should be addressed.
Appl. Sci. 2024, 14(8), 3135; https://doi.org/10.3390/app14083135
Submission received: 25 February 2024 / Revised: 21 March 2024 / Accepted: 1 April 2024 / Published: 9 April 2024

Abstract

:
Currently, over 100 nuclear power units globally have been in operation for more than 40 years. Hindered by the limitations of computer technology at the time, these nuclear facilities lack detailed electronic drawings. Activities such as equipment replacement and process circuit system modifications during operation result in discrepancies between paper drawings and actual conditions. Given the complexity and irreversibility of nuclear facility decommissioning activities, virtual simulation technology is often employed before the decommissioning process begins to assist in designing and validating decommissioning plans. Consequently, the creation of high-precision 3D models is crucial for subsequent decommissioning designs. Through innovatively utilizing laser-scanning 3D model reconstruction technology in the reconstruction of the model of China’s first heavy water research reactor undergoing decommissioning, this paper provides an overview of the process of laser-scanning 3D model reconstruction and its application in reconstructing the heavy water research reactor model. Using a 3D laser scanner, four decommissioning areas of the heavy water research reactor, including the reactor building, secondary water pump room, ventilation center, and low-level radioactive wastewater storage tank area, were subjected to 3D laser scanning. The acquired point cloud data from 572 scanning stations were processed using point cloud processing software for denoising, stitching, and triangulation. The triangulated model was then imported into modeling software for 3D reconstruction, ultimately establishing a digitalized model of the heavy water research reactor suitable for subsequent decommissioning simulation and design.

1. Introduction

As of July 2022, there are currently 194 nuclear power units globally in the decommissioning process or awaiting it, with projections indicating that the global nuclear decommissioning market will continue to expand in the upcoming decade [1,2]. Notably, at least 105 nuclear power units worldwide have been operational for over 40 years. Due to immature developments in computer technology at the time, these reactors lack detailed electronic drawings, and even comprehensive paper drawings are challenging to preserve. Furthermore, over the decades of their operation, activities such as equipment replacements, plant expansions, and process circuits modifications have inevitably led to discrepancies between the paper drawings of nuclear facilities and the actual conditions [3].
For the final phase of a nuclear facility’s lifecycle, the decommissioning process, an accurate assessment of the decommissioning site is crucial, especially considering the complexity of underground process circuit systems and the industrial and radiation risks involved [4]. Given the irreversibility, safety, and economic considerations of the decommissioning process, virtual simulation technology, empowered by the advancements in computer technology, serves as a robust auxiliary tool for nuclear facility decommissioning. It provides a supportive platform for tasks such as assisting in decommissioning plan designs, validating and confirming implementation plans, process planning and optimization, as well as personnel training [5,6,7]. Given the pivotal role that virtual simulation technology plays in the process of decommissioning nuclear facilities, the acquisition of highly accurate 3D reactor models becomes the primary task for simulating the decommissioning of nuclear facilities [8,9].
The heavy water research reactor (HWRR) is the first reactor of its kind in China; it has a tank-type structure with heavy water as the moderator and coolant and graphite as the reflector layer, and the original design power is 7 MW. It achieved criticality for the first time in 1958 and operated at full power in the same year. The HWRR was upgraded to a rated power of 10 MW and an enhanced power of 15 MW after a major overhaul and modification in 1980. In December 2007, the HWRR was permanently shut down and entered a phase of secure closure. By the end of 2019, the HWRR had officially commenced its decommissioning process after a successful operational span of approximately 50 years, during which it released a total cumulative energy of 50,500 MW·d [10,11]. The early reactor construction date and the complexity of its process system equipment and pipelines, as well as the major modifications and reconstruction conducted during the operational lifespan of the HWRR, have resulted in the preservation of incomplete paper drawings, with no digitized drawings available. Furthermore, the absence of detailed digitized drawings or 3D models has presented challenges to decommissioning the HWRR, necessitating the adoption of innovative technologies for the acquisition of its 3D model [12]. Presently, laser-scanning 3D model reconstruction technology has achieved maturity in applications within the digital preservation of cultural heritage [13,14,15], building deformation monitoring [16,17], surveying and mapping engineering [18,19], and related domains. However, in the field of reconstructing decommissioning models for nuclear facilities, there are relatively few applications that deal with the design and integration of scanning platforms and the optimization of point cloud data processing methods, and detailed practical applications in nuclear facility decommissioning projects are lacking [20,21,22,23].
This study utilizes 3D laser-scanning technology for non-contact measurements in radioactive environments, acquiring a significant amount of point cloud data, which subsequently undergo denoising and registration processes. Upon validating the accuracy of the scanning equipment and the precision of point cloud registration, the point cloud model can be exported to 3D modeling software, which facilitates the efficient modeling of the decommissioning area of the HWRR.

2. A Brief Introduction to Laser-Scanning 3D Model Reconstruction Technology

The process of reconstructing a 3D model of an object into a mathematical model that can be suitable for computer processing is commonly known as 3D reconstruction. Currently, two primary approaches exist for acquiring 3D models of objects. The first method entails the direct generation of a 3D model using specialized 3D modeling software [24]. The second method involves the acquisition of 3D information about the object’s surface through dedicated equipment, followed by the reconstruction of the object’s 3D model [25]. While the first method is well established, its application to nuclear facilities, characterized by complex systems and numerous pieces of equipment, presents significant challenges and demands substantial labor. Moreover, utilizing outdated paper drawings for modeling may exhibit certain deviations between the created models and the actual objects. In the second method, laser-scanning 3D model reconstruction technology is the prevailing technique, which entails utilizing a laser scanner to capture surface data of the object, encompassing spatial coordinates, reflection intensity, and color information. The precise point cloud data acquired through this method prove instrumental in 3D modeling. The comparisons of laser-scanning 3D model reconstruction and 3D software modeling technology are shown in Table 1.
The above table compares the traditional 3D software modeling technology with laser-scanning 3D model reconstruction technology, and the results show that the laser-scanning 3D model reconstruction technology requires relatively high economic costs and skilled manpower, but it spares us the time cost of acquiring the HWRR plant model, improving the accuracy of the model. From a long-term perspective, this provides us with the equipment base and human resources to subsequently undertake other nuclear facility model reconstruction projects.
In addition, the drawings retained during the construction of the nuclear facilities in the 1960s were incomplete, and the overhaul and replacement of equipment during their operation caused changes in the paper drawings, and the parts involved in the entire nuclear facility amounted to at least tens of thousands, so it is difficult to complete the model construction of the huge nuclear facility project by relying on the traditional modeling method alone. The use of laser-scanning 3D model reconstruction technology is suitable for the construction of complex models, which can effectively establish a complete model and compensate for the shortcomings of traditional modeling methods.
Laser-scanning 3D model reconstruction technology facilitates the precise and comprehensive acquisition of point cloud data for decommissioned nuclear facility components in a non-contact manner, thereby preserving digital assets. The heightened automation in the subsequent stages of the modeling process ensures efficiency. Given the intricate and radioactive nature of decommissioning environments within nuclear facilities, laser-scanning 3D model reconstruction technology assumes a pivotal role as an essential auxiliary method for the reconstruction of decommissioning models. Its benefits include rapid data collection, elevated measurement accuracy, and non-contact capabilities [26]. The subsequent section offers a concise overview of the operational principles of a 3D laser scanner and the process involved in laser-scanning 3D model reconstruction.

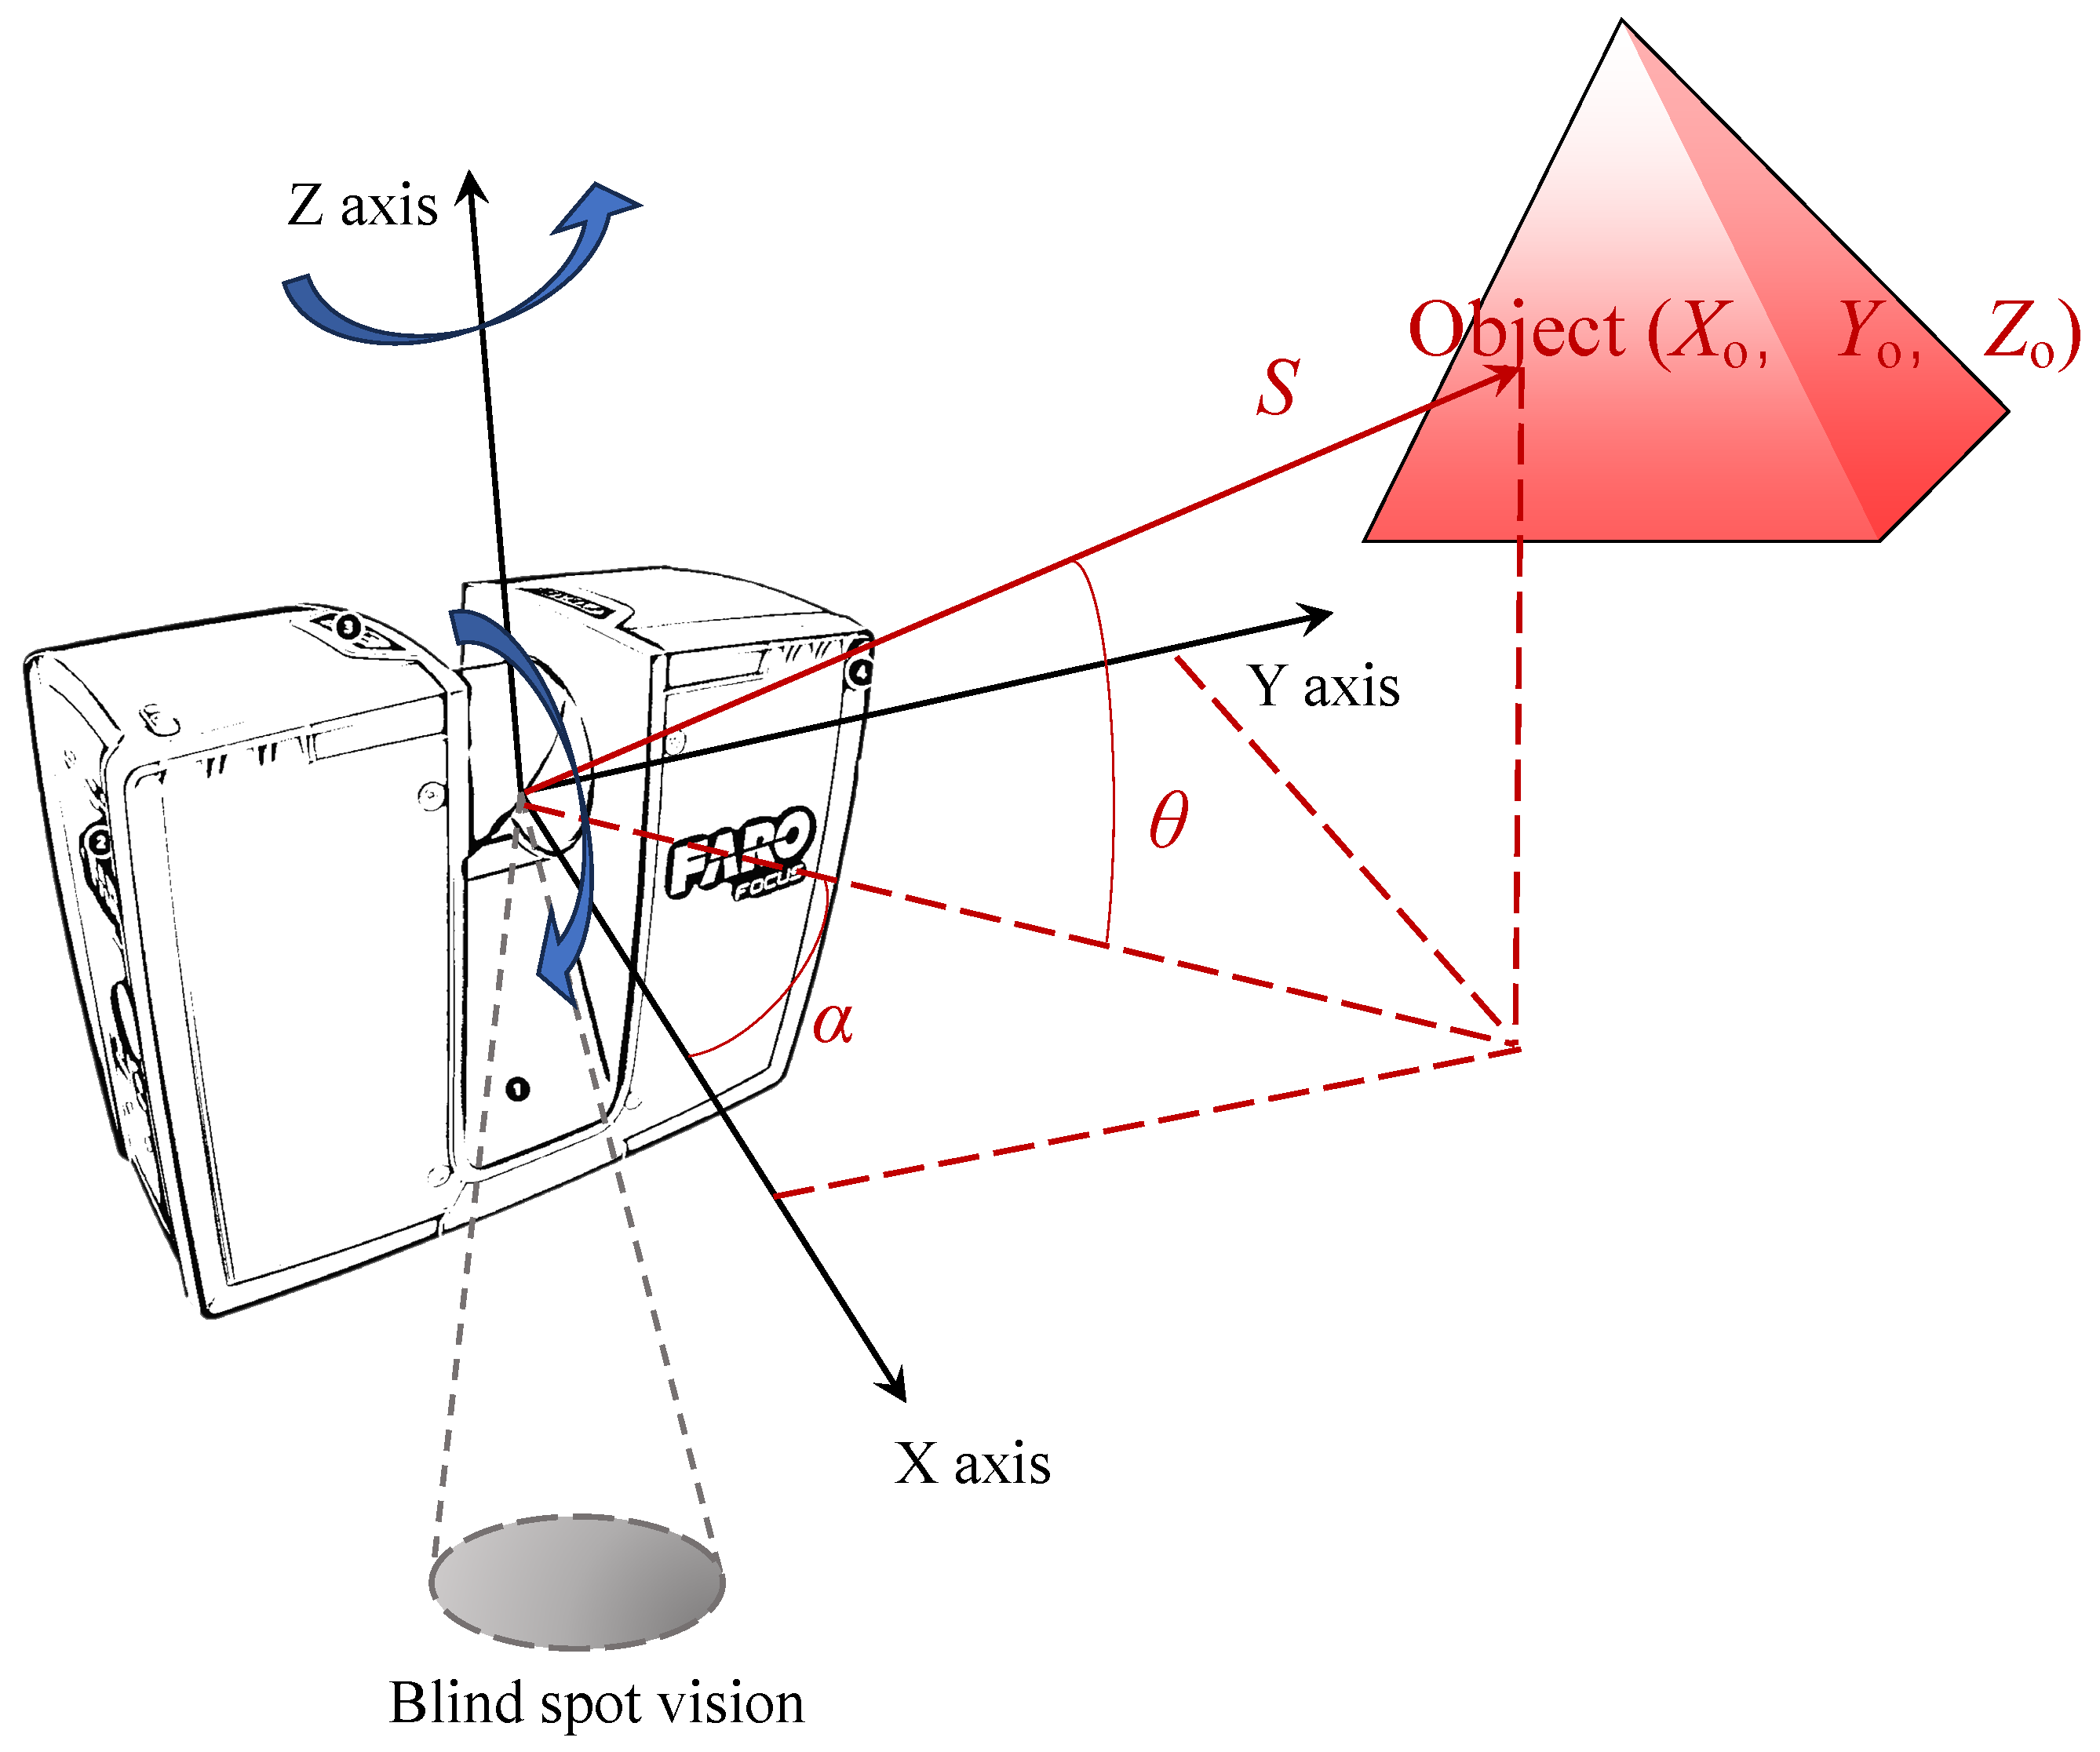
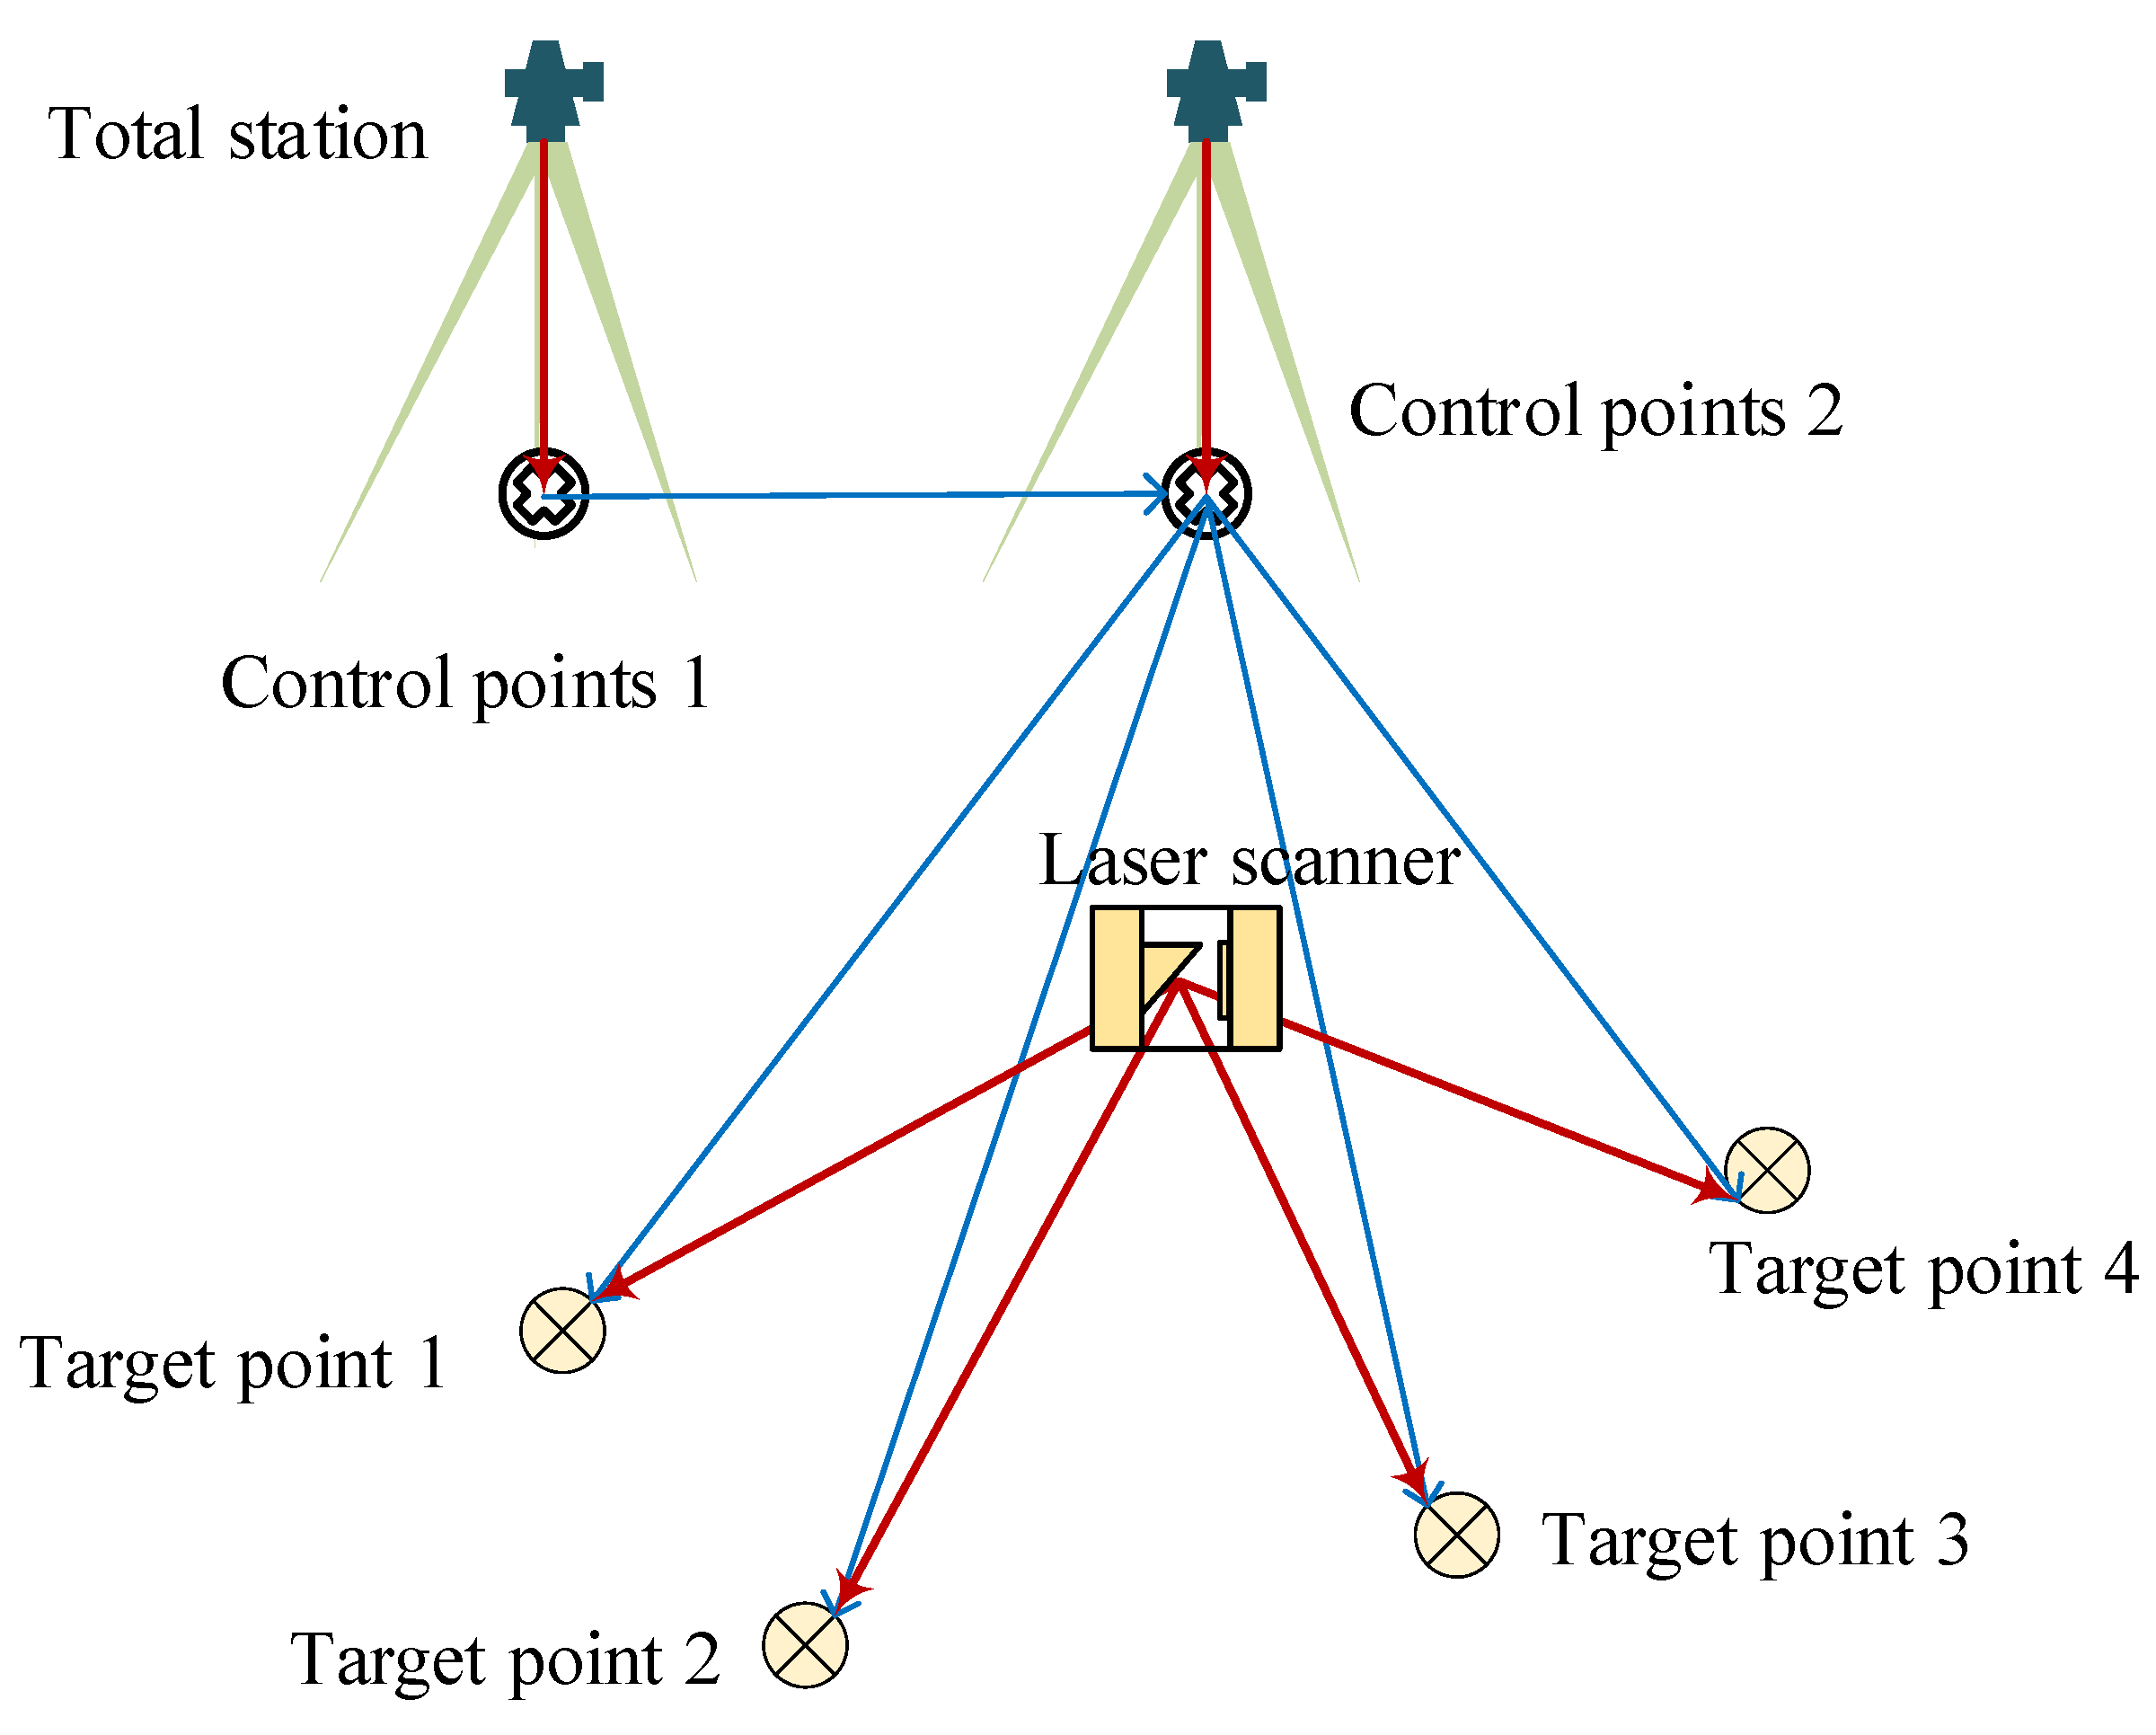
2.1. Principle of 3D Laser-Scanning Technology

The operational principle of 3D laser-scanning technology is depicted in Figure 1. The XY plane signifies the lateral scanning plane of the 3D laser scanner, and the Z-axis is perpendicular to the lateral scanning plane. During the scanning process, the laser emitter and laser receiver located in the middle of the scanner rotate rapidly around the Y-axis to achieve longitudinal scanning. Simultaneously, the entire scanner rotates around the Z-axis to achieve lateral scanning. In theory, the longitudinal scanning angle range and the lateral scanning angle range are both within 0° to 360°. However, due to the presence of the support structure of the 3D laser scanner, there is a conical blind spot region beneath the scanner. In practical situations, the point cloud data in the blind spot region can be supplemented by employing a multi-station scanning approach. Through the observation of the distance measurement value S from the laser scanner’s center point to the target object, the longitudinal scanning angle θ, and the lateral scanning angle α, the 3D coordinates (Xo, Yo, Zo) of the target object’s spatial position can be computed, which result in the acquisition of point cloud data for the target object. The relationship between parameters S, θ, and α is demonstrated in Equation (1). The parameter S is determined by calculating the time difference between the laser emission and reflection (ΔT), multiplied by the speed of laser propagation in air (C). Laser scanners are generally driven by servo motors; the two parameters α and θ can be measured according to the motor rotation angle and are usually recorded with the angle encoder that comes with the scanner.
X o = S × cos θ cos α Y o = S × cos θ sin α Z o = S × sin θ S = C   ×   Δ T 2
The interiors within the HWRR plant exhibit a diverse array of equipment and pipes with varying shapes. These components can be viewed as assemblies of numerous points, and the clarity of the equipment and pipe contours improves with an increased number of captured points. Through 3D scans performed from different positions and perspectives, extensive point cloud data with spatial coordinate information can be acquired. This facilitates the derivation of comprehensive point cloud data that encompass spatial details regarding the shapes and dimensions of internal equipment and pipes within the nuclear facility [27]. To mitigate the prolonged exposure of on-site personnel or unnecessary movements within the nuclear facility, it is imperative to proactively plan the scanning positions and routes of the laser scanner.

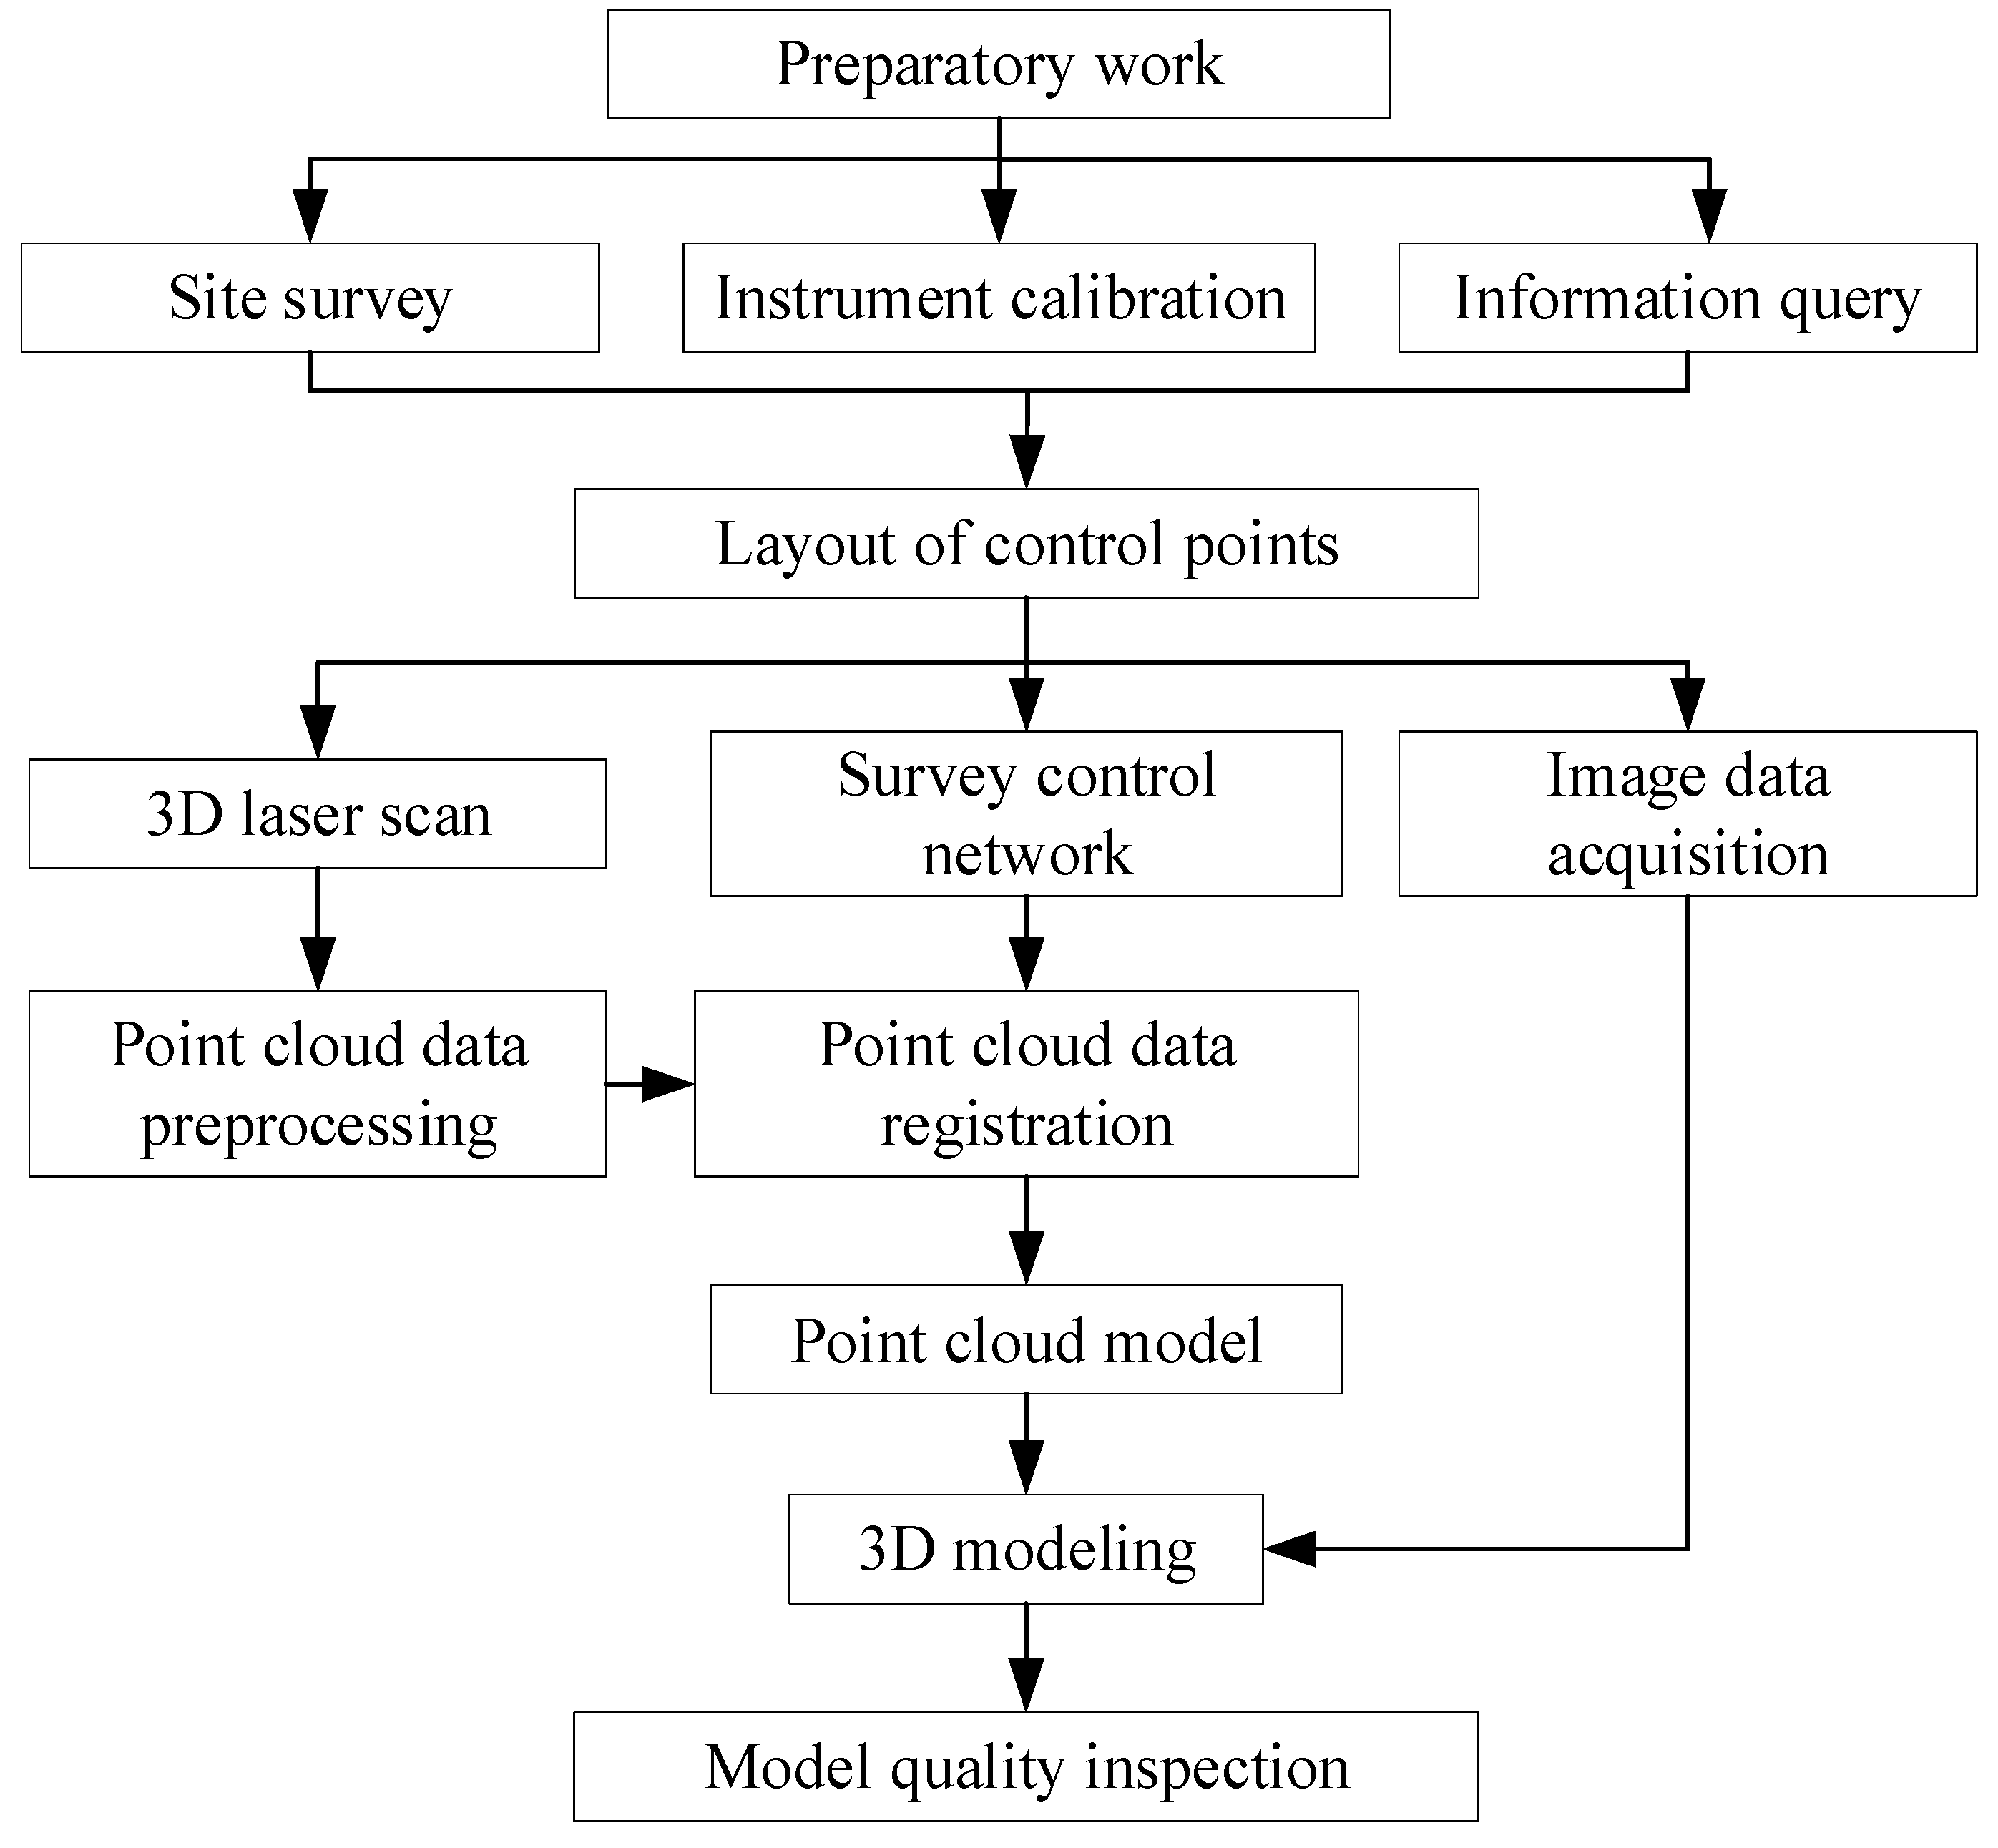
2.2. A Brief Description of the Laser-Scanning 3D Model Reconstruction Process

The process of laser-scanning 3D model reconstruction is intricate and involves numerous details, encompassing on-site preparation, point cloud data acquisition, point cloud data processing, and model reconstruction as four general key aspects, as depicted in Figure 2. On-site preparation involves delineating the area intended for laser scanning and establishing control points through on-site reconnaissance and data reviews, and calibrating and charging the instruments to be utilized. The point cloud data acquisition process includes multiple scans of the nuclear facility buildings and their internals using mobile scanning devices to obtain raw point cloud data. Point cloud data processing entails the use of specialized software to streamline, denoise, and register the point cloud data. Ultimately, the processed point cloud data are imported into 3D modeling software for the model reconstruction.

2.2.1. On-Site Preparation

Before initiating the scanning process, it is crucial to conduct on-site reconnaissance and review relevant documentation to preliminarily plan the positions of scanning stations on the drawings. It is noteworthy that the point cloud data acquired with the 3D laser scanner are based on relative coordinates. This implies that data from different scanning stations exist in distinct coordinate systems, resulting in errors during the merging of point cloud data from adjacent stations. Multiple-station alignments can introduce error propagation and accumulation. To ensure the subsequent alignment of point cloud data in a unified coordinate system and to minimize error accumulation, establishing a control network for coordinate transformation and error control is imperative [28]. Common control networks include the national control network or a locally established regional control network. Due to the extensive control area and the relatively sparse distribution of control points within the national control network, this can potentially result in substantial absolute errors. Consequently, to guarantee the accuracy of the point cloud and minimize subsequent modeling errors, a locally established regional control network is typically employed for precise control of the point clouds. The principle of a locally established regional control network involves using a total station to measure the coordinates of each control point and target point in the coordinate system of the control network. The control points and target points are strategically positioned to form a coordinate control network, effectively managing the overall scanned point cloud coordinates within the scanning area and unifying the coordinate system. A schematic diagram illustrating the principle of the regional control network is presented in Figure 3.
In the establishment of a regional control network, it is crucial to uniformly distribute control points considering the range of the scanning area and on-site conditions. These control points should be positioned at elevated locations, providing a fixed and unobstructed line of sight, and secured using bolted connections. This methodology ensures optimal visibility during measurement tasks and assures stability, with the points remaining securely in place for over five years without detachment. The strategic positioning of control points not only improves point cloud accuracy but also establishes a robust foundation for subsequent tasks, including the supplementation and adjustments of the point cloud data.

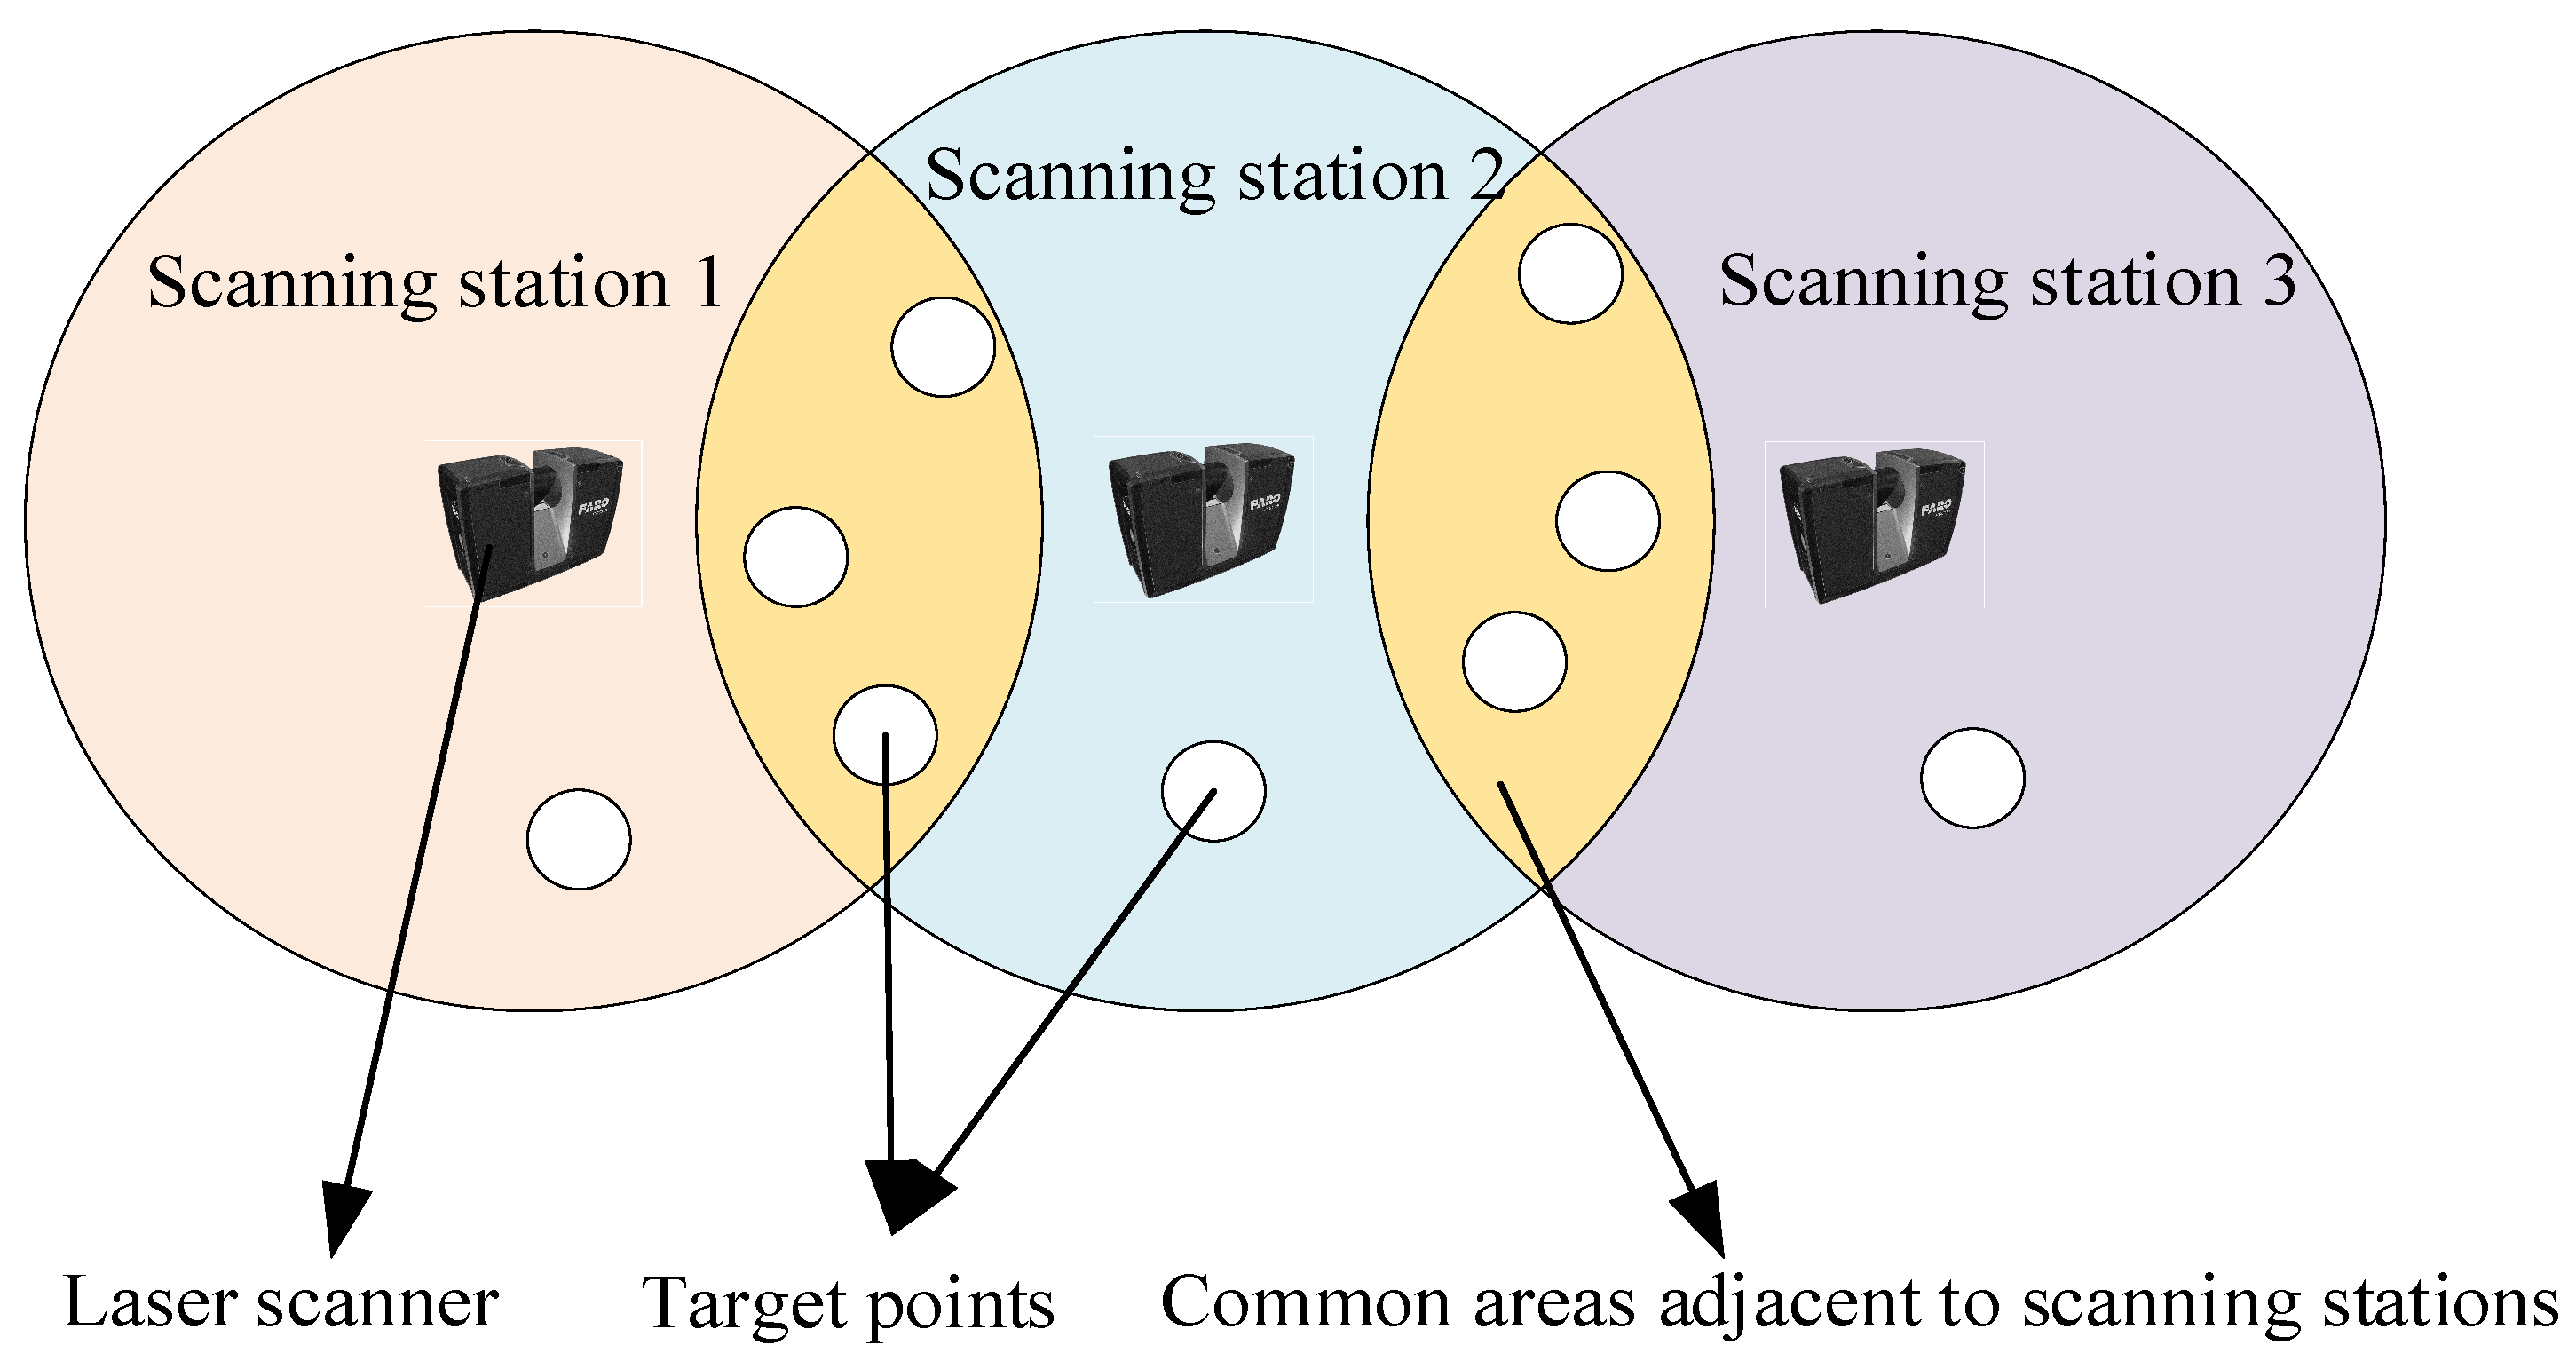
2.2.2. Point Cloud Data Acquisition

After the placement of control points is finalized, the distribution of 3D laser-scanning stations can be strategically planned according to the site conditions, achieving a uniform distribution of scanning stations and target points, as depicted in Figure 4. A 30% overlap between the scanning stations is recommended, and each scanning station should be equipped with a minimum of four target points [29]. Additionally, adjacent scanning stations should share at least three target points with a noticeable height difference. In critical scanning areas, scanning stations are positioned from various angles and locations to guarantee the completeness of the scanning point cloud data. Generally speaking, the greater the distance between the scanner and the object being measured, the lower the scanning accuracy [30,31]. When using a 3D laser scanner to scan a small volume of equipment, pipes, valves, etc., the distance between the scanner and the measured item should be reduced. For large areas such as corridors and open spaces, the scanning distance can be appropriately increased to reduce the workload. When the density of points is increased, the absolute error of points will be reduced and the accuracy will be higher. However, the density of points is not as high as possible, which will increase the workload.
Throughout the 3D laser-scanning process, preserving detailed image data is frequently essential to facilitate subsequent point cloud data processing or the reconstruction of 3D models, which involves capturing on-site photographs of buildings, images of equipment, installation drawings, and as-built drawings of the equipment.

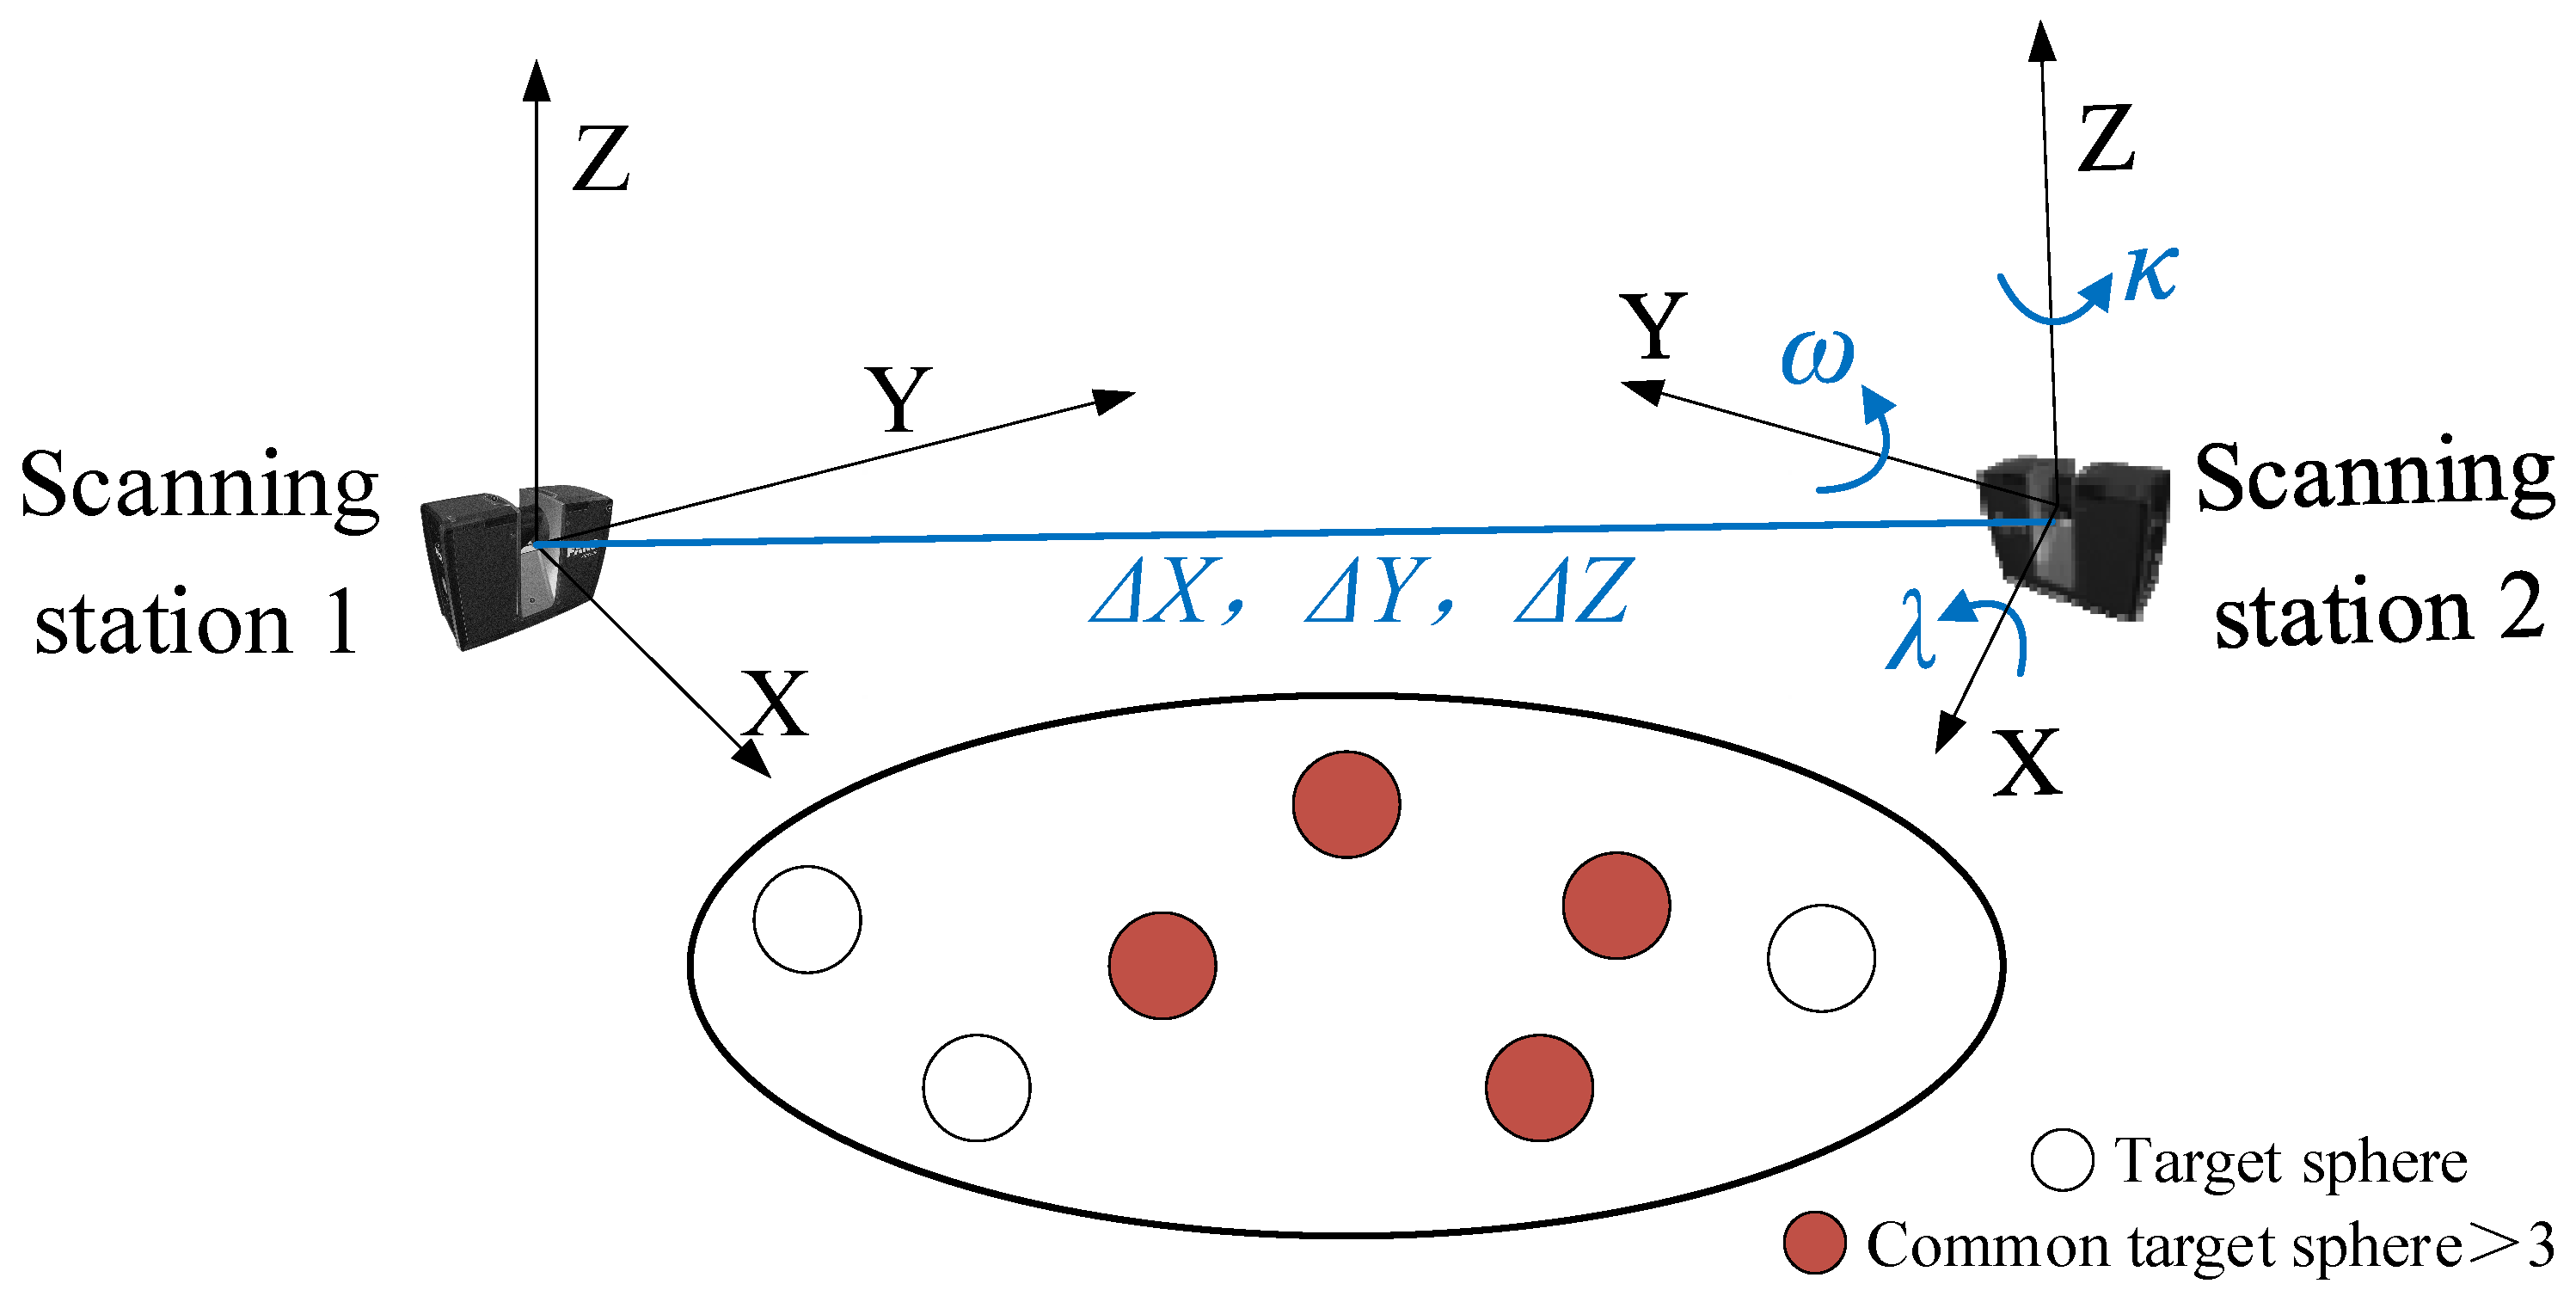
2.2.3. Point Cloud Data Processing

The substantial amount of raw point cloud data acquired from a 3D laser scanner inevitably contains noise, necessitating the denoising of the original point cloud data for nuclear facilities. Furthermore, the substantial amount of raw point cloud data introduces redundant information, resulting in an increased computational burden; therefore, it becomes imperative to simplify this voluminous point cloud data. Following the denoising and simplification processes, the point cloud data from various scan stations can be accurately registered into a unified coordinate system within the comprehensive spatial platform, which is a procedure commonly referred to as point cloud data registration. Most 3D laser scanners from different brands typically come with dedicated point cloud data processing software for data processing and management [32].
Point cloud registration can rely on features points, features surfaces, and targets. To enhance the accuracy and efficiency of point cloud data processing, registration is commonly achieved through the alignment of target spheres [33,34]. The registration process of point cloud data based on target spheres is shown in Figure 5, and the fundamental concept of point cloud registration using target spheres entails positioning three or more target spheres in the overlapping area of two scan stations during scanning, and matching the coordinates of the corresponding target spheres subsequently. The coordinate transformation relationship for two corresponding target spheres is represented by Equation (2). When the rotation matrix R (λ, ω, κ) and translation matrix TX, ΔY, ΔZ) are calculated, this enables coordinate transformation and achieves the registration of point clouds obtained from adjacent scan stations [17].
X Y Z = R x y z + T
where (X, Y, Z) and (x, y, z) denote the coordinates of corresponding target spheres in two coordinate systems.
The point cloud registration process typically begins with the initial step of conducting local registration of the point cloud data, which facilitates easy verification, adjustment, and modification until the accuracy requirements are satisfied. Subsequently, after completing local point cloud registration, it becomes possible to directly perform overall point cloud registration across numerous localized regions, thereby obtaining a comprehensive dataset of the nuclear facility point cloud.

2.2.4. Model Reconstruction

The purpose of utilizing point cloud data for 3D model reconstruction is to restore the organizational structure and 3D model of the original object from unorganized point cloud data. However, the extensive amount of point cloud data, serving as foundational information, cannot be directly employed for 3D reconstruction applications; consequently, further processing of the point cloud data is necessary. The most prevalent method for model reconstruction involves creating numerous triangles based on the topological relationships within the point cloud data, resulting in a triangular mesh model [35]. This triangular mesh model can be directly imported into industrial design software, allowing for topological modeling based on the triangular mesh data. Subsequently, tasks such as design, simulation, and demonstration can be conducted according to specific professional requirements.

3. Application in the Reconstruction of the HWRR Decommissioning Model

3.1. Main Technical Parameters

Due to the direct impact of point cloud data accuracy on the subsequent quality of 3D model reconstruction, ensuring the precision of laser-scanning data is crucial for achieving high-precision reconstruction of nuclear facilities. Taking various factors into account, including the decommissioning simulation requirements, the workload associated with scanning the HWRR decommissioning area, computer hardware capabilities, the model retrieval speed, and point cloud data management, laser scanning over a large spatial range was selected for the HWRR decommissioning area. To expedite the process, it is imperative to enhance the efficiency of data acquisition, thereby reducing the scanning time. The obtained raw point cloud data, serving as valuable and reusable digital assets, should encompass color information on the surfaces of buildings and equipment within the HWRR decommissioning area. In summary, considering the specific requirements for acquiring point cloud data in a nuclear facility, the following technical parameters for laser scanning are specified: the 3D laser-scanning range covers the entire decommissioning area, approximately 140 m × 90 m × 40 m; the single-station point cloud data acquisition error is less than 0.5 mm; and the point cloud data should include color information, with an efficiency of no less than 200,000 points per second.
After acquiring the point cloud data, the data can be processed to generate a 3D model of the HWRR. Due to limited system resources and to ensure smooth platform operation without extensive computations, low-precision modeling is applied to the buildings, various floor corridors, offices, doors, windows, and ground within the HWRR decommissioning area. The reconstruction error for feature surfaces is maintained below 5 mm. For internal equipment within buildings, high-precision modeling is utilized, with a reconstruction error for feature surfaces below 2 mm. The reconstructed 3D model is compatible with simulation software such as ANSYS (https://www.ansys.com/zh-cn (accessed on 24 February 2024) and DELMIA (https://www.3ds.com/zh-hans/products/delmia (accessed on 24 February 2024)). To maximize resource utilization, temporary and movable equipment is generally not required to undergo modeling.

3.2. Equipment and Main Parameters

The key equipment and parameters required for modeling the HWRR using laser-scanning 3D reconstruction techniques are shown in Table 2.
In addition to the key equipment listed in Table 2, we used 3D modeling software and point cloud management software.

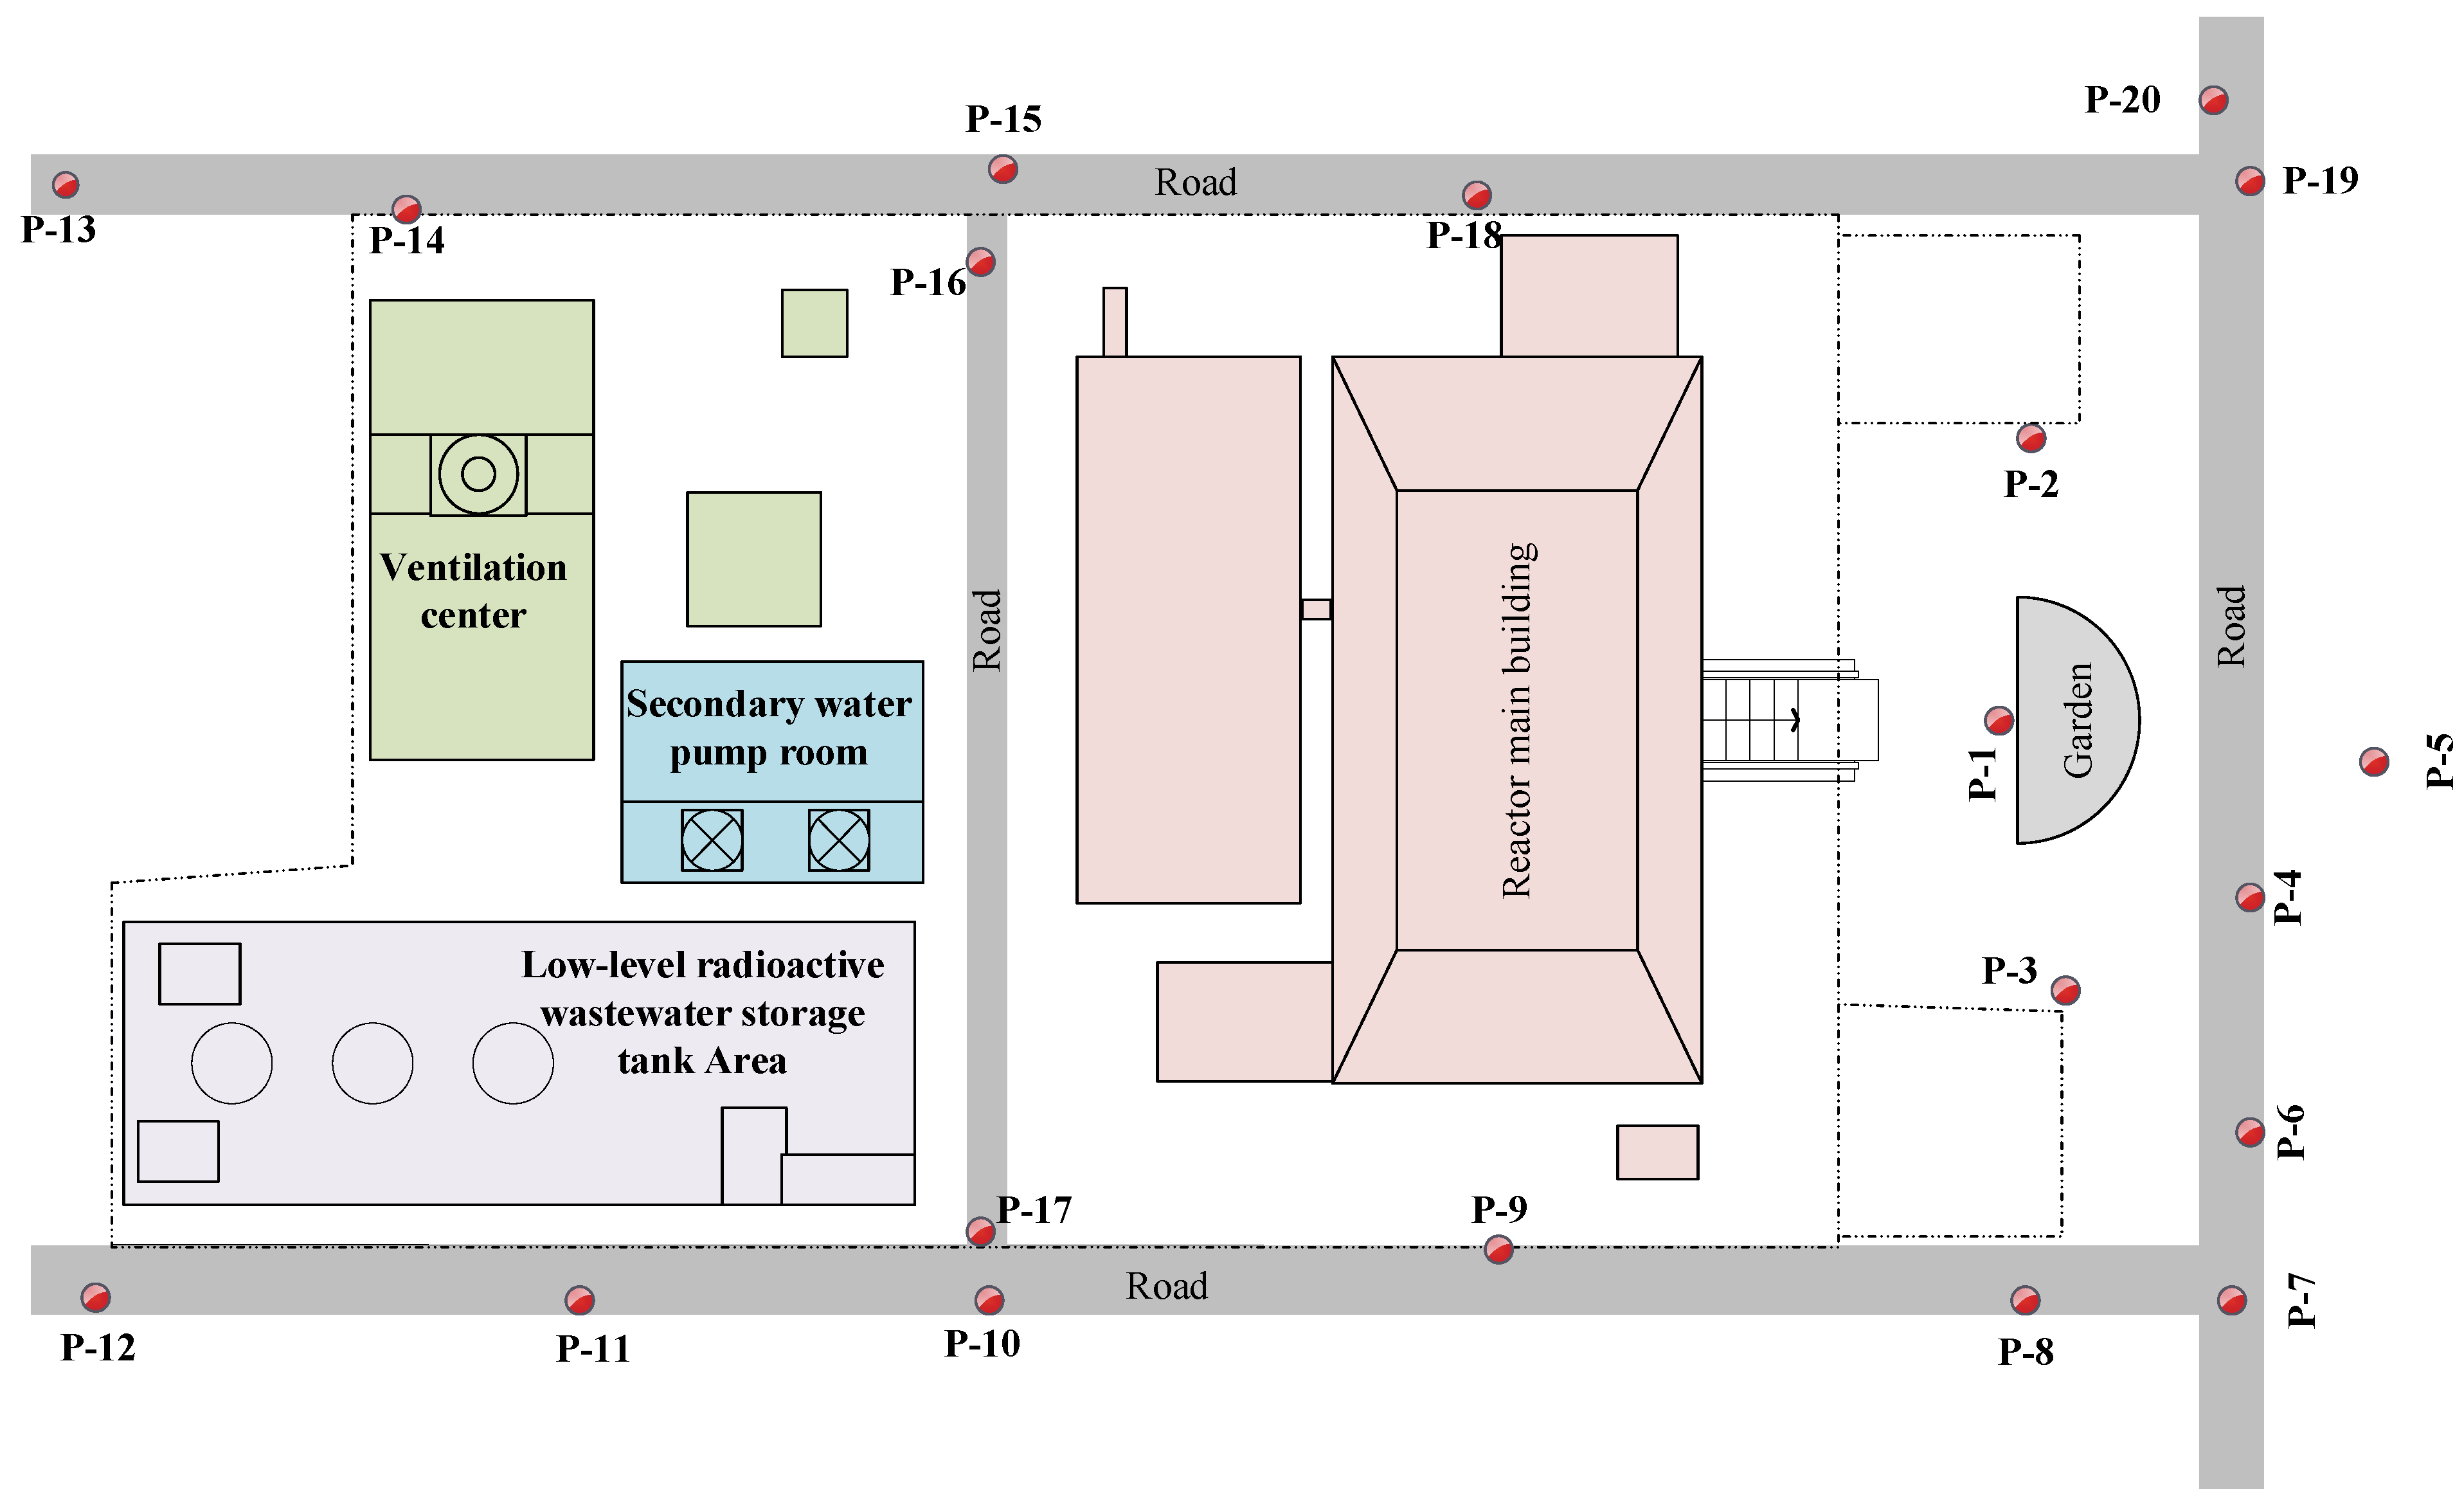
3.3. On-Site Preparation for the HWRR Decommissioning Area

The total area of the HWRR decommissioning area is approximately 13,550 m2, with a total building area of around 11,562 m2. Given the large size of the HWRR decommissioning area, and following on-site reconnaissance and data reviews, the entire plant area is categorized into four regions: the reactor main building, the secondary water pump room, the ventilation center, and the low-level radioactive wastewater storage tank area. The building areas for each region are detailed in Table 3. It is crucial to highlight that the current scope of work does not encompass the acquisition of point cloud data for internals within the HWRR core, which are scheduled to be dismantled in 2025. Currently, the reactor core is closed, and due to the high radiation dose, compact structure, and the fixation of certain internals inside the reactor core, conducting 3D laser scanning of the reactor’s internals is not feasible at this stage. CAD modeling has been performed based on detailed drawings of the HWRR core. To update the existing CAD model, there is a consideration to conduct 3D laser scanning of the internals during the subsequent dismantling process of the reactor core.
According to the high accuracy requirements for the input HWRR decommissioning model in the later decommissioning simulation process, it is necessary to divide the entire HWRR plant into four independent yet interconnected regions through controlled measurements. For the reactor main building, which consists of a multi-story structure with four aboveground floors and two underground floors, it is essential to partition the space on each floor into different units. Additionally, each floor space is further divided into numerous rooms serving different purposes: for example, the basement floor of the HWRR main building has more than 50 process rooms. To ensure modeling accuracy and completeness, it is required to further subdivide the process rooms on each floor space into different groups.
To accomplish coordinate transformation of the point cloud data for each decommissioning region, unit, and group within the HWRR, and to enhance the accuracy of the point cloud data stitching, it is crucial to deploy control points based on the field situation, establishing a regional coordinate control network in the HWRR plant. To ensure the control points are not oxidized over an extended period and exhibit excellent resistance to acid and alkali corrosion, the control points in the HWRR decommissioning area are fabricated using electro-galvanized cast iron and undergo surface heat treatment. A total of 20 control points are strategically placed within the HWRR plant, and a coordinate control network is established using the Leica TCRP 1201 high-precision total station (as indicated by the red spheres in Figure 6). These 20 control points can function as permanent monitoring points, providing a robust foundation for subsequent data supplementation, adjustments, and related tasks.

3.4. Point Cloud Data Acquisition for the HWRR Decommissioning Area

According to the point cloud accuracy and model precision requirements of the HWRR, we have opted for the widely used large-space laser-scanning device, the FARO Laser Scanner FocusS 350, for acquiring point cloud data in the HWRR plant. This device has a maximum scanning speed of 976,000 pts/s, a measurement range of 0.6 m to 350 m, and a longitudinal scanning angle θ ranging from 0 to 300 degrees, coupled with a lateral scanning angle α ranging from 0 to 360 degrees. Throughout the 3D laser-scanning process, a white target sphere with a diameter of 145 mm serves as the registration basis for data from two adjacent scanning stations, with a minimum of four staggered white target spheres placed around each scanning station.
Given the complexity and specificity of the HWRR decommissioning area, particularly the large number of process rooms on the basement floor of the main building area and the confined spaces with numerous components such as equipment, pipes, and valves, the scanning task is challenging. Nevertheless, to ensure the integrity and accuracy of information, meticulous scanning of each decommissioning region is imperative, ensuring that the designated scanning stations are rational and effective. Initially, a reconnaissance is conducted on the scanning units in each HWRR region, determining the placement points for the scanner and the deployment points for the target spheres. The objective is to achieve maximum coverage with the minimum number of scanning stations, thereby reducing the number of point cloud stitching operations. While maintaining the point cloud acquisition rate, the effective point cloud overlap between adjacent scanning stations should not be less than 30%, and in challenging areas, it should not be less than 15%. After on-site installation of the FARO Laser Scanner FocusS 350, multiple target spheres are securely fixed in suitable positions within the scanning area. Considering the particularity of nuclear facilities, the target spheres are preferably positioned on the main structural elements of the buildings rather than on equipment or pipes within the buildings. Additionally, target spheres should be strategically placed to avoid obstructing critical scanning areas. The HWRR plant is then systematically scanned station by station, and the scanning approach is dynamically adjusted based on factors such as physical characteristics and on-site conditions. For instance, in areas with large equipment or compact spaces, additional stations are established to capture comprehensive point cloud data, thereby minimizing errors. Following the station-by-station and region-by-region scanning of each building and equipment in the HWRR plant, an on-site confirmation of the scanning results is conducted. If there are missing or abnormal point cloud data, supplementary scans are promptly carried out on-site. If the scanned point cloud data are complete and meet the requirements, they are promptly saved and imported into the corresponding point cloud processing software for subsequent data processing.
When scanning the HWRR plant, the scanning resolution for the FARO Laser Scanner FocusS 350 was set to 1/4 in most scenes, and the scan quality was set to 3×. The operation of the FARO Laser Scanner FocusS 350 combines the principles of laser measurement and photogrammetry; therefore, the obtained point cloud data include three-dimensional coordinates (XYZ), laser reflection intensity (I), and color information (RGB). We aimed to use a positive viewing angle as much as possible to acquire point cloud data within the HWRR plant. A single-station scan took approximately 6.5 min, and approximately 30 scanning stations could be completed within a working day. In the 3D laser-scanning work within the HWRR plant, a total of 1186 white target spheres were employed as auxiliary controls, taking 28 working days to complete the 3D laser scanning for 572 stations. Throughout the laser-scanning process in the HWRR plant, approximately 14.3 billion points of point cloud data were acquired, resulting in a total raw point cloud data size of 97.6 GB.
Due to the irreversibility of decommissioning, to preserve valuable digital images of the nuclear facility before decommissioning and provide auxiliary data for subsequent point cloud processing, we simultaneously used a camera for on-site photo collection during the 3D laser scanning of the HWRR plant. During the shooting process, efforts were made to maintain a horizontal orientation to capture frontal images. We took a certain number of overall and detailed photos of buildings, equipment, and pipes within each decommissioning region from different directions. The overlap between adjacent pairs of images should not be less than 30%. A total of 34 GB of image photos were collected, comprising a total of 2537 high-definition photos.

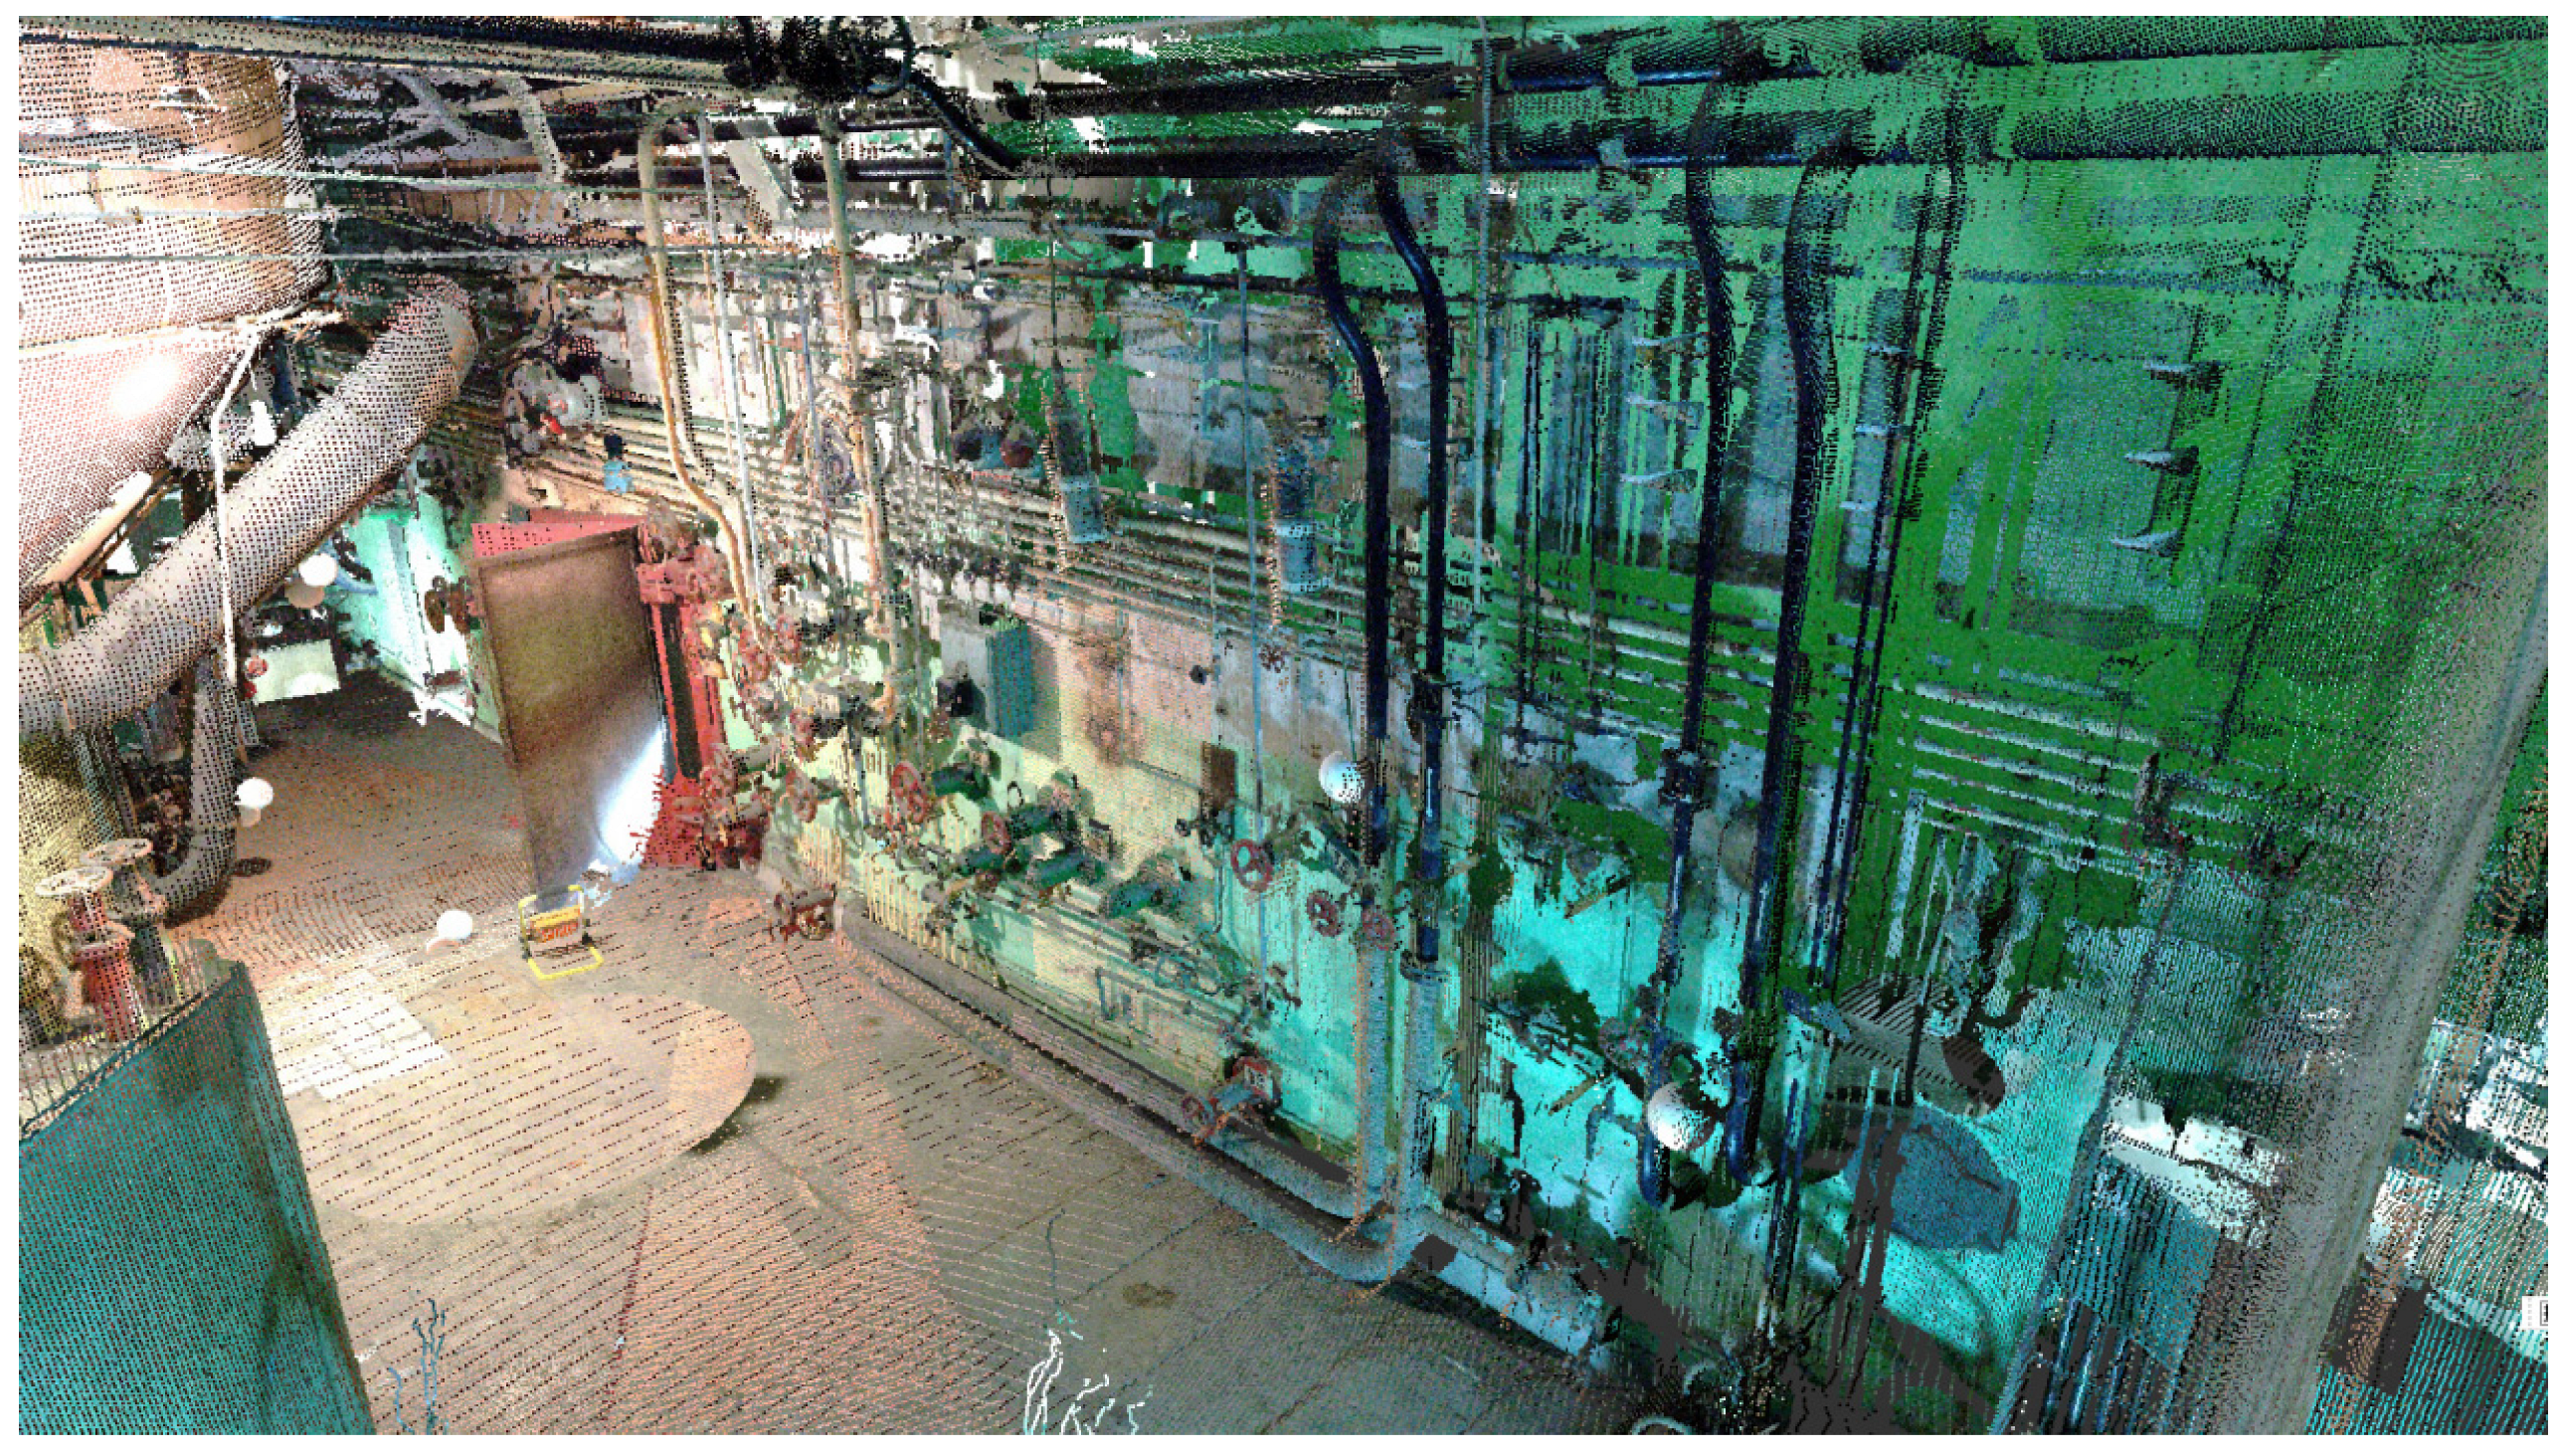
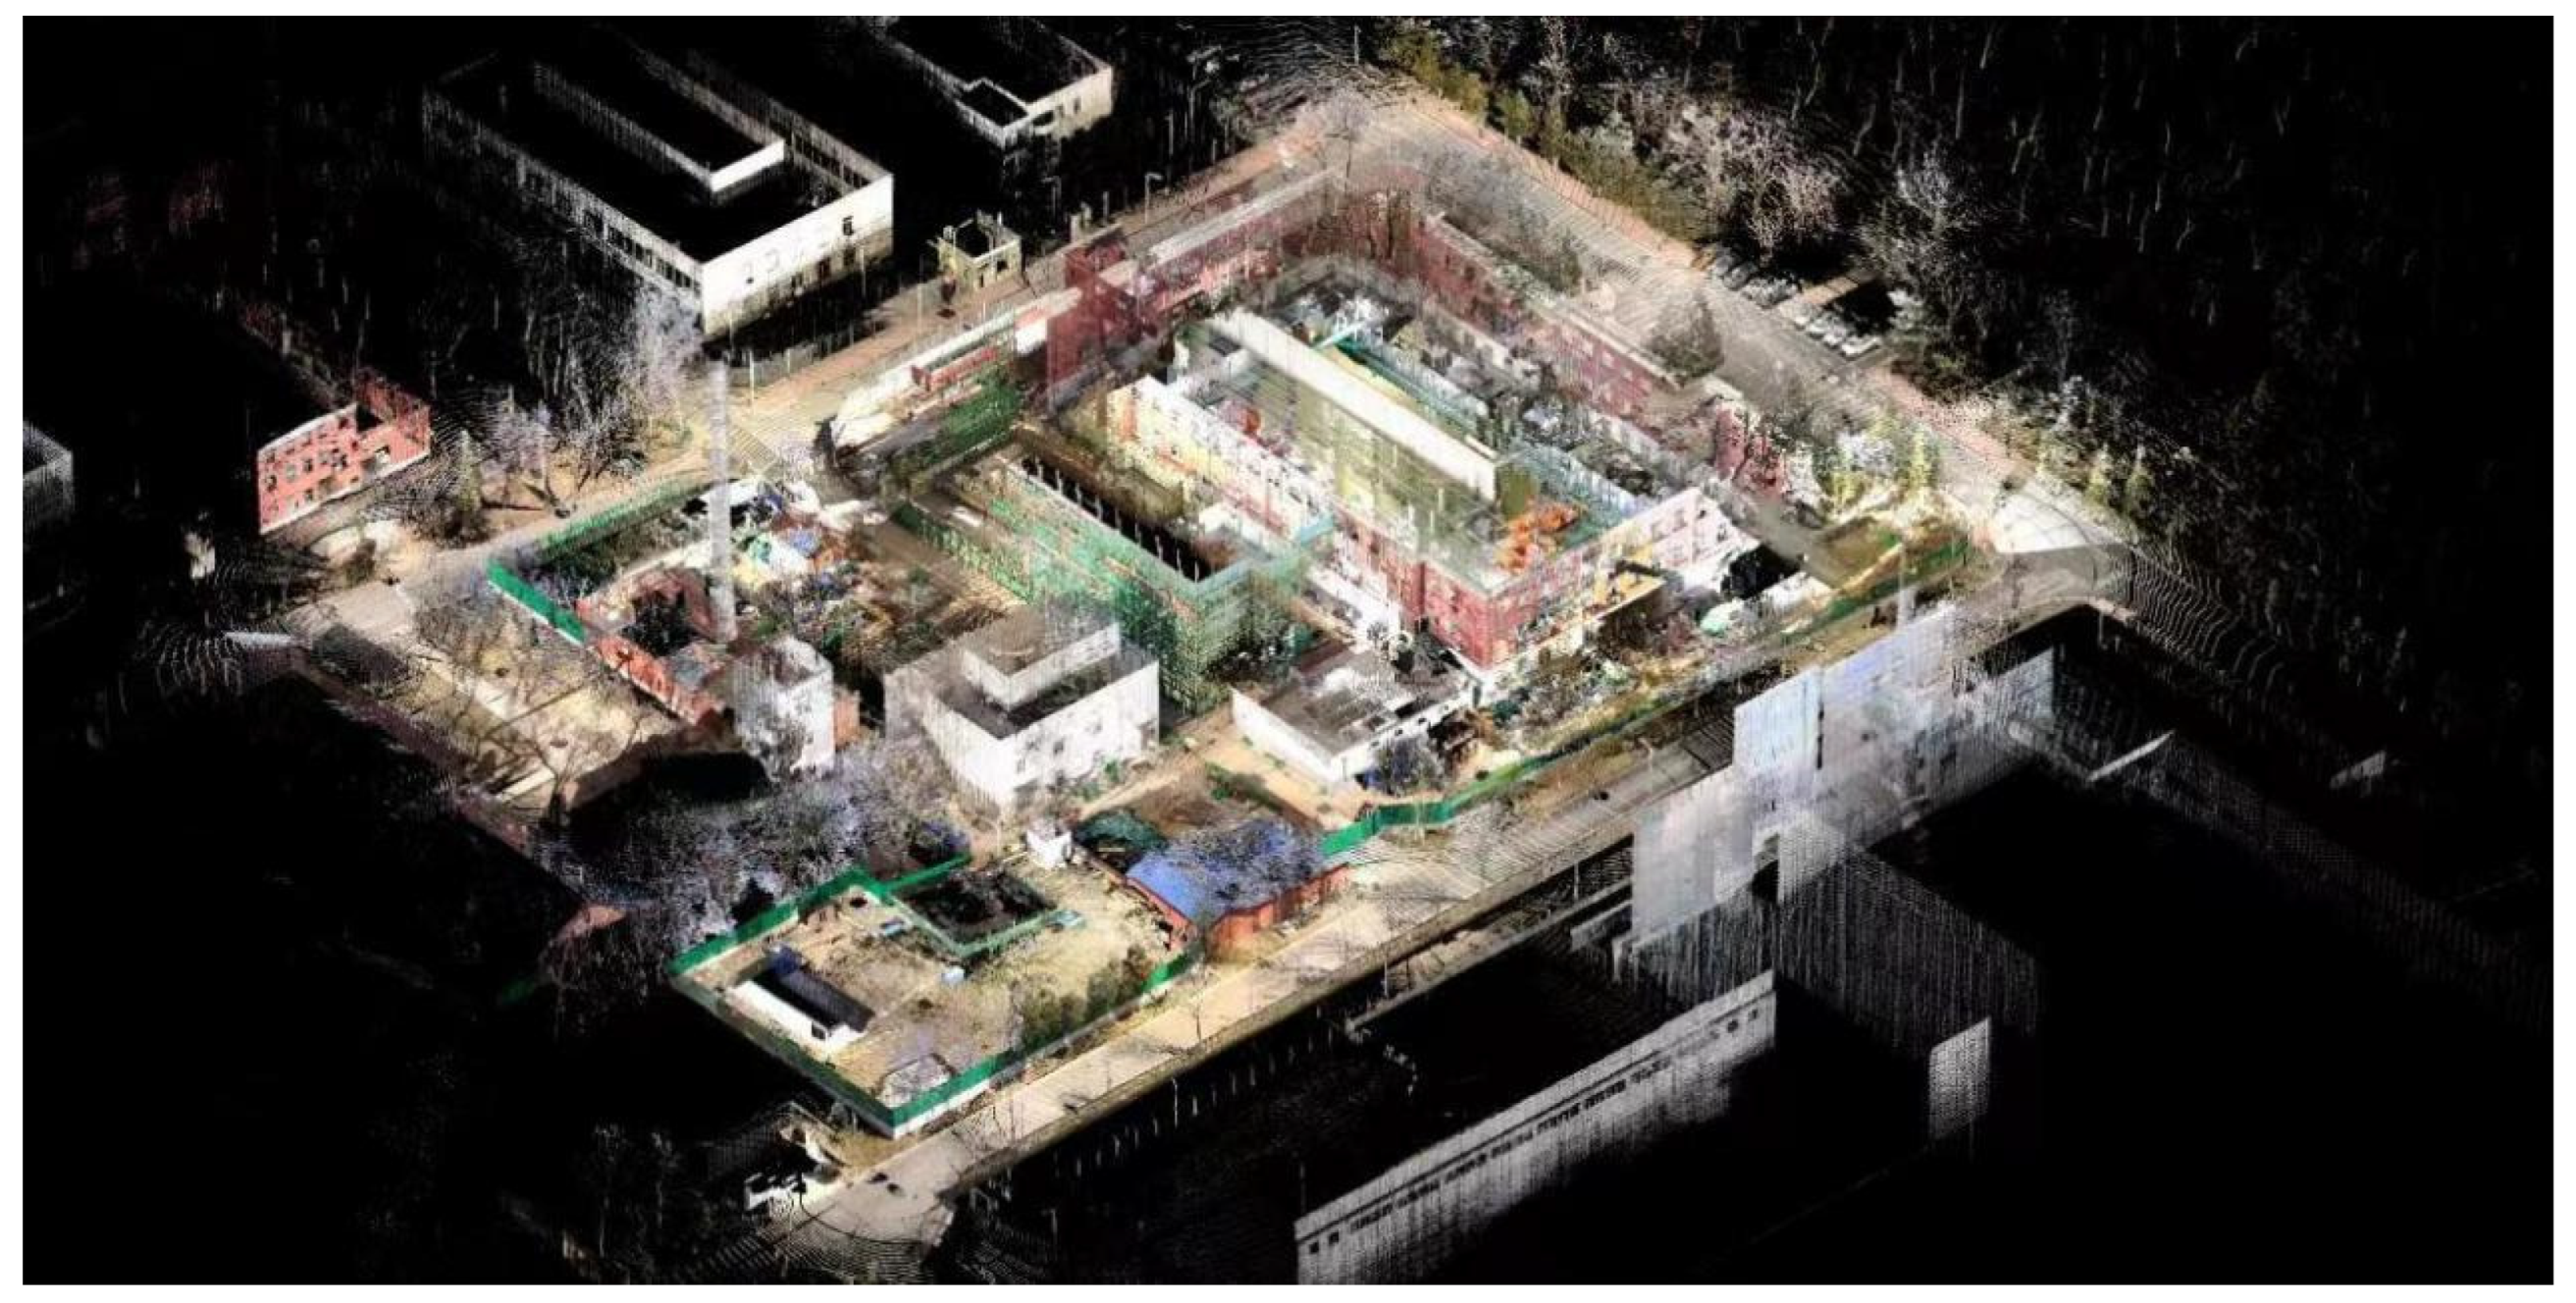
3.5. Point Cloud Data Processing for the HWRR Decommissioning Area

The acquired point cloud data underwent processing through the dedicated point cloud management software SCENE (https://www.faro.com/zh-cn/Products/Software/SCENE-Software (accessed on 24 February 2024)), encompassing essential tasks such as point cloud filtering, registration, coloring, and optimization [32]. Upon importing the single-station point cloud data into the SCENE software, once the data are loaded, the software autonomously eliminates impractical noise points. Furthermore, the software offers a manual option for the removal of noisy point cloud data arising from factors such as pedestrians, sundries, and other elements encountered during the scanning process. Notably, the software exhibits the capability to automatically recognize and pinpoint target spheres, achieving the automatic registration of point cloud data originating from two adjacent scanning stations.
The registration of point cloud data for the 572 scanning stations in the HWRR plant is based on target spheres between adjacent scanning stations. These target spheres are adjusted in 3D point cloud processing software to meet the required project accuracy before registration. The combination of control point data and target point data enables automated real-coordinate transformations, and the use of the least-squares method enhances the accuracy of large-scale data stitching. The scanner’s integrated image capture system facilitates automatic colorization of the point cloud, resulting in a colored and measurable panoramic point cloud. The point cloud model for the HWRR plant is illustrated in Figure 7.

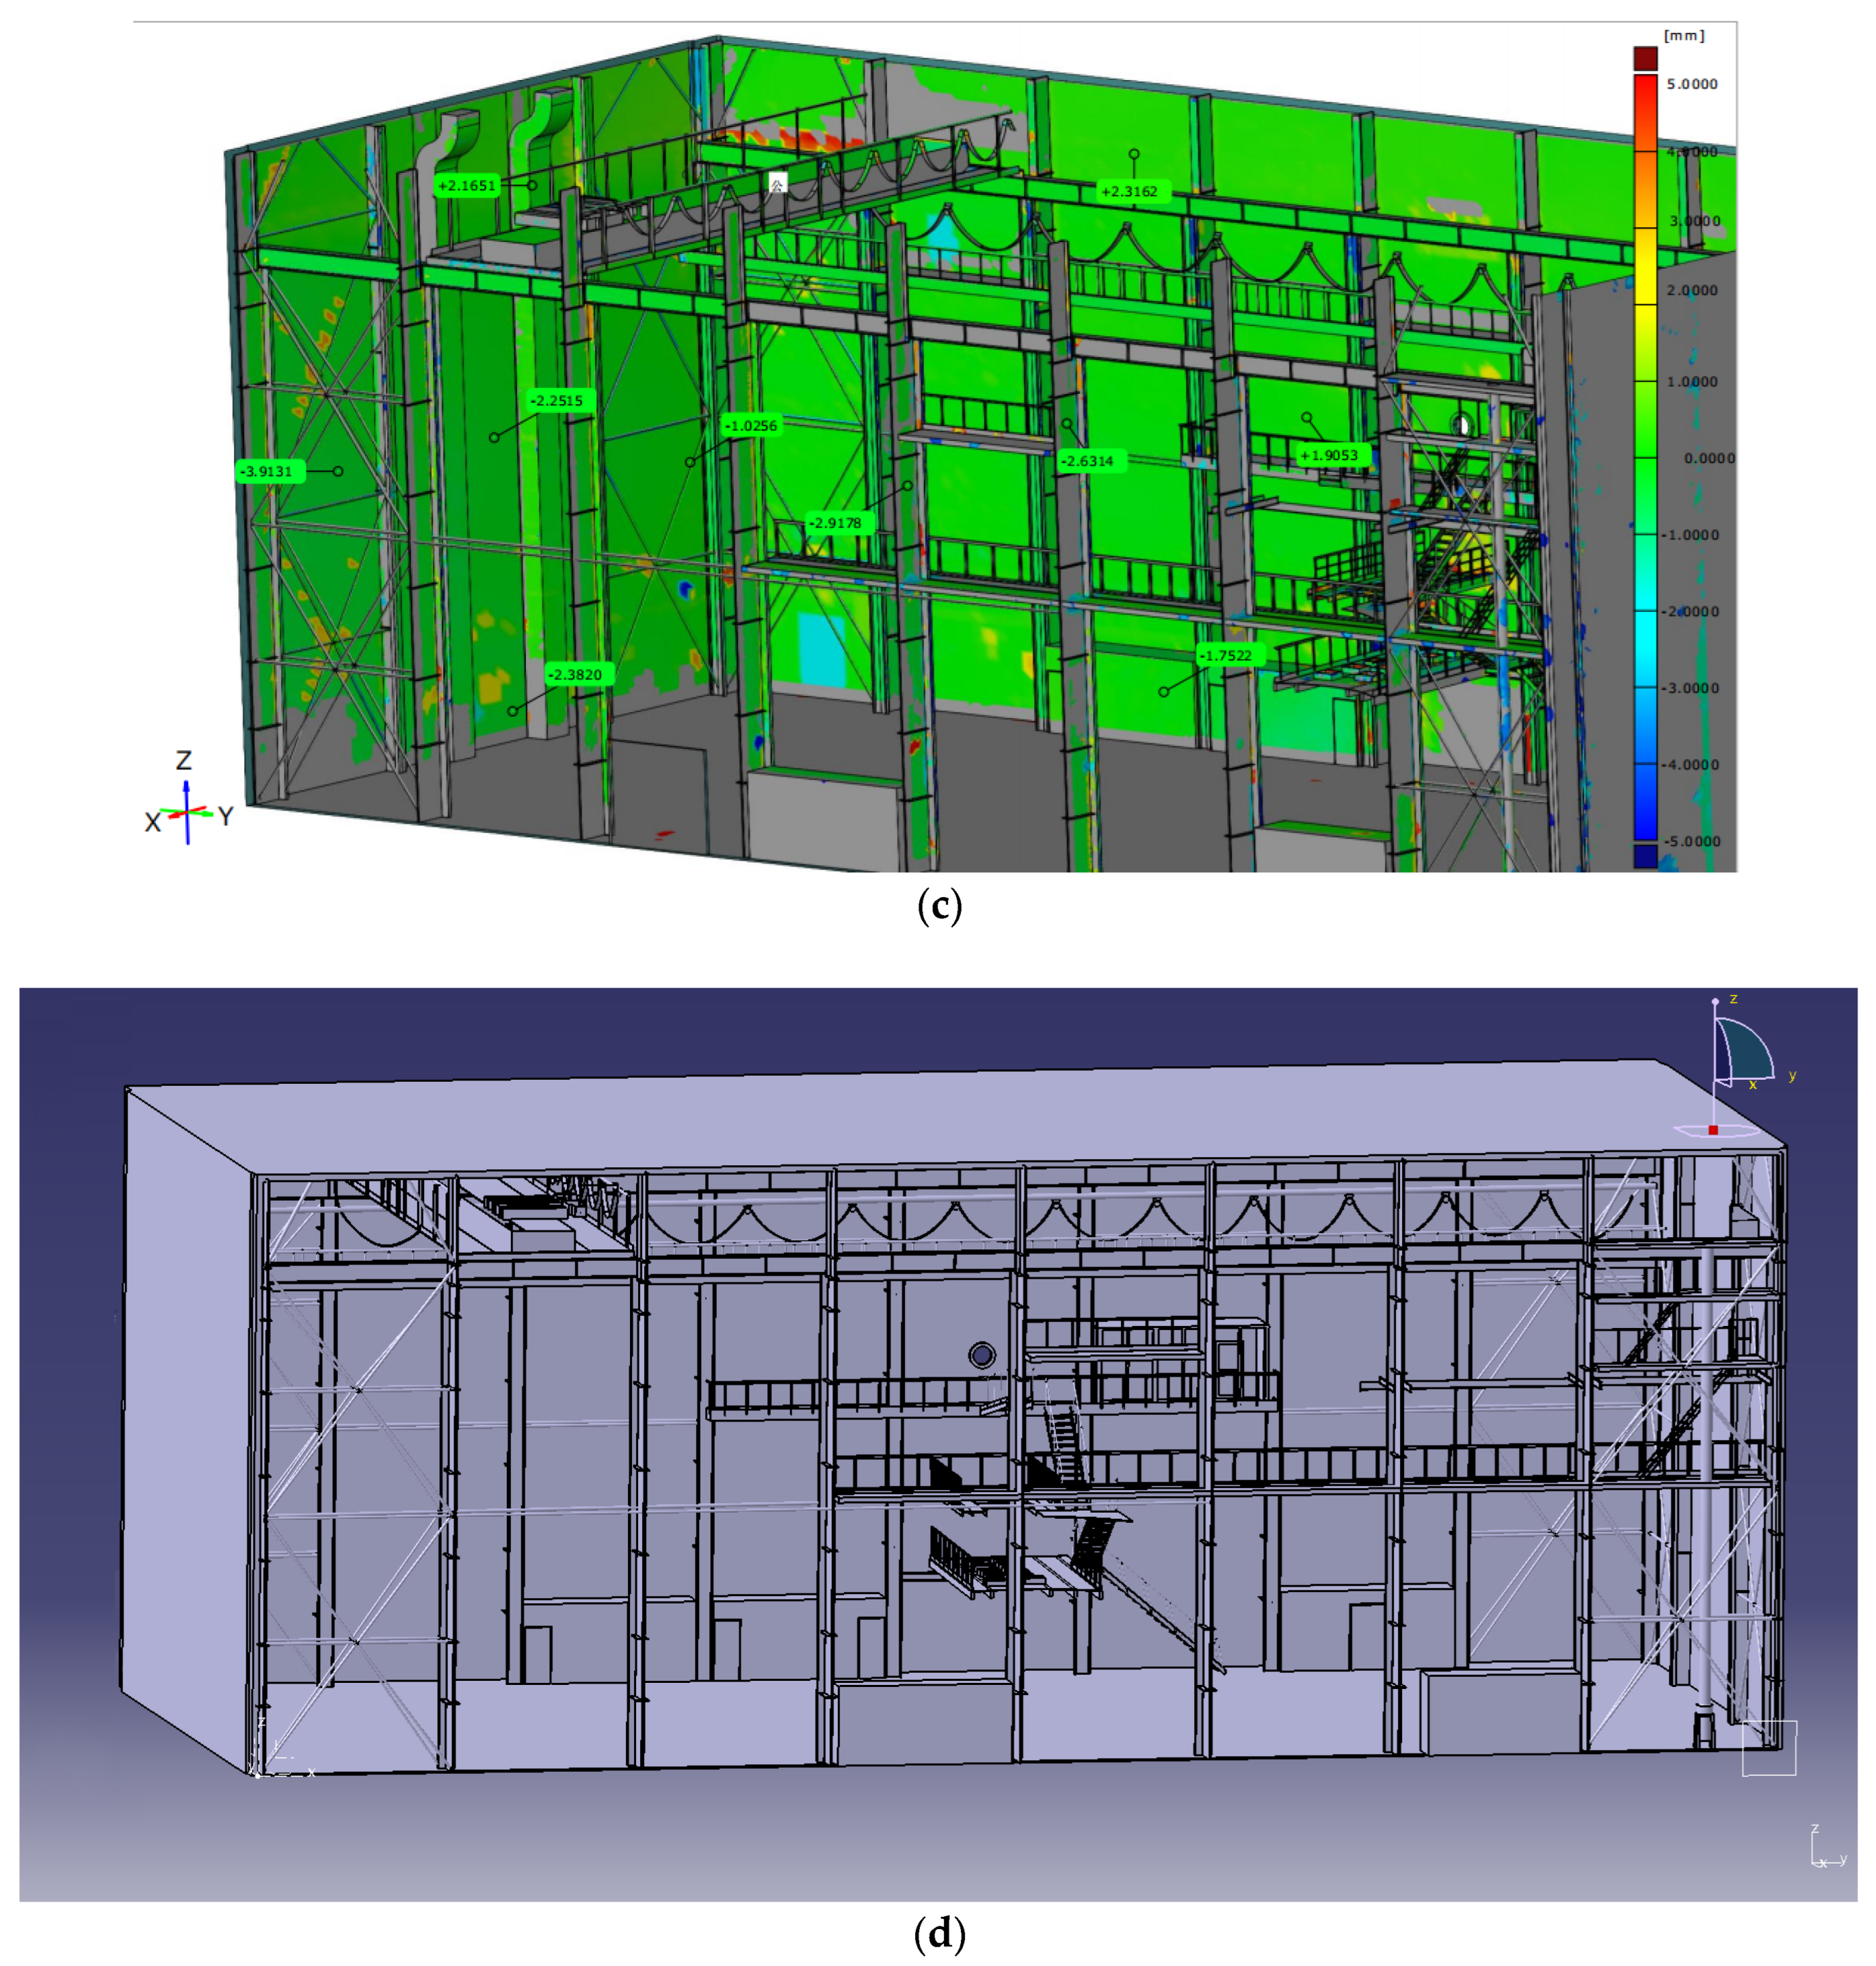
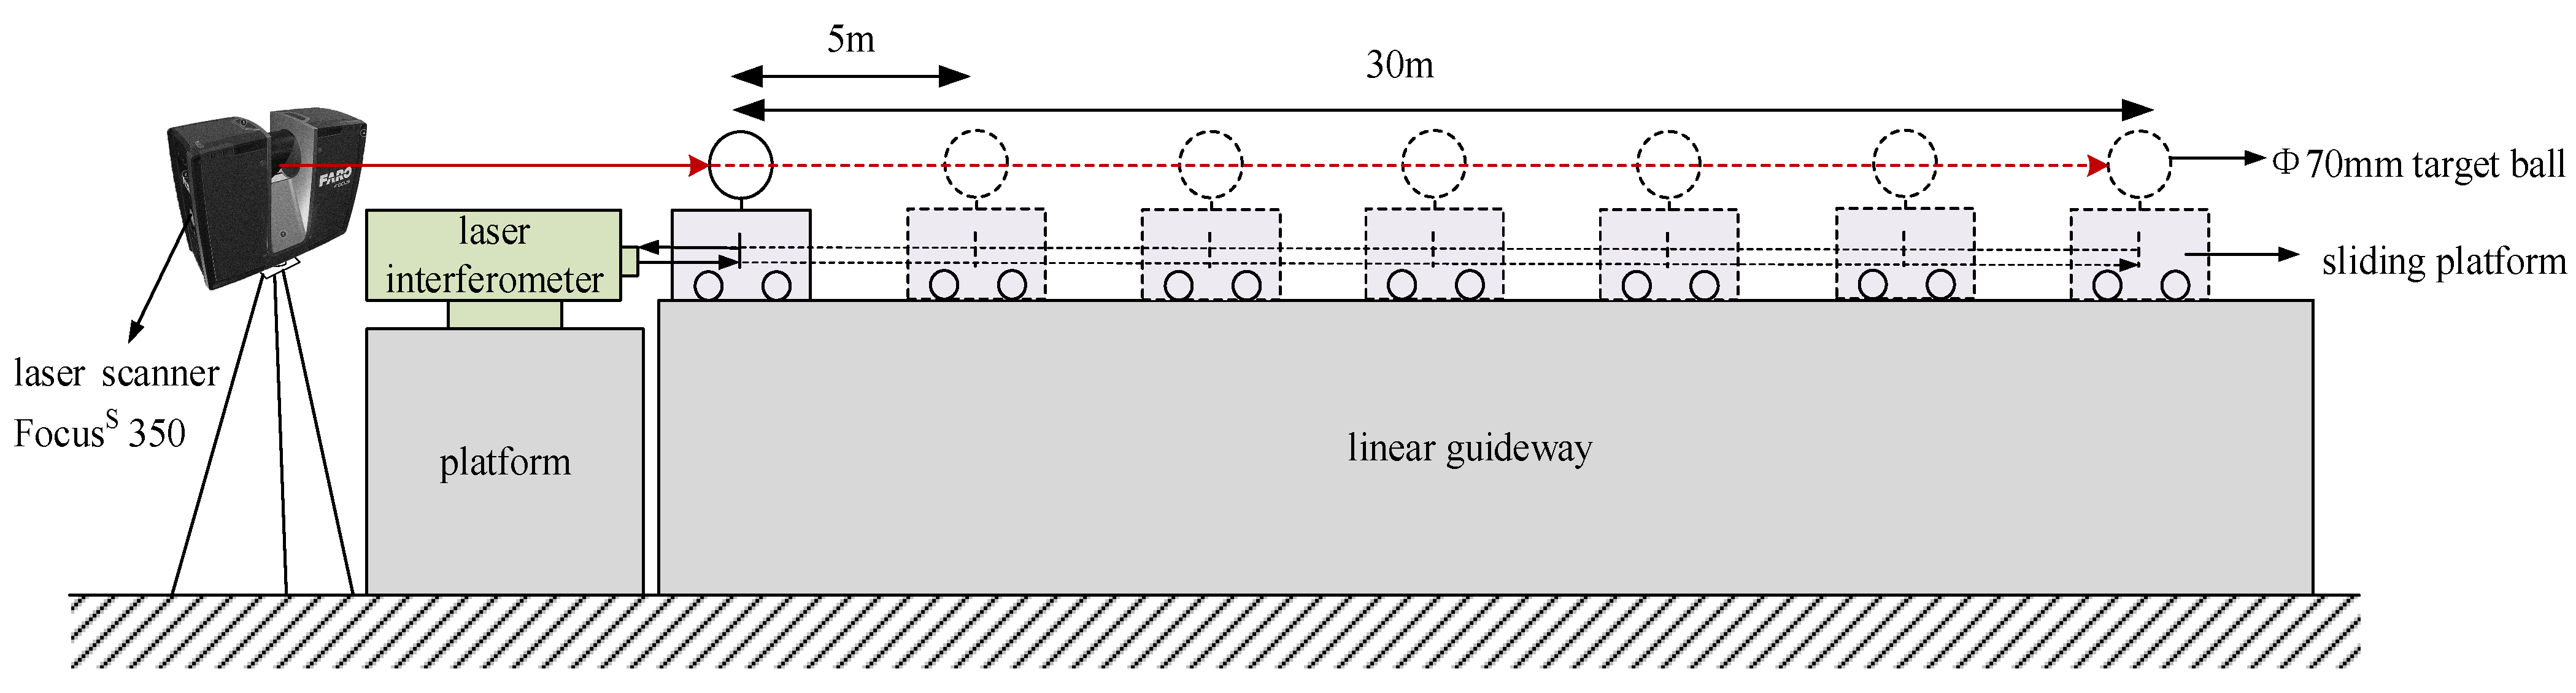
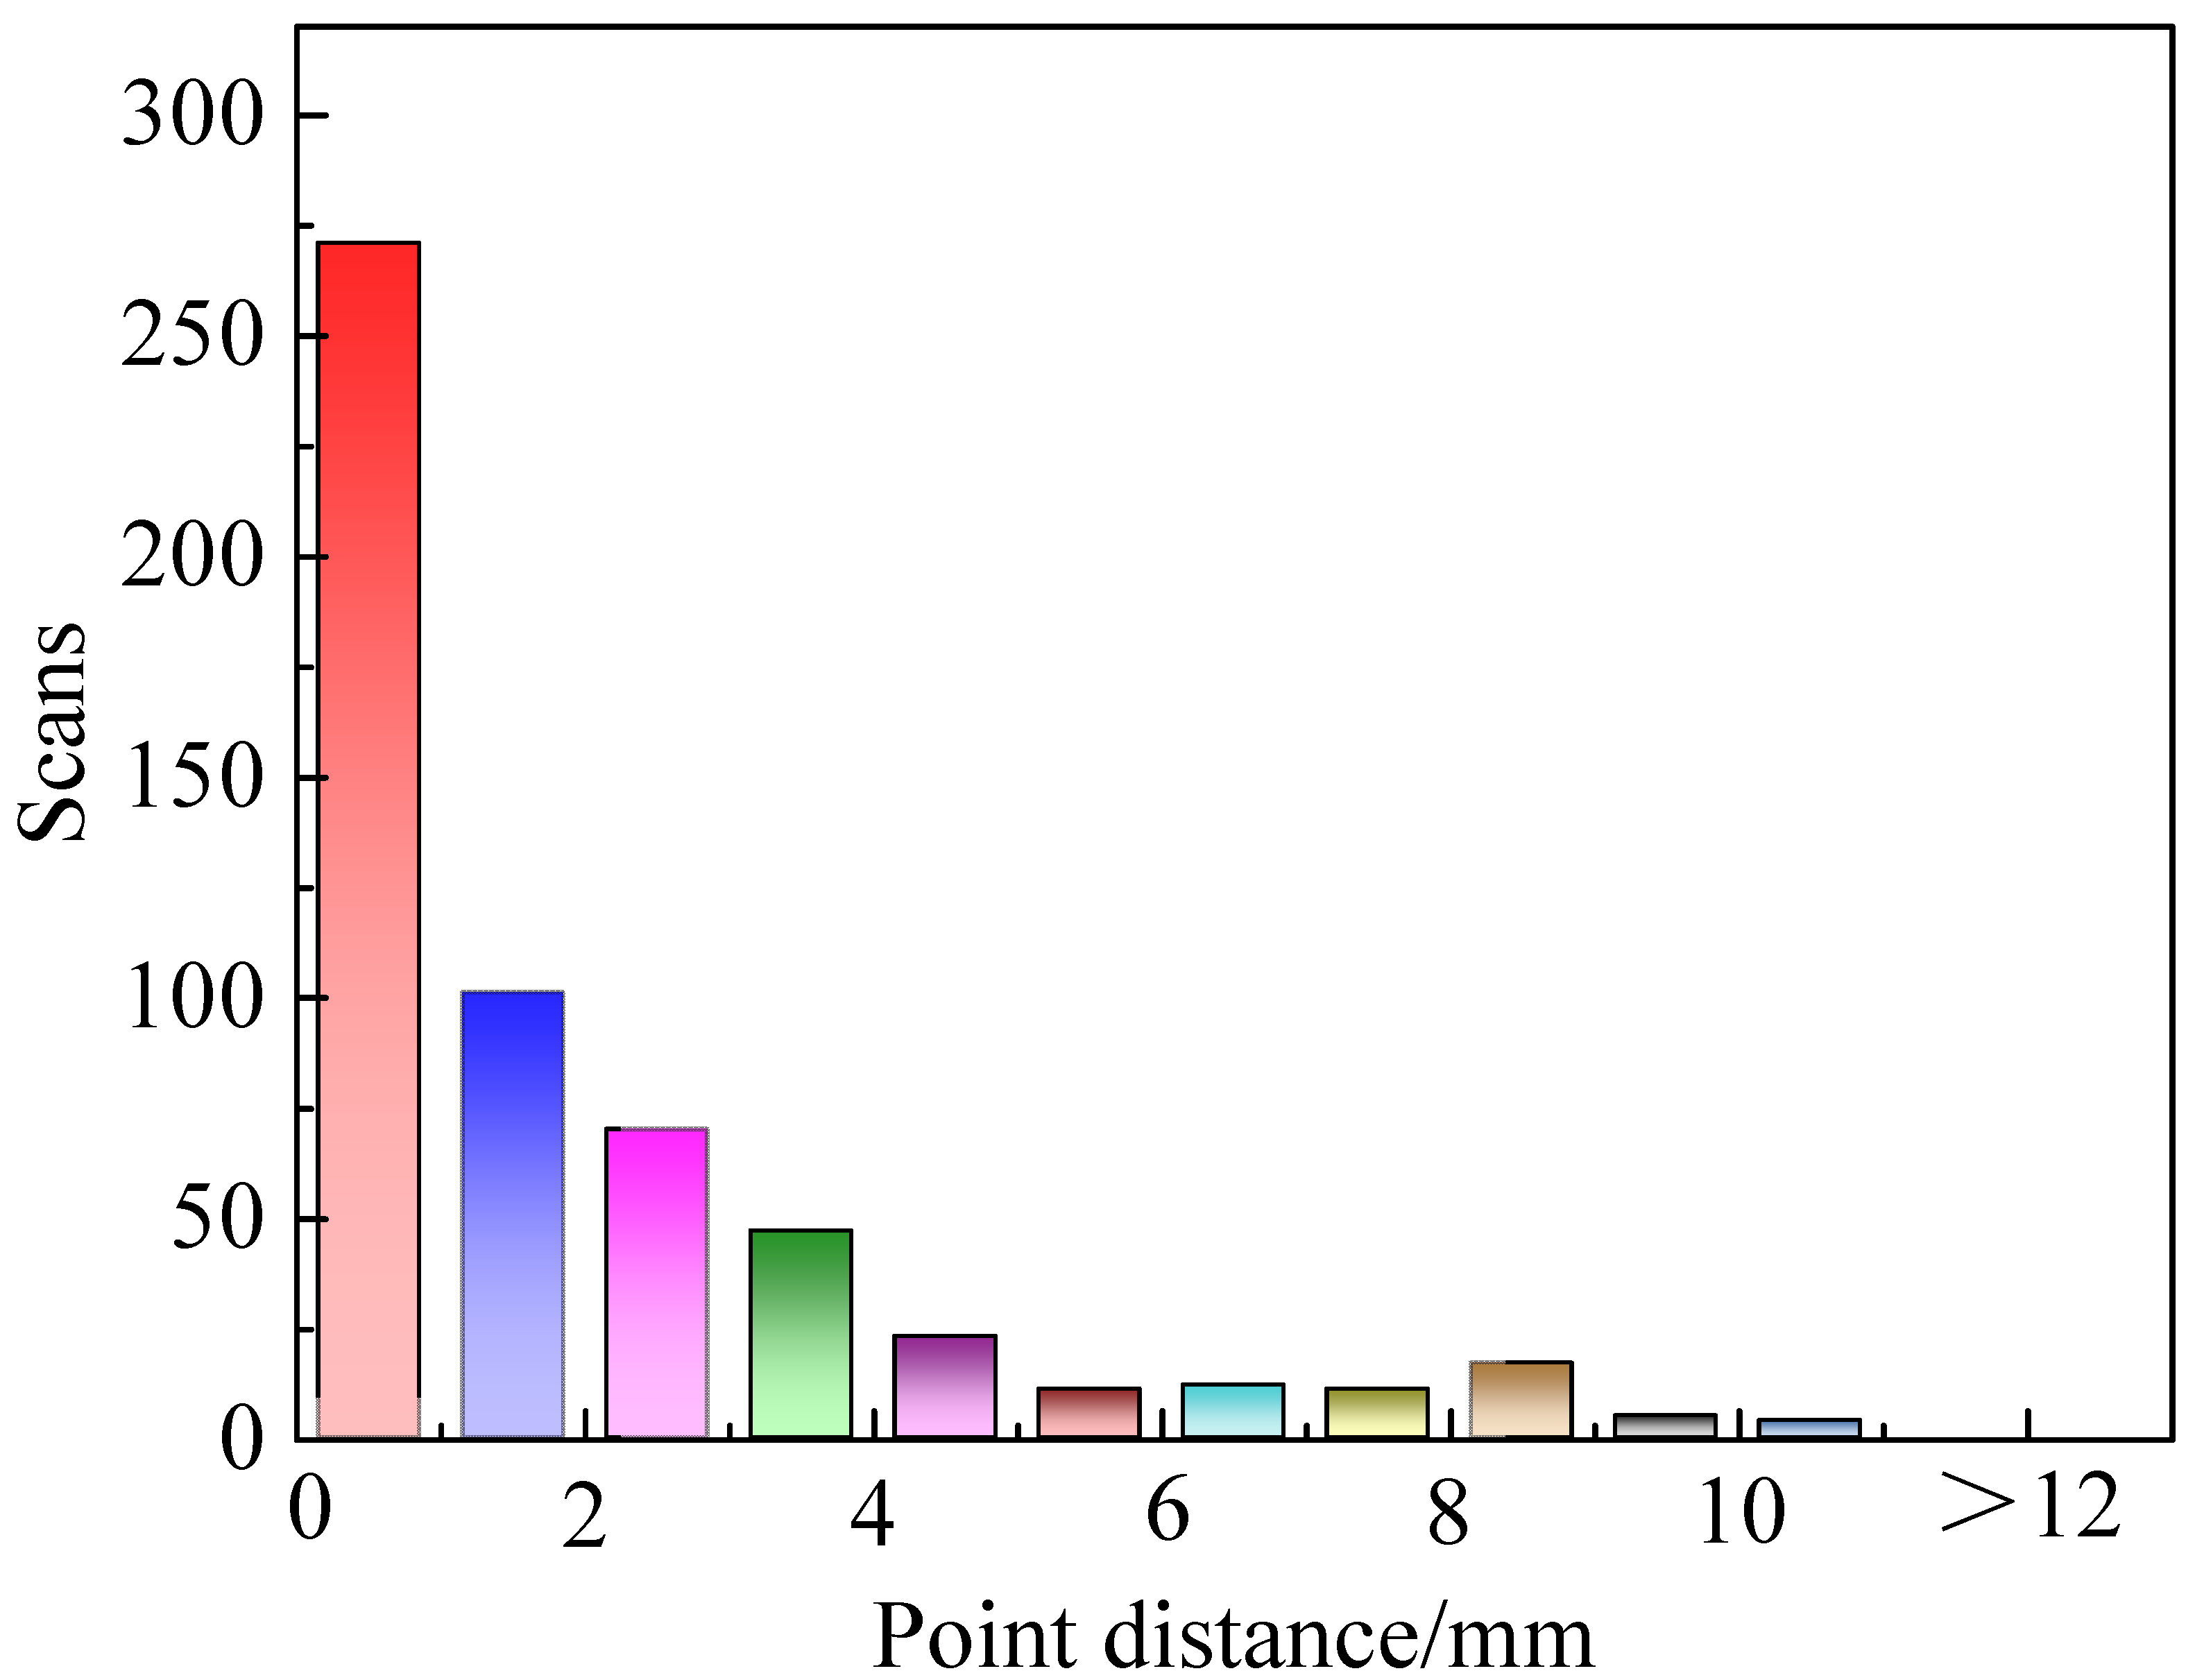
3.6. Accuracy Verification

The raw point cloud data serve as the foundation, and all subsequent post-processing tasks revolve around the point cloud data obtained from the initial scans. Ensuring the accuracy of the raw point cloud data acquisition is crucial. Therefore, precision calibration of the scanner is necessary to confirm the accuracy of the point cloud data obtained from the scanning equipment [36,37].
When calibrating the accuracy of the FARO Laser Scanner FocusS 350, the calibrated instrument used was a 35 mm dual-frequency laser interferometer standard device with higher accuracy than the scanner, which was verified through metrological calibration. The FARO Laser Scanner FocusS 350 scanned six target spheres evenly distributed at approximately 5, 10, 15, 20, 25, and 30 m under the highest resolution, as illustrated in Figure 8. The calibration test was conducted under environmental conditions with a temperature of 19.9 °C and a relative humidity of 59%. The calibration results for the FARO Laser Scanner FocusS 350 are presented in Table 4. Comparing the measured values from the scanner with the reference values from the laser interferometer, the error is within ±0.1 mm for scanning distances less than 15 m, and the maximum error is 0.3 mm for scanning distances exceeding 15 m. Furthermore, the calculated uncertainty for this scanner is 0.1 mm. From the results of the calibration, the scanner meets the requirement of an error less than 0.5 mm for single-station point cloud data acquisition in the HWRR decommissioning area.
After verifying that the acquired point cloud data are reliable, it is imperative to register and stitch the raw point cloud data due to the numerous scanning stations within the HWRR plant. To guarantee that the point cloud registration accuracy meets the requirements for subsequent 3D model reconstruction, a thorough analysis of the point cloud registration error should be conducted.
The integrated point cloud, derived from stitching, lays the groundwork for subsequent 3D model reconstruction. Theoretically, a smaller point cloud stitching accuracy corresponds to a higher quality in the reconstructed 3D model. The outcome of the point cloud registration from the 572 scanning stations within the HWRR plant is illustrated in Figure 9, with the average point distance error being 1.9 mm and a substantial 91.6% of the 1186 target spheres being of high quality, thus meeting the precision criteria for subsequent 3D model reconstruction of the HWRR plant.

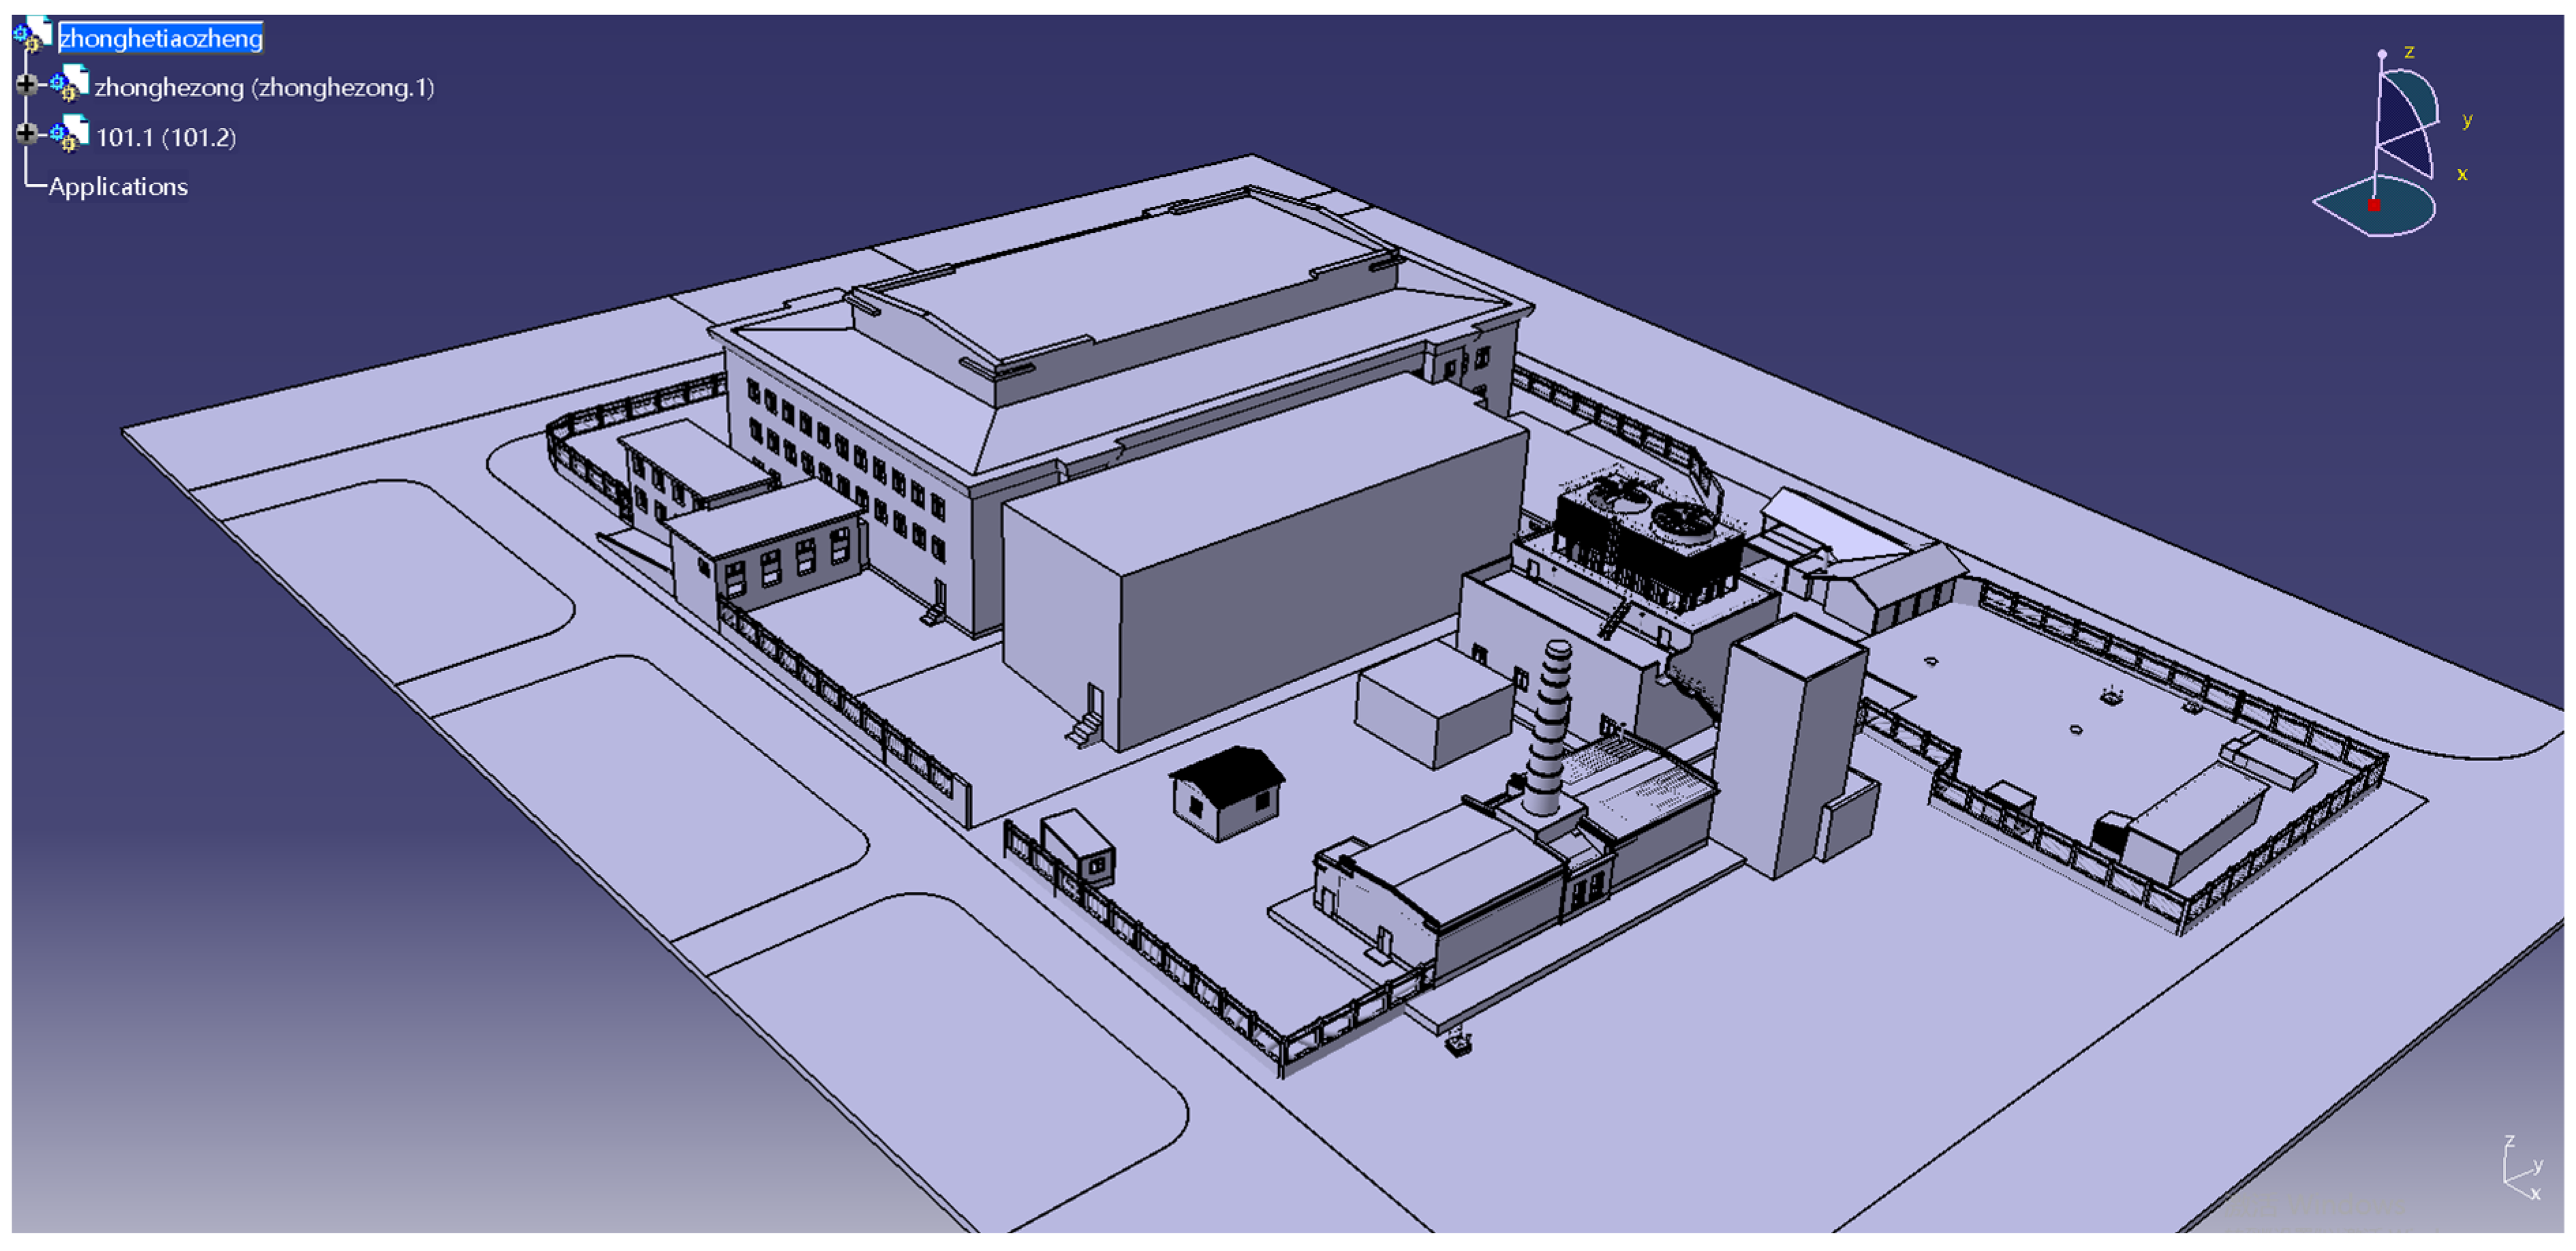
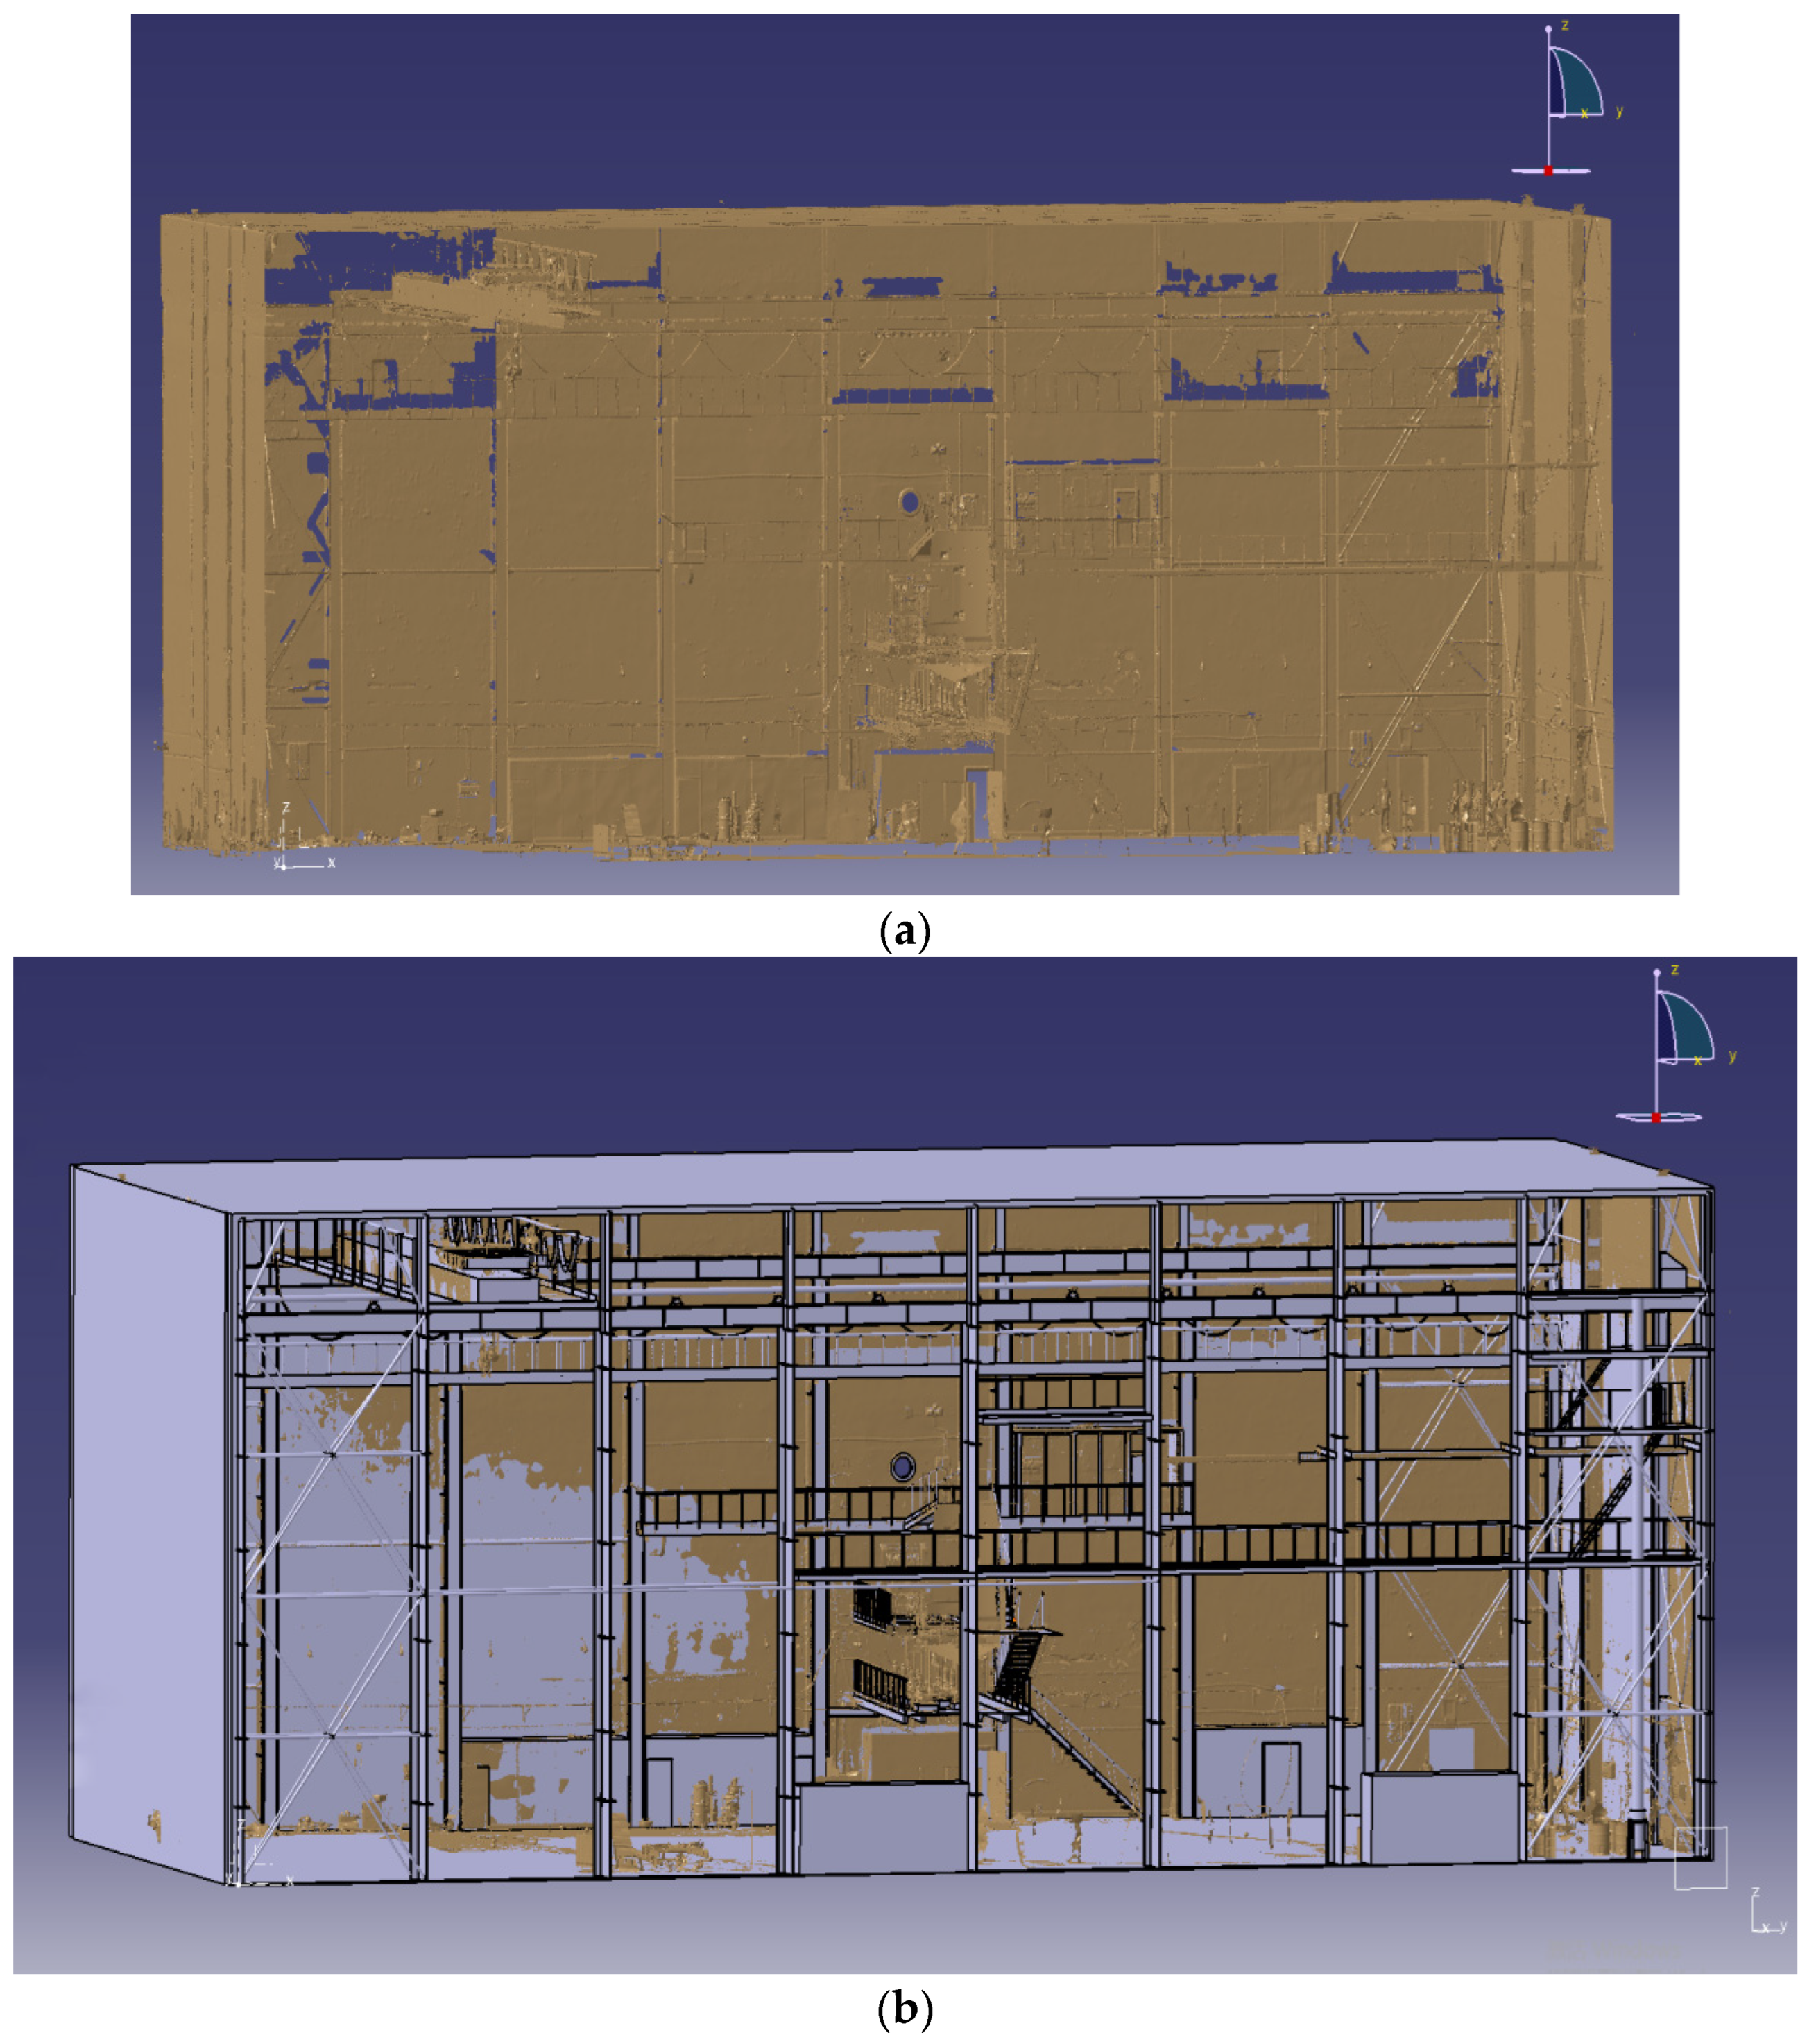
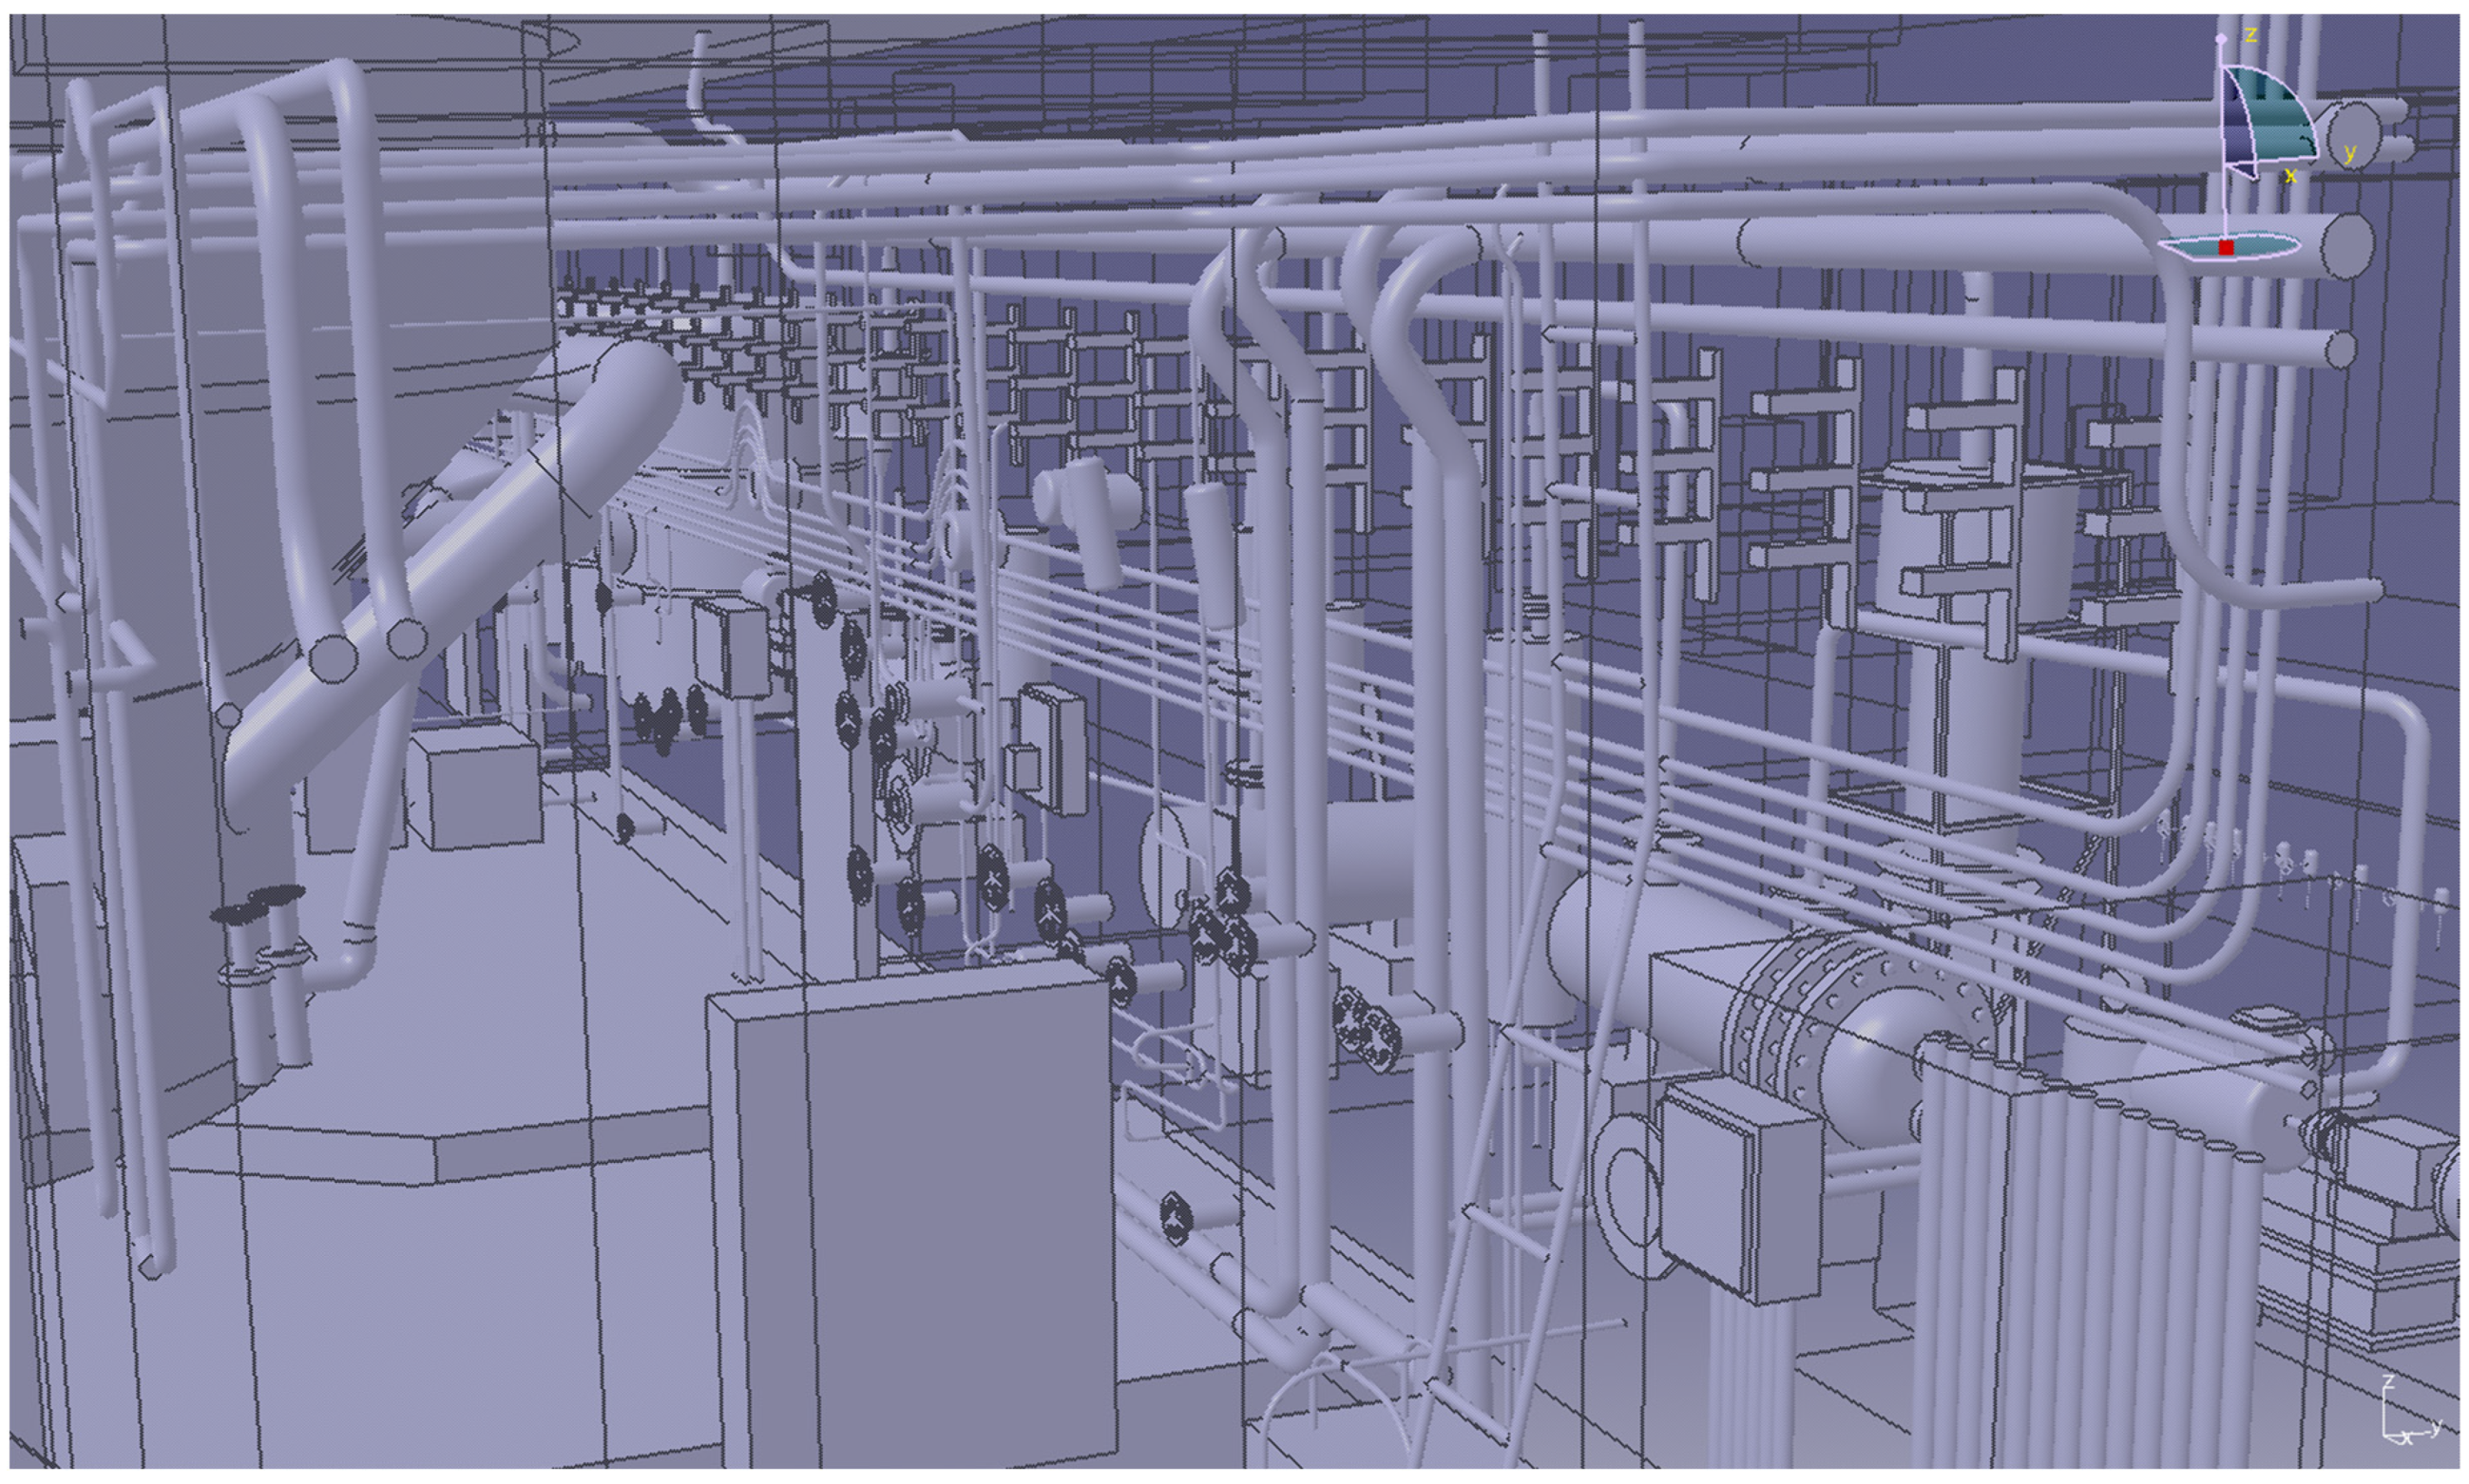
3.7. Model Reconstruction for the HWRR Plant

After processing the point cloud data and confirming the point cloud registration error is within an acceptable range, the subsequent step is the 3D model reconstruction of the HWRR plant. Since point cloud data cannot be directly utilized for modeling, it is necessary to convert the 3D point cloud data into a triangulated digital model, which can be directly exportable for reverse modeling within CATIA software (https://www.3ds.com/products/catia (accessed on 24 February 2024)). Additionally, considering the diverse point cloud density across various scanning stations, it is essential to ensure the uniformity of the point cloud to facilitate subsequent triangulation processing. Following the completion of the 3D model reconstruction, verification is performed to ensure that the model meets the requirements for subsequent simulation.
Using the HWRR hall as an example, the process of 3D model reconstruction and model verification is illustrated as follows. Initially, we extract the universal point cloud data of the reactor hall and triangulate the point cloud data, establishing a triangular mesh model that is exported to design software. Subsequently, topological modeling is performed based on the triangular mesh model, as depicted in Figure 10a. Through virtual assembly analysis with a high-precision triangular mesh model, any components of the topological model not meeting the accuracy requirements are refined or modified, as depicted in Figure 10b. The refined reactor hall model undergoes accuracy testing, as depicted in Figure 10c. Considering that the HWRR hall primarily encompasses elements like stairs, corridors, and walls, and taking into account computer hardware capabilities, the model retrieval speed, and point cloud data management, the error of model reconstruction can be less than 5 mm. This meets the criteria for subsequent decommissioning simulations and enables us to export the HWRR hall model in a universal format, as depicted in Figure 10d.
The point cloud model and reconstruction model of a typical system in the HWRR are obtained using laser-scanning 3D reconstruction technology. Figure 11 and Figure 12 show the point cloud images and 3D reconstruction model of the helium system in the HWRR.
After individually verifying the reconstruction models for each region within the HWRR plant, the final 3D model of the HWRR plant is established, illustrated in Figure 13, assembling with the models for each region within the HWRR plant.

3.8. Scheduling

The 3D model reconstruction of the HWRR main building area, secondary water pump house, ventilation center, and low-level radioactive wastewater storage tank area was conducted using laser scanning. The project took a total of 70 working days, with 28 working days being dedicated to point cloud data acquisition and 49 working days dedicated to point cloud data processing and 3D model reconstruction. Some tasks, such as point cloud data acquisition, processing, and 3D model reconstruction, had overlapping timelines. The specific project schedule is outlined in Table 5.

4. Conclusions

Due to the urgent need for the decommissioning of nuclear facilities, considering the radiation risks and industrial risks associated with nuclear facilities, the use of digital simulation technology can provide support for the development of decommissioning plans for nuclear facilities from the perspectives of safety and cost-effectiveness. Considering that accurate digital models are the foundation for subsequent simulations, laser-scanning 3D model reconstruction technology was adopted to obtain a 3D model of the HWRR plant. By setting up 20 control points, conducting on-site 3D scanning at 572 stations, processing the obtained 1.43 million units of raw point cloud data, and model reconstructing, the 3D model of the HWRR plant was obtained. The research roadmap for this project is illustrated in Figure 14.
This is the first time in China that laser-scanning 3D reconstruction technology has been applied to nuclear facility decommissioning projects. The obtained 3D nuclear facility model can provide a basis for the design of decommissioning simulation plans, scene displays, personnel training, etc. In the future, further research and development can also be conducted on 3D laser-scanning platforms to adapt them for applications in high-radiation fields, deep underground wells, or narrow spaces in nuclear facilities.

Author Contributions

Methodology, W.L. and Y.Z.; Validation, P.N.; Writing—original draft, W.L.; Writing—review & editing, R.L., L.Z., X.Z. and H.L.; Project administration, S.Z. All authors have read and agreed to the published version of the manuscript.

Funding

This research received no external funding.

Institutional Review Board Statement

Not applicable.

Informed Consent Statement

Not applicable.

Data Availability Statement

The raw data supporting the conclusions of this article will be made available by the authors on request.

Acknowledgments

Acknowledgement is made to Nothton Metrology Technology (Beijing) Co., Ltd. for their technical support and SCENE software support.

Conflicts of Interest

The authors declare no conflicts of interest.

References

  1. Schneider, M.; Froggartt, A. The World Nuclear Industry Status Report 2023; Mycle Schneider: Paris, France, 2023; Available online: https://www.worldnuclearreport.org/IMG/pdf/wnisr2023-v3-hr.pdf (accessed on 15 January 2024).
  2. International Atomic Energy Agency. Global Status of Decommissioning of Nuclear Installations; International Atomic Energy Agency: Vienna, Austria, 2023.
  3. Kim, I.; Hyun, D.; Joo, S.; Lee, J. A methodology for digital mockup update based on the 3D scanned spatial information for the automated dismantling of nuclear facilities. Ann. Nucl. Energy 2022, 139, 107238. [Google Scholar] [CrossRef]
  4. International Atomic Energy Agency. Management of Project Risks in Decommissioning; International Atomic Energy Agency: Vienna, Austria, 2019.
  5. Choi, B.S.; Hyun, D.; Kim, I.; Jonghwan, L.; Jeikwon, M. A new graphical dismantling process simulation technology for flexible planning of nuclear facility. Trans. Am. Nucl. Soc. 2017, 116, 35–37. [Google Scholar]
  6. Kim, H.-R.; Kim, S.-K.; Seo, B.-K.; Lee, K.-W.; Park, J.-H. The preliminary 3D dynamic simulation on the RSR dismantling process of the KRR-1&2. Ann. Nucl. Energy 2003, 30, 1487–1494. [Google Scholar] [CrossRef]
  7. Jeong, K.; Choi, B.; Moon, J.; Hyun, D.; Lee, J.; Kim, I.; Kim, G.; Seo, J. The digital mock-up system to simulate and evaluate the dismantling scenarios for decommissioning of a NPP. Ann. Nucl. Energy 2014, 69, 238–245. [Google Scholar] [CrossRef]
  8. Pot, J.; Thibault, G.; Levesque, P. Techniques for CAD reconstruction of ‘as-built’ environments and application to preparing for dismantling of plants. Nucl. Eng. Des. 1997, 178, 135–143. [Google Scholar] [CrossRef]
  9. Yan, W.; Aoyama, S.; Ishii, H.; Shimoda, H.; Sang, T.T.; Inge, S.L.; Lygren, T.A.; Terje, J.; Izumi, M. Development and evaluation of a temporary placement and conveyance operation simulation system using augmented reality. Nucl. Eng. Technol. 2012, 44, 507–522. [Google Scholar] [CrossRef]
  10. Wu, S.; Pan, T.; Cao, J.; He, D.; Xiao, Z. Radiological characterization survey during transition phase of safe shutdown of 101 HWRR. Nucl. Eng. Technol. 2012, 46, 716–720. [Google Scholar] [CrossRef]
  11. Ren, R.; Guo, Y.; Zhang, X.; Zhang, L.; Nie, P.; Li, R.; Li, H.; Zhao, Z. Design and application of a special underwater cutting device for the decommissioning of the first HWRR reactor in China. Nucl. Eng. Des. 2023, 415, 112678. [Google Scholar] [CrossRef]
  12. Farr, H. Advances and Innovations in Nuclear Decommissioning; Laraia, M., Ed.; Emerging Technologies: Naples, FL, USA, 2017; Volume 8, pp. 201–257. [Google Scholar]
  13. Zhao, J.L.; Wu, R.; Wang, L.; Wu, Y.Q. The application of 3D laser scanning technology in ancient architecture protection. Appl. Mech. Mater. 2013, 353–356, 3476–3479. [Google Scholar] [CrossRef]
  14. Elhakim, S.F.; Picard, M.; Godin, G. Detailed 3D reconstruction of heritage sites with integrated. IEEE Comput. Graph. Appl. 2004, 24, 21–29. [Google Scholar] [CrossRef]
  15. Arbace, L.; Sonnino, E.; Callieri, M.; Dellepiane, M.; Fabbri, M.; Idelson, A.I.; Scopigno, R. Innovative uses of 3D digital technologies to assist the restoration of a fragmented terracotta statue. J. Cult. Herit. 2013, 14, 332–345. [Google Scholar] [CrossRef]
  16. Strouth, A.; Burk, R.L.; Eberhardt, E. The afternoon creek rockslide near Newhalem Washington. Landslides 2006, 3, 175–179. [Google Scholar] [CrossRef]
  17. Abbas, M.A.; Luh, L.C.; Setan, H.; Majid, Z.; Chong, A.K.; Aspuri, A.; Idris, K.M.; Ariff, M.F.M. Terrestrial laser scanners pre-processing: Registration and georeferencing. J. Teknol. 2014, 71, 2180–3722. [Google Scholar] [CrossRef]
  18. Xu, F.J.; Chen, S.K. Application of 3D laser scan technology in the surveying and mapping of ancient buildings. In Proceedings of the 6th International Conference on Environmental Science and Civil Engineering, Nanchang, China, 4–5 January 2020. [Google Scholar]
  19. Zhang, L.; Song, L. Application of 3D laser scanning technology in surveying and mapping of building facade. Bull. Surv. Map. 2019, 9, 160–162. [Google Scholar] [CrossRef]
  20. Bobbitt, J.; Vrettos, N.; Howard, M. R&P Reactor Building In-Situ Decommissioning Visualization. U.S. 2010. Available online: https://www.osti.gov/servlets/purl/981860 (accessed on 15 June 2007).
  21. Liu, Z.; Liu, Y.; Zhu, H.; Cheng, S. Research on nuclear facilities decommissioning engineering support system framework. In Proceedings of the 2010 Asia Pacific Power and Energy Engineering Conference, Chengdu, China, 28–31 March 2010. [Google Scholar]
  22. Zhang, Y.L.; Zhao, W.; Wang, S. Study of laser 3D scanning model reconstruction for nuclear facilities decommissioning. In Proceedings of the 2020 International Conference on Nuclear Engineering, Virtual, 4–5 August 2020. [Google Scholar]
  23. Hyun, D.; Joo, S.; Kim, I.; Lee, J. 3D point cloud acquisition and correction in radioactive and underwater environments using industrial 3D scanners. Sensors 2022, 22, 9053. [Google Scholar] [CrossRef] [PubMed]
  24. Huang, X.; Wang, R.; Luo, Y. 3D reality modeling of large complicated structural systems based on 2D engineering drawings. Struct. Eng. 2008, 24, 26–29. [Google Scholar] [CrossRef]
  25. Thanh, N.T.; Liu, X.; Wang, H.; Yu, M.; Zhou, W. 3D model reconstruction based on laser scanning technique. Laser Optoelectron. Prog. 2011, 48, 081201. [Google Scholar] [CrossRef]
  26. Zhang, H.F.; Cheng, X.J.; Shi, Y.T. Study on 3D modeling for history building and precision analyzing. Appl. Mech. Mater. 2011, 443–444, 471–476. [Google Scholar] [CrossRef]
  27. Zhang, K.; Zhao, L.; Deng, Q. Research on application of 3D laser scanning technology in the decommissioning nuclear facilities. Mech. Eng. 2016, 3, 66–68. [Google Scholar] [CrossRef]
  28. Chen, Y.; Wu, T.; Chen, Z.H. Error analysis and control based on 3D laser scanning measurement for large-scale bridge. Railw. Eng. 2022, 62, 96–100. [Google Scholar]
  29. Phan, N.D.M.; Quinsat, Y.; Lavernhe, S.; Lartigue, C. Scanner path planning with the control of overlap for part inspection with an industrial robot. Int. J. Adv. Manuf. Technol. 2018, 98, 629–643. [Google Scholar] [CrossRef]
  30. Li, L.W.; Li, H.; BAN, Y.; Gao, Y. Accuracy analysis of 3D laser scanning spherical targets at different distances and different scan densities. J. Kunming Metall. Coll. 2019, 35, 5. [Google Scholar]
  31. Kedzierski, M.; Walczykowski, P.; Orych, A.; Czarnecka, P. Accuracy assessment of modeling architectural structures and details using terrestrial laser scanning. In Proceedings of the 25th International CIPA Symposium 2015, Taipei, Taiwan, 31 August–4 September 2015. [Google Scholar]
  32. Cox, R.A.K. Real-World Comparisons between Target-Based and Targetless Point-Cloud Registration in FARO Scene, Trimble RealWorks and Autodesk Recap. Ph.D. Thesis, University of Southern Queensland, Toowoomba, QLD, Australia, 2015. [Google Scholar]
  33. Franaszek, M.; Cheok, G.S.; Witzgall, C. Fast automatic registration of range images from 3D imaging systems using sphere targets. Autom. Constr. 2009, 18, 265–274. [Google Scholar] [CrossRef]
  34. Shi, H. Automatic registration of laser point cloud using precisely located sphere targets. J. Appl. Remote Sens. 2014, 8, 5230–5237. [Google Scholar] [CrossRef]
  35. Liu, B.; Shangguan, N.; Jiang, K.; Lin, J. Triangular mesh model reconstruction from scan point clouds based on template. Tsinghua Sci. Technol. 2009, 14, 56–61. [Google Scholar] [CrossRef]
  36. Kersten, T.P.; Lindstaedt, M. Geometric accuracy investigations of terrestrial laser scanner systems in the laboratory and in the field. Appl. Geomat. 2022, 14, 421–434. [Google Scholar] [CrossRef]
  37. Deng, X.; Qian, Z.; Zhou, Z. Terrestrial laser scanner ranging calibration equipment and evaluation of measurement uncertainty. Acta Meteorol. Sin. 2010, 31, 157–160. [Google Scholar] [CrossRef]
Figure 1. Schematic diagram of the working principle of a 3D laser scanner.
Applsci 14 03135 g001
Figure 2. Flow chart of the laser-scanning 3D model reconstruction process.
Applsci 14 03135 g002
Figure 3. Schematic diagram of a regional control network.
Applsci 14 03135 g003
Figure 4. Layout diagram of target points and scanning stations.
Applsci 14 03135 g004
Figure 5. Schematic diagram of coordinate transformation.
Applsci 14 03135 g005
Figure 6. Layout diagram of control points (P points) in the HWRR plant.
Applsci 14 03135 g006
Figure 7. The point cloud model for the HWRR plant.
Applsci 14 03135 g007
Figure 8. Diagram of the FARO Laser Scanner FocusS 350 calibration test.
Applsci 14 03135 g008
Figure 9. The point cloud registration error in the HWRR plant.
Applsci 14 03135 g009
Figure 10. The model reconstruction process for the HWRR hall. (a) Triangulation model of the HWRR hall. (b) Virtual assembly diagram of the HWRR hall topology model and triangulation model. (c) Accuracy verification results of the 3D model of the HWRR hall. (d) The model of the HWRR hall.
Applsci 14 03135 g010aApplsci 14 03135 g010b
Figure 11. Point cloud image of the helium system in the HWRR.
Applsci 14 03135 g011
Figure 12. Reconstruction model of the helium system in the HWRR.
Applsci 14 03135 g012
Figure 13. 3D reconstruction model of the HWRR plant.
Applsci 14 03135 g013
Figure 14. The roadmap of the application of laser-scanning 3D model reconstruction technology for the HWRR.
Applsci 14 03135 g014
Table 1. Comparisons of laser-scanning 3D model reconstruction and 3D software modeling technology.
No.IndexLaser-Scanning 3D Model
Reconstruction Technology
3D Software Modeling Technology
1CostsThe economic cost of the 3D laser-scanning equipment is relatively high, but at the same time it saves time.The economic cost is relatively low, while the time cost of decommissioning is increased.
2Skilled manpowerThe variety and level of skilled manpower required is high.The skilled manpower required are relatively homogeneous.
3Model accuracyHigh precision with multiple presentation of results.General, not applicable to the modeling of complex objects.
4Data acquisition3D coordinates and reflectivity of modeled entities.Drawings containing dimensional data of modeled entities.
5WorkloadsThe data acquisition and modeling workload is small, but the workload required for processing the point cloud data is large.The data acquisition and modeling workload is large.
Table 2. Key equipment and specifications used in the laser-scanning 3D model reconstruction process.
No.EquipmentBrandSpecificationsQuantity
13D laser scannerFARO FocusS 350 (FARO, Lake Mary, FL, USA) Maximum measure speed: 976,000 pts/s;
Angle accuracy: 0.00527°;
Distance accuracy: ±1 mm;
1
2Total stationTCRP 1201 (Leica, Wetzlar, Germany)Angle accuracy: 0.00027°;
Distance accuracy: 1 mm + 1.5 ppm;
Display resolution: 0.1 mm
1
3CameraA7R2 (Sony, Tokyo, Japan)Effective pixels: 42.4 million;
Maximum shutter speed: 1/8000 s
1
4Target spheresFARO (Lake Mary, FL, USA)14.5 cm in diameter10
5PC workstationT-7920 (Dell, Austin, TX, USA)Intel Xeon Gold 6248R CPU @ 3.00 GHz;
128 G RAM
4
Table 3. The building areas for each region in the HWRR plant.
No.RegionBuilding Area/m2Number of Floors
1Reactor main building86906
2Ventilation center3001
3Low-level radioactive wastewater storage tank area20831
4Secondary water pump room4891
Total 11,562-
Table 4. Result of the FARO Laser Scanner FocusS 350 calibration test.
No.Measured Value/mmReference Value/mmError/mm
14999.84999.9−0.1
29999.79999.8−0.1
315,000.515,000.20.3
420,000.019,999.90.1
525,000.525,000.30.2
630,000.530,000.20.3
Table 5. The project schedule of the HWRR model reconstruction.
No.TasksDurationWorking Time
1Preparation Work2 working days23/3–24/3/2022
2Control survey5 working days25/3–31/3/2022
3Three-dimensional laser scan21 working days1/4–29/4/2022
4Point cloud data processing9 working days20/4–2/5/2022
5Model Reconstruction40 working days28/4–22/6/2022
6Data accuracy check15 working days8/6–28/6/2022
7Result arrangement3 working days28/6–30/6/2022
Disclaimer/Publisher’s Note: The statements, opinions and data contained in all publications are solely those of the individual author(s) and contributor(s) and not of MDPI and/or the editor(s). MDPI and/or the editor(s) disclaim responsibility for any injury to people or property resulting from any ideas, methods, instructions or products referred to in the content.

