Abstract
Infrared multispectral imaging technology can achieve the long-distance, wide-ranging and fast detection of target gas, and has been widely used in the fields of dangerous-gas detection and environmental monitoring. However, due to the difficulty in acquiring background radiation as well as atmospheric disturbance and noise interference in the detection process, the quantitative detection of gas concentration has become a difficult problem to solve. Therefore, this paper proposes an inversion method for gas column concentration based on infrared multispectral imaging technology. Firstly, infrared background radiation images of the non-target gas absorption spectrum band were collected and converted into background radiation images of the target gas absorption spectrum band according to the dual-channel mapping relationship. Then, combined with the gas radiation images of the target gas absorption spectrum band, the column concentration distribution of the gas was obtained by using the measured calibration relationship between absorbance and column concentration. Experiments of gas detection in different environments were carried out, and the column concentration distribution of the target gas was inverted using this method; the results showed that the average relative error of the inversion of the gas column concentration was 4.84%, which enables the quantitative detection of gas column concentration in a complex environment.
1. Introduction
Infrared imaging gas detection technology has seen rapid development in recent years; it uses the infrared radiation absorption spectrum of gas to achieve qualitative and quantitative analyses of gas. With the advantages of long-distance, wide-ranging and rapid detection, as well as being dynamic and intuitive, it has been widely used in industrial production, environmental monitoring, national defense security and other fields [1,2,3,4,5]. Infrared imaging detection technology is mainly divided into two forms: active and passive. The active infrared gas imaging detection technology represented by the radiation absorption mode employing a laser light source has the advantages of a high signal-to-noise ratio, high detection sensitivity and no need for a temperature difference between the gas and background [6,7,8]. However, due to the limitations of the laser light source, it also has the disadvantages of a large volume, a narrow spectral detection range, few detectable gas types and low safety, which makes it limited in terms of practical application [9,10,11,12,13,14]. In contrast to this, passive infrared gas imaging detection technology is a new gas detection technology that has developed rapidly in recent years. Compared with the active method, passive infrared gas imaging detection technology has the advantages of simple structure, more types of detectable gases, no active light source, etc. However, it requires a temperature difference between the measured gas and the background and a low signal-to-noise ratio, making it suitable for gas detection under harsh environments and background temperature differences [15,16,17,18,19,20]. Currently, passive infrared gas imaging detection technology can be divided into hyperspectral imaging technology and multispectral imaging technology according to the number of detection bands.
Hyperspectral imaging technology can obtain the spatial and spectral information of gases, has the ability to detect the composition of mixed gases and can detect gas column concentration more accurately. However, it also has the limitations of a complex structure, a large volume and high cost [21,22,23,24]. Meanwhile, multispectral imaging technology is used to image and detect gases with absorption peaks through filters, and is widely used in the field of gas detection as it has the benefits of simple instrument structure, fast response and low cost [25,26,27,28]. Nowadays, there is more and more research on multispectral gas detection technology across the world. In 2017, Migual et al. developed a multi-aperture longwave-infrared multispectral imaging technique and uniquely combined, for the first time, the advantages of high throughput, real-time optimization and low cost. The applicability of this technique to the detection and classification of multiple gases is demonstrated [29]. The Gas Find IR thermal gas imager of the FLIR Company in the United States added a narrow-band filter covering the absorption peak of the target gas between the lens and the infrared focal plane. In order to improve the sensitivity of the imaging system, a variety of adjustable time integration modes were adopted, and a variety of infrared image-processing algorithms were used to achieve gas imaging detection in the narrow spectral band [30]. The above detection instrument can achieve good qualitative detection of gas leaks and distribution, but it cannot achieve the quantitative detection of gas column concentration, mainly because it is affected by the absorption of the target gas, and it is difficult to obtain accurate background radiation information.
Aiming to address the problems existing in multispectral infrared gas imaging detection technology, this paper proposes a dual-channel mapping–gas column concentration inversion method based on the multispectral imaging principle. Starting from the infrared spectrum absorption characteristics of the gas, considering the known target gas’s influence on the background radiation measurement, the background was imaged through the non-target gas absorption spectrum band. After twice mapping the gray level and temperature, the background gray level image was extracted and the gas column concentration was calculated via combination with the gas column concentration inversion method, and the inversion of gas column concentration by using multispectral imaging technology was achieved. The experimental results showed that the average relative error of this method was 4.84%, which solved the problem whereby existing multispectral infrared gas imaging detection technology faces difficulty in achieving the quantitative measurement of gas column concentrations in complex environments.
2. Method
2.1. Principle of Gas Column Concentration Inversion
When the multispectral infrared imaging system works, the radiation received by the detector unit, including the radiation of the background, target gas and atmosphere. Within a certain detection distance, the influence of the atmosphere on the radiation transmission process is relatively small. Therefore, the infrared radiation received by the detector mainly includes the radiation from the background and the radiation of the target gas [31]. The radiation energy received by the detector can be expressed as follows:
where is the gray level of the detector connected to the output; is the transmittance of the target gas; is the gray value corresponding to the background radiation; is the gray value corresponding to the target gas radiation; is the temperature of the background; and is the temperature of the target gas. According to Equation (1), the relationship between the gas absorbance and each radiation quantity is
where is the absorbance of the gas. According to Equation (2), the absorbance of the gas can be obtained if the background radiation, the target gas radiation and the radiation received by the detector are known. According to the Lambert–Beer law, the absorbance of the gas is closely related to the column concentration of the gas. Therefore, determining how to accurately obtain background radiation is the focus of gas column concentration inversion research.
2.2. Dual-Channel Mapping–Gas Column Concentration Inversion Algorithm Based on Multispectral Imaging
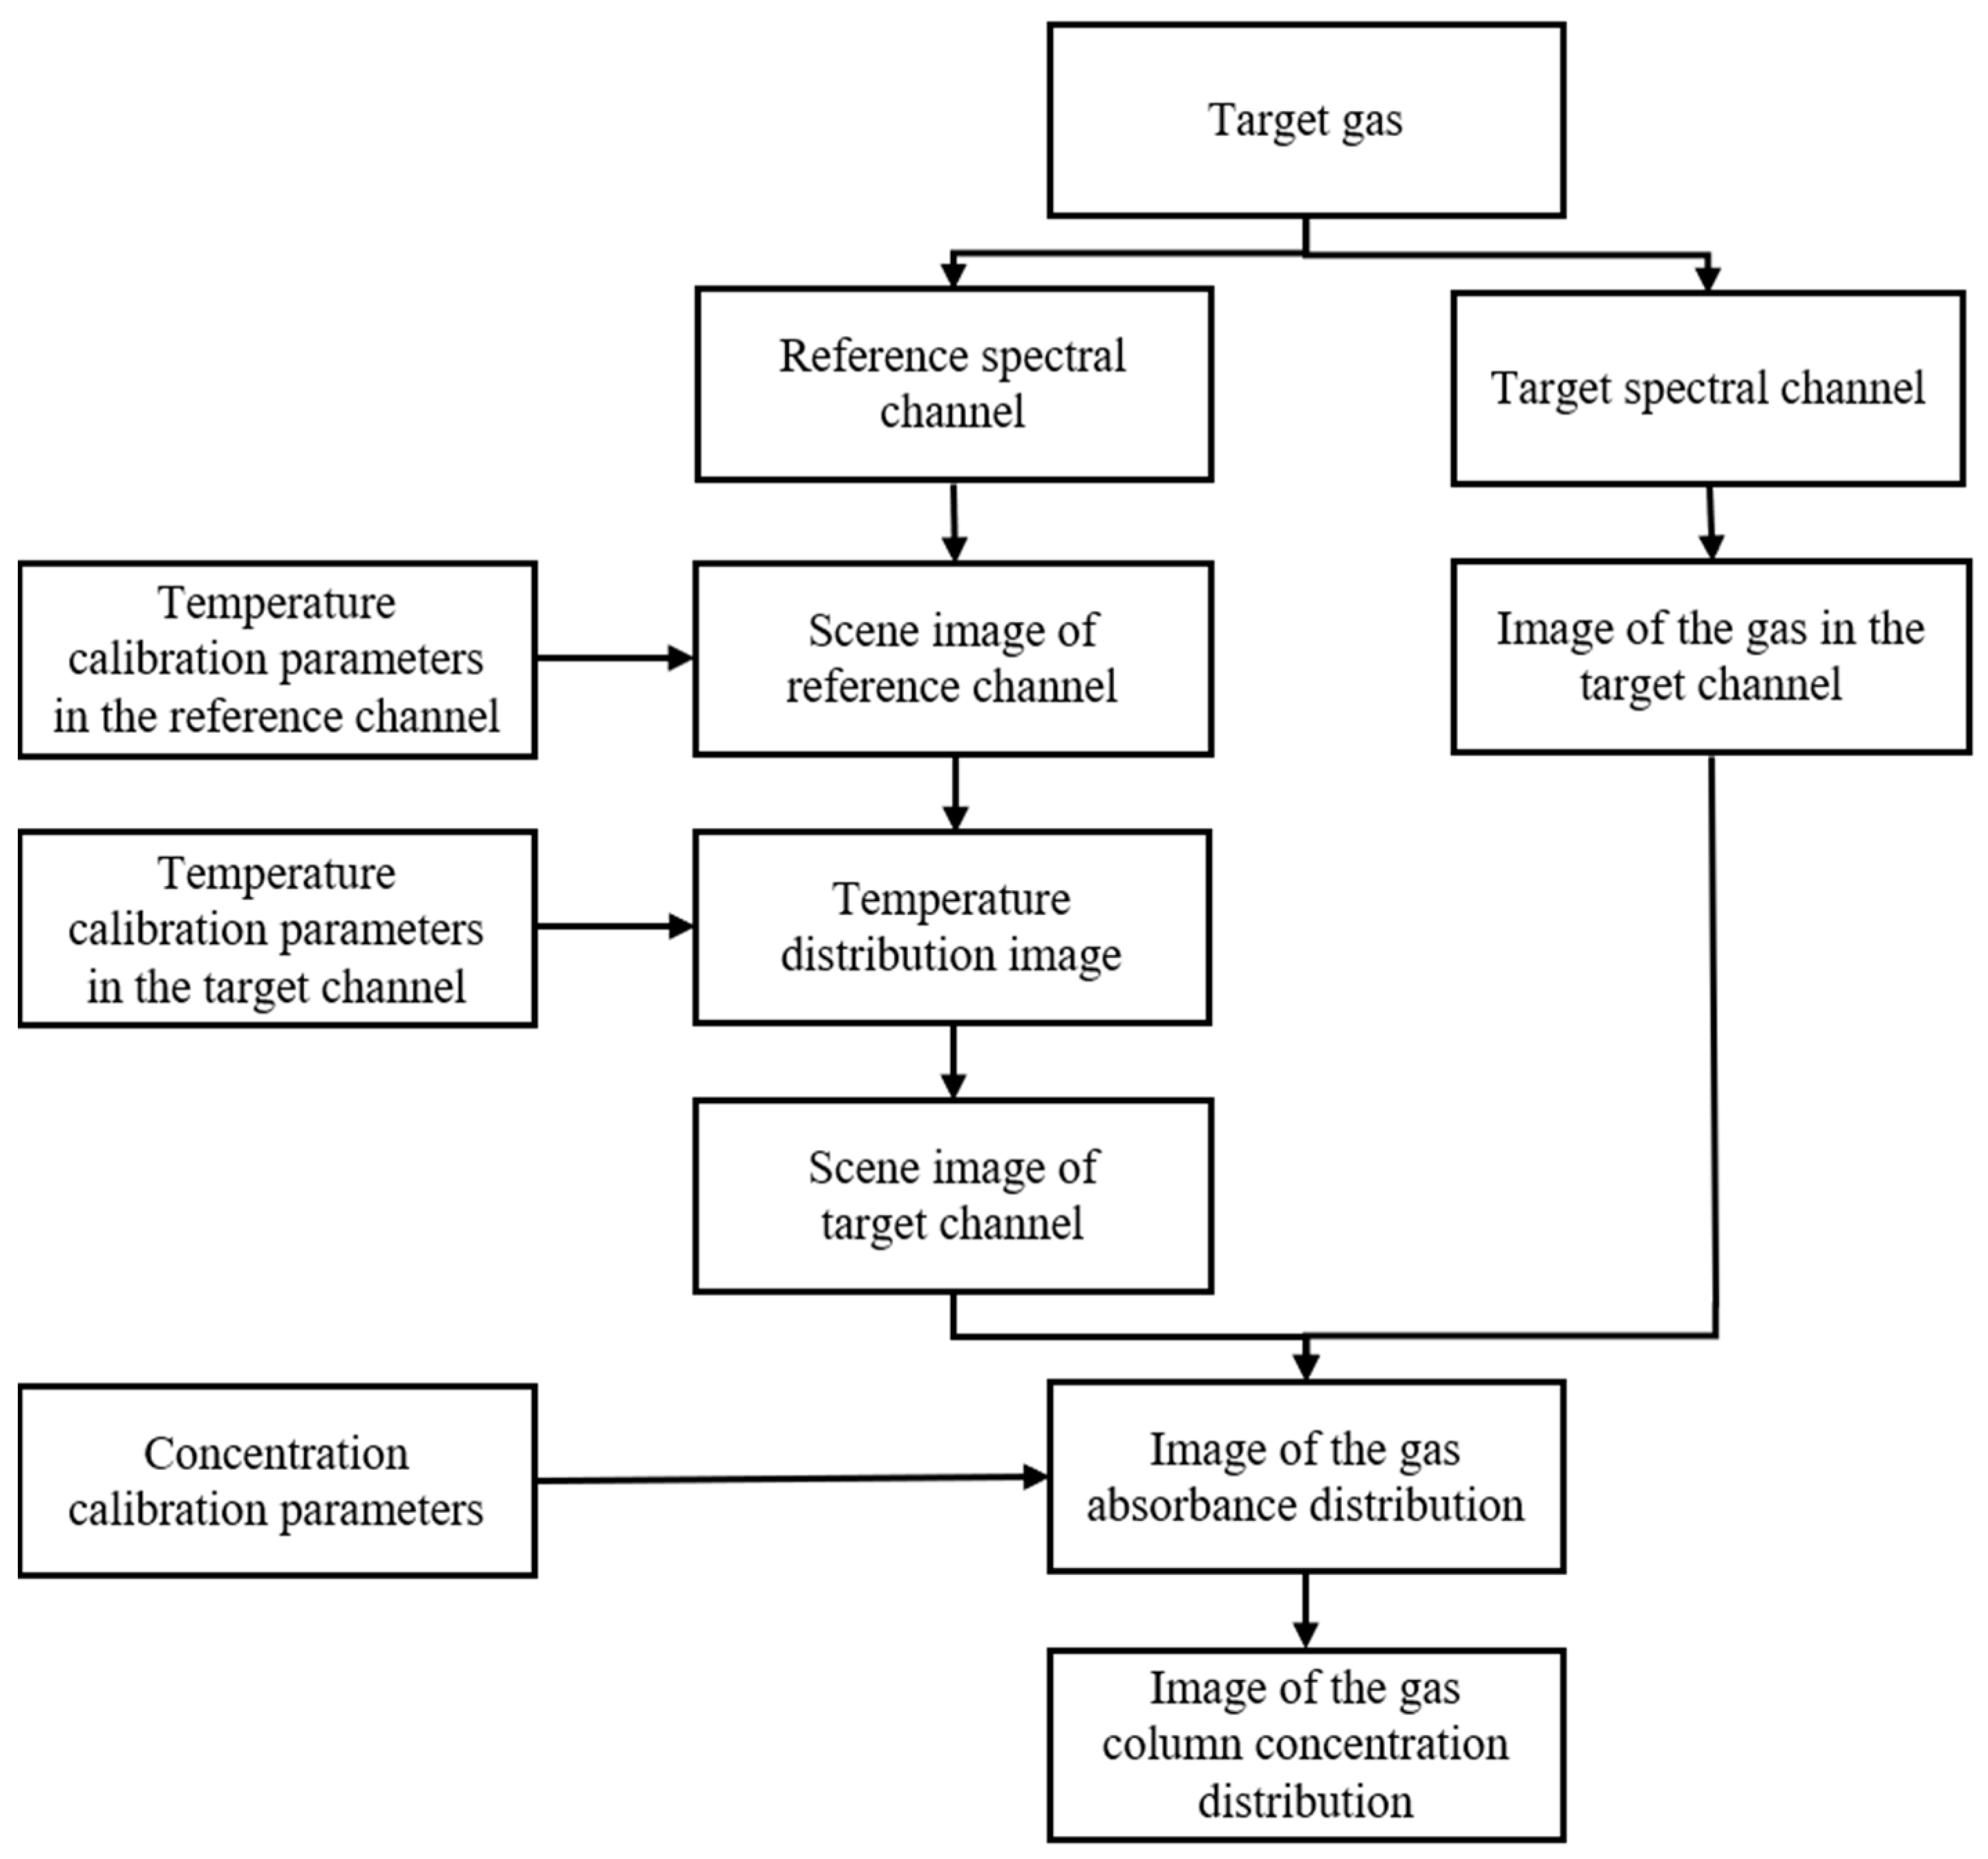
In order to solve the problem whereby background radiation is difficult to obtain in gas detection, a dual-channel mapping–gas column concentration inversion algorithm is proposed in this paper. In this algorithm, the absorption spectrum band of the target gas is taken as the target spectral channel, the absorption spectrum band of the non-target gas is taken as the reference spectral channel, and the target gas is imaged through two spectral channels, respectively. According to Equation (2), the absorbance of the gas can be obtained from the grayscale image of the target gas radiation and the grayscale image of the background radiation. Part of the background radiation will be absorbed after passing through the target gas, so the background radiation cannot be obtained by direct measurement. Therefore, we use the infrared absorption characteristics of the gas and the background radiation calibration curve to convert the background gray image of the reference spectral channel into a background temperature image and, finally, into a background grayscale image of the target spectral channel. A schematic diagram and flow chart of this method are shown in Figure 1 and Figure 2.
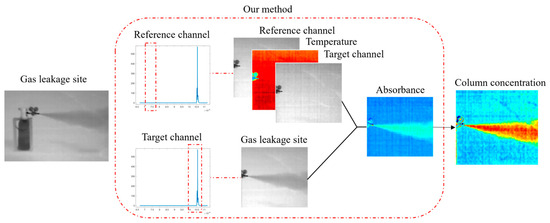
Figure 1.
Schematic diagram of gas column concentration inversion.

Figure 2.
Flow chart of gas column concentration inversion.
The gray level information output by the detector can be expressed as [32,33]
where is the output gray value of the detector; is the pixel area of the detector; is the F-number of the optical system; is the number of photons per unit energy in the narrow band with a wavelength of ; is the quantum efficiency of the detector; is the integration time of the detector, and are the first and second radiation constants, respectively (according to research, it is known that and [34]); and is the temperature of the object. In the spectral range , the surface source blackbody under different temperatures is imaged several times, and the calibration function can be obtained by combining the temperature of the blackbody and the output signal of the detector . All the constants in Equation (3), except and , are constant. When and are relatively close, Equation (3) is simplified. When the background temperature is , the grayscale image of background radiation under the target spectral channel is
where , and are the three parameters obtained after fitting. If we switch the spectral channel to the reference spectral channel, similarly, the background radiation gray level image is
where , and are the calibration parameters under the reference spectral channel, respectively. can be expressed as follows according to Equations (4) and (5):
Because the spectral band where is refers to the reference spectral channel, the acquisition of is not affected by the target gas. Equation (6) can obtain the background gray image under the target spectral channel which is not affected by the target gas. According to Equations (2) and (6), the absorbance of the gas can be calculated. In order to deduce the column concentration of the gas through the absorbance of the gas, it is necessary to confirm the conversion relationship between gas column concentration and absorbance. Within the target spectral channel range, by measuring the absorbance at different gas column concentrations, the relationship curve between the absorbance and column concentration of target gas can be obtained; the absorbance–column concentration curve of gas is expressed as a quadratic function as
where , and are the three parameters obtained after fitting, and is the column concentration of the gas. According to Equation (7), the corresponding column concentration can be obtained by inverting the absorbance within the wavelength . By combining Equations (2) and (7), the conversion formula of gas column concentration and absorbance can be obtained. When the temperature of the gas and the column concentration of the gas are low, the radiation amount of the gas can be ignored. Finally, the relationship between the gas column concentration and absorbance can be expressed as
3. Experimental Verification
In order to achieve the inversion of the gas column concentration, calibration and test experiment platforms were built, the background radiation mapping relationship between the two spectral channels was established, and the corresponding relationship between the absorbance of the target gas and the column concentration was established, and the gas column concentration inversion experiment was carried out.
3.1. Dual-Channel Background Radiation Mapping Experiment
In order to eliminate the influence of target gas on background imaging during column concentration inversion, a two-channel background radiation mapping method is proposed in this paper. A background radiation image acquisition platform was built, as shown in Figure 3, which mainly included a radiation source with stable, uniform and controllable background radiation; a filter wheel that provides spectral range switching; and an optical imaging system composed of an optical lens and a detector. In the experiment, dual-spectral band imaging of the radiation source was achieved by rotating the filter wheel. The radiation source was INFRAMET’s blackbody MTB-6D, and the filter wheel was an FW102C from THORLABS in the United States. The field of view of the optical imaging system was 40° and the F number was 1. The detector used was an uncooled vanadium oxide detector from the Wuhan Guide Company, with a resolution of 640 × 512, a pixel size of 17 μm and a working spectral band of 7~14 μm. We chose SF6, which has a wide range of applications and high safety, as the experimental target gas. According to the rovibrational spectrum of SF6, the absorption peak of SF6 is at 10.56 μm; therefore, in order to fully cover the absorption peak of SF6, a filter with a transmission spectrum range of 9.9~11.45 μm was selected as the target spectral channel, and we selected a filter with transmission band of 7~8.75 μm, which is almost not absorbed by SF6, as the reference spectral channel.
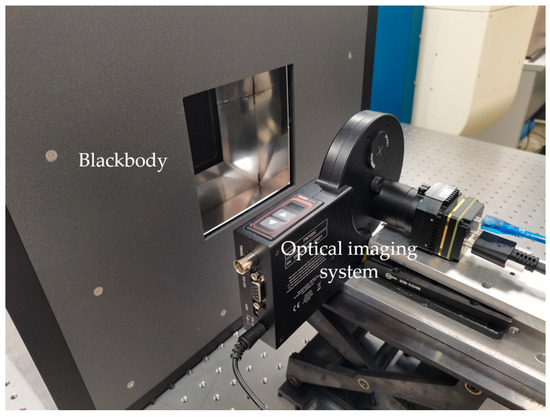
Figure 3.
Dual-channel background radiation mapping experiment.
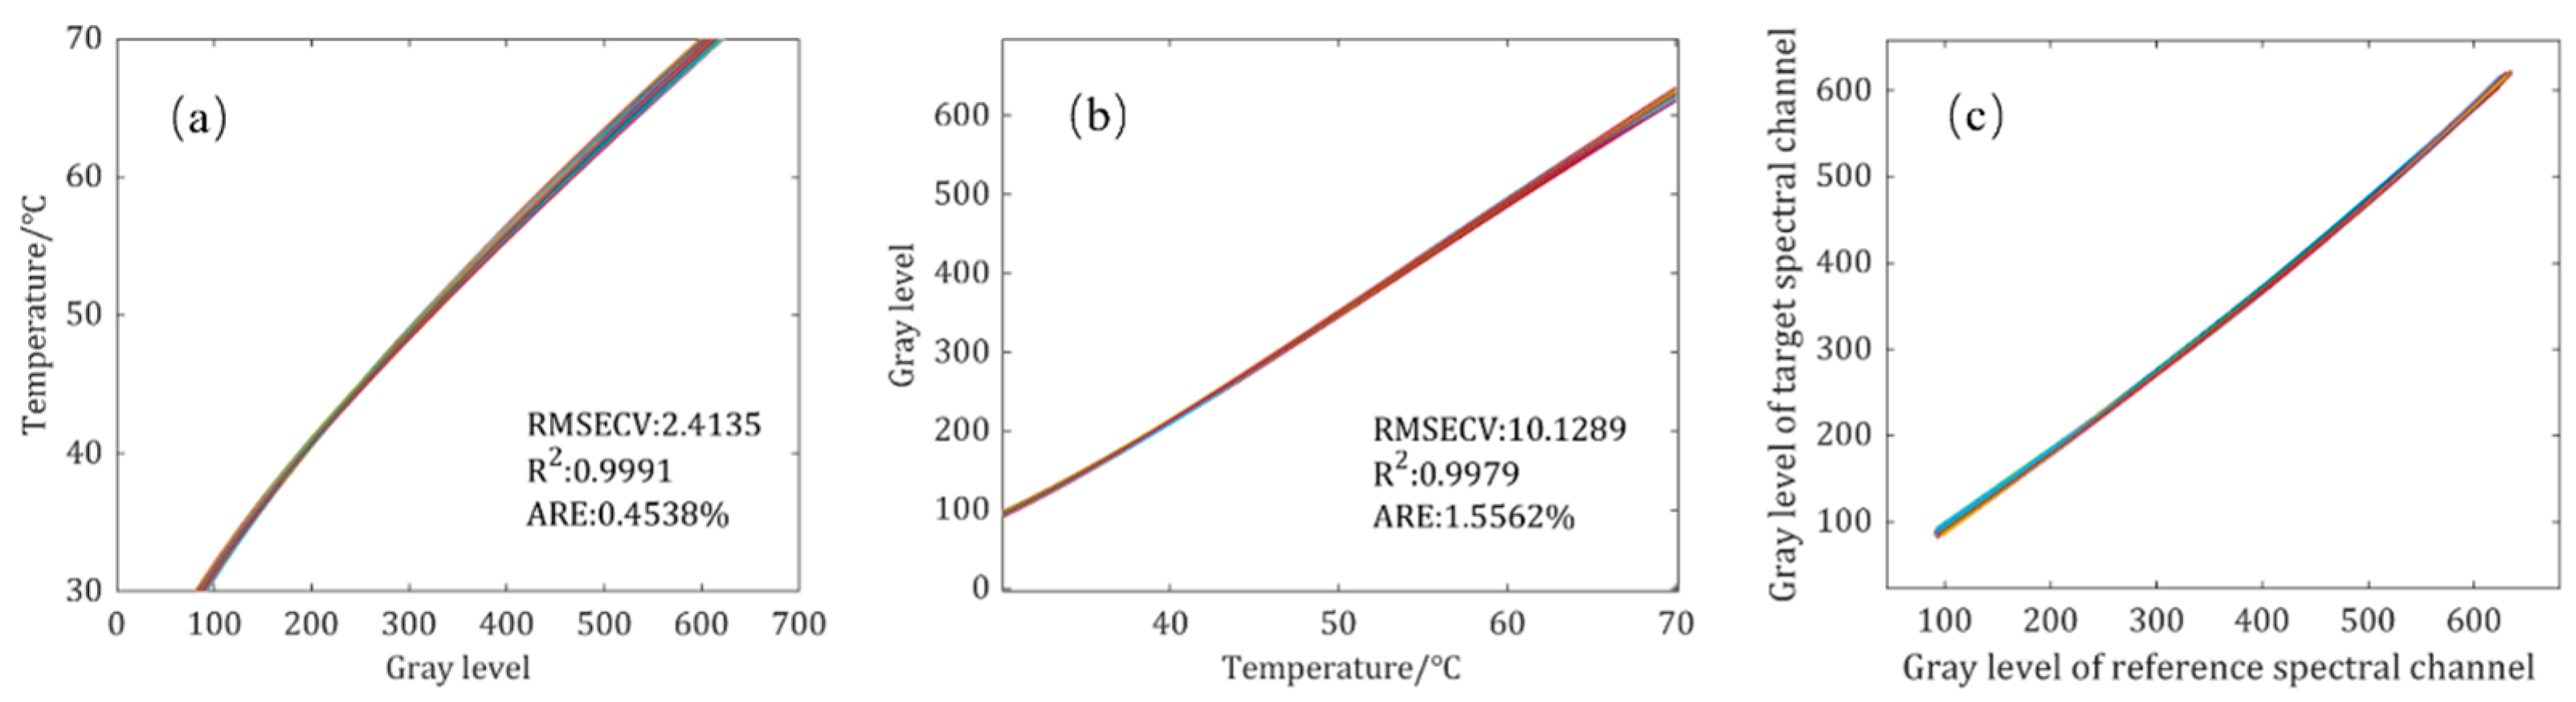
In order to obtain the mapping relationship between the background gray values under the target spectral channel and the reference spectral channel, the temperature of the surface source blackbody was set to 30 °C, 40 °C, 50 °C, 60 °C and 70 °C, successively, and the surface source blackbody was imaged through the target spectral channel and the reference spectral channel. The temperature of the surface source blackbody and the gray value output by the detector underwent calibration using least squares method. The pixels of the uncooled detector will accumulate noise in the working process, which will also result in the output gray value being offset. In order to eliminate the impact of noise on the calibration accuracy, the gray image of the surface source blackbody and the low-temperature TEC (Thermoelectric Cooler) were collected by way of low-temperature correction, and the gray value difference was used as the surface source blackbody radiation at this temperature. Since each pixel in the detector has a different response to the same blackbody radiation, each pixel needs to be calibrated and fitted separately, as shown in Figure 4a,b. Figure 4a is a temperature–gray level calibration curve of the reference spectral channel, and Figure 4b is a gray level–temperature calibration curve of the target spectral channel. For convenience of display, the calibration curve of 20 × 30 pixels in the central region of the detector is selected in these two figures, and the following parameters are analyzed by taking the mean of all pixels. Under different spectral channels, the fitting determination coefficients R2 of the calibration curves between the detector output gray level and blackbody temperature are 0.99912 and 0.9979, the average relative errors (AREs) are 0.4538% and 1.5562% and the Root-Mean-Square Errors of Cross-Validation (RMSECVs) are 2.4135 °C and 10.1289 gray level, indicating that both calibration curves have high fitting accuracy. According to the calibration curves under the two spectral channels, the gray mapping relationship between the two spectral channels was obtained, as shown in Figure 4c. The background gray image under the reference channel can be mapped to the gray image under the target spectral channel through the calibration curve.
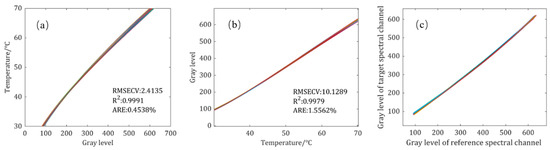
Figure 4.
Background radiation calibration curve. (a) Temperature–gray level value calibration curve of reference spectral channel; (b) gray level–temperature calibration curve of target spectral channel; (c) dual-channel gray value mapping calibration curve.
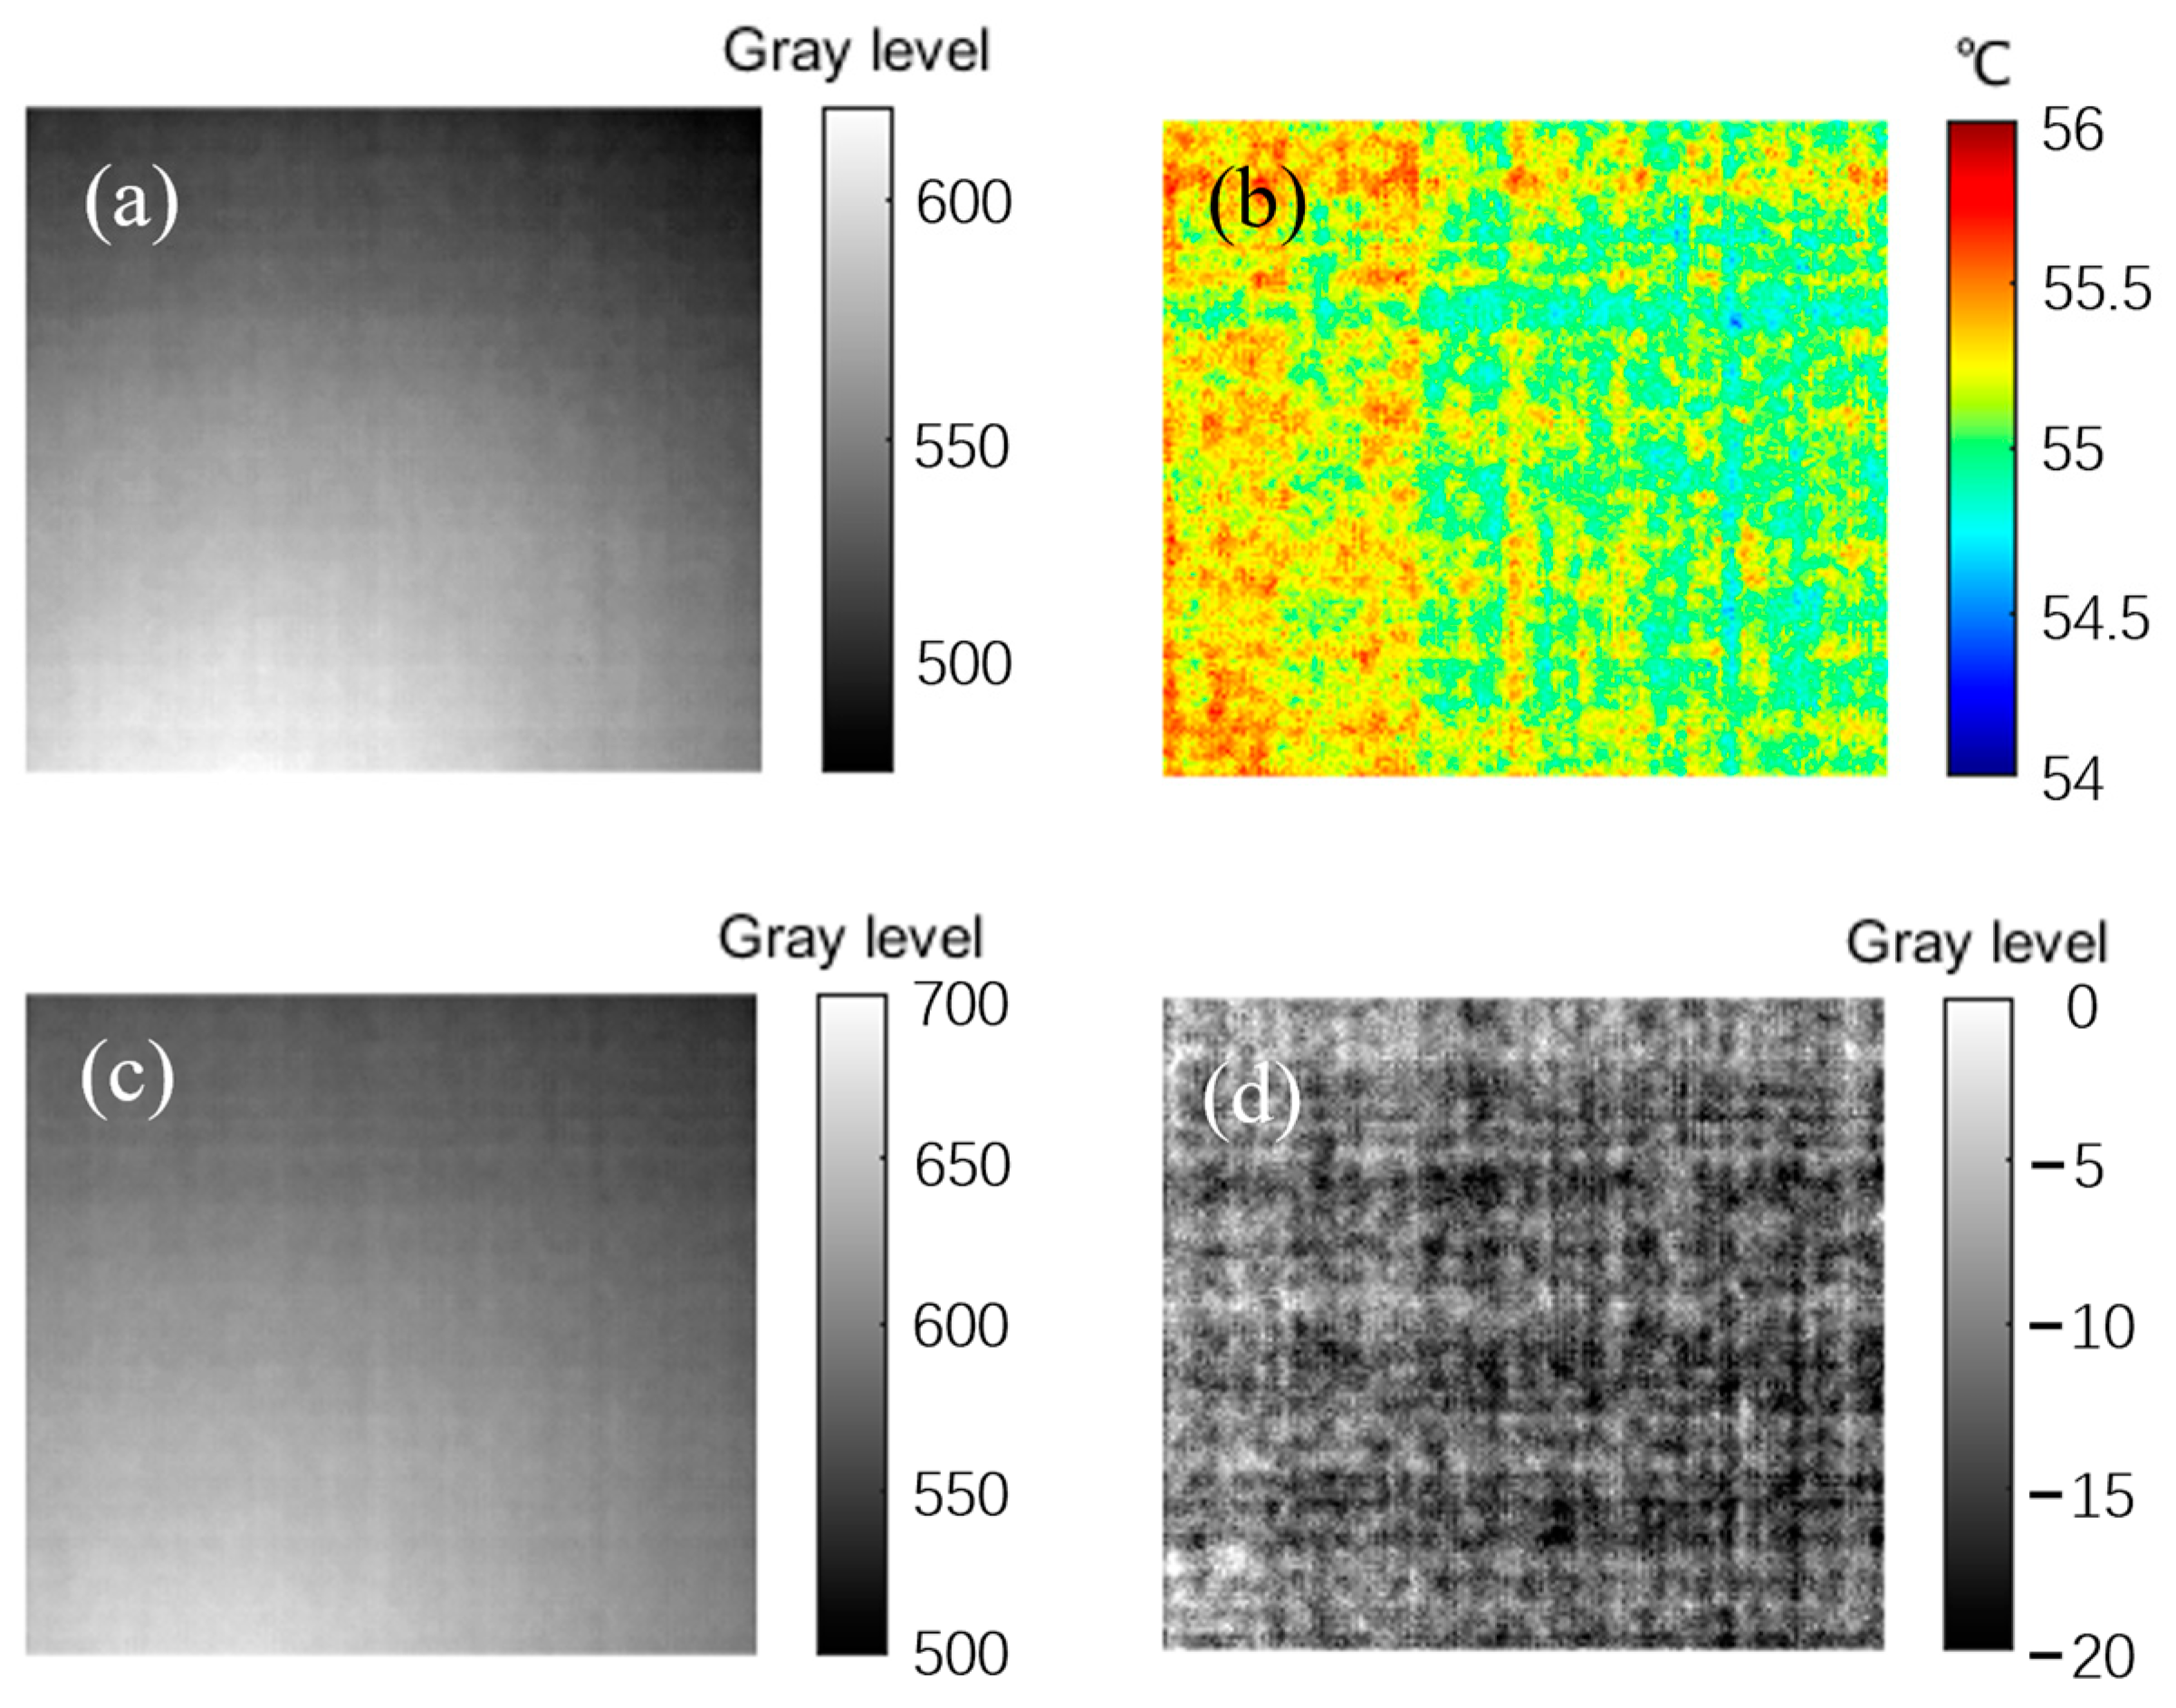
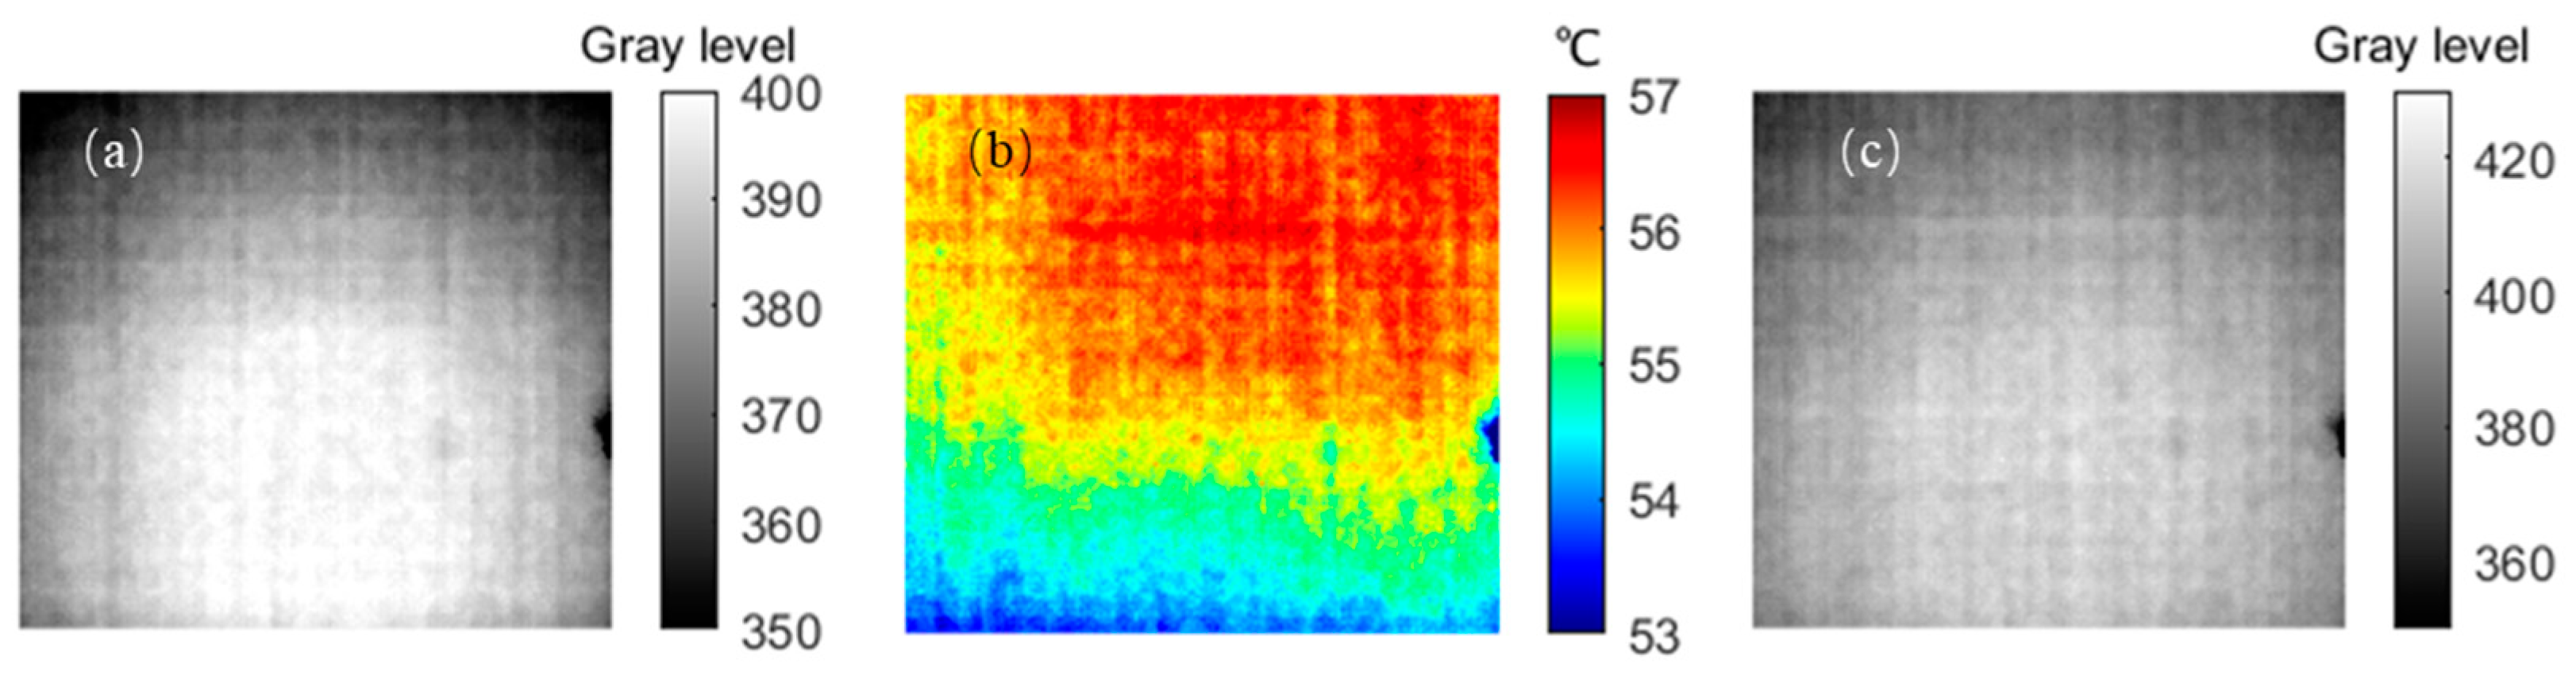
We analyzed the error of the dual-channel background radiation mapping, set the blackbody temperature to 55 °C and collected the blackbody gray images under the target spectral channel and the reference spectral channel, respectively. Through the mapping relationship, the blackbody temperature distribution image and the blackbody gray image under the target spectral channel could be obtained. We calculated the difference between the mapped blackbody grayscale image and the blackbody grayscale image actually captured through the target spectral channel, and the smaller the difference, the higher the mapping accuracy. The mapping results are shown in Figure 5 and Table 1. Figure 5a is the blackbody grayscale image captured through the reference spectrum channel, Figure 5b is the mapped temperature distribution image, Figure 5c is the mapped blackbody grayscale image and Figure 5d is the gray value difference image. The values of the temperature distribution image and the gray value difference image are evenly distributed, the error of the temperature distribution image is about 0.3%, the average of the temperature distribution image is 55.138 °C, and the difference error of the gray image is about 1.9%, indicating that the mapping has high precision.

Figure 5.
Background radiation conversion experiment verification results. (a) Background gray image captured through the reference spectrum channel; (b) mapped temperature distribution image; (c) mapped background gray image; (d) gray value difference image.

Table 1.
Precision of background radiation conversion.
3.2. Column Concentration Parameter Fitting Experiment
The experimental setup for gas column concentration calibration is shown in Figure 6.
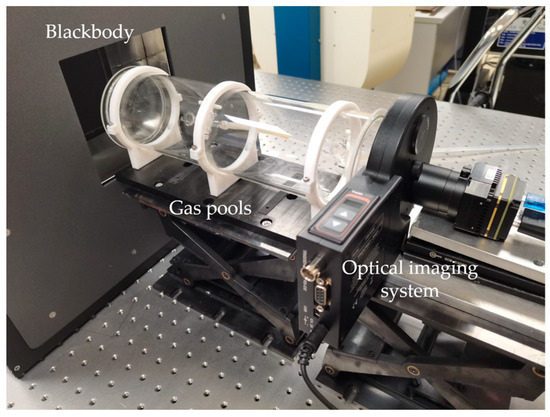
Figure 6.
Column concentration calibration experimental device.
Based on the dual-channel background radiation mapping experiment, to the column concentration calibration system, we added a gas pool with a length of 30 cm to constrain the gas to be measured. During the experiment, the blackbody temperature was kept constant, and different concentrations of gas were injected into the gas pool. The detector passed through the target gas radiation and the gas pool to image the blackbody, and the absorbance of the gas under different column concentrations was obtained through the grayscale image. After fitting the calibration curve of gas absorbance–column concentration, the calibration parameters were obtained.
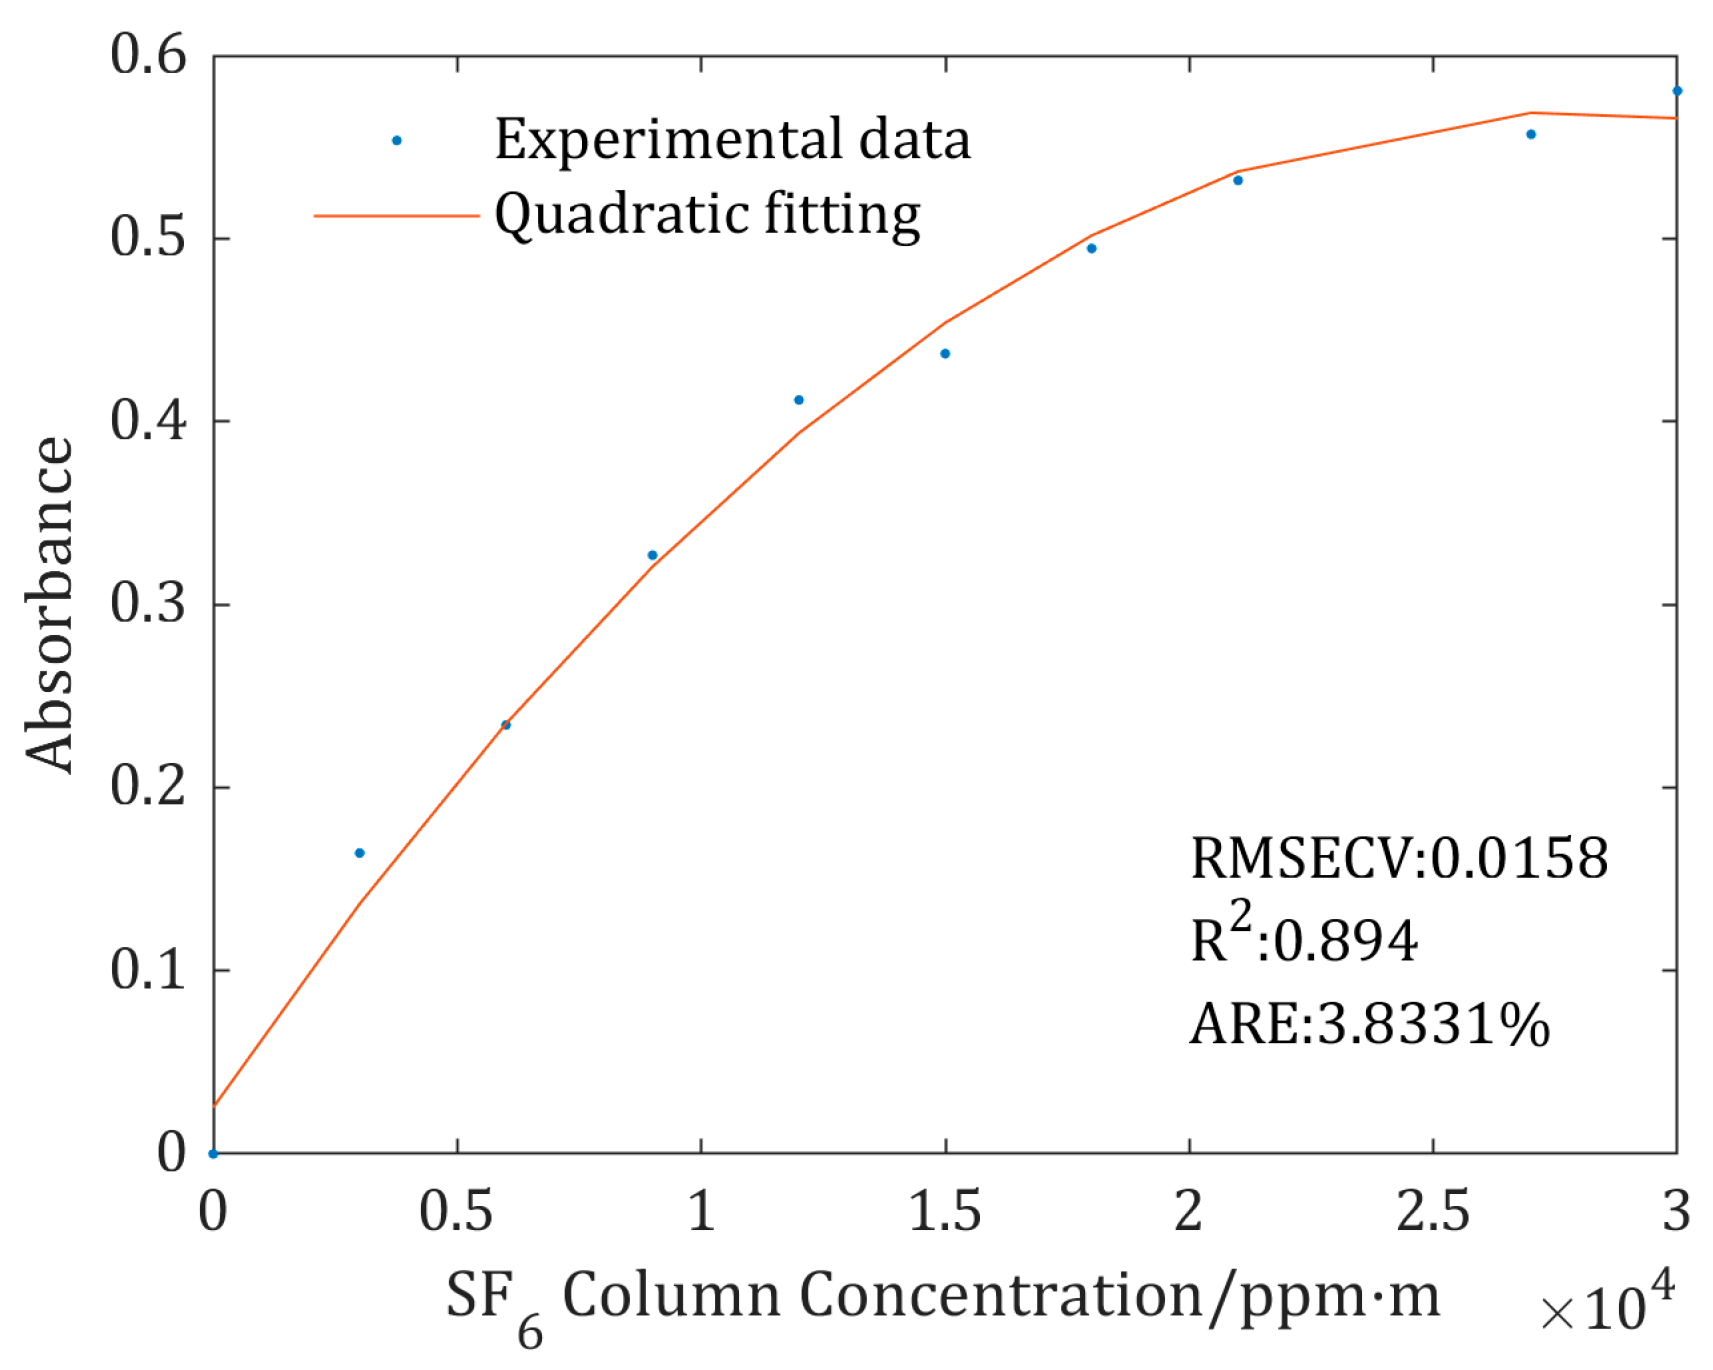
Under standard atmospheric pressure, SF6 of different concentrations was introduced, the absorbance of ten different column concentrations of gas, ranging from 3000 to 30,000 ppm·m, was measured, and the fitting calibration parameters , and were obtained. The calibration curve of SF6 gas absorbance–column concentration is shown in Figure 7. The fitting determination coefficient R2 of the absorbance–column concentration calibration curve is 0.894, the average relative error (ARE) is 3.8331% and the Root-Mean-Square Error of Cross-Validation (RMSECV) is 3.8331.

Figure 7.
Absorbance–column concentration calibration curve.
Due to the length limitation of the gas pool, the upper limit of the gas column concentration in the calibration curve is 30,000 ppm·m, this column concentration can already meet most usage needs. In order to invert SF6 with a column concentration above 30,000 ppm·m, calibration can be performed on SF6 gases with higher column concentrations. Although the absorbance of the SF6 is close to saturation at 30,000 ppm·m, this method is still effective within a certain range beyond 30,000 ppm·m, but the accuracy may be reduced.
3.3. Column Concentration Inversion under Different Environments
3.3.1. Inversion of Gas Column Concentration under a Stable Environment
Under relatively stable conditions in the laboratory, a gas column concentration inversion experiment was carried out with the surface source blackbody as the background. The experimental equipment is shown in Figure 8.
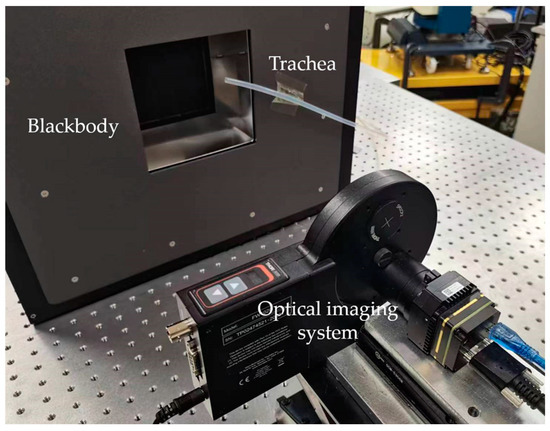
Figure 8.
Experimental device for inversion of gas column concentration in the laboratory.
During the experiment, the surface source blackbody was adjusted to 55 °C, and SF6 gas with 99.99% concentration was released between the surface source blackbody and the imaging system through the gas path. The gray level image of the target scene was obtained through the reference spectral channel when the SF6 gas was released, and a background temperature image and a background gray level image under the target spectral channel were obtained by combining the mapping relationships. As shown in Figure 9, Figure 9a is the grayscale image under the reference spectral channel, and because it is not affected by SF6 gas in the reference spectral channel, the gas distribution cannot be observed; Figure 9b is the temperature distribution image; and Figure 9c is the grayscale image under the target spectral channel obtained through mapping.

Figure 9.
(a) Gray image of reference spectral channel; (b) temperature distribution image; (c) gray image of inversion.
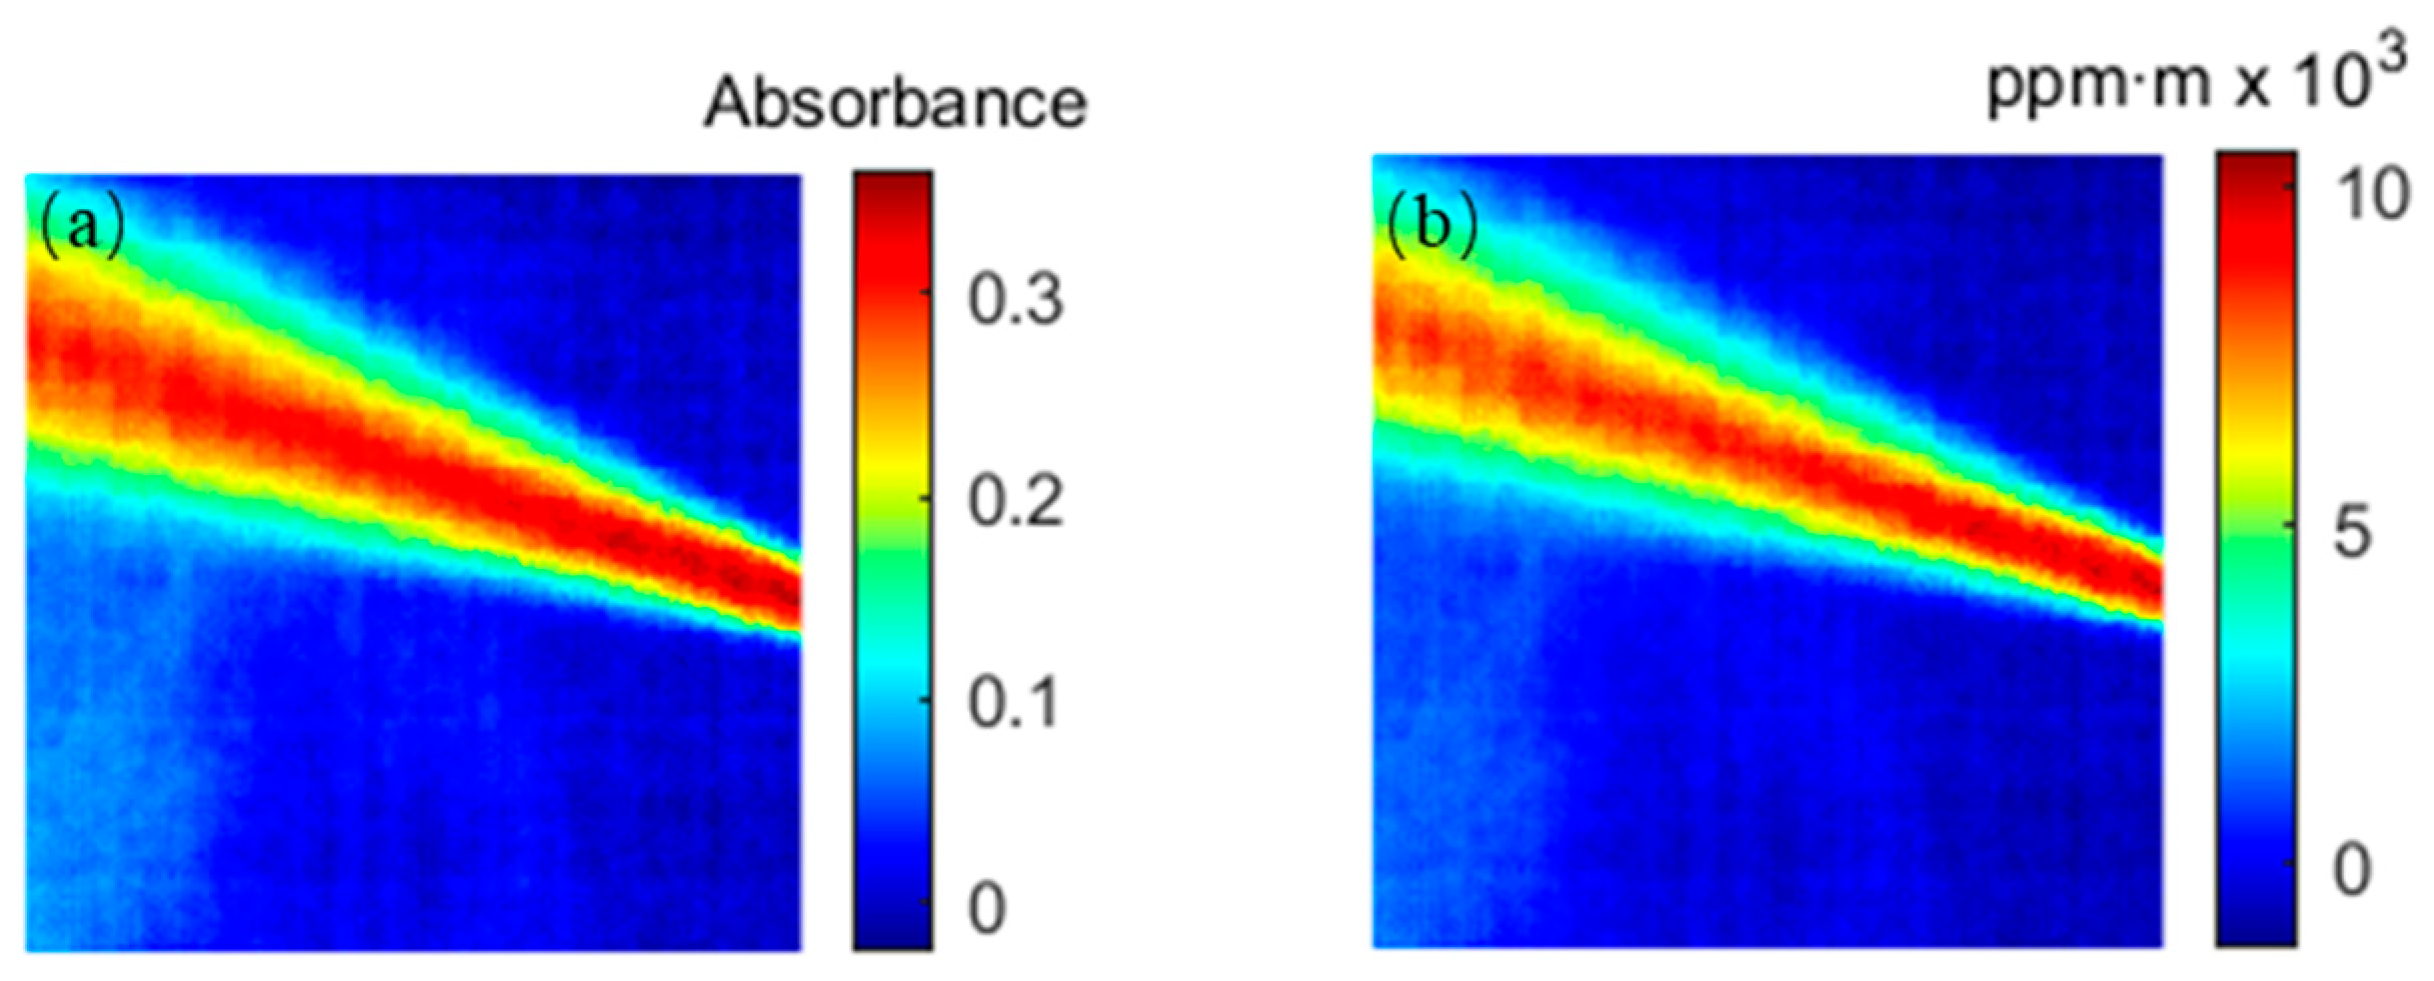
The absorbance distribution of the target gas can be calculated according to the gray image of the gas under the target spectral channel and the gray image of the background radiation obtained by mapping. We inserted the absorbance distribution into the calibration curve of the gas column concentration to invert the gas column concentration distribution. The results are shown in Figure 10, where Figure 10a is the absorbance distribution image and Figure 10b is the column concentration distribution image. From the column concentration distribution image obtained from the inversion, it can be clearly seen that the column concentration of the target gas shows a distribution trend of being high in the middle and low at both ends. The measured gas distribution accords with the result of Gaussian distribution fitting, and the background absorbance and column concentration outside the target gas are close to 0. The gas path diameter of the released gas is 8 mm, the concentration of the released gas is approximately 100% and the pressure of the exhaust port is about 0.125 mpa. Therefore, when the gas is released into the atmosphere and the pressure is reduced, the column concentration of the gas is about 9871.67 ppm·m, and the peak of the column concentration obtained by inversion is 10,258 ppm·m, with a relative error of 3.9%. The inversion results are relatively close to the actual situation and have good inversion accuracy.
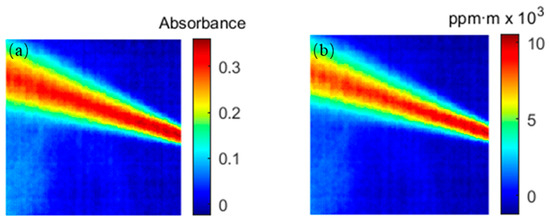
Figure 10.
(a) Absorbance distribution image; (b) column concentration distribution image.
3.3.2. Inversion of Gas Column Concentration under a Dynamic Environment
In order to verify the inversion effect of this method in an actual environment, an outdoor gas column concentration inversion experiment was set up. The experiment was carried out on a sunny day with a high outdoor temperature, and the experimental scene is shown in Figure 11. SF6 gas with 99.99% concentration in the gas cylinder was directly released into the atmosphere, and the concentration distribution of the gas column was retrieved using the above method.
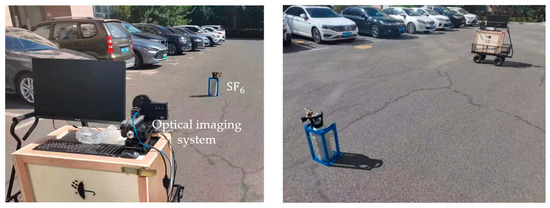
Figure 11.
Outdoor gas column concentration inversion experiment.
Figure 12 is a grayscale image under different channels during the operation of the exhaust in the experiment, and Figure 12a,b are gas release images of the target spectral channel and the reference spectral channel, respectively. In the image of the target spectral channel, the gas leakage position and its diffusion in the atmosphere can be observed. Since the experimental environment was outdoors and the gas diffusion was fast, the gas column concentration at the gas cylinder exhaust port was relatively high, and the gas column concentration decreased with an increase in diffusion distance. Compared with the target spectral channel, in the grayscale image under the reference spectral channel, we cannot observe the gas at all, indicating that the background image under the reference spectral channel is not affected by the target gas.
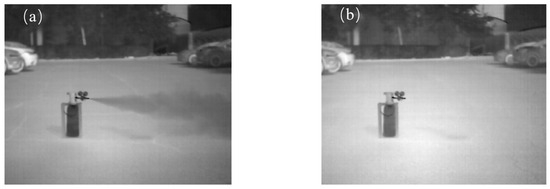
Figure 12.
(a) Image under the target spectral channel; (b) image under the reference spectral channel.
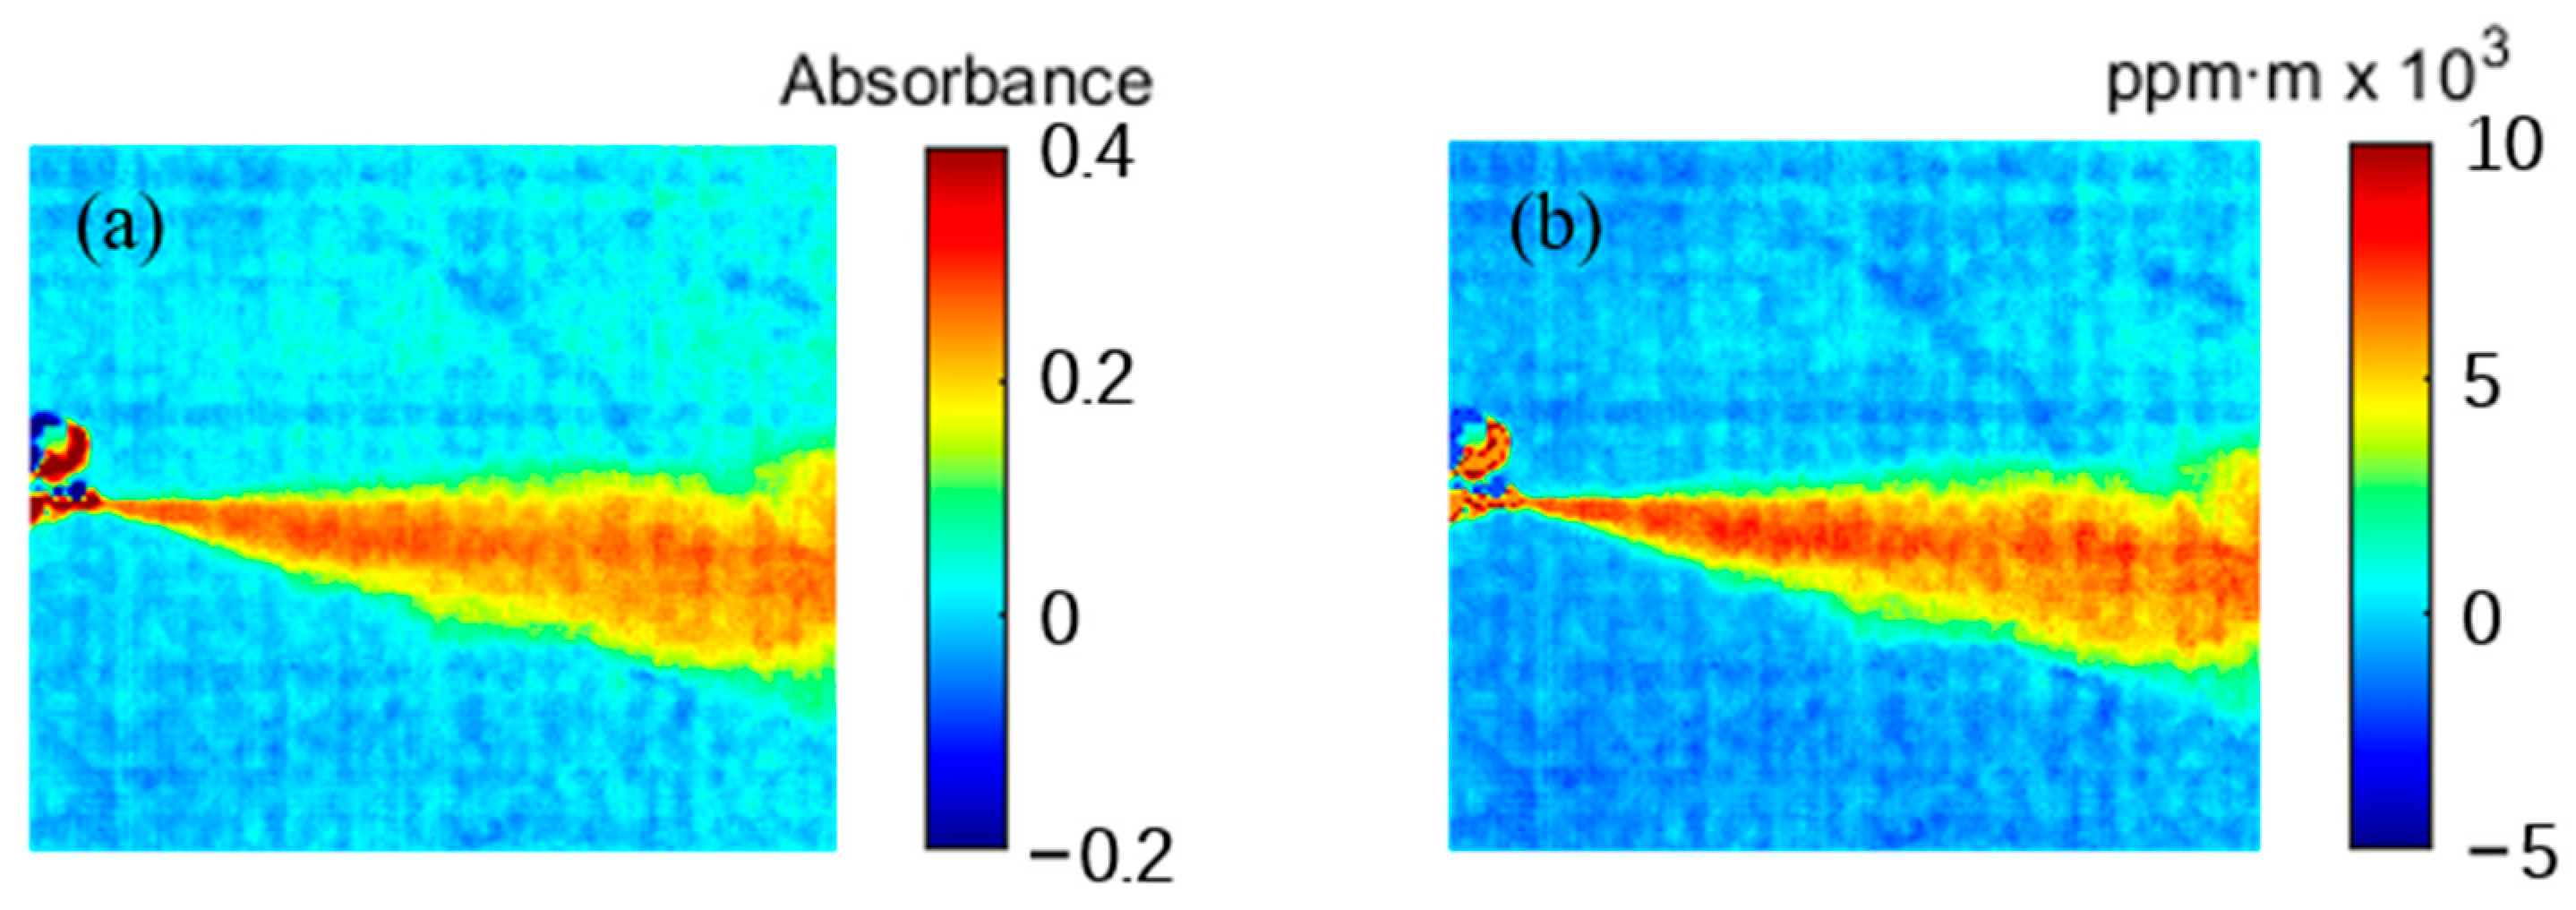
The background gray image under the target spectral channel was obtained by mapping the gray image under the reference spectral channel. The absorbance distribution image of the gas was calculated in combination with Figure 12a. The absorbance distribution image was substituted into the column concentration calibration parameters to obtain a column concentration distribution image of the gas, as shown in Figure 13a. Figure 13b is the column concentration distribution image. In Figure 13b, the maximum value of the gas column concentration is 7579.8 ppm·m, and the gas column concentration is close to 0 in the background part without gas.

Figure 13.
(a) Image of absorbance distribution; (b) image of column concentration distribution.
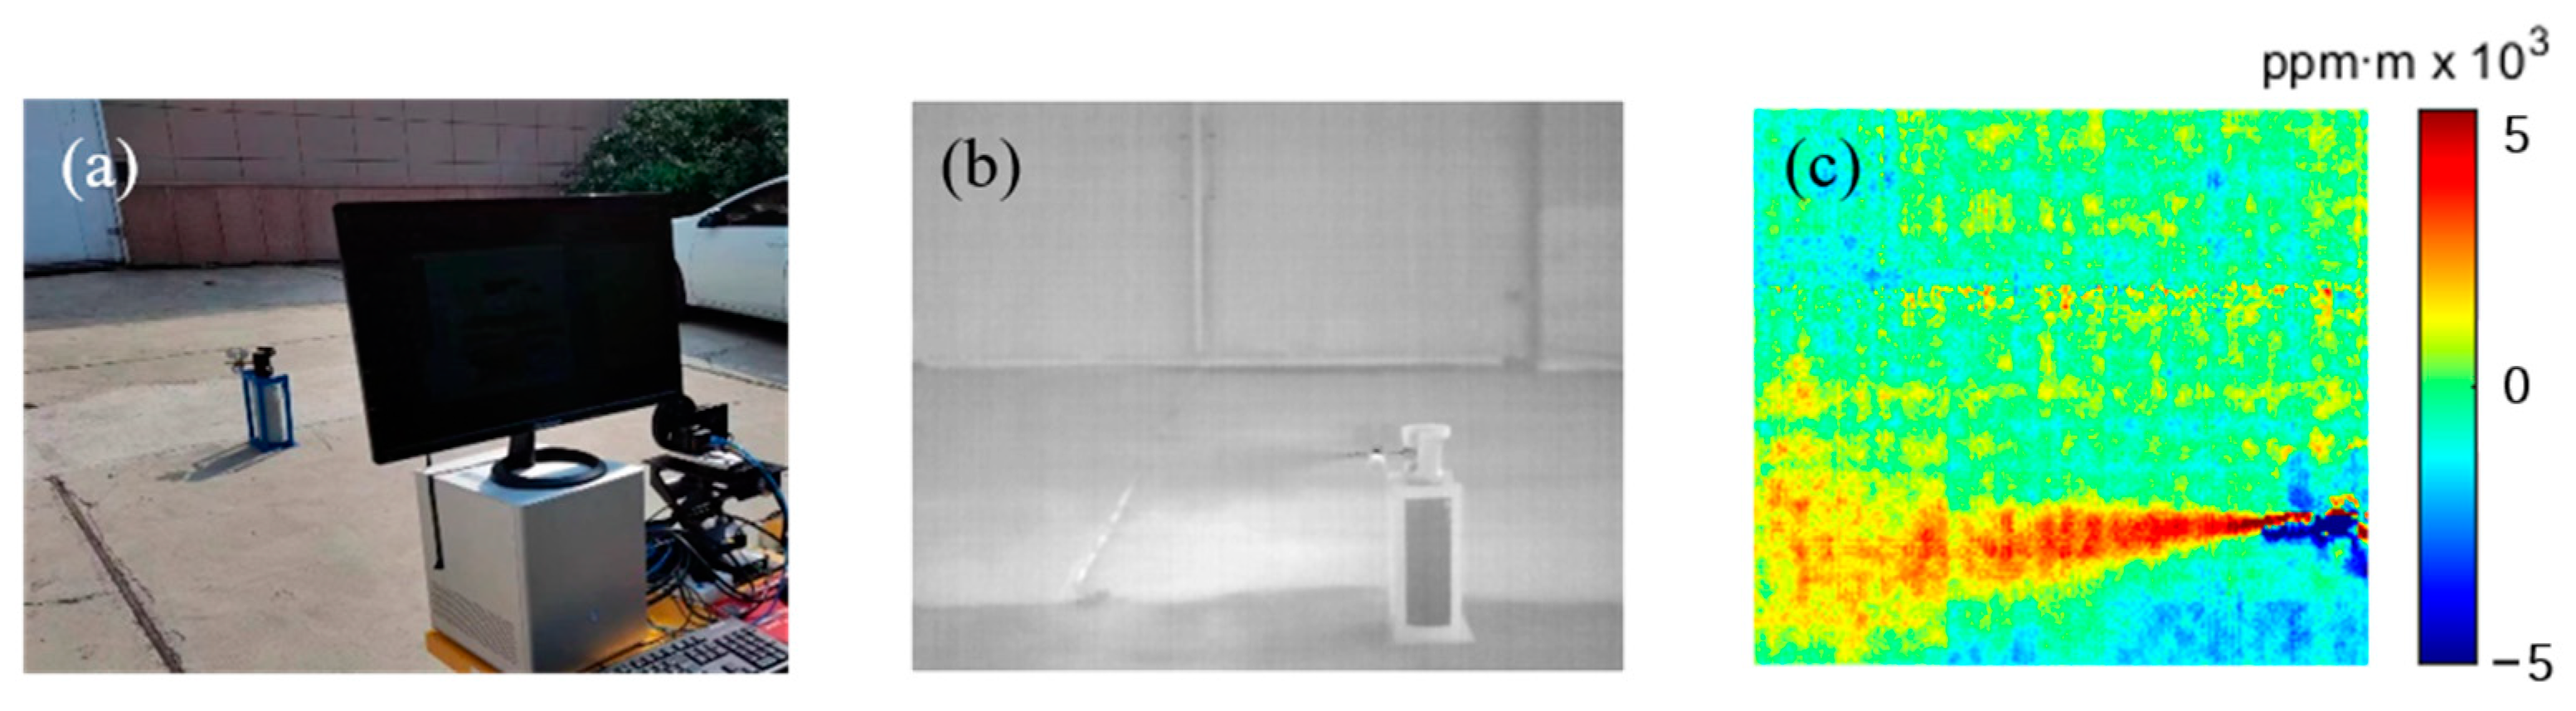
The applicability of this method under different conditions was verified by repeating the experiments in different environments. Different scenes were selected as the gas release background, and the flow rate of gas released from the gas cylinder was reduced. The experimental results are shown in Figure 14, where Figure 14a is the experimental scene, Figure 14b is the gas release image and Figure 14c is the gas column concentration inversion image. The background of the experiment was an asphalt pavement, the temperature was 51.9 °C and the maximum value of gas column concentration was 6810 ppm·m. In the gas column concentration distribution image, it can be clearly distinguished that the gas column concentration was high in the middle and low at both ends.
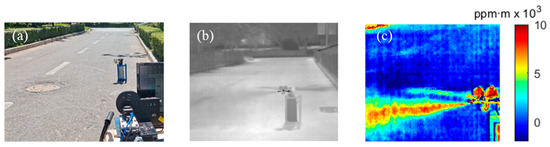
Figure 14.
(a) Experimental scene; (b) gas release image; (c) gas column concentration inversion image.
In order to test the inversion effect of the system under a relatively low-temperature background, the background was replaced with a cement pavement with a lower temperature of 42.3 °C, and the gas release was further reduced. The inversion results are shown in Figure 15, where Figure 15a is the experimental scene, Figure 15b is the gas release image and Figure 15c is the gas column concentration inversion image. As the temperature difference between the gas and the background decreases, the system is limited by the performance of the uncooled detector, and the inversion image is fuzzy, but the column concentration distribution of the gas can still be distinguished. The peak of the gas column concentration is 4587 ppm·m. It can be inferred from the experimental results that the inversion effect decreases with a decrease in the background temperature and gas column concentration.
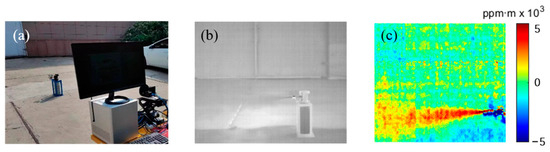
Figure 15.
(a) Gas release experimental scene; (b) gas release image of target spectral channel; (c) gas column concentration inversion image.
The Adaptive InfraRed Imaging Spectro radiometer (AIRIS) from Physical Science Corporation (PSI) in the United States can achieve a detection limit of 1000 ppm·m for methane gas when the temperature difference between the background and target is greater than 2 K [35]. This system is lower than this method on the detection line, mainly due to the high noise of uncooled detectors, and when the column concentration of the target gas is too small, it will be submerged in the noise. Therefore, improving the sensitivity of the detector in this method can effectively improve the detection sensitivity of the system.
4. Error Analysis
In the gas column concentration inversion experiment, the gas escaped rapidly under the influence of the atmosphere, and it was difficult to calculate the specific optical path of the gas at a certain position, so the accuracy of the inversion method could not be evaluated. In order to obtain the accuracy of gas column concentration inversion, the error of gas column concentration inversion was analyzed using a dual-channel mapping error analysis experiment and a gas column concentration inversion error evaluation experiment.
4.1. Dual-Channel Mapping Error Analysis Experiment
In the inversion process, dual-channel background radiation mapping is affected by many factors, such as calibration error, atmospheric change and detector noise. All of these factors become the main sources of error in the inversion process, which far outweigh the influence of other steps. Therefore, the accuracy of the background gray image obtained by the dual-channel background radiation mapping reflects the accuracy of the gas column concentration inversion to a certain extent. By using the gas column concentration inversion experimental platform, the background gray image taken when the target gas was not released was compared with the mapped background gray image to determine the accuracy of the dual-channel background radiation mapping. The comparison results are shown in the following figure.
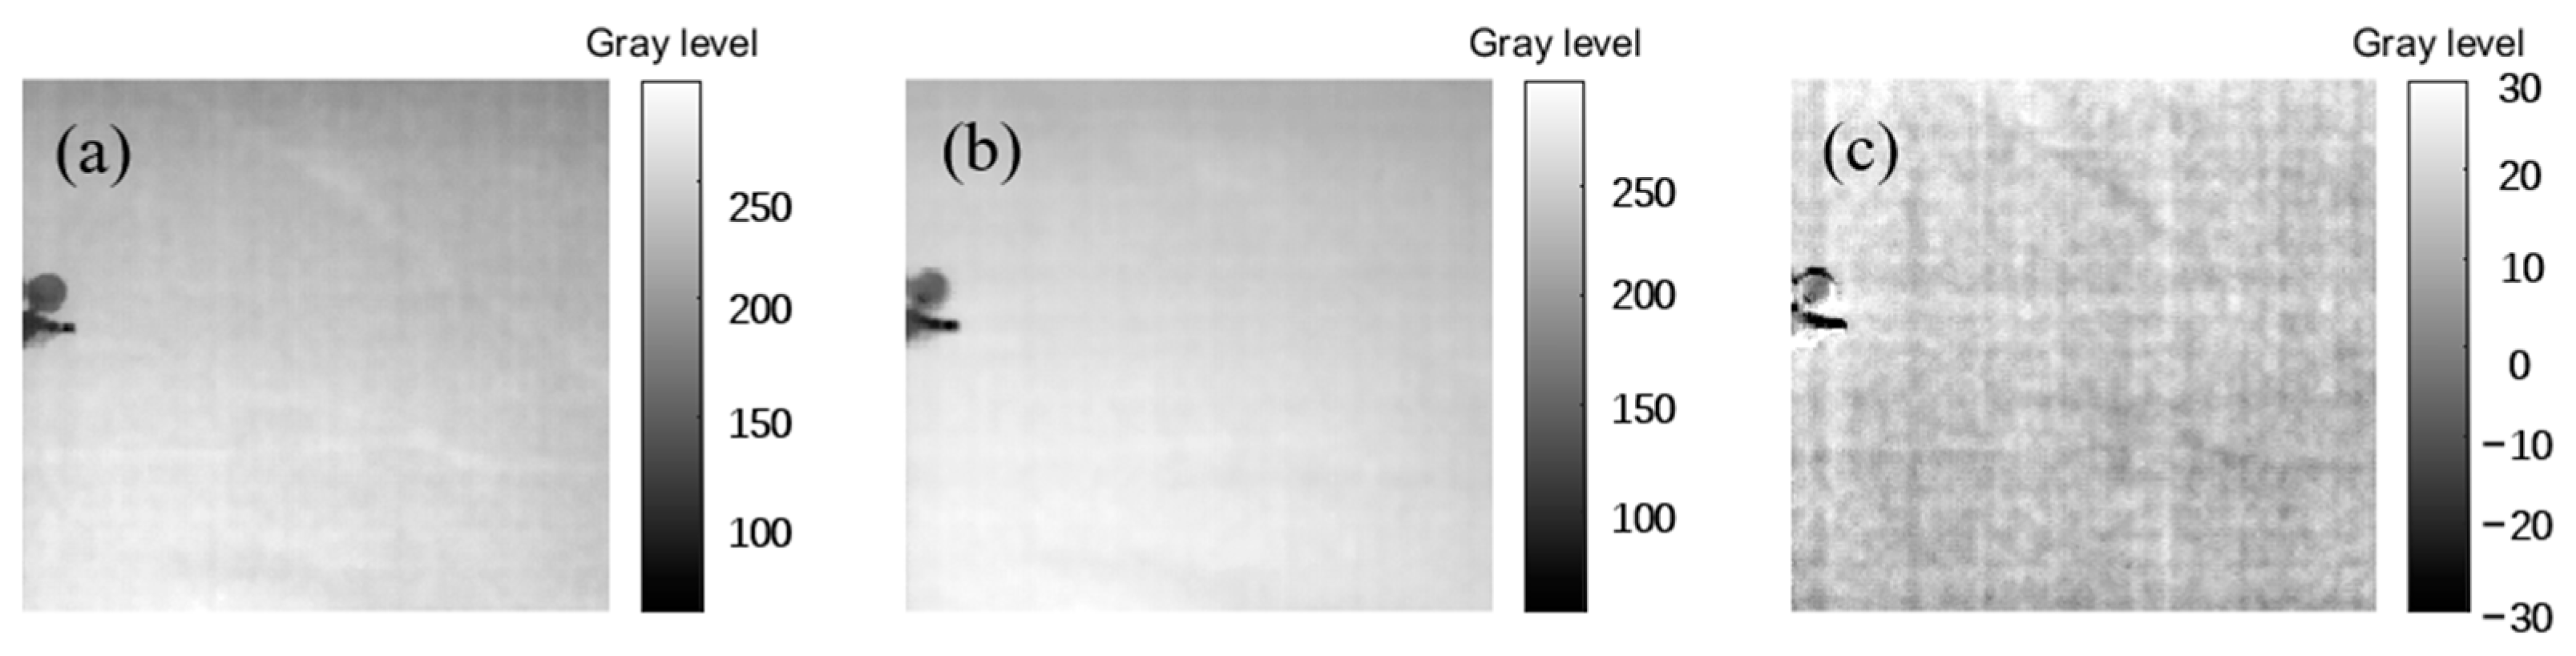
Figure 16a is the background grayscale image taken when the target gas is not released, Figure 16b is the background grayscale image obtained through the mapping relationship and Figure 16c is the grayscale value difference between the two. By comparing these images, it can be seen that the gray level difference of the two images is within ±10, which proves that the gray level of the background grayscale image of the target spectral channel under the condition of no gas release is similar to that obtained through the mapping relationship, and the error is small. Further, a gas column concentration distribution image was obtained by calculating the background grayscale image of the target spectral channel without gas release and the background gray image obtained through the mapping relationship, respectively, as shown in Figure 17.

Figure 16.
Background grayscale image comparison: (a) the background grayscale image taken when the target gas was not released; (b) the background grayscale image obtained through the mapping relationship; (c) the difference between (a) and (b).
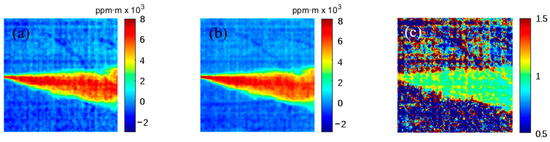
Figure 17.
(a) Column concentration image calculated from the background grayscale image of the target spectral channel without gas release. (b) Column concentration image calculated from the background grayscale image obtained from the mapping relationship (c) ratio of (a) to (b).
Figure 17a is a column concentration image calculated from the background grayscale image of the target spectral channel without gas release, and Figure 17b is a column concentration image calculated from the background grayscale image obtained from the mapping relationship. The gas column concentration image has a high consistency, the column concentration of the background part without gas is close to 0, and the gas shape and concentration distribution in the figure are consistent. Figure 17c shows the ratio between Figure 17a,b. In order to directly reflect the accuracy of column concentration inversion, a column concentration ratio image was obtained by dividing the two column concentration distribution images. When the ratio of the two is closer to 1, the similarity between the two is higher and the error of the inversion method is smaller. From the ratio images, it can be seen that the ratio of the background part without gas is far greater or less than 1 because the column concentration is approaching 0, while the ratio of the part with gas is within the range of 0.9~1.1. Therefore, it can be inferred that the relative error of column concentration inversion is within ±10%.
4.2. Gas Column Concentration Inversion Error Evaluation
Although the inversion accuracy detection method based on actual imaging can evaluate the inversion accuracy of gas column concentration under practical application scenarios, the error introduced in the latter half of the inversion process is ignored by using the intermediate quantity as the standard, and it is difficult to fully represent the error in the whole process of column concentration inversion. At the same time, when SF6 gas is directly discharged into the atmosphere through gas cylinders, it is difficult to determine the optical path of the gas in a certain location, and it is impossible to infer the concentration of the gas column at that location, resulting in an inability to evaluate the accuracy of the inversion of gas column concentration. Therefore, gas sampling bags were used instead of gas release to evaluate the inversion accuracy. The experimental installation is shown in Figure 18.
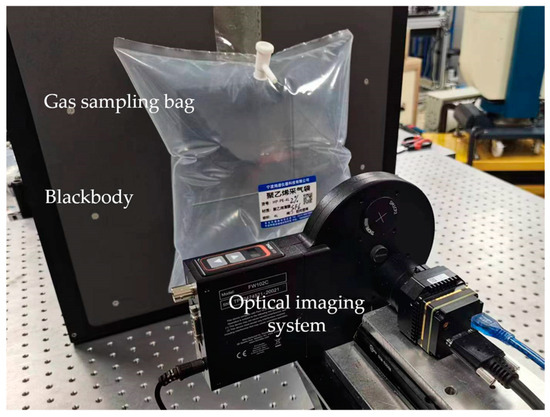
Figure 18.
Experimental diagram of inversion accuracy detection of gas sampling bag inflation.
In order to reduce the influence of the gas sampling bag itself on the inversion, polyethylene with less infrared spectrum absorption was selected as the material for the gas sampling bag, and SF6 gas was added to the gas sampling bag until the gas sampling bag was completely filled. The completely filled gas sampling bag was not easy to deform, and could better confirm the optical path of a certain point of the gas. After filling, the central thickness of the gas sampling bag was about 13.4 mm. In the experiment, a surface source blackbody at 40 °C was selected as the background. The transmittance of the polyethylene gas sampling bag was measured before the experiment, which eliminated the influence of the transmittance of the gas sampling bag in the subsequent column concentration inversion process.
SF6 gas at different concentrations was added to the gas sampling bag to achieve different column concentrations. The gas column concentration distribution in the gas sampling bag was obtained through the column concentration inversion algorithm, and the average column concentration in the 50 × 50 pixel area in the center of the gas sampling bag was calculated. Since the center area of the gas sampling bag was relatively flat and the collection area was small, it can be considered that the radiation path received by each pixel was equal. The theoretical column concentration was deduced according to the thickness of the center of the gas sampling bag, and the inversion errors under each column concentration were calculated, as shown in Table 2. The mean relative error of the inversion was 4.8%.
Table 2.
Inversion accuracy under different column concentrations.
The above two experiments evaluated the error of the inversion method of dual-channel mapping–gas column concentration inversion from different angles, among which the error introduced by gas column concentration calibration in the inversion process was ignored in the dual-channel mapping error analysis experiment. The inversion error evaluation experiment with a known gas column concentration was able to calculate the actual gas column concentration according to the thickness of the inflated gas sampling bag. According to a comprehensive analysis of the two methods, the relative error of this method is less than 10%, and the average relative error is 4.8%.
Mason Paulec et al. [36] used an infrared Fourier transform spectrometer (IFTS) to measure the content of CO2 and water vapor in the exhaust gas emitted by a turbo engine, with an average error of less than 5%. Burrows et al. [37] from the University of Bremen in Germany used the infrared DOAS algorithm to invert the spectra measured by the Scanning Imaging Absorption Spectrometer for Atmospheric Chartography (SCIAMACHY), and the inversion accuracy of the total column concentrations of H2O, CO2 and CH4 obtained was better than 1% [38]. Lei Hao et al. [39] proposed a spectral measurement method using an infrared thermal imager as a field-of-view aid and a spectrometer as the main measurement device; the test results showed that this method can effectively obtain the infrared spectral radiance of the exhaust plume, and the measurement uncertainty was 19.54%. Compared with existing multispectral infrared imaging techniques, the method proposed in this paper has advantages in accuracy. However, compared to active and hyperspectral imaging systems, the method proposed in this paper has lower accuracy, mainly due to the use of uncooled detectors and higher noise. In order to improve the accuracy of this method, detectors with higher sensitivity or methods such as image processing can be used.
5. Conclusions
This paper is aimed at solving the problem of difficulty in calculating the gas column concentration in gas concentration detection with background radiation acquisition affected by the target gas. In this paper, a dual-channel mapping–gas column concentration inversion method based on multispectral infrared gas imaging detection technology was proposed. The infrared radiation was separated by switching the spectral channels, the infrared radiation absorption characteristics of the gas combined with the dual-channel background radiation mapping experiment were utilized to acquire background radiation, and finally, we conducted a column concentration calibration experiment to achieve the column concentration inversion of the target gas column. The mapping relationship between the temperature and gray value of two spectral channels, the absorbance of the target gas and the column concentration was established. The experimental results showed that the relative error of the dual-channel background radiation mapping method was about 1.9% in the laboratory environment. The feasibility of this method was verified by the inversion of SF6 gas column concentration in different indoor and outdoor environments, and the accuracy of the method was verified in a variety of ways. The average relative error of the inversion method was 4.8%, which enables the detection of gas column concentration.
Author Contributions
Conceptualization, N.S. and J.L. (Jingqiu Liang); methodology, N.S., J.L. (Jinguang Lv) and Y.Z.; validation, N.S., J.L. (Jingqiu Liang) and J.L. (Jinguang Lv); investigation, N.S., J.L. (Jinguang Lv) and Y.Z.; resources, Y.Z.; writing—original draft preparation, N.S. and Y.Z.; writing—review and editing, J.L. (Jingqiu Liang), J.L. (Jinguang Lv) and W.W.; supervision, Y.Q., B.Z., K.Z. and Y.C.; funding acquisition, J.L. (Jingqiu Liang). All authors have read and agreed to the published version of the manuscript.
Funding
This research was funded by the Jilin Scientific and Technological Development Program under grants 20230201049GX, 20230508141RC and 20230508137RC; the National Natural Science Foundation of China under grants 61805239, 61627819, 61727818 and 62305339; the Youth Innovation Promotion Association Foundation of the Chinese Academy of Sciences under grant 2018254; and the National Key Research and Development Program of China under grant 2022YFB3604702.
Institutional Review Board Statement
Not applicable.
Informed Consent Statement
Not applicable.
Data Availability Statement
The original contributions presented in the study are included in the article, further inquiries can be directed to the corresponding authors.
Conflicts of Interest
The authors declare no conflicts of interest. The funders had no role in the design of the study; in the collection, analyses or interpretation of the data; in the writing of the manuscript; or in the decision to publish the results.
References
- Cao, Y.; Liu, A.; Chen, M.; Jiang, Y.; Wang, S.; Bai, Y. Safety analysis of an offshore platform for leakage and deflagration accidents from adjacent oil and gas storage and transportation units. Ships Offshore Struct. 2021, 16, 815–826. [Google Scholar] [CrossRef]
- Jafari, M.J.; Mohammadfam, I.; Zarei, E. Analysis and Simulation of Severe Accidents in a Steam Methane Reforming Plant. Int. J. Occup. Hyg. 2015, 6, 120–130. [Google Scholar]
- Sandsten, J.; Weibring, P.; Edner, H.; Svanberg, S. Real-time gas-correlation imaging employing thermal background radiation. Opt. Express 2000, 6, 92–103. [Google Scholar] [CrossRef] [PubMed]
- Hagen, N.; Kudenov, M.W. Review of snapshot spectral imaging technologies. Opt. Eng. 2013, 52, 090901. [Google Scholar] [CrossRef]
- Sandsten, J.; Edner, H.; Svanberg, S. Gas visualization of industrial hydrocarbon emissions. Opt. Express 2004, 12, 1443–1451. [Google Scholar] [CrossRef] [PubMed]
- Harig, R.; Matz, G. Toxic cloud imaging by infrared spectrometry: A scanning FTIR system for identification and visualization. Field Anal. Chem. Technol. 2001, 5, 75–90. [Google Scholar] [CrossRef]
- Wang, Q.; Han, L.; Liao, X. Experiment on a distributed fiber optic interferometric sensing system to monitor and locate urban high-density polyethylene gas pipe leakage. J. Opt. Technol. 2021, 88, 536–542. [Google Scholar] [CrossRef]
- Bonow, G.; Kroll, A. Gas Leak Localization in Industrial Environments Using a TDLAS-Based Remote Gas Sensor and Autonomous Mobile Robot with the Tri-Max Method. In Proceedings of the 2013 IEEE International Conference on Robotics and Automation, Karlsruhe, Germany, 6–10 May 2013; pp. 987–992. [Google Scholar]
- Nutt, K.J.; Hempler, N.; Maker, G.T.; Malcolm, G.P.A.; Padgett, M.J.; Gibson, G.M. Developing a portable gas imaging camera using highly tunable active-illumination and computer vision. Opt. Express 2020, 28, 18566–18576. [Google Scholar] [CrossRef] [PubMed]
- Lengden, M.; Wilson, D.; Armstrong, I.; Benoy, T.; Johnstone, W.; Fisher, E.; Chighine, A.; Tsekenis, A.; McCann, H.; Wright, P.; et al. Fibre Laser Imaging of Gas Turbine Exhaust Species—A Review of CO2 Aero Engine Imaging. In Proceedings of the Advanced Photonics 2015, Boston, MA, USA, 27 June 2015; p. JM3A.37. [Google Scholar]
- Herbst, J.; Strahl, T. Laser based Hyperspectral Imaging for Stand-off Gas Detection. In Proceedings of the Optical Sensors and Sensing Congress, Washington, DC, USA, 22 June 2020; p. EM3C.3. [Google Scholar]
- Strahl, T.; Herbst, J.; Lambrecht, A.; Maier, E.; Steinebrunner, J.; Wöllenstein, J. Methane leak detection by tunable laser spectroscopy and mid-infraredimaging. Appl. Opt. 2021, 60, C68–C75. [Google Scholar] [CrossRef]
- Tancin, R.J.; Spearrin, R.M.; Goldenstein, C.S. 2D mid-infrared laser-absorption imaging for tomographic reconstruction of temperature and carbon monoxide in laminar flames. Opt. Express 2019, 27, 14184–14198. [Google Scholar] [CrossRef]
- Guillaume, D.; Pierre-Yves, F.; Stéphanie, D.; Xavier, W.; Sophie, J.; Emmanuel, V.; Hadrien, P. Test of SIMAGAZ: A LWIR Cryogenic Multispectral Infrared Camera for Methane Gas Leak Detection and Quantification. In Proceedings of the Algorithms, Technologies, and Applications for Multispectral and Hyperspectral Imaging XXVII, Online, 12–16 April 2021; p. 117270G. [Google Scholar]
- Erba, I.; Buzzelli, M.; Schettini, R. RGB color constancy using multispectral pixel information. J. Opt. Soc. Am. A 2024, 41, 185–194. [Google Scholar] [CrossRef] [PubMed]
- Min, W.; Hanyu, H.; Likun, H. Infrared Video Based Gas Leak Detection Method using Modified FAST Features. In Proceedings of the MIPPR 2017: Remote Sensing Image Processing, Geographic Information Systems, and Other Applications, Tenth International Symposium on Multispectral Image Processing and Pattern Recognition (MIPPR2017), Xiangyang, China, 28–29 October 2017; p. 1061112. [Google Scholar]
- Coudrain, C.; Bernhardt, S.; Caes, M.; Domel, R.; Ferrec, Y.; Gouyon, R.; Henry, D.; Jacquart, M.; Kattnig, A.; Perrault, P.; et al. SIELETERS, an airborne infrared dual-band spectro-imaging system for measurement of scene spectral signatures. Opt. Express 2015, 23, 16164. [Google Scholar] [CrossRef] [PubMed]
- Sylvain, F.; Aymeric, A.; Manon, V.; Romain, V.; Sébastien, B. Detecting Unknown Chemical Clouds at Distance with Multispectral Imagery. In Proceedings of the Chemical, Biological, Radiological, Nuclear, and Explosives (CBRNE) Sensing XVIII, Anaheim, CA, USA, 11 April 2017; p. 101830C. [Google Scholar]
- Li, K.; Duan, S.; Pang, L.; Li, W.; Yang, Z.; Hu, Y.; Yu, C. Chemical Gas Telemetry System Based on Multispectral Infrared Imaging. Toxics 2023, 11, 83. [Google Scholar] [CrossRef] [PubMed]
- Hu, Y.; Xu, L.; Shen, X.; Jin, L.; Xu, H.; Deng, Y.; Liu, J.; Liu, W. Reconstruction of a leaking gas cloud from a passive FTIR scanning remote-sensing imaging system. Appl. Opt. 2021, 60, 9396–9403. [Google Scholar] [CrossRef] [PubMed]
- Morales-Sillero, A.; Pierna, J.A.F.; Sinnaeve, G.; Dardenne, P.; Baeten, V. Quantification of protein in wheat using near infrared hyperspectral imaging: Performance comparison with conventional near infrared spectroscopy. J. Near Infrared Spectrosc. 2018, 26, 186–195. [Google Scholar] [CrossRef]
- Zhou, B.; Li, B.; He, X.; Liu, H. A Spectral-spatial Cooperative Noise-evaluation Method for Hyperspectral Imaging. Curr. Opt. Photon. 2020, 4, 530–539. [Google Scholar]
- Staudt, T.; Eschner, E.; Schmidt, M. Temperature determination in laser welding based upon a hyperspectral imaging technique. CIRP Ann. 2019, 68, 225–228. [Google Scholar] [CrossRef]
- Hu, Y.; Xu, L.; Xu, H.; Shen, X.; Deng, Y.; Xu, H.; Liu, J.; Liu, W. Three-dimensional reconstruction of a leaking gas cloud based on two scanning FTIR remote-sensing imaging systems. Opt. Express 2022, 30, 25581–25596. [Google Scholar] [CrossRef] [PubMed]
- Amiot, C.G.; Ryczkowski, P.; Friberg, A.T.; Dudley, J.M.; Genty, G. Spectral Ghost Imaging for Spectroscopy and Optical Coherence Tomography. In Proceedings of the 2019 Conference on Lasers and Electro-Optics Europe and European Quantum Electronics Conference, Munich, Germany, 23 June 2019; p. ch_12_14. [Google Scholar]
- Shan, C.; Wang, W.; Liu, C.; Guo, Y.; Xie, Y.; Sun, Y.; Hu, Q.; Zhang, H.; Yin, H.; Jones, N. Retrieval of vertical profiles and tropospheric CO2 columns based on high-resolution FTIR over Hefei, China. Opt. Express 2021, 29, 4958–4977. [Google Scholar] [CrossRef]
- Huang, H.; Liu, S.; Wang, C.; Xia, K.; Zhang, D.; Wang, H.; Zhan, S.; Huang, H.; He, S.; Liu, C.; et al. On-site visualized classification of transparent hazards and noxious substances on a water surface by multispectral techniques. Appl. Opt. 2019, 58, 4458–4466. [Google Scholar] [CrossRef]
- Latorre-Carmona, P.; Sánchez-Ortiga, E.; Xiao, X.; Pla, F.; Martínez-Corral, M.; Navarro, H.; Saavedra, G.; Javidi, B. Multispectral integral imaging acquisition and processing using a monochrome camera and a liquid crystal tunable filter. Opt. Express 2012, 20, 25960–25969. [Google Scholar] [CrossRef] [PubMed]
- Preciado, M.A.; Carles, G.; Harvey, A.R. Snapshot Multispectral Imaging in Long-Wave Infrared Based on a Multi-Aperture System of Low-Cost Detectors. In Proceedings of the Imaging and Applied Optics 2017 (3D, AIO, COSI, IS, MATH, pcAOP), San Francisco, CA, USA, 26 June 2017; p. ITh3E.5. [Google Scholar]
- Azwar, E.; Nurhajati, N. Leak Detection on Water Distribution Networks Using Helium Gas. Civ. Environ. Res. 2017, 9, 20–29. [Google Scholar]
- Dennis, F.F. Limits of Passive Remote Detection of Hazardous Vapors by Computer Simulation. In Proceedings of the Aerospace/Defense Sensing and Controls, Orlando, FL, USA, 17 June 1996; pp. 117–127. [Google Scholar]
- Sun, Z.; Chang, S.; Zhu, W. Radiometric calibration method for large aperture infrared system with broad dynamic range. Appl. Opt. 2015, 54, 4659–4666. [Google Scholar] [CrossRef] [PubMed]
- Té, Y.; Jeseck, P.; Pépin, I.; Camy-Peyret, C. A method to retrieve blackbody temperature errors in the two points radiometric calibration. Infrared Phys. Technol. 2009, 52, 187–192. [Google Scholar] [CrossRef]
- Pujana, J.; Del Campo, L.; Pérez-Sáez, R.; Tello, M.; Gallego, I.; Arrazola, P. Radiation thermometry applied to temperature measurement in the cutting process. Meas. Sci. Technol. 2007, 18, 3409. [Google Scholar] [CrossRef]
- Cosofret, B.R.; Marinelli, W.; Ustun, T.E.; Gittins, C.; Boies, M.T.; Hinds, M.F.; Rossi, D.C.; Coxe, R.; Chang, S.; Green, B.D.; et al. Passive Infrared Imaging Sensor for Standoff Detection of Methane Leaks. In Proceedings of the SPIE Optics East, Philadelphia, PA, USA, 25–28 October 2004. [Google Scholar]
- Paulec, M.; Marciniak, M.; Gross, K.; Azevedo, D. Infrared Signature Measurements of a Jet Turbine using a Hyperspectral Imager for Combustion Diagnostics. In Proceedings of the Algorithms and Technologies for Multispectral, Hyperspectral, and Ultraspectral Imagery XXIV, Orlando, FL, USA, 17–19 April 2018; pp. 250–260. [Google Scholar]
- Burrows, J.; Hölzle, E.; Goede, A.; Visser, H.; Fricke, W. SCIAMACHY—Scanning imaging absorption spectrometer for atmospheric chartography. Acta Astronaut. 1995, 35, 445–451. [Google Scholar] [CrossRef]
- Buchwitz, M.; Rozanov, V.V.; Burrows, J.P. A near-infrared optimized DOAS method for the fast global retrieval of atmospheric CH4, CO, CO2, H2O, and N2O total column amounts from SCIAMACHY Envisat-1 nadir radiances. J. Geophys. Res. Atmos. 2000, 105, 15231–15245. [Google Scholar] [CrossRef]
- Hao, L.; Li, J.; Zhu, X.; Ran, D. A Method for Testing the Infrared Spectral Radiation of Aircraft Engine Exhaust Plume. In Proceedings of the Sixth Symposium on Novel Optoelectronic Detection Technology and Applications, Beijing, China, 3–5 December 2019; pp. 1322–1329. [Google Scholar]


Disclaimer/Publisher’s Note: The statements, opinions and data contained in all publications are solely those of the individual author(s) and contributor(s) and not of MDPI and/or the editor(s). MDPI and/or the editor(s) disclaim responsibility for any injury to people or property resulting from any ideas, methods, instructions or products referred to in the content. |
© 2024 by the authors. Licensee MDPI, Basel, Switzerland. This article is an open access article distributed under the terms and conditions of the Creative Commons Attribution (CC BY) license (https://creativecommons.org/licenses/by/4.0/).