Article

Intelligent Analysis System for Teaching and Learning Cognitive Engagement Based on Computer Vision in an Immersive Virtual Reality Environment

1
Computer Science and Technology, China University of Mining & Technology, Beijing 100083, China
2
College of Science and Technology, Hebei Agricultural University, Cangzhou 071001, China
3
School of Geosciences & Surveying Engineering, China University of Mining & Technology, Beijing 100083, China
*
Author to whom correspondence should be addressed.
Appl. Sci. 2024, 14(8), 3149; https://doi.org/10.3390/app14083149
Submission received: 13 March 2024 / Revised: 31 March 2024 / Accepted: 3 April 2024 / Published: 9 April 2024

Abstract

:

Featured Application

This application mainly detects the visual attention content and handles operation information in the students’ IVR video and visualizes the detection information after the detection is completed. Visualization can be displayed in the following three forms: carousel, bar chart, and pie chart. Each carousel information includes six types of information, as follows: object name, occurrence frame rate, disappearance frame rate, occurrence time, disappearance time, and duration. Bar charts and pie charts can select visual objects for more targeted statistics, thereby promoting the development of educational technology toward intelligence and personalization.

Abstract

The 20th National Congress of the Communist Party of China and the 14th Five Year Plan for Education Informatization focus on digital technology and intelligent learning and implement innovation-driven education environment reform. An immersive virtual reality (IVR) environment has both immersive and interactive characteristics, which are an important way of virtual learning and are also one of the important ways in which to promote the development of smart education. Based on the above background, this article proposes an intelligent analysis system for Teaching and Learning Cognitive engagement in an IVR environment based on computer vision. By automatically analyzing the cognitive investment of students in the IVR environment, it is possible to better understand their learning status, provide personalized guidance to improve learning quality, and thereby promote the development of smart education. This system uses Vue (developed by Evan You, located in Wuxi, China) and ECharts (Developed by Baidu, located in Beijing, China) for visual display, and the algorithm uses the Pytorch framework (Developed by Facebook, located in Silicon Valley, CA, USA), YOLOv5 (Developed by Ultralytics, located in Washington, DC, USA), and the CRNN model (Convolutional Recurrent Neural Network) to monitor and analyze the visual attention and behavioral actions of students. Through this system, a more accurate analysis of learners’ cognitive states and personalized teaching support can be provided for the education field, providing certain technical support for the development of smart education.

1. Introduction

The report of the 20th National Congress of the Communist Party of China highlighted the important strategic position of education and digital technology in socialist modernization construction. The 14th Five Year Plan for Education Informatization focuses on “intelligent learning” and implements innovation-driven educational environment reform, of which virtual learning experience is an important part [1]. With the development of technology, immersive virtual reality (IVR) has rapidly developed and gradually been applied in various fields [2], particularly in the area of education [3], which has received widespread attention from researchers. The immersive and interactive features of immersive virtual reality provide necessary technical and environmental support for learners’ deep learning [4]. The immersive features of virtual reality can provide learners with multi-spatial perspectives and situational experiences, which helps to enhance their learning effectiveness. The interactive features of virtual reality can provide learners with an immersive feeling and personalized learning experience, improve learning effect and memory, and provide practice and experiment opportunities through environmental interaction [5]. In addition, the IVR environment can also be used to complete experimental tasks that are difficult to complete in traditional teaching, thereby improving learning effectiveness. IVR technology is a new educational tool. In this environment, the learners’ degree of learning engagement is closely related to the learning effect. Therefore, how to accurately and objectively use computer vision to evaluate learners’ learning engagement in immersive virtual reality environments has become a highly concerning issue. Research on intelligent analysis systems for Teaching and Learning Cognitive engagement in immersive virtual reality environments based on computer vision is a new and prospective field. At present, most research on cognitive engagement in learning adopts a combination of subjective self-reporting and cognitive testing for analysis. Some studies used physiological indicators for analysis and evaluation [6] and some used computer vision to detect learners’ emotions and behavioral performance for automated analysis, etc. In recent years, researchers have been developing systems that can monitor learners’ attention, emotion, cognitive load, and other cognitive states in real time, to provide personalized learning support and assessment. However, there is still little discussion on the intelligent assessment of cognitive engagement in learning.
This research aims to design and utilize a system for ally, analyzing learners’ cognitive engagement in the learning process using computer vision technology combined with an immersive virtual reality environment. This research is of great significance. In recent years, domestic and foreign academic circles have been relatively active in the study of learning engagement and a certain number of published articles have been accumulated [7]. This article mainly studies the intelligent analysis system of Teaching and Learning Cognitive engagement, which deepens the research on the intelligent evaluation of Teaching and Learning Cognitive engagement based on previous research, promotes the development of related research, and provides a certain theoretical basis for future research. Through this study, learners’ cognitive investment in learning in the virtual environment can be analyzed to help students deeply appreciate the learning state in the learning process and to self-regulate accordingly, to enhance the learning effect. Furthermore, the system can optimize the effect and attractiveness of virtual reality education [8], promoting the development of educational technology towards intelligence and personalization, introducing advanced technological means and methods for smart education, and promoting the development of intelligence education [9], further promoting the training of talents and, ultimately, boosting the innovative development of the country. Therefore, the application of an intelligent analysis system for Teaching and Learning Cognitive engagement in an immersive virtual reality environment based on computer vision is of great significance.

2. Related Work

2.1. IVR Environment Learning Investment Analysis Method and System

The immersive virtual reality environment has both immersive and interactive features, so it has more advantages than other learning methods. Immersive virtual reality environments can enhance learners’ self-efficacy. Self-efficacy was a concept proposed by psychologist Albert Bandera in the 1970s and is often described as an individual’s perception of their competence in a particular field or task. For example, Makransky et al. proved that learners learning in an immersive virtual reality environment could stimulate learning interest and self-efficacy more effectively than video learning [10]. Researchers such as Michelle [11], Wang [12], Ali [13], Li [14], and others [15] had confirmed that learners learned better in immersive virtual reality environments than in traditional learning methods. Some foreign scholars have also confirmed that the immersive virtual reality environment was more immersive and realistic than the virtual environment that simply replicated the real world [16]. In summary, immersive virtual reality environments have more advantages compared to other traditional learning methods.
Learning engagement refers to the energy, time, and attention a person puts into the learning process. It includes motivation, concentration, and effort, as well as the depth and breadth of learning [17]. Learning engagement was divided into two, three, and four dimensions. Among them, more people recognize the investment in three-dimensional learning, including cognitive investment, emotional investment, and behavioral investment. Cognitive engagement refers to the cognitive effort that learners put into the learning process, such as understanding, memorizing, analyzing, and solving problems [18]; emotional engagement refers to the emotional experience produced by learners, such as interest, enthusiasm, frustration, and satisfaction [19]; behavioral engagement refers to the actual actions shown by learners, such as class participation, group discussion, extracurricular research, and so on [20].
Learning engagement directly affects the learning effect and outcome of learners in an IVR environment. For example, Essoe et al. found that the stronger the sense of experience in an IVR environment, the longer the memory and the better the learning effect [21]. Parong found that high emotional and cognitive engagement contributed to student learning outcomes [22]. Chunghwan et al. developed a facial muscle and eye motion capture system for IVR environments, which has been tested to perform well [23]. To sum up, the learning effect is largely influenced by learning engagement. Generally speaking, the learning effect is proportional to the learning engagement, which provides theoretical support for future research. This study aimed to develop an automated analysis system to detect learning engagement, in order to provide better advice to learners.

2.2. IVR Environment Computer Vision Detection Method

Computer vision refers to the ability to process and analyze images or videos using computer technology to simulate the human visual system [24]. Computer vision has outstanding advantages in object detection and recognition, image segmentation, feature extraction, image classification, and video analysis. Through these technologies, computer vision systems can automate image and video processing, thus playing an important role in a variety of fields. Computer vision technology has been proven to be an effective way to detect learning engagement in online learning environments [25]. Chung et al. used a 3D-CNN (3D Convolutional Neural Network) to evaluate and analyze students’ behavioral engagement in classroom learning [26]; Qi et al. used visual technology to assess the study engagement via facial gesture recognition and action recognition [27]. Nan et al. used VGG16, ResNet-101, and Mediapipe (developed by Google, located in Mountain View) methods to identify students’ facial expressions, head movements, and estimate facial coordinates for eye–mouth behavior, thereby detecting students’ classroom participation [28]. Ling developed a classroom behavior analysis system based on computer vision facial recognition technology to analyze students’ head attention and eye state [29]. Anh et al. developed an automated system using visual technology to capture and summarize students’ classroom behaviors [30]. These provide support for intelligent recognition of learner behavior detection in IVR environments.
In recent years, more and more scholars have been studying computer vision technology to evaluate learners’ learning engagement in immersive virtual reality environments. For example, Dubovi used facial expression recognition algorithms in computer vision to detect learners’ emotional engagement in an IVR environment in real-time [31]; Liming et al. adopted the improved DeepID (Deep Identity Representation) network model to carry out facial expression classification tasks and the accuracy rate reached 97.2% [32]; Zhihui et al. developed a new system based on a lightweight convolutional neural network, MobileNet V2, to recognize facial expressions in an IVR environment [33]. To sum up, existing studies have proven the effectiveness of computer vision detection in immersive virtual reality environments. Due to the recessive nature of learning engagement, there are few studies on the real-time tracking and intelligent assessment of Teaching and Learning Cognitive engagement in immersive virtual reality environments based on computer vision.

2.3. IVR Learning Engagement Measurement and Cognitive Representation Methods
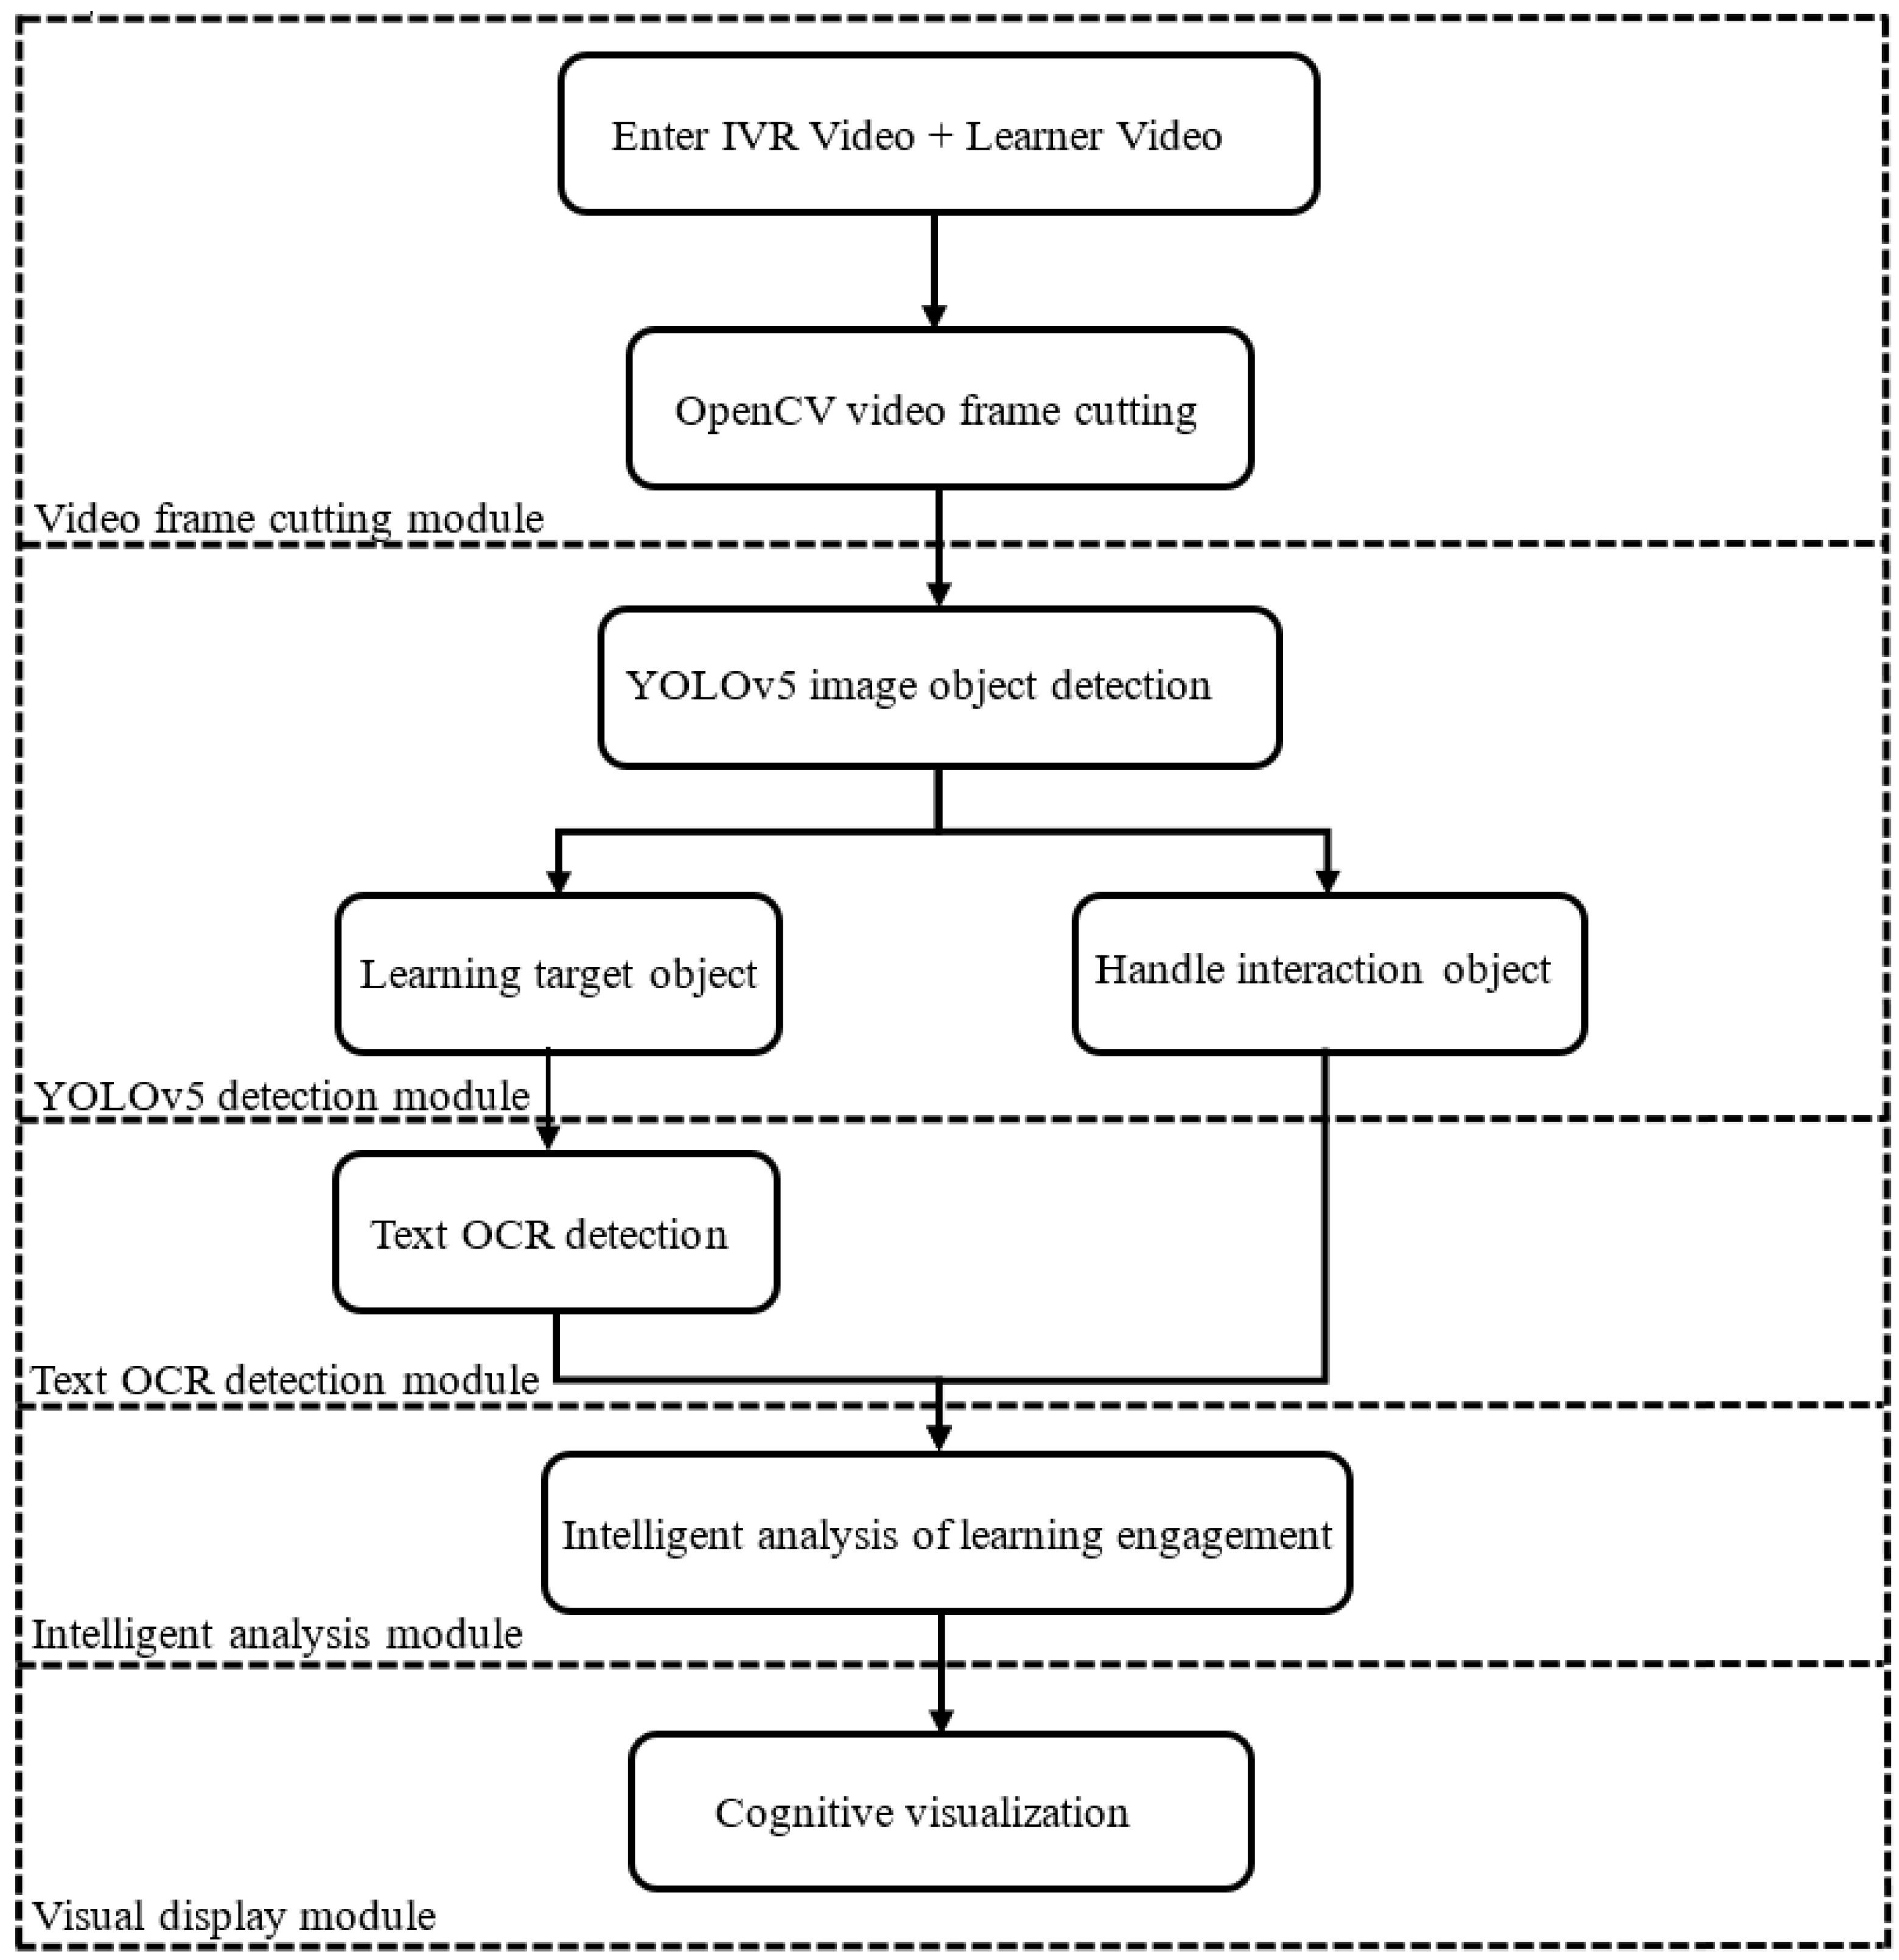
Learning engagement is a key indicator for measuring learning quality, which describes the time, effort, and attention that learners invest in the learning process. There are many methods for measuring learning engagement, including the self-report method—using a questionnaire survey to understand the level of learner engagement in the learning process, including information on learning motivation, learning strategies, learning beliefs and other aspects. Chen et al. adopted the subjective reporting method to measure the contribution of IVR environment to students’ learning engagement [34]. The self-report method is a simple and easy method to implement, so many studies have adopted this method, but this method cannot record learners’ various experiences in time and has a strong subjectivity, so there is a certain deviation from the real situation. The cognitive testing method—the cognitive test is used to evaluate the degree of learners’ learning engagement, including the measurement of attention, memory and thinking ability, etc. This method is widely used to measure the learning effectiveness of learners. Ruixue and other researchers used both a pre-test and a post-test to measure students’ learning effect [35]. The physiological indicator method—used to evaluate the level of learning engagement of learners by measuring physiological indicators, including measurements of heart rate, skin resistance, EEG, etc. By using certain devices to detect corresponding indicators during the learning process of learners, it can reflect their learning status. Parong et al. used a combination of electroencephalogram (EEG) signals and self-reporting to characterize learners’ learning engagement and used structural equation modeling to conclude that high arousal and cognitive engagement of learners positively predicted their final scientific knowledge retention scores [36]. This measurement method can accurately obtain real feedback on the learners’ physical state, but its relationship with the learning state needs to be further verified. At the same time, the physiological indicator method requires professional equipment, so it is difficult to implement in the teaching process. Later, researchers used emotional expressions to characterize learners’ cognitive engagement. For example, Dubovi used facial expression recognition to represent emotional expression and, thus, cognitive engagement. However, due to the fact that emotional engagement is also relatively implicit and there are significant differences in emotional performance among different individuals, there are certain shortcomings.
According to the information processing theory, learning is a process of internal transformation and processing when learners are faced with external stimuli. In an IVR environment, learners will receive visual, auditory, and tactile stimuli [37]. Compared with an ordinary learning environment, visual attention stimulation will be more obvious. Visual attention stimuli can be characterized by attention breadth, stability, allocation, and transfer. The breadth of attention refers to what is observed at the same time; the stability of attention refers to the duration of the observed object; allocation refers to the allocation of attention to multiple objects; transfer is when an individual transfers attention from one object to another [37]. Because visual attention is the basis of information processing, this also provides a certain theoretical basis for the follow-up research.
The embodied cognitive theory suggests that the closer the connection between physical movement and visual processes, the better the learning effect [38]. Robb et al. founded that the clearer the connection between the physical movement process and visual attention, the better the learning effect [38]. Hu et al. used interactive and visual data to comprehensively characterize student focus in an IVR environment and the study confirmed that the higher the level of focus, the better the learning effect [39]. In the IVR environment, students can interact through the handle and receive an embodied experience, which facilitates information processing and improves learning results. Therefore, student cognitive engagement can be indirectly demonstrated through interactive behavior.
In summary, this study mainly uses computer vision technology to analyze the learning and cognitive engagement of visual attention span, attention stability, and embodied interaction behavior. In our previous studies with Captial Normal University, the effectiveness of this learning framework has been preliminarily validated using IVR teaching video data and we have published the learning and cognitive engagement model in Chinese journals.

3. System Design

The main purpose of the system is to detect objects and text OCR through students’ IVR learning videos and students’ operation videos in the IVR environment, to find out which learning objectives in the videos students have learned and how many times they have interacted with the controller and visualized them to then achieve the impact of Teaching and Learning Cognitive engagement analysis.
The overall design architecture of the system is shown in Figure 1. The system was mainly divided into five modules, which were the video frame cutting module, YOLOv5 detection module, text OCR detection module, intelligent analysis module, and visual display module.

4. Detection Method

In this study, deep learning technology was used for object detection and text recognition. YOLOv5 was used for the object detection model and the CRNN model was mainly used for text recognition.

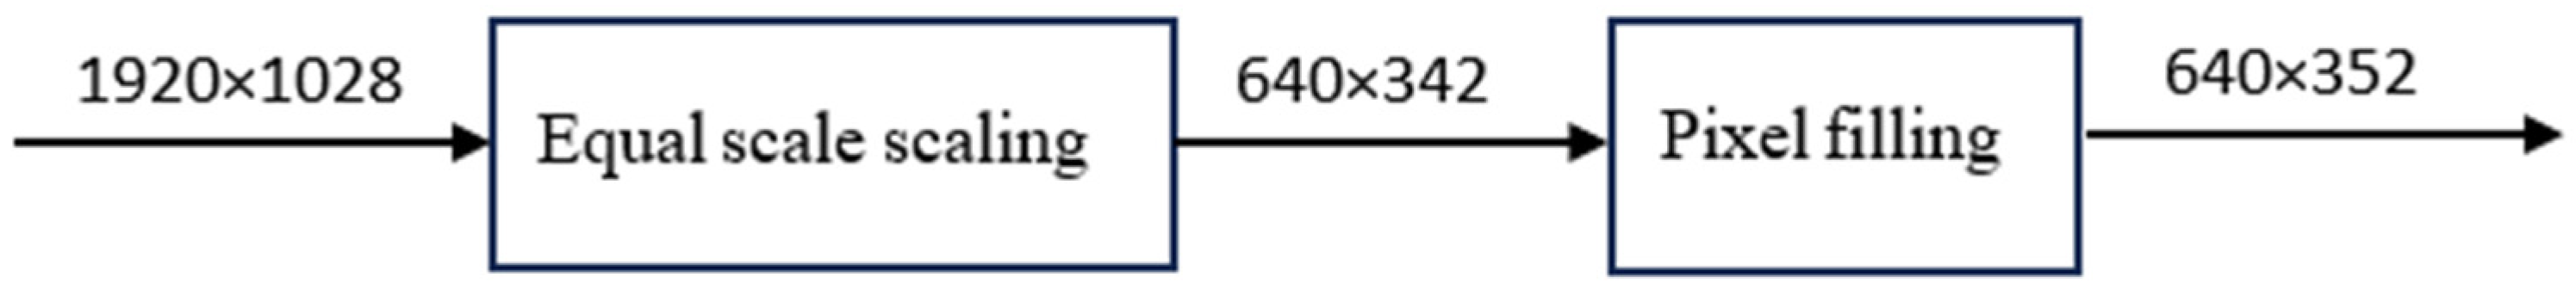
4.1. Data Preprocessing

Data preprocessing was mainly used to carry out rectangular reasoning on the picture, which was convenient for subsequent detection and improved the detection effect and efficiency. As shown in Figure 2, data preprocessing mainly consisted of two main steps, as follows: first, select the long edge of the image to scale to 640 pixels and then scale the short edge of the image to the same proportion. Then, fill the short edges of the image as a multiple of 32, as shown in Figure 3. Due to the need for five times downsampling in the subsequent detection process, the stride for each downsampling was 2, which was a total of 32 times. In order to reduce redundant information or lost parts of the images in the subsequent detection process, the width and height of the image were set to a multiple of 32 in the image preprocessing process and a portion of gray information was filled in for short edges. The image effect is shown in Figure 4.

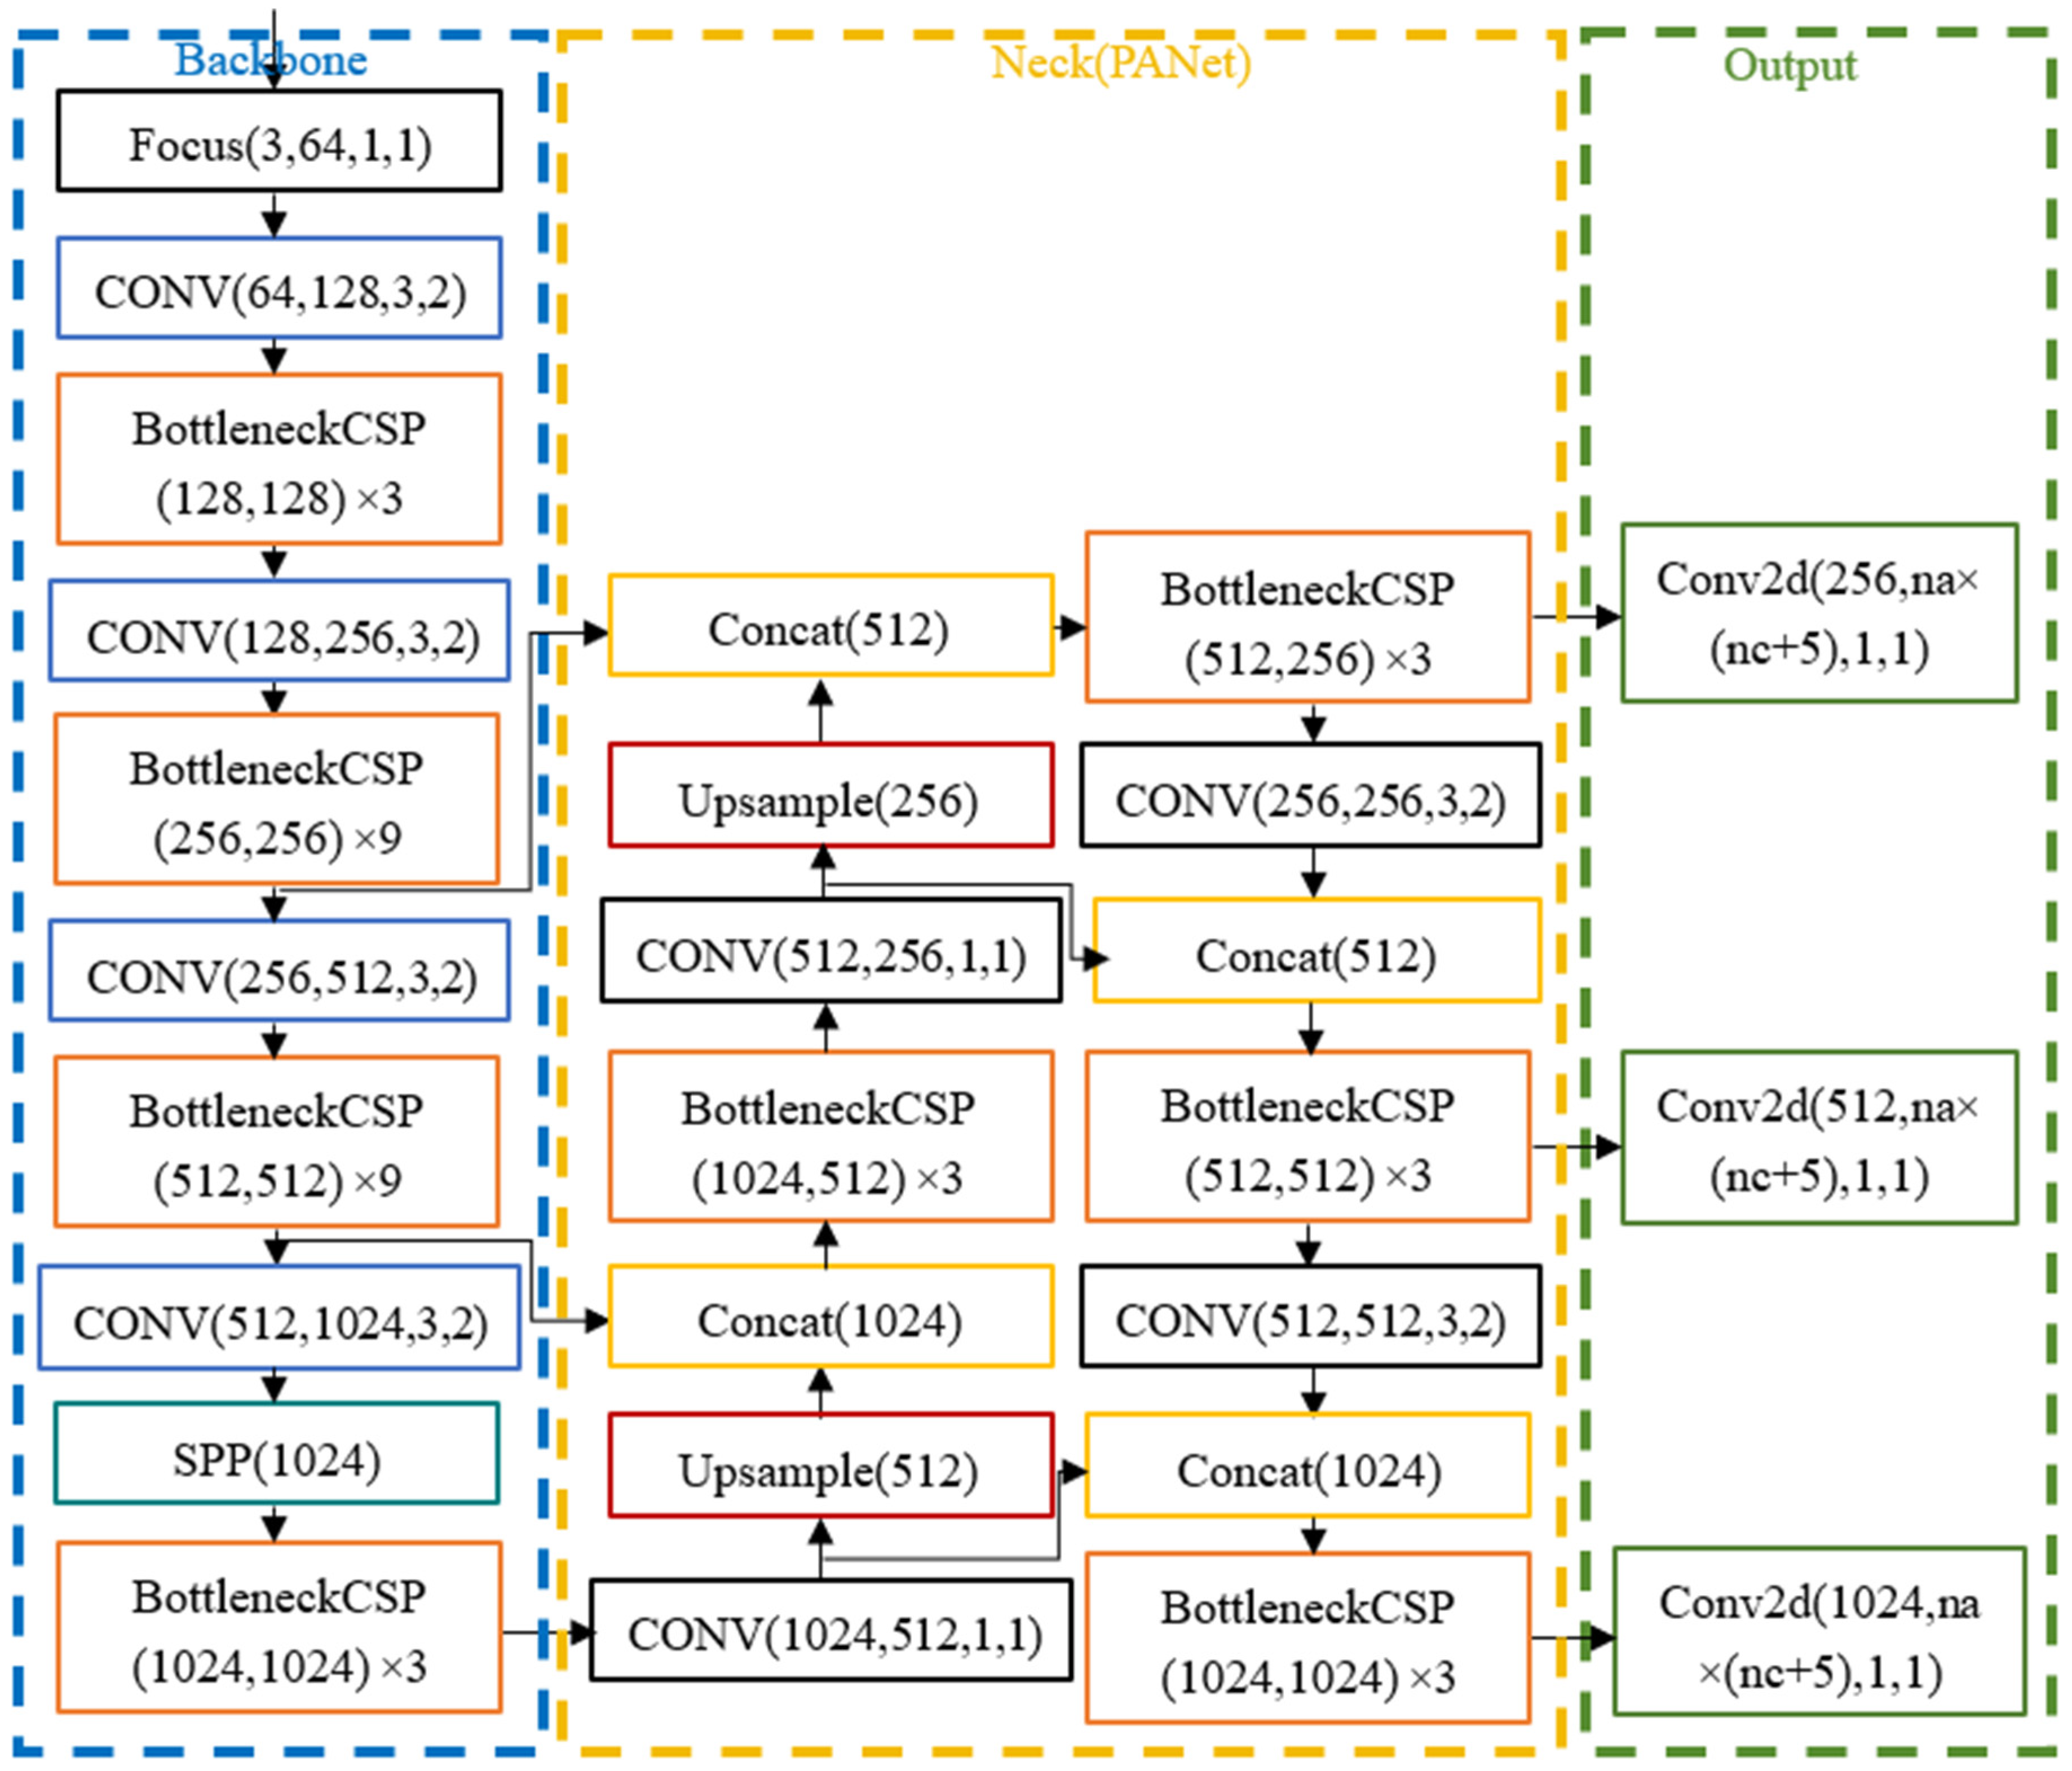
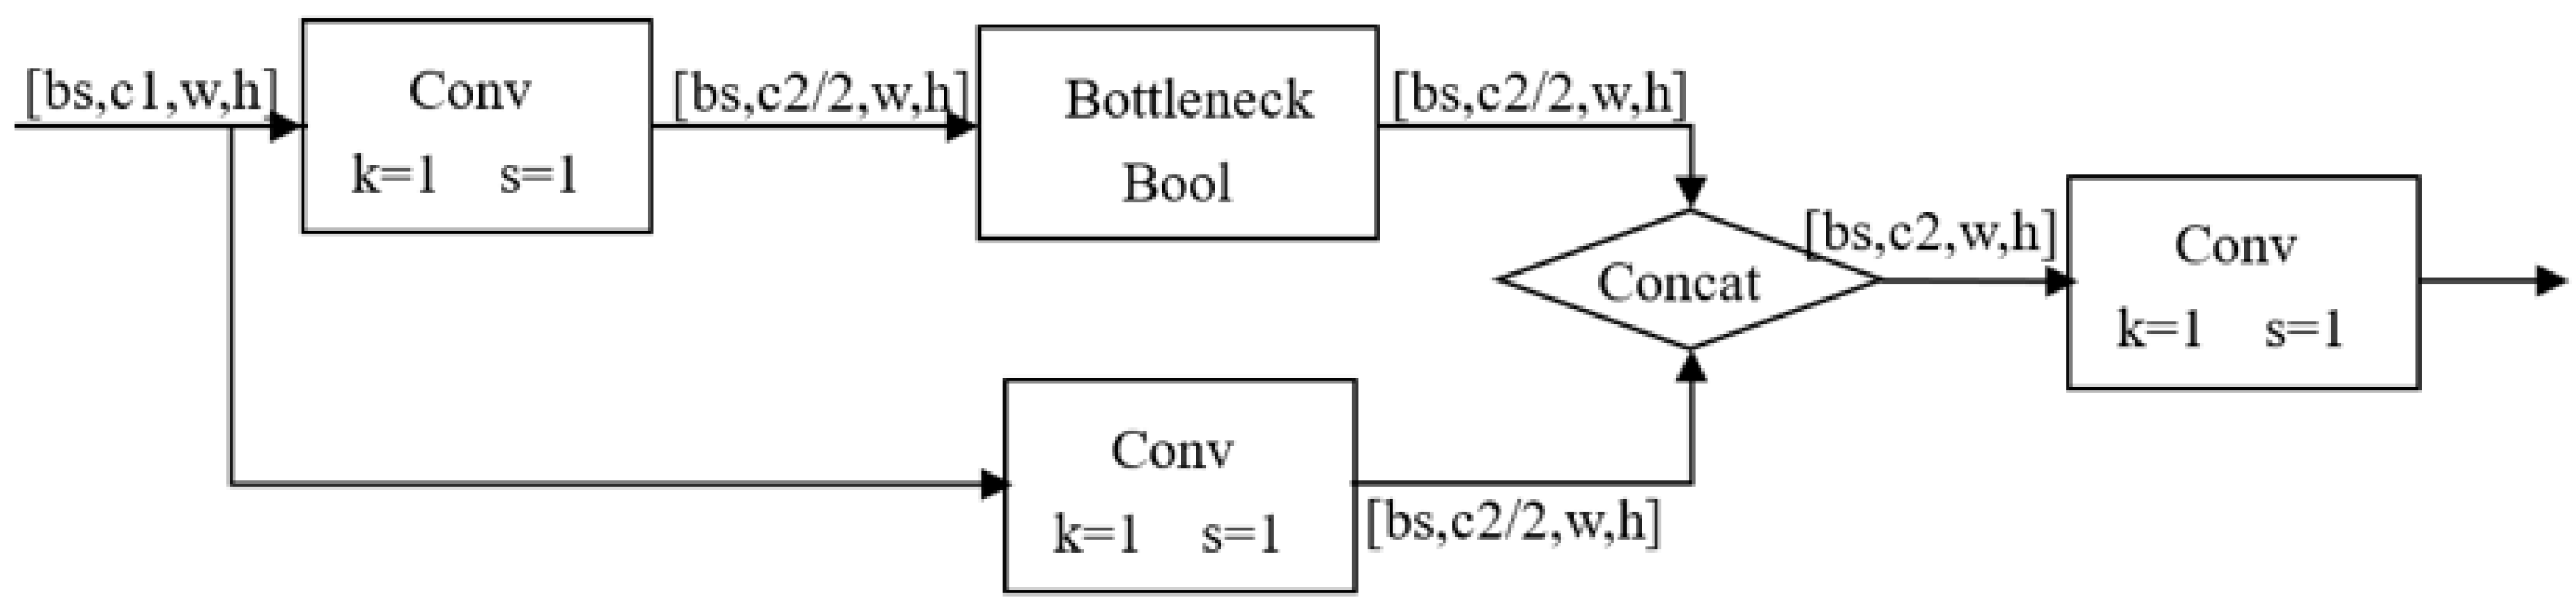
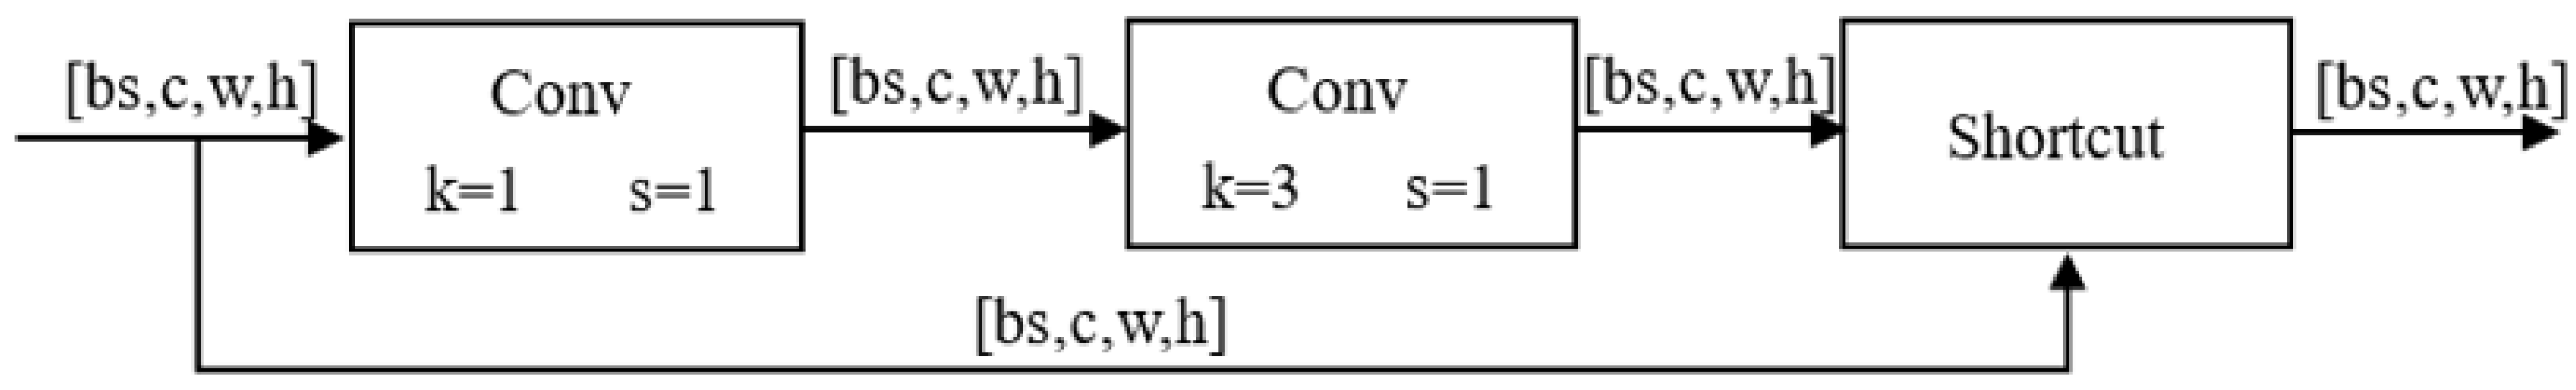
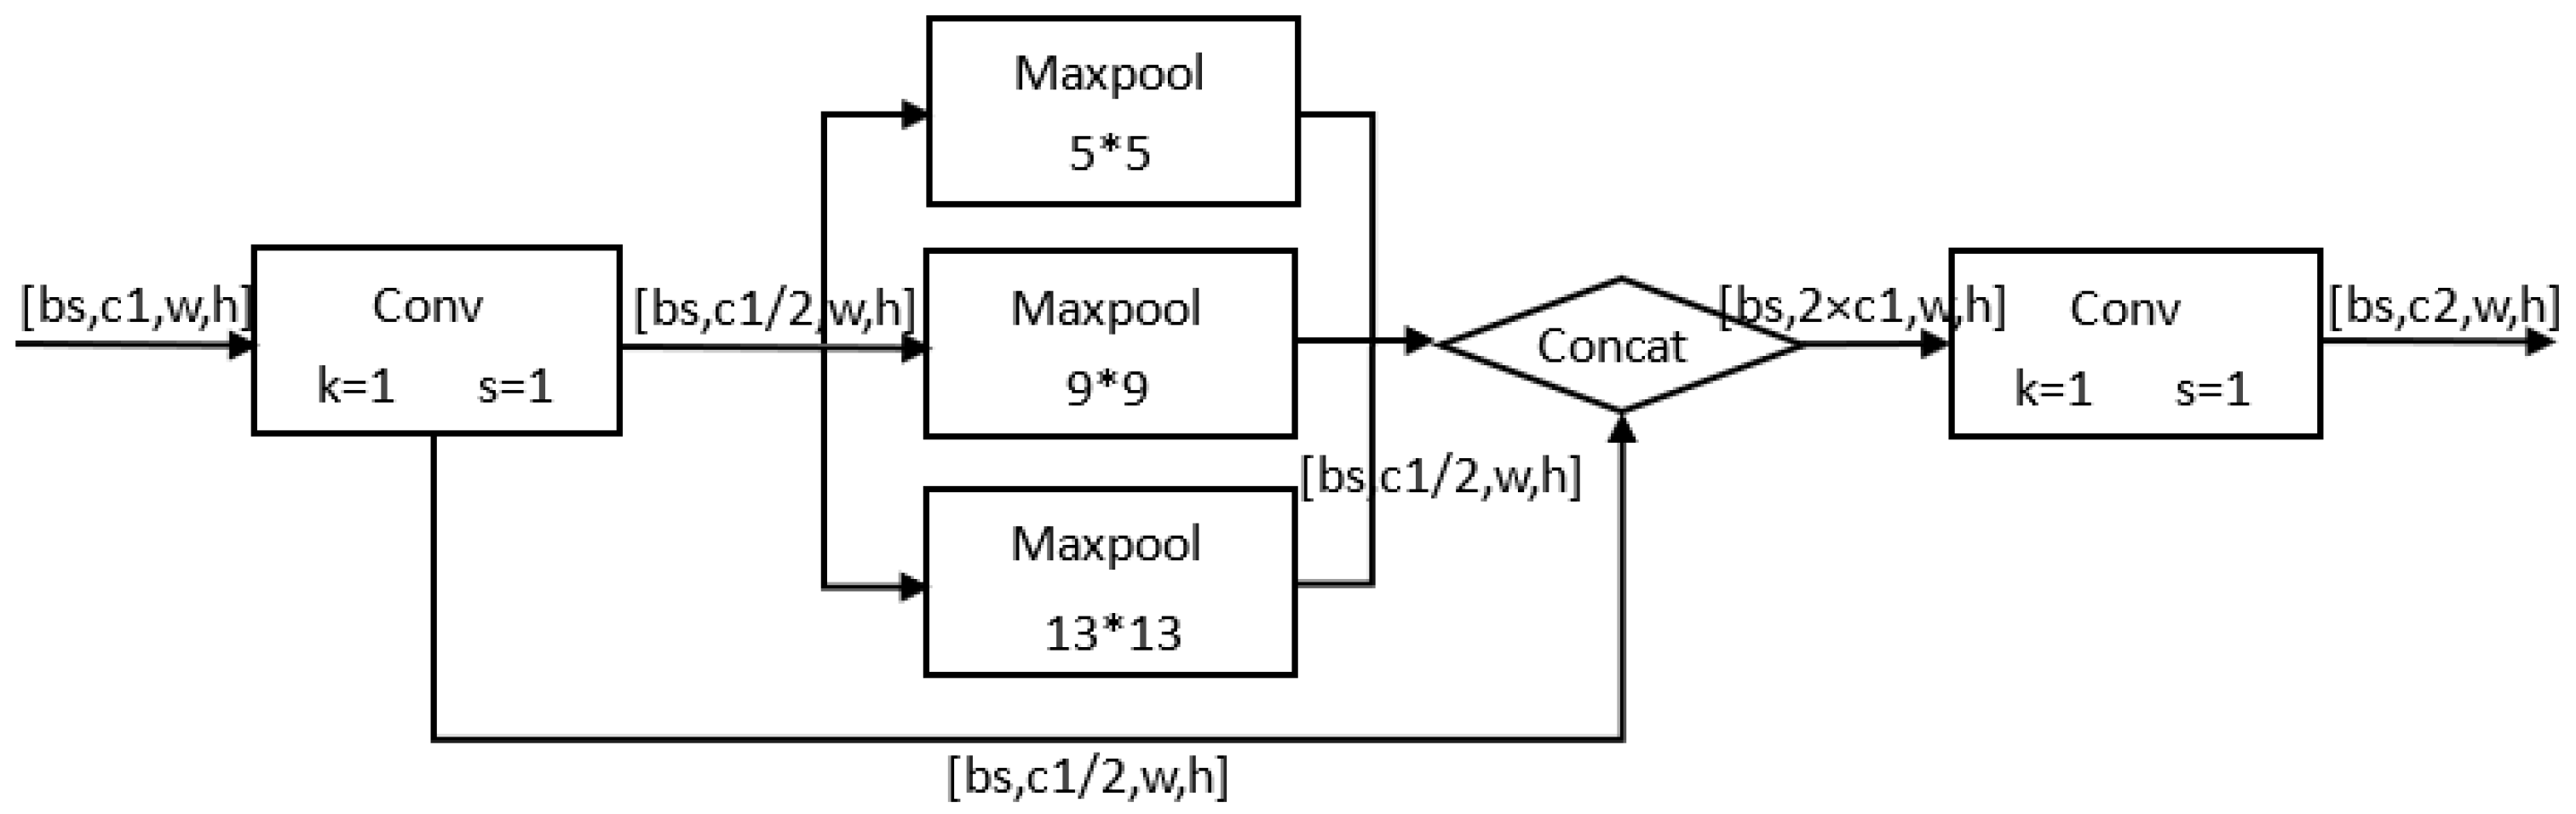
4.2. YOLOv5 Network Architecture

The pre-processed images were detected using the YOLOv5 model. The YOLOv5 network architecture is shown in Figure 5. The YOLOv5 model mainly had three network blocks, as follows: Backbone, Neck, and Output.
The Backbone block was mainly used for feature extraction and continuously shrinks the feature map, with the main structures including the Conv module, C3 module, and SPP module.
The Conv module was an important component of the object detection algorithm YOLOv5, which mainly consisted of Conv2d, BatchNorm2d, and SiLU. The Conv module could help the model effectively extract features and organize the feature maps, providing useful information for subsequent processing steps. The Conv2d layer was one of the most basic operations in convolutional neural networks, which could extract features and scale the feature map (halving width and height). In YOLOv5, the Conv2d layer was widely used at different layers of the network to extract features at different scales. Unlike traditional convolution operations, the Conv2d layer of YOLOv5 typically used small convolution kernels (3 × 3 or 1 × 1), which could reduce the number of parameters and, thus, optimize the operation speed. YOLOv5 also employed some optimization techniques, such as depthwise separable convolution to enhance efficiency. The BatchNorm2d layer was a normalization layer that could normalize each batch of data, thereby accelerating the training process of the network, while also alleviating the problems of gradient disappearance and explosion and improving the robustness and generalization ability of the model. In YOLOv5, the BatchNorm2d layer was usually applied after the Conv2d layer to normalize the feature maps, to further enhance the performance of the model. As shown in Formulas (1) and (2), SiLU was a new type of activation function, which was a linear combination of Sigmoid weighting. It could increase the nonlinear characteristics of the network, thus improving the expressiveness and accuracy of the model. Different from the traditional activation function, SiLU had the characteristics of symmetry and smoothness, and the SiLU function was differentiable everywhere and continuously smooth, which could effectively alleviate the problems of gradient disappearance and explosion and enhance the training speed and convergence of the model. In YOLOv5, the SiLU activation function was widely used in different levels of the Conv module to improve feature expression ability and detection accuracy.
S i L U x = x × S i g m o i d x
S i g m o i d x = 1 1 + exp x
The C3 module mainly consisted of three Conv modules and one Bottleneck module, as shown in Figure 6. This module mainly undertook the more important feature extraction function. The three Conv modules in this module were all 1 × 1 convolutions, which mainly controlled the size of the feature map and had almost no feature extraction function. The Bottleneck, here, used residual connections, as shown in Figure 7, which include two Convs, the first of which was 1 × 1 convolution, and reduce the number of channels to half of the original. The second one was a 3 × 3 convolution, doubling the number of channels, and, finally, added the input and output using a residual structure.
The design of the SPP module was based on the idea of pyramid pooling. It divided the input feature map into multiple scales and each scale with maximum pooling operation. The pooled results were spliced together to form a unified scale, as shown in Figure 8. The output size of the SPP module was not limited by the input size, which could adapt to different sizes of targets and improved the generalization ability of the network, so as to enhance the detection accuracy.
In object detection tasks, features of different scales have different importance for targets of different sizes and shapes. Therefore, in order to better deal with multi-scale targets, the target detection model usually introduces the Neck module. YOLOv5 used the Neck module to determine multi-scale feature fusion, which fused features from different layers of the Backbone network to optimize the accuracy of object detection. A feature of this module was that it used a top-down path aggregation approach, which could make full use of the semantic information of high-level features, while retaining the details of low-level features and improving the robustness and generalization ability of target detection. In addition, the Neck module could effectively handle objects of different sizes and shapes, improving the adaptability and flexibility of the model. YOLOv5 used three different scales of feature maps in the Output module, which could achieve good prediction accuracy for both large and small targets.

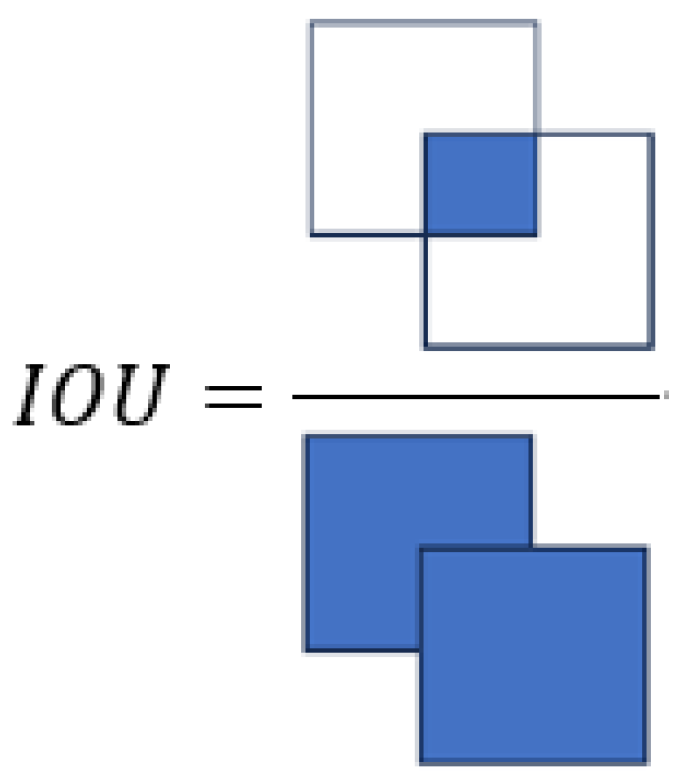
4.3. NMS (Non-Maximum Suppression)
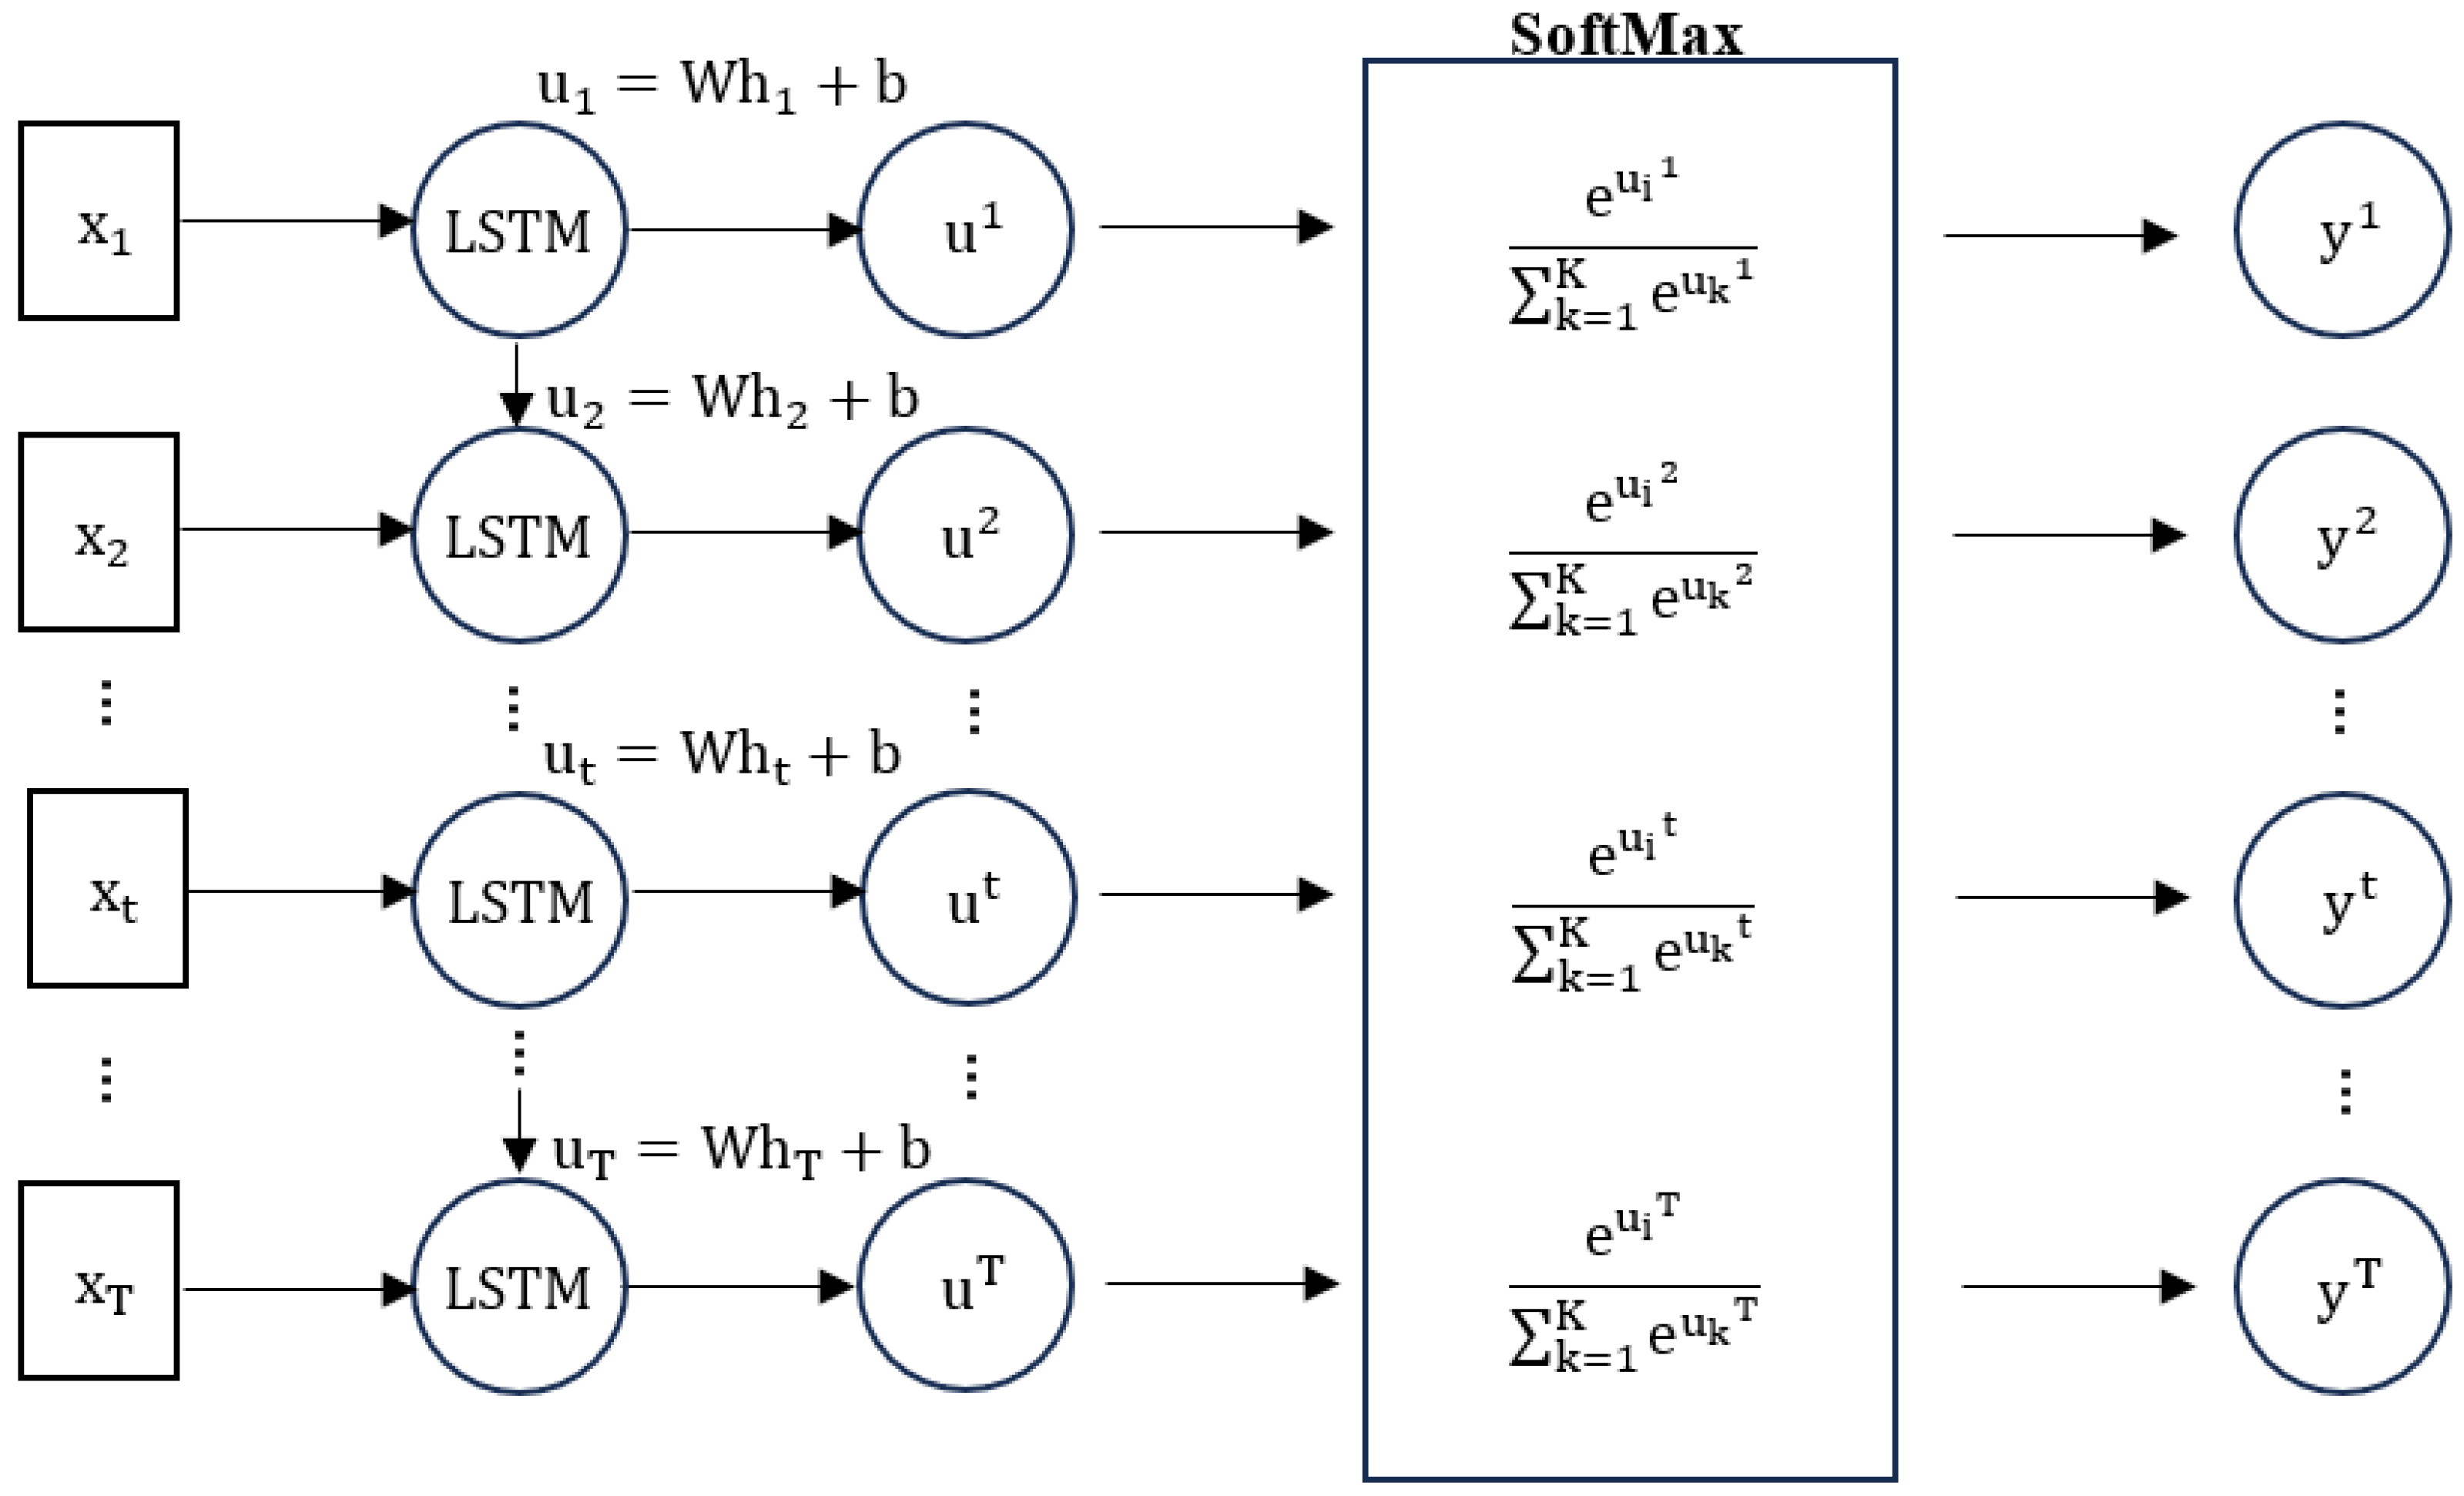
In the process of object detection, a large number of candidate boxes could be generated in the same object and these candidate boxes could overlap with each other, so the model adopted the NMS (non-maximum suppression) method to find the best object detection box and remove redundant boundary boxes to achieve the best effect. This algorithm mainly has three steps. Firstly, it sorted the confidence of all candidate boxes in descending order. Then, it selected the candidate box with the highest confidence, calculated the IOU between other candidate boxes and this candidate box, as shown in Figure 9, and deleted candidate boxes with an IOU threshold greater than 0.6. The algorithm repeated the above operation in the remaining candidate boxes, until all candidate boxes were processed, and obtained the best prediction box. After the detection was completed, there were three candidate boxes for red blood cells on the left of Figure 10. The best candidate box was finally obtained through NMS (non-maximum suppression), as shown on the right of Figure 10.

4.4. Text OCR Layer

The text OCR layer mainly performed text recognition on objects with YOLOv5 detection results as learning targets, so as to identify specific learning objects. The main steps are shown in Figure 11. The text OCR layer of this system used the CRNN model. The architecture of the CRNN model consisted of the following three parts: a Convolutional Layer (CNN), a Recurrent Layer (RNN), and a Fully Connected Layer. As shown in Figure 12, features were extracted using CNN first, followed by classification using recurrent neural networks and SoftMax to obtain output, before, finally, being combined with CTC to determine the characters.
In OCR training, the CTC loss function was used for backpropagation. As shown in Formulas (3) and (4), the CTC loss function was the sum of the probabilities of all possible paths with a result of l, given input x, where pi represented the path equal to l after being changed by B. Because the CTC loss function could compare sequences of different lengths, the input sequence could be mapped to the output sequence, while allowing a certain sequence alignment error, thus improving the robustness and generalization performance of the model.
p l x = π B 1 l p π x
As shown in Figure 13, the model clipped the image containing word objects, according to the boundary box. The clipping result was shown on the left of Figure 14. Then, the text information in the image was recognized according to the learned features. The recognition result was shown on the right of Figure 14, where the string represents the recognized text content and the corresponding probability. By following the above steps, the corresponding target object could be accurately identified.

5. Function Implementation and Analysis

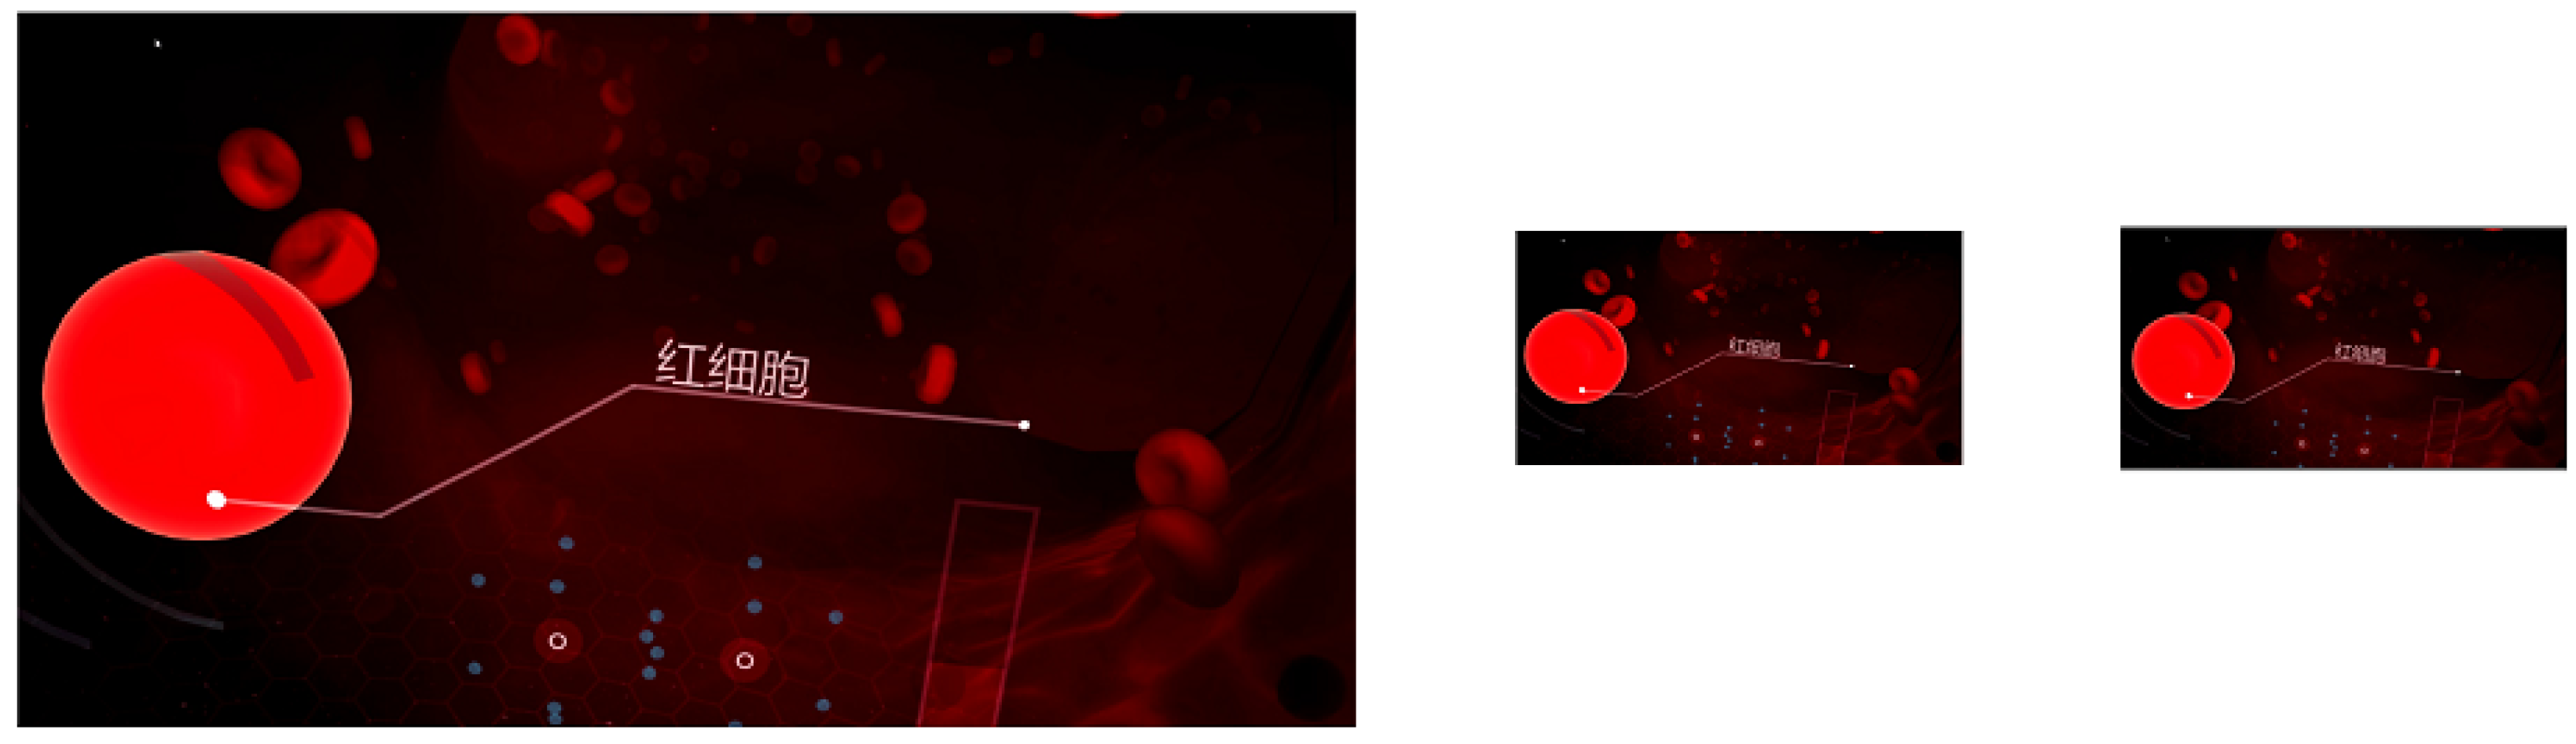
5.1. Video Frame Cutting Module

Using the OpenCV library is a common technique in IVR teaching video processing and analysis. In this module, the OpenCV library was used to segment IVR videos and convert each frame into an image. Since the YOLOv5 network does not require the size of the input image, the image after frame cutting can be directly processed in the next module. During this process, a single IVR learning video was selected for video frame cutting, generating a total of 24,123 frames of images, as shown on the left in Figure 15. The first frame, 10,001st frame, and last frame images are shown on the right side of Figure 15 and Figure 16. On the left side of Figure 15, there is a folder corresponding to the image and the Chinese text is mainly related to the folder. The Chinese names in the remaining images mainly indicate the beginning and end of IVR learning videos.

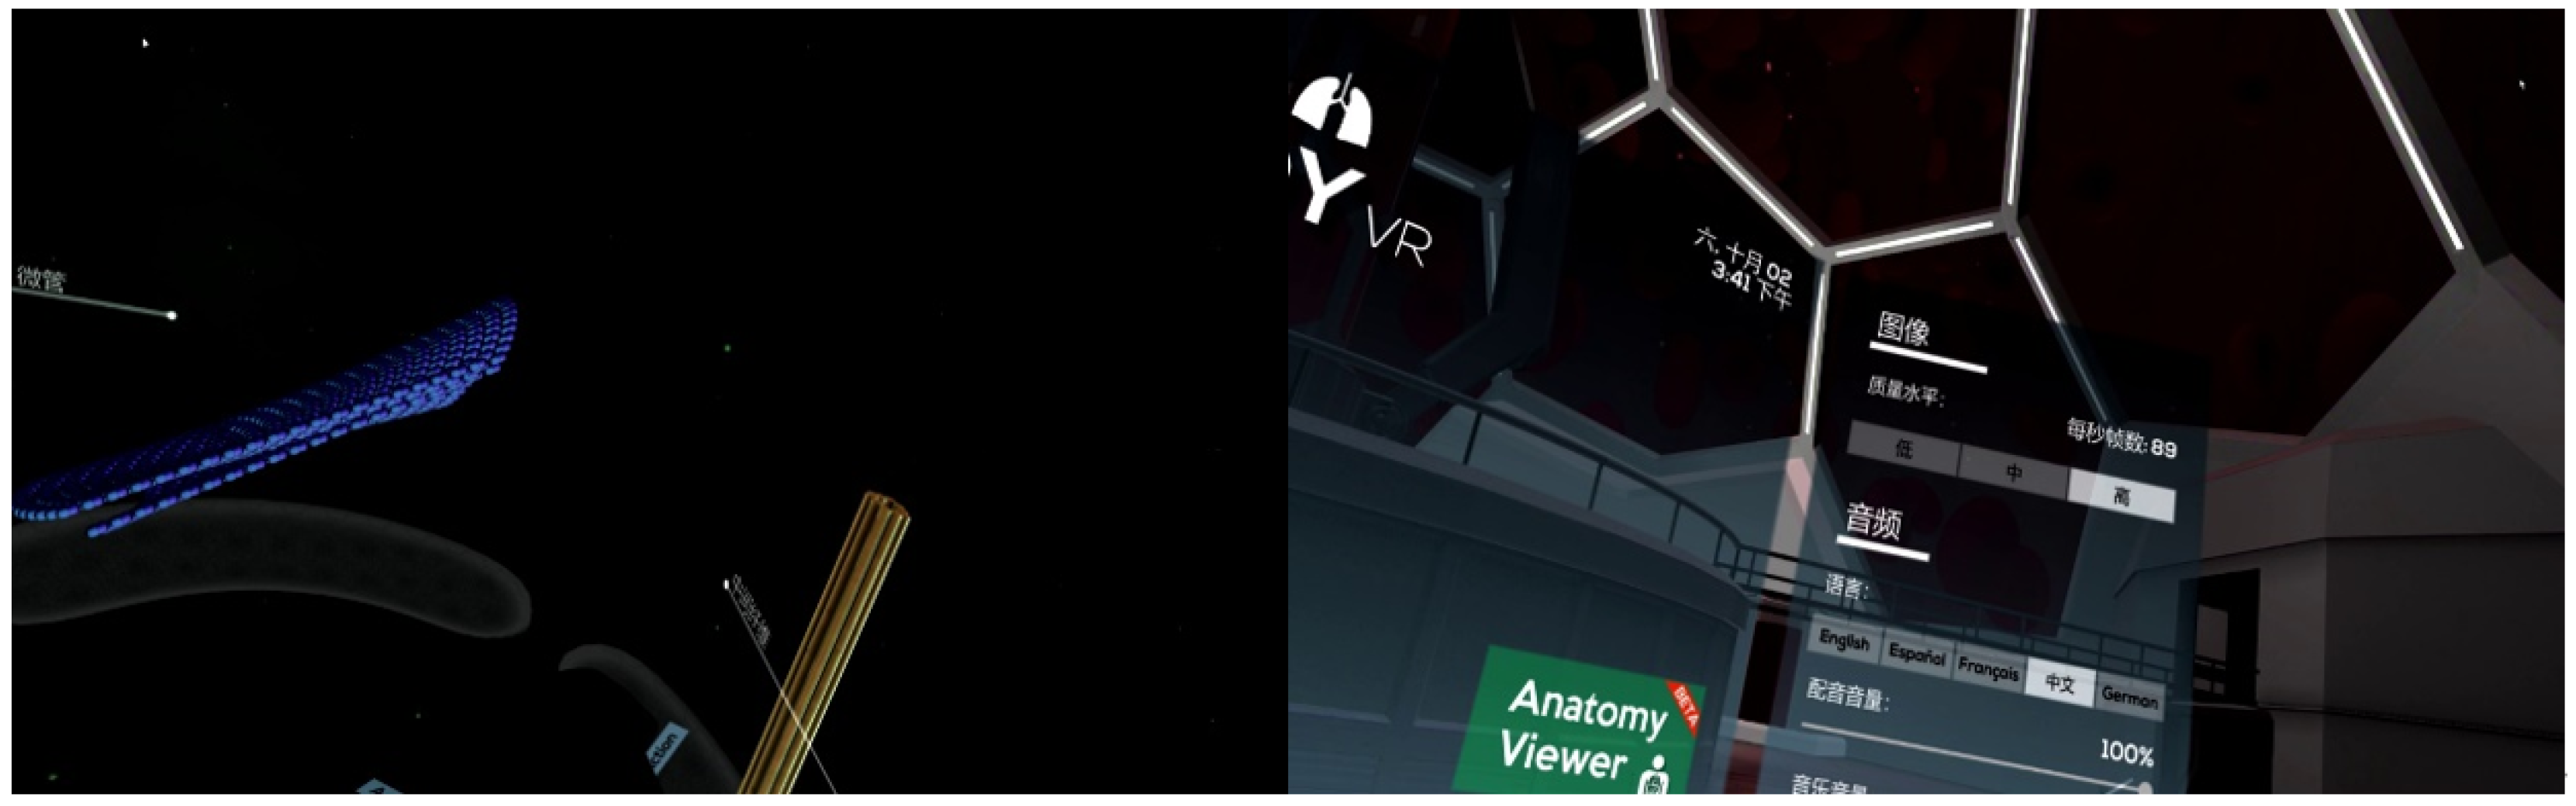
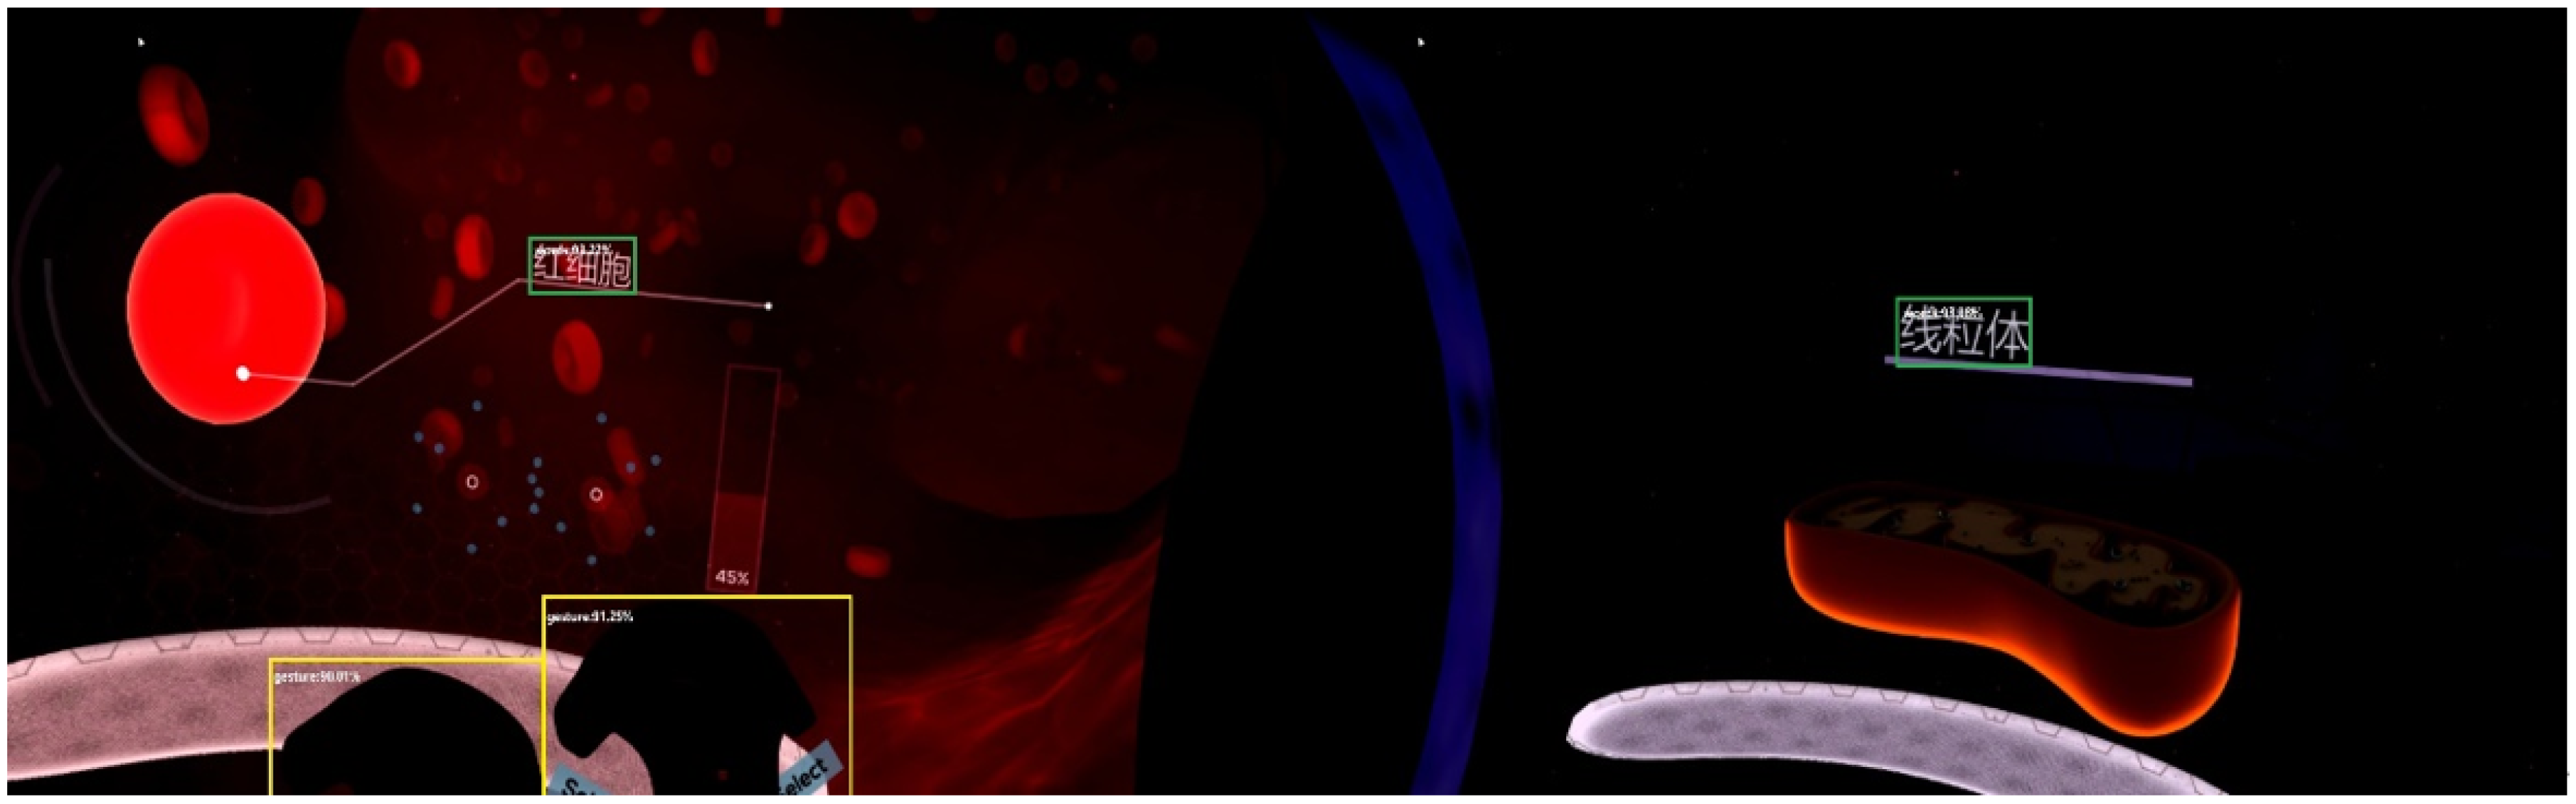
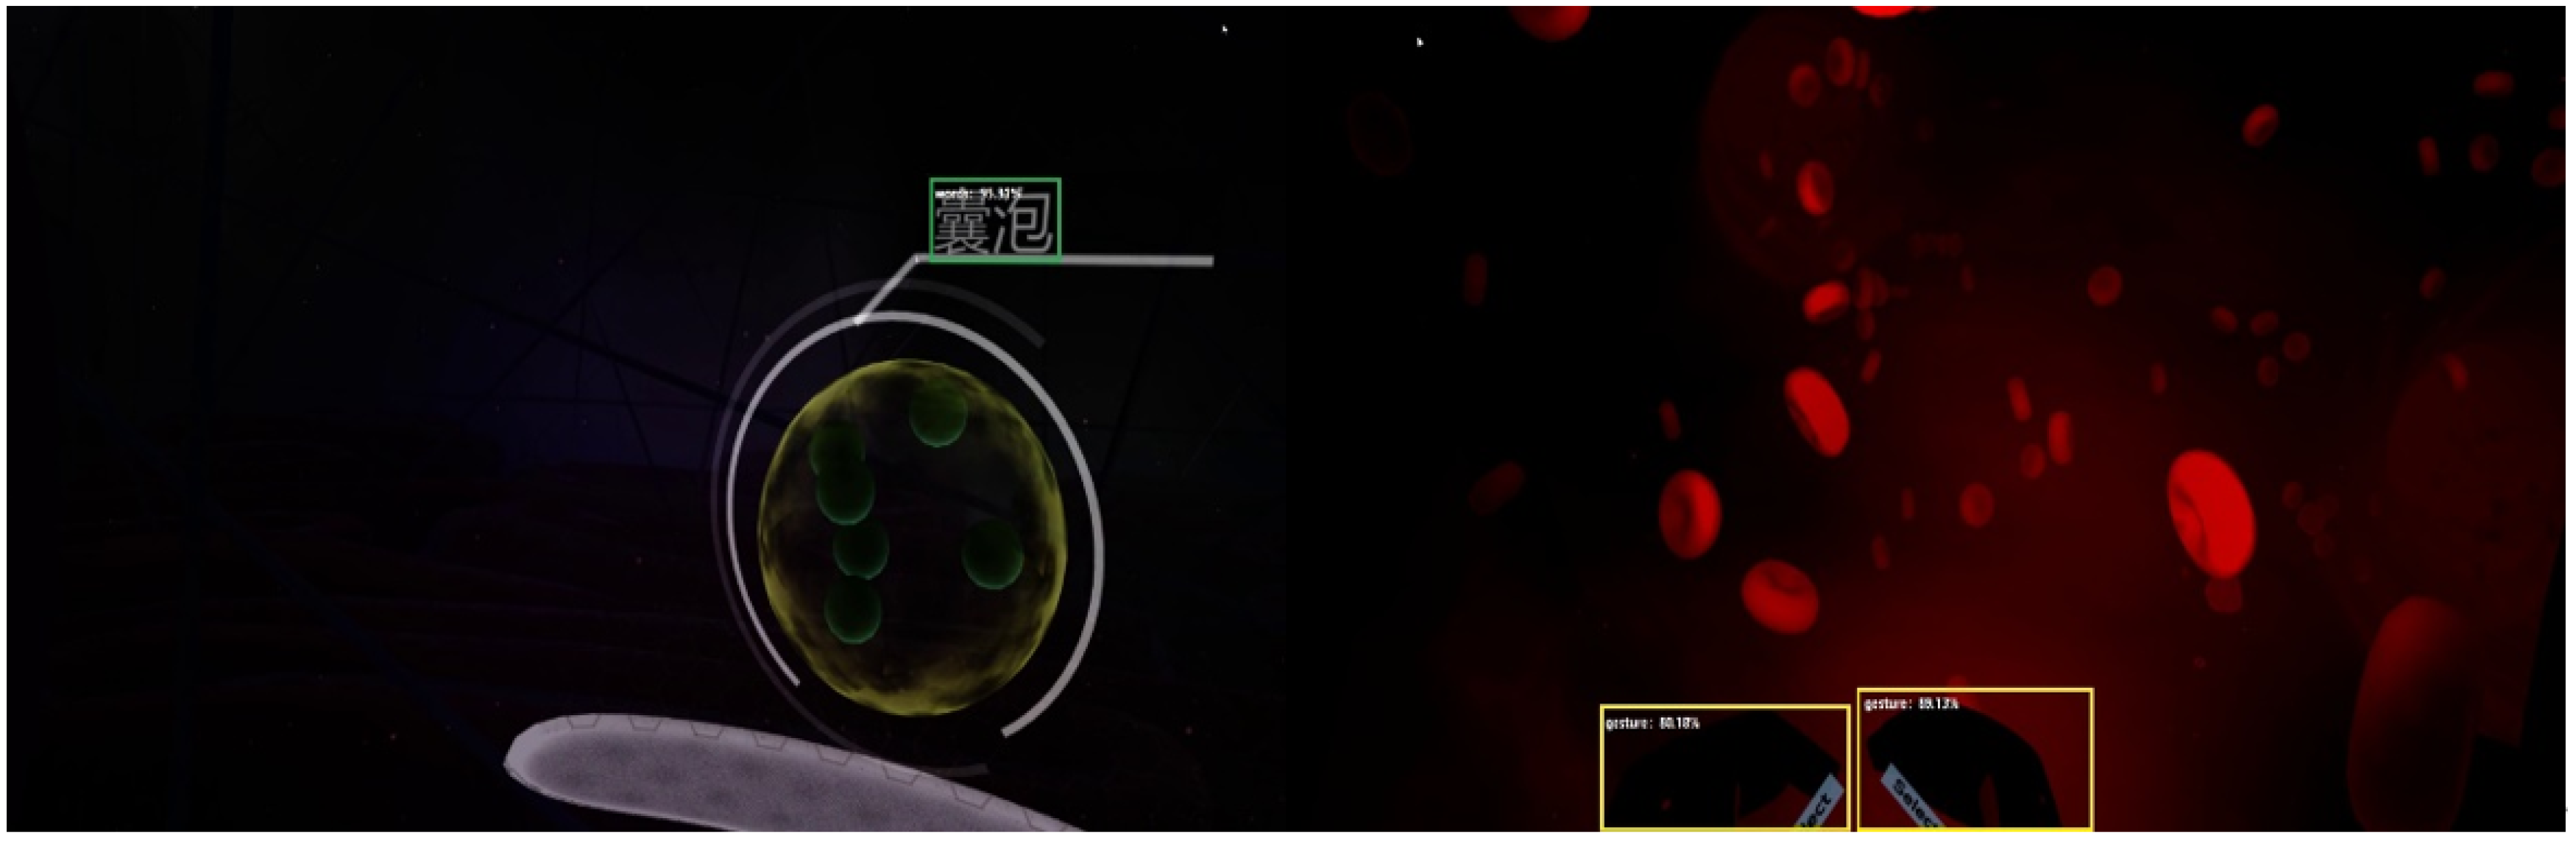
5.2. YOLOv5 Detection Module

In the processing and analysis of the IVR teaching video, the YOLOv5 module received the cut frame image from the previous module and detected the target of the image based on the pre-trained weight value. As shown in Figure 17 and Figure 18, this module divided the detection objects into learning objects (words) and gesture objects (gesture). After detection, information such as the window coordinates, predicted category, and confidence levels of each target could be obtained. Then, the YOLOv5 detection module will transfer the detected target to the next module for processing.
In this process, the module function received the input image and a threshold parameter. Firstly, the input image was pre-processed, then the target detection result was predicted, the model performed non-maximum suppression on the prediction result to achieve the purpose of filtering the overlapping boundary box, and filtered this according to the confidence threshold.

5.3. Text OCR Detection Module

Text OCR detection is an important task in IVR teaching video processing analysis, which can be used to identify text information in the video. This module further identified the learning target objects (words), which were divided into 18 learning target objects, containing red blood cells, white blood cells, platelets, cell membranes, water, oxygen, glucose, microfilaments, intermediate fibers, microtubules, kinesin, nucleus, nuclear membrane pores, deoxyribonucleic acid, ribosomes, vesicles, mitochondria, etc. To achieve this task, the CRNN model can be used. The CRNN model is a deep learning model that can be trained on convolutional neural networks and recurrent neural networks simultaneously to complete text recognition tasks. The model identified the text information in the image, according to the learned features, and output a string as the detection result, combining the detection result with the target box, as shown in Figure 19. This string represented the recognized text content and the corresponding probability, such as the name of a learning target and the probability of being predicted as that learning target.

5.4. Intelligent Analysis of Learning Engagement

This module mainly integrates and intelligently analyzes the testing data. The integration process of detection data is shown in Figure 20. Due to the constantly changing perspective of IVR videos, this may lead to recognition errors in object detection or text OCR detection. This model designed a fuzzy algorithm for target detection and tracking and set up a detection target pool during the detection process. When an object was detected in a certain frame of an image and confirmed as a target through OCR detection, it was added to the target pool. If an object with the same name already existed in the target pool, the object was merged and refreshed. When the continuous frame rate exceeded the set threshold, but no object was detected, segmentation was performed. The segmented object needed to be reviewed by the decision layer to determine whether it was within the frame rate range in the target pool and whether the ratio of object detection times to the length of the frame rate range exceeded the set threshold. If it exceeds the set threshold, it would be added to the result pool; otherwise, it would be deleted. After the video frame cutting detection was completed, all detection objects are submitted to the decision layer for review and the legitimate data is written into the result pool. Finally, the data in the result pool were formatted and saved to a CSV file.
By comparing the objects automatically recognized by the system (red blood cells, white blood cells, platelets, cell membranes, water, oxygen, glucose, microfilaments, intermediate fibers, microtubules, kinesin, nucleus, nuclear membrane pores, deoxyribonucleic acid, ribosomes, vesicles, mitochondria, and handle objects) with manually annotated objects, the accuracy rate of the system’s intelligent recognition was determined. Figure 21 shows the total number of frames detected for various learning target objects and the controller interaction object in a single IVR learning video, as well as the total number of frames that actually appear. It can be seen that the system has a high intelligence recognition accuracy. Figure 22 is a graph of accuracy for each object. The average accuracy was around 98%. The research showed that this method can effectively identify the learning target objects and the handle interaction objects in IVR learning.

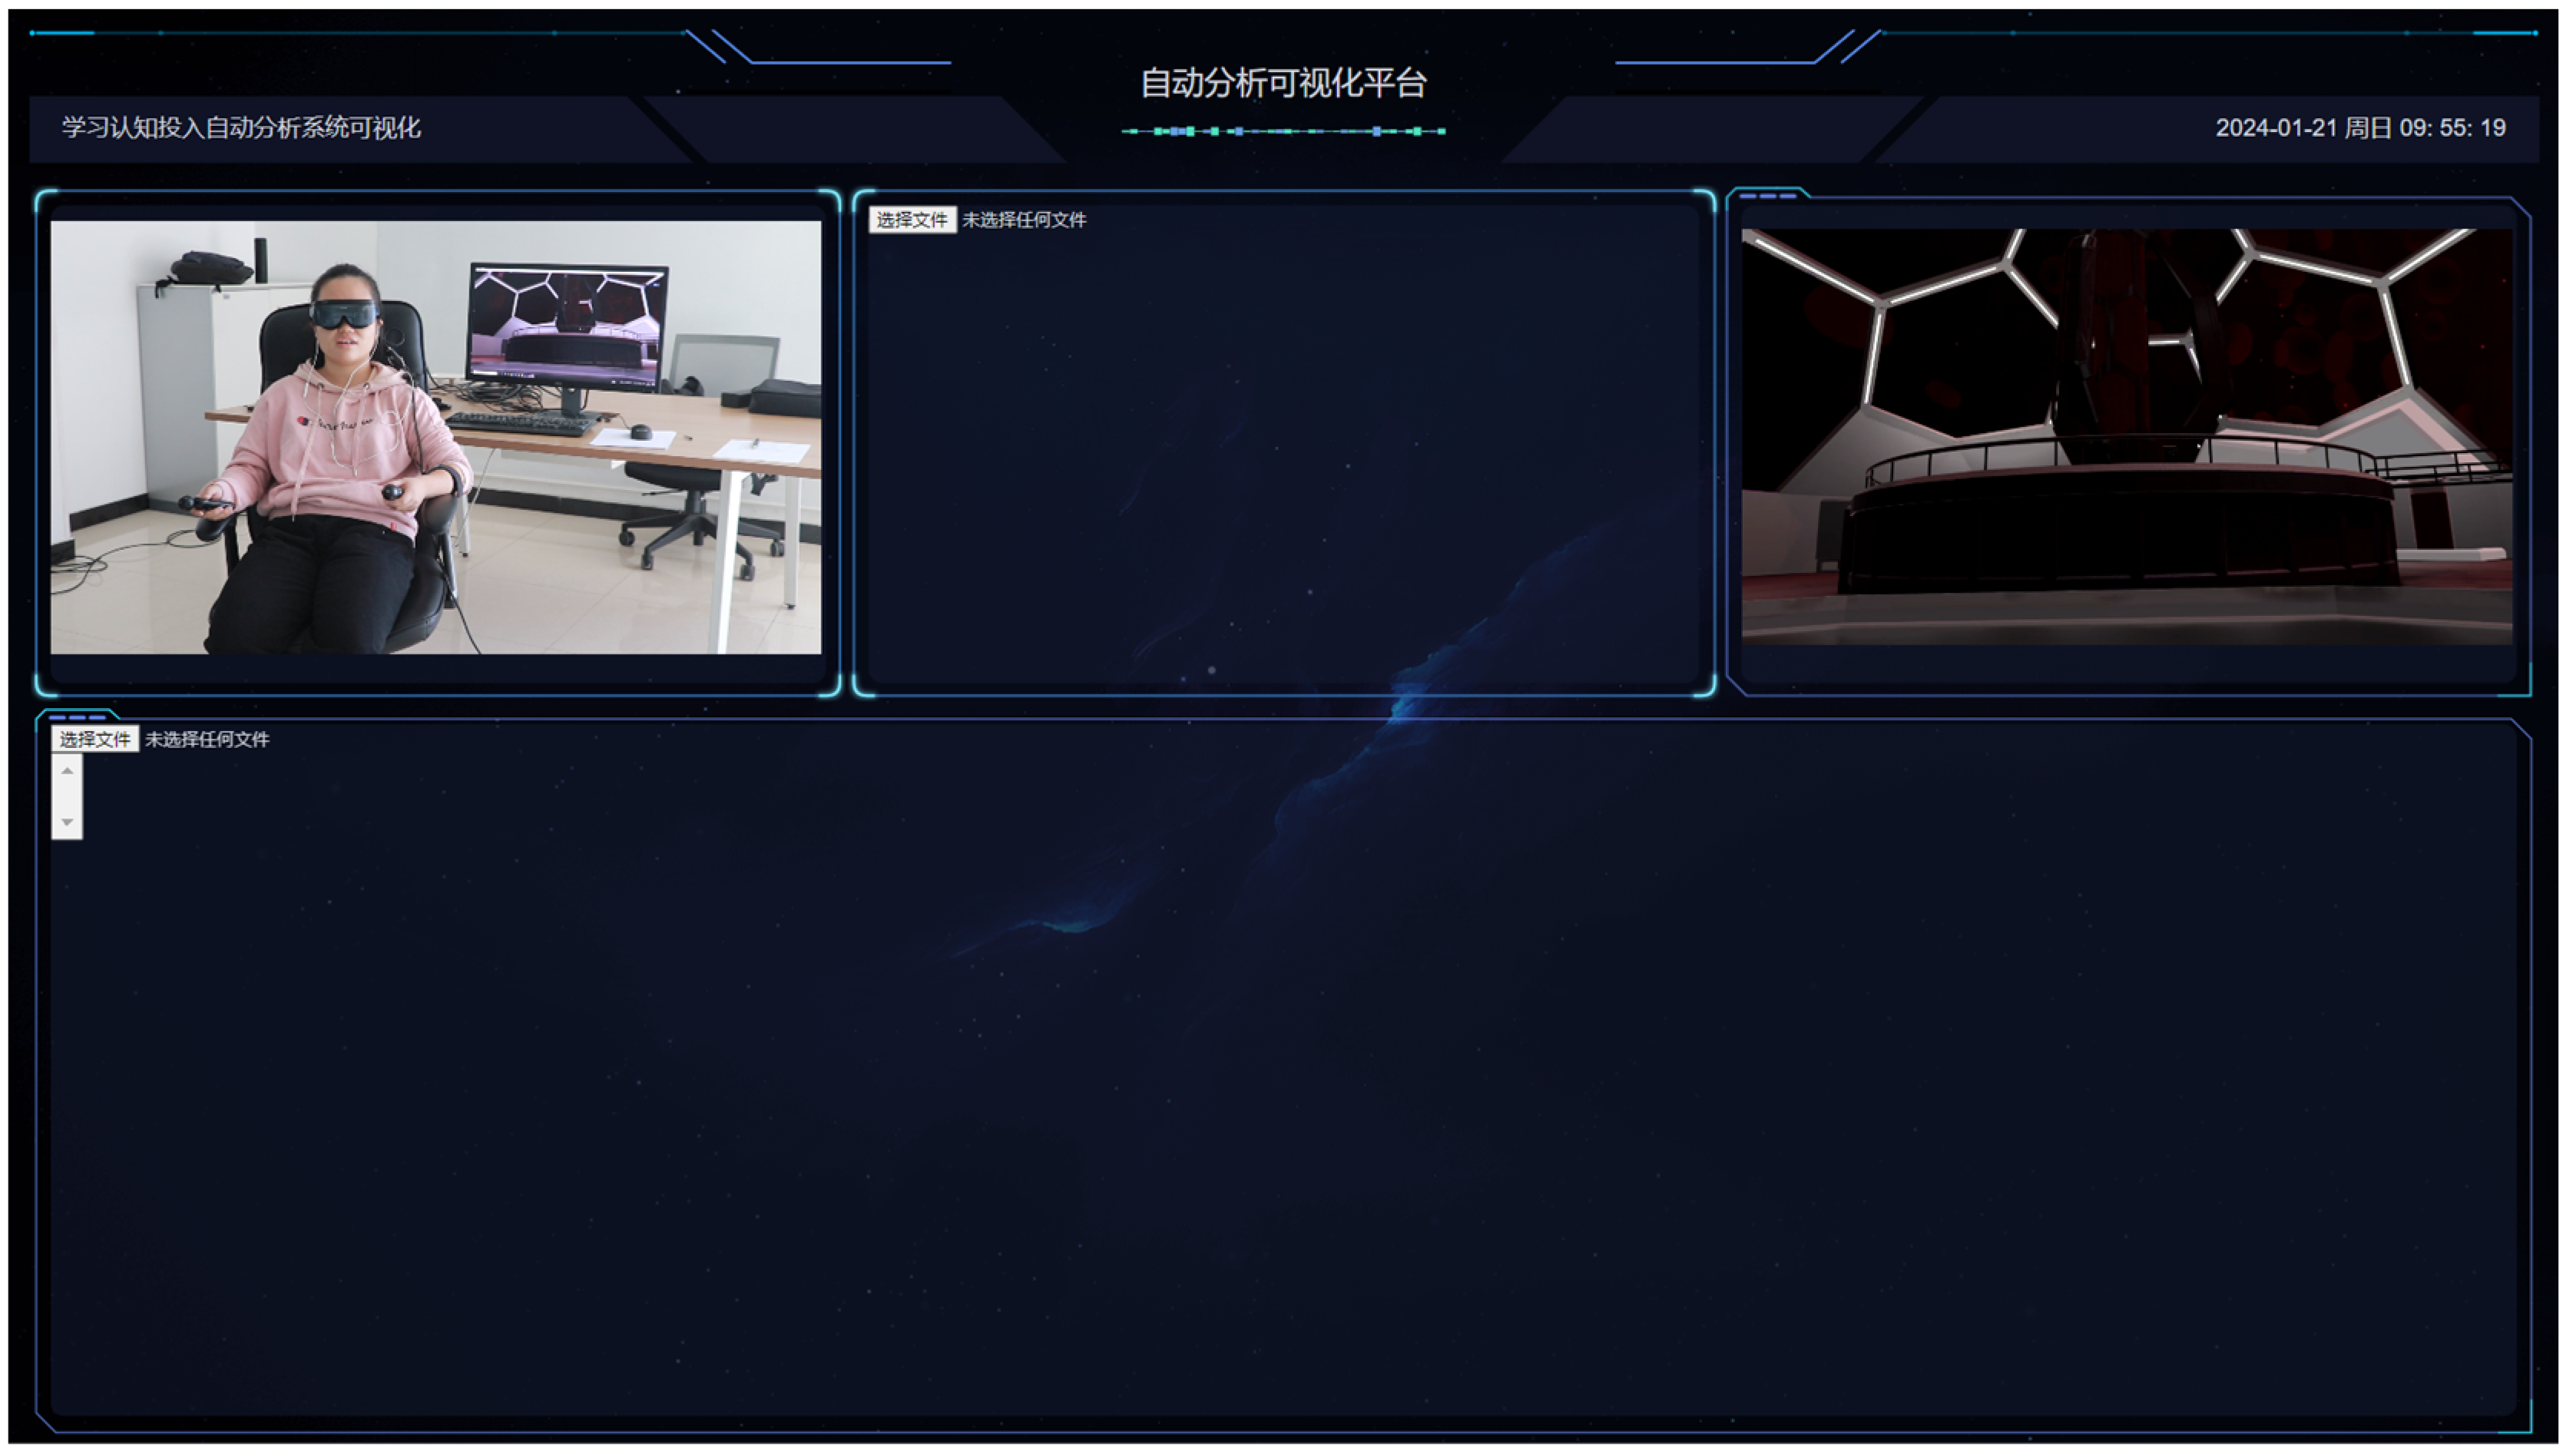
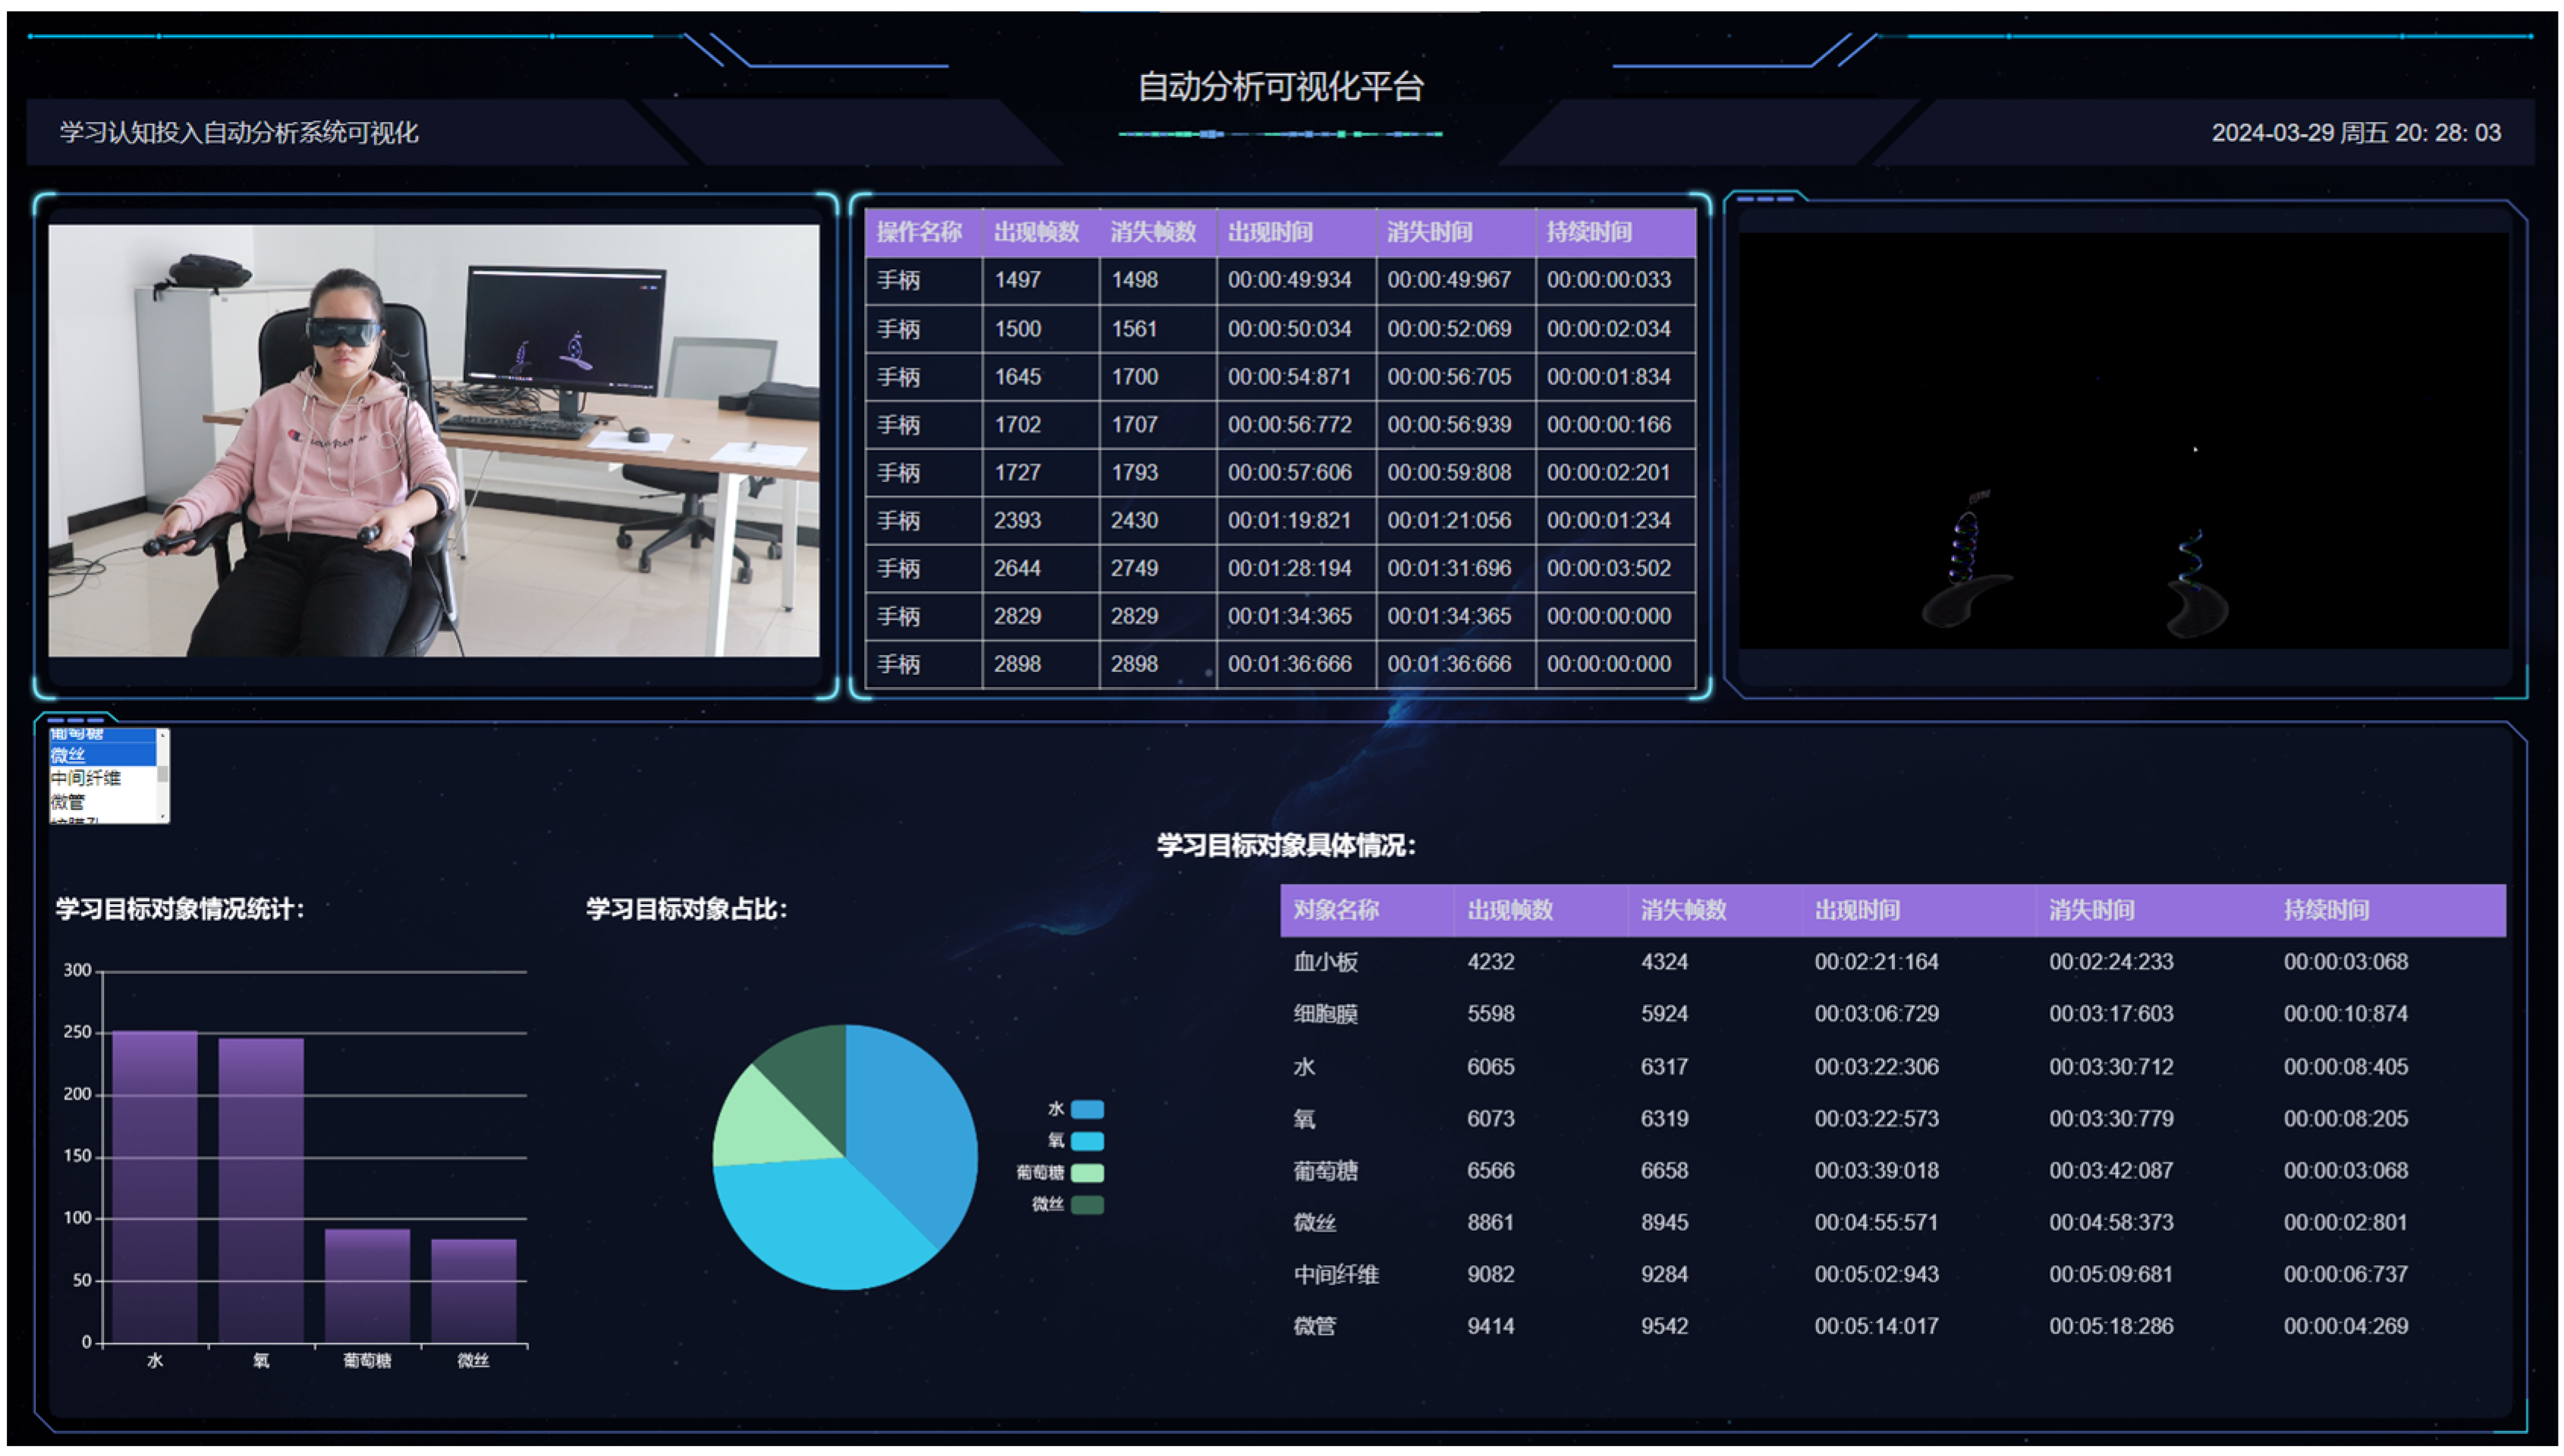
5.5. Visualization of Cognitive Situations

The module mainly used Vue and ECharts for visual display. Vue was used to build pages and views and ECharts was used to create various interactive icons, as well as to display and analyze various data. This module mainly displayed the students’ learning content videos, operation videos, and test results in the IVR environment. The main page, shown in Figure 23, was mainly divided into four areas, two of which are used to display student learning videos and operation videos in the IVR environment. The other two areas were used to visualize the detection results of the video. You could select the corresponding video file to display on the page, as shown in Figure 24. The module selected the operation detection result file corresponding to the video and performed a round-robin display, displaying nine pieces of information each time and the display was playing in a loop. Each piece of information had an operation name, occurrence frame rate, disappearance frame rate, occurrence time, disappearance time, and duration, which could visually display the handle operation information. One part of the Chinese content in Figure 23 and Figure 24 is the system display content, “Automatic Analysis Visualization Platform, Learning Cognitive Input Automatic Analysis System Visualization, System Corresponding Time”; the other part was the “Select File” information for visualization.
Selecting the detection learning target object result file corresponding to the video could be visualized in three forms, as follows: carousel, bar chart, and pie chart. Among them, a carousel was used to display the specific situation of the learning target object. Eight pieces of information were displayed each time in chronological order. Each piece of information included six pieces of information, including object name, occurrence frame rate, disappearance frame rate, occurrence time, disappearance time, and duration. The display of bar charts and pie charts could select visualization objects, which could increase or decrease the number of statistical objects. On the left of Figure 25, four objects, including oxygen, water, glucose, and microfilaments, were selected for visual display. The bar chart was used to display the total number of frames of corresponding objects in the IVR video and the pie chart showed the proportion of corresponding objects. In the figure, the Chinese information is mainly displayed in the system title and table header.
Through this system, students and teachers could more intuitively observe students’ cognitive engagement in learning and teachers could choose designated learning target objects for statistics through interaction, promoting the development of intelligent education.

6. Analysis of Experimental Results

6.1. Experimental Environment

The computer hardware conditions used in the experiment in this paper are Intel Core i5-10200H CPU (Intel, Santa Clara, CA, USA), NVIDIA 4G graphics memory 1650GPU and 8G RAM (NVIDIA, Santa Clara, CA, USA). Some experiments were completed on NVIDIA Tesla graphics cards, with Windows 10 (developed by Microsoft, located in Washington, DC, USA) operating system, Python version 3.8 (developed by Python Software Foundation, located in Portland, OR, USA), and CUDA (developed by Nvidia Corporation, located in Shenzhen, China) version CUDA11. This system page was mainly completed using Vue (developed by Evan You, located in Wuxi, China) and Echarts (developed by Baidu, located in Beijing, China). The algorithm mainly used the Python framework and, in Python, the NumPy 1.23.5 (developed by Python Software Foundation, located in Portland, OR, USA), Sklearn (developed by Scikit-learn’s open source project team, located in Paris, France) 0.11.2, Matplotlib (developed by John D. Hunter, located in Tennessee) 3.7.2, Seaborn (developed by Michael Waskom, located in San Francisco, CA, USA) 0.11.2, Pandas (developed by Wes McKinney, located in New York, NY, USA) 2.0.3, and OpenCV (developed by Intel, located in California) 4.5.1 libraries were mainly used.

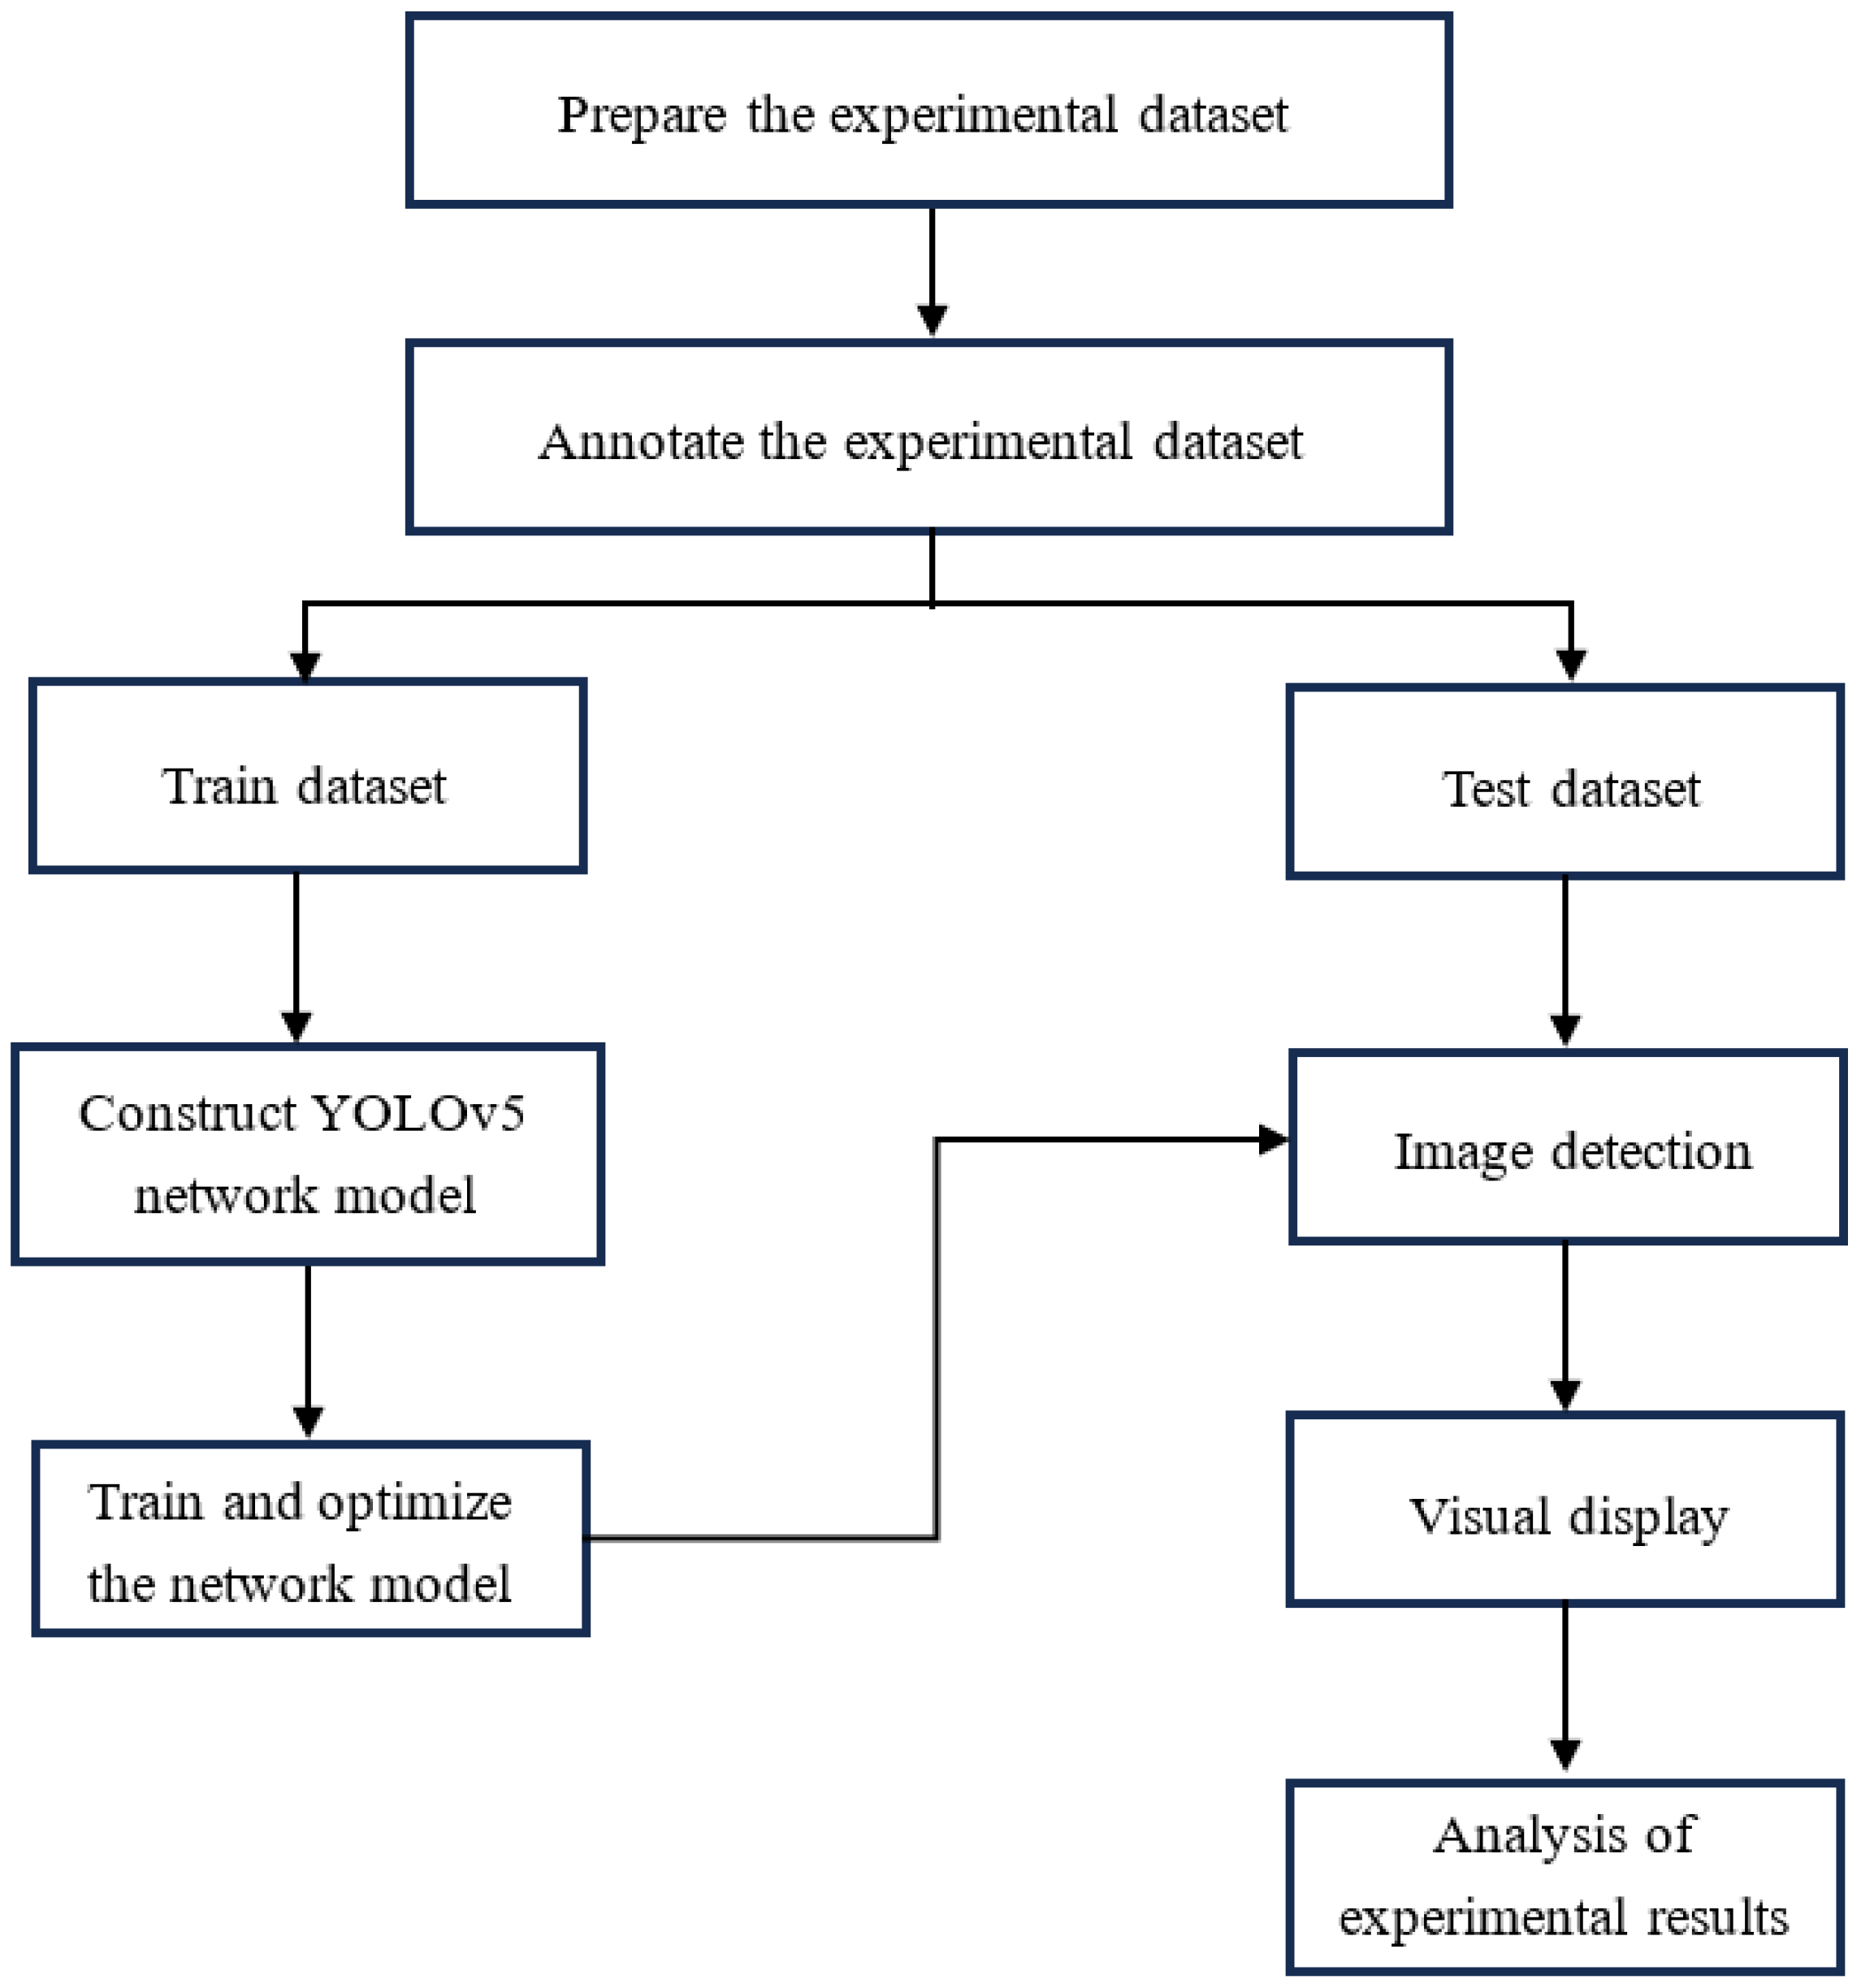
6.2. Experimental Process

This article constructs the YOLOv5 network structure for object detection in images, which is divided into learning target objects and handle interaction objects. Industry conventions were strictly followed in this study, with special attention being paid to privacy and security issues of videos and images. The experimental process is shown in Figure 26 and the main operating procedures are described as follows:
(1)
Cut the video frames to obtain image data and filter it, use Labelme software v1.0 to manually annotate the images, and obtain training and testing sets.
(2)
Designed and built YOLOv5 image target detection model and continuously optimized parameters to complete the adjustment of network structure parameters.
(3)
Load the pre-processed training set for network iterative training until the accuracy of the loss rate of the network model becomes stable, then the training ends.
(4)
Save the wordsDet.pt model file generated by the final training for calling the test set image data.
(5)
Analyze the experimental results to verify the effectiveness and accuracy of the algorithm proposed in this paper.

6.3. Analysis of Experimental Results

To evaluate the detection accuracy, we collected the dataset with 216 IVR videos for biology teaching. The dataset has 2 splits and contains 216 RGB video data taken of 54 individuals, performing 2 experiments, twice, learnt in a Biology class. The dataset has 18 object classes with 24,123 frames of annotated data. Among them, 2/3 are used for the training set and the other third is used for testing. The dataset is an expanding version on the basis of the preliminary study on the evaluation of the cognitive engagement model with Capital Normal University.
This article selects overall accuracy to evaluate the performance of the model, which represents how many correctly predicted samples are identified as corresponding categories and is commonly used to evaluate the performance of the model. NTP is enabled to represent the number of objects that the model correctly recognizes as the target object; NFP represent the number of non-objects recognized by the model as target objects; the definition formula of the model evaluation indicator is as follows (5):
P r e c i s i o n = N T P N T P + N F P
For comparison, we test the detection accuracy of visual learning objects. The overall accuracy of our approach is about 98% on the dataset, while the method performed by Liming et al. [34] is 97%, which indicates that our approach can effectively distinguish the learning objects and the controller interaction objects.
Furthermore, we also evaluate the performance of the proposed approach on the dataset in terms of learning effect. Due to the small sample size and the data not obeying the normal distribution, the Spearman correlation analysis method is used in this study. We first conduct statistics on visual coverage (the object is detected in the students’ view), visual attention duration (the object is detected in a period of time from the students’ view) of learning object, then make the correlation analysis between visual coverage, attention duration, knowledge retention, and knowledge transfer. The results are shown in Table 1.
As shown in Table 1, it can be observed that the visual coverage of learning object (the students noticing the learning object) is significantly correlated with students’ knowledge retention scores, as well as with their knowledge transfer scores at the same level of significance. However, the visual attention duration of the learning object does not exhibit a significant correlation with the students’ knowledge retention scores or knowledge transfer scores. The result suggests that in an IVR environment, whether students notice important learning object or not will impact their final knowledge retention and knowledge transfer scores, but the visual attention duration of the learning object does not significantly affect their performance in knowledge retention and transfer.

7. Conclusions

In this study, computer vision technology was used to automatically evaluate students’ Teaching and Learning Cognitive engagement in an IVR environment. Combining information processing theory and embodied cognition theory, this study aimed to monitor and visualize visual attention and behavioral actions. After research, it was found that the accuracy of the system was close to 98%, which can effectively monitor and analyze the learners’ cognitive engagement in learning and visualize their learning status.
Although some achievements have been made in this research, there are still some problems and challenges. Due to the small sample size, it is necessary to continuously expand the sample size in the future, thereby further improving the algorithm and function of the system and enhancing the evaluation and analysis ability of students’ cognitive engagement in learning. This study only considered automatic analysis and evaluation from the perspectives of visual attention and behavioral actions. In future research, learning cognitive engagement can be evaluated from other perspectives. For example, cognitive load and learning outcomes. At the same time, multiple models can be compared to determine better models. In addition, the effectiveness and practicality of the system can be further improved and optimized by combining user feedback evaluation.

Author Contributions

Conceptualization, C.L. and D.W.; Data curation, C.L. and L.W.; Formal analysis, C.L.; Funding acquisition, C.L. and D.W.; Investigation, C.L., L.W. and Q.L.; Methodology, C.L. and L.W.; Project administration, C.L., Q.L. and D.W.; Resources, C.L., L.W. and Q.L.; Supervision, C.L.; Validation, C.L. and L.W.; Visualization, L.W.; Writing—original draft, C.L. and L.W.; Writing—review and editing, C.L. and L.W. All authors have read and agreed to the published version of the manuscript.

Funding

This work is sponsored by the National Natural Science Foundation of China (62176260, 62076016, 61972016), the Beijing Municipal Natural Science Foundation (4202065), the Beijing Nova Program of Science and Technology (Z211100002121147, Z191100001119106), and the National Key Research and Development Program of China (2021YFC3090304).

Institutional Review Board Statement

Not applicable.

Informed Consent Statement

Not applicable.

Data Availability Statement

The data presented in this study are available on request from the corresponding author due to this project just starting and not being complete, the data collection is still ongoing and cannot be made public temporarily.

Conflicts of Interest

The authors declare no conflicts of interest.

References

  1. Dincă, M.; Berge, T.; Onițiu, A.; Thomassen, M.; Luștrea, A.; Lucheș, D.; Crașovan, M. Immersive Team-Based Learning in Transnational Virtual Classrooms. Eur. Rev. Appl. Sociol. 2023, 16, 51–70. [Google Scholar] [CrossRef]
  2. Gunawan, A.; Wiranto, N.; Wu, D. Application of virtual reality in diverse fields of study in education sector: A systematic literature review. Procedia Comput. Sci. 2023, 227, 948–957. [Google Scholar] [CrossRef]
  3. Cho, Y.; Park, K.S. Designing Immersive Virtual Reality Simulation for Environmental Science Education. Electronics 2023, 12, 315. [Google Scholar] [CrossRef]
  4. Yan, S. The Application of Virtual Reality Technology in Higher Education and Its Impact on Student Learning Performance. Educ. Rev. USA 2023, 7, 1808–1812. [Google Scholar] [CrossRef]
  5. Predescu, S.L.; Caramihai, S.I.; Moisescu, M.A. Impact of VR application in an academic context. Appl. Sci. 2023, 13, 4748. [Google Scholar] [CrossRef]
  6. Ferdinand, J.; Gao, H.; Stark, P.; Bozkir, E.; Hahn, J.U.; Kasneci, E.; Göllner, R. The impact of a usefulness intervention on students’ learning achievement in a virtual biology lesson: An eye-tracking-based approach. Learn. Instr. 2024, 90, 101867. [Google Scholar] [CrossRef]
  7. Wei, Z.; Yuan, M. Research on the Current Situation and Future Development Trend of Immersive Virtual Reality in the Field of Education. Sustainability 2023, 15, 7531. [Google Scholar] [CrossRef]
  8. Yu, Z. A meta-analysis of the effect of virtual reality technology use in education. Interact. Learn. Environ. 2023, 31, 4956–4976. [Google Scholar] [CrossRef]
  9. Liao, X. Immersive Learning: Characteristics of Development of VR Education Technology and the Practice. Adv. Educ. Technol. Psychol. 2023, 7, 107–111. [Google Scholar]
  10. Makransky, G.; Petersen, G.B.; Klingenberg, S. Can an immersive virtual reality simulation increase students’ interest and career aspirations in science? Br. J. Educ. Technol. 2020, 51, 2079–2097. [Google Scholar] [CrossRef]
  11. Lui, M.; McEwen, R.; Mullally, M. Immersive virtual reality for supporting complex scientific knowledge: Augmenting our understanding with physiological monitoring. Br. J. Educ. Technol. 2020, 51, 2180–2198. [Google Scholar] [CrossRef]
  12. Wang, H. Exploration of Evaluation Method for Achievement of Learning Effectiveness Based on Virtual Reality Technology. Int. J. Math. Syst. Sci. 2023, 6, 3742. [Google Scholar]
  13. Mousavi, S.M.; Powell, W.; Louwerse, M.M.; Hendrickson, A.T. Behavior and self-efficacy modulate learning in virtual reality simulations for training: A structural equation modeling approach. Front. Virtual Real. 2023, 4, 1250823. [Google Scholar] [CrossRef]
  14. Li, W.; Liu, X.; Zhang, Q.; Zhou, B.; Wang, B. VR-Enhanced Cognitive Learning: Method, Framework, and Application. Appl. Sci. 2023, 13, 4756. [Google Scholar] [CrossRef]
  15. Chen, J.; Fu, Z.; Liu, H.; Wang, J. Effectiveness of Virtual Reality on Learning Engagement: A Meta-Analysis. Int. J. Web-Based Learn. Teach. Technol. (IJWLTT) 2023, 19, 1–14. [Google Scholar] [CrossRef]
  16. Kang, J. Effect of Interaction Based on Augmented Context in Immersive Virtual Reality Environment. Wirel. Pers. Commun. 2018, 98, 1931–1940. [Google Scholar] [CrossRef]
  17. Chen, S.; Li, Q.; Wang, T. Smart Campus and Student Learning Engagement. Int. J. Inf. Commun. Technol. Educ. (IJICTE) 2024, 20, 1–22. [Google Scholar] [CrossRef]
  18. López-Banet, L.; Martínez-Carmona, M.; Reis, P. Effects of an intervention on emotional and cognitive engagement in teacher education: Scientific practices concerning greenhouse gases. In Frontiers in Education; Frontiers Media SA: Lausanne, Switzerland, 2024; Volume 9, p. 1307847. [Google Scholar]
  19. Prayogo, A.; Khotimah, K.; Istiqomah, L.; Maharsi, I. Students’ emotional engagement in online classes: A conceptual framework. Int. J. Inf. Learn. Technol. 2024, 41, 61–72. [Google Scholar] [CrossRef]
  20. Pan, X. Online Learning Environments, Learners’ Empowerment, and Learning Behavioral Engagement: The Mediating Role of Learning Motivation. SAGE Open 2023, 13, 21582440231205098. [Google Scholar] [CrossRef]
  21. Essoe, J.K.Y.; Reggente, N.; Ohno, A.A.; Baek, Y.H.; Dell’Italia, J.; Rissman, J. Enhancing learning and retention with distinctive virtual reality environments and mental context reinstatement. NPJ Sci. Learn. 2022, 7, 31. [Google Scholar] [CrossRef] [PubMed]
  22. Parong, J.; Mayer, R.E. Cognitive and affective processes for learning science in immersive virtual reality. J. Comput. Assist. Learn. 2020, 37, 226–241. [Google Scholar] [CrossRef]
  23. Kim, C.; Cha, H.S.; Kim, J.; Kwak, H.; Lee, W.; Im, C.H. Facial Motion Capture System Based on Facial Electromyogram and Electrooculogram for Immersive Social Virtual Reality Applications. Sensors 2023, 23, 3580. [Google Scholar] [CrossRef] [PubMed]
  24. Hütten, N.; Alves Gomes, M.; Hölken, F.; Andricevic, K.; Meyes, R.; Meisen, T. Deep Learning for Automated Visual Inspection in Manufacturing and Maintenance: A Survey of Open-Access Papers. Appl. Syst. Innov. 2024, 7, 11. [Google Scholar] [CrossRef]
  25. Dewan, M.; Murshed, M.; Lin, F. Engagement detection in online learning: A review. Smart Learn. Environ. 2019, 6, 1. [Google Scholar] [CrossRef]
  26. Yin Albert, C.C.; Sun, Y.; Li, G.; Peng, J.; Ran, F.; Wang, Z.; Zhou, J. Identifying and Monitoring Students’ Classroom Learning Behavior Based on Multisource Information. Mob. Inf. Syst. 2022, 10, 1155. [Google Scholar] [CrossRef]
  27. Qi, Y.; Zhuang, L.; Chen, H.; Han, X.; Liang, A. Evaluation of Students’ Learning Engagement in Online Classes Based on Multimodal Vision Perspective. Electronics 2023, 13, 149. [Google Scholar] [CrossRef]
  28. Xie, N.; Liu, Z.; Li, Z.; Pang, W.; Lu, B. Student engagement detection in online environment using computer vision and multi-dimensional feature fusion. Multimed. Syst. 2023, 29, 3559–3577. [Google Scholar] [CrossRef]
  29. Ling, W. Automatic Recognition of Students’ Classroom Behavior Based on Computer Vision. Acad. J. Comput. Inf. Sci. 2022, 5, 31–34. [Google Scholar]
  30. Ngoc Anh, B.; Tung Son, N.; Truong Lam, P.; Phuong Chi, L.; Huu Tuan, N.; Cong Dat, N.; Huu Trung, N.; Umar Aftab, M.; Van Dinh, T. A computer-vision based application for student behavior monitoring in classroom. Appl. Sci. 2019, 9, 4729. [Google Scholar] [CrossRef]
  31. Dubovi, I. Cognitive and emotional engagement while learning with VR: The perspective of multimodal methodology. Comput. Educ. 2022, 183, 104495. [Google Scholar] [CrossRef]
  32. Zheng, L. Application of Multi-sensory interaction design Based on Machine Learning in Virtual Reality. J. Phys. Conf. Ser. 2023, 2665, 1742–6596. [Google Scholar] [CrossRef]
  33. Zhang, Z.; Fort, J.M. Facial expression recognition in virtual reality environments: Challenges and opportunities. Front. Psychol. 2023, 14, 1280136. [Google Scholar] [CrossRef] [PubMed]
  34. Chen, M.; Chai, C.; Jong, S.M.; Chao, G.C.N. Modeling learners’ self-concept in Chinese descriptive writing based on the affordances of a virtual reality-supported environment. Educ. Inf. Technol. 2021, 26, 6013–6032. [Google Scholar] [CrossRef]
  35. Liu, R.; Wang, L.; Lei, J.; Wang, Q.; Ren, Y. Effects of an immersive virtual reality-based classroom on students’ learning performance in science lessons. Br. J. Educ. Technol. 2020, 51, 2034–2049. [Google Scholar] [CrossRef]
  36. Parong, J.; Mayer, R.E. Learning about history in immersive virtual reality: Does immersion facilitate learning? Educ. Technol. Res. Dev. 2021, 69, 1433–1451. [Google Scholar] [CrossRef]
  37. Sudarma, I.K.; Prabawa, D.; Suartama, I.K. The application of information processing theory to design digital content in learning message design course. Int. J. Inf. Educ. Technol. 2022, 12, 1043–1049. [Google Scholar] [CrossRef]
  38. Robb, L.; David, D. Viewpoint, embodiment, and roles in STEM learning technologies. Educ. Technol. Res. Dev. 2022, 70, 1009–1034. [Google Scholar]
  39. Hu, R.; Hui, Z.; Li, Y.; Guan, J. Research on learning concentration recognition with multi-modal features in virtual reality environments. Sustainability 2023, 15, 11606. [Google Scholar] [CrossRef]
Figure 1. Overall system design architecture diagram.
Applsci 14 03149 g001
Figure 2. Preprocessing steps diagram.
Applsci 14 03149 g002
Figure 3. Preprocessing process diagram. The Chinese word in the picture says “red blood cell”.
Applsci 14 03149 g003
Figure 4. Preprocessing result image. The Chinese word in the picture says “red blood cell”.
Applsci 14 03149 g004
Figure 5. YOLOv5 architecture diagram.
Applsci 14 03149 g005
Figure 6. C3 module structure diagram.
Applsci 14 03149 g006
Figure 7. Bottleneck module architecture diagram.
Applsci 14 03149 g007
Figure 8. SPP module architecture diagram.
Applsci 14 03149 g008
Figure 9. IOU calculation chart.
Applsci 14 03149 g009
Figure 10. Changes in NMS processing. The Chinese word in the picture says “red blood cell”.
Applsci 14 03149 g010
Figure 11. Text OCR layer flowchart.
Applsci 14 03149 g011
Figure 12. CRNN model structure diagram.
Applsci 14 03149 g012
Figure 13. Network input image. The Chinese word in the picture says “red blood cell”.
Applsci 14 03149 g013
Figure 14. Text recognition process diagram. The Chinese word in the picture says “red blood cell”.
Applsci 14 03149 g014
Figure 15. Video frame cutting results.
Applsci 14 03149 g015
Figure 16. Video frame cutting results.
Applsci 14 03149 g016
Figure 17. YOLOv5 module detection results. The Chinese words in the picture say “red blood cell” and “mitochondria”.
Applsci 14 03149 g017
Figure 18. YOLOv5 module detection results. The Chinese word in the picture says “vesica”.
Applsci 14 03149 g018
Figure 19. Text OCR detection module detection effect diagram. The Chinese words in the picture say “microtubule” and “white blood cell”.
Applsci 14 03149 g019
Figure 20. Integration process diagram of detection data.
Applsci 14 03149 g020
Figure 21. Comparison chart between system detection of various target objects and the actual frame rate.
Applsci 14 03149 g021
Figure 22. Accuracy chart of system detection for various target objects.
Applsci 14 03149 g022
Figure 23. Visualization page diagram.
Applsci 14 03149 g023
Figure 24. Visualization of IVR videos and learner videos.
Applsci 14 03149 g024
Figure 25. Select statistical object visualization.
Applsci 14 03149 g025
Figure 26. Experimental flow chart.
Applsci 14 03149 g026
Table 1. Correlation analysis between visual coverage, attention duration, knowledge retention, and knowledge transfer.
Statistics of Detected Visual
Learning Object
Knowledge RetentionKnowledge Transfer
visual coverage0.620.90
visual attention duration0.220.16
Disclaimer/Publisher’s Note: The statements, opinions and data contained in all publications are solely those of the individual author(s) and contributor(s) and not of MDPI and/or the editor(s). MDPI and/or the editor(s) disclaim responsibility for any injury to people or property resulting from any ideas, methods, instructions or products referred to in the content.

