
State of Health Estimation and Remaining Useful Life Prediction of Lithium-Ion Batteries by Charging Feature Extraction and Ridge Regression

Abstract
:1. Introduction
2. Health Feature Parameters
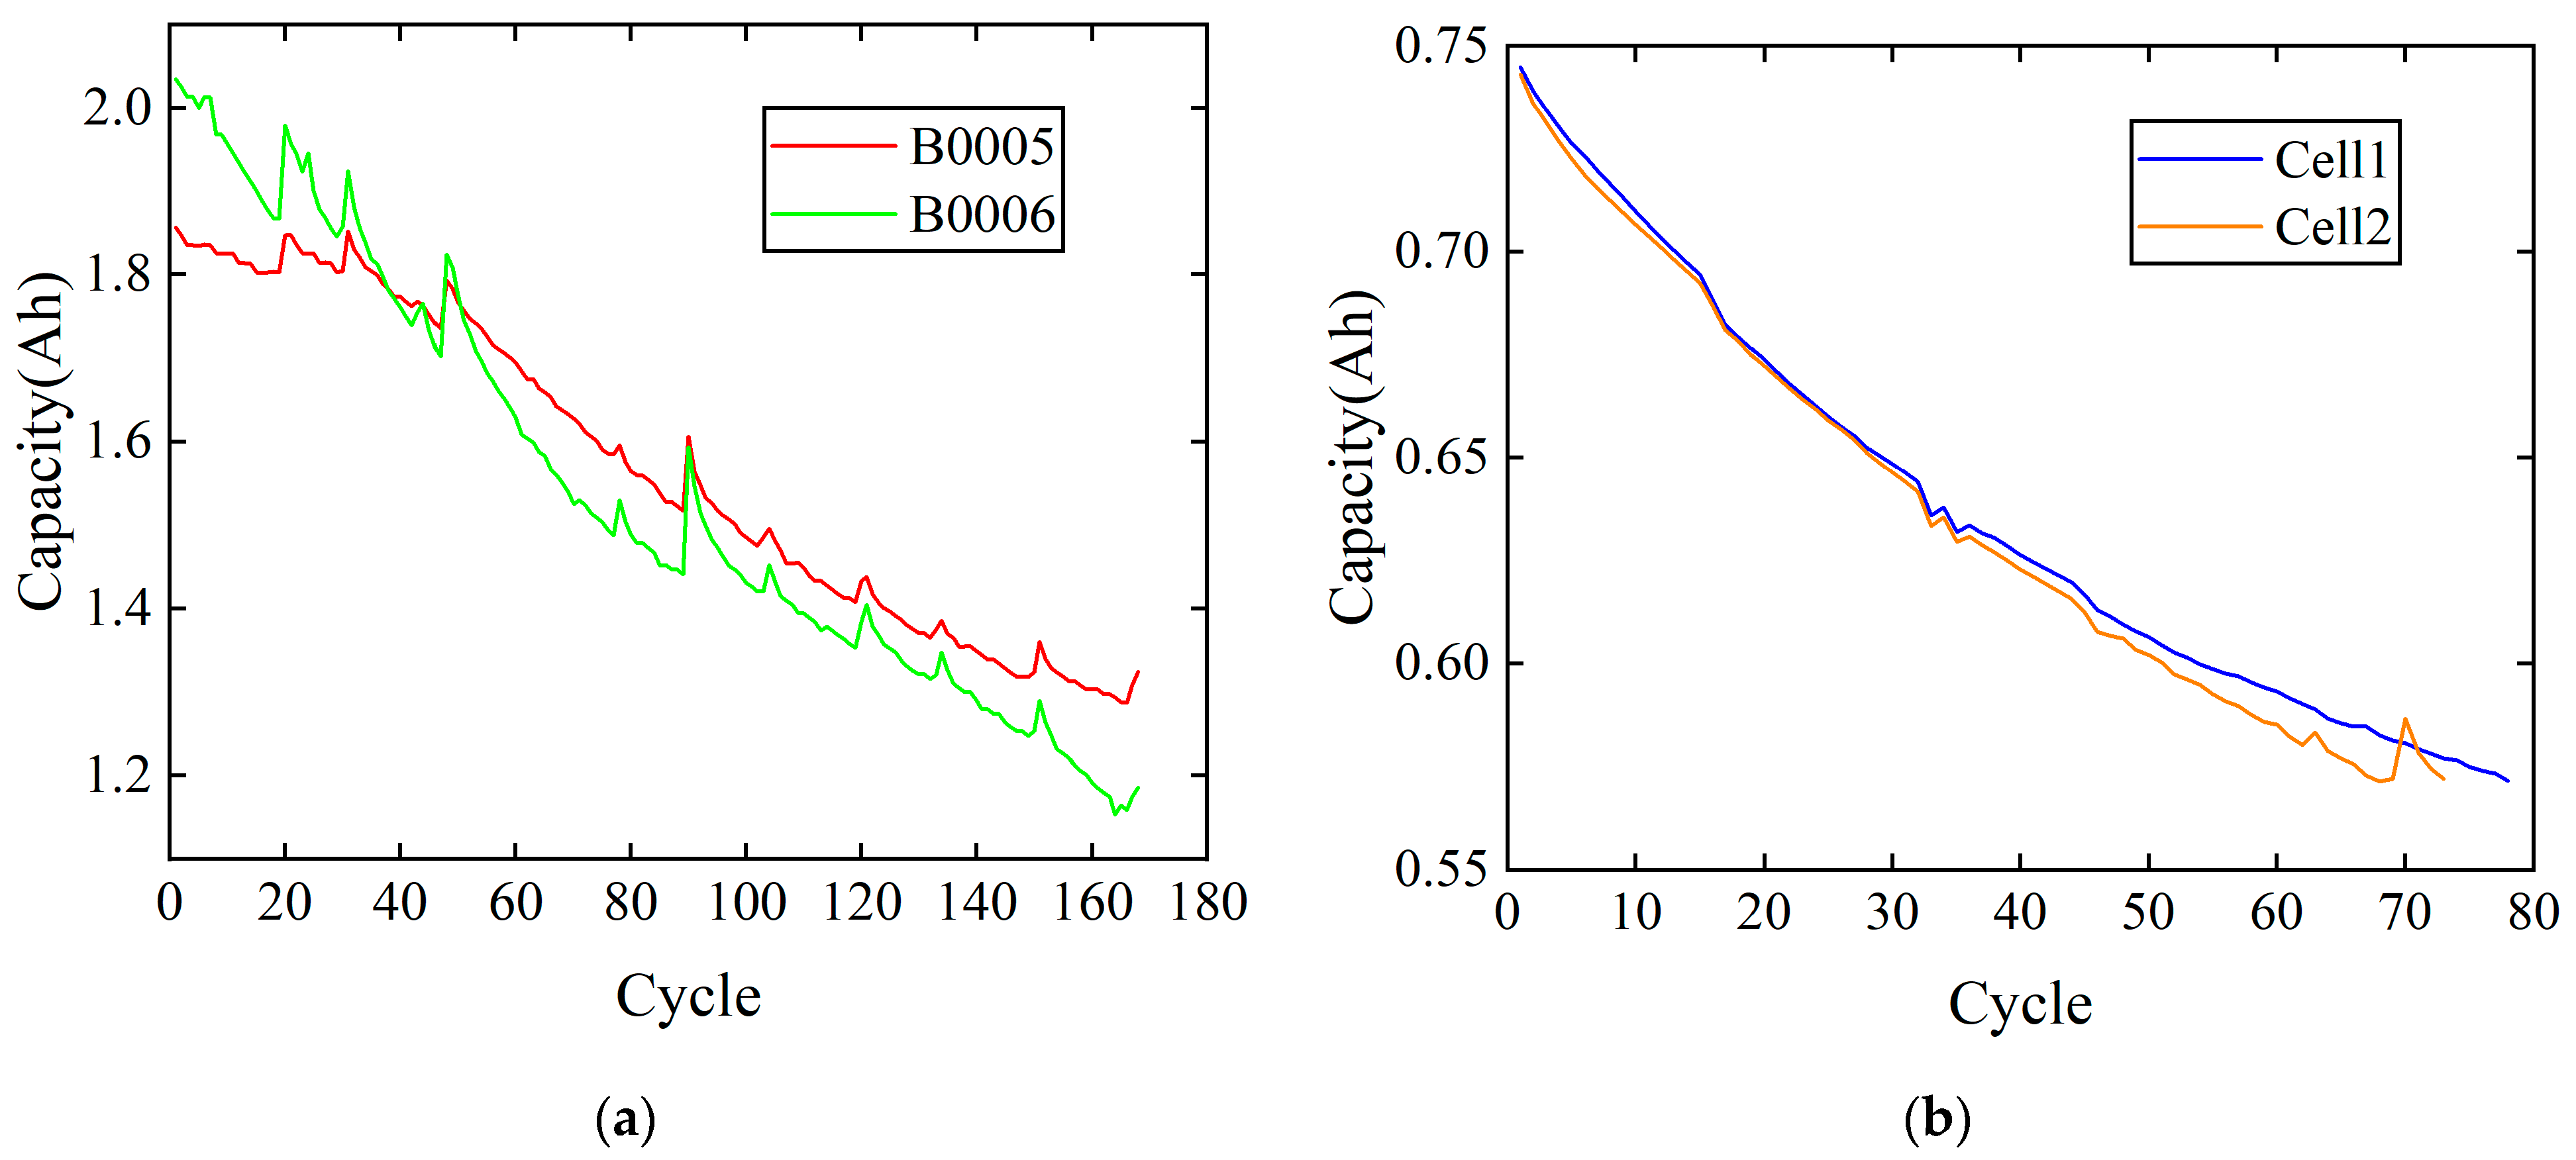
2.1. Battery Degradation Datasets
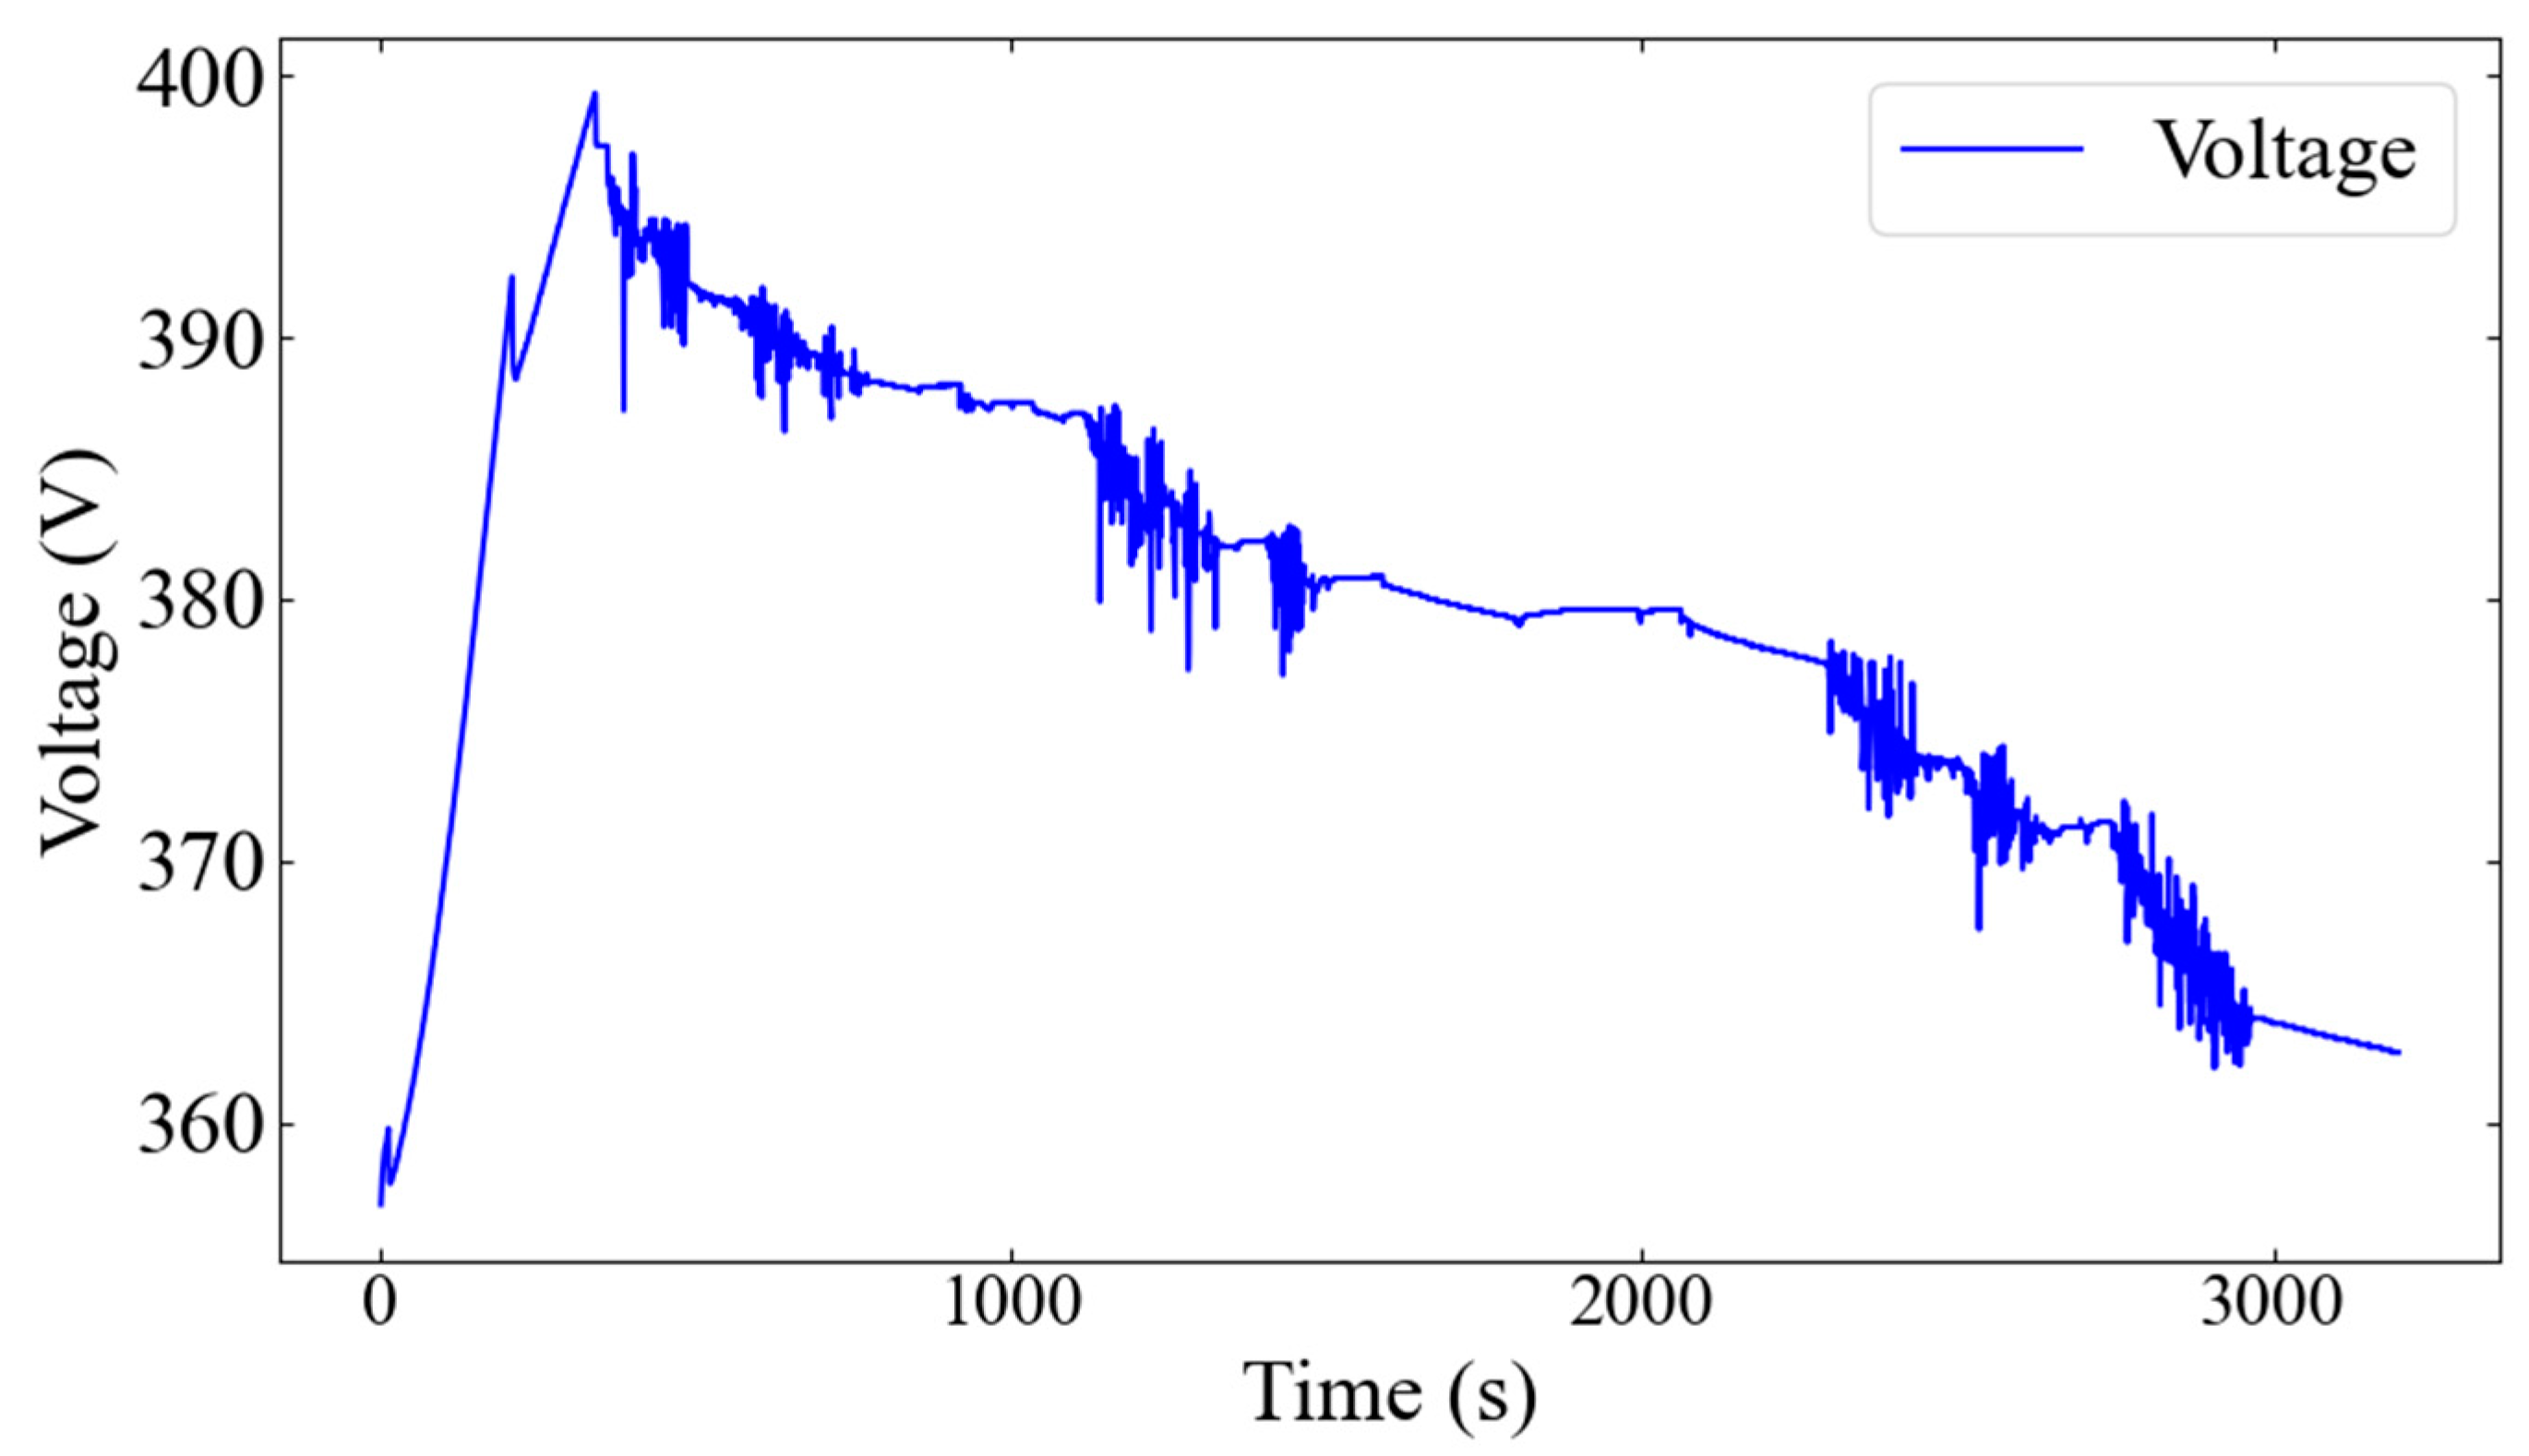
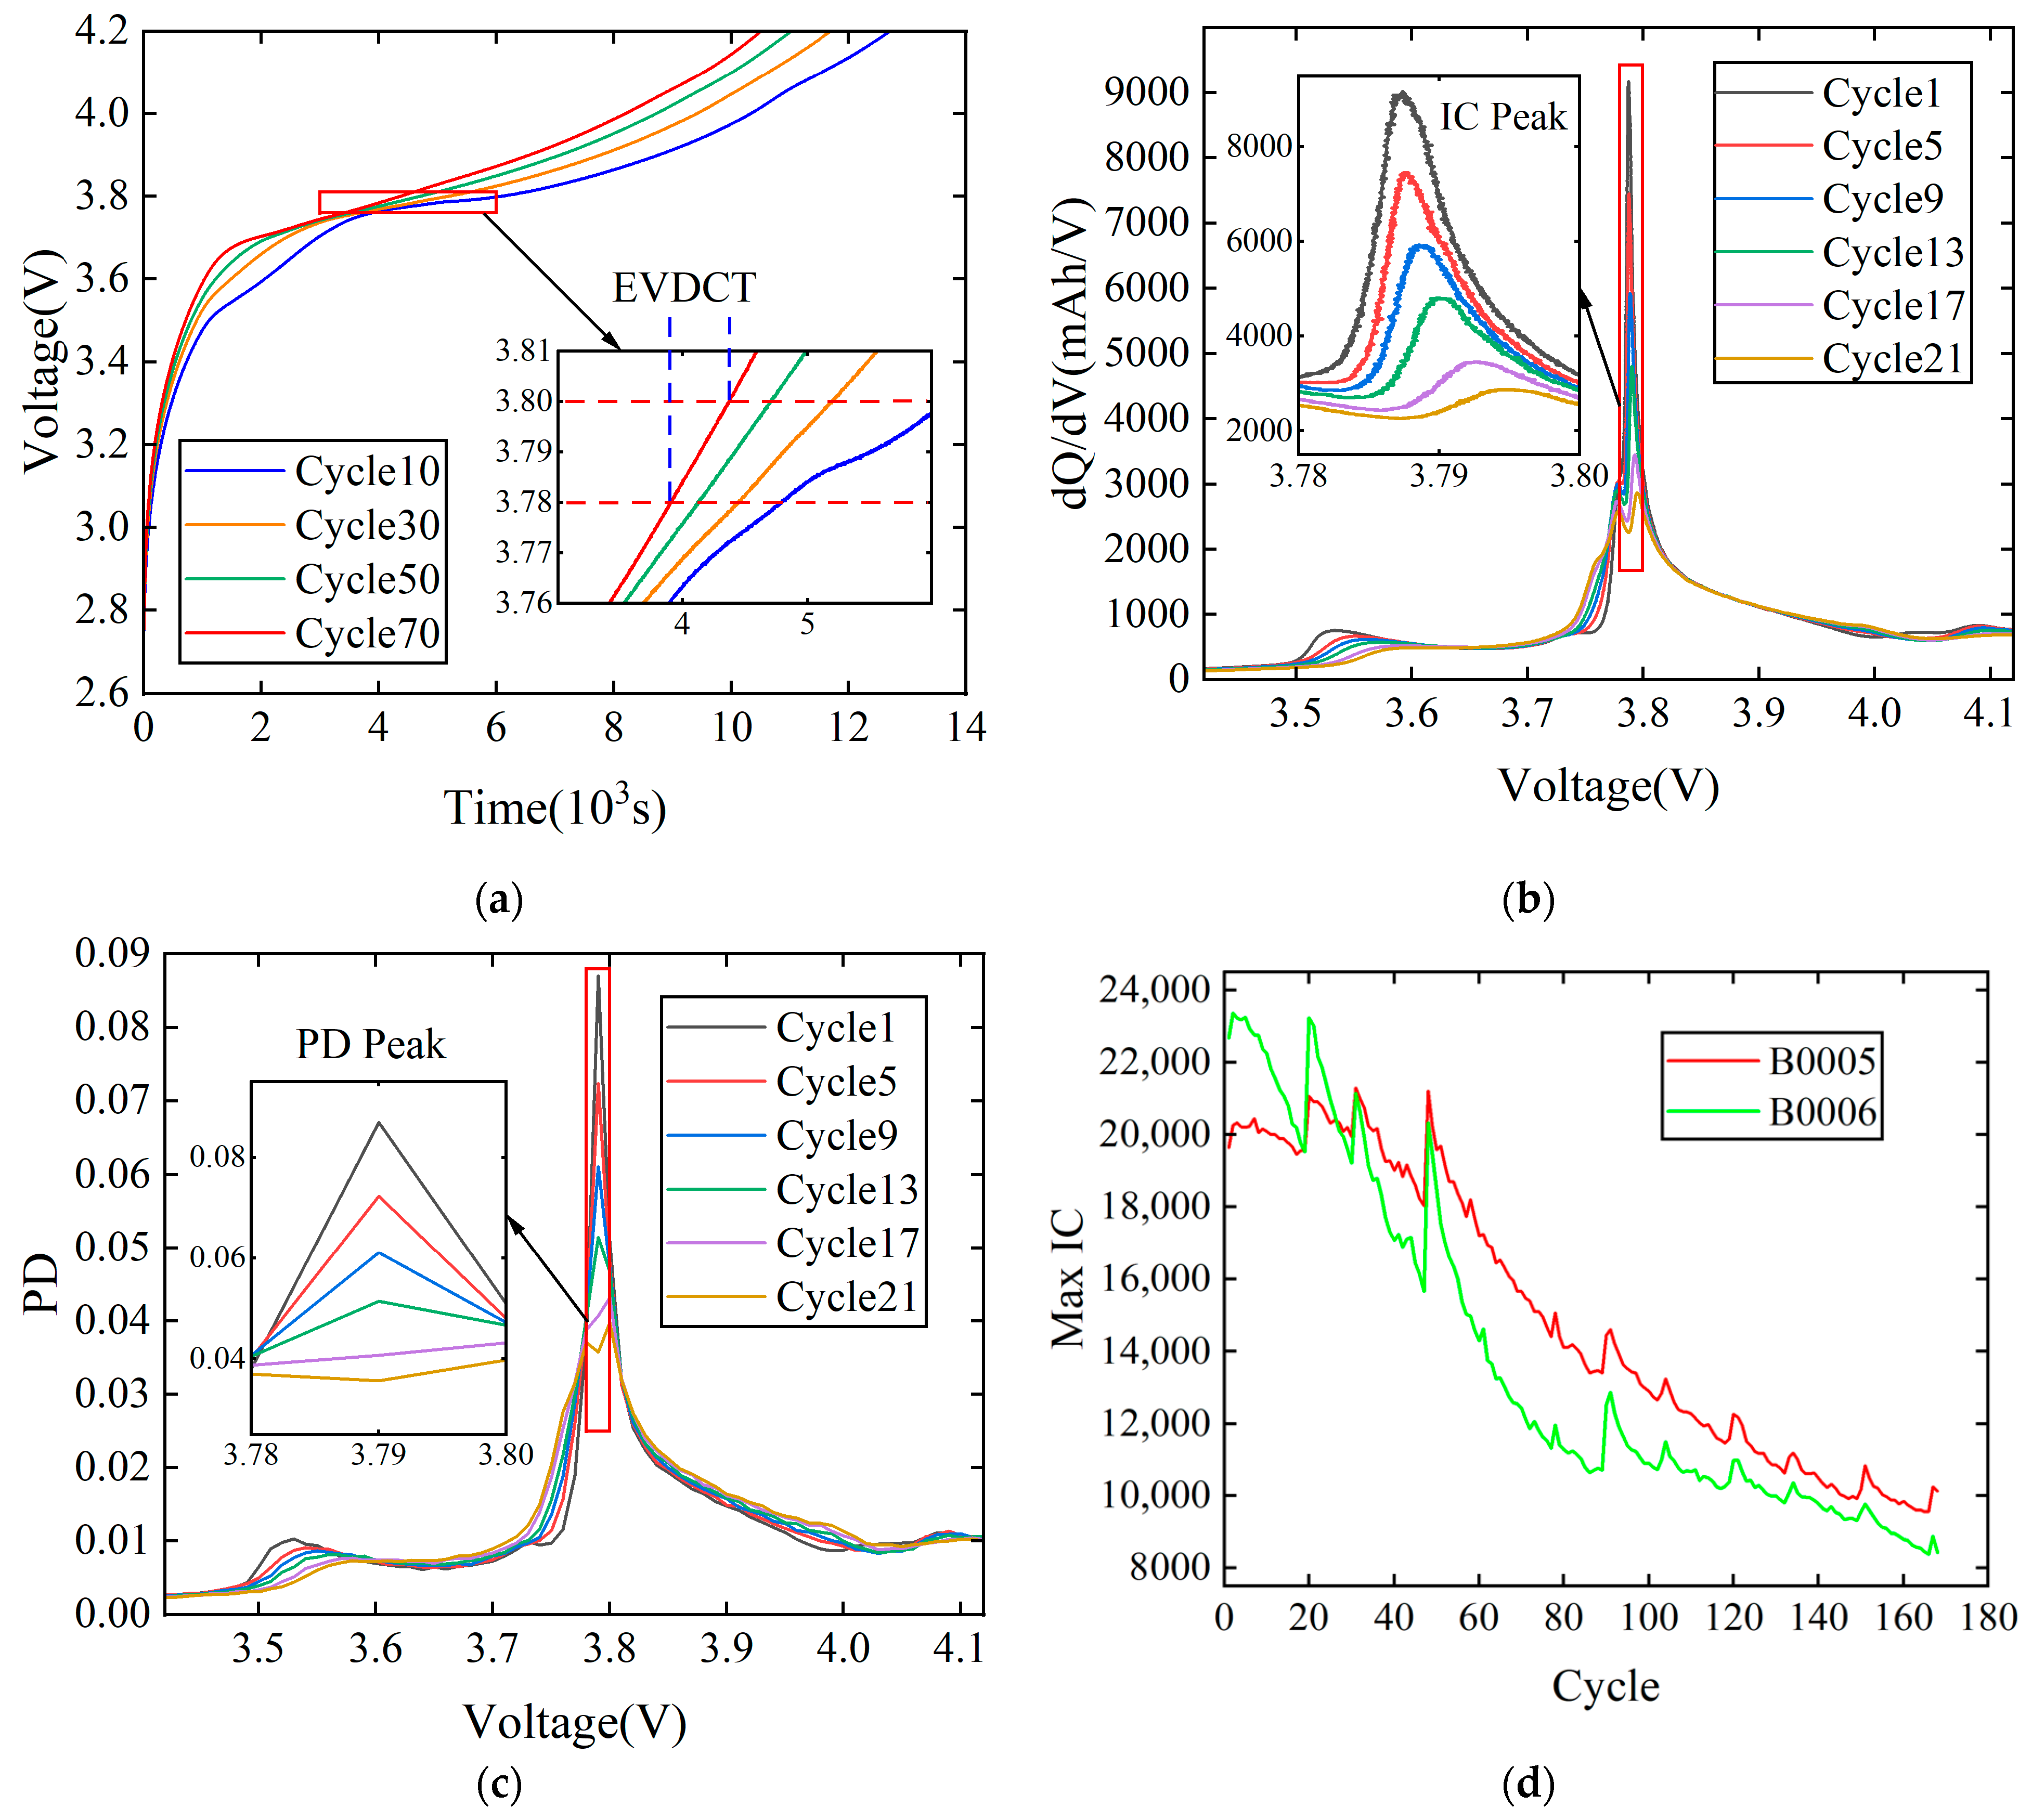
2.2. Health Features Extraction
2.3. Correlation Analysis
3. Methods
3.1. Ridge Regression
3.2. Multiscale Prediction Model
3.2.1. Ensemble Empirical Mode Decomposition
- (1)
- Add white noise sequence to the initial signal to obtain new signal :where is the number of white noise additions.
- (2)
- The EMD decomposition of is performed to obtain the sum of the IMF components of each order and the residual component after decomposition:where is the th IMF component derived from the decomposition after adding white noise for the th time, and the value of is in the range of .
- (3)
- Repeat the above two steps times and add the IMF components obtained each time, then calculate the mean value as the result:where is the th IMF component average obtained after EEMD decomposition of the initial signal.
3.2.2. Multiple Linear Regression
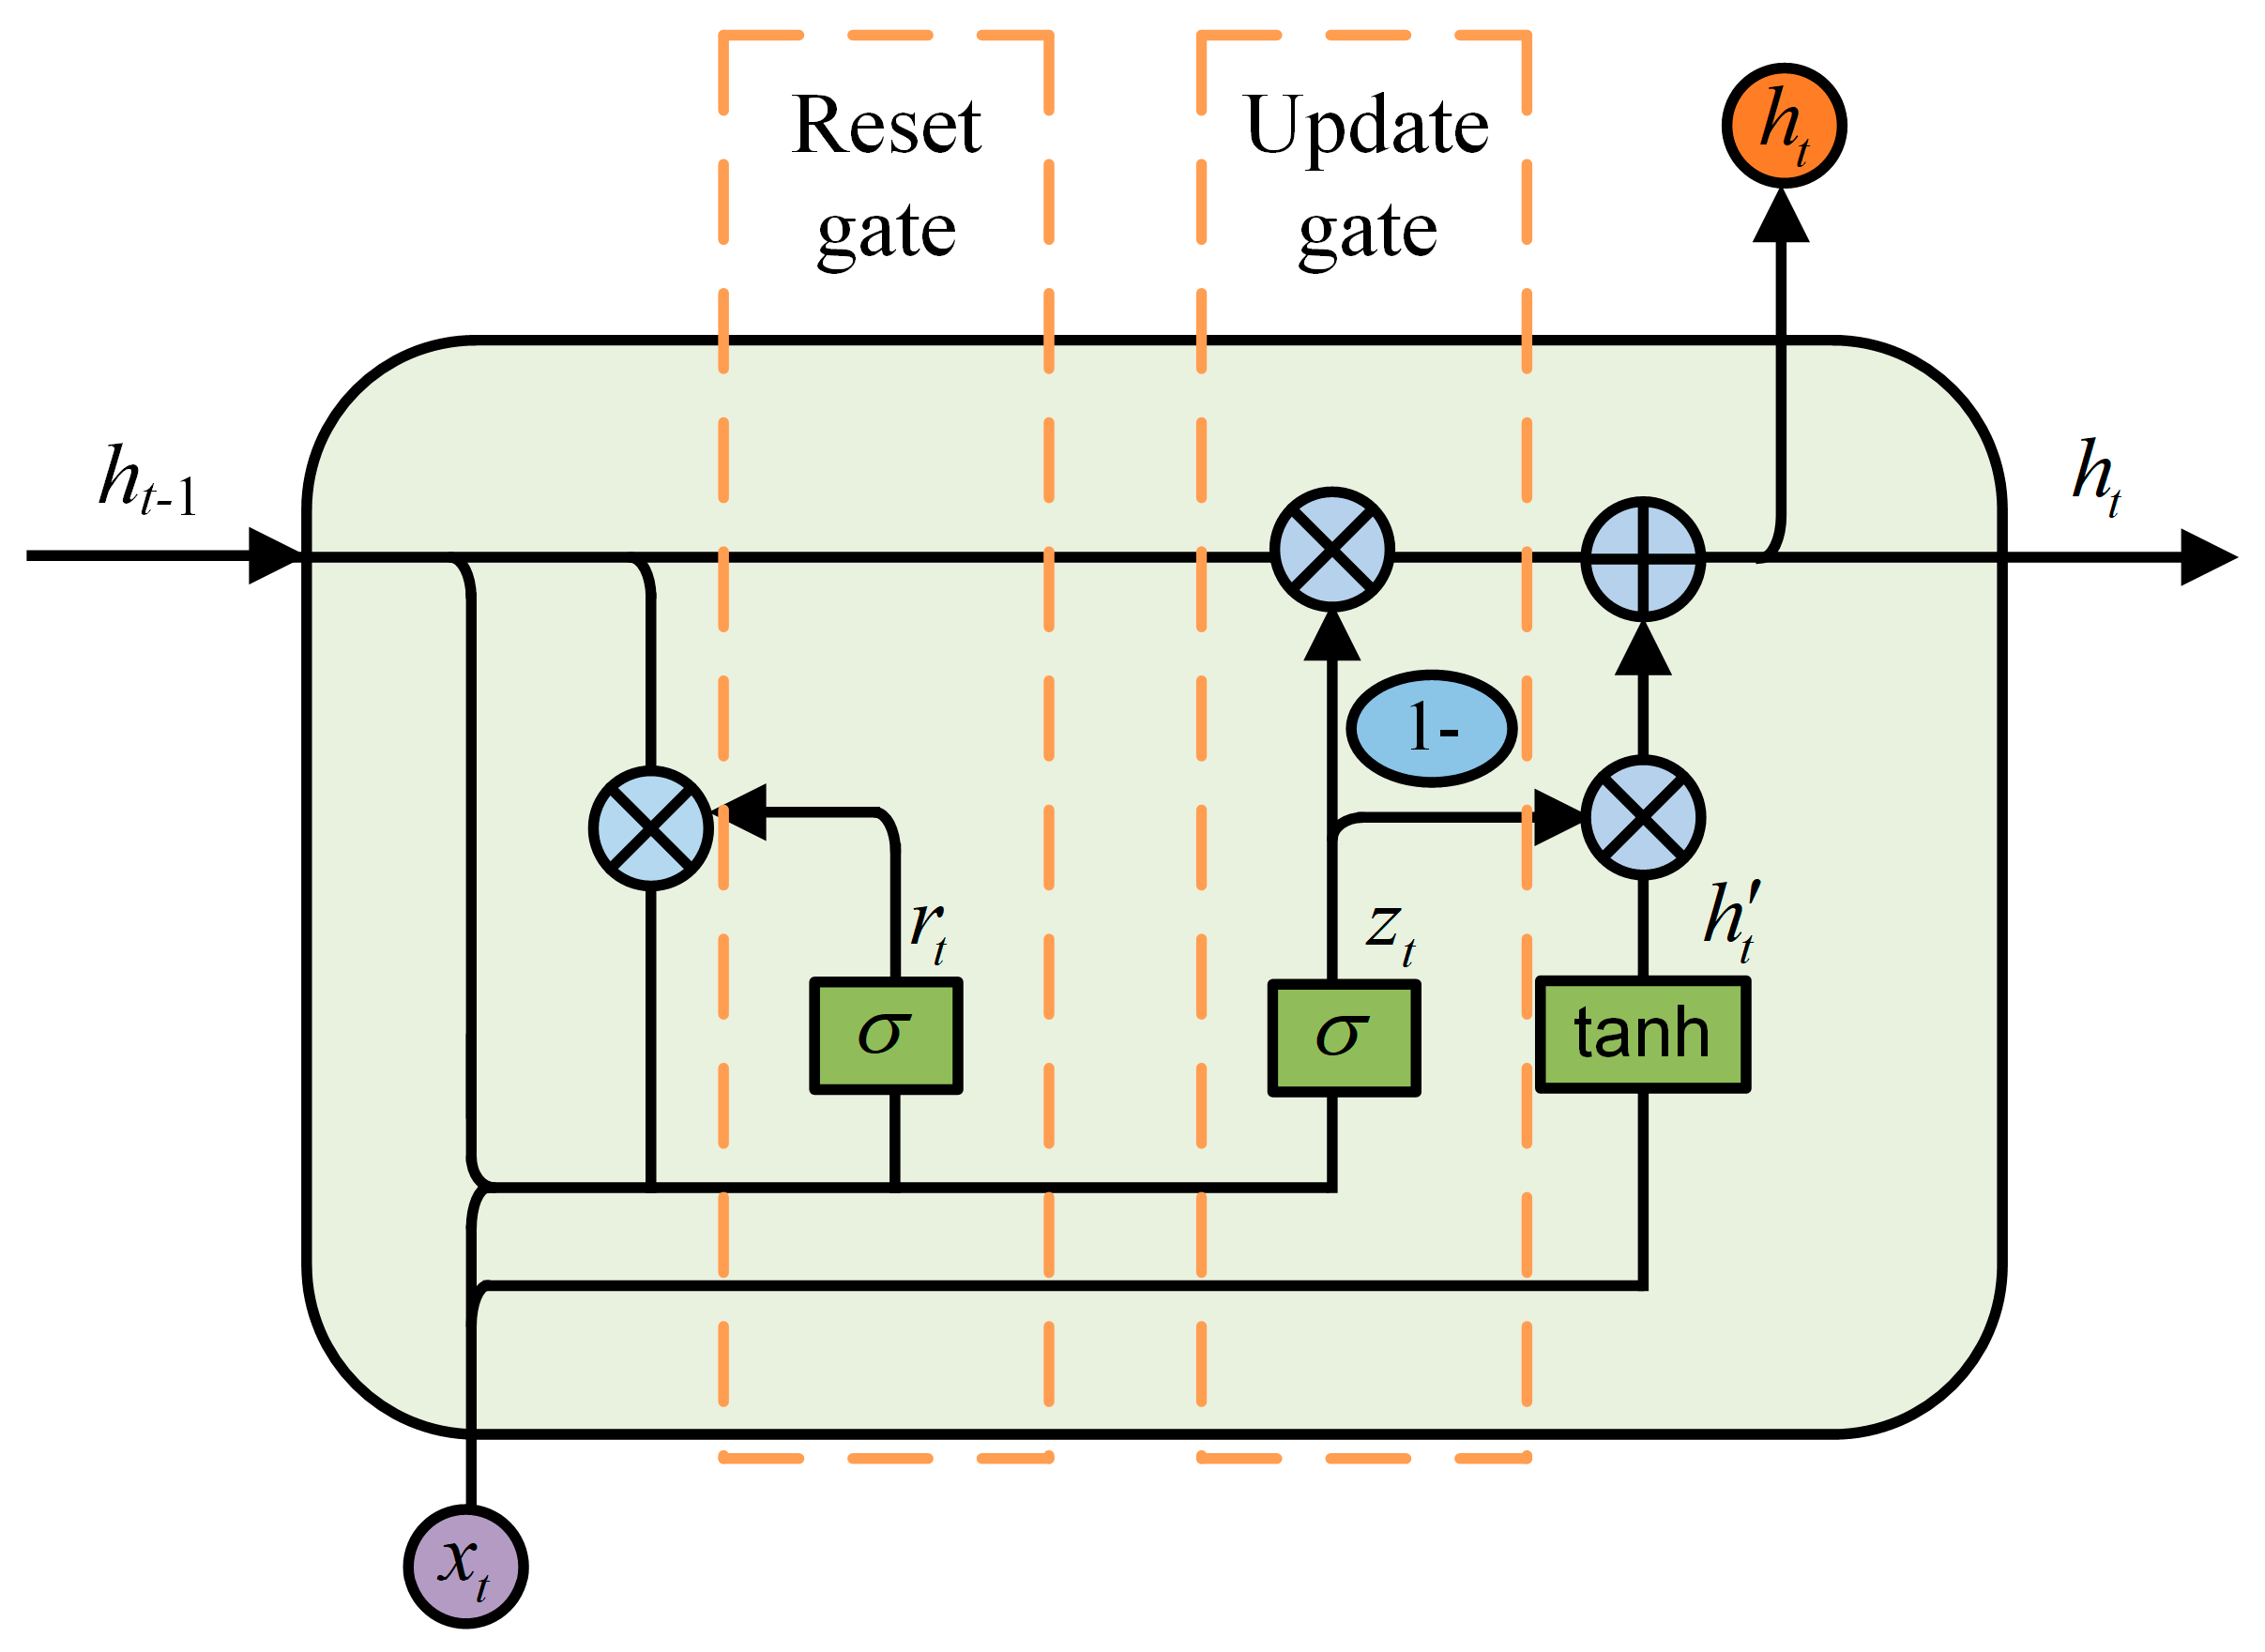
3.2.3. Gated Recurrent Unit
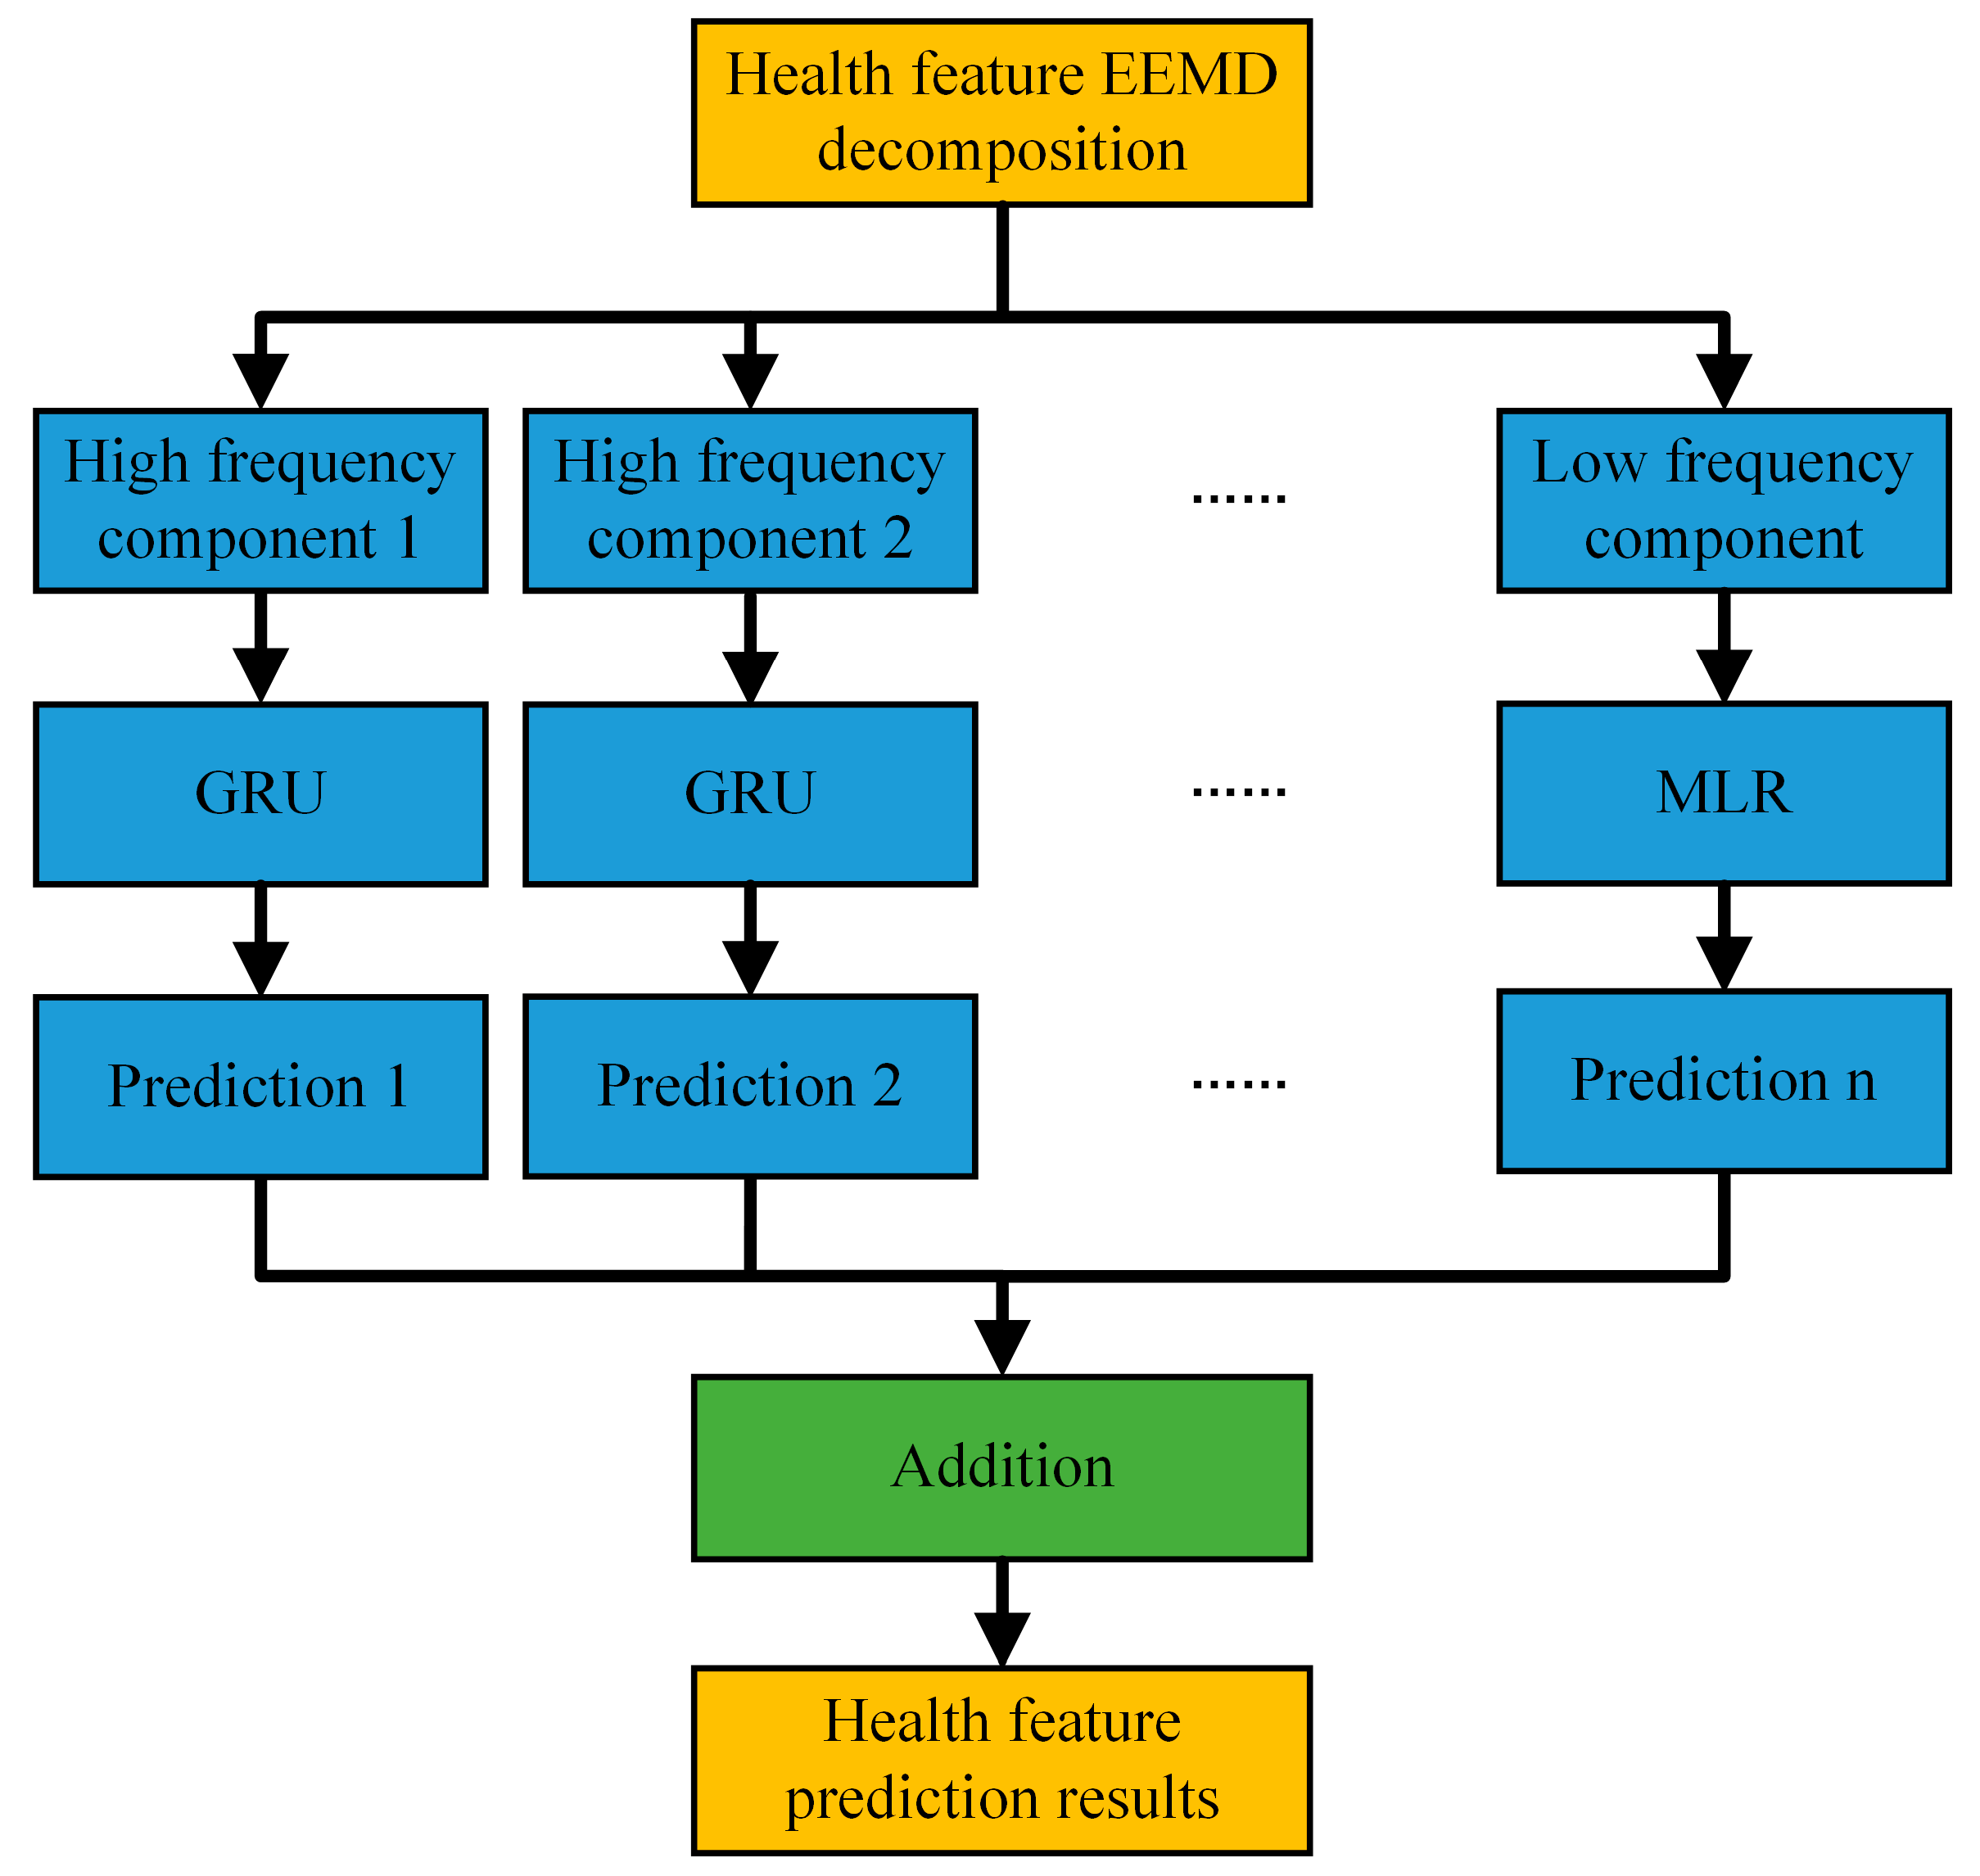
3.2.4. Multiscale Prediction Modeling
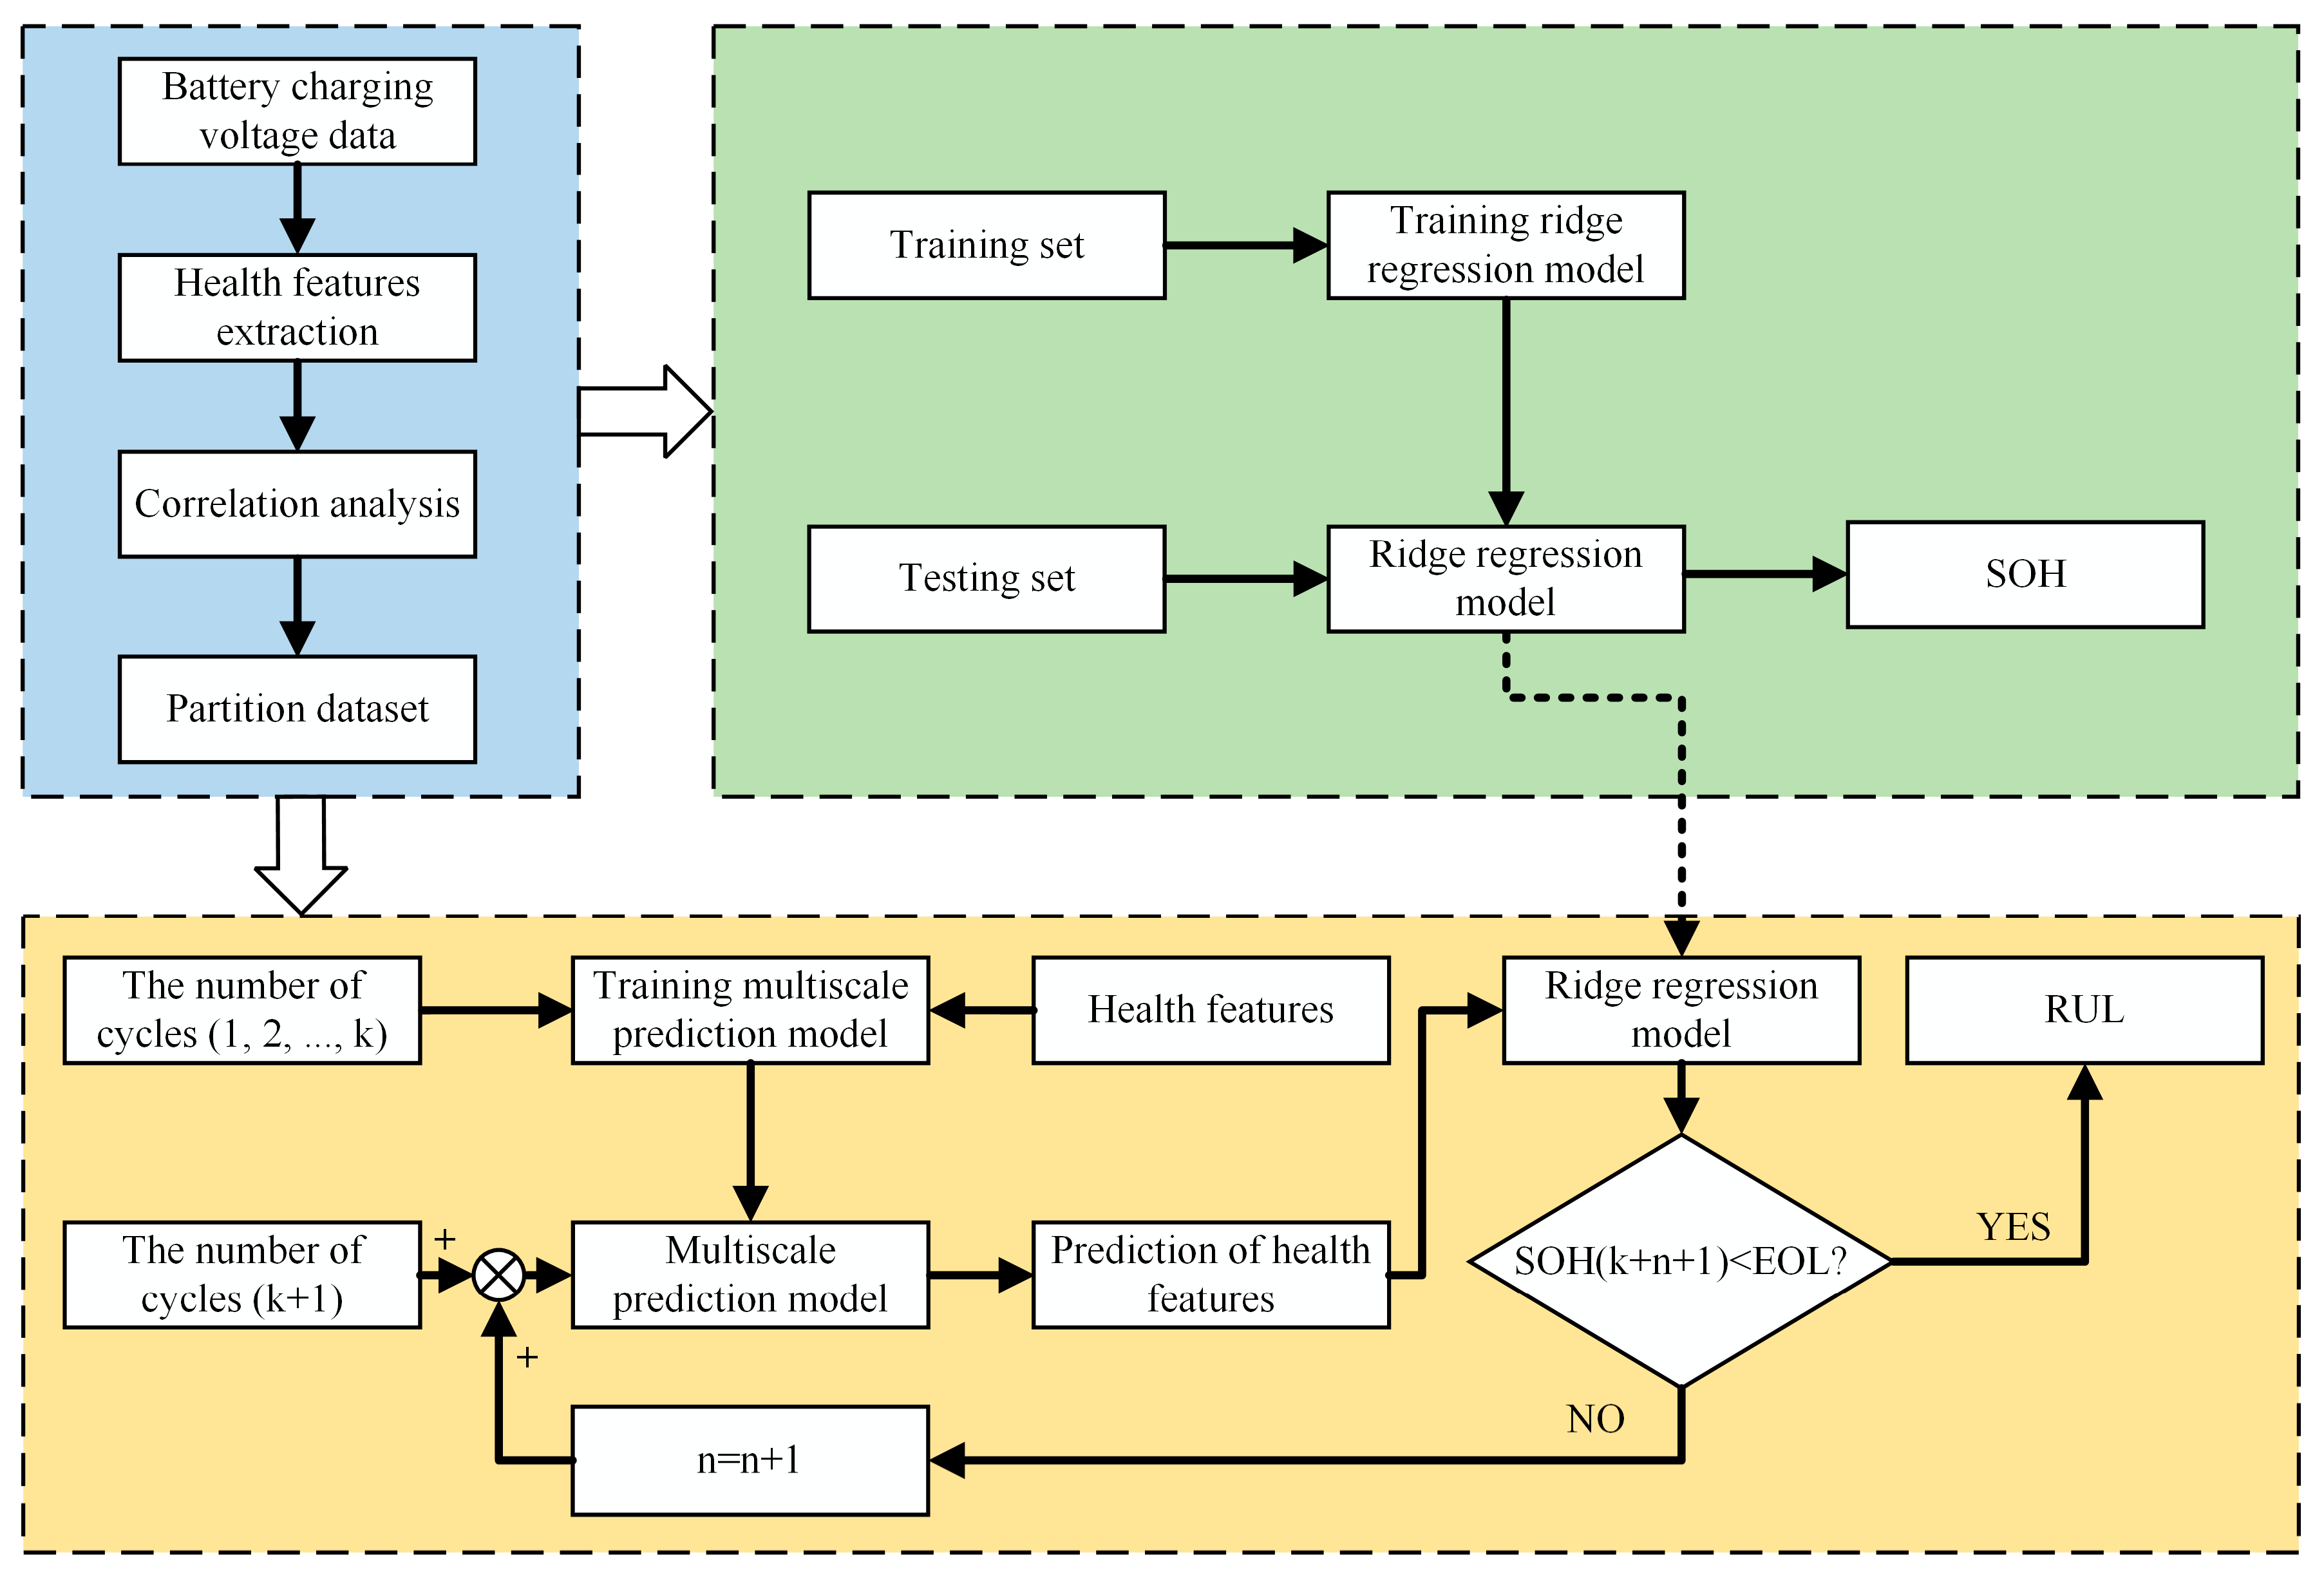
3.3. Overall Prediction Framework
4. Results and Discussion
4.1. Evaluation Metrics
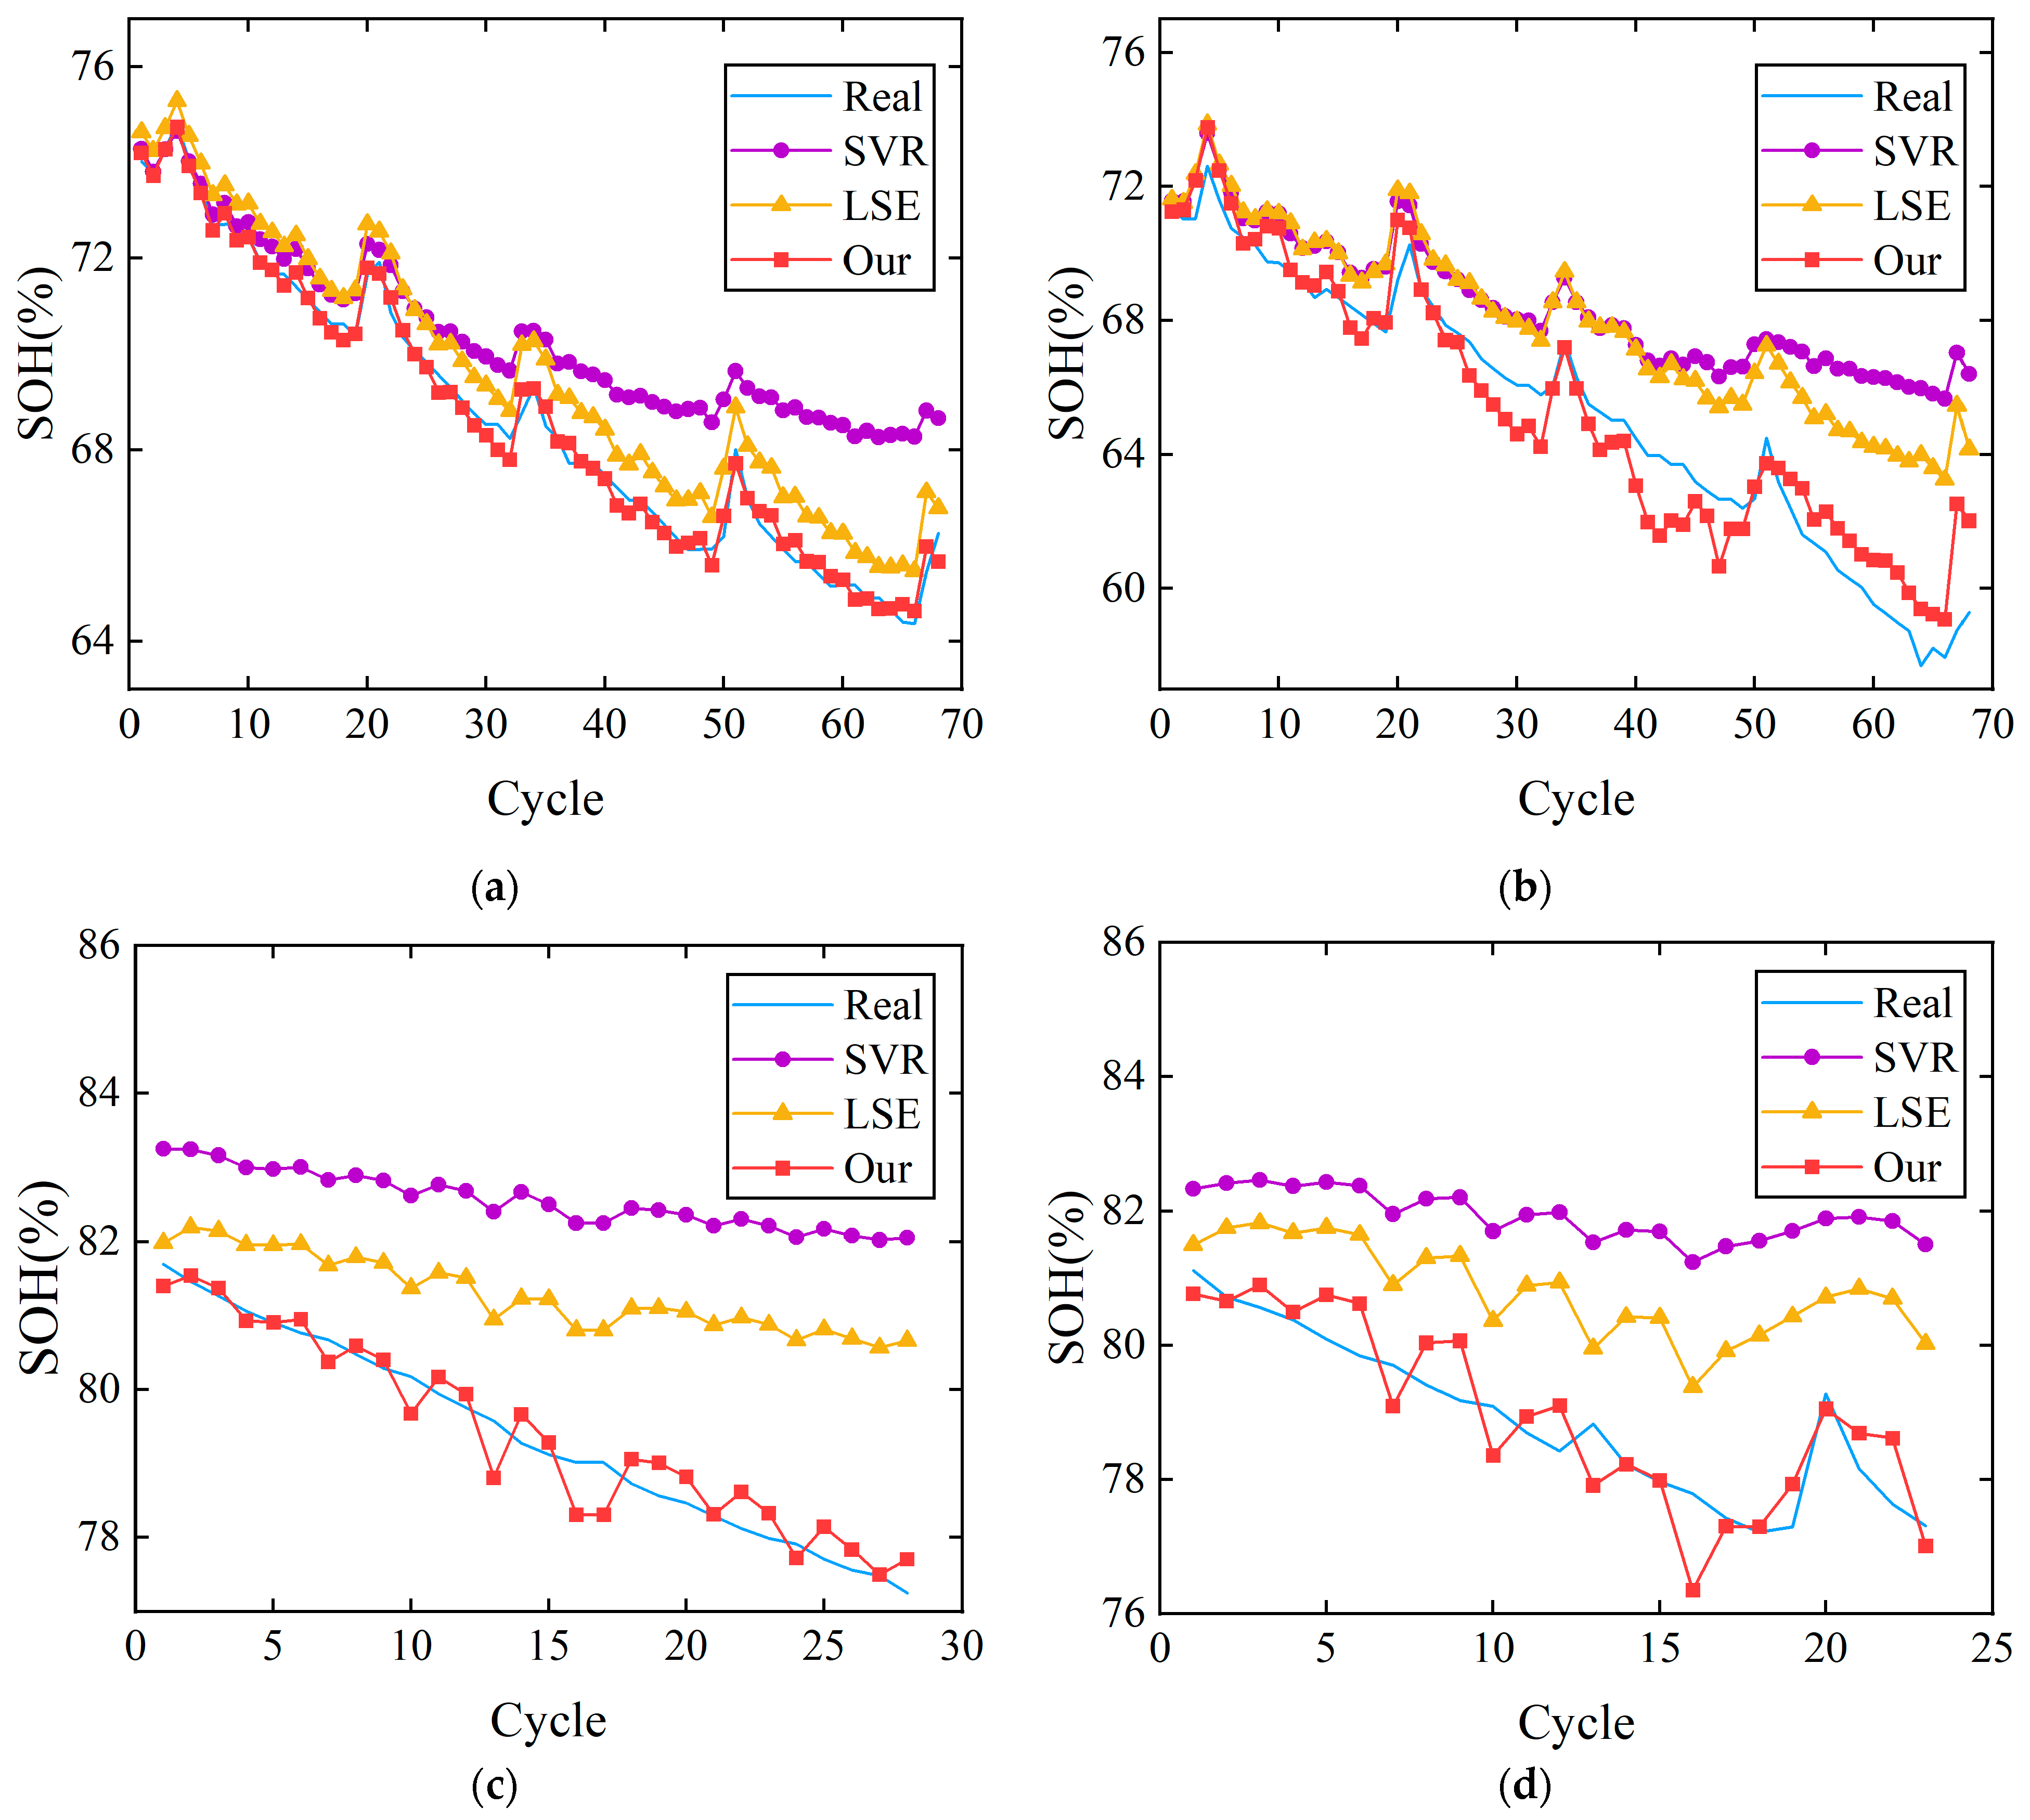
4.2. SOH Estimation Results
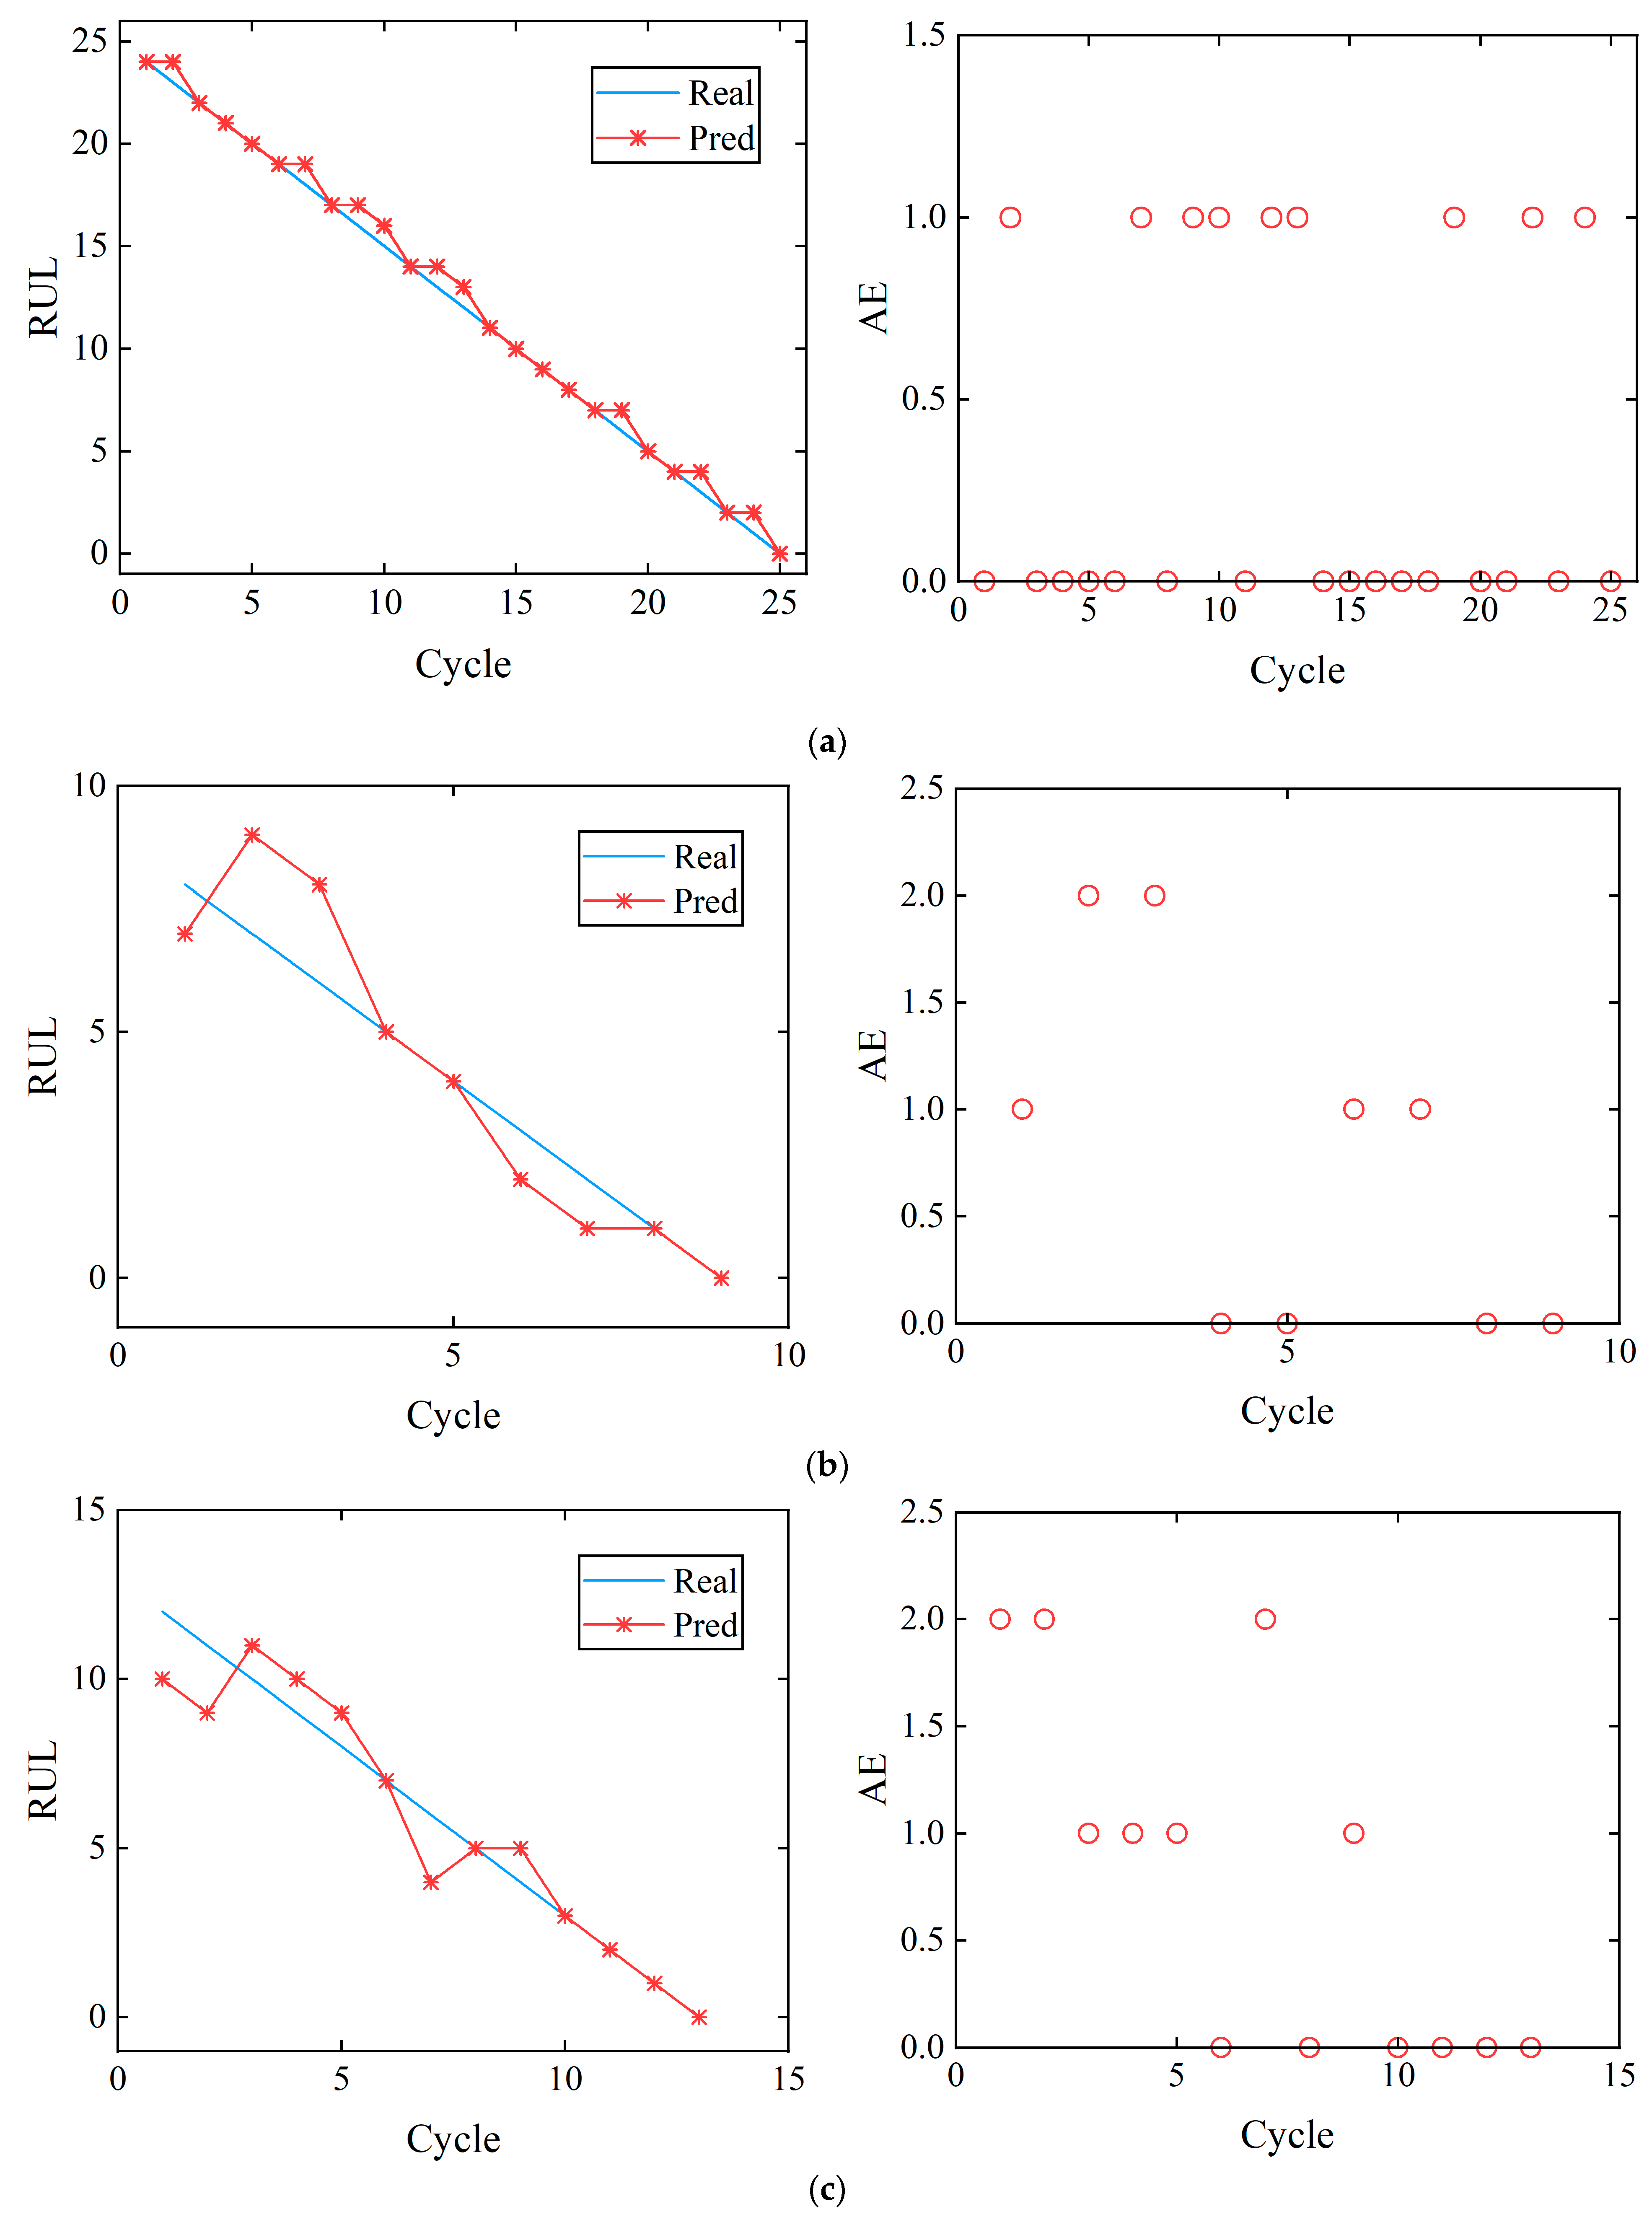
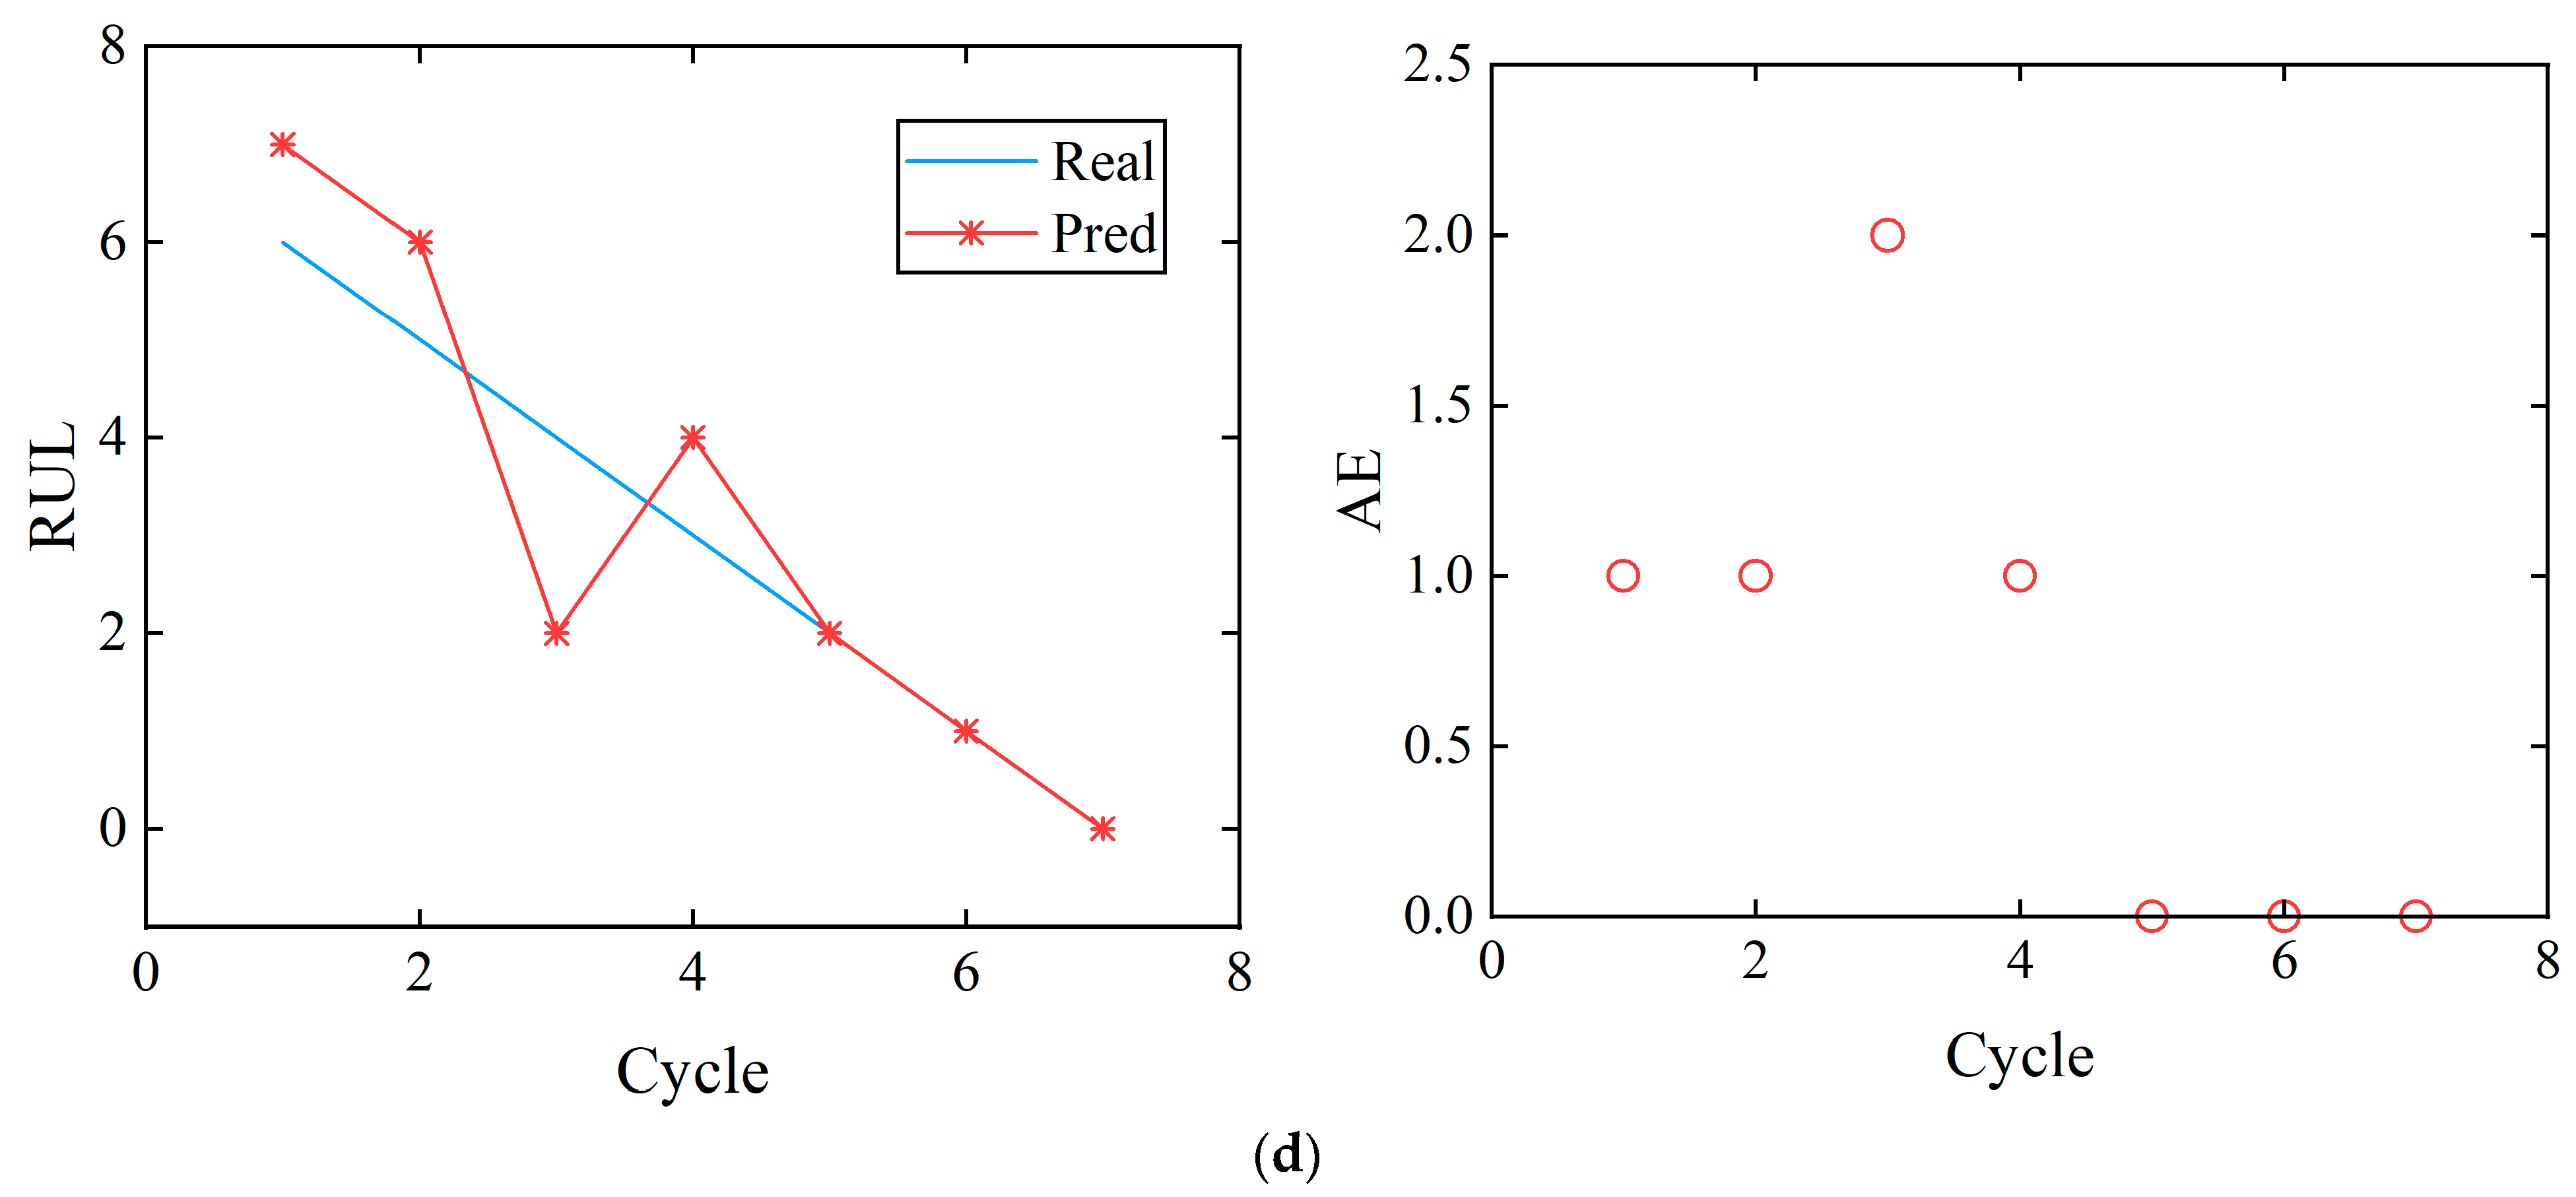
4.3. RUL Prediction Results
4.4. Results of the Joint SOH and RUL Evaluation
5. Conclusions
Author Contributions
Funding
Institutional Review Board Statement
Informed Consent Statement
Data Availability Statement
Conflicts of Interest
References
- Wang, G.; Lyu, Z.; Li, X. An Optimized Random Forest Regression Model for Li-Ion Battery Prognostics and Health Management. Batteries 2023, 9, 332. [Google Scholar] [CrossRef]
- Zhang, M.; Chen, W.; Yin, J.; Feng, T. Health Factor Extraction of Lithium-Ion Batteries Based on Discrete Wavelet Transform and SOH Prediction Based on CatBoost. Energies 2022, 15, 5331. [Google Scholar] [CrossRef]
- Liu, H.; Li, Y.; Luo, L.; Zhang, C. A Lithium-Ion Battery Capacity and RUL Prediction Fusion Method Based on Decomposition Strategy and GRU. Batteries 2023, 9, 323. [Google Scholar] [CrossRef]
- Deng, L.; Shen, W.; Wang, H.; Wang, S. A rest-time-based prognostic model for remaining useful life prediction of lithium-ion battery. Neural Comput. Appl. 2020, 33, 2035–2046. [Google Scholar] [CrossRef]
- Tian, H.; Qin, P.; Li, K.; Zhao, Z. A review of the state of health for lithium-ion batteries: Research status and suggestions. J. Clean. Prod. 2020, 261, 120813. [Google Scholar] [CrossRef]
- Lipu, M.S.H.; Hannan, M.A.; Hussain, A.; Hoque, M.M.; Ker, P.J.; Saad, M.H.M.; Ayob, A. A review of state of health and remaining useful life estimation methods for lithium-ion battery in electric vehicles: Challenges and recommendations. J. Clean. Prod. 2018, 205, 115–133. [Google Scholar] [CrossRef]
- Xu, J.; Sun, C.; Ni, Y.; Lyu, C.; Wu, C.; Zhang, H.; Yang, Q.; Feng, F. Fast Identification of Micro-Health Parameters for Retired Batteries Based on a Simplified P2D Model by Using Padé Approximation. Batteries 2023, 9, 64. [Google Scholar] [CrossRef]
- Fan, Y.; Xiao, F.; Li, C.; Yang, G.; Tang, X. A novel deep learning framework for state of health estimation of lithium-ion battery. J. Energy Storage 2020, 32, 101741. [Google Scholar] [CrossRef]
- Amogne, Z.E.; Wang, F.-K.; Chou, J.-H. Transfer Learning Based on Transferability Measures for State of Health Prediction of Lithium-Ion Batteries. Batteries 2023, 9, 280. [Google Scholar] [CrossRef]
- Lin, C.-P.; Cabrera, J.; Yang, F.; Ling, M.-H.; Tsui, K.-L.; Bae, S.-J. Battery state of health modeling and remaining useful life prediction through time series model. Appl. Energy 2020, 275, 115338. [Google Scholar] [CrossRef]
- Roman, D.; Saxena, S.; Robu, V.; Pecht, M.; Flynn, D. Machine learning pipeline for battery state-of-health estimation. Nat. Mach. Intell. 2021, 3, 447–456. [Google Scholar] [CrossRef]
- Chun, H.; Kim, J.; Kim, M.; Lee, J.; Lee, T.; Han, S. Capacity Estimation of Lithium-Ion Batteries for Various Aging States Through Knowledge Transfer. IEEE Trans. Transp. Electrif. 2022, 8, 1758–1768. [Google Scholar] [CrossRef]
- Zhang, C.; Allafi, W.; Dinh, Q.; Ascencio, P.; Marco, J. Online estimation of battery equivalent circuit model parameters and state of charge using decoupled least squares technique. Energy 2018, 142, 678–688. [Google Scholar] [CrossRef]
- Misyris, G.S.; Tengnér, T.; Marinopoulos, A.G.; Doukas, D.I.; Labridis, D.P. Battery energy storage systems modeling for online applications. In Proceedings of the 2017 IEEE Manchester PowerTech, Manchester, UK, 18–22 June 2017; pp. 1–6. [Google Scholar]
- Wang, Z.; Zeng, S.; Guo, J.; Qin, T. State of health estimation of lithium-ion batteries based on the constant voltage charging curve. Energy 2019, 167, 661–669. [Google Scholar] [CrossRef]
- Qiu, X.; Wu, W.; Wang, S. Remaining useful life prediction of lithium-ion battery based on improved cuckoo search particle filter and a novel state of charge estimation method. J. Power Sources 2020, 450, 227700. [Google Scholar] [CrossRef]
- Bole, B.; Kulkarni, C.S.; Daigle, M. Adaptation of an Electrochemistry-based Li-Ion Battery Model to Account for Deterioration Observed Under Randomized Use. In Proceedings of the Annual Conference of the PHM Society, Fort Worth, TX, USA, 29 September–2 October 2014; Volume 6. [Google Scholar]
- Khodadadi Sadabadi, K.; Jin, X.; Rizzoni, G. Prediction of remaining useful life for a composite electrode lithium ion battery cell using an electrochemical model to estimate the state of health. J. Power Sources 2021, 481, 228861. [Google Scholar] [CrossRef]
- Hong, J.; Lee, D.; Jeong, E.-R.; Yi, Y. Towards the swift prediction of the remaining useful life of lithium-ion batteries with end-to-end deep learning. Appl. Energy 2020, 278, 115646. [Google Scholar] [CrossRef]
- Zhang, X.; Sun, J.; Shang, Y.; Ren, S.; Liu, Y.; Wang, D. A novel state-of-health prediction method based on long short-term memory network with attention mechanism for lithium-ion battery. Front. Energy Res. 2022, 10, 972486. [Google Scholar] [CrossRef]
- Li, Y.; Liu, K.; Foley, A.M.; Zülke, A.; Berecibar, M.; Nanini-Maury, E.; Van Mierlo, J.; Hoster, H.E. Data-driven health estimation and lifetime prediction of lithium-ion batteries: A review. Renew. Sustain. Energy Rev. 2019, 113, 109254. [Google Scholar] [CrossRef]
- Zhang, D.; Zhao, W.; Wang, L.; Chang, X.; Li, X.; Wu, P. Evaluation of the State of Health of Lithium-Ion Battery Based on the Temporal Convolution Network. Front. Energy Res. 2022, 10, 929235. [Google Scholar] [CrossRef]
- Wu, J.; Zhang, C.; Chen, Z. An online method for lithium-ion battery remaining useful life estimation using importance sampling and neural networks. Appl. Energy 2016, 173, 134–140. [Google Scholar] [CrossRef]
- Khumprom, P.; Yodo, N. A Data-Driven Predictive Prognostic Model for Lithium-Ion Batteries based on a Deep Learning Algorithm. Energies 2019, 12, 660. [Google Scholar] [CrossRef]
- Chen, L.; Zhang, Y.; Zheng, Y.; Li, X.; Zheng, X. Remaining useful life prediction of lithium-ion battery with optimal input sequence selection and error compensation. Neurocomputing 2020, 414, 245–254. [Google Scholar] [CrossRef]
- Zhang, S.; Zhai, B.; Guo, X.; Wang, K.; Peng, N.; Zhang, X. Synchronous estimation of state of health and remaining useful lifetime for lithium-ion battery using the incremental capacity and artificial neural networks. J. Energy Storage 2019, 26, 100951. [Google Scholar] [CrossRef]
- Deng, Y.; Ying, H.; Jiaqiang, E.; Zhu, H.; Wei, K.; Chen, J.; Zhang, F.; Liao, G. Feature parameter extraction and intelligent estimation of the State-of-Health of lithium-ion batteries. Energy 2019, 176, 91–102. [Google Scholar] [CrossRef]
- Chen, Y.; Duan, W.; Ding, Z.; Li, Y. Battery Life Prediction Based on a Hybrid Support Vector Regression Model. Front. Energy Res. 2022, 10, 899804. [Google Scholar] [CrossRef]
- Li, R.; Li, W.; Zhang, H.; Zhou, Y.; Tian, W. On-Line Estimation Method of Lithium-Ion Battery Health Status Based on PSO-SVM. Front. Energy Res. 2021, 9, 693249. [Google Scholar] [CrossRef]
- Tian, J.; Xiong, R.; Shen, W. State-of-Health Estimation Based on Differential Temperature for Lithium Ion Batteries. IEEE Trans. Power Electron. 2020, 35, 10363–10373. [Google Scholar] [CrossRef]
- Wu, J.; Cui, X.; Zhang, H.; Lin, M. Health Prognosis With Optimized Feature Selection for Lithium-Ion Battery in Electric Vehicle Applications. IEEE Trans. Power Electron. 2021, 36, 12646–12655. [Google Scholar] [CrossRef]
- Zhao, L.; Wang, Y.; Cheng, J. A hybrid method for remaining useful life estimation of lithium-ion battery with regeneration phenomena. Appl. Sci. 2019, 9, 1890. [Google Scholar] [CrossRef]
- Zhang, L.; Ji, T.; Yu, S.; Liu, G. Accurate Prediction Approach of SOH for Lithium-Ion Batteries Based on LSTM Method. Batteries 2023, 9, 177. [Google Scholar] [CrossRef]
- Birkl, C. Diagnosis and Prognosis of Degradation in Lithium-Ion Batteries; University of Oxford: Oxford, UK, 2017. [Google Scholar]
- Guo, P.; Cheng, Z.; Yang, L. A data-driven remaining capacity estimation approach for lithium-ion batteries based on charging health feature extraction. J. Power Sources 2019, 412, 442–450. [Google Scholar] [CrossRef]
- Wang, X.; Wang, X.; Ma, B.; Li, Q.; Shi, Y.-Q. High Precision Error Prediction Algorithm Based on Ridge Regression Predictor for Reversible Data Hiding. IEEE Signal Process. Lett. 2021, 28, 1125–1129. [Google Scholar] [CrossRef]
- Mao, L.; Xu, J.; Chen, J.; Zhao, J.; Wu, Y.; Yao, F. A LSTM-STW and GS-LM Fusion Method for Lithium-Ion Battery RUL Prediction Based on EEMD. Energies 2020, 13, 2380. [Google Scholar] [CrossRef]
- Chen, Z.; Li, L.; Cui, W.; Yang, S.; Wang, Y.; Wang, D. Remaining useful life prognostics of lithium-ion batteries based on a coordinate reconfiguration of degradation trajectory and multiple linear regression. Front. Energy Res. 2023, 10, 1033039. [Google Scholar] [CrossRef]
- Zhang, R.; Li, X.; Sun, C.; Yang, S.; Tian, Y.; Tian, J. State of Charge and Temperature Joint Estimation Based on Ultrasonic Reflection Waves for Lithium-Ion Battery Applications. Batteries 2023, 9, 335. [Google Scholar] [CrossRef]


| Battery | Charging Current (A) | Rated Capacity (Ah) | Temperature (°C) | Number of Cycles |
|---|---|---|---|---|
| B0005 | 1.5 | 2 | 24 | 168 |
| B0006 | 1.5 | 2 | 24 | 168 |
| Cell1 | 1.48 | 0.74 | 40 | 78 |
| Cell2 | 1.48 | 0.74 | 40 | 73 |
| Health Features | B0005 | B0006 | Cell1 | Cell2 |
|---|---|---|---|---|
| EVDCT | 0.9915 | 0.9941 | 0.8666 | 0.9930 |
| IC Peak | 0.9953 | 0.9802 | 0.8829 | 0.9016 |
| PD Peak | 0.8287 | 0.9085 | 0.9247 | 0.9212 |
| Prediction Methods | Describe | Advantages | Disadvantages |
|---|---|---|---|
| SVR | Support Vector Regression | Strong generalization ability | Complex parameter tuning |
| LSE | Least Squares Estimation | Simplicity and Efficiency | Sensitive to outliers |
| Our method | Ridge Regression | Handles multicollinearity well | Regularization selection |
| Battery | Methods | MAE | RMSE |
|---|---|---|---|
| B0005 | SVR | 0.0339 | 0.0411 |
| LSE | 0.0177 | 0.0186 | |
| Our Method | 0.0042 | 0.0051 | |
| B0006 | SVR | 0.0628 | 0.0770 |
| LSE | 0.0521 | 0.0597 | |
| Our Method | 0.0188 | 0.0193 | |
| Cell1 | SVR | 0.0236 | 0.0246 |
| LSE | 0.0142 | 0.0155 | |
| Our Method | 0.0022 | 0.0027 | |
| Cell2 | SVR | 0.0226 | 0.0235 |
| LSE | 0.0143 | 0.0153 | |
| Our Method | 0.0036 | 0.0045 |
| Evaluation Metrics | B0005 | B0006 | Cell1 | Cell2 |
|---|---|---|---|---|
| MAE | 0.3600 | 0.7778 | 0.7692 | 0.7143 |
| RMSE | 0.6000 | 1.1055 | 1.1094 | 1.0000 |
| Current Number of Cycles | Real Capacity (Ah) | Estimated Capacity (Ah) | Estimation Error (Ah) | Real RUL | Prediction of RUL | Prediction Error |
|---|---|---|---|---|---|---|
| 111 | 1.4387 | 1.4382 | 0.0005 | 14 | 14 | 0 |
| 121 | 1.4383 | 1.4336 | 0.0047 | 4 | 4 | 0 |
Disclaimer/Publisher’s Note: The statements, opinions and data contained in all publications are solely those of the individual author(s) and contributor(s) and not of MDPI and/or the editor(s). MDPI and/or the editor(s) disclaim responsibility for any injury to people or property resulting from any ideas, methods, instructions or products referred to in the content. |
© 2024 by the authors. Licensee MDPI, Basel, Switzerland. This article is an open access article distributed under the terms and conditions of the Creative Commons Attribution (CC BY) license (https://creativecommons.org/licenses/by/4.0/).
Share and Cite
Wu, M.; Yue, C.; Zhang, F.; Sun, R.; Tang, J.; Hu, S.; Zhao, N.; Wang, J. State of Health Estimation and Remaining Useful Life Prediction of Lithium-Ion Batteries by Charging Feature Extraction and Ridge Regression. Appl. Sci. 2024, 14, 3153. https://doi.org/10.3390/app14083153
Wu M, Yue C, Zhang F, Sun R, Tang J, Hu S, Zhao N, Wang J. State of Health Estimation and Remaining Useful Life Prediction of Lithium-Ion Batteries by Charging Feature Extraction and Ridge Regression. Applied Sciences. 2024; 14(8):3153. https://doi.org/10.3390/app14083153
Chicago/Turabian StyleWu, Minghu, Chengpeng Yue, Fan Zhang, Rui Sun, Jing Tang, Sheng Hu, Nan Zhao, and Juan Wang. 2024. "State of Health Estimation and Remaining Useful Life Prediction of Lithium-Ion Batteries by Charging Feature Extraction and Ridge Regression" Applied Sciences 14, no. 8: 3153. https://doi.org/10.3390/app14083153
APA StyleWu, M., Yue, C., Zhang, F., Sun, R., Tang, J., Hu, S., Zhao, N., & Wang, J. (2024). State of Health Estimation and Remaining Useful Life Prediction of Lithium-Ion Batteries by Charging Feature Extraction and Ridge Regression. Applied Sciences, 14(8), 3153. https://doi.org/10.3390/app14083153