1. Introduction
Compared to the traditional connections made with gusset plates, the construction and dimensioning of connections with welded structural hollow sections necessitate a more specialized technique. This method takes into account local deformation as a limiting constraint, which is the main design criterion in many real-world situations. This is not the same as the method utilized in most steel connections. Welded joints are known for their non-linear and extremely complex local deformations and stresses at the connection nodes [
1,
2]. As such, it is not possible to simply use analytical postulates to analyze the behavior of these connections under ultimate limit states and serviceability limit states. To develop theoretical foundations and computation models for estimating the carrying capacity of these connections, a significant number of experimental and numerical studies have been carried out throughout the last 40 years [
3,
4,
5,
6,
7,
8].
However, the examination of connections between hollow section profiles is limited by the current European standard EN 1993-1-8 [
9] for the design of joints in steel structures. The given formulas are limited to specific geometrical arrangements and ratios of element sizes. Moreover, class 3 and class 4 hollow section profiles are not covered by the designated design equations. Advanced numerical techniques must be used in conjunction with thorough experimental study to overcome this problem.
The use of the finite element method (FEM), a remarkably potent tool for the computer analysis of hollow section connections under varied stress circumstances, has eliminated the need to create unique analytical solutions for distinct connection types [
10,
11,
12]. Since shell components are comparatively simple and do not need a lot of computational work, they were used to simulate joint members in the early stages of FEM implementation [
13,
14]. Solid elements have become more popular for FEM analyses of hollow section joints as processing power and speed have increased [
15,
16]. The main benefit of using solid parts is that welding can be modeled more easily and precisely. Engineering practice needs to streamline FEM modeling because it saves money and time on calculations. As a result, considerable research has been conducted in recent years to try to streamline the modeling process, and novel techniques such component-based finite element modeling [
17] have been put forth.
Numerical models can be used for parametric analyses and the derivation of analytical equations for geometrical solutions that are not covered by existing standards, provided that they are verified by experimental data. The carrying capacity of structural components or connections can then be improved by using these derived equations. The ultimate strength, initial stiffness, and failure processes of tubular T/I joints reinforced by doubler plates under axial compressive loads were all numerically analyzed by the authors in [
18,
19]. According to their research, a doubler-plate-reinforced T/I joint’s ultimate strength can reach up to 295% of that of an equivalent unreinforced joint. Furthermore, the doubler-plate-reinforcement approach greatly improves the failure modes of tubular T/I joints subjected to axial compressive loads and boosts initial stiffness. The authors developed a novel formula for the construction of these connections by building on the results of the parametric analysis.
In [
8,
20], the authors used non-linear computational calculations to calculate the “T” connectors’ finite limit bearing capacity. Comparative studies between analytically and numerically estimated bearing capacities and experimental data were carried out, and a non-linear materialism model was used to evaluate the steel modeling method. The authors emphasized important findings on the limit states of “T” connections by drawing conclusions from the experimental research as well as the results from numerical and analytical solutions. Notably, the load capacity of experimentally evaluated connections was depleted as a result of the local plasticization of the chord flange. It was also underlined that the analytical models used to analyze these connection behaviors are predicated on the concept that rigid-plastic materials behave optimally at the connection. The study’s experimental and numerical results demonstrated the connection’s elastic–plastic behavior with notable elastic deformation, raising questions about the load capacity related to the straining condition. It was said that the stresses and local deformations at the connection nodes were extremely complicated and non-linear. The limit carrying capacity values that were established experimentally were up to 2.5 times more than those that were calculated in accordance with EC 3 using nominal stretching limits, taking experimentally determined stretching limits into account as well. After taking seam effects into consideration, the authors empirically arrived at a limit bearing capacity value that was almost 25% higher than the results obtained numerically. Because of the post-elastic stiffness of the material resulting from plastic deformations and membrane effects, the calculated limit bearing capacities for the experimentally tested joints were very conservative. The good coherence between the experimental data and numerical and analytical approaches was established as the paper’s conclusion. In [
21], the authors studied “T” connections of cold-formed RHS sections and concluded that the corners of cold-formed RHS sections should be considered in predicting both web buckling strength and chord flange strength. In the publication [
22], the study included the hollow section, as well as the fatigue loading. Some recommendations for the advanced design of the RHS section connections are also given in [
23].
The appropriate material parameter selection is another important part of FEM modeling. An approximate stress–strain relationship is frequently used in place of an accurate one in order to speed up computations. Usually, in FEM analyses, the stress–strain relationship is defined by a bilinear model with isotropic hardening. Ref. [
24] discusses the limitations of this kind of material model. The advantage of non-linear FEM modeling compared to analytical solutions was pointed out in [
25,
26,
27].
The results obtained from the theory of limit states show that the behavior of these connections at the fracture state is dependent not only on the base material quality and the geometric properties of the connected element, but also on the configuration, or more specifically, the shape of the connection, and the kind and size of the load applied to a chord.
In order to account for material non-linearity, this study presents the use of a non-linear numerical analysis for “T” connections and makes comparisons with the findings of experimental research carried out under quasi-static loading [
28]. This methodology applies a mixed incrementally iterative strategy based on the so-called Total Lagrange formulation [
29]. This method divides the overall load into multiple steps, or increments, and performs iterations at each step to equalize the residual load. This is the basic formulation used in numerical approaches to solve non-linear issues [
30].
To validate the presented modeling method under the limit states of these connections, a comparison analysis of the outcomes from the analytical solution and the numerical and experimental findings was conducted [
28].
The software tool ANSYS R14.5 was utilized to conduct the numerical non-linear analysis [
31].
2. Experimental Research
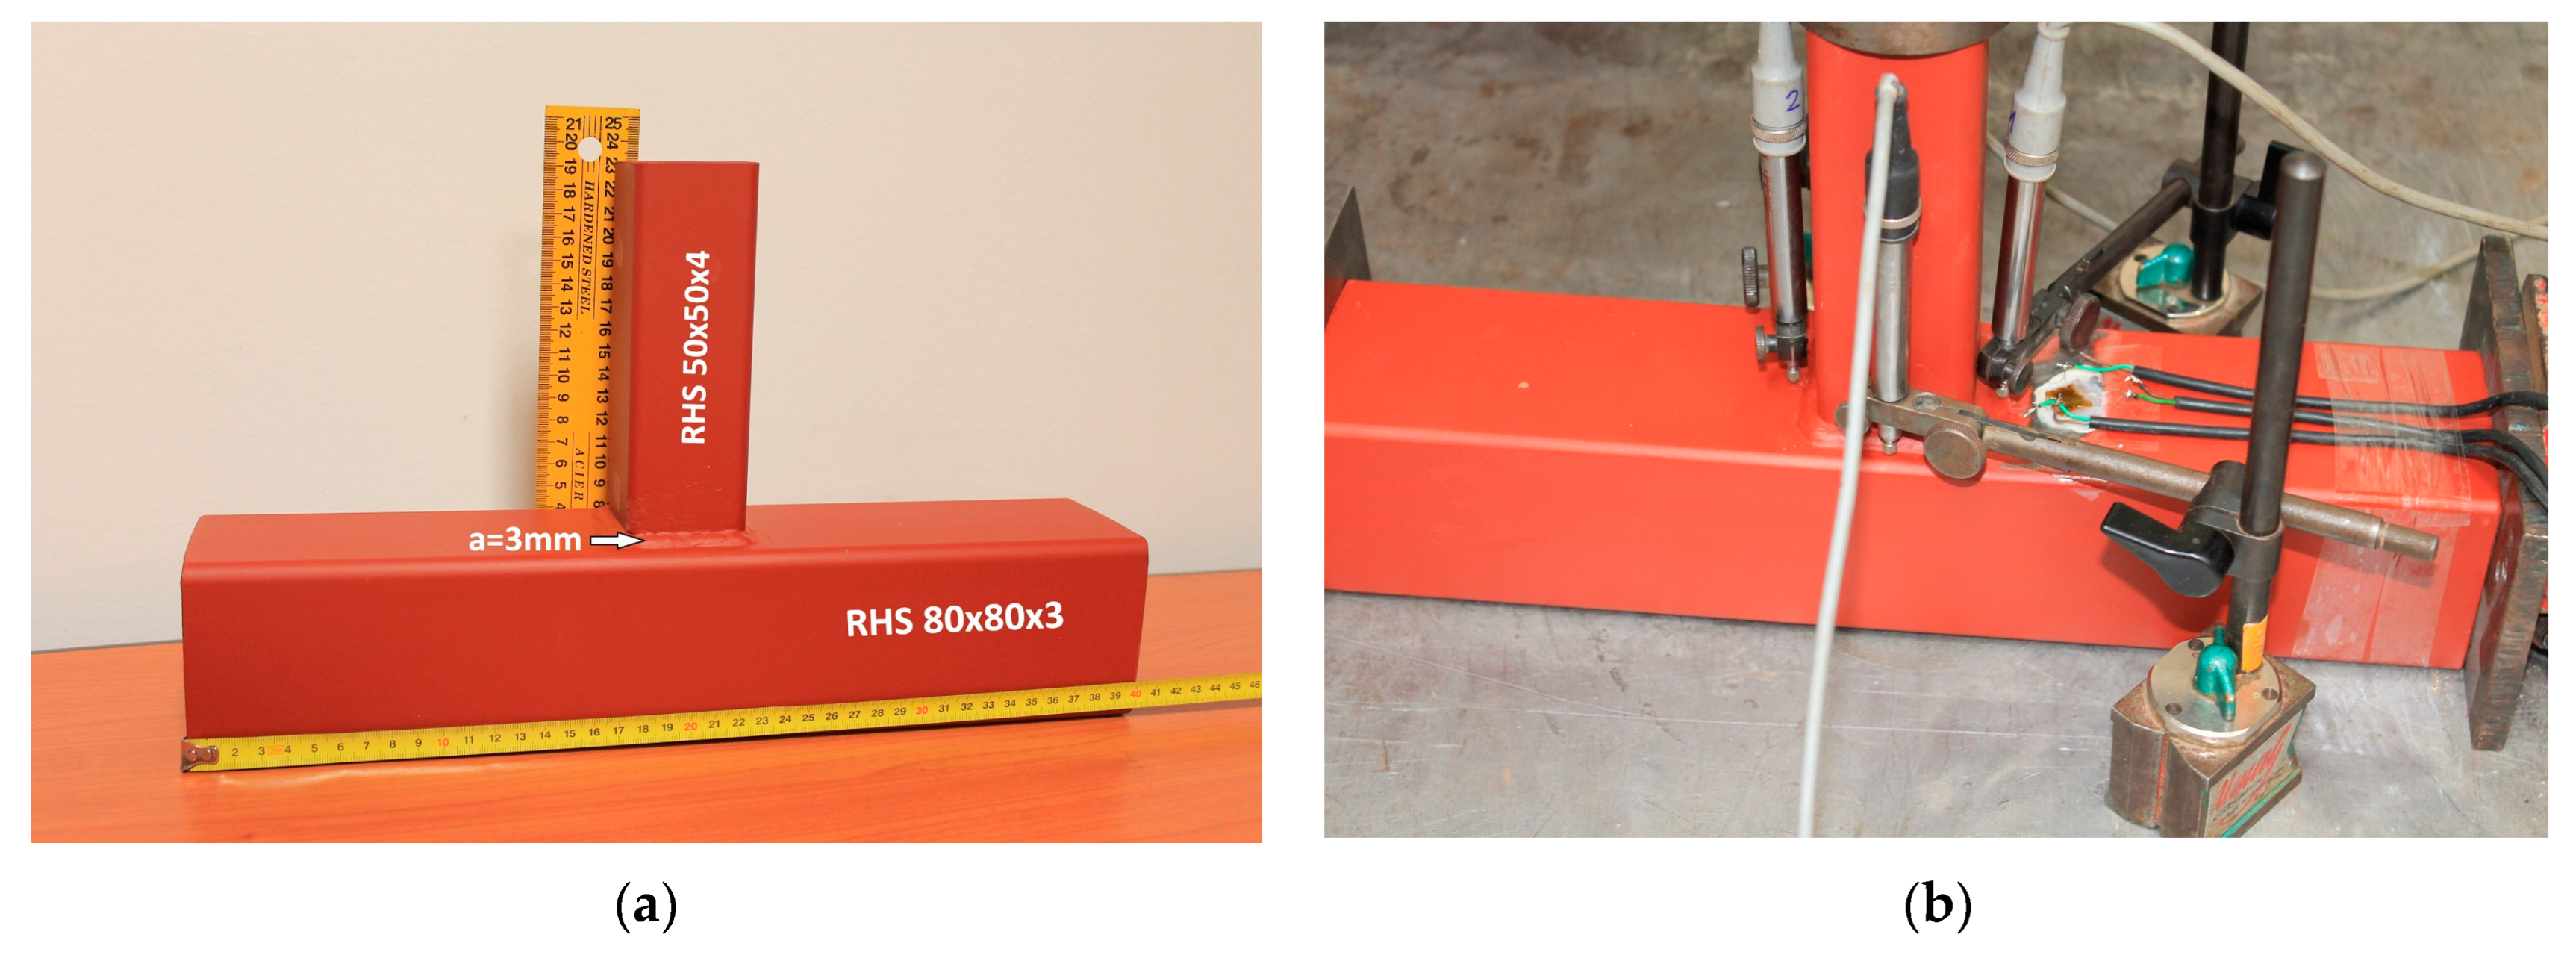
“T” connectors made of square hollow sections made from cold-formed S235JR steel profiles were the subject of the experimental study. A 90-degree angle in the physical model represents the link between the vertical brace element and the truss chord. The length of the brace was 200 mm, while the chord length was 400 mm. A 3 mm thick fillet weld was used to connect the two components.
There were three samples tested in a quasi-static environment. Using a hydraulic piston on a hydraulic press with a 100-ton load capacity, a static force on the connection was applied. According to EN ISO 6892-1 [
32], the test load was delivered within the permitted limits.
The test was designed to reach a local displacement of 3% of the chord width or height in order to determine the joint’s ultimate bearing capacity based on the deformation limit criterion. The experimental configuration is depicted in
Figure 1b, wherein the brace was positioned vertically by positioning the chord at a 90-degree angle from the horizontal plane.
Hydraulic presses with a 50 kN capacity were used to exert axial pressure forces on zonal elements. The 50 kN range HBM U2A dynamometer was used to measure the imported force intensity. A mobile force reader made by TRC pro with the label DIGIDYN was used to measure the force (
Figure 1b).
Three places were simultaneously used to quantify local deformations (displacements): the two side surfaces of the chord (10 mm from the chord top surface) and one in weld (in the center of the chord top flange). An HBM linear variable displacement transducer with a ±2 mm measurement range was used to measure displacements. A mobile force reader made by TRC pro (labeled DIGIDYN) was used to obtain the force readings. As a result, a 4 mm maximum displacement value was set. A SPIDER8 data acquisition system was utilized for data recording, with a 10 Hz sampling frequency.
Having in mind the stress state around the connection, the local strains were monitored with help of measuring tape rosettes (10/120 RY41) with angles of α = 0°, α = +120°, and α = −120°, with base length of 10 mm and data
p = 1 × 10
−6, which were produced by Hottinger (
Figure 1b).
Material Parameters of Joined Elements
The cold-formed square hollow-section steel profiles used to create the “T” connectors under investigation (
Figure 1) have certain mechanical and partially defined chemical properties. The connection was built in compliance with the applicable EN bearing steel construction guidelines [
33,
34].
The chemical composition and mechanical parameters of the chord element, which was produced using RHS 80 × 80 × 3 CFR(C) HS longitudinally welded steel profiles composed of S235JR steel, with the mechanical characteristics of the basic material (steel), are ReH = 281 MPa and RM = 381 MPa.
The brace elements, which were made of S235JR steel and constructed from RHS 50 × 50 × 4 CFR(C) HS longitudinally welded steel pipes, with the mechanical characteristics of the basic material (steel): ReH = 255 MPa and RM = 355 MPa.
3. FEM Modeling
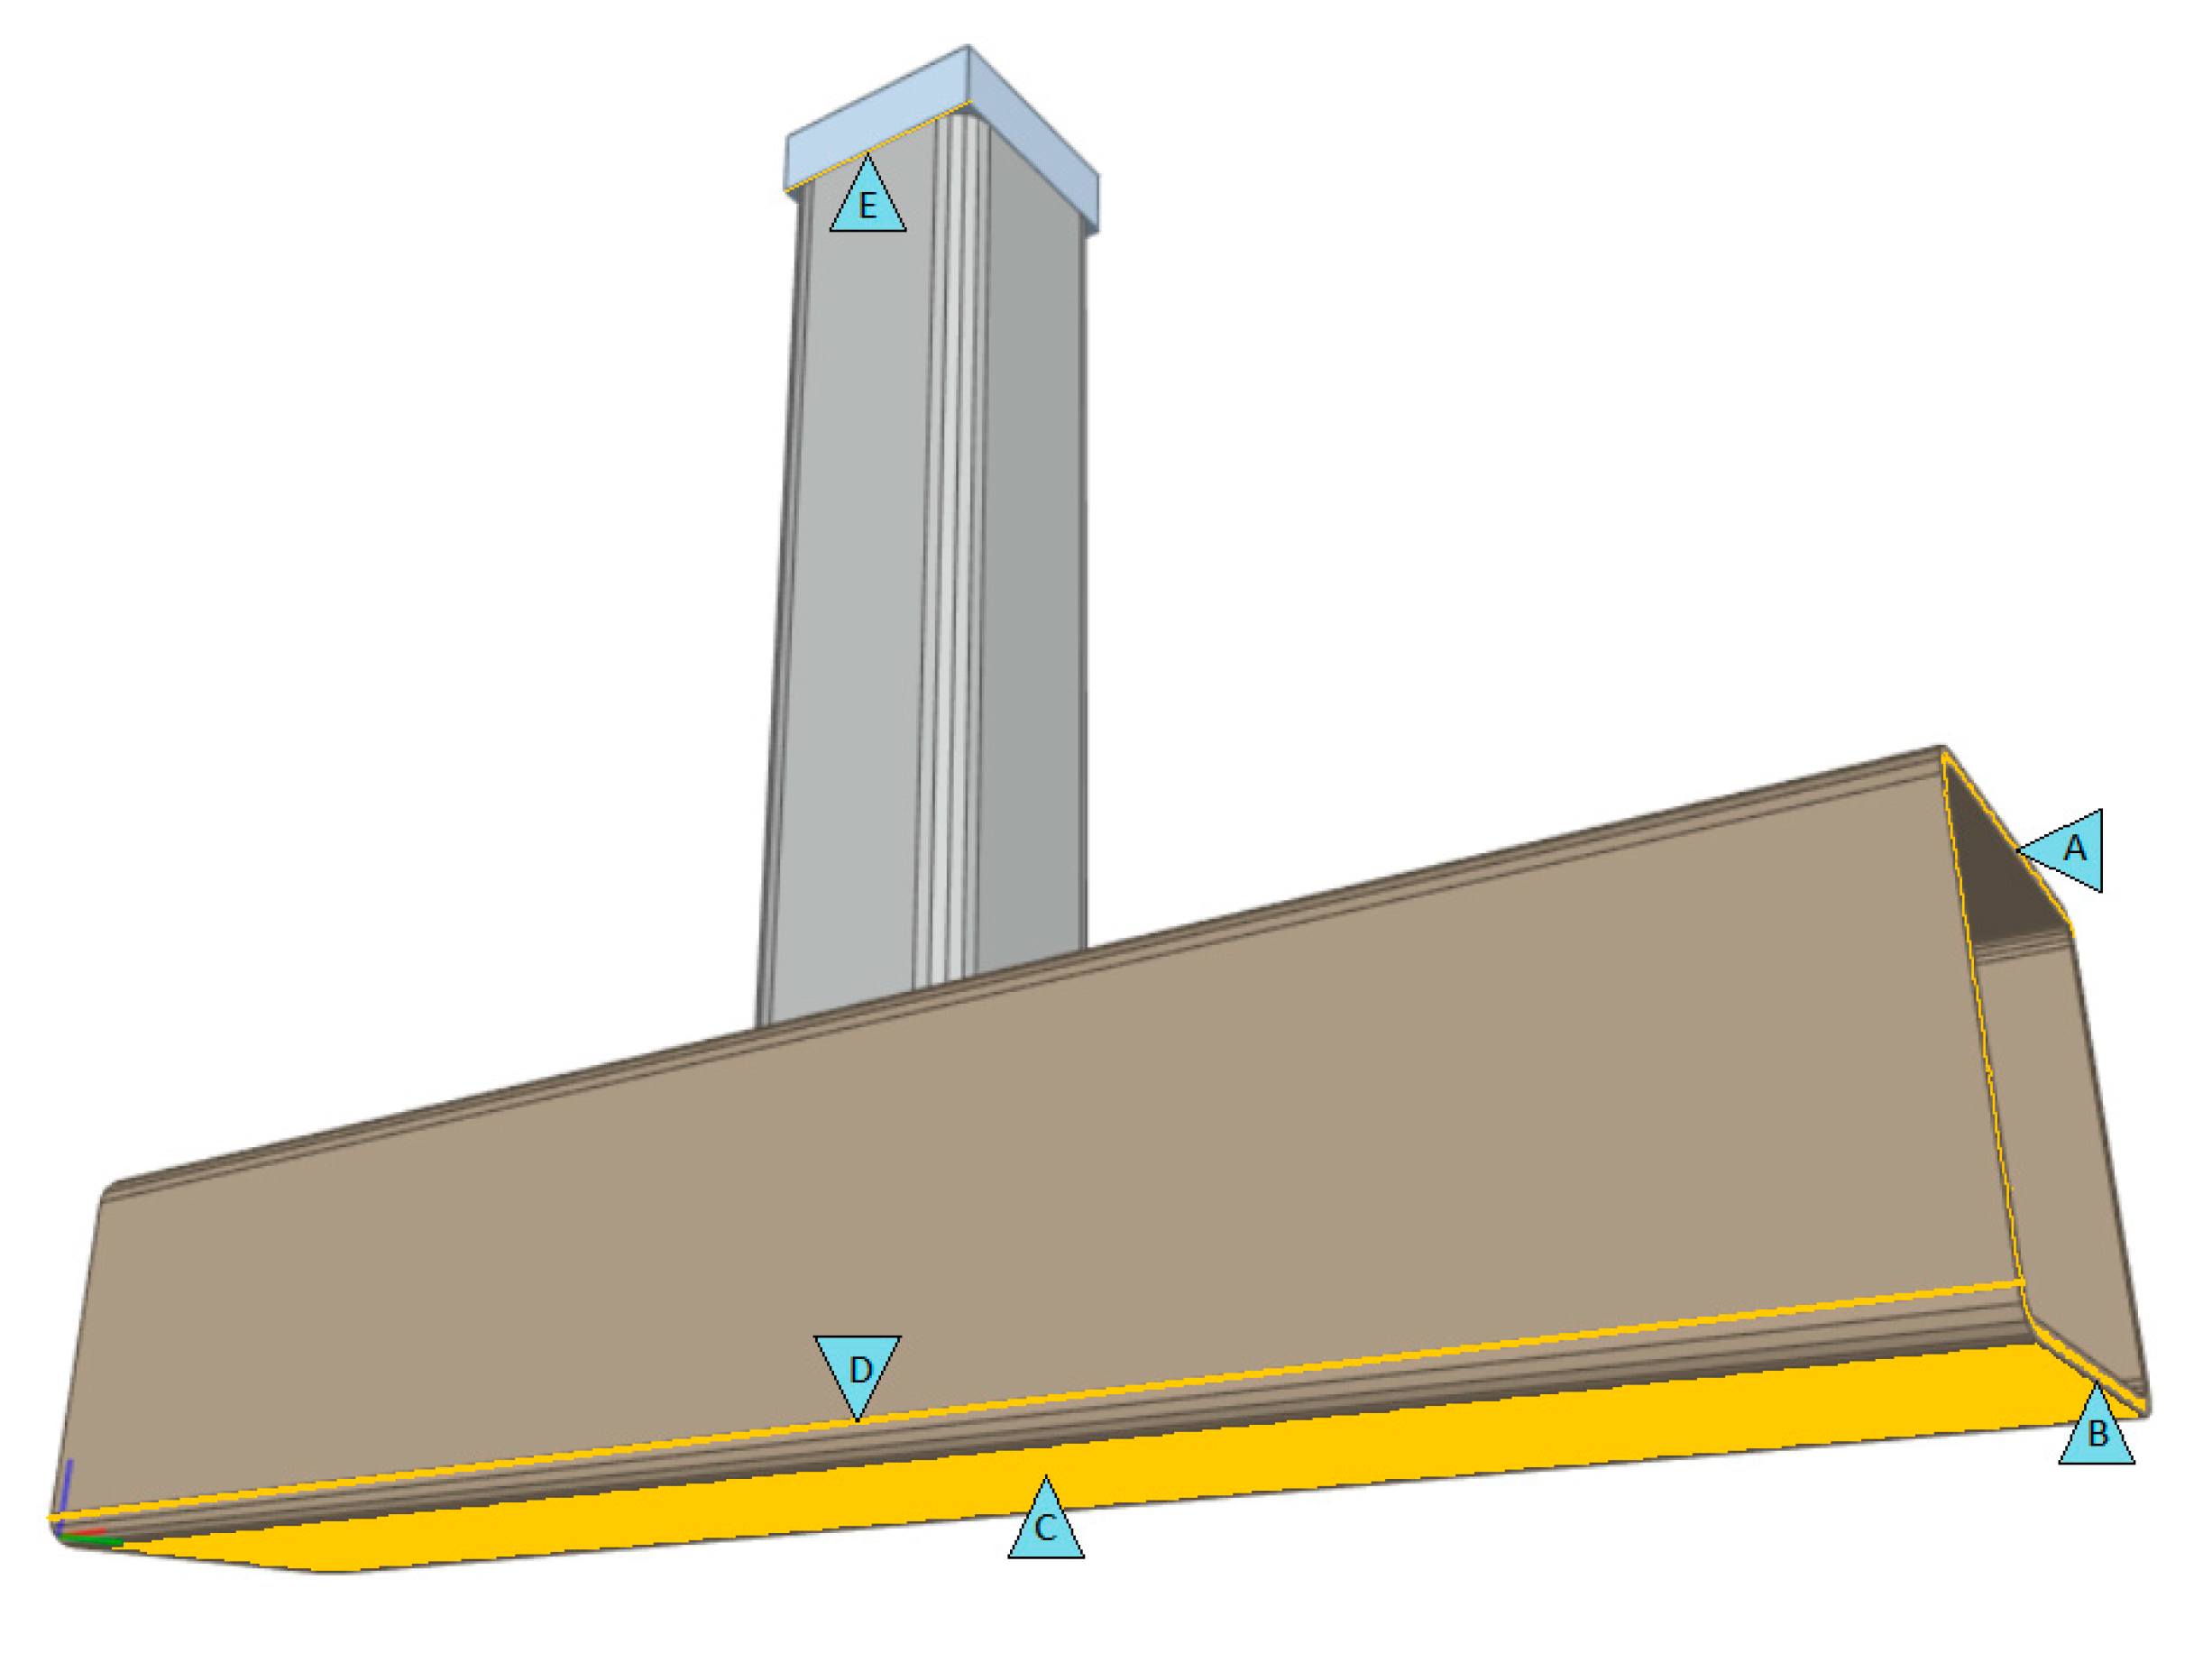
The commercial software ANSYS R14.5, which is based on FEM, was utilized to perform numerical analyses. Two solid bodies were assembled to represent the joint in the model. The chord element was represented by the second body, whereas the perpendicular brace and fillet weld were comprised of the first body. The weld was only represented at the brace’s straight sections in order to simplify the model. As mentioned in
Table 1 and shown in
Figure 2 and
Figure 3, the boundary conditions were carefully chosen to replicate the experimental conditions. Surfaces that made contact with the experimental rig’s fixed parts were configured to move zero degrees in the direction perpendicular to the contact surface. By defining a bonded contact pair between the surfaces of the two bodies, the contact between the brace/fillet weld and the chord was established.
The automatic mesh generator included with ANSYS Mechanical was used to create the mesh. The command body sizing was used to control the element’s size. Automatic mesh refinement was applied at the surface level, set to half of the body element size, in the high-stress areas, namely at the brace and chord contact. By changing the element size at the body level, this method made the mesh convergence research easier to complete. For element sizes of 15 mm, 10 mm, and 5 mm, calculations were made. Meshing was performed using SOL-ID187 elements, which are higher-order 3-D, 10-node elements with quadratic displacement behaviors appropriate for modeling irregular meshes. According to the mesh convergence investigation, there was no discernible difference between the two finer-meshed models’ estimations for the development of total strain with increasing load. Thus, both meshes were to be sufficient.
The following basic input data were applied to the material, taking into account both geometrical and material non-linearity in the numerical analysis:
The yield strength and ultimate strength of the steel material were modeled as described in Section Material Parameters of Joined Elements, with the following applied values: for the chord element, the yield strength was set to fy = 282 MPa and the ultimate strength to fu = 381 MPa; for the brace element, the yield strength was specified as fy = 255 MPa and the ultimate strength as fu = 355 MPa.
4. Analysis of the Results
For the studied “T” connection type, a comparison between the analytical solution and experimental findings was carried out, in addition to the outcomes of the non-linear numerical analysis. In this investigation, local deformations in the connection area were evaluated both qualitatively and quantitatively, and stress fields were examined qualitatively. The following factors determined the connection’s ultimate carrying capacity:
EC 3 [
9], applying nominal yield strength;
EC 3 [
9], applying experimentally determined yield strength;
Analytical model, considering the effect of welds;
Experimentally determined load-bearing capacity of connections.
The von Mises stresses in the stress concentration zones were found to be far more than the material’s ultimate strength during the preliminary research’s mesh convergence study. It is possible to trace this disparity to the FEM computational approach. More specifically, only in elastic regions can the solution findings be accurately extrapolated from integration points to nodes. When plasticity is present, the results could be inaccurate since the behavior of the material inside one element is not well captured by linear extrapolation. Reducing the element size or the separation between integration points and nodes could help to minimize errors. The ERESX command [
31], which is implemented through the ANSYS APDL snippet, can also be used to regulate the extrapolation. It can be specified to copy or extrapolate findings from integration points to nodes.
An exaggerated increase in stresses, well beyond the ultimate stress, was found at the transition from the elastic to the plastic region in the von Mises stress distribution with allowed extrapolation, during a stage where a considerable portion of the chord’s top side was in the plastic region. By minimizing the discrepancy between the value at the integration point and the extrapolated value, decreasing the element size may result in stresses that are more realistic. Nonetheless, to stop the yielding zone from spreading, a very fine mesh must be achieved in a sizable zone. An alternative strategy would be to either fully or partially activate the extrapolation. Values are copied from integration points to nodes in the first scenario, and extrapolation is limited to elements that have not surrendered in the second scenario. Stresses greater than the maximum strength, however, could still happen in the second scenario. Extrapolation was fully removed for the mesh convergence research and the final calculations.
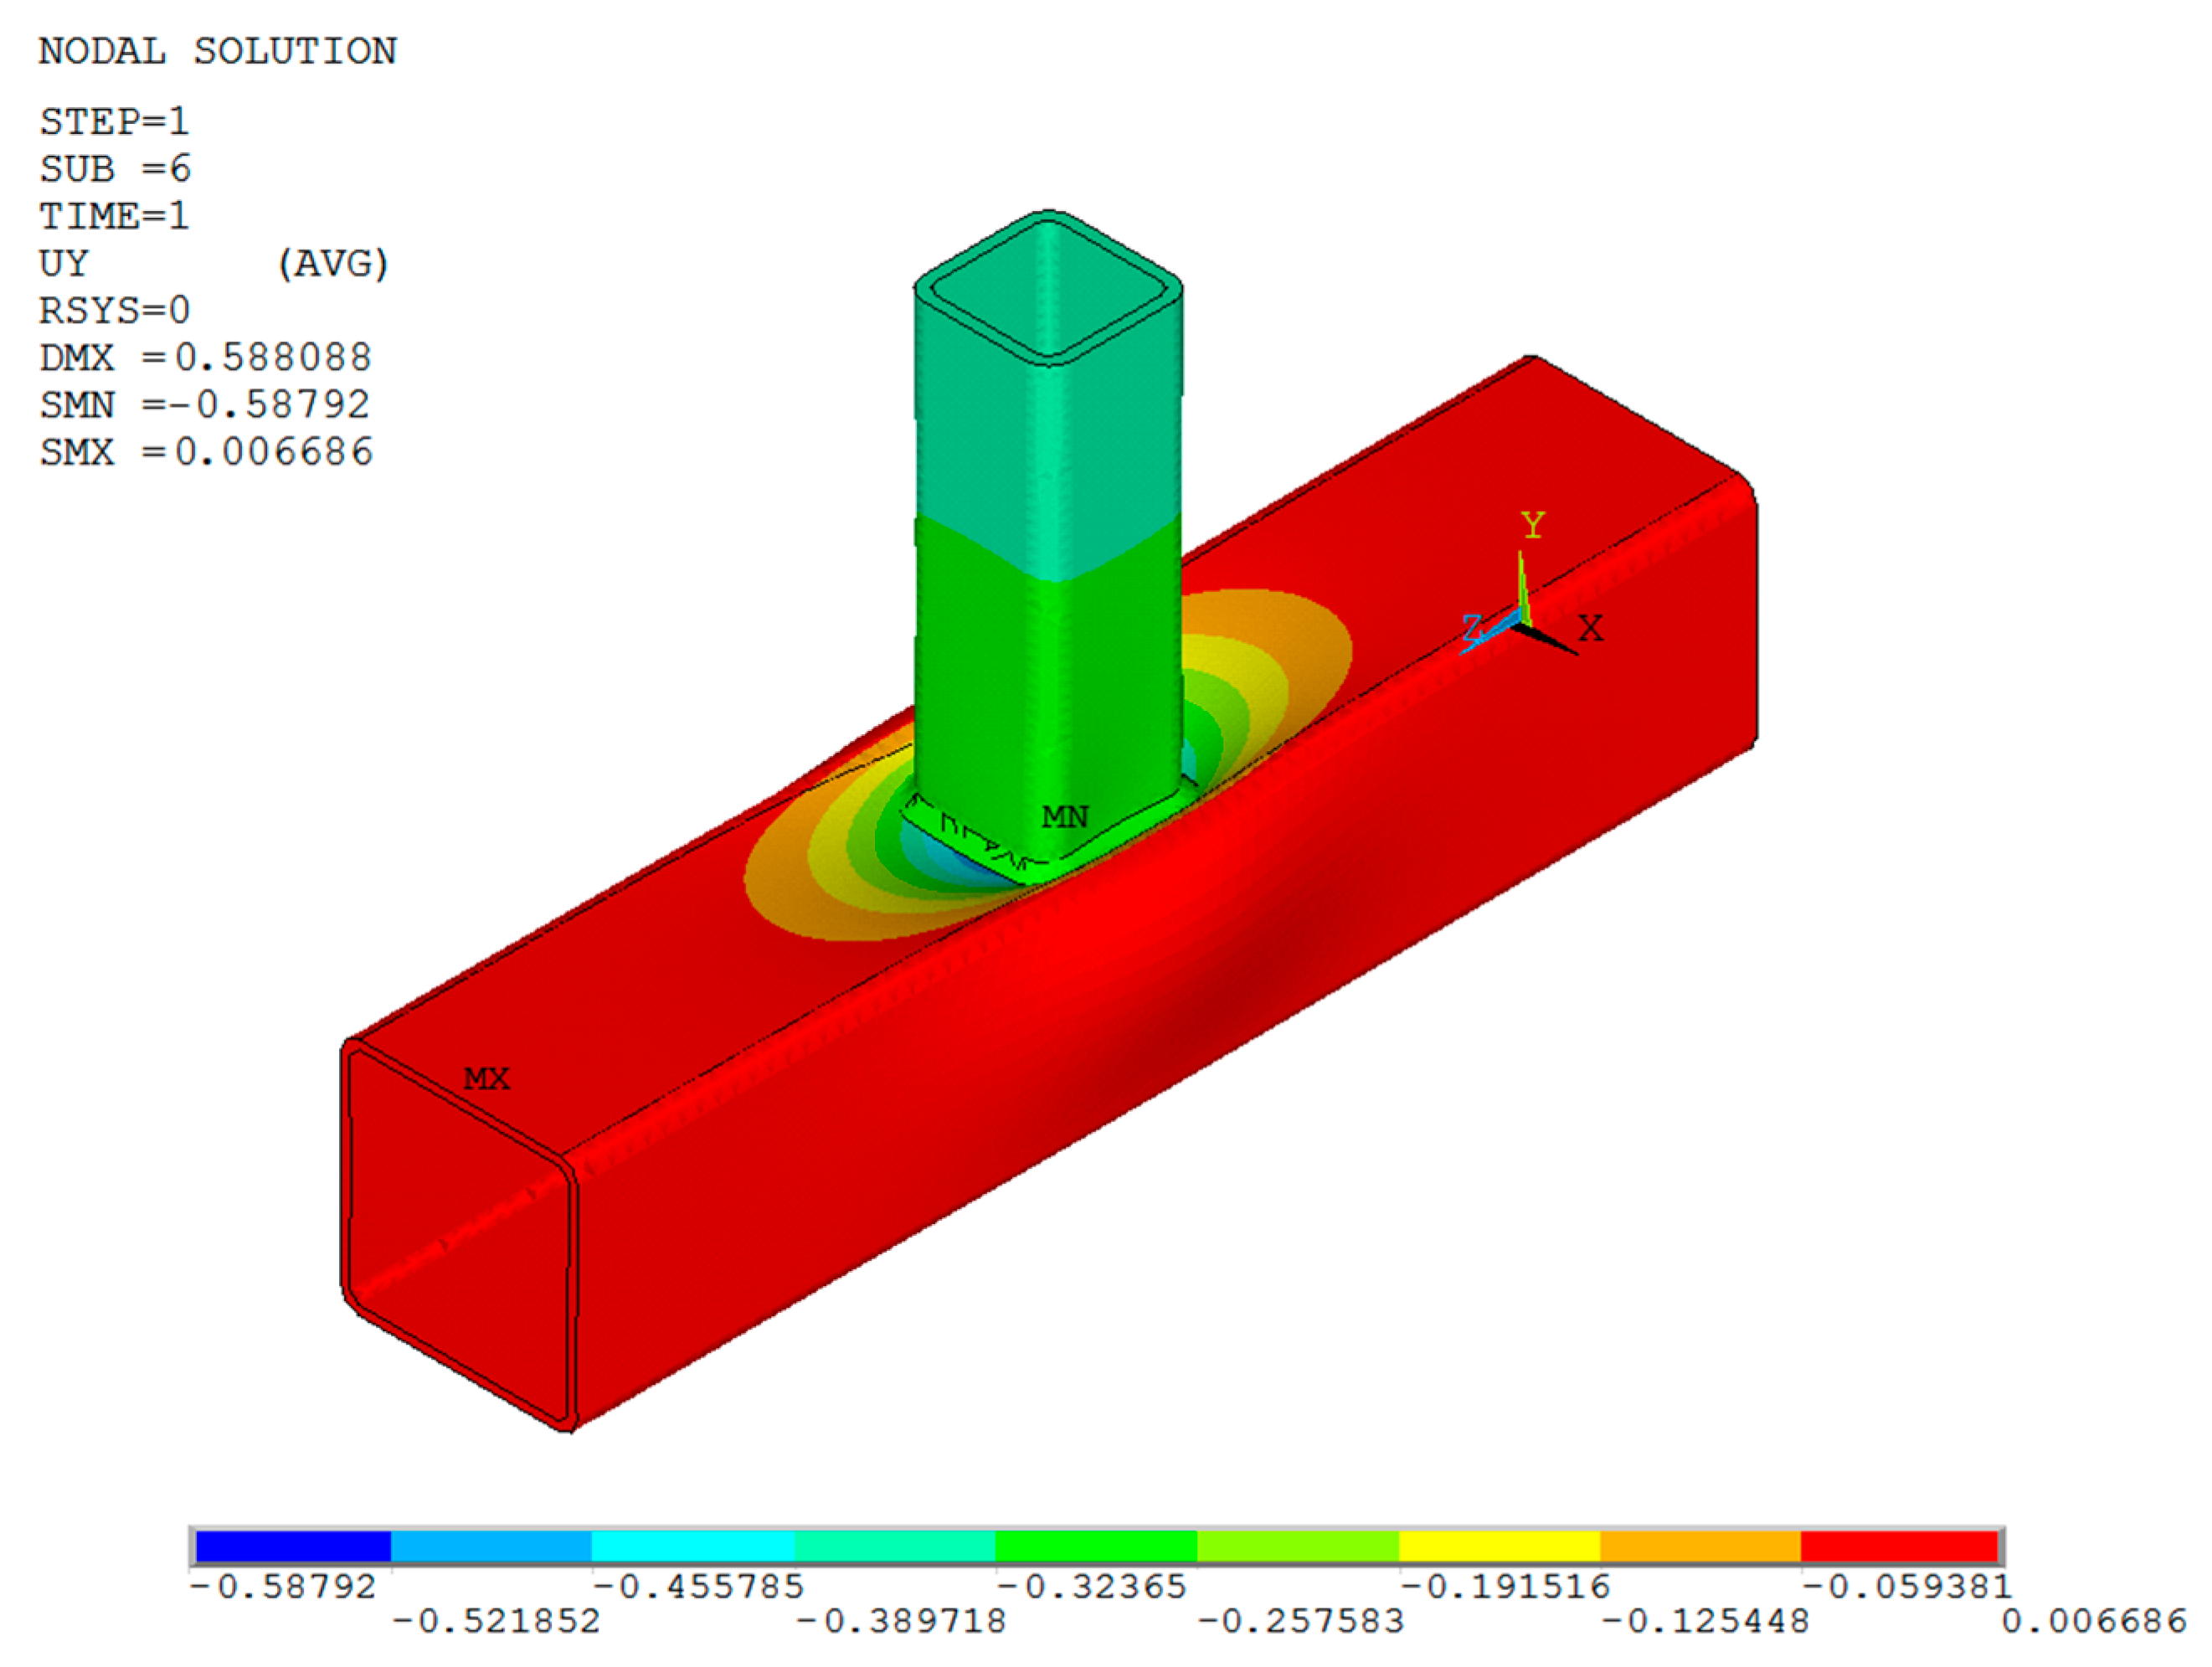
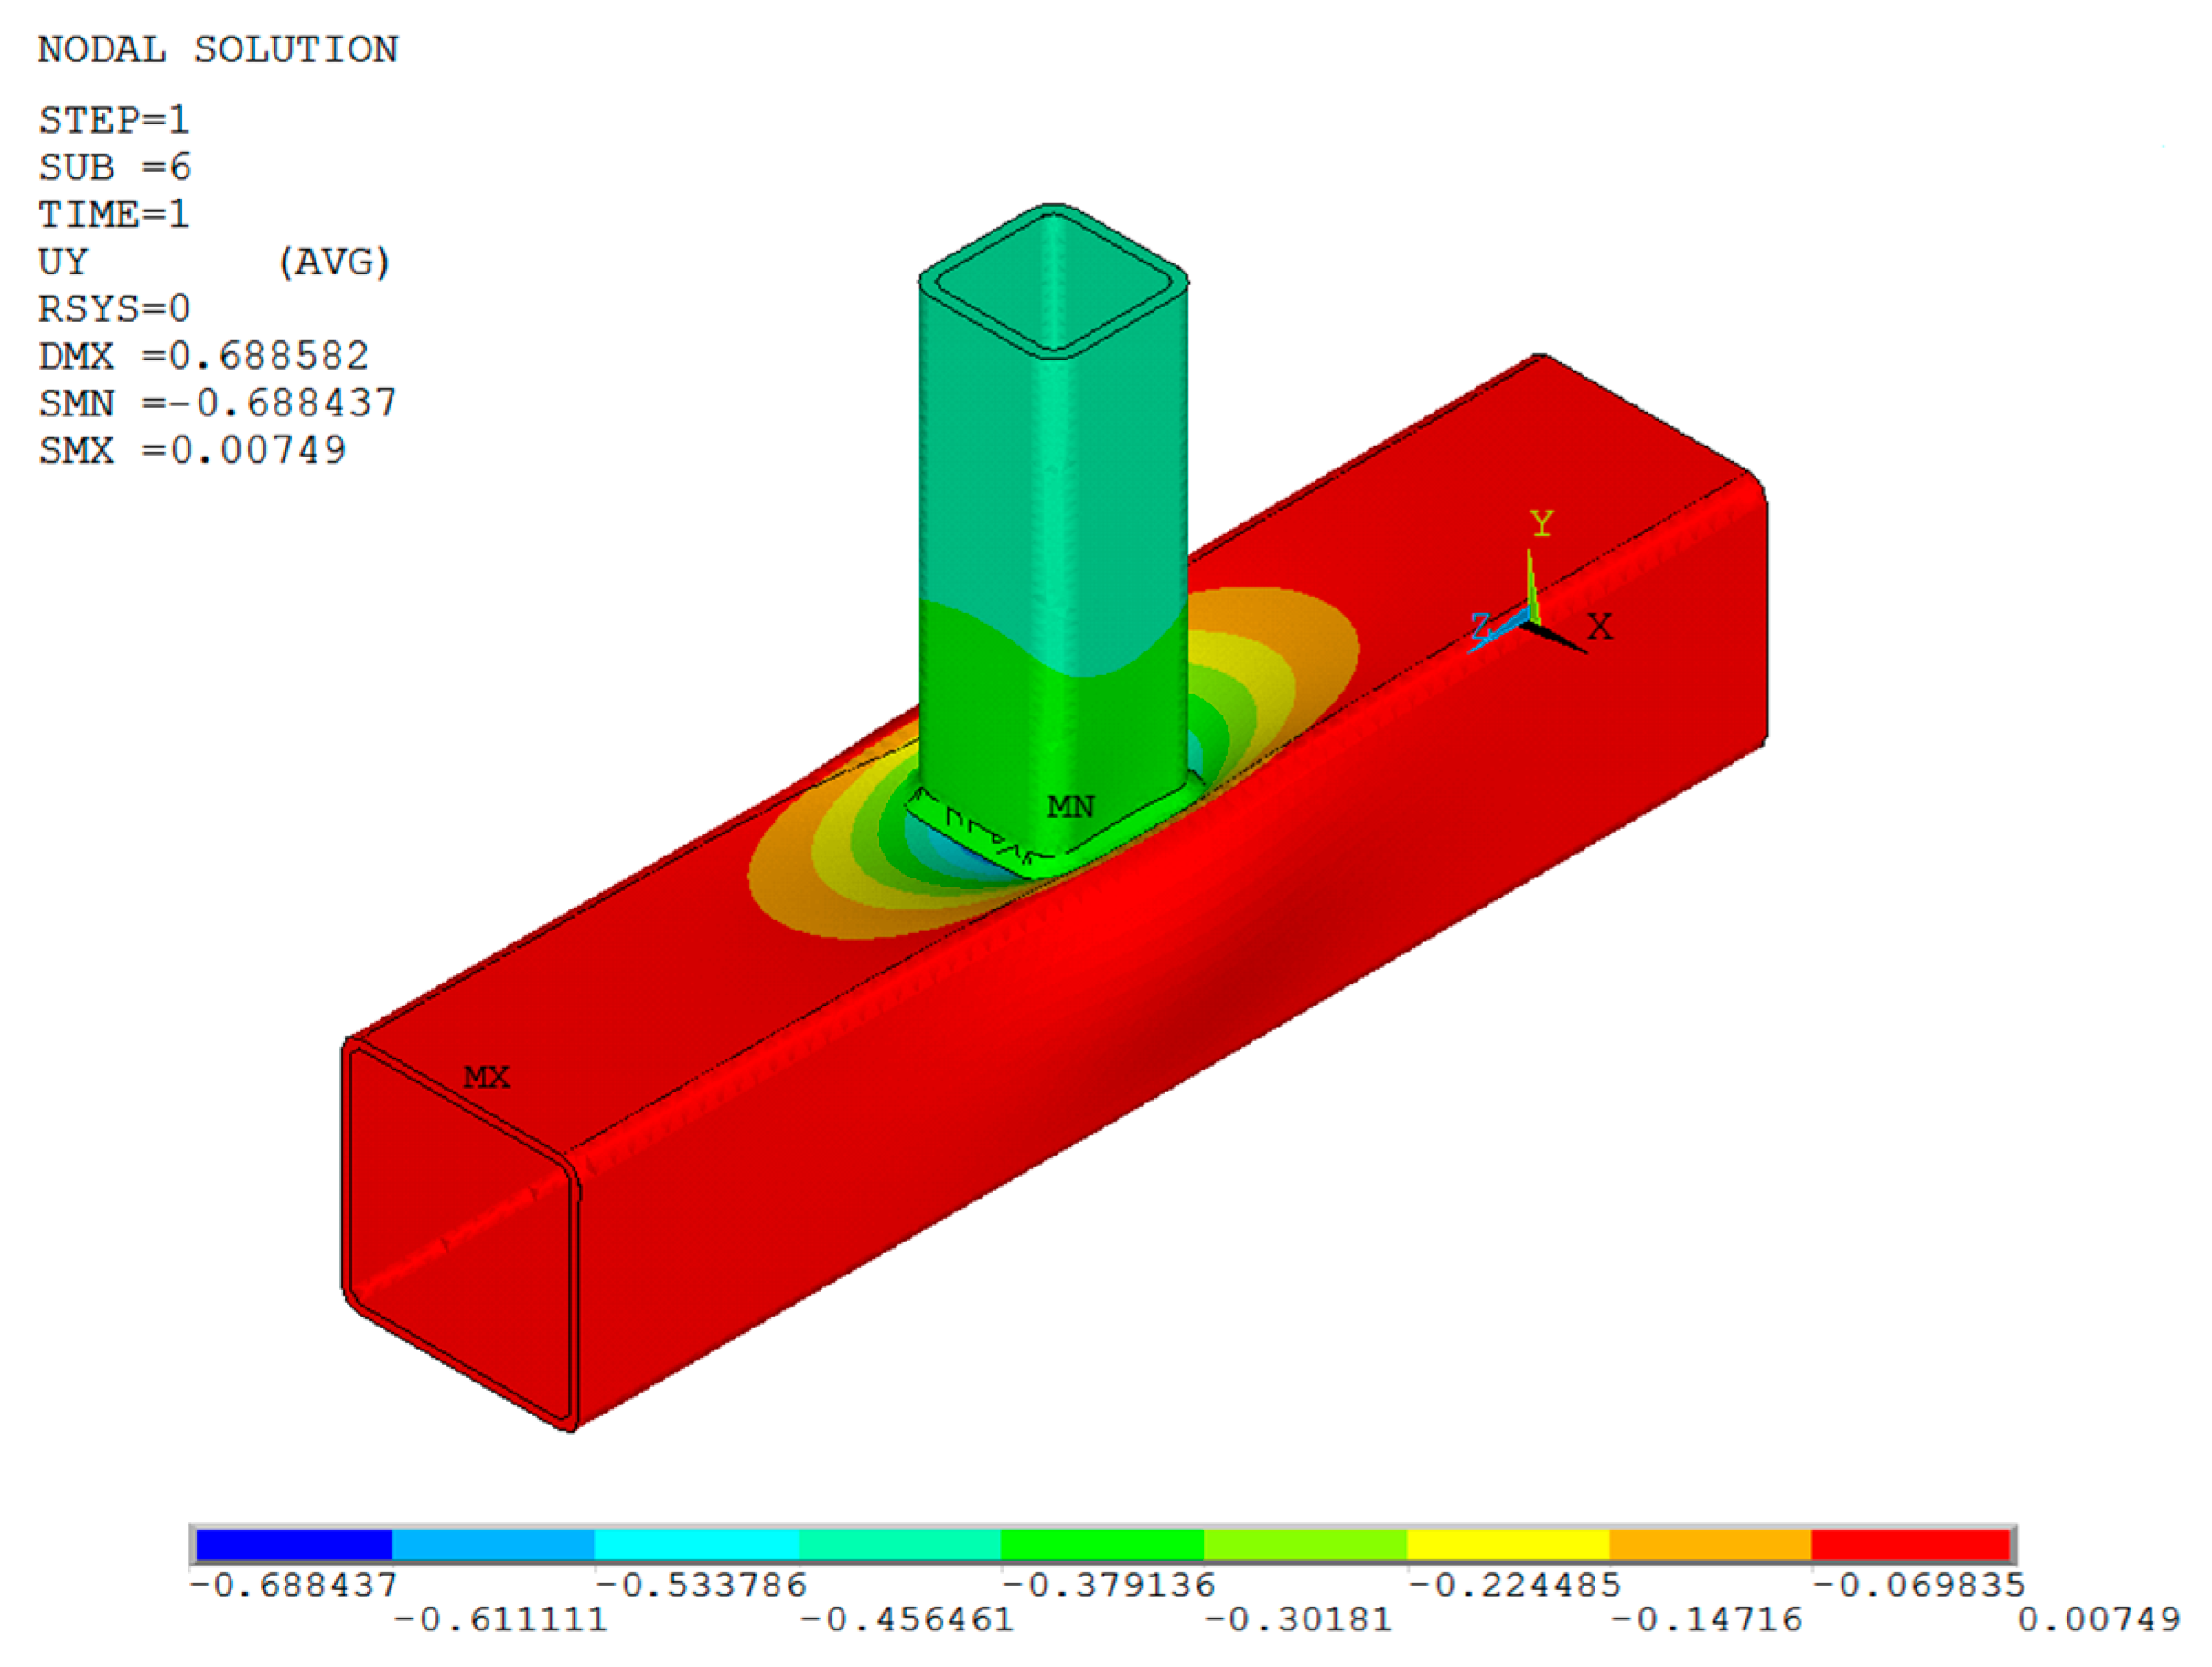
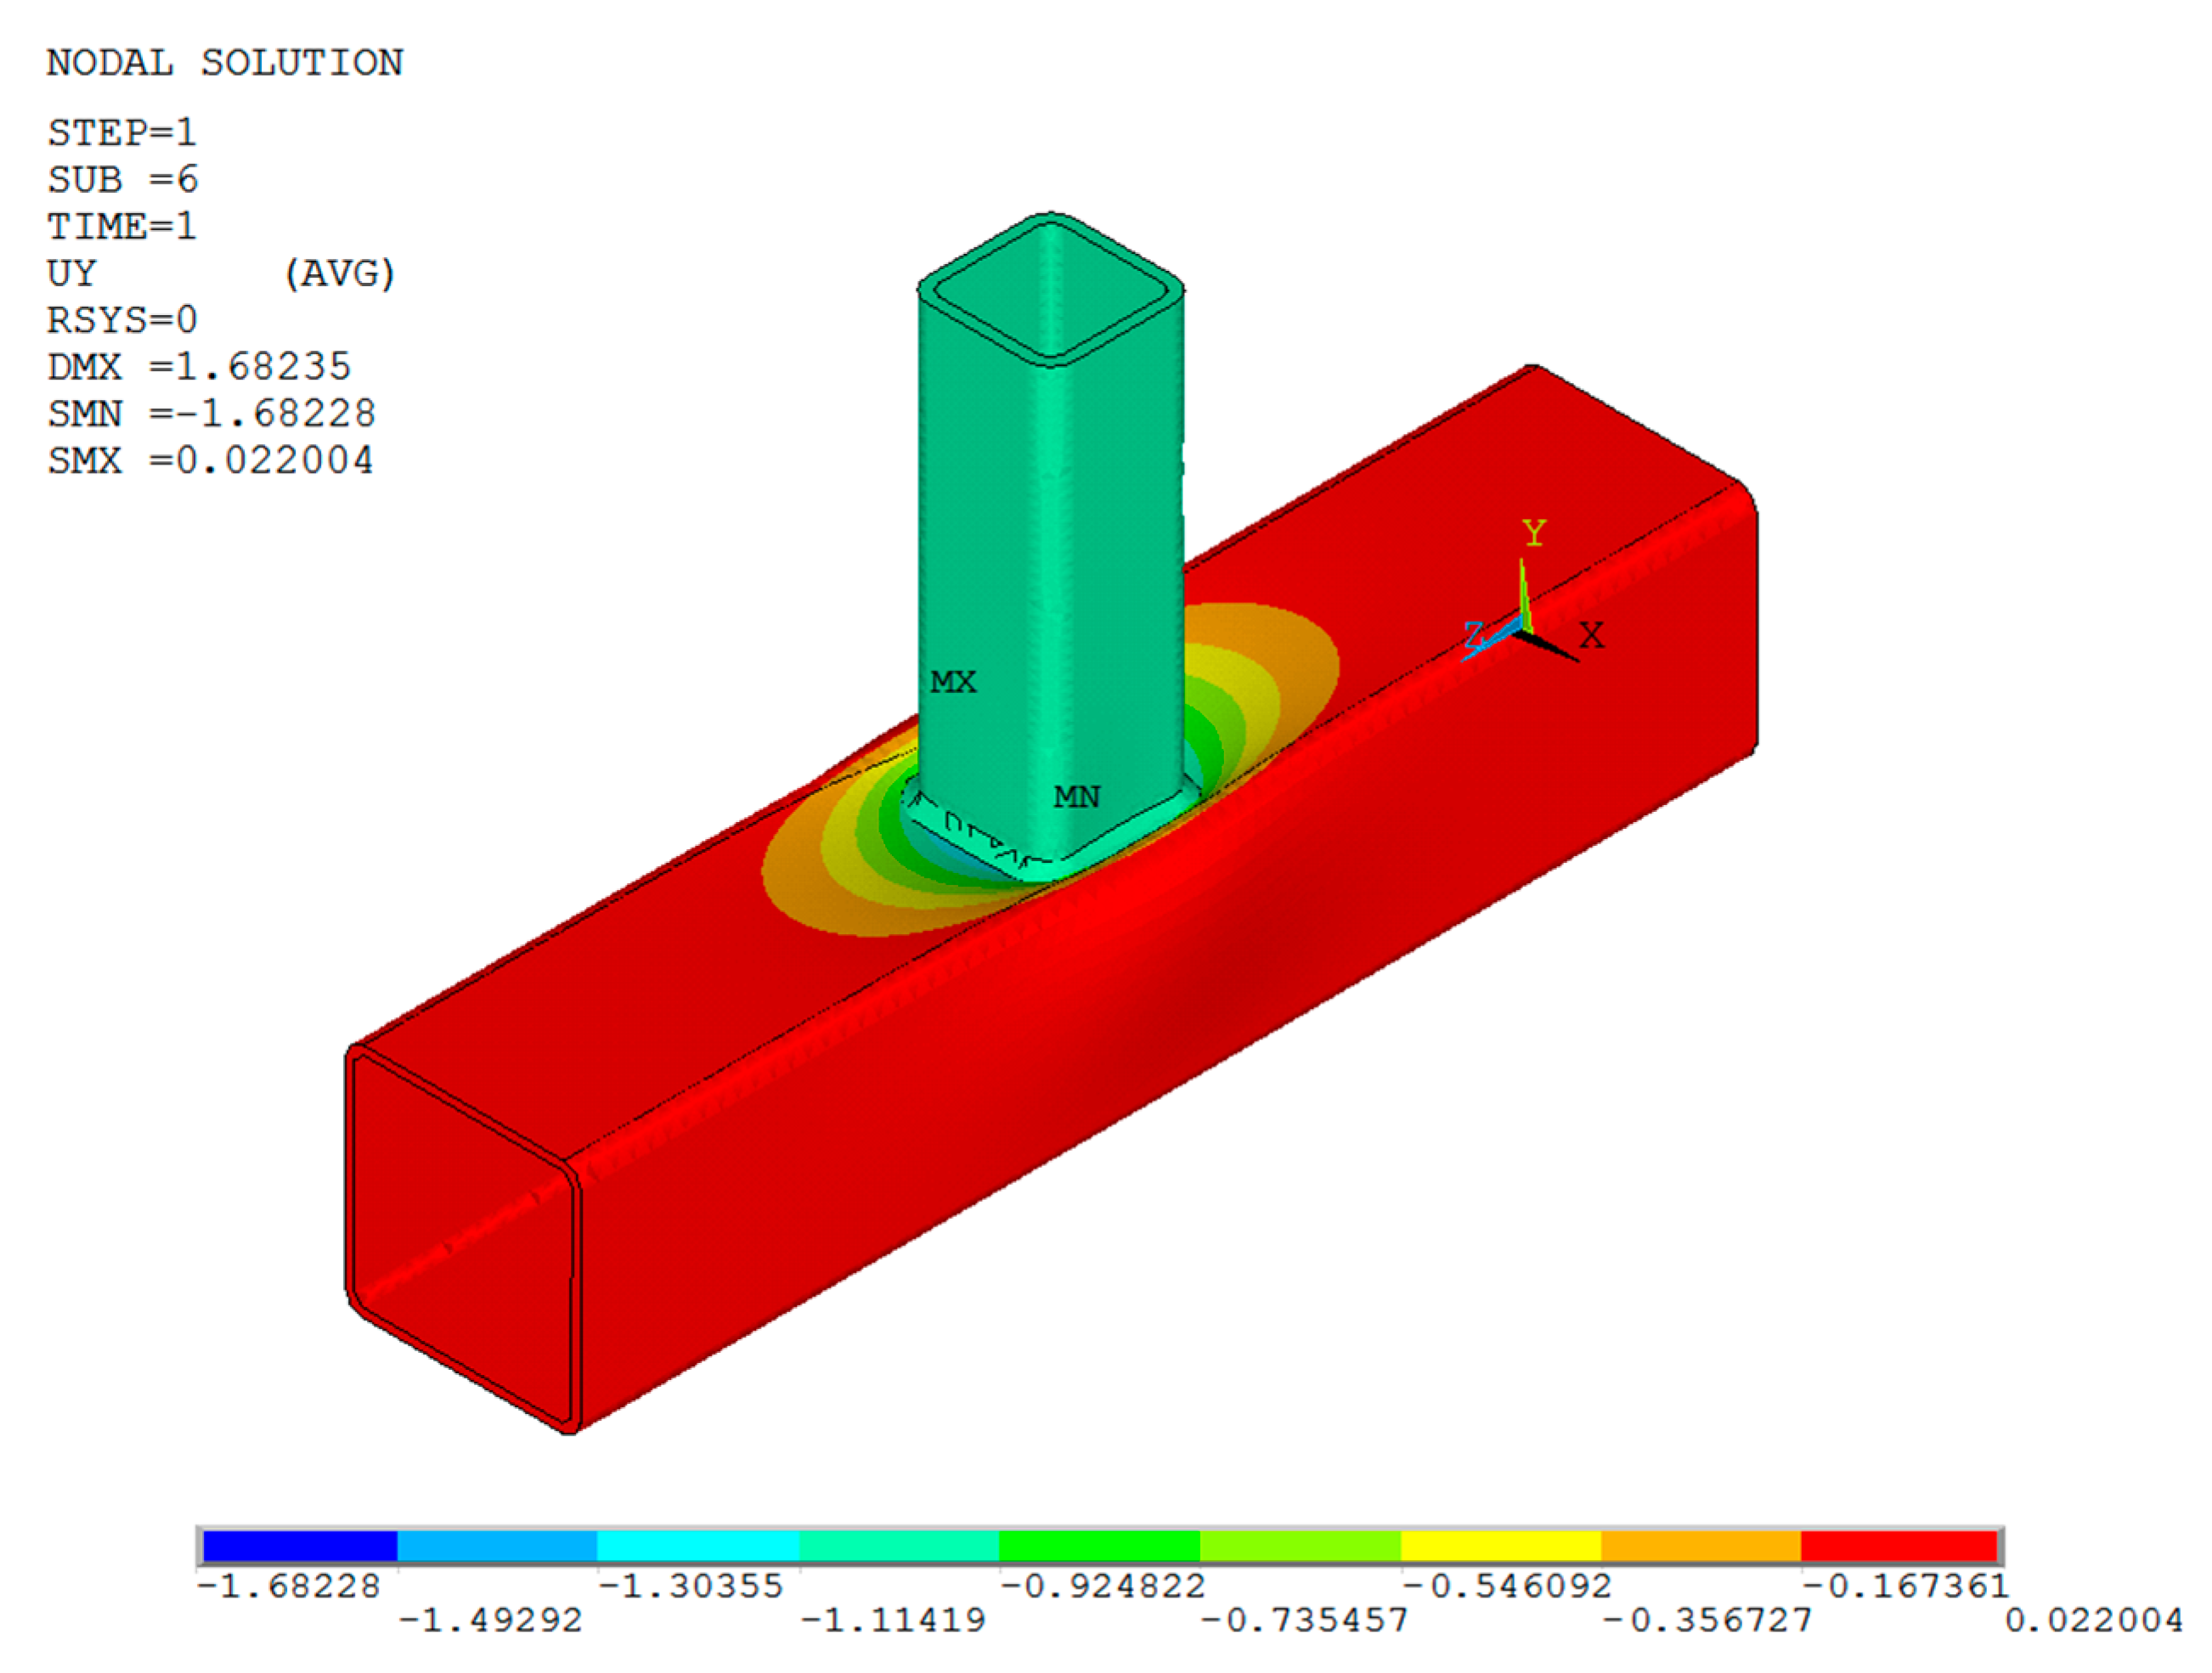
Contour plots that show the stress field and deformation are used to visually represent the analytical results or typical output data. The designations “MX” and “MN” in these figures indicate, respectively, the maximum and minimum values of the relevant output data.
The local deformations of the y-direction components of the “T” connection for different load values are shown in
Figure 3,
Figure 4,
Figure 5 and
Figure 6. Using the previously described methods, the applied stress level was set to match the bearing capacities of the connections under investigation.
Table 2 provides comparative representations of maximum local deformations and ultimate carrying capabilities of connections obtained using the non-linear analysis.
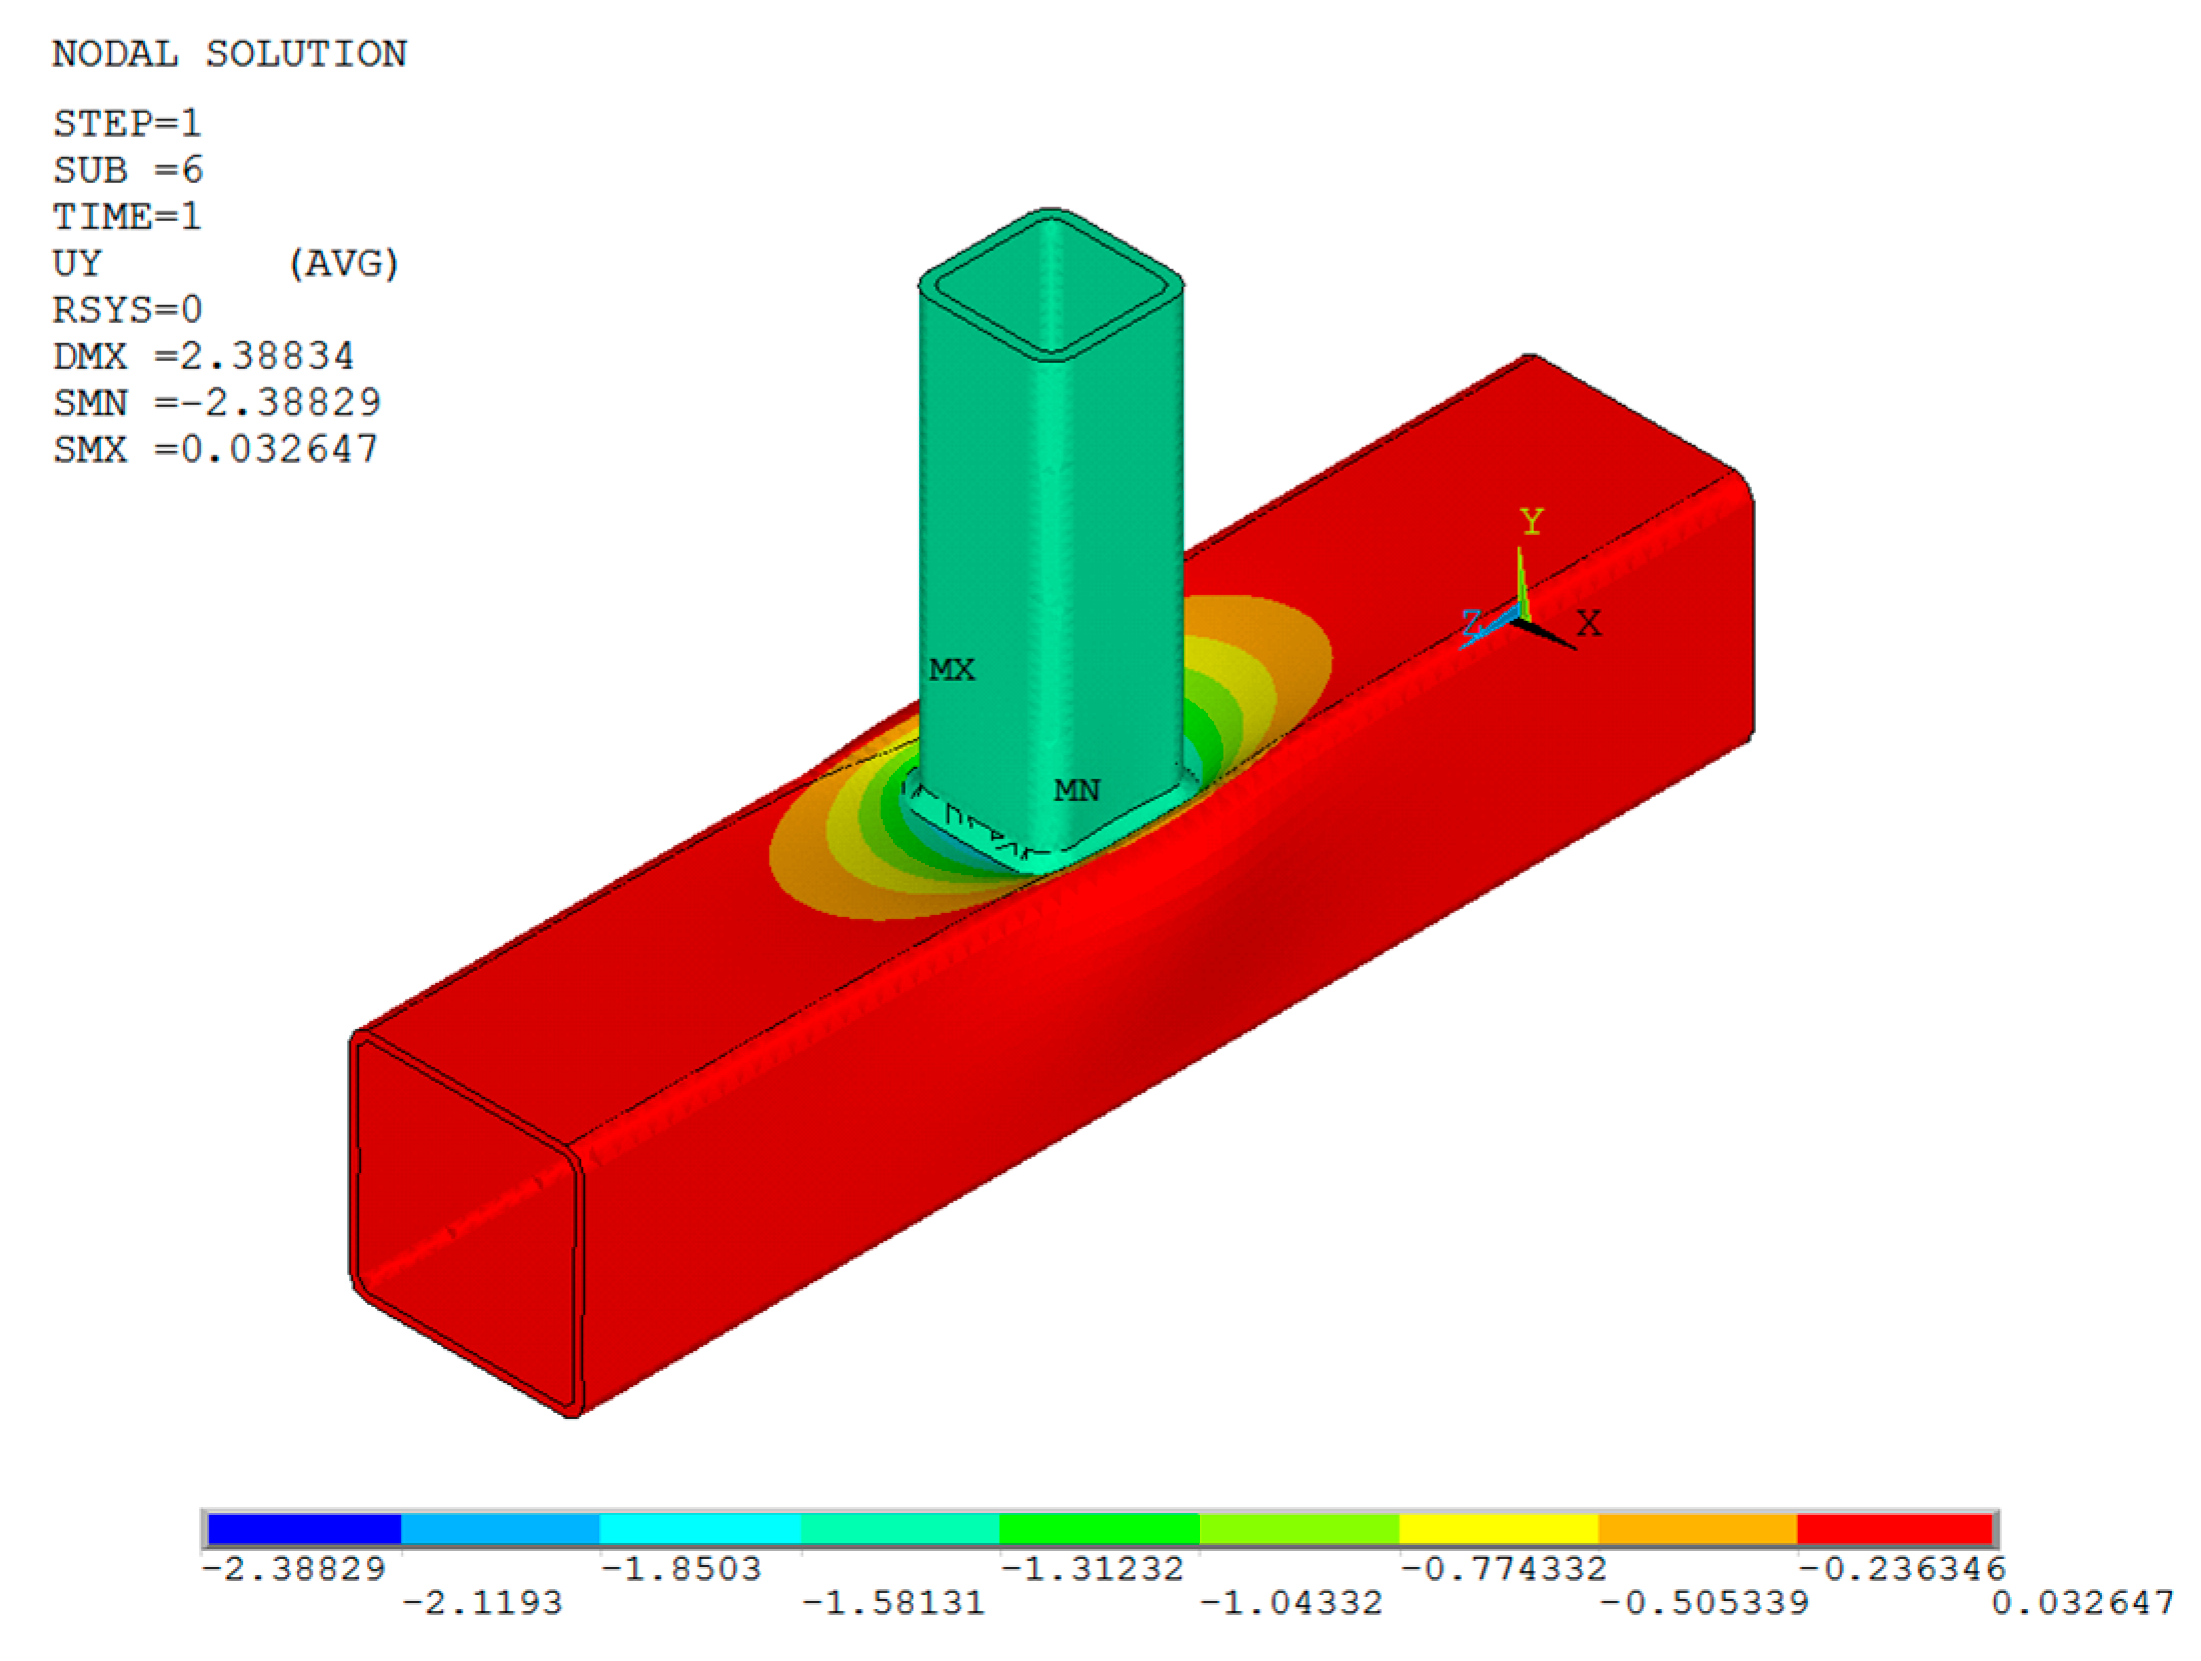
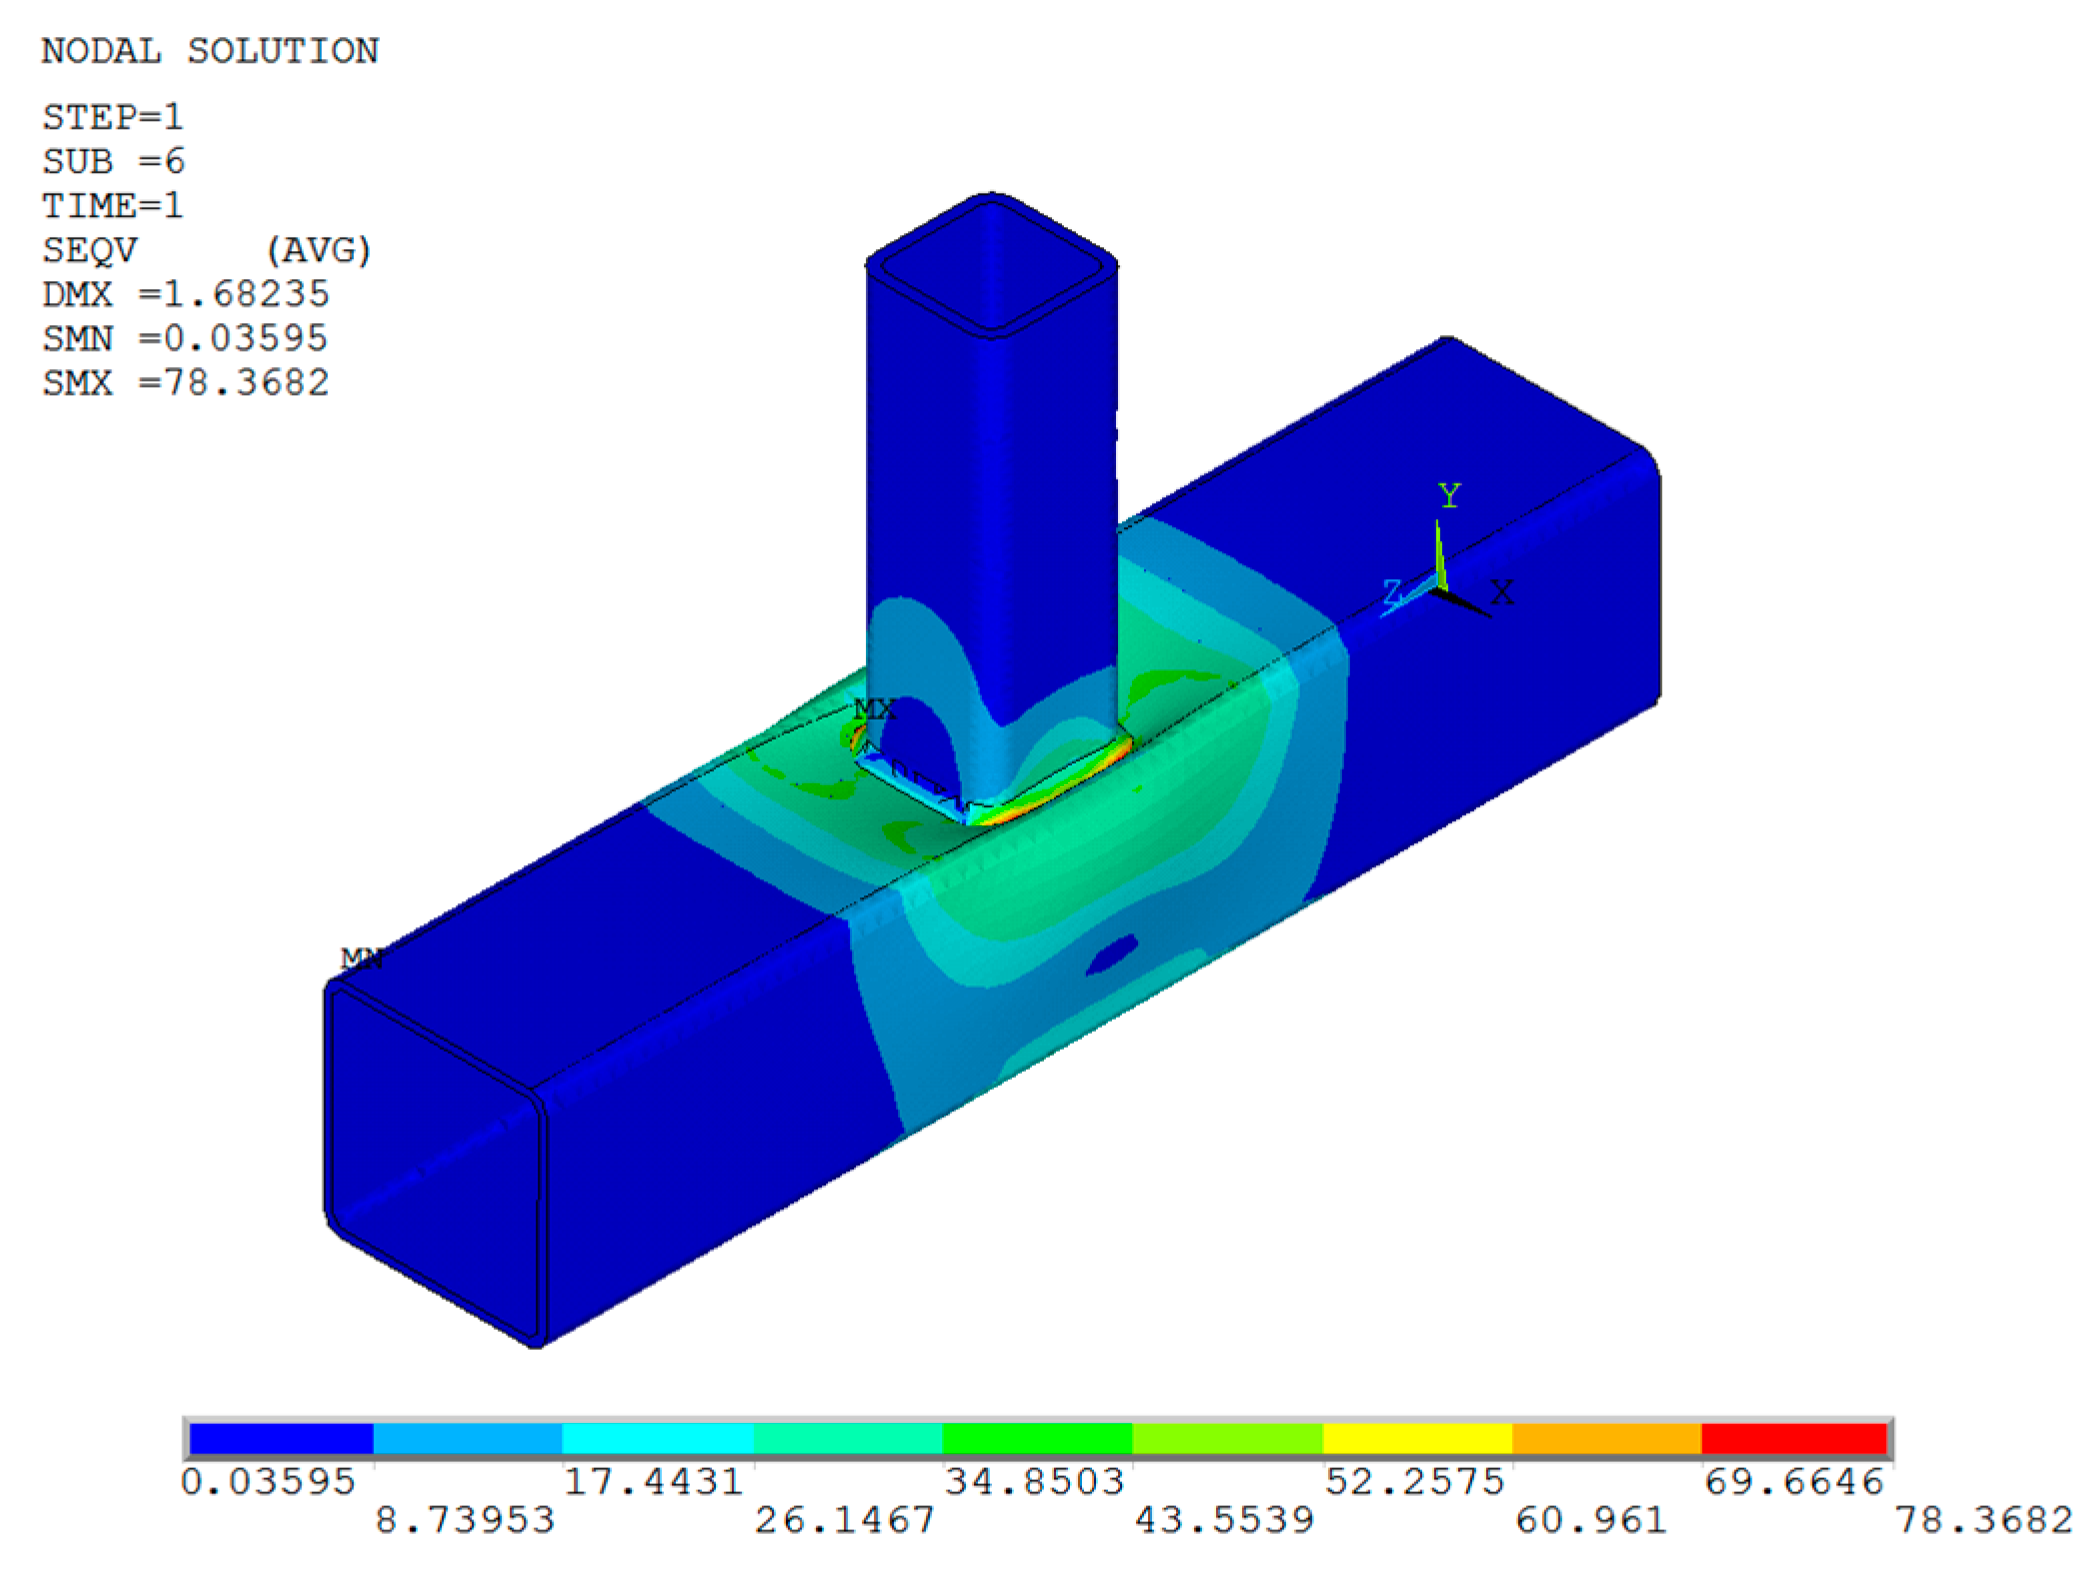
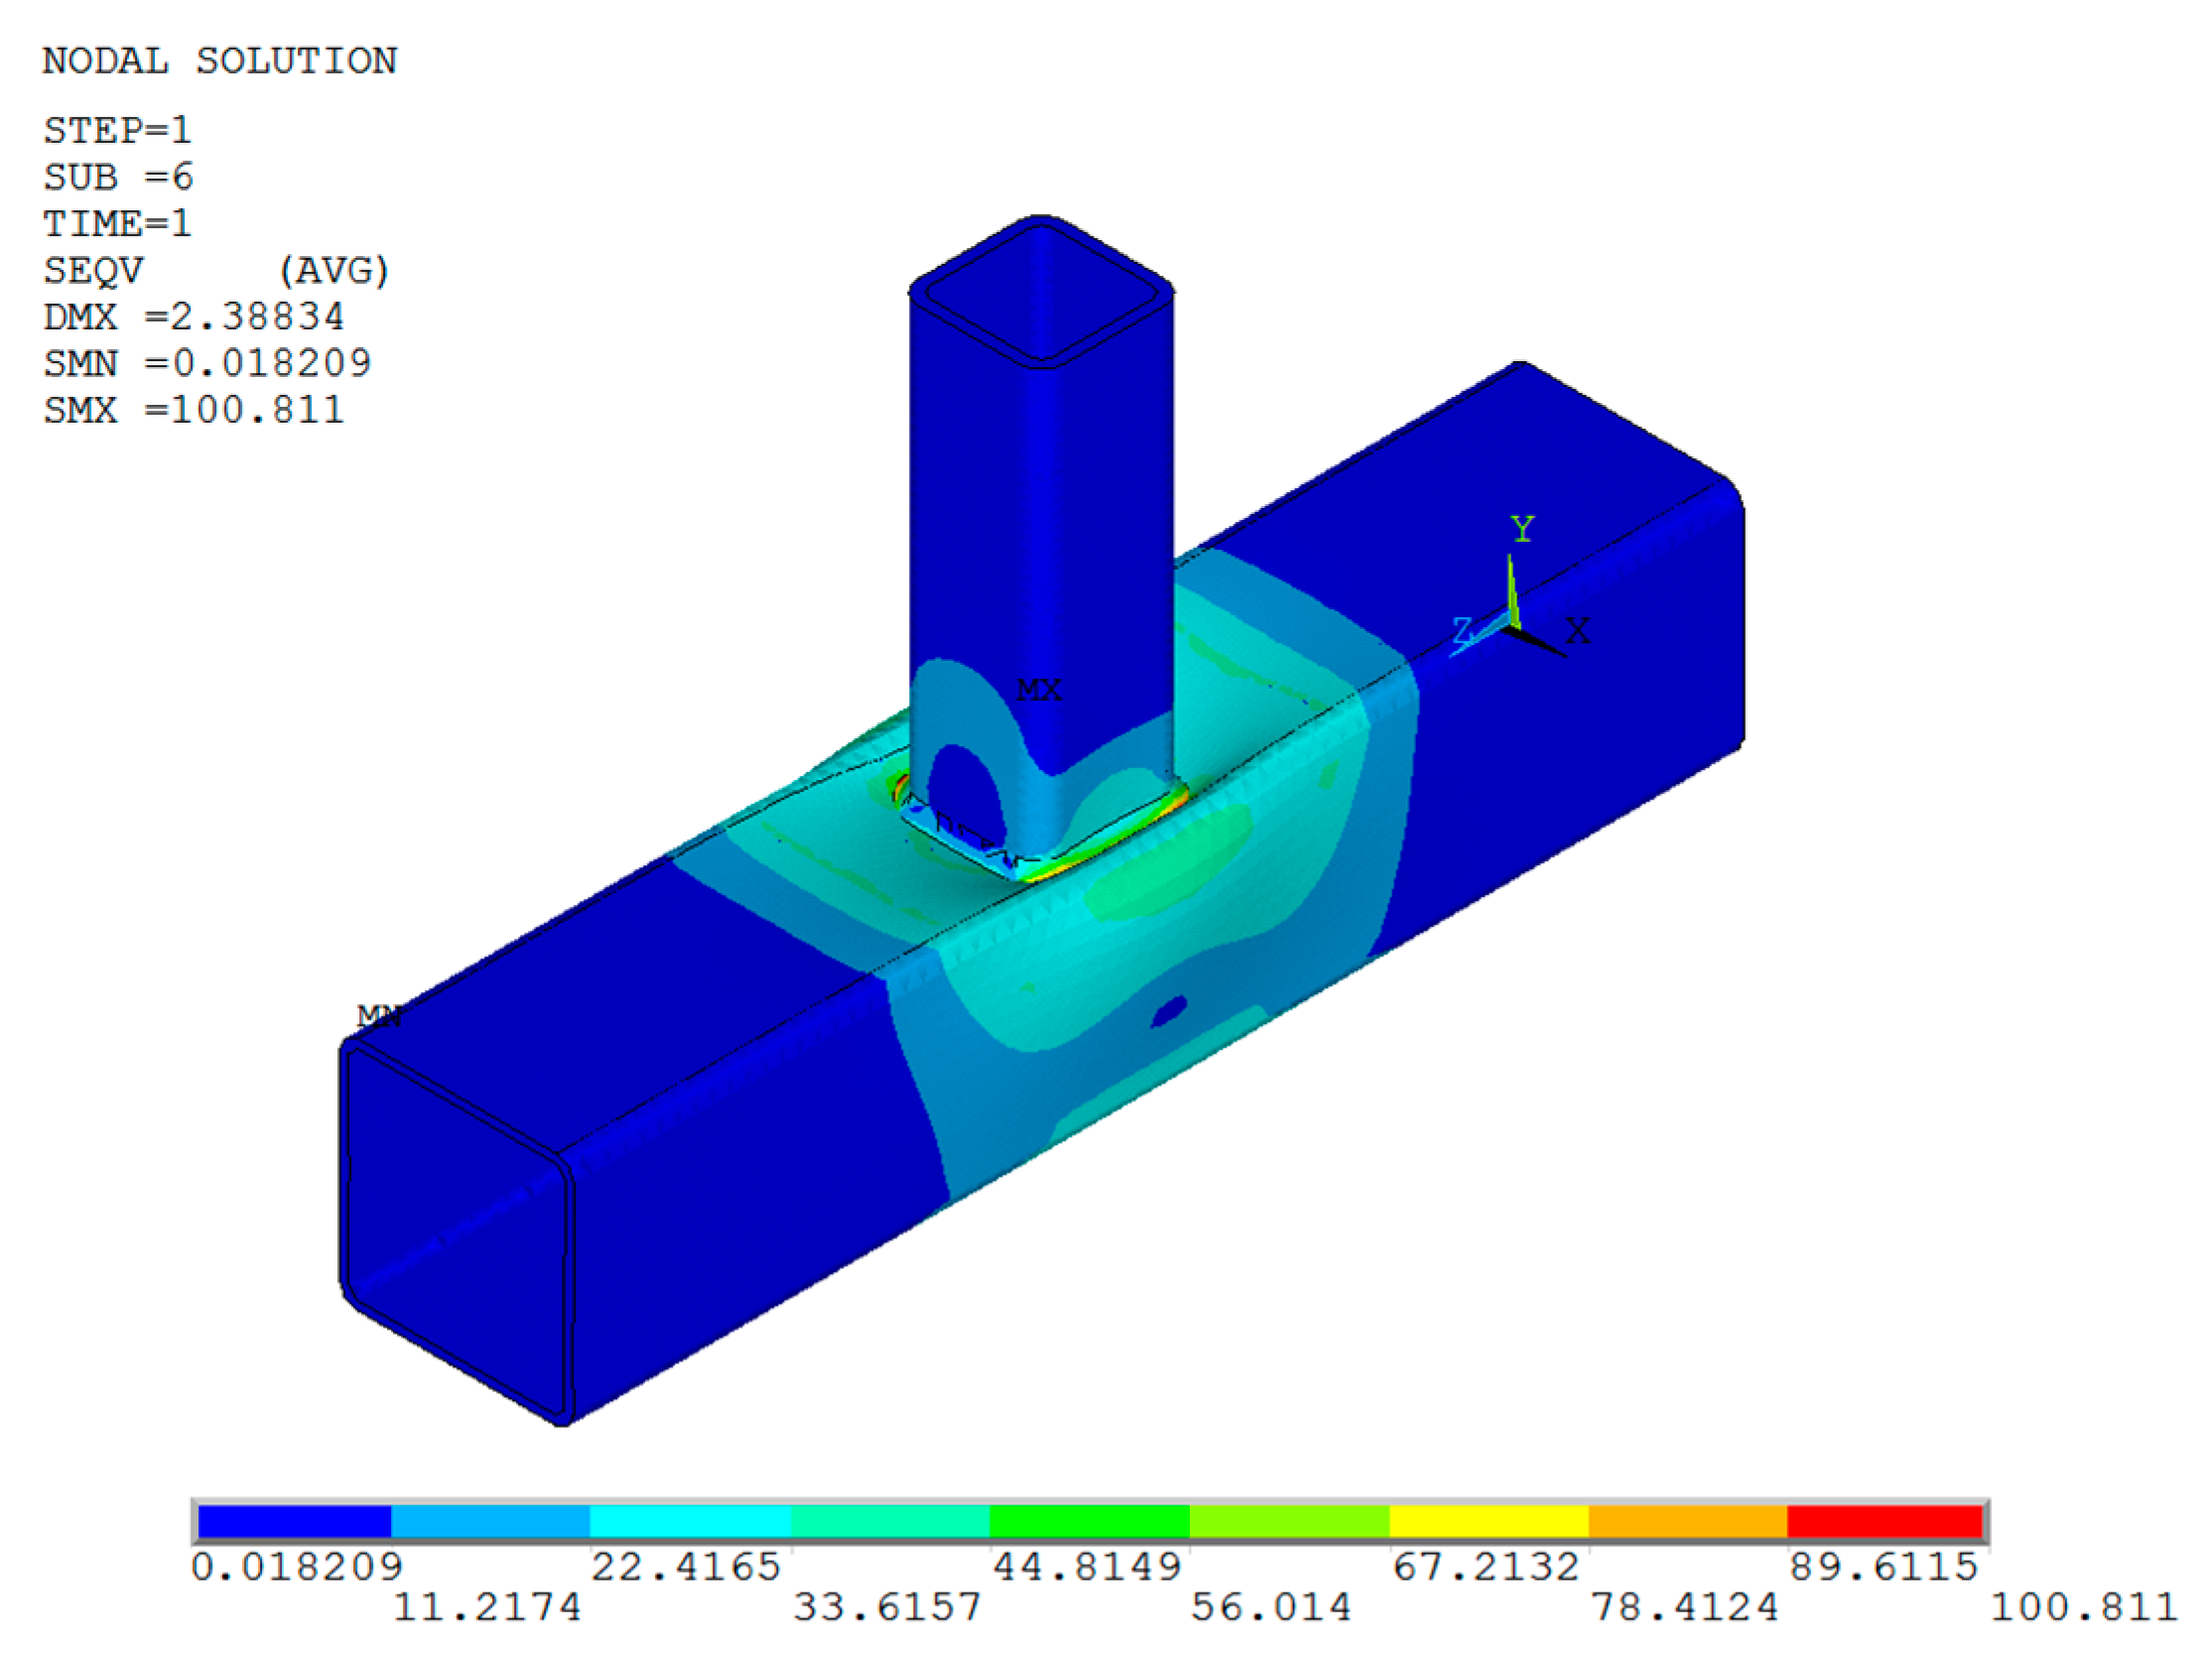
It is clear from
Figure 3 and
Figure 4 that the major local plasticization of the chord element’s flange surface caused the greatest distortion to occur close to the weld, at the point where the brace and chord meet. The maximum and minimum local deformations in the direction of the “T” axis were, respectively, 0.588 and 0.688 mm.
The resulting value of the local deformation, when the seams are taken into account in the analytical model, was 1.682 mm, which is substantially closer to the experimentally determined deformation of 2.400 mm. When comparing the connection’s bearing capacity to the bearing capacity calculated using the nominal value of the yield strength, the difference was 2.16. This discrepancy results from the theoretical presumption of rigid-plastic behavior of the material at the connection point in the analytical model where the influence of the seams was taken into account. Nonetheless, these results demonstrate that there is a strong correlation between the link and its elastic–plastic nature.
For a load equivalent to the bearing capacity found by experimentation, the numerically computed local deformation was 2.388 mm, which is in good agreement with the deformation recorded experimentally.
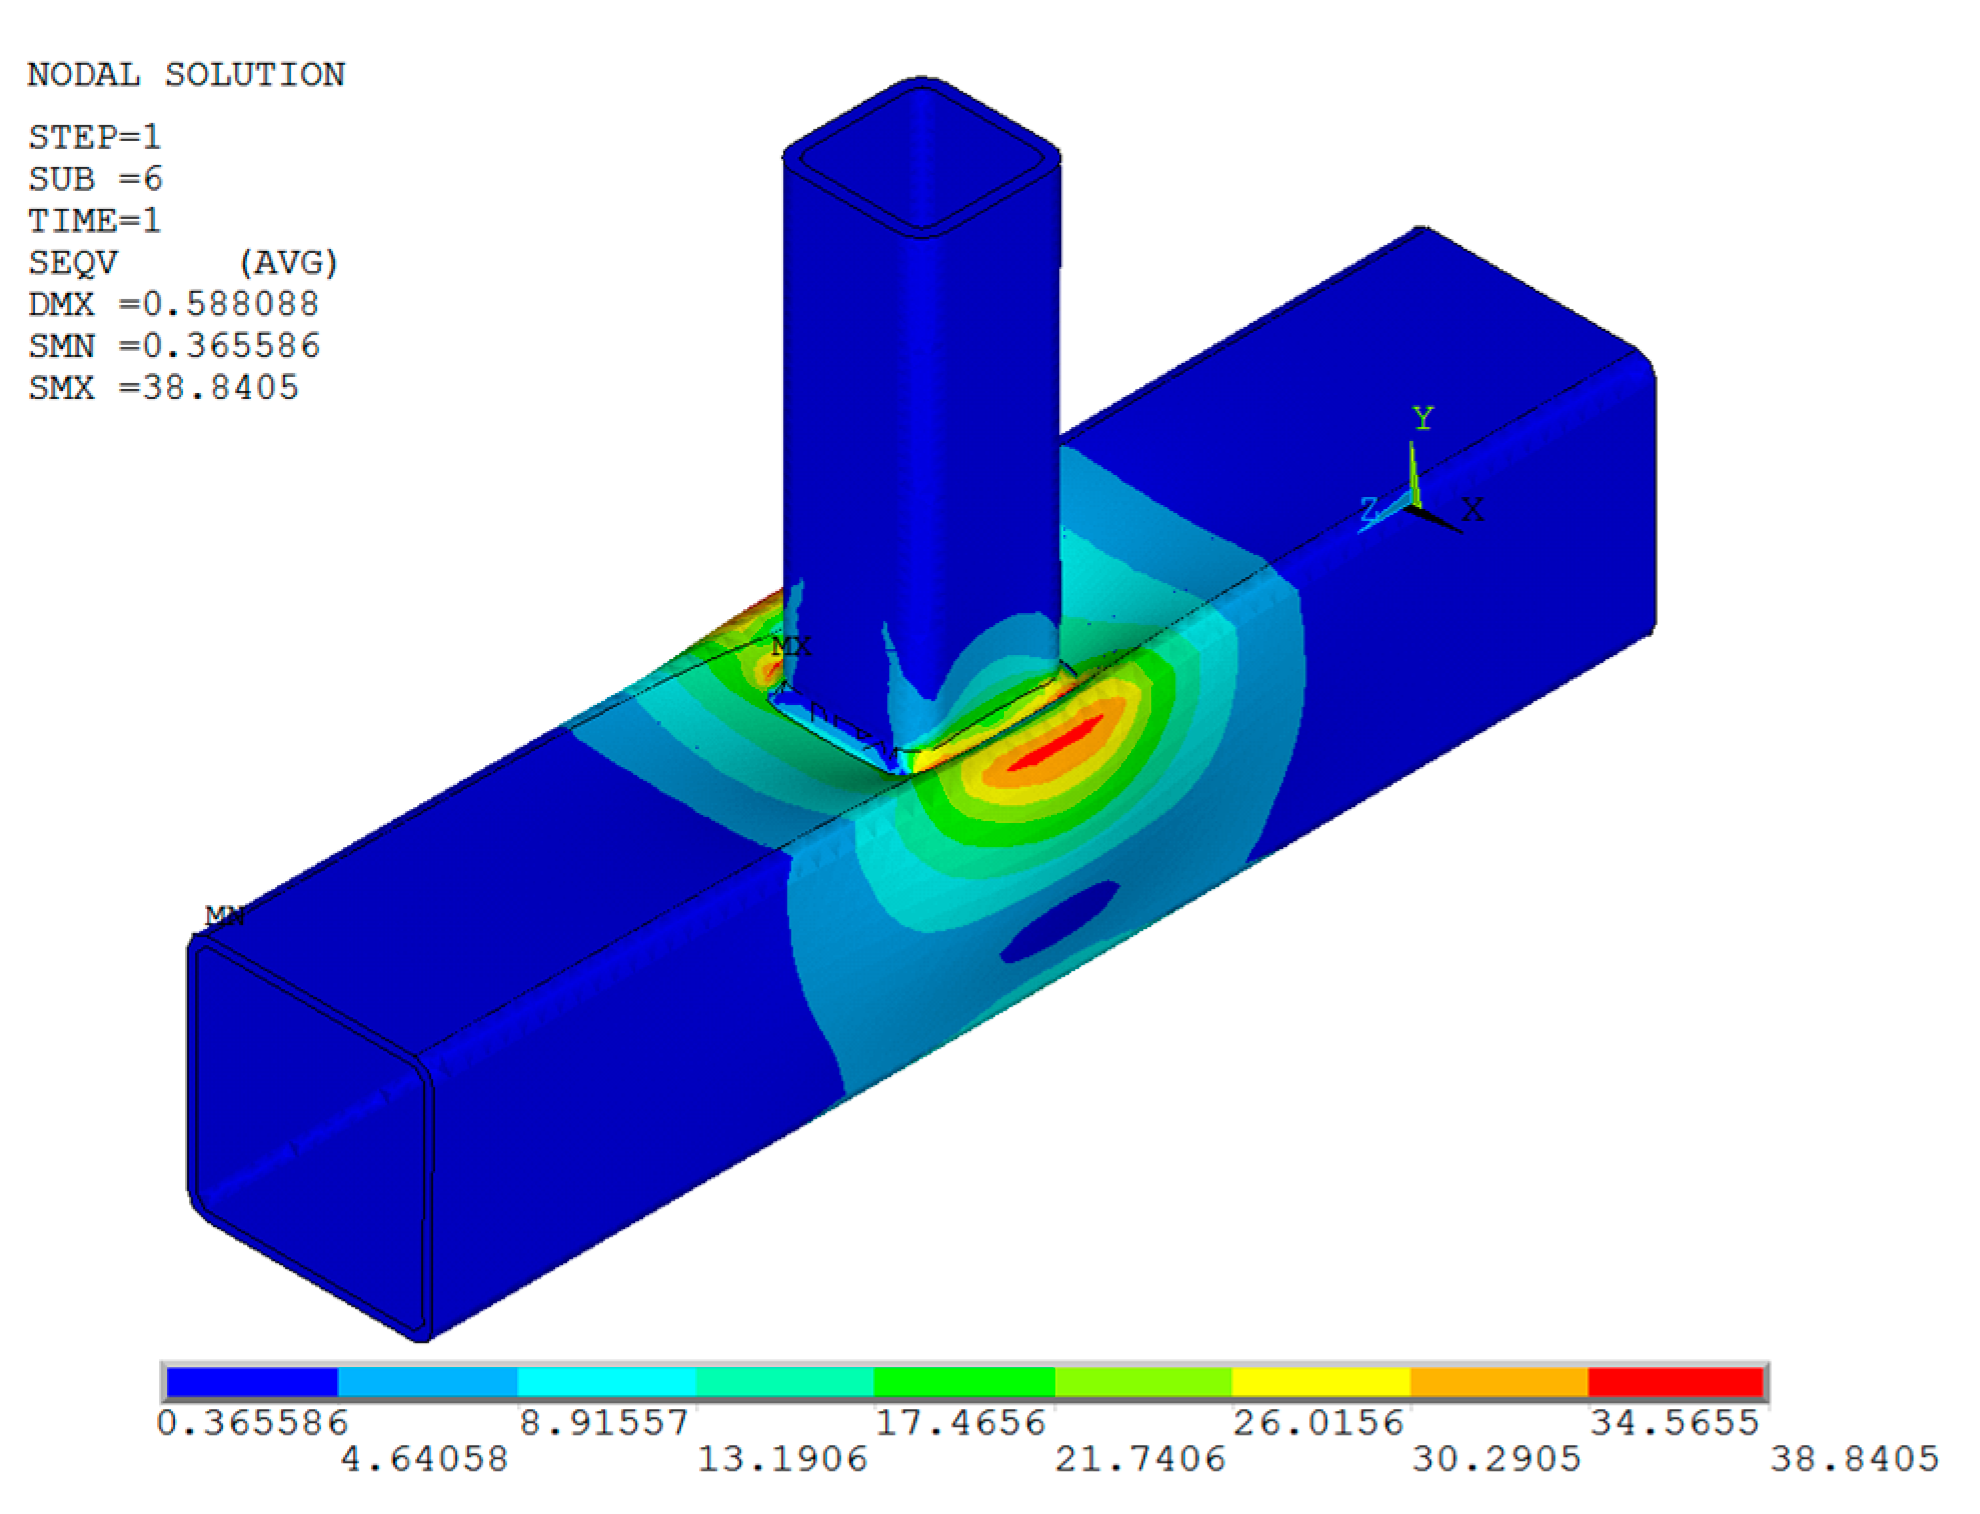
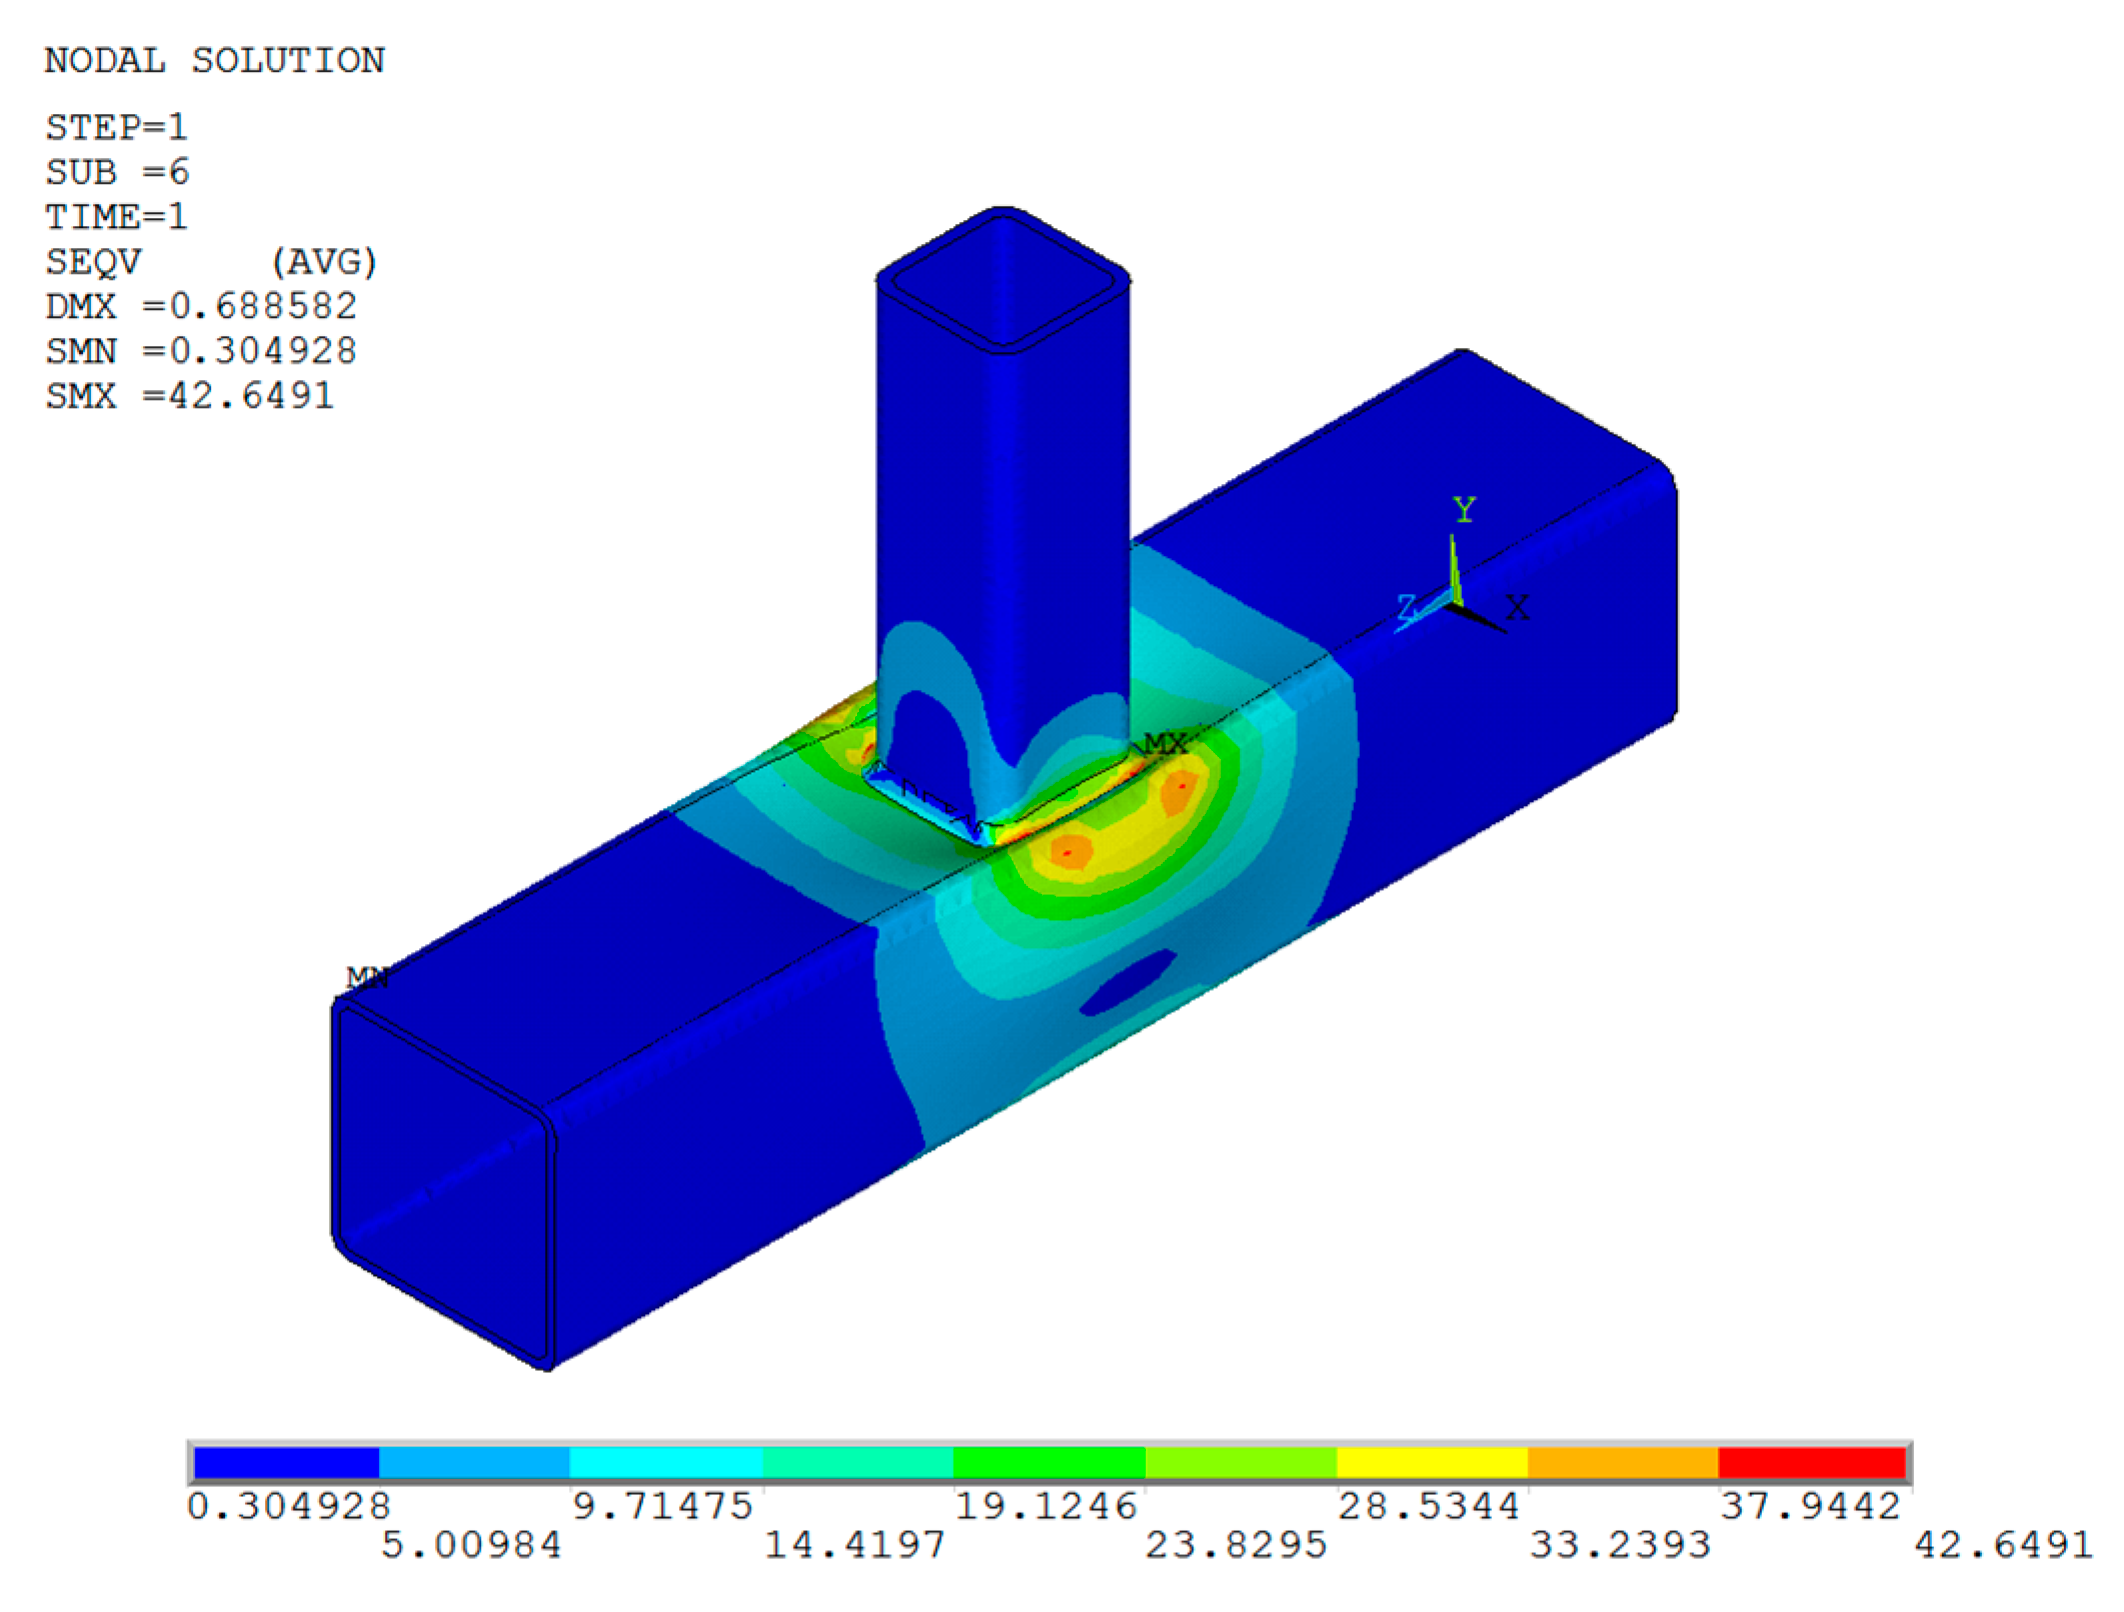
Figure 7,
Figure 8,
Figure 9 and
Figure 10 show characteristic depictions of this stress together with the matching numerical value legend. The yield strength and the maximum equivalent stress in the base material at the connecting zone were generally comparable. The sudden peaks on the stress diagram indicate that there was a severely non-uniform stress distribution in the field of equivalent stresses at fillet welds and in certain zones on the side vertical walls of the chord element.
In certain places, the maximum equivalent stress at the welds even exceeded the weld material’s yield strength. The tension on the side walls of the chord element approached the material’s ultimate strength. Based on these data, it can be concluded that the connection model under investigation reached a breaking point—a situation that did not arise during the connection’s experimental study. It is noteworthy that the impact of these occurrences [
31] was strictly confined, encompassing a relatively tiny area. Furthermore, at these high stress levels, local plasticization took place, changing the modulus of elasticity to a much lower value and leading to noticeably lower stresses. Due to the failure corresponding to the local deformation requirement occurring at a load level insufficient to produce high stress levels over broader areas, this occurrence had a limited character.
In the non-linear numerical analysis, the experimentally determined values of the bearing capacity corresponding to the limit displacement, and the results of the bearing capacities and deformations determined in accordance with EC 3 calculation processes were compared. The maximum local deformation ascertained through the non-linear numerical analysis and the maximum deformation ascertained through experimentation were found to be similar and in the range of 1.03–1.5. Using the non-linear numerical analysis, which errs on the side of caution, larger values of local deformation were achieved in all studied scenarios. The experimentally obtained values showed the best fit with the non-linear numerical analysis results, with a divergence of only 3%.
It is significant to notice that local plasticization of the chord element’s flange was the cause of the experimentally evaluated connections’ bearing capacity exhaustion. An ideal rigid-plastic behavior of the material at the connection site was assumed for the theoretical analysis of the behavior of these connections. The connection showed clear elastic deformation and elastic–plastic behaviors, according to the experimental tests carried out in this work. The implementation of the plasticization line model was necessary for the theoretical concerns. The values that result from using this model were conservative and show the upper bound of the solution. It is feasible to examine several plastic fracture line mechanisms in order to obtain the lowest value, but the values obtained in this way would be non-conservative.
Around the node connection shown in
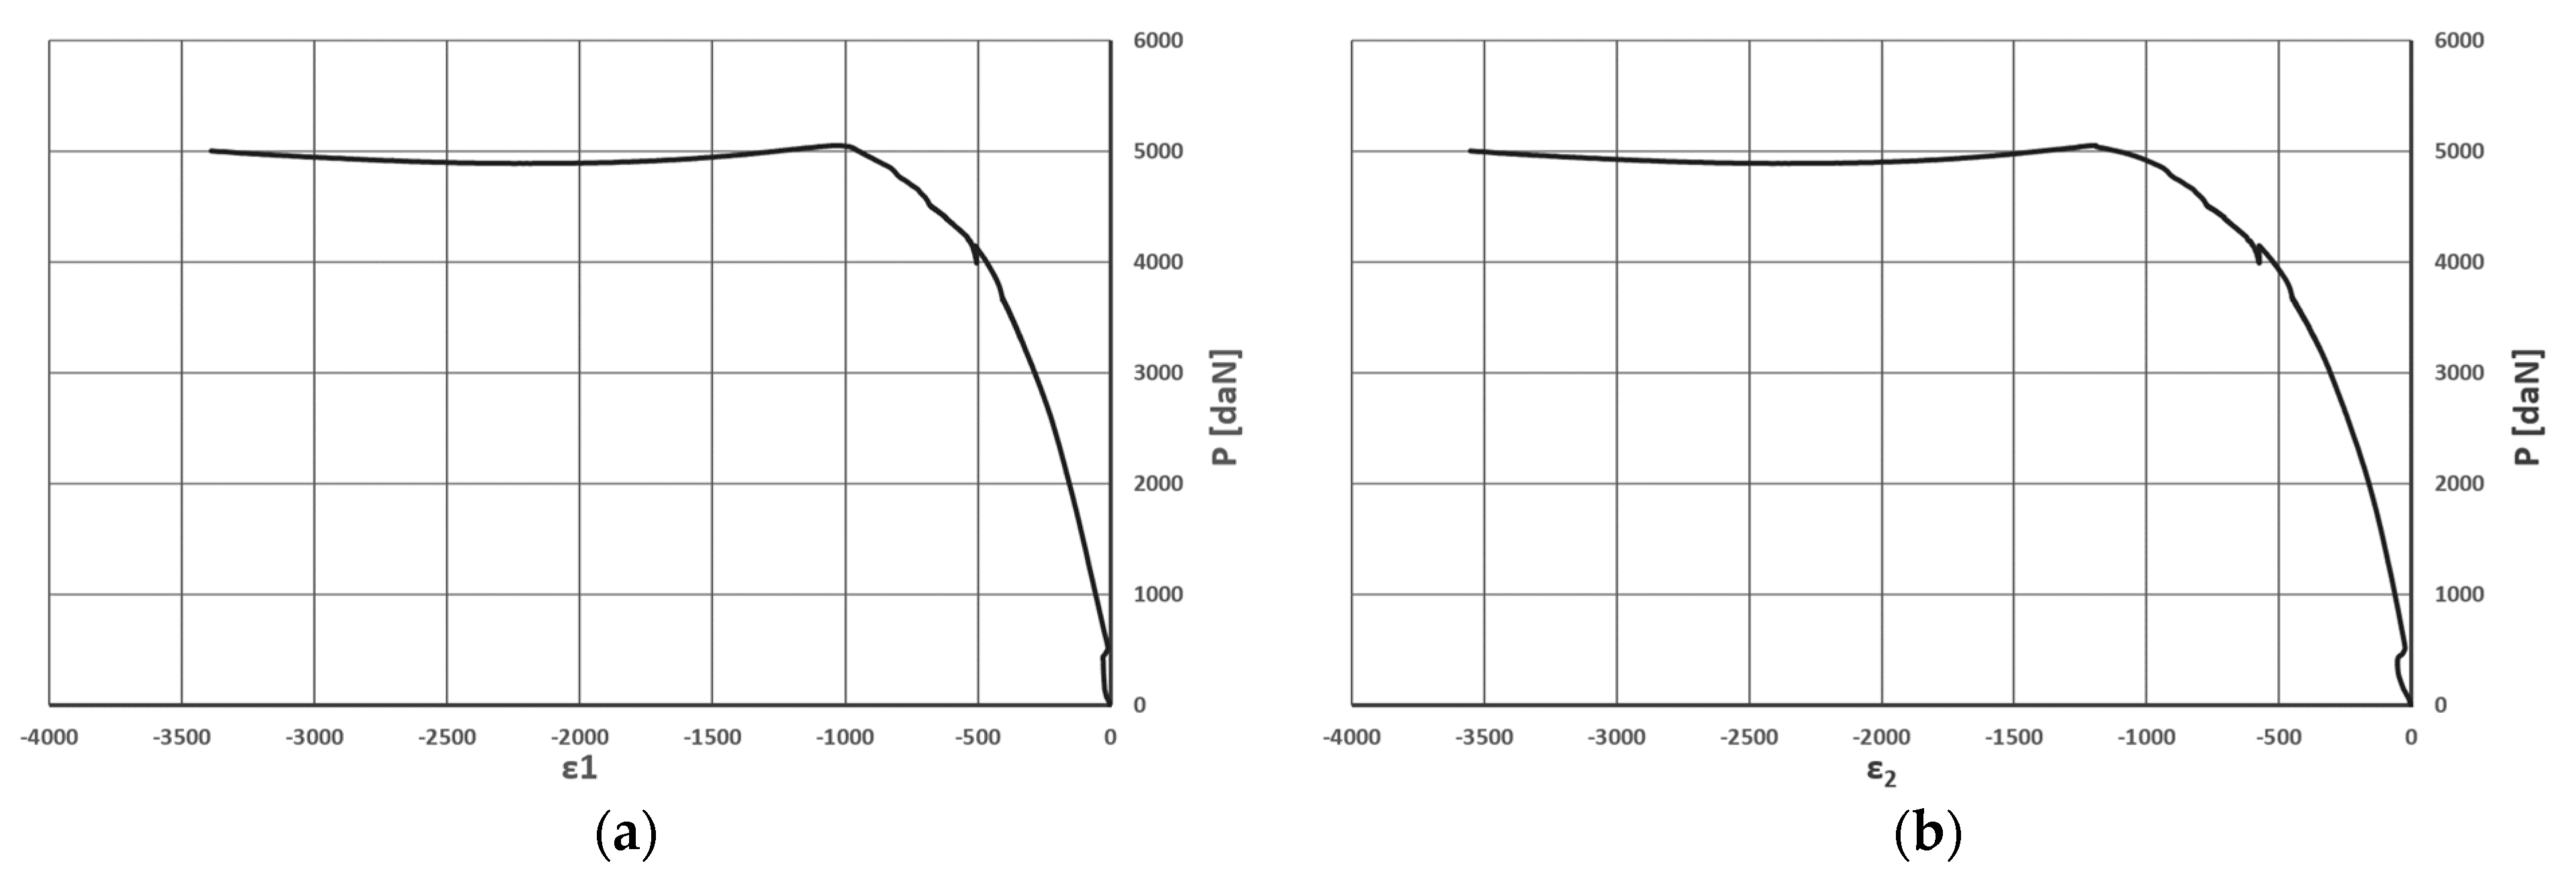
Figure 1, behavioral investigations of this connection in the elastic area for a flat state of stress were carried out. The local strain was observed with measurement tape rosettes (angles = 0°, +120°, and −120°).
Figure 11 displays the values of the principal strains that were measured. According to EC 3, the figure depicts an incredibly linear condition of stress–strain in an elastic area, which perfectly matches the experimentally determined limit values of forces under limited element deformation.
Figure 11 and
Table 2 clearly show that the values obtained for the limit value of the force at the connecting point perfectly coincide with the numerical model results.
Analyzing the failure mechanism, it was observed that the load capacity of the experimentally analyzed connections was exhausted due to local plasticization of the chord flange, which is entirely consistent with the calculating techniques and procedures described in this study.
The assumption behind analytical models analyzing these connections’ behavior is that the connecting node exhibits optimal rigid-plastic material behaviors. But, as the study’s experimental and numerical results showed, the connection showed notable elastic deformation and elastic–plastic behaviors. This suggests that the stress condition of the elements is connected to a reserve in the bearing capacity. However, lowering the local deformations is required to raise the connection’s bearing capacity. Local deformations and stresses at the connection zone are highly complex and non-linear. Certain restrictions on the connection geometry, such as the ratio of connection element sizes, must be implemented in order to limit local deformations at the connection and avoid a decrease in the rotation/deformation capacity. The main motivation behind this is to meet the requirements of the serviceability limit state.
At local deformations of around 1.0% of the element width, the chord element exhibits elastic local deformation or elastic connection behavior. Using the EC 3 rule and nominal yield strain, the connection’s ultimate bearing capacity was determined. This value was equivalent to a local chord deformation equal to 0.25% of the chord width.
The values of the ultimate bearing capacity that were found experimentally were 2.32 and 2.03 times greater than the value that was determined using the nominal yield strength and the experimentally determined yield strength in accordance with EC 3. This number decreased to 1.23 when seam effects were taken into account. This fact highlights the need to update the guidelines for connecting hollow section profiles in design. Taking into account the weld effects, the experimentally obtained value of the ultimate bearing capacity was approximately 25% higher than the calculated result.
Because of membrane effects and the material’s post-elastic rigidity following plastic deformations, the estimated ultimate bearing capacities of the experimentally studied connections were noticeably conservative.
Fillet welds provide adequate bearing capacity, which allows them to withstand non-uniform stress distributions and deformations, as well as adequate deformation ability. Welds’ computed bearing capacity is greater than that of the element cross-section.
The impact of the side webs’ plastification on the connection’s load-bearing capacity was minimal for both types of connections that were experimentally studied. In limited zones of connection deformation, cracks did not manifest visually.
The non-linear FEM analysis revealed good agreement with the experimental results for the studied forms of “T” connections.
5. Conclusions
This paper shows the results of the research conducted on “T” type connections between cold-formed square hollow-section steel profiles. The experimental and numerical investigations provided the basis for the analysis of the behavior of the studied connections. The local deformation and the load-bearing capacity were determined experimentally and numerically and compared to the analytical solutions obtained according to the EC 3 provisions.
The results have confirmed that the exhaustion of bearing capacity of T connections occurs due to the local plastification of the chord flange, which is in accordance with the calculation techniques and procedures described in this study. Furthermore, it was confirmed that the introduced assumption that this type of connection shows elastic–plastic material behaviors is correct, which implies that the stress state shows a certain bearing capacity reserve. This can have an impact on the optimal and rational design of such connections. The observed membrane effects and the post-elastic rigidity of the material after plastic deformations allow the possibility of reducing the local deformation effect and avoiding a reduction in the rotation/deformation capacity by optimizing the connection geometry parameters (for example, by choosing the optimal element size ratio). In this way, an increase in the bearing capacity of the connection can be achieved.
Compared to “Y”, “K”, “X”, and “N” connections, the experimentally determined value of the bearing capacity of “T” connections is lower [
20], which can be attributed to the significantly higher sensitivity to local deformations compared to the other types of connections. This also leads to the result that the geometry optimization plays an important role in achieving greater load bearing capacities and points out the necessity of giving more detailed recommendations regarding this aspect.
Another significant contribution of this work is the indication of the necessity of taking into account the influence of seams on the real behavior of such connections in analytical calculations. Namely, by taking into account the effect of seams on the bearing capacity, during the analytical calculation procedure, significantly higher and more accurate values can be obtained compared with the experimental and FEM analysis results. It should be pointed out that that fillet welds provide an adequate load-bearing capacity and can withstand uneven distributions of stress and deformation, as well as an adequate rotation capacity at moment connections or at small eccentricities of axial forces.
The conclusions point out the necessity of conducting an extensive parametric study in order to update and modify the current European regulations for the design of “T” connections for achieving more economical designs.

 ,
, 


