
Studying the Role of Visuospatial Attention in the Multi-Attribute Task Battery II

Abstract
:1. Introduction
1.1. Impact Statement
1.2. Theoretical Background
2. Materials and Methods
2.1. Participants
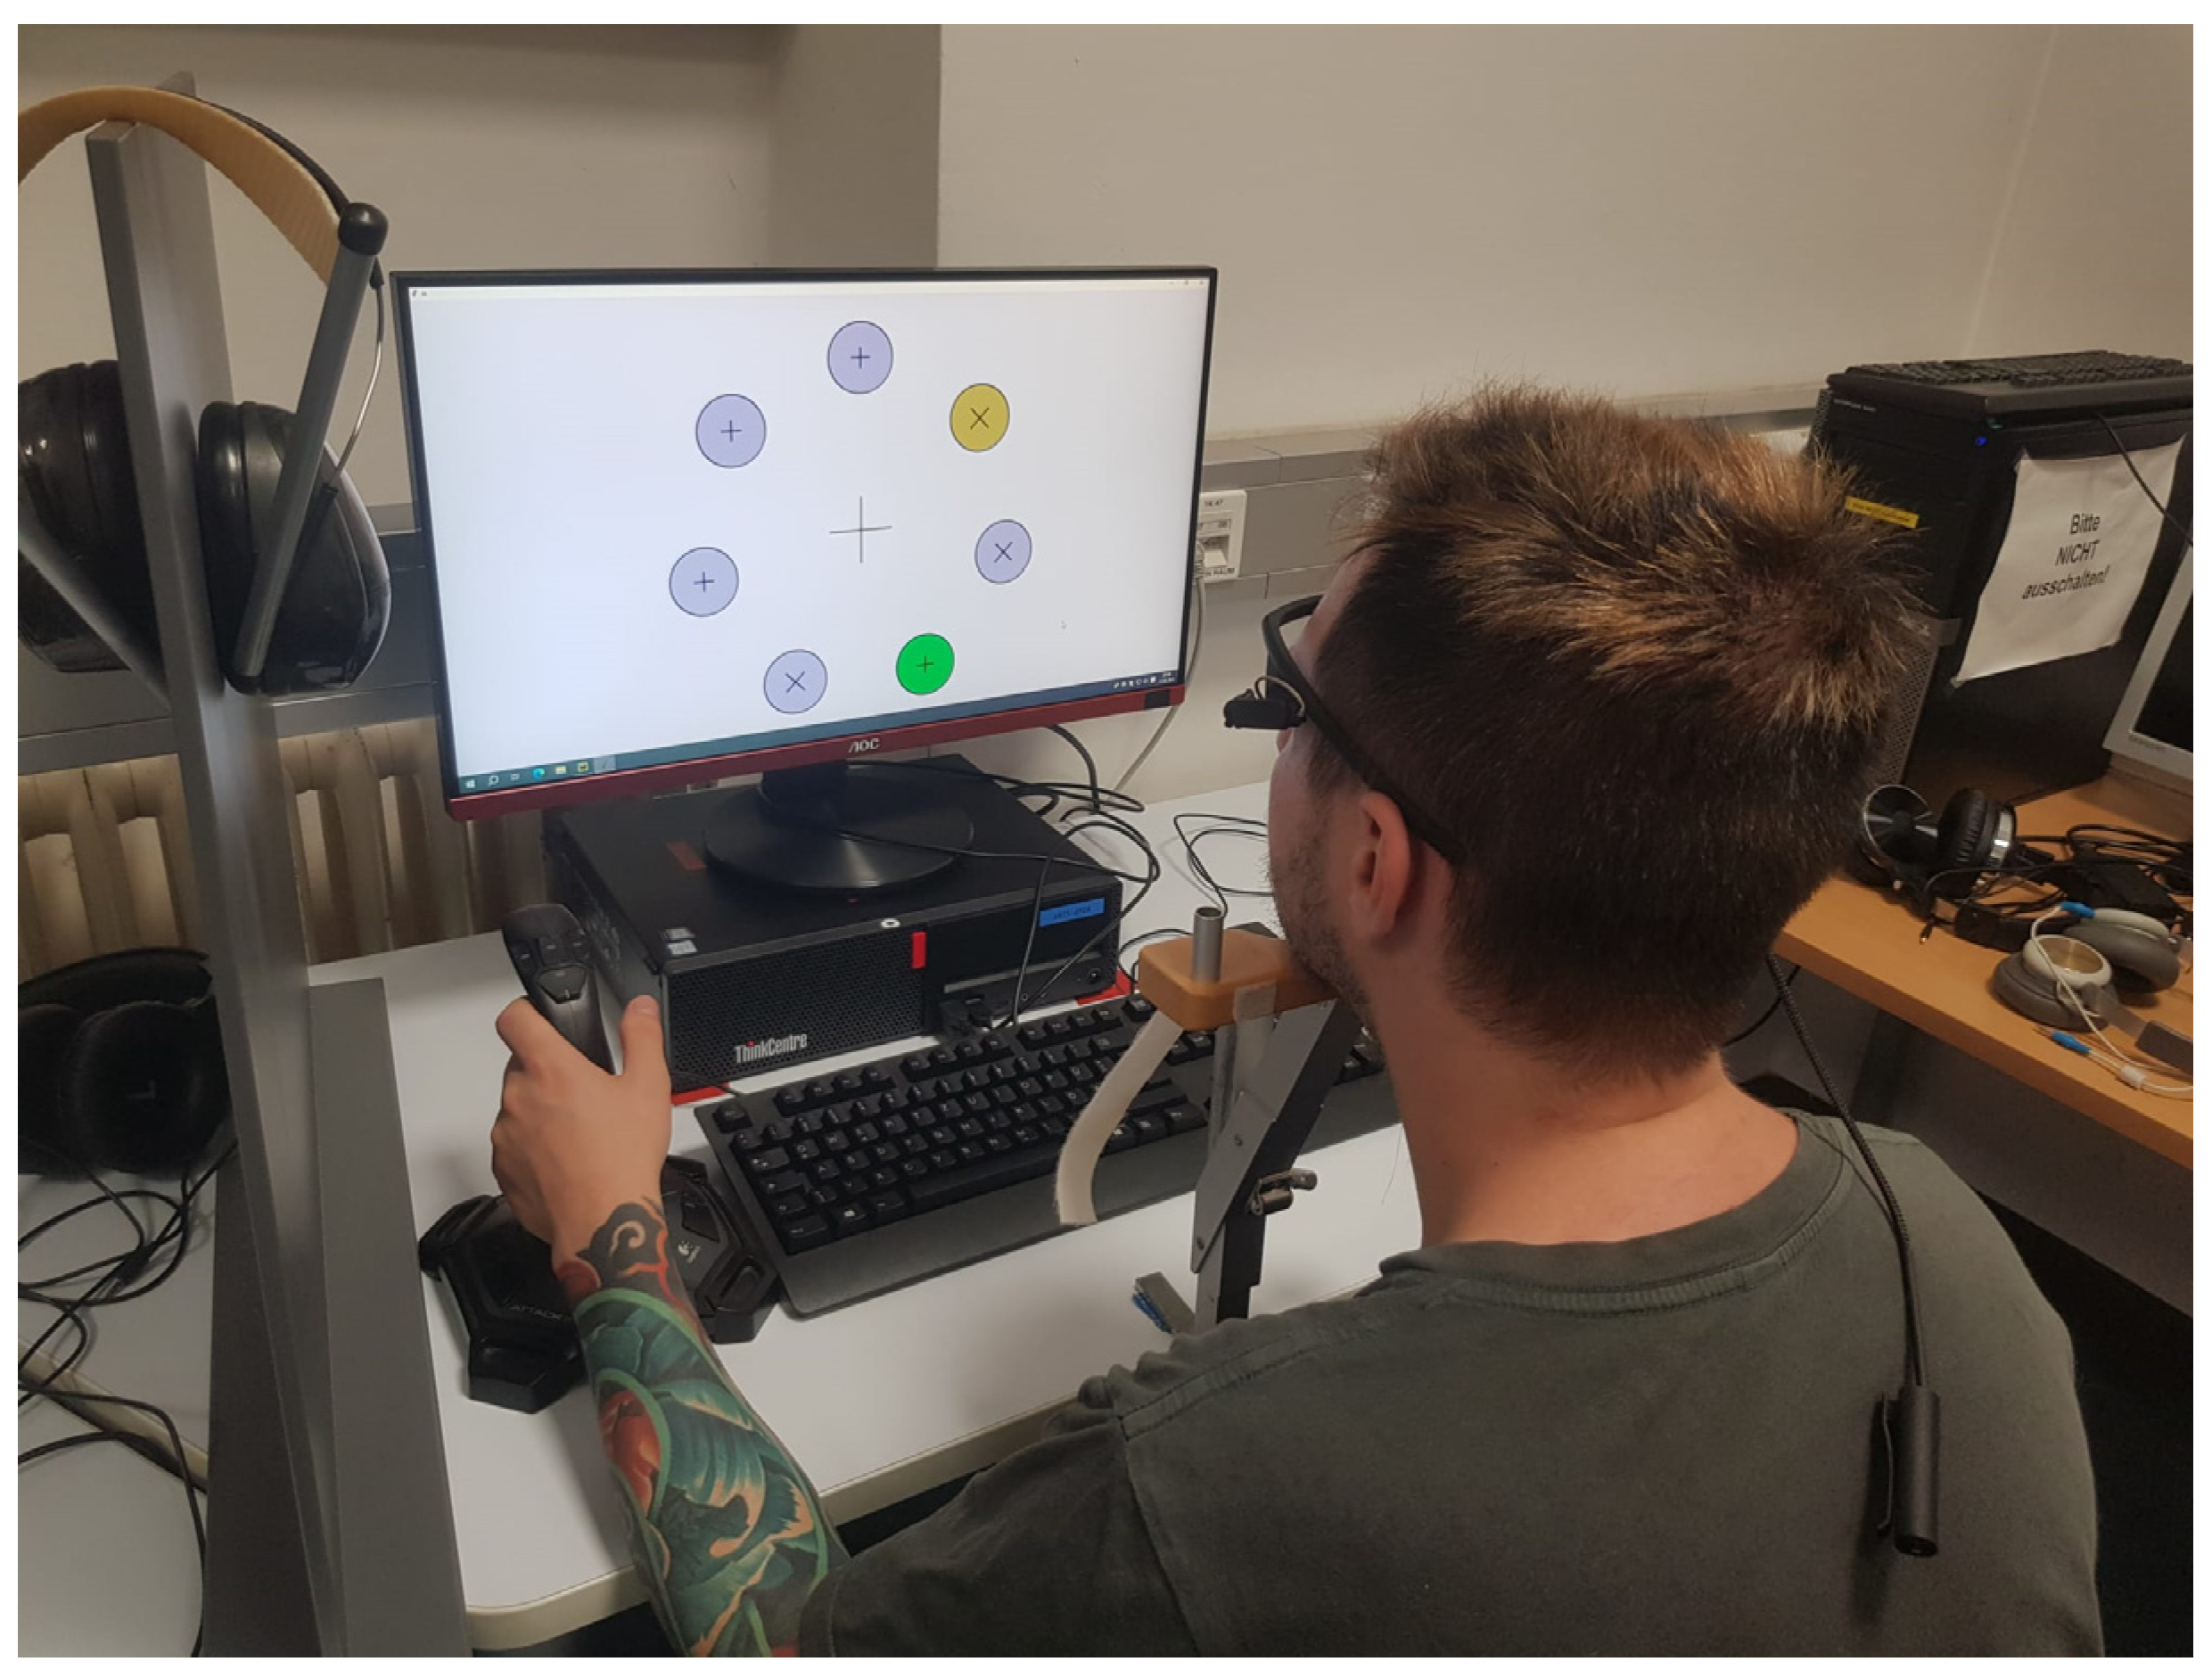
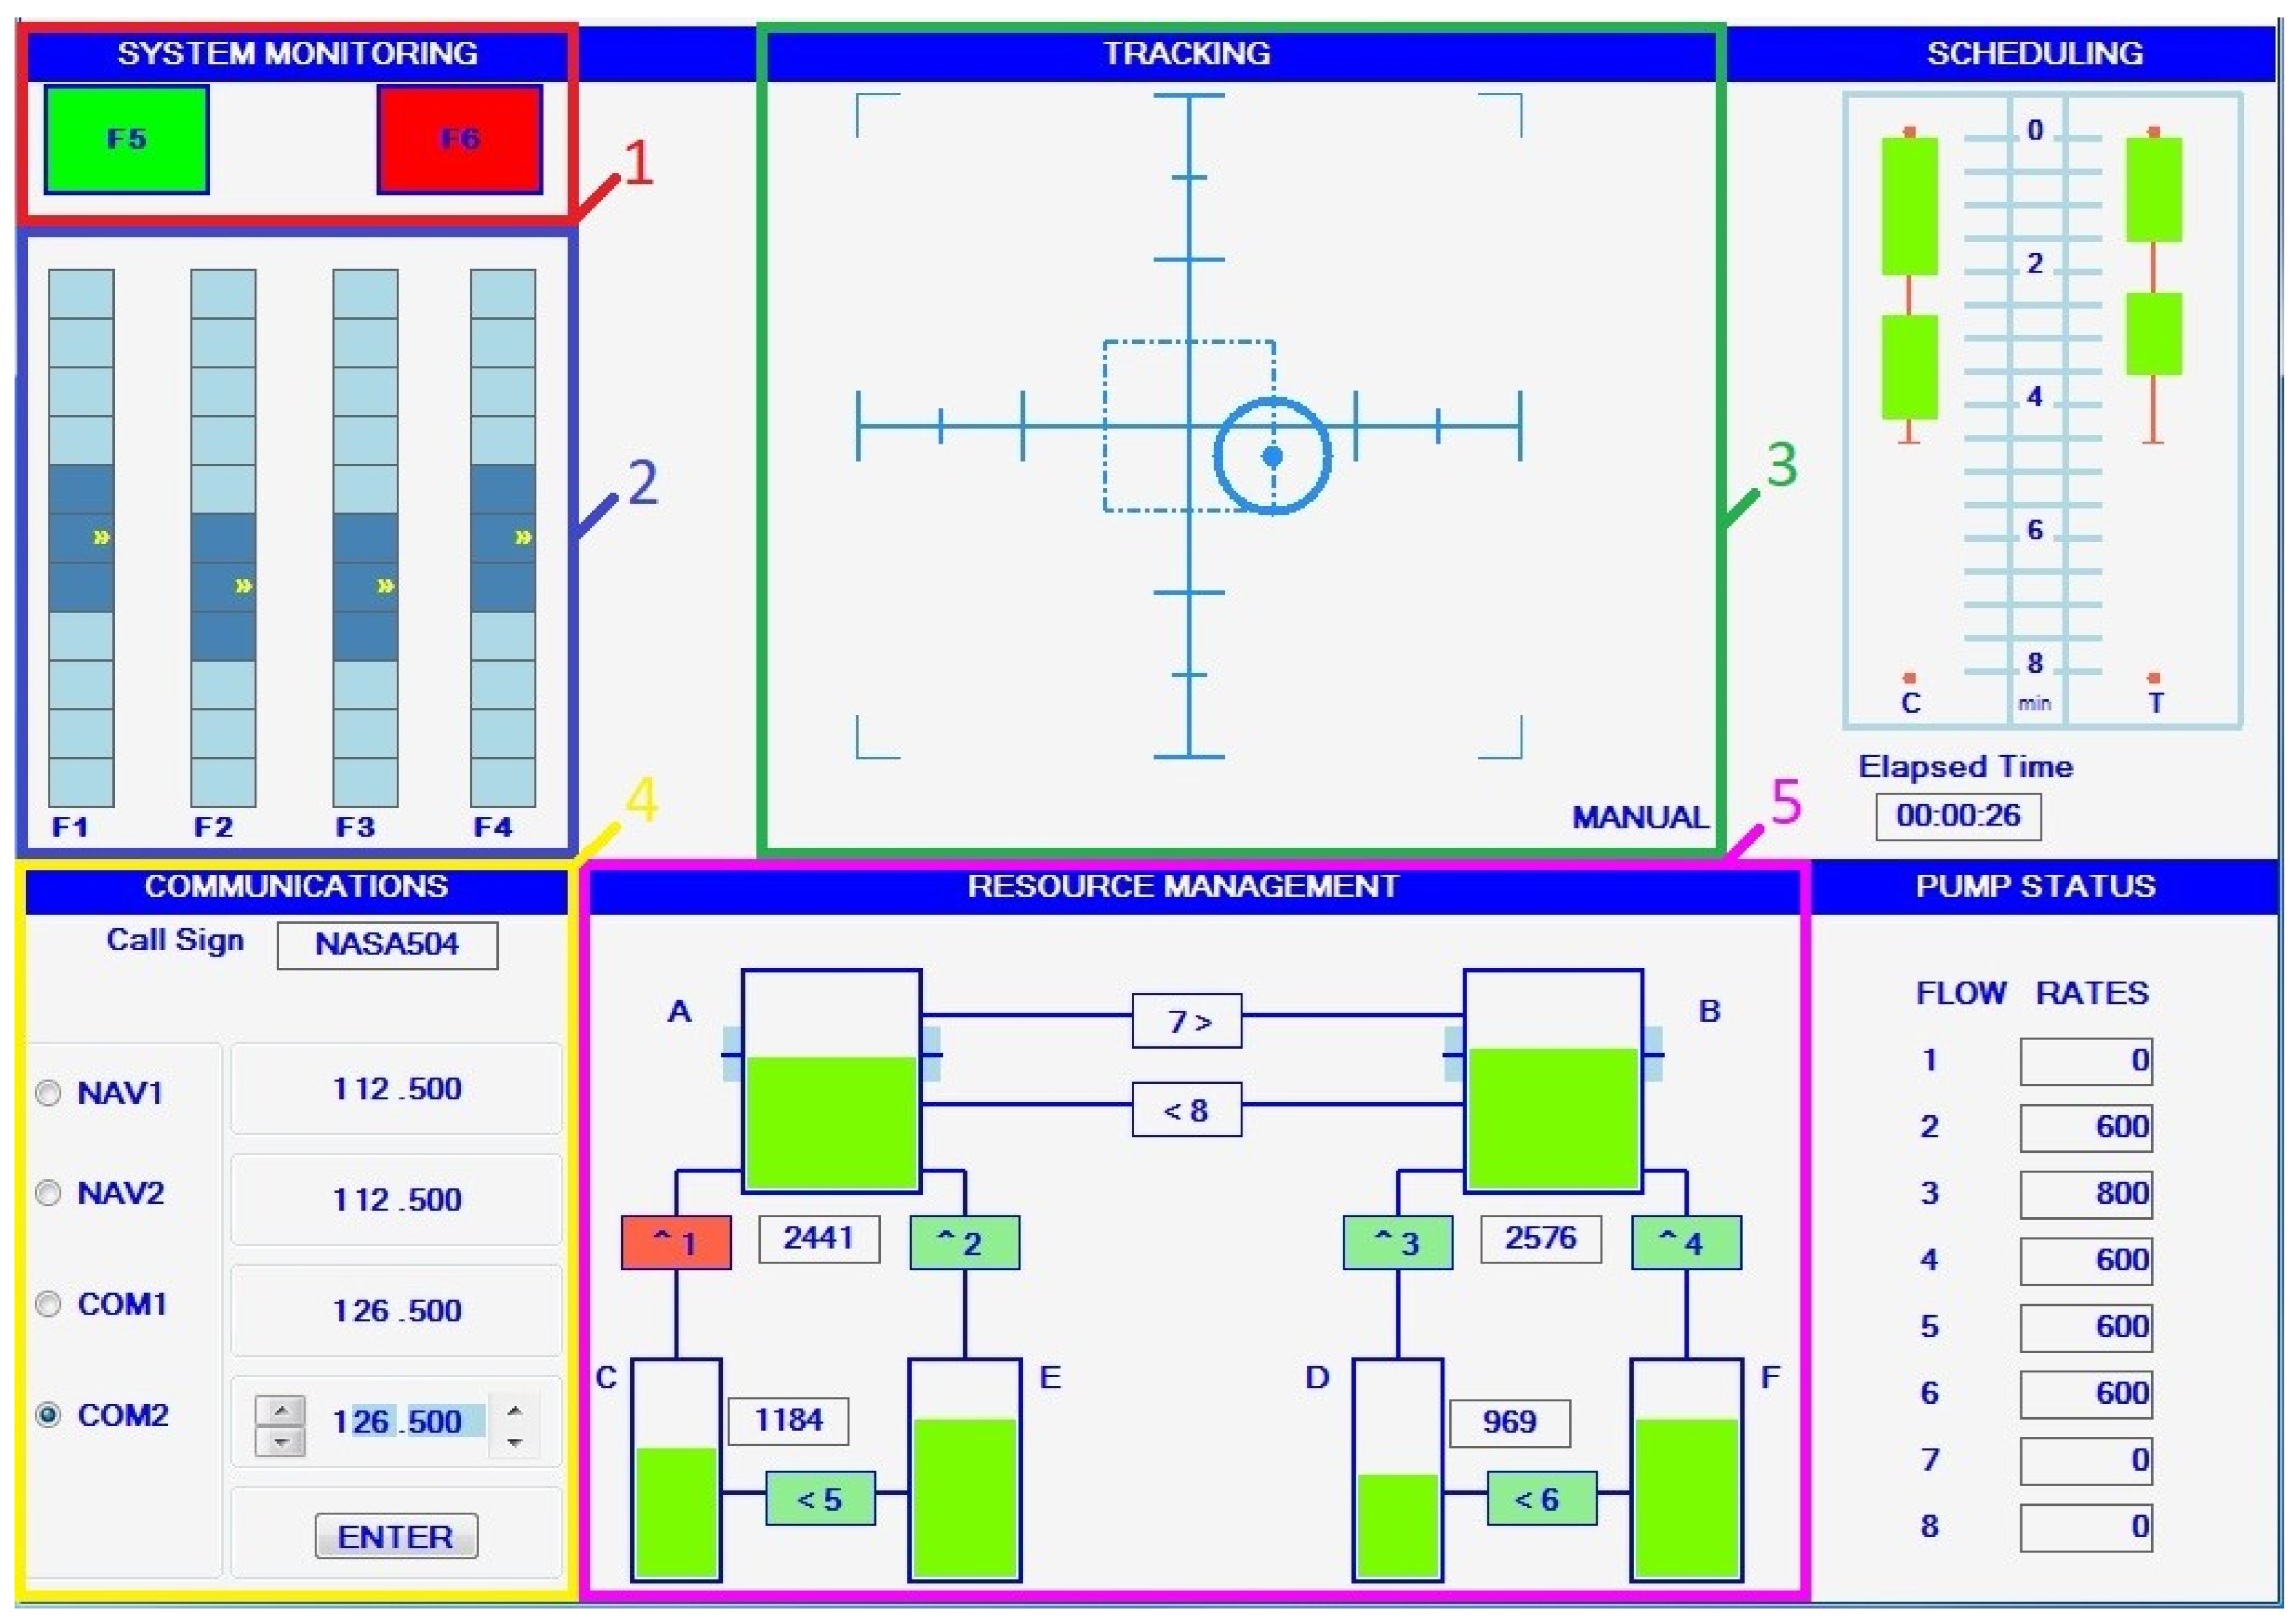
2.2. Apparatus
2.3. Eye-Tracking Data Processing
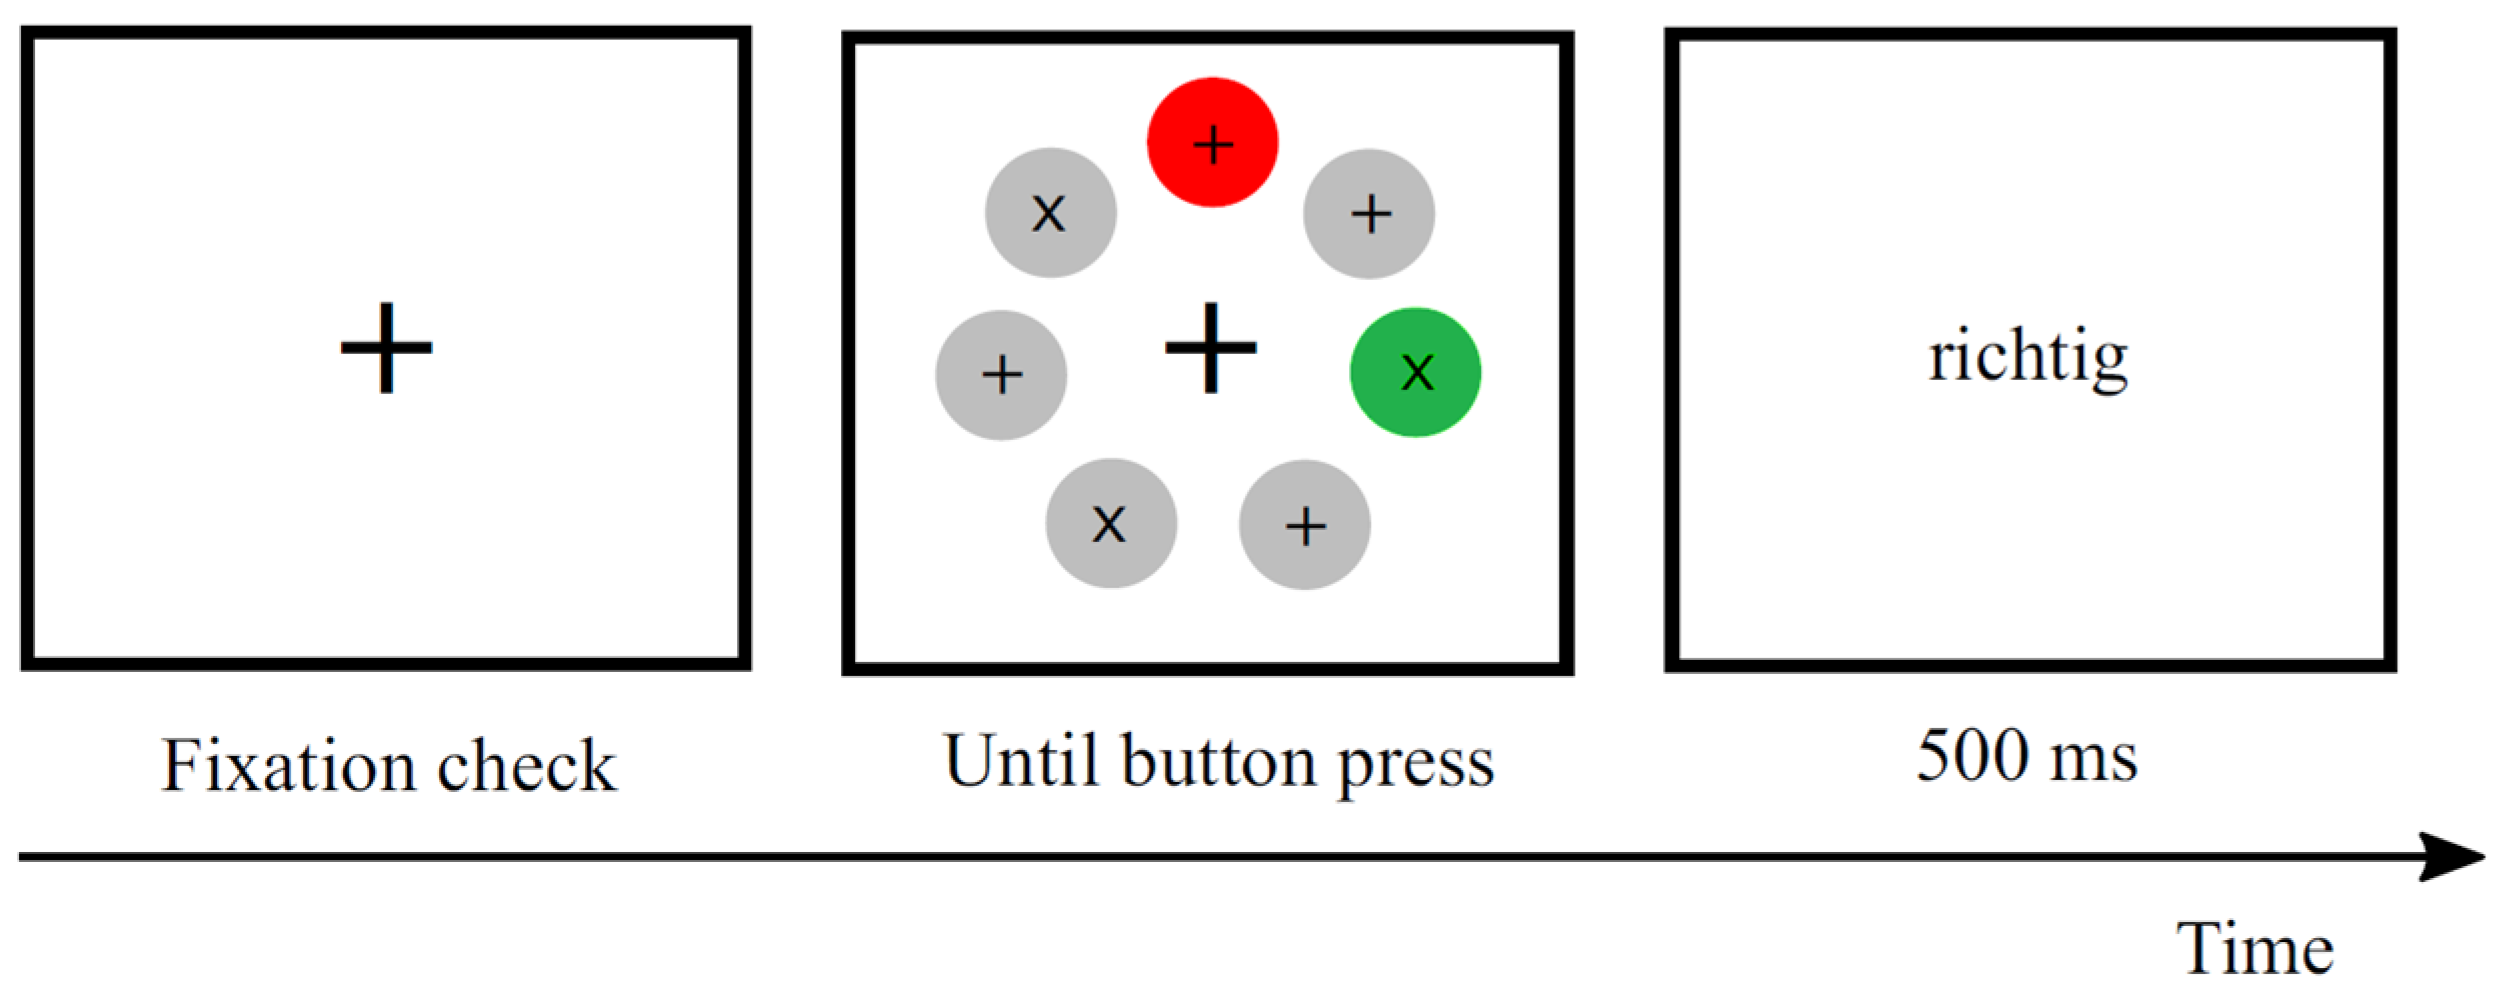
2.4. Procedure and Task
3. Results
3.1. Analyses of Bottom-Up and Top-Down Capture of Visuospatial Attention in the Visual-Search Task
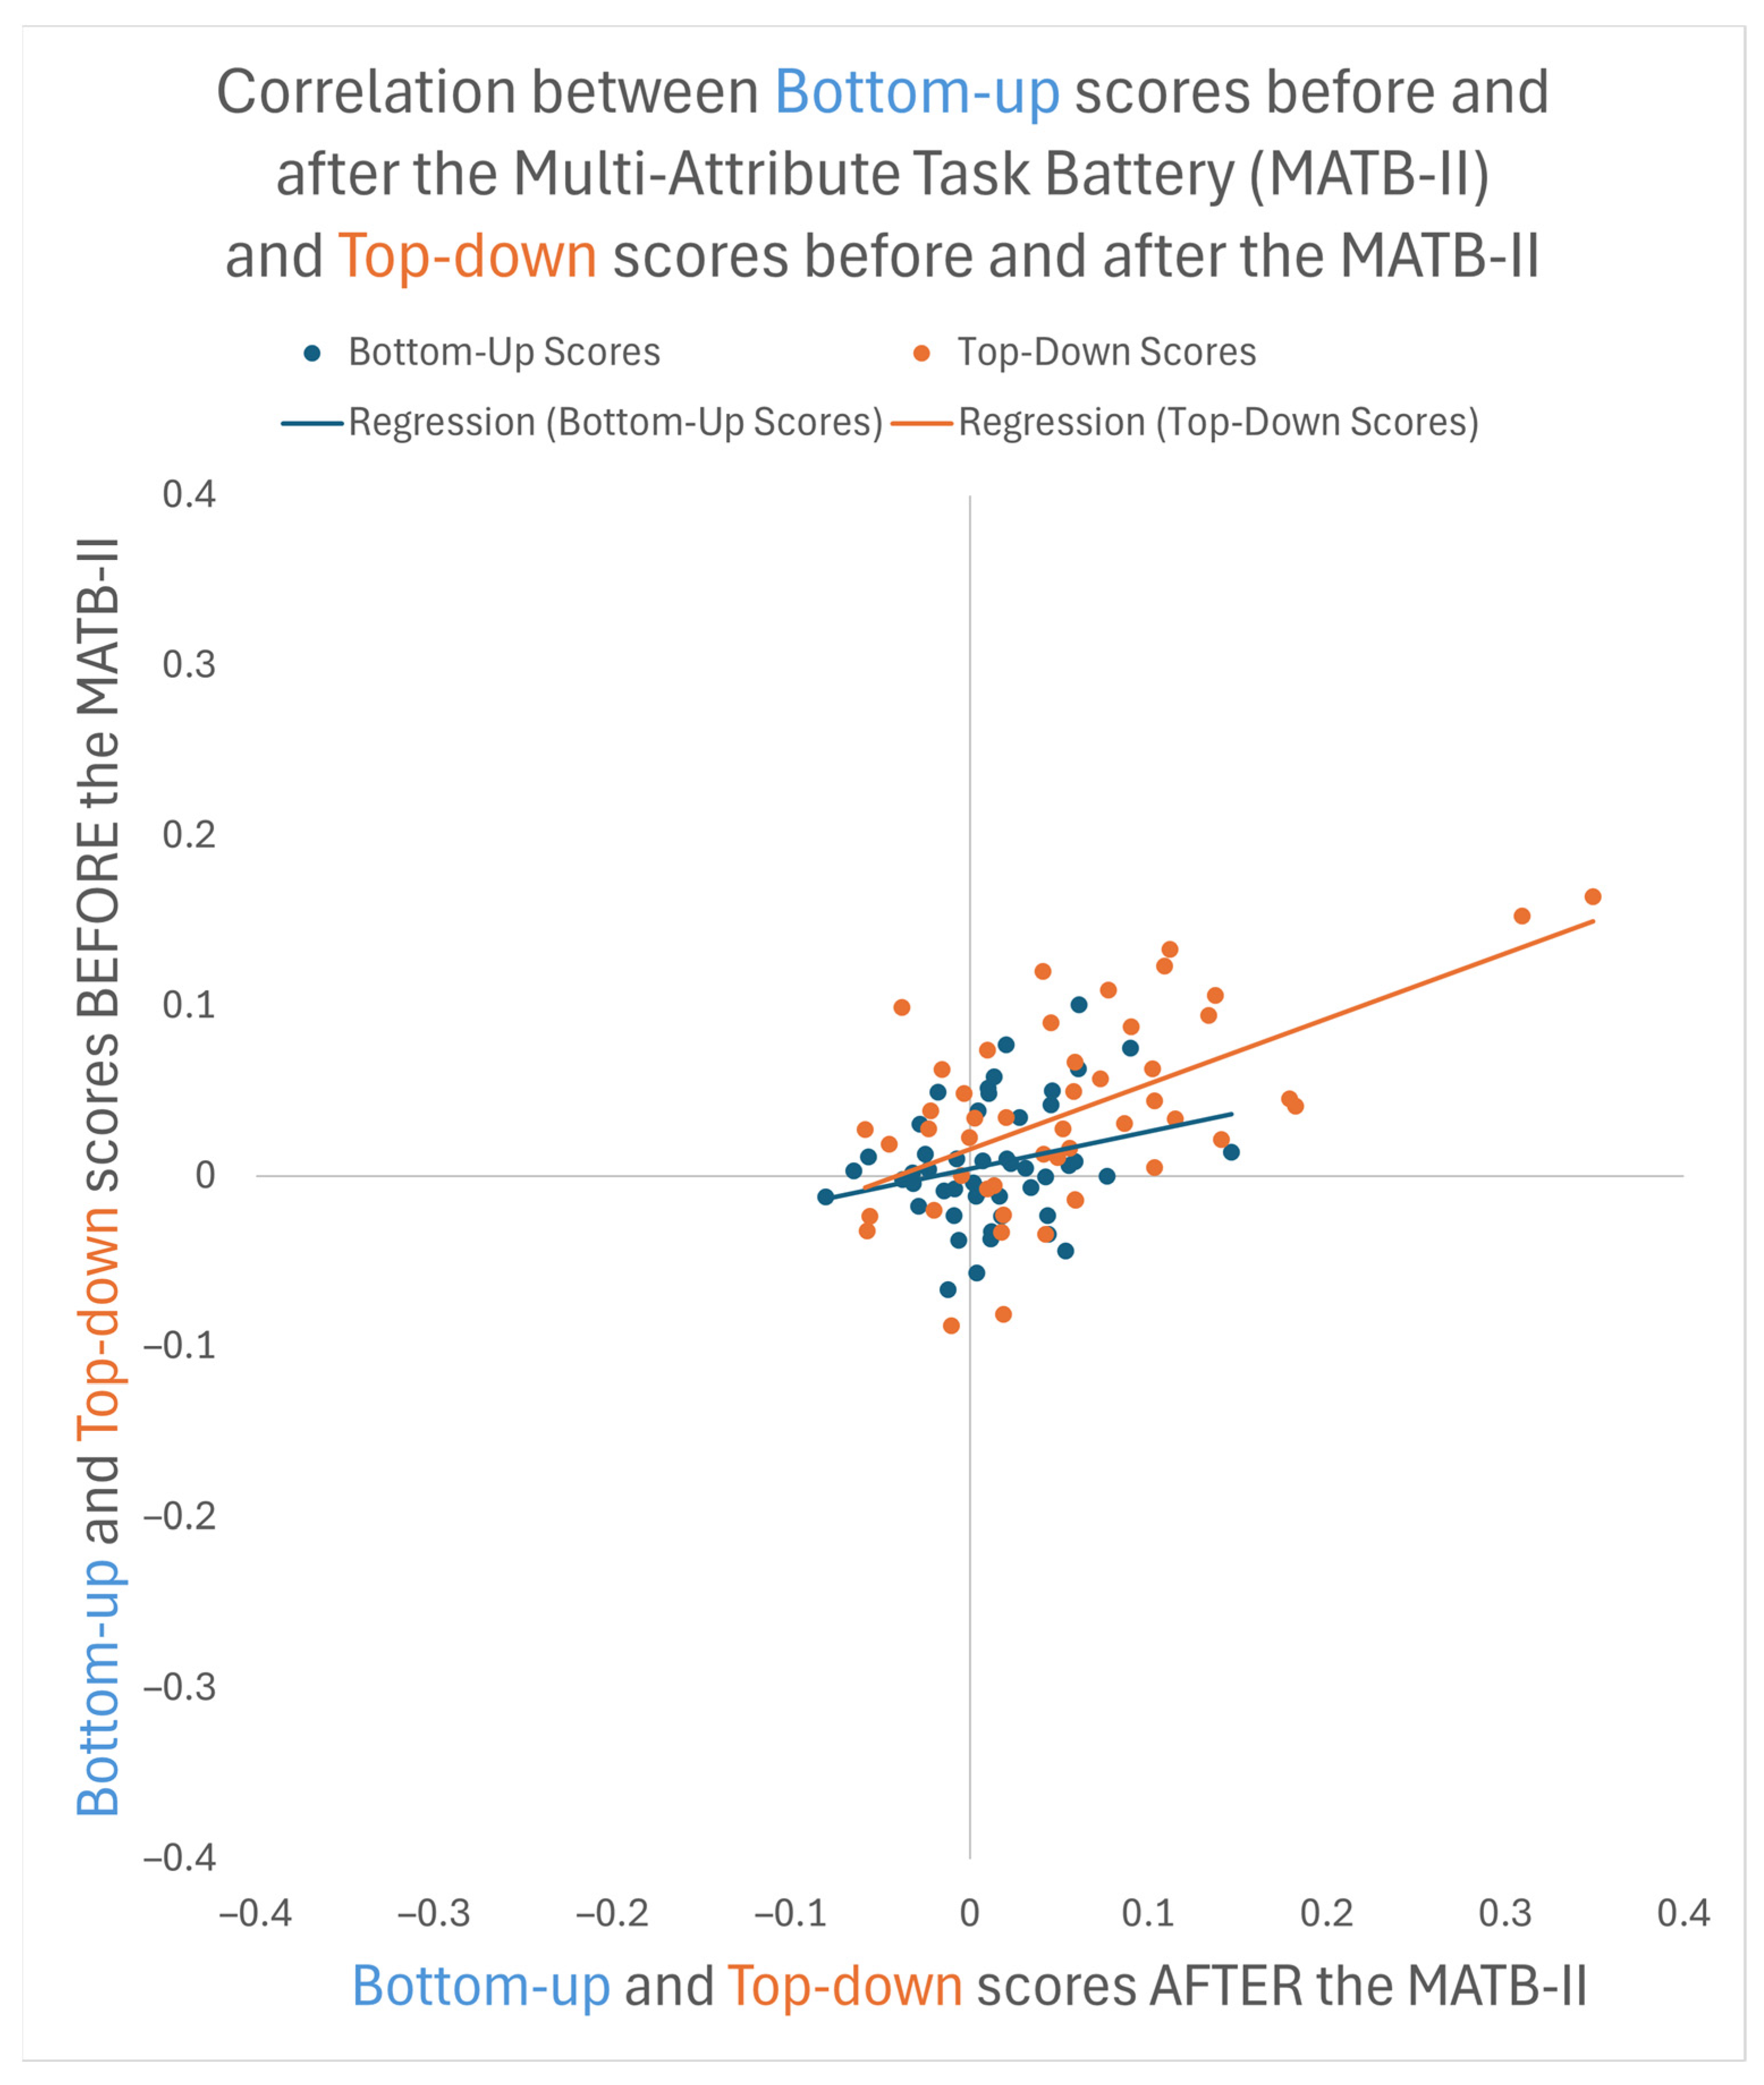
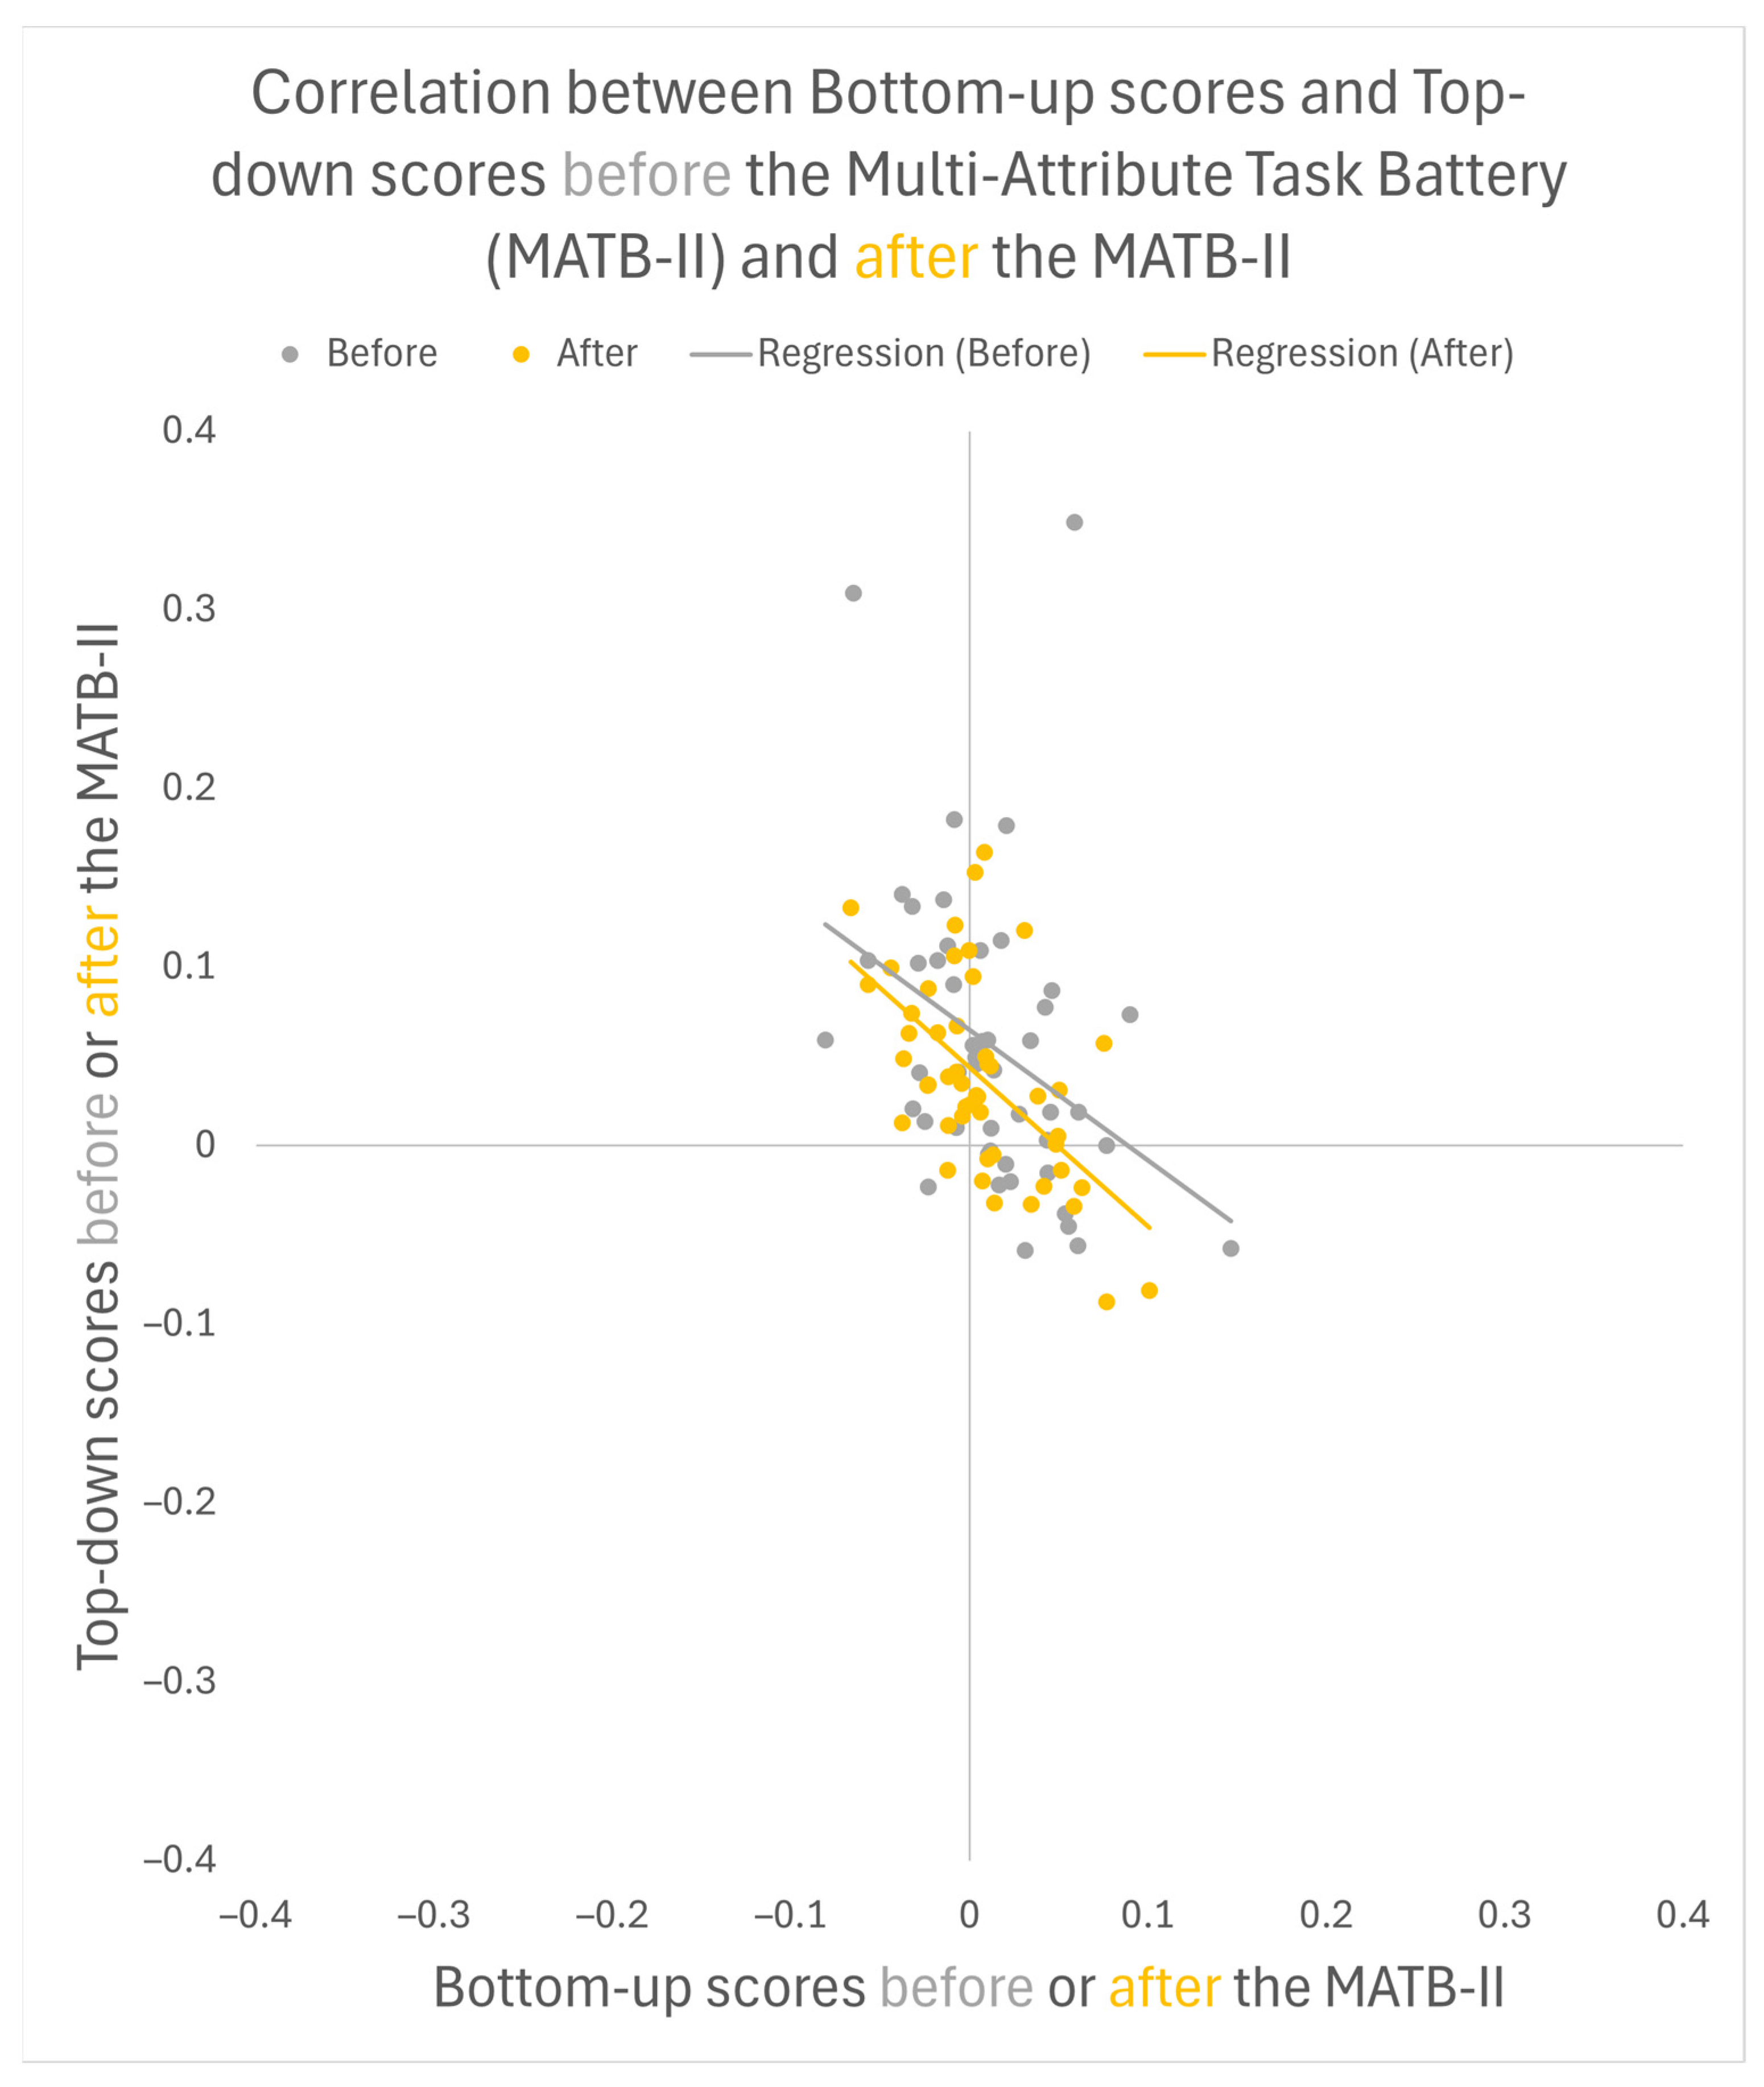
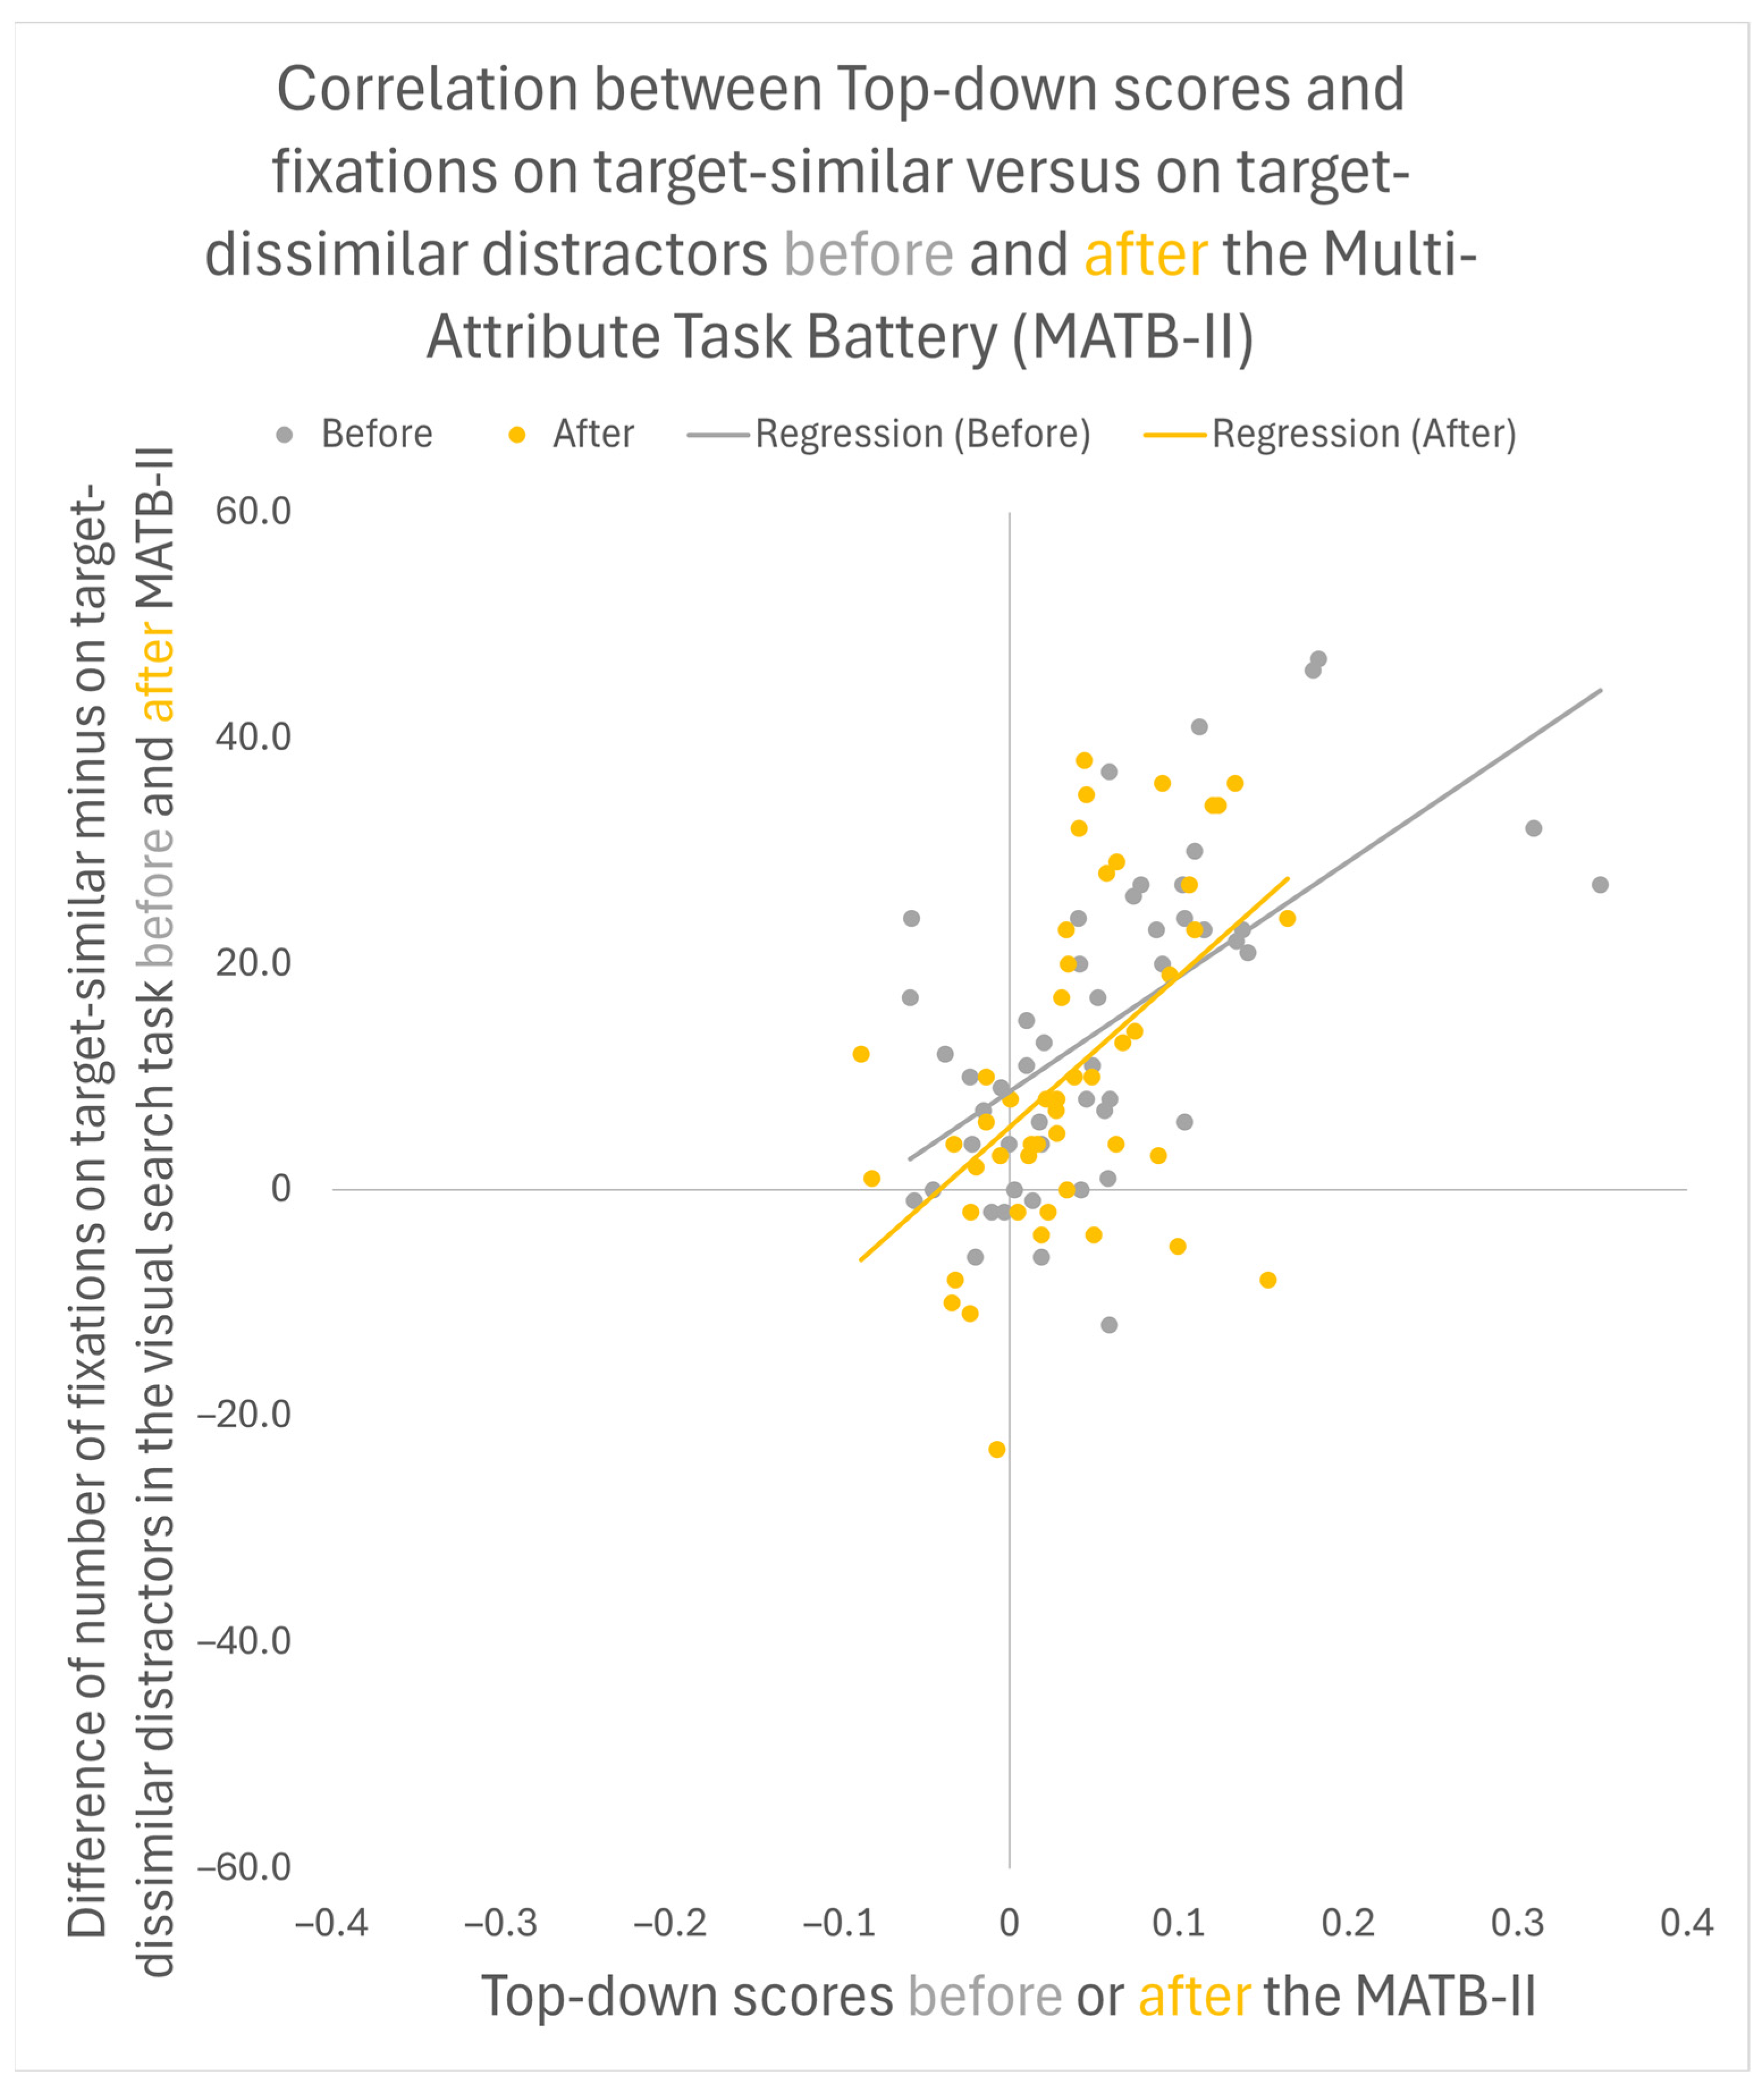
3.2. Correlations between Visuospatial Attention in the Experimental Task and Performance on the Multi-Attribute Task Battery
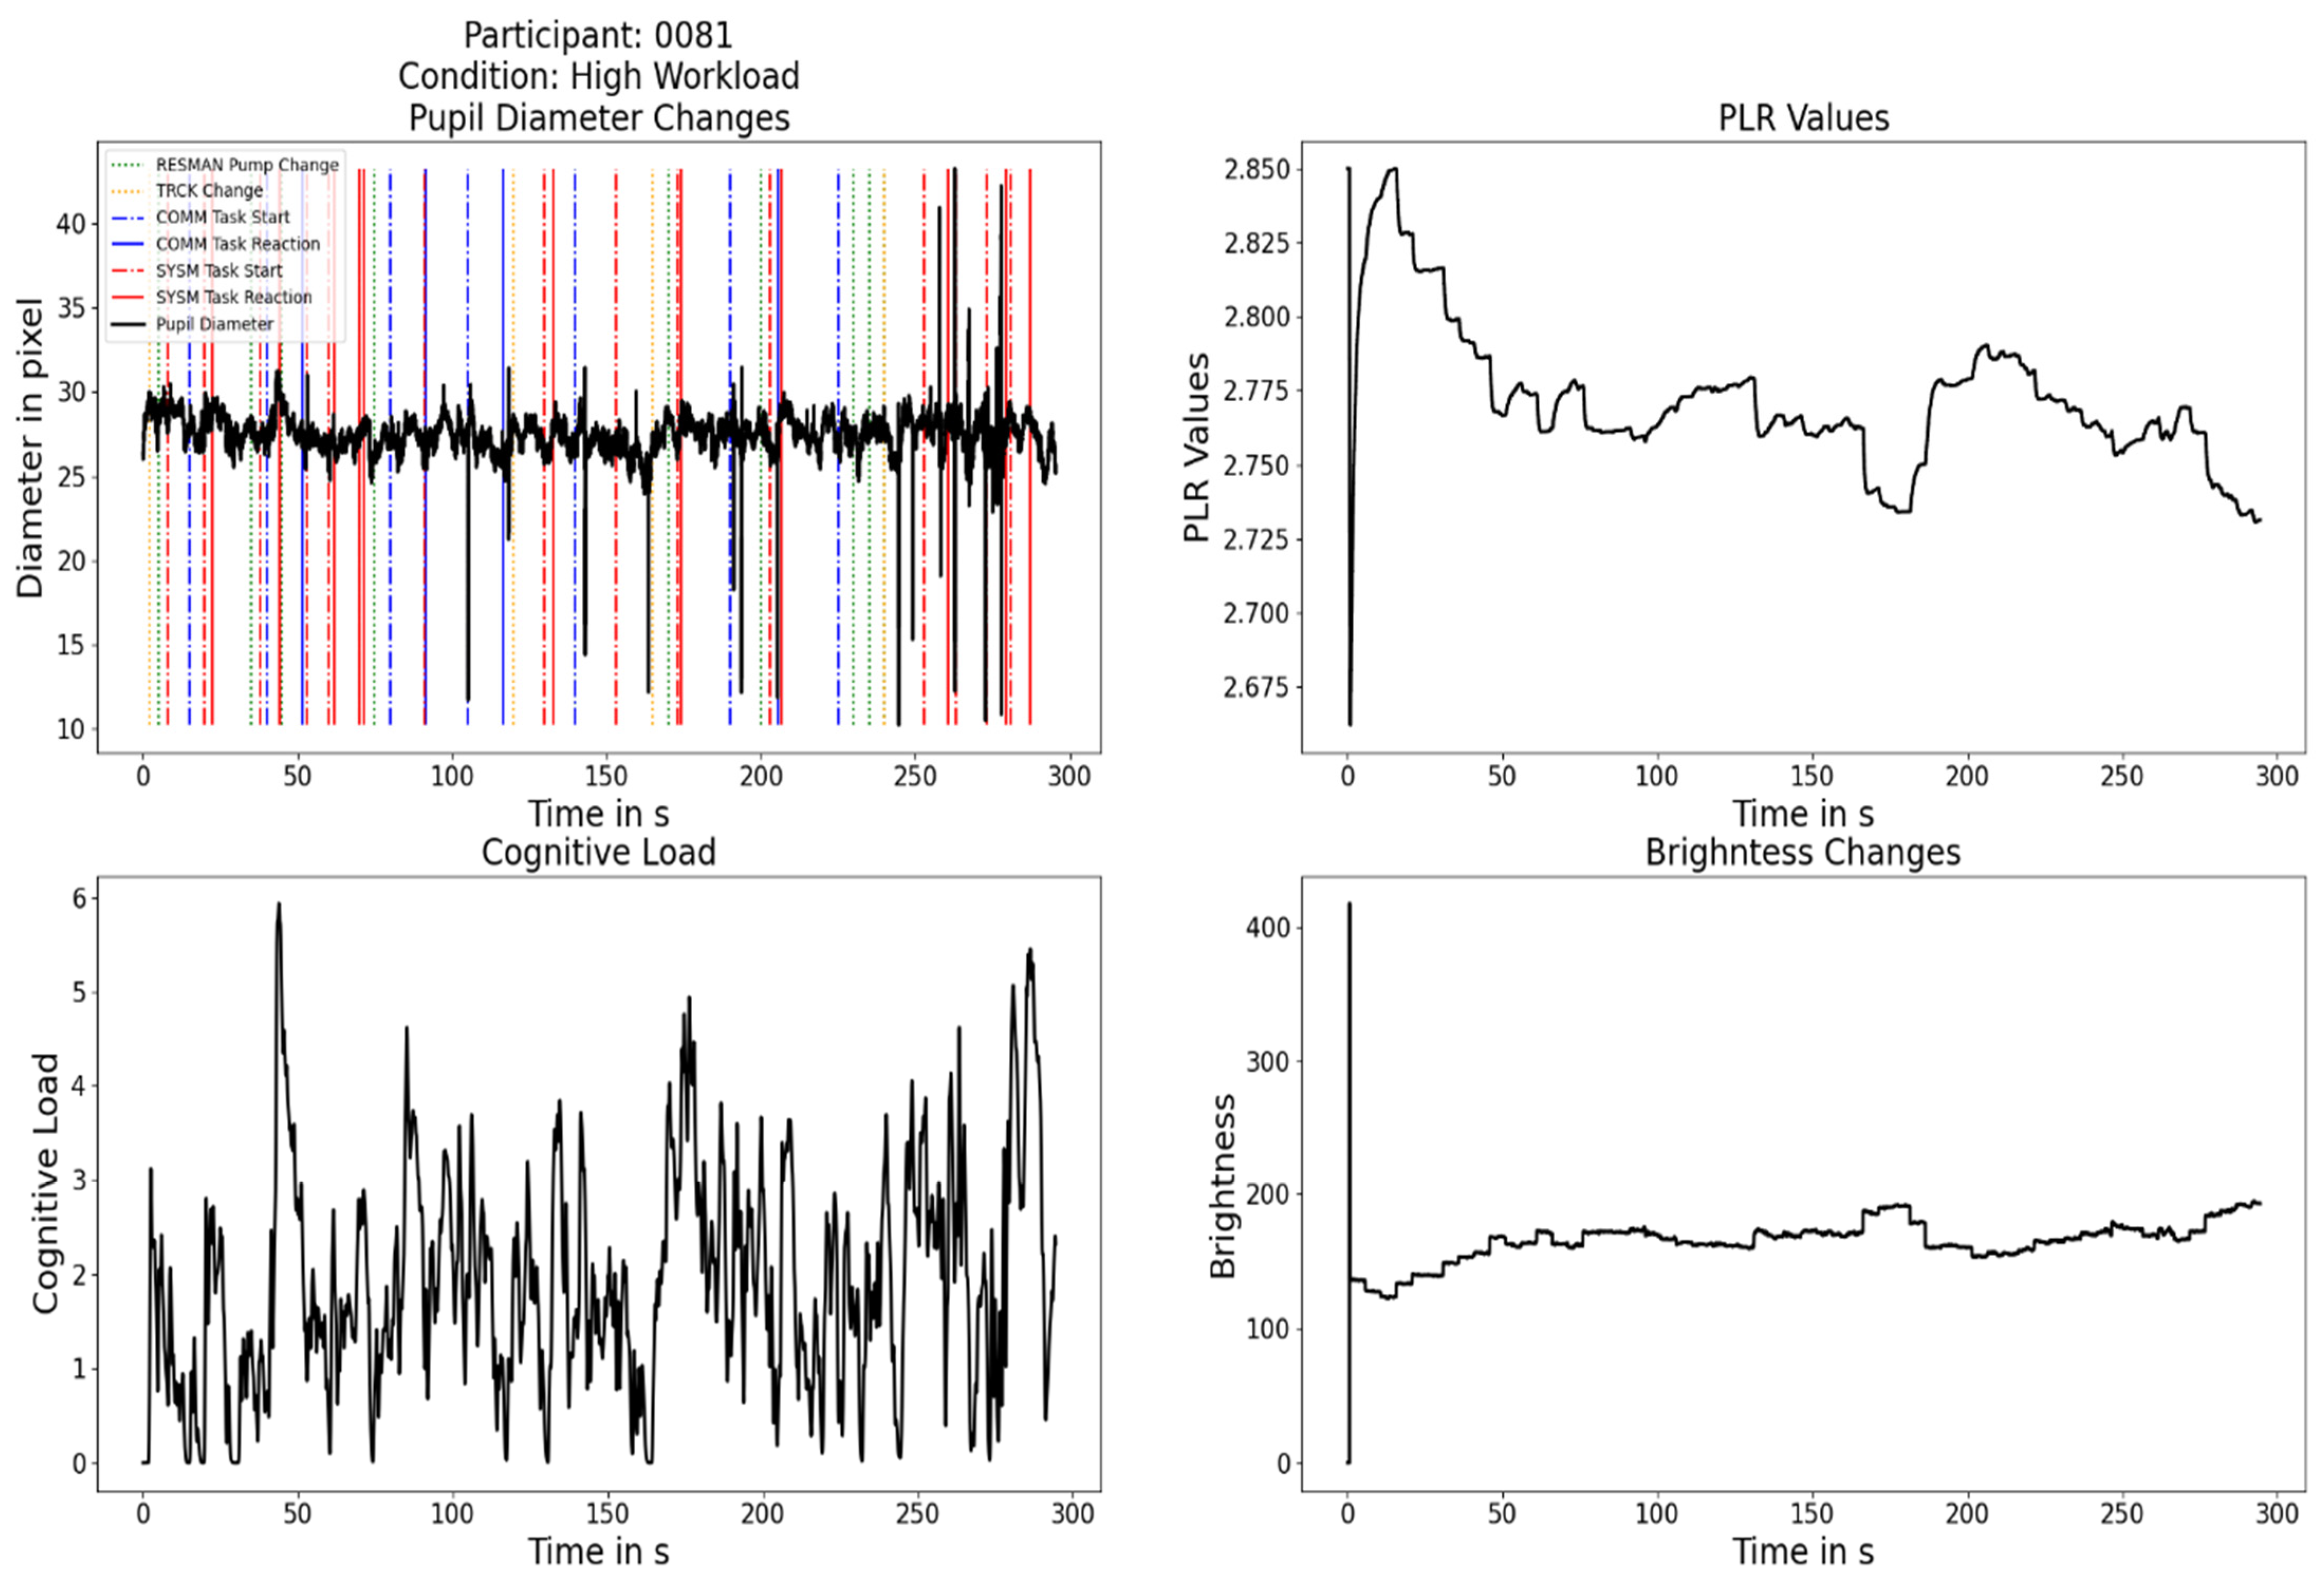
3.3. Analyses of Pupillary Responses in the Multi-Attribute Task Battery (MATB-II)
3.4. Analyses of Pupillary Responses in the System Monitoring Task of the Multi-Attribute Task Battery (MATB-II)
4. Discussion
4.1. Correlation Analyses between Visual-Search Task Measure of Visuospatial Attention and Multi-Attribute Task Battery Scores and between Different Measures of Visuospatial Attention within the Visual Search Task
4.2. Further Findings of Interest
4.3. Pupillary Cognitive Load or Workload Responses
4.4. Limitations
5. Conclusions
Supplementary Materials
Author Contributions
Funding
Institutional Review Board Statement
Informed Consent Statement
Data Availability Statement
Conflicts of Interest
References
- Kong, Y.; Posada-Quintero, H.F.; Gever, D.; Bonacci, L.; Chon, K.H.; Bolkhovsky, J. Multi-Attribute Task Battery configuration to effectively assess pilot performance deterioration during prolonged wakefulness. Inform. Med. Unlocked 2022, 28, 100822. [Google Scholar] [CrossRef]
- Wang, P.; Fang, W.; Guo, B. A colored petri nets based workload evaluation model and its validation through Multi-Attribute Task Battery-II. Appl. Ergon. 2017, 60, 260–274. [Google Scholar] [CrossRef] [PubMed]
- Fukuda, K.; Vogel, E.K.; Awh, E. Quantity, not quality: The relationship between fluid intelligence and working memory capacity. Psychon. Bull. Rev. 2010, 17, 673–679. [Google Scholar] [CrossRef] [PubMed]
- Robertson, I.H.; Ward, T.; Ridgeway, V.; Nimmo-Smith, I. The structure of normal human attention: The Test of Everyday Attention. J. Int. Neuropsychol. Soc. 1996, 2, 525–534. [Google Scholar] [CrossRef]
- Roque, N.A.; Wright, T.J.; Boot, W.R. Do different attention capture paradigms measure different types of capture? Atten. Percept. Psychophys. 2016, 78, 2014–2030. [Google Scholar] [CrossRef] [PubMed]
- Conway, A.R.A.; Kane, M.J.; Bunting, M.F.; Hambrick, D.Z.; Wilhelm, O.; Engle, R.W. Working memory span tasks: A methodological review and user’s guide. Psychon. Bull. Rev. 2005, 12, 769–786. [Google Scholar] [CrossRef]
- Wiegand, I.; Töllner, T.; Habekost, T.; Dyrholm, M.; Müller, H.J.; Finke, K. Distinct Neural Markers of TVA-Based Visual Processing Speed and Short-Term Storage Capacity Parameters. Cereb. Cortex 2014, 24, 1967–1978. [Google Scholar] [CrossRef] [PubMed]
- Weichselbaum, H.; Huber-Huber, C.; Ansorge, U. Attention capture is temporally stable: Evidence from mixed-model correlations. Cognition 2018, 180, 206–224. [Google Scholar] [CrossRef]
- Weichselbaum, H.; Ansorge, U. Bottom-up attention capture with distractor and target singletons defined in the same (color) dimension is not a matter of feature uncertainty. Atten. Percept. Psychophys. 2018, 80, 1350–1361. [Google Scholar] [CrossRef]
- Santiago-Espada, Y.; Myer, R.; Latorella, K.; Comstock, J.R. The Multi-Attribute Task Battery II (MATB-II) Software for Human Performance and Workload Research: A User’s Guide. 2011. Available online: https://www.semanticscholar.org/paper/The-Multi-Attribute-Task-Battery-II-(MATB-II)-for-A-Santiago-Espada-Myer/03048e4a70abc42693148a7b4e24d2a18ab75347 (accessed on 29 August 2023).
- Folk, C.L.; Remington, R. Selectivity in distraction by irrelevant featural singletons: Evidence for two forms of attentional capture. J. Exp. Psychol. Hum. Percept. Perform. 1998, 24, 847–858. [Google Scholar] [CrossRef]
- Goller, F.; Ditye, T.; Ansorge, U. The contribution of color to attention capture effects during search for onset targets. Atten. Percept. Psychophys. 2016, 78, 789–807. [Google Scholar] [CrossRef] [PubMed]
- Theeuwes, J. Cross-dimensional perceptual selectivity. Percept. Psychophys. 1991, 50, 184–193. [Google Scholar] [CrossRef] [PubMed]
- Theeuwes, J. Perceptual selectivity for color and form. Percept. Psychophys. 1992, 51, 599–606. [Google Scholar] [CrossRef] [PubMed]
- Theeuwes, J. Top–down and bottom–up control of visual selection. Acta Psychol. 2010, 135, 77–99. [Google Scholar] [CrossRef]
- Appel, T.; Scharinger, C.; Gerjets, P.; Kasneci, E. Cross-subject workload classification using pupil-related measures. In Proceedings of the 2018 ACM Symposium on Eye Tracking Research & Applications, Warsaw, Poland, 14–18 June 2018; pp. 1–8. [Google Scholar] [CrossRef]
- Chen, S.; Epps, J. Automatic classification of eye activity for cognitive load measurement with emotion interference. Comput. Methods Programs Biomed. 2013, 110, 111–124. [Google Scholar] [CrossRef] [PubMed]
- Chen, S.; Epps, J. Using Task-Induced Pupil Diameter and Blink Rate to Infer Cognitive Load. Hum. Comput. Interact. 2014, 29, 390–413. [Google Scholar] [CrossRef]
- Iqbal, S.T.; Zheng, X.S.; Bailey, B.P. Task-evoked pupillary response to mental workload in human-computer interaction. In Proceedings of the CHI’04 Extended Abstracts on Human Factors in Computing Systems, Vienna, Austria, 24–29 April 2004; pp. 1477–1480. [Google Scholar]
- Krejtz, K.; Duchowski, A.T.; Niedzielska, A.; Biele, C.; Krejtz, I. Eye tracking cognitive load using pupil diameter and microsaccades with fixed gaze. PLoS ONE 2018, 13, e0203629. [Google Scholar] [CrossRef] [PubMed]
- Laeng, B.; Ørbo, M.; Holmlund, T.; Miozzo, M. Pupillary Stroop effects. Cogn. Process. 2011, 12, 13–21. [Google Scholar] [CrossRef]
- Stolte, M.; Gollan, B.; Ansorge, U. Tracking visual search demands and memory load through pupil dilation. J. Vis. 2020, 20, 21. [Google Scholar] [CrossRef]
- Ahlstrom, U.; Friedman-Berg, F.J. Using eye movement activity as a correlate of cognitive workload. Int. J. Ind. Ergon. 2006, 36, 623–636. [Google Scholar] [CrossRef]
- Van der Wel, P.; van Steenbergen, H. Pupil dilation as an index of effort in cognitive control tasks: A review. Psychon. Bull. Rev. 2018, 25, 2005–2015. [Google Scholar] [CrossRef] [PubMed]
- Gollan, B. Sensor-based Online Assessment of Human Attention. Ph.D. Thesis, Johannes Kepler University Linz, Linz, Austria, 2018. [Google Scholar] [CrossRef]
- Gollan, B.; Ferscha, A. Modeling Pupil Dilation as Online Input for Estimation of Cognitive Load in non-laboratory Attention-Aware Systems. In Proceedings of the COGNITIVE 2016: The Eighth International Conference on Advanced Cognitive Technologies and Applications, Rome, Italy, 20–24 March 2016. [Google Scholar]
- Bradley, M.M.; Miccoli, L.; Escrig, M.A.; Lang, P.J. The pupil as a measure of emotional arousal and autonomic activation. Psychophysiology 2008, 45, 602–607. [Google Scholar] [CrossRef] [PubMed]
- Casuccio, A.; Cillino, G.; Pavone, C.; Spitale, E.; Cillino, S. Pharmacologic pupil dilation as a predictive test for the risk for intraoperative floppy-iris syndrome. J. Cataract. Refract. Surg. 2011, 37, 1447–1454. [Google Scholar] [CrossRef] [PubMed]
- Clewett, D.; Gasser, C.; Davachi, L. Pupil-linked arousal signals track the temporal organization of events in memory. Nat. Commun. 2020, 11, 4007. [Google Scholar] [CrossRef]
- Gao, Y.; Theeuwes, J. Learning to suppress a distractor is not affected by working memory load. Psychon. Bull. Rev. 2020, 27, 96–104. [Google Scholar] [CrossRef] [PubMed]
- Stilwell, B.T.; Bahle, B.; Vecera, S.P. Feature-based statistical regularities of distractors modulate attentional capture. J. Exp. Psychol. Hum. Percept. Perform. 2019, 45, 419–433. [Google Scholar] [CrossRef] [PubMed]
- Wang, B.; Theeuwes, J. How to inhibit a distractor location? Statistical learning versus active, top-down suppression. Atten. Percept. Psychophys. 2018, 80, 860–870. [Google Scholar] [CrossRef] [PubMed]
- Burlingham, C.S.; Mirbagheri, S.; Heeger, D.J. A unified model of the task-evoked pupil response. Sci. Adv. 2022, 8, eabi9979. [Google Scholar] [CrossRef] [PubMed]
- Einhäuser, W.; Koch, C.; Carter, O.L. Pupil dilation betrays the timing of decisions. Front. Hum. Neurosci. 2010, 4, 18. [Google Scholar] [CrossRef]
- Bundesen, C. A theory of visual attention. Psychol. Rev. 1990, 97, 523–547. [Google Scholar] [CrossRef]
- Duncan, J.; Humphreys, G.W. Visual search and stimulus similarity. Psychol. Rev. 1989, 96, 433–458. [Google Scholar] [CrossRef] [PubMed]
- Itti, L.; Koch, C.; Niebur, E. A model of saliency-based visual attention for rapid scene analysis. IEEE Trans. Pattern Anal. Mach. Intell. 1998, 20, 1254–1259. [Google Scholar] [CrossRef]
- Li, Z. A saliency map in primary visual cortex. Trends Cogn. Sci. 2002, 6, 9–16. [Google Scholar] [CrossRef] [PubMed]
- Nothdurft, H.-C. Salience from feature contrast: Additivity across dimensions. Vis. Res. 2000, 40, 1183–1201. [Google Scholar] [CrossRef] [PubMed]
- Cappe, C.; Clarke, A.; Mohr, C.; Herzog, M. Is there a common factor for vision? J. Vis. 2014, 14, 4. [Google Scholar] [CrossRef] [PubMed]
- Miyake, A.; Friedman, N.P.; Emerson, M.J.; Witzki, A.H.; Howerter, A.; Wager, T.D. The Unity and Diversity of Executive Functions and Their Contributions to Complex “Frontal Lobe” Tasks: A Latent Variable Analysis. Cogn. Psychol. 2000, 41, 49–100. [Google Scholar] [CrossRef] [PubMed]
- Monsell, S. Task switching. Trends Cogn. Sci. 2003, 7, 134–140. [Google Scholar] [CrossRef]
- Stilwell, B.T.; Vecera, S.P. Learned distractor rejection in the face of strong target guidance. J. Exp. Psychol. Hum. Percept. Perform. 2020, 46, 926–941. [Google Scholar] [CrossRef]
- Reeder, R.R.; Olivers, C.N.; Hanke, M.; Pollmann, S. No evidence for enhanced distractor template representation in early visual cortex. Cortex 2018, 108, 279–282. [Google Scholar] [CrossRef]
- De Vries, I.E.J.; Savran, E.; Van Driel, J.; Olivers, C.N.L. Oscillatory Mechanisms of Preparing for Visual Distraction. J. Cogn. Neurosci. 2019, 31, 1873–1894. [Google Scholar] [CrossRef]
- Gutzwiller, R.S.; Wickens, C.D.; Clegg, B.A. Workload overload modeling: An experiment with MATB II to inform a computational model of task management. Proc. Hum. Factors Ergon. Soc. Annu. Meet. 2014, 58, 849–853. [Google Scholar] [CrossRef]
- Kerzel, D.; Barras, C. Distractor rejection in visual search breaks down with more than a single distractor feature. J. Exp. Psychol. Hum. Percept. Perform. 2016, 42, 648–657. [Google Scholar] [CrossRef] [PubMed]
- Büsel, C.; Pomper, U.; Ansorge, U. Capture of attention by target-similar cues during dual-color search reflects reactive control among top-down selected attentional control settings. Psychon. Bull. Rev. 2019, 26, 531–537. [Google Scholar] [CrossRef]
- Folk, C.L.; Anderson, B.A. Target-uncertainty effects in attentional capture: Color-singleton set or multiple attentional control settings? Psychon. Bull. Rev. 2010, 17, 421–426. [Google Scholar] [CrossRef] [PubMed]
- Grubert, A.; Eimer, M. A capacity limit for the rapid parallel selection of multiple target objects. J. Vis. 2018, 18, 1017. [Google Scholar] [CrossRef]
- Kerzel, D.; Grubert, A. Capacity limitations in template-guided multiple color search. Psychon. Bull. Rev. 2022, 29, 901–909. [Google Scholar] [CrossRef]
- Ort, E.; Fahrenfort, J.J.; Olivers, C.N.L. Lack of Free Choice Reveals the Cost of Having to Search for More Than One Object. Psychol. Sci. 2017, 28, 1137–1147. [Google Scholar] [CrossRef]
- Pereira, E.J.; Castelhano, M.S. Attentional capture is contingent on scene region: Using surface guidance framework to explore attentional mechanisms during search. Psychon. Bull. Rev. 2019, 26, 1273–1281. [Google Scholar] [CrossRef]
- Torralba, A.; Oliva, A.; Castelhano, M.S.; Henderson, J.M. Contextual guidance of eye movements and attention in real-world scenes: The role of global features in object search. Psychol. Rev. 2006, 113, 766–786. [Google Scholar] [CrossRef]
- Wolfe, J.M. Guided Search 6.0: An updated model of visual search. Psychon. Bull. Rev. 2021, 28, 1060–1092. [Google Scholar] [CrossRef]
- Eckstein, M.P.; Drescher, B.A.; Shimozaki, S.S. Attentional Cues in Real Scenes, Saccadic Targeting, and Bayesian Priors. Psychol. Sci. 2006, 17, 973–980. [Google Scholar] [CrossRef] [PubMed]
- Võ, M.L.-H.; Wolfe, J.M. Differential Electrophysiological Signatures of Semantic and Syntactic Scene Processing. Psychol. Sci. 2013, 24, 1816–1823. [Google Scholar] [CrossRef] [PubMed]
- Võ, M.L.; Wolfe, J.M. The role of memory for visual search in scenes. Ann. New York Acad. Sci. 2015, 1339, 72–81. [Google Scholar] [CrossRef]
- Bulikhov, D.; Landry, S.J. The effect of applied effort on MATB-II performance. Theor. Issues Ergon. Sci. 2023, 24, 233–240. [Google Scholar] [CrossRef]
- Muñoz-de-Escalona, E.; Cañas, J.J.; Leva, C.; Longo, L. Task Demand Transition Peak Point Effects on Mental Workload Measures Divergence. In Proceedings of the Human Mental Workload: Models and Applications: 4th International Symposium, H-WORKLOAD 2020, Granada, Spain, 3–5 December 2020; Longo, L., Leva, M.C., Eds.; Communications in Computer and Information Science; Springer International Publishing: Cham, Switzerland, 2020; Volume 1318, pp. 207–226. [Google Scholar] [CrossRef]
- Pekrun, R.; Frenzel, A.C.; Goetz, T.; Perry, R.P. The Control-Value Theory of Achievement Emotions. In Emotion in Education; Elsevier: Amsterdam, The Netherlands, 2007; pp. 13–36. [Google Scholar] [CrossRef]
- Yerkes, R.M.; Dodson, J.D. The relation of strength of stimulus to rapidity of habit-formation. J. Comp. Neurol. Psychol. 1908, 18, 459–482. [Google Scholar] [CrossRef]
- Huestegge, L.; Koch, I. When two actions are easier than one: How inhibitory control demands affect response processing. Acta Psychol. 2014, 151, 230–236. [Google Scholar] [CrossRef] [PubMed]
- Kürten, J.; Raettig, T.; Gutzeit, J.; Huestegge, L. Dual-action benefits: Global (action-inherent) and local (transient) sources of action prepotency underlying inhibition failures in multiple action control. Psychol. Res. 2023, 87, 410–424. [Google Scholar] [CrossRef] [PubMed]
- Laeng, B.; Endestad, T. Bright illusions reduce the eye’s pupil. Proc. Natl. Acad. Sci. USA 2012, 109, 2162–2167. [Google Scholar] [CrossRef] [PubMed]
- Laeng, B.; Nabil, S.; Kitaoka, A. The Eye Pupil Adjusts to Illusorily Expanding Holes. Front. Hum. Neurosci. 2022, 16, 877249. [Google Scholar] [CrossRef]
- Bressan, P.; Actis-Grosso, R. Simultaneous Lightness Contrast on Plain and Articulated Surrounds. Perception 2006, 35, 445–452. [Google Scholar] [CrossRef]
- Cavanagh, P.; Alvarez, G. Tracking multiple targets with multifocal attention. Trends Cogn. Sci. 2005, 9, 349–354. [Google Scholar] [CrossRef] [PubMed]


| Target-Color | Distractor Trial | Mean Target Fixation | SD Target Fixation | Mean Nonsingleton Fixation | SD Nonsingleton Fixation | Degrees of Freedom | T-Value | p-Value |
|---|---|---|---|---|---|---|---|---|
| Green-1 (G1) | Dissimilar | 18.07 | 8.41 | 12.03 | 10.30 | 27 | 1.87 | 0.038 |
| Similar | 19.75 | 10.85 | 13.25 | 10.35 | 27 | 2.25 | 0.028 | |
| Green-2 (G2) | Dissimilar | 16.17 | 5.85 | 7.26 | 6.49 | 29 | 5.50 | <0.001 |
| Similar | 20.67 | 7.18 | 10.57 | 8.02 | 29 | 5.06 | <0.001 | |
| Red-1 (R1) | Dissimilar | 11.85 | 5.25 | 7.00 | 6.35 | 25 | 2.94 | 0.005 |
| Similar | 40.08 | 9.97 | 5.73 | 4.98 | 25 | 15.41 | <0.001 | |
| Red-2 (R2) | Dissimilar | 14.13 | 6.97 | 7.79 | 7.55 | 23 | 2.95 | 0.005 |
| Similar | 40.29 | 15.49 | 9.08 | 5.82 | 23 | 9.04 | <0.001 |
Disclaimer/Publisher’s Note: The statements, opinions and data contained in all publications are solely those of the individual author(s) and contributor(s) and not of MDPI and/or the editor(s). MDPI and/or the editor(s) disclaim responsibility for any injury to people or property resulting from any ideas, methods, instructions or products referred to in the content. |
© 2024 by the authors. Licensee MDPI, Basel, Switzerland. This article is an open access article distributed under the terms and conditions of the Creative Commons Attribution (CC BY) license (https://creativecommons.org/licenses/by/4.0/).
Share and Cite
Gugerell, D.; Gollan, B.; Stolte, M.; Ansorge, U. Studying the Role of Visuospatial Attention in the Multi-Attribute Task Battery II. Appl. Sci. 2024, 14, 3158. https://doi.org/10.3390/app14083158
Gugerell D, Gollan B, Stolte M, Ansorge U. Studying the Role of Visuospatial Attention in the Multi-Attribute Task Battery II. Applied Sciences. 2024; 14(8):3158. https://doi.org/10.3390/app14083158
Chicago/Turabian StyleGugerell, Daniel, Benedikt Gollan, Moritz Stolte, and Ulrich Ansorge. 2024. "Studying the Role of Visuospatial Attention in the Multi-Attribute Task Battery II" Applied Sciences 14, no. 8: 3158. https://doi.org/10.3390/app14083158