

Surface Structuring of the CP Titanium by Ultrafast Laser Pulses


Abstract
:1. Introduction
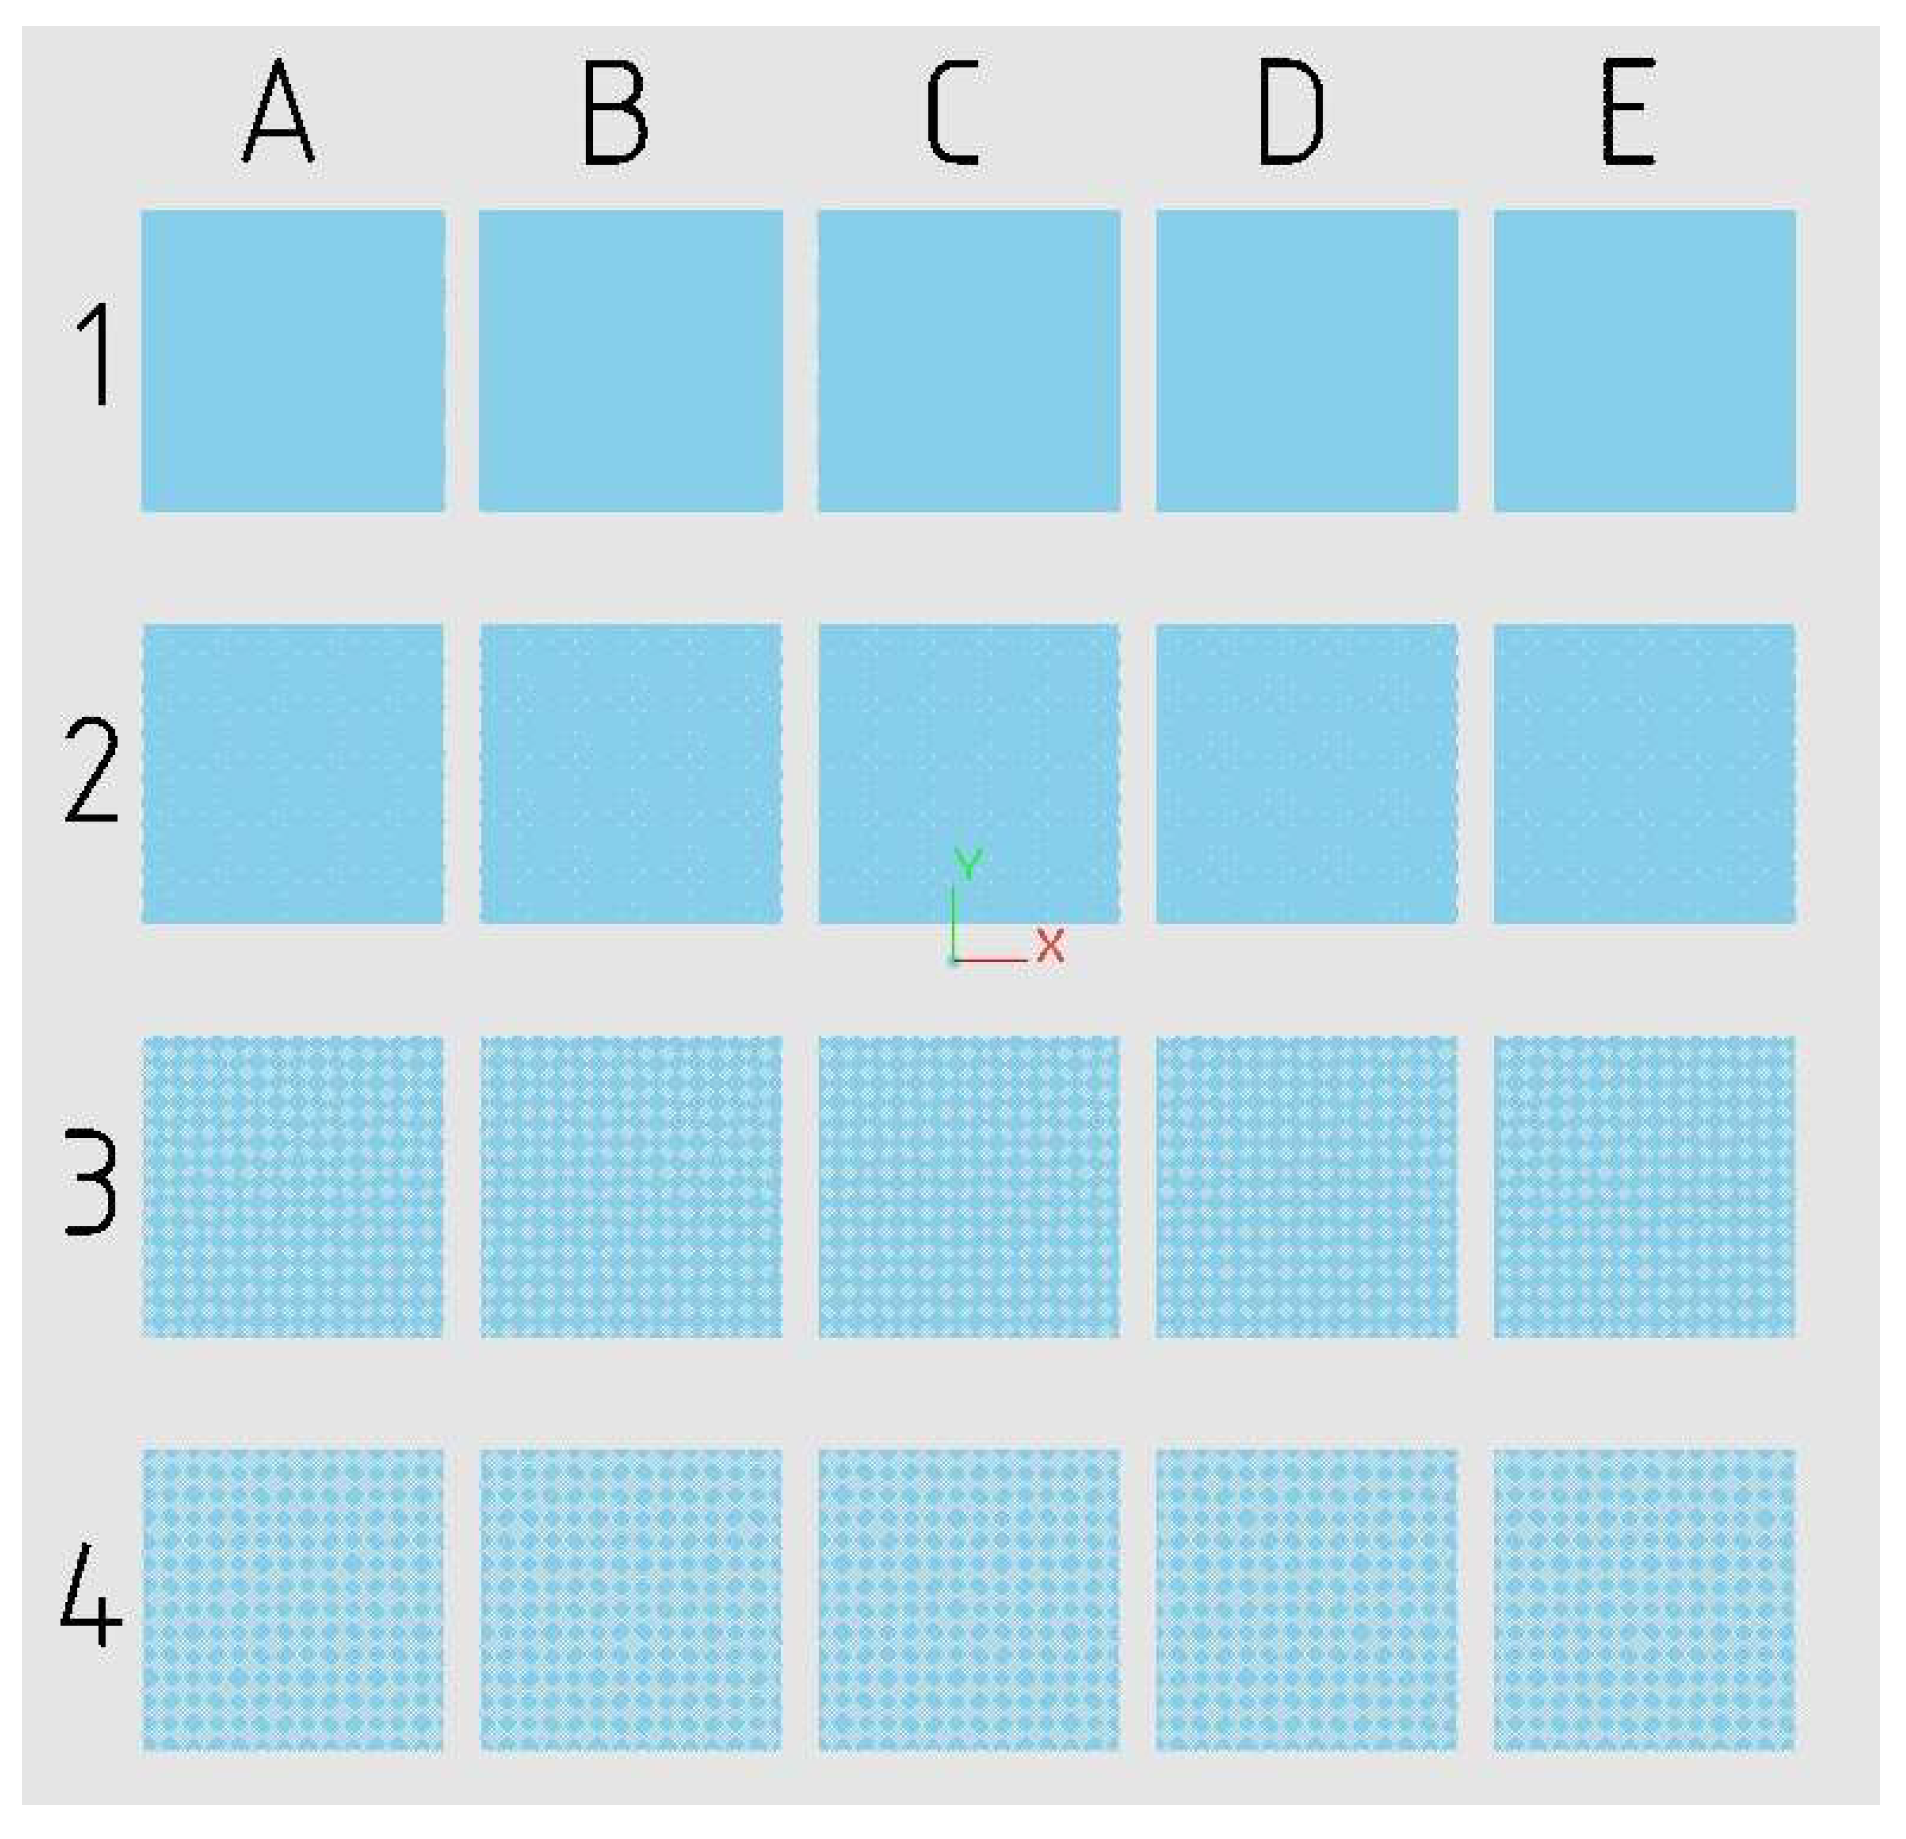
2. Materials and Methods
3. Results and Discussion
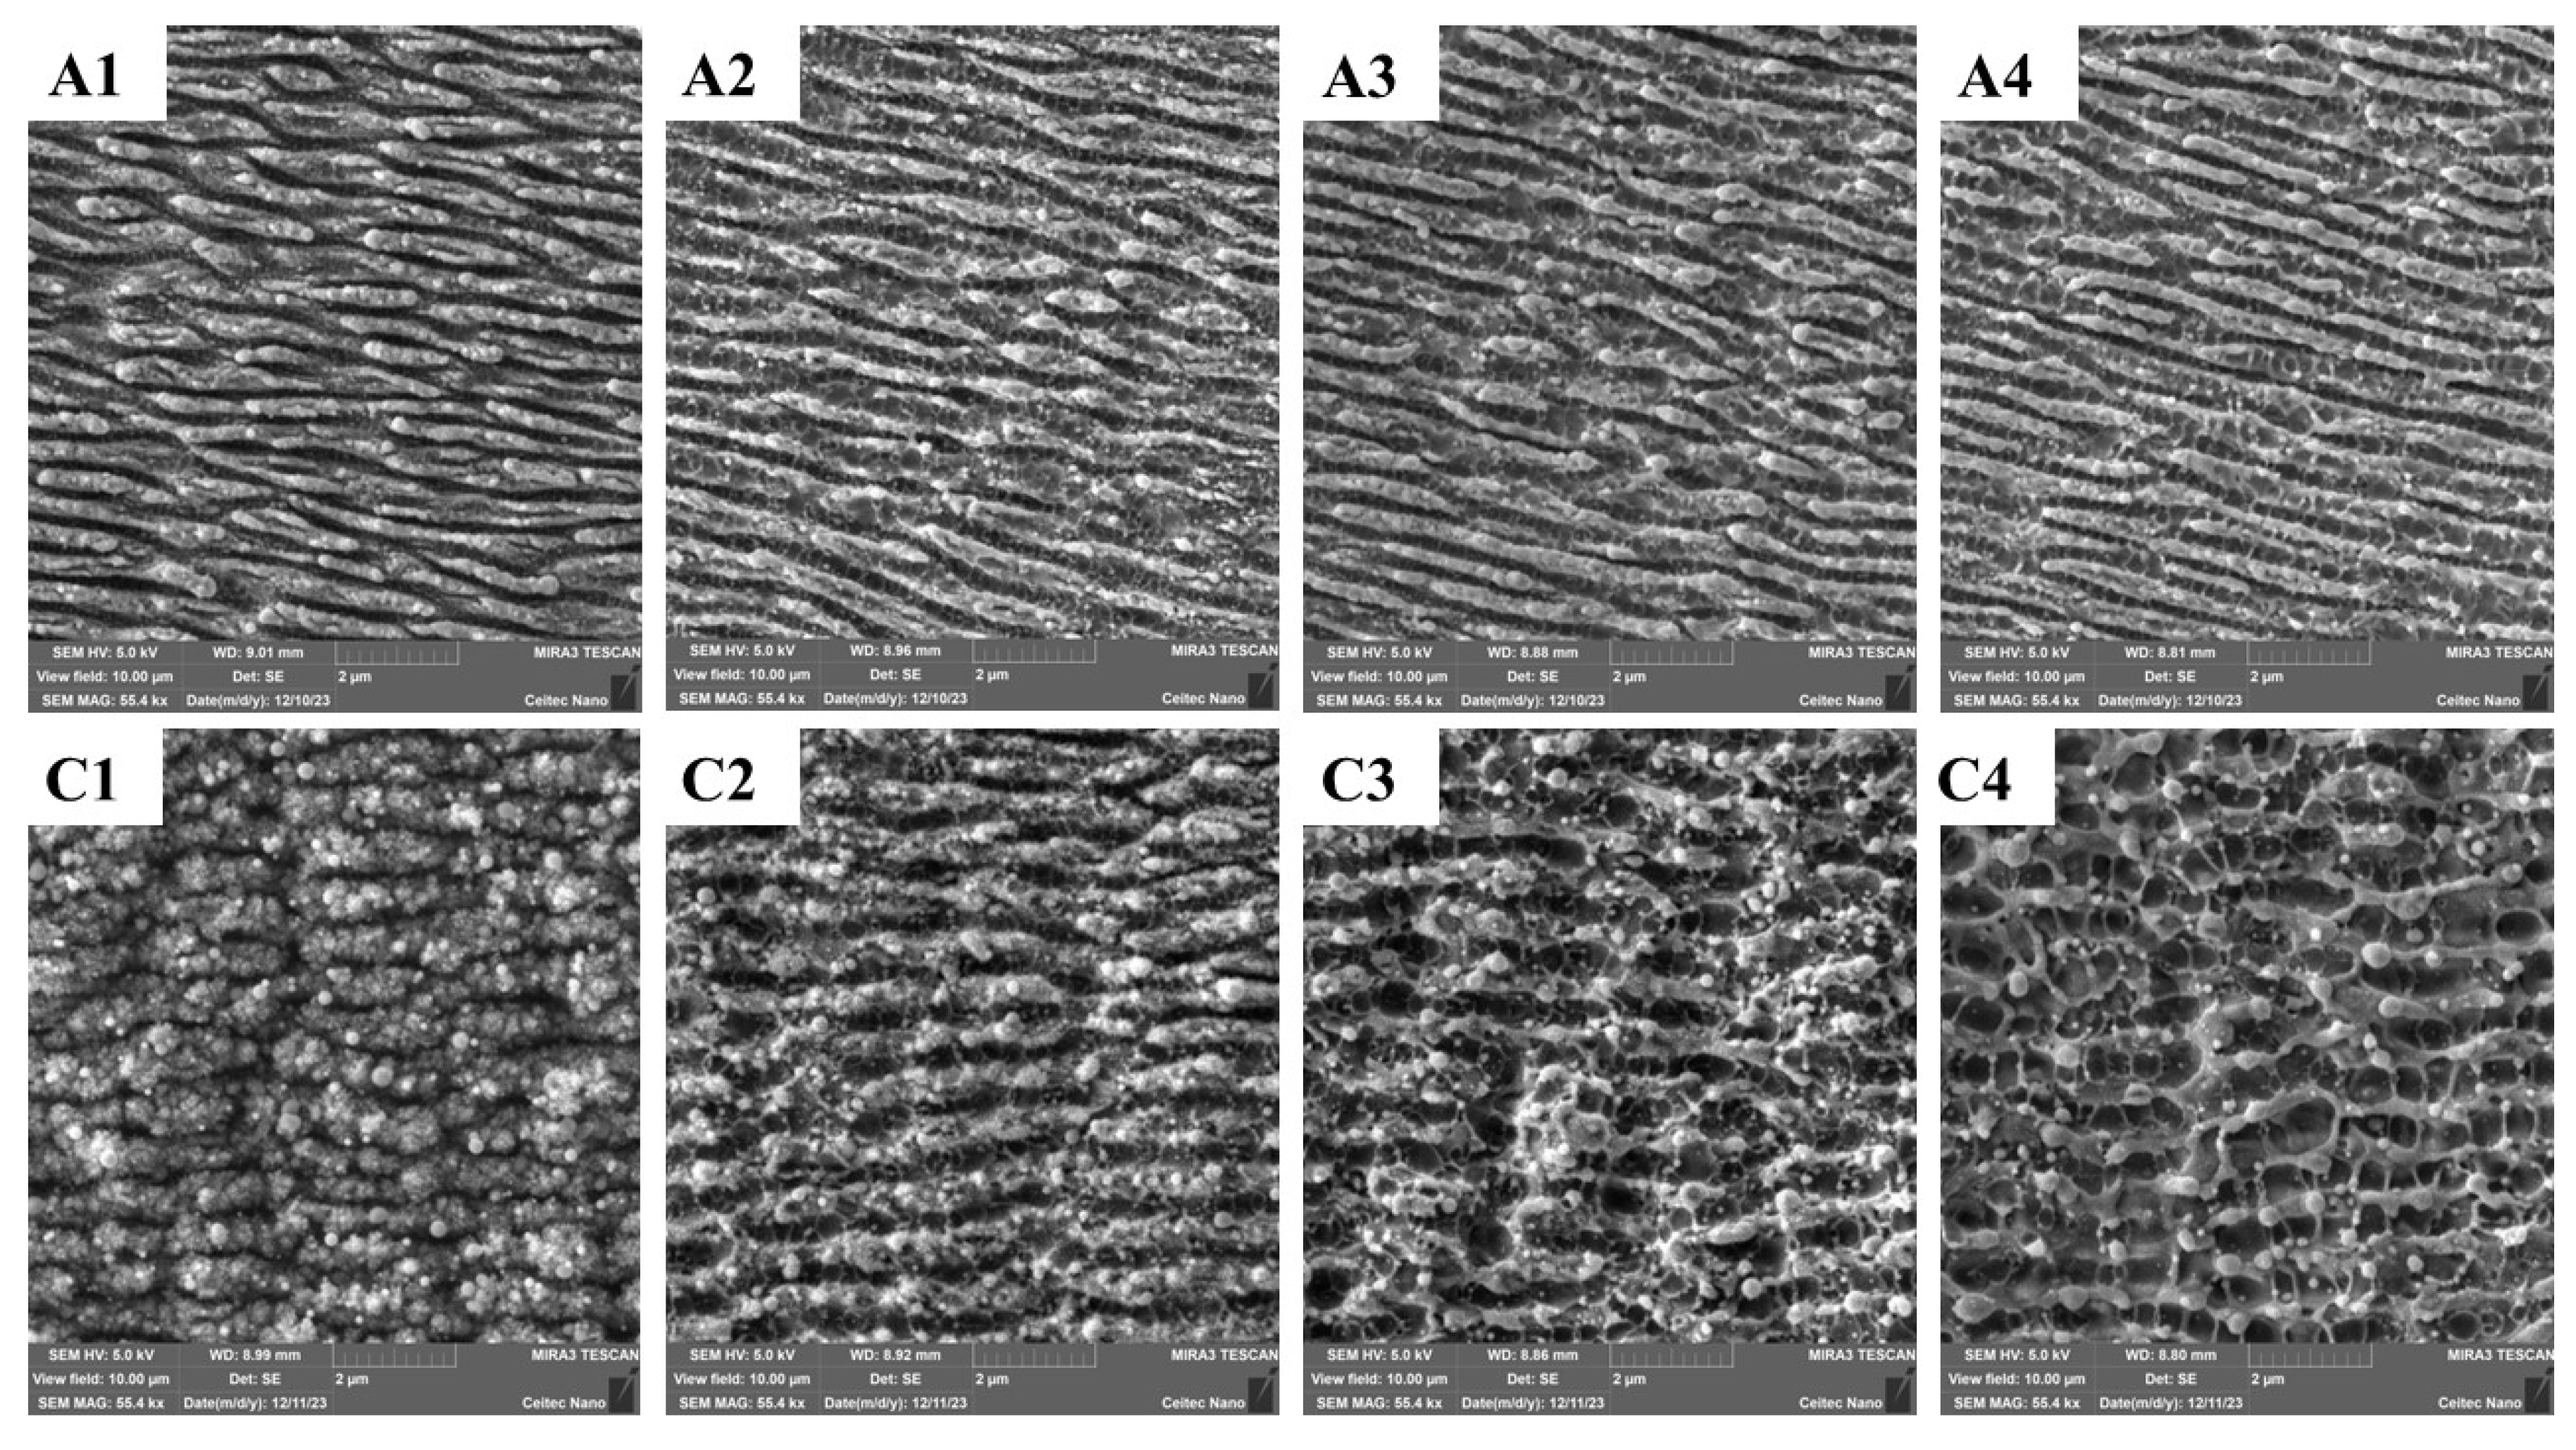
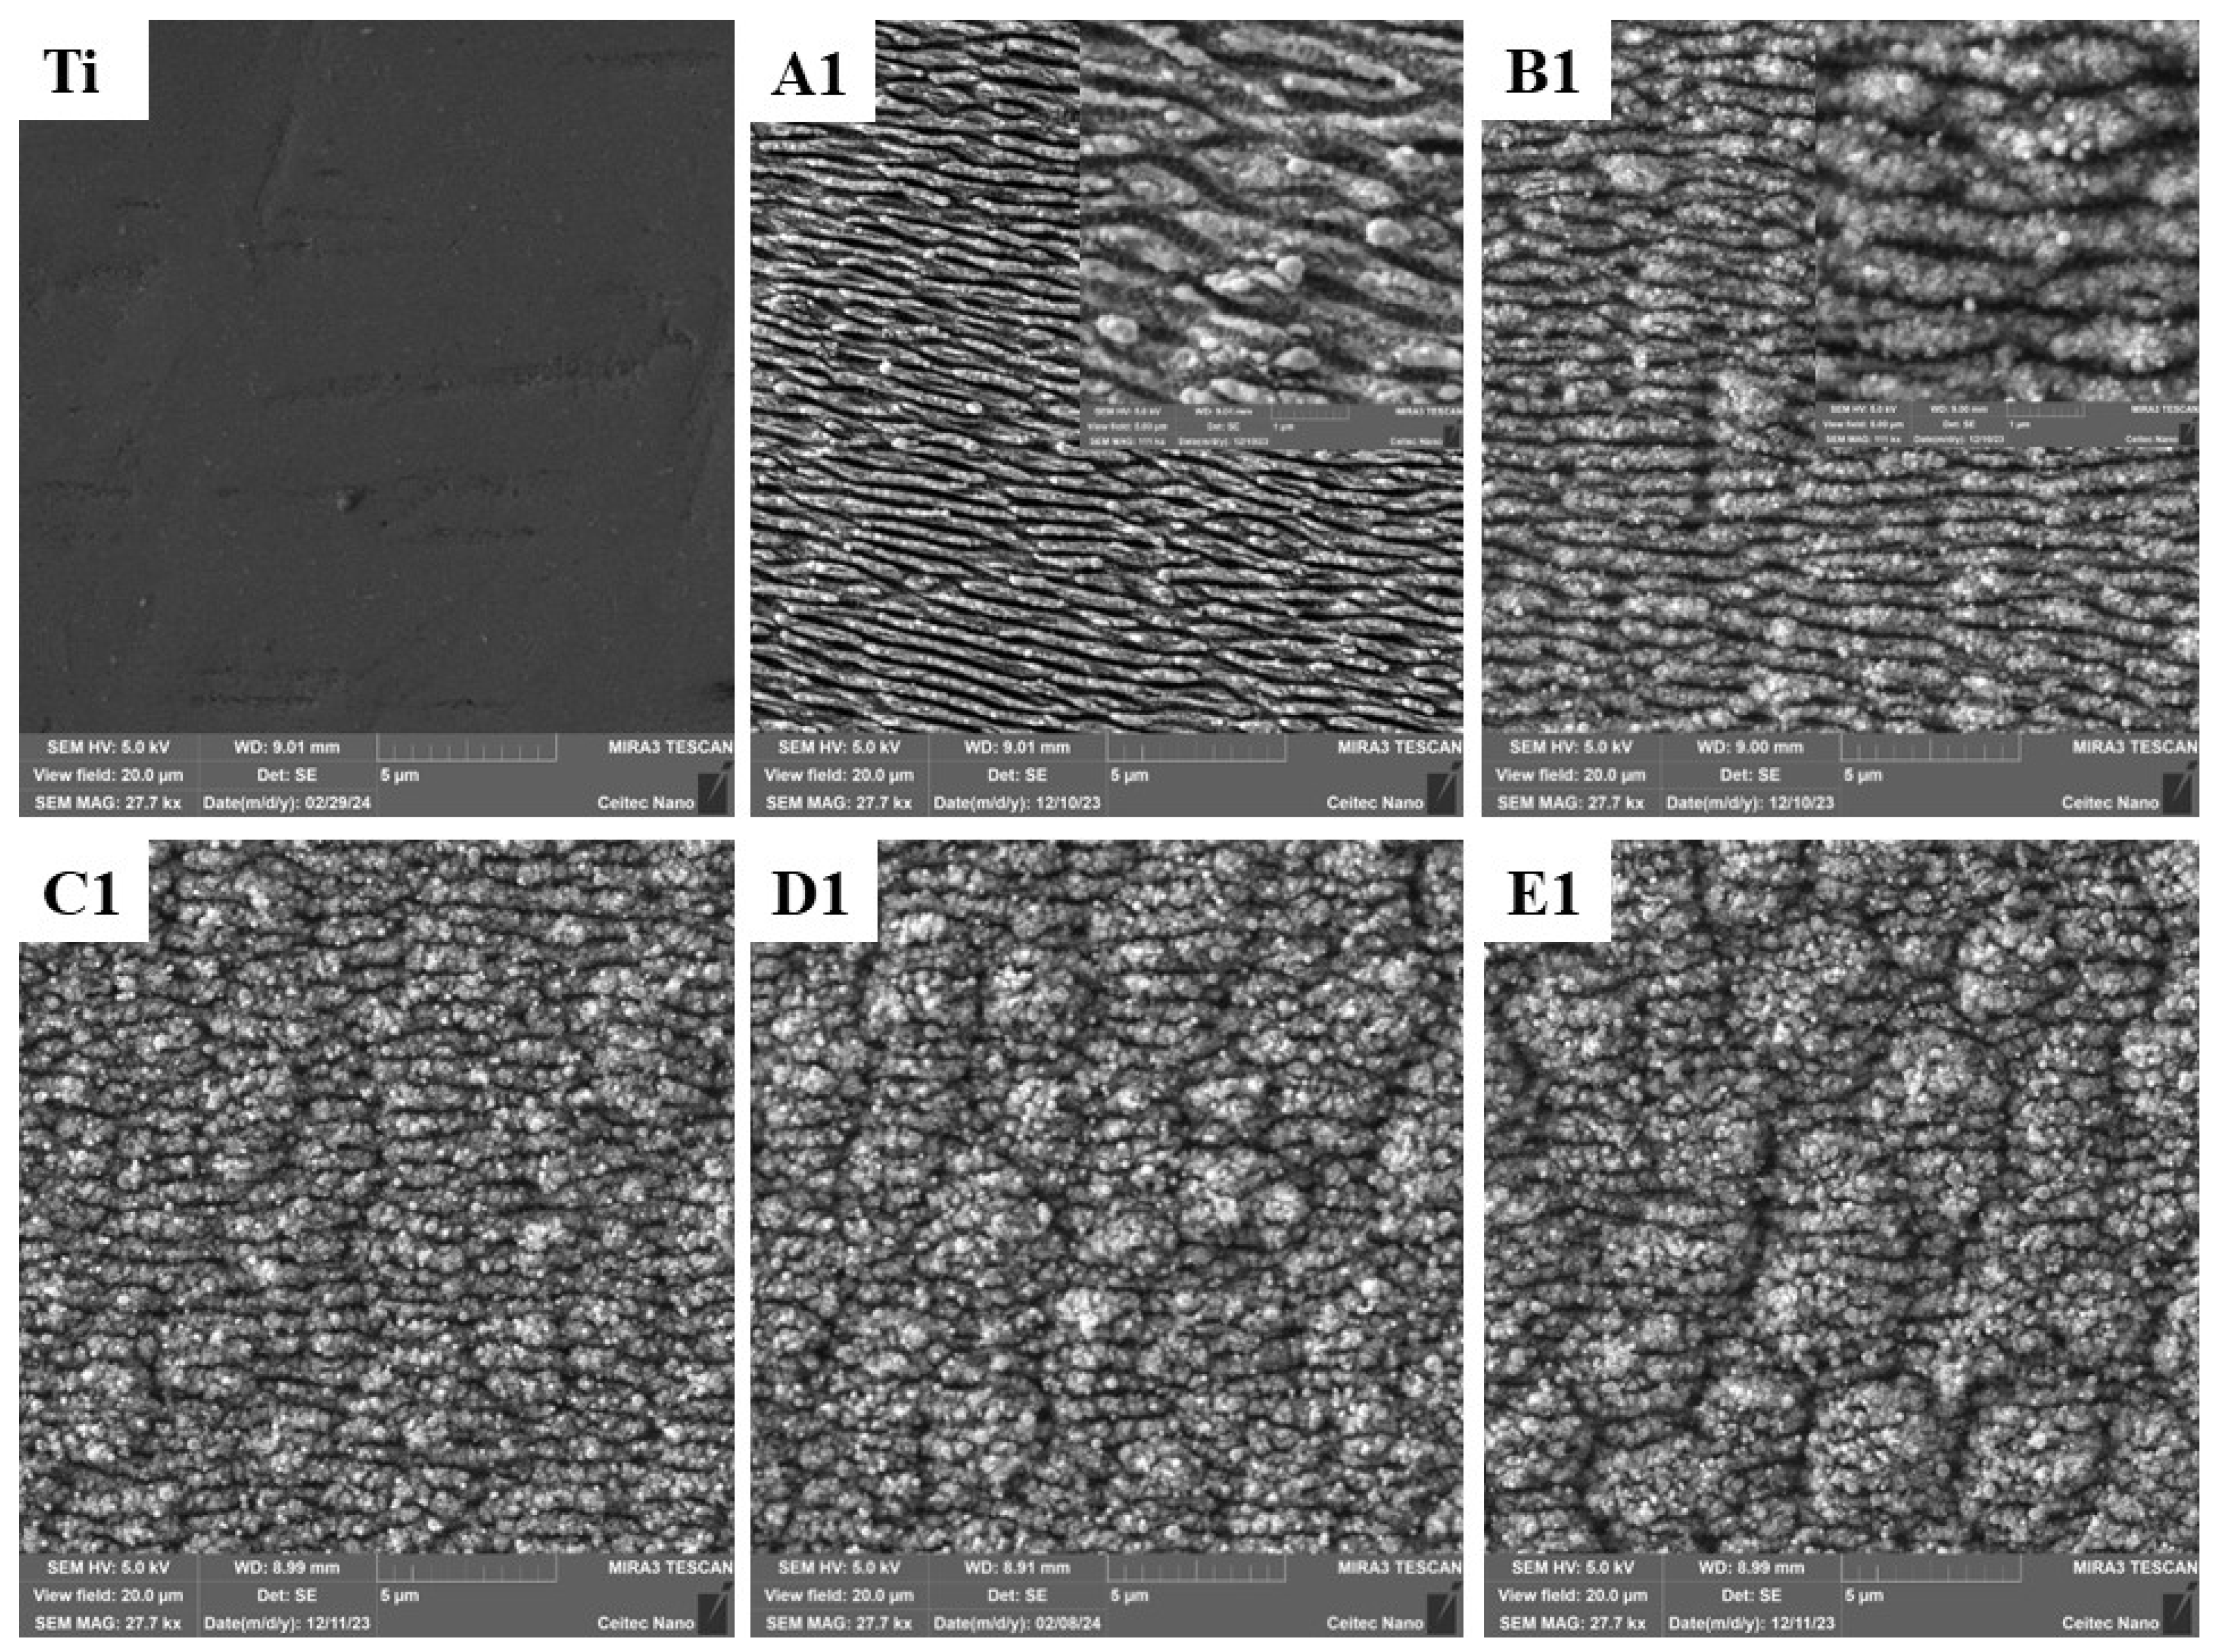
3.1. Morphology of the Laser-Processed Surfaces
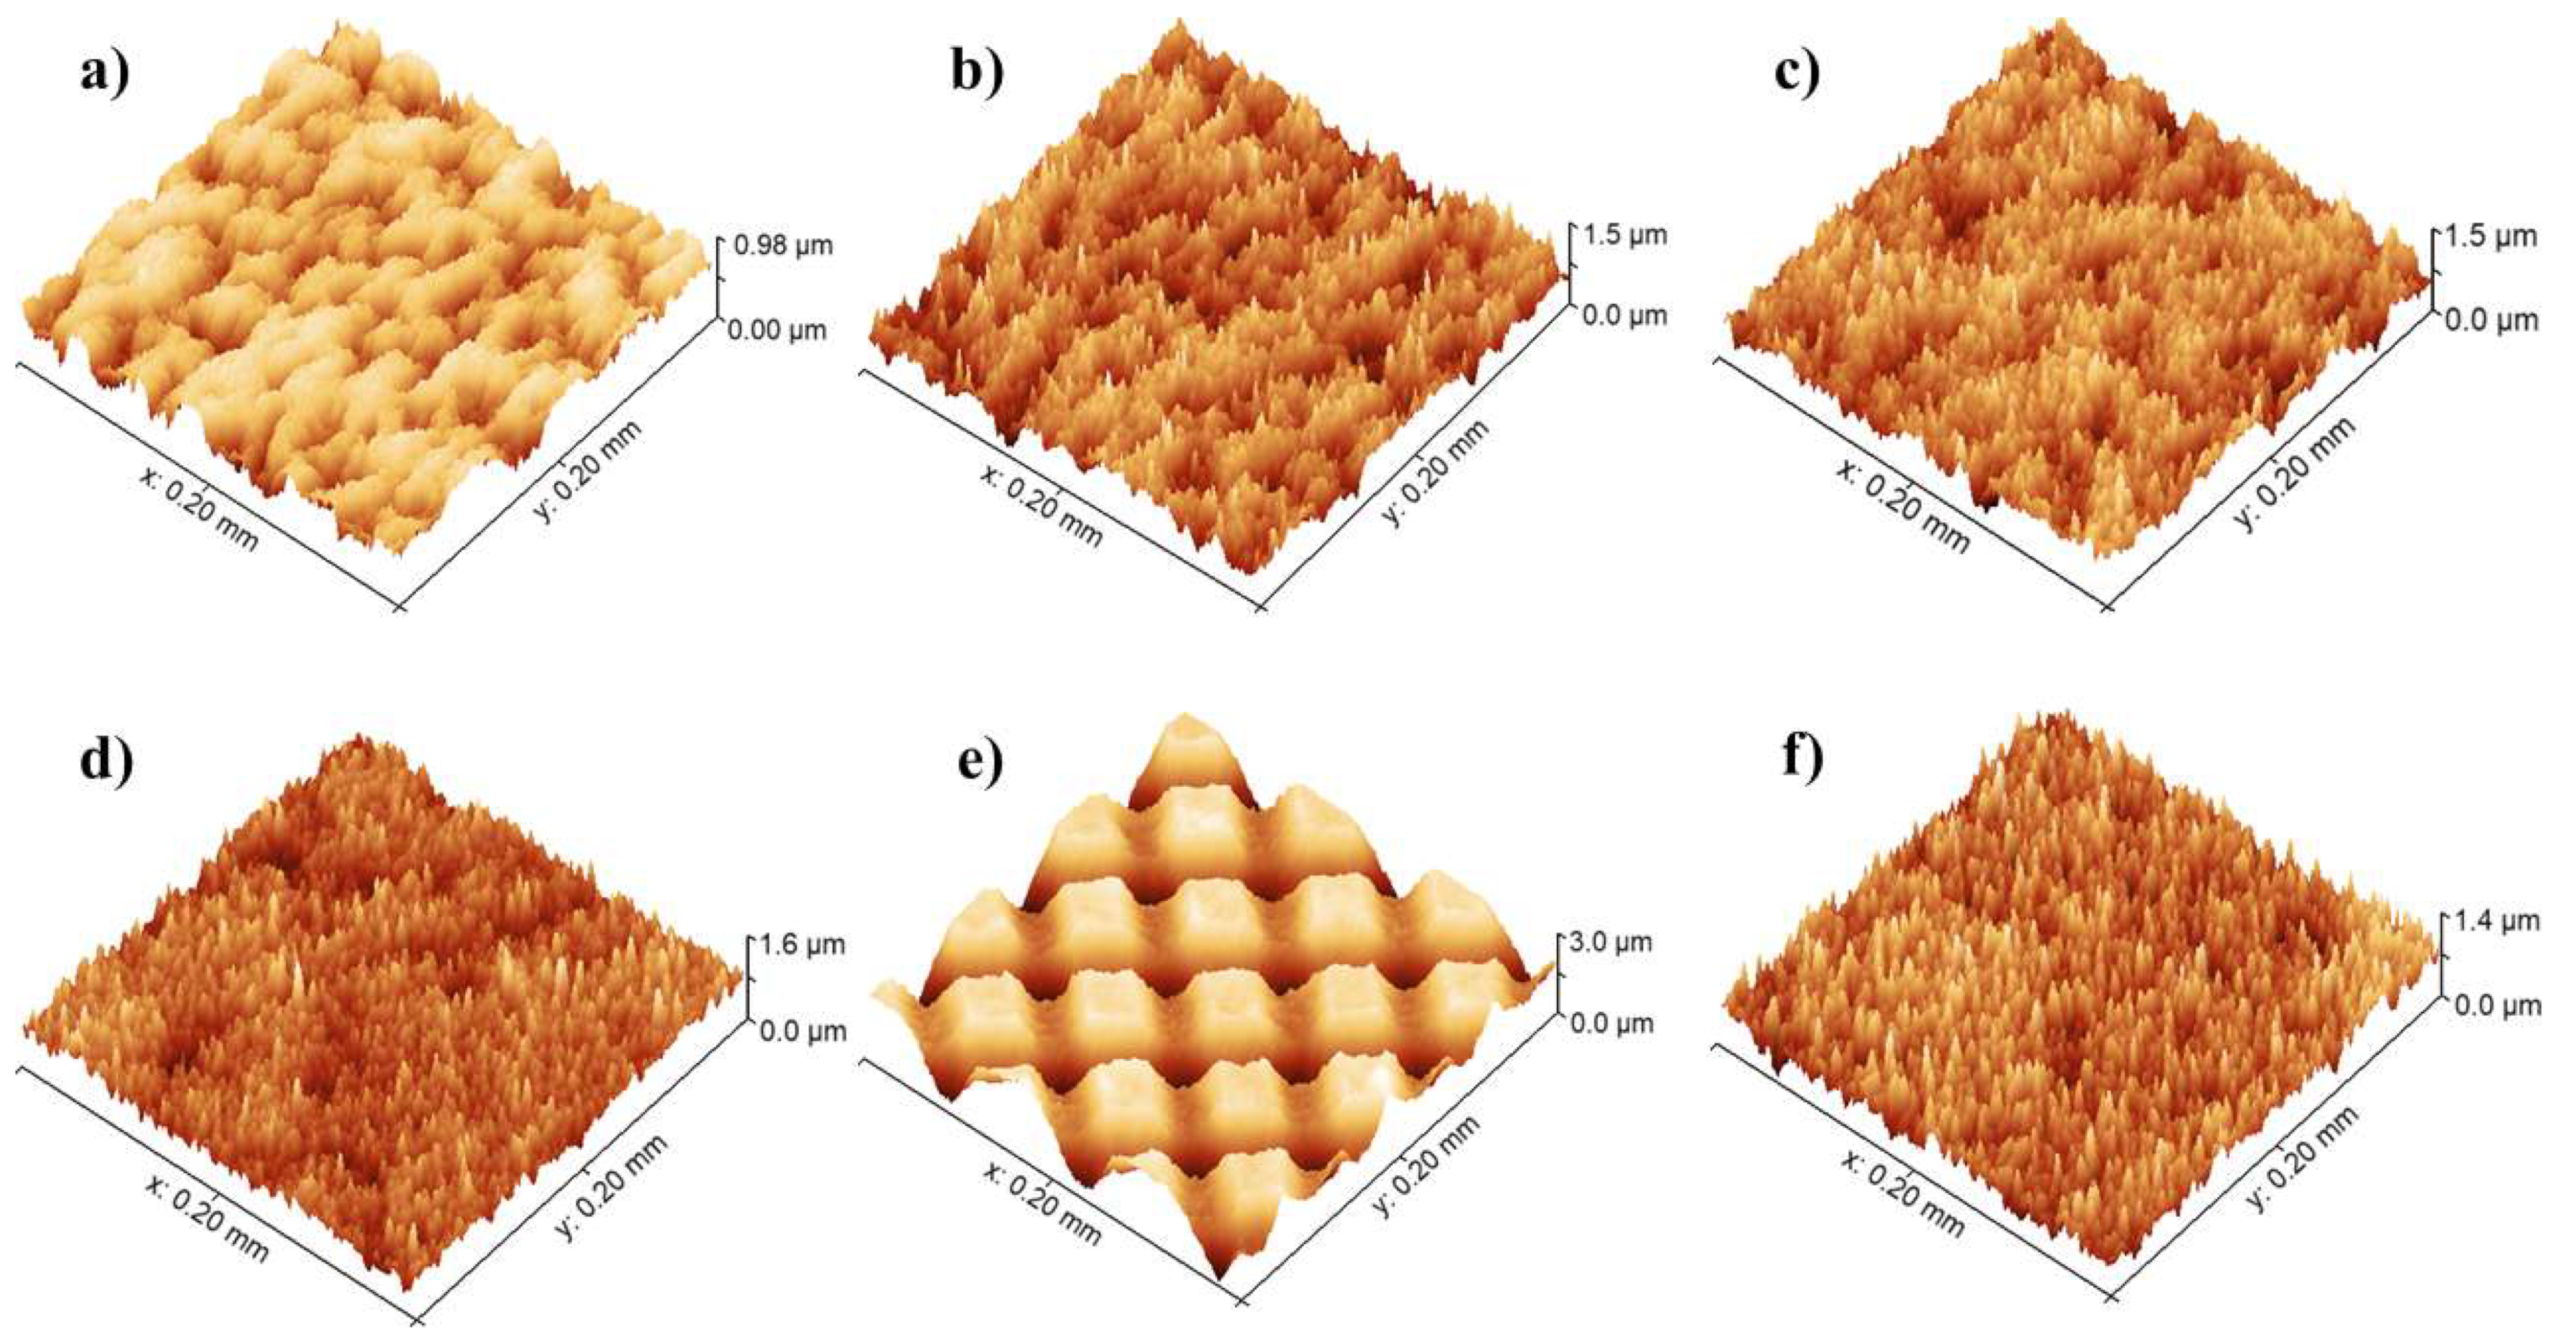
3.2. Topographical Analysis of Laser-Structured Surfaces
3.3. EDX Analysis
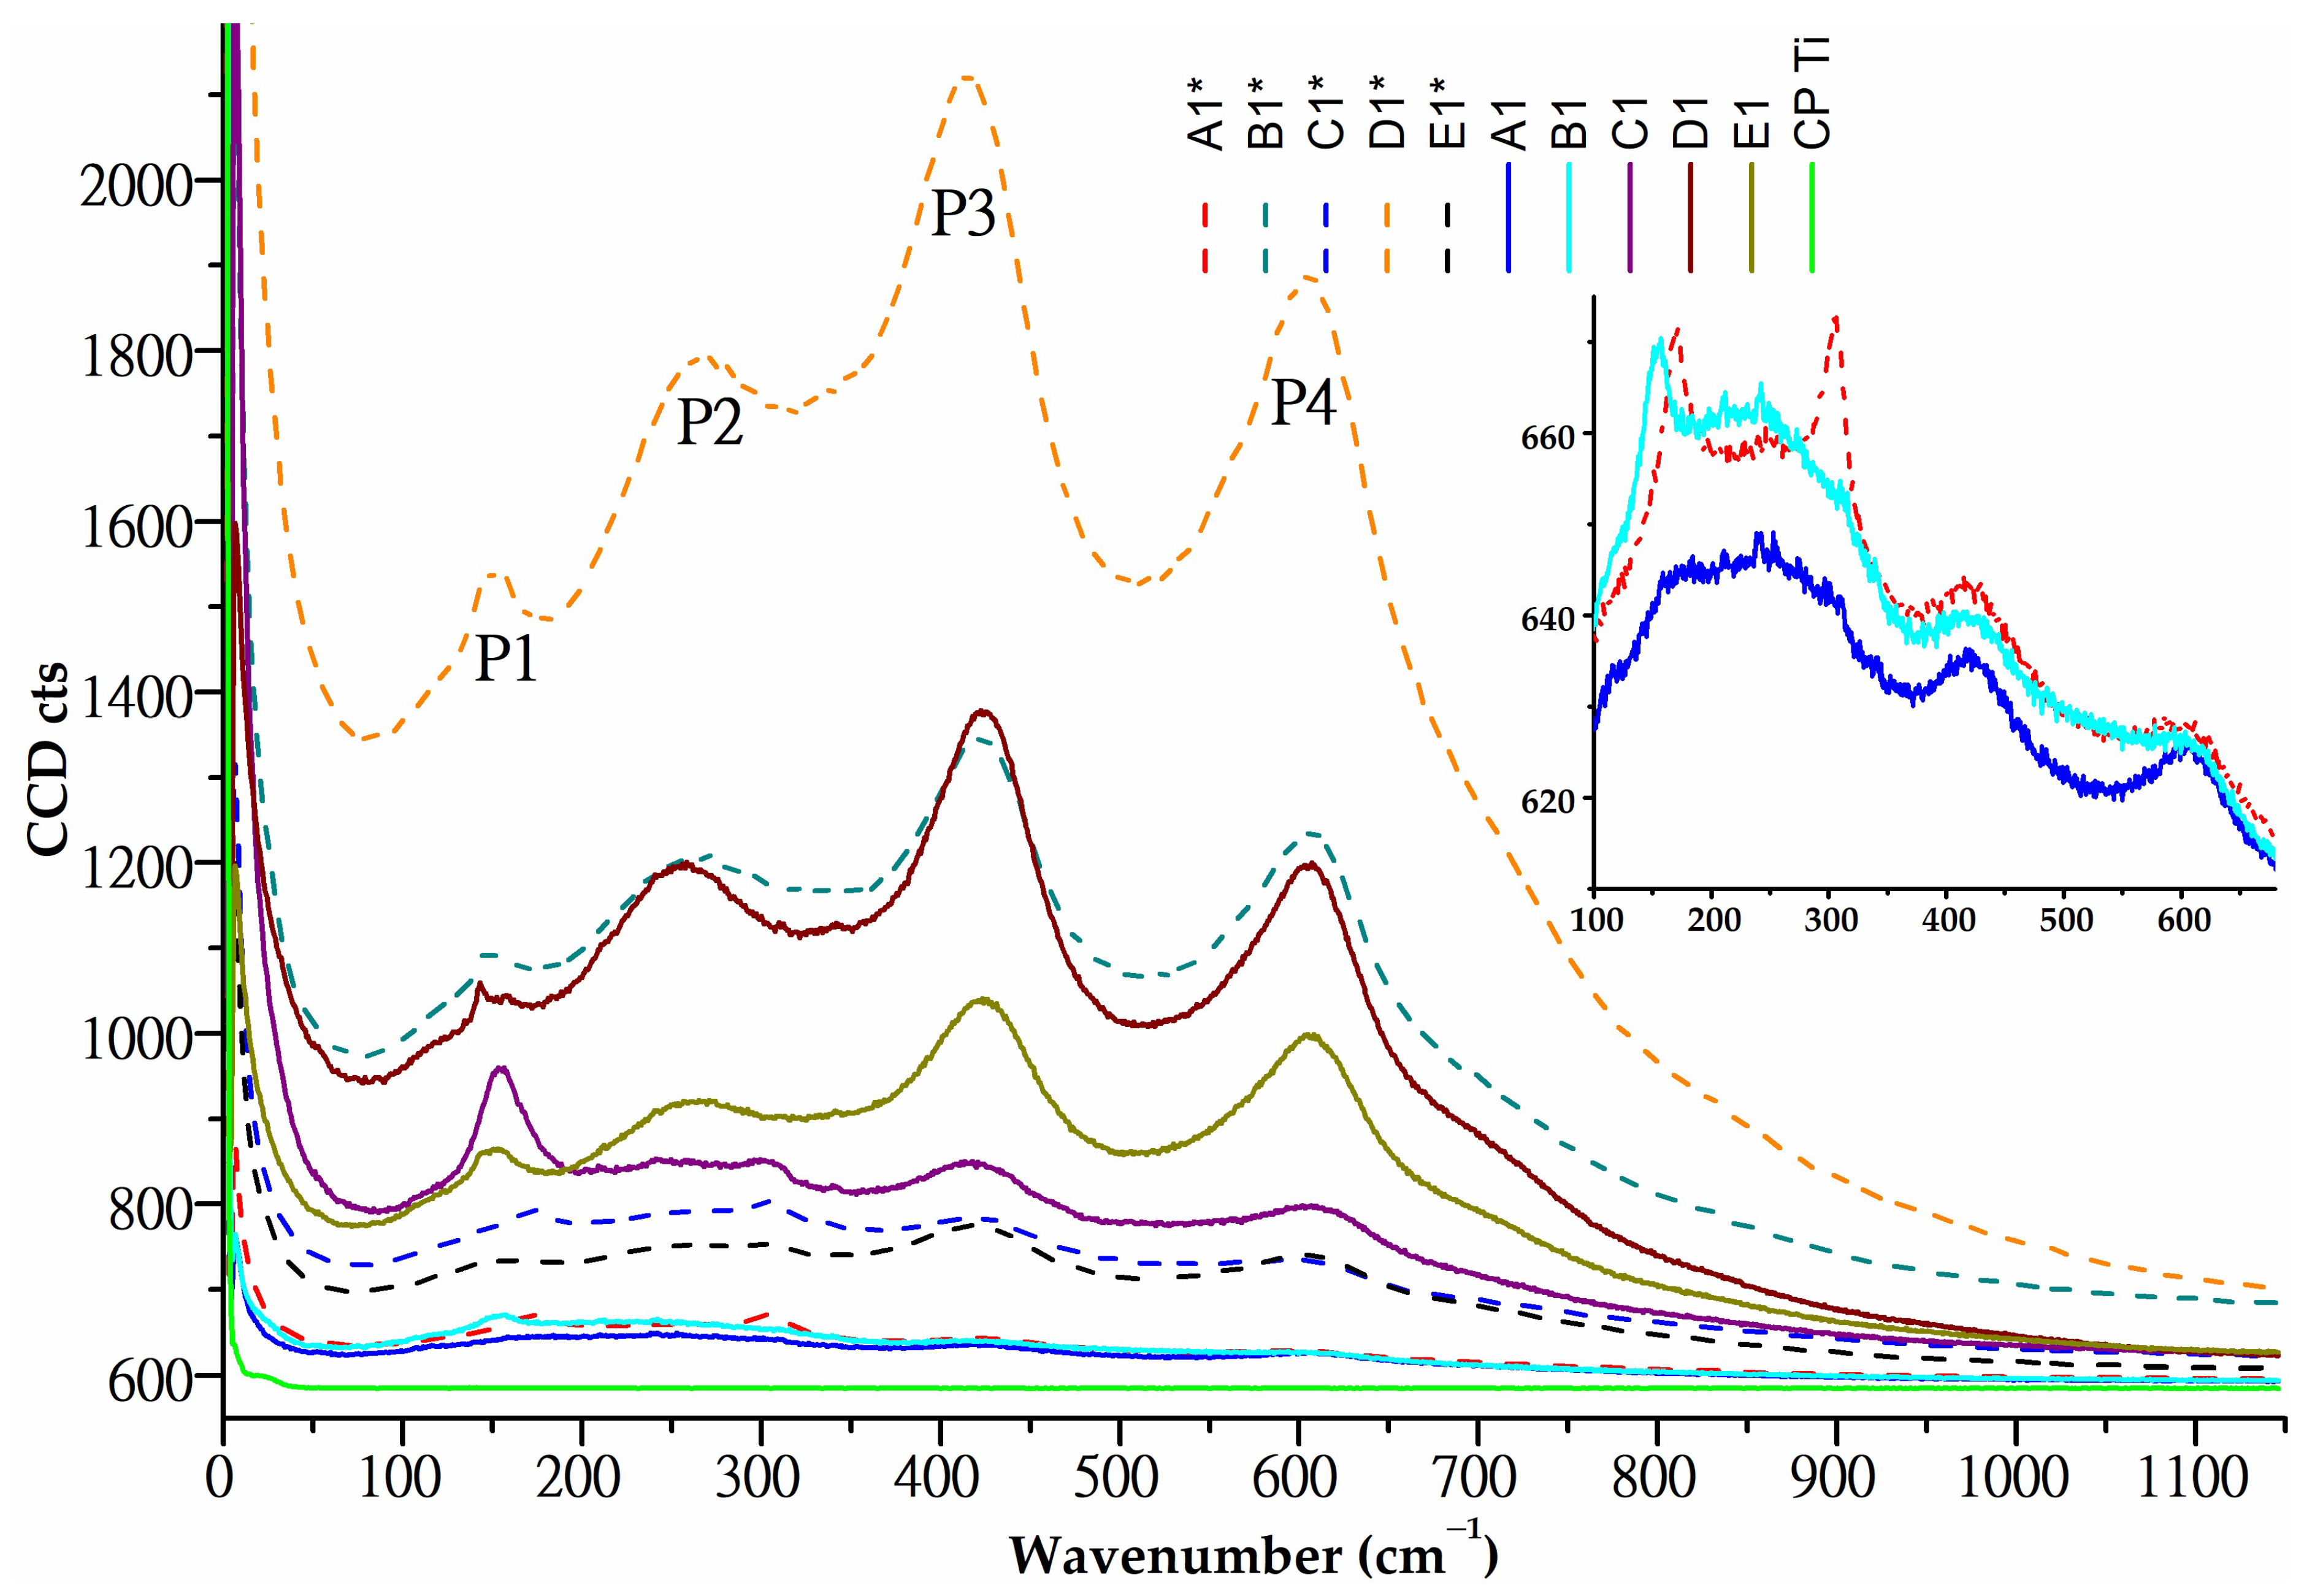
3.4. Raman Analysis
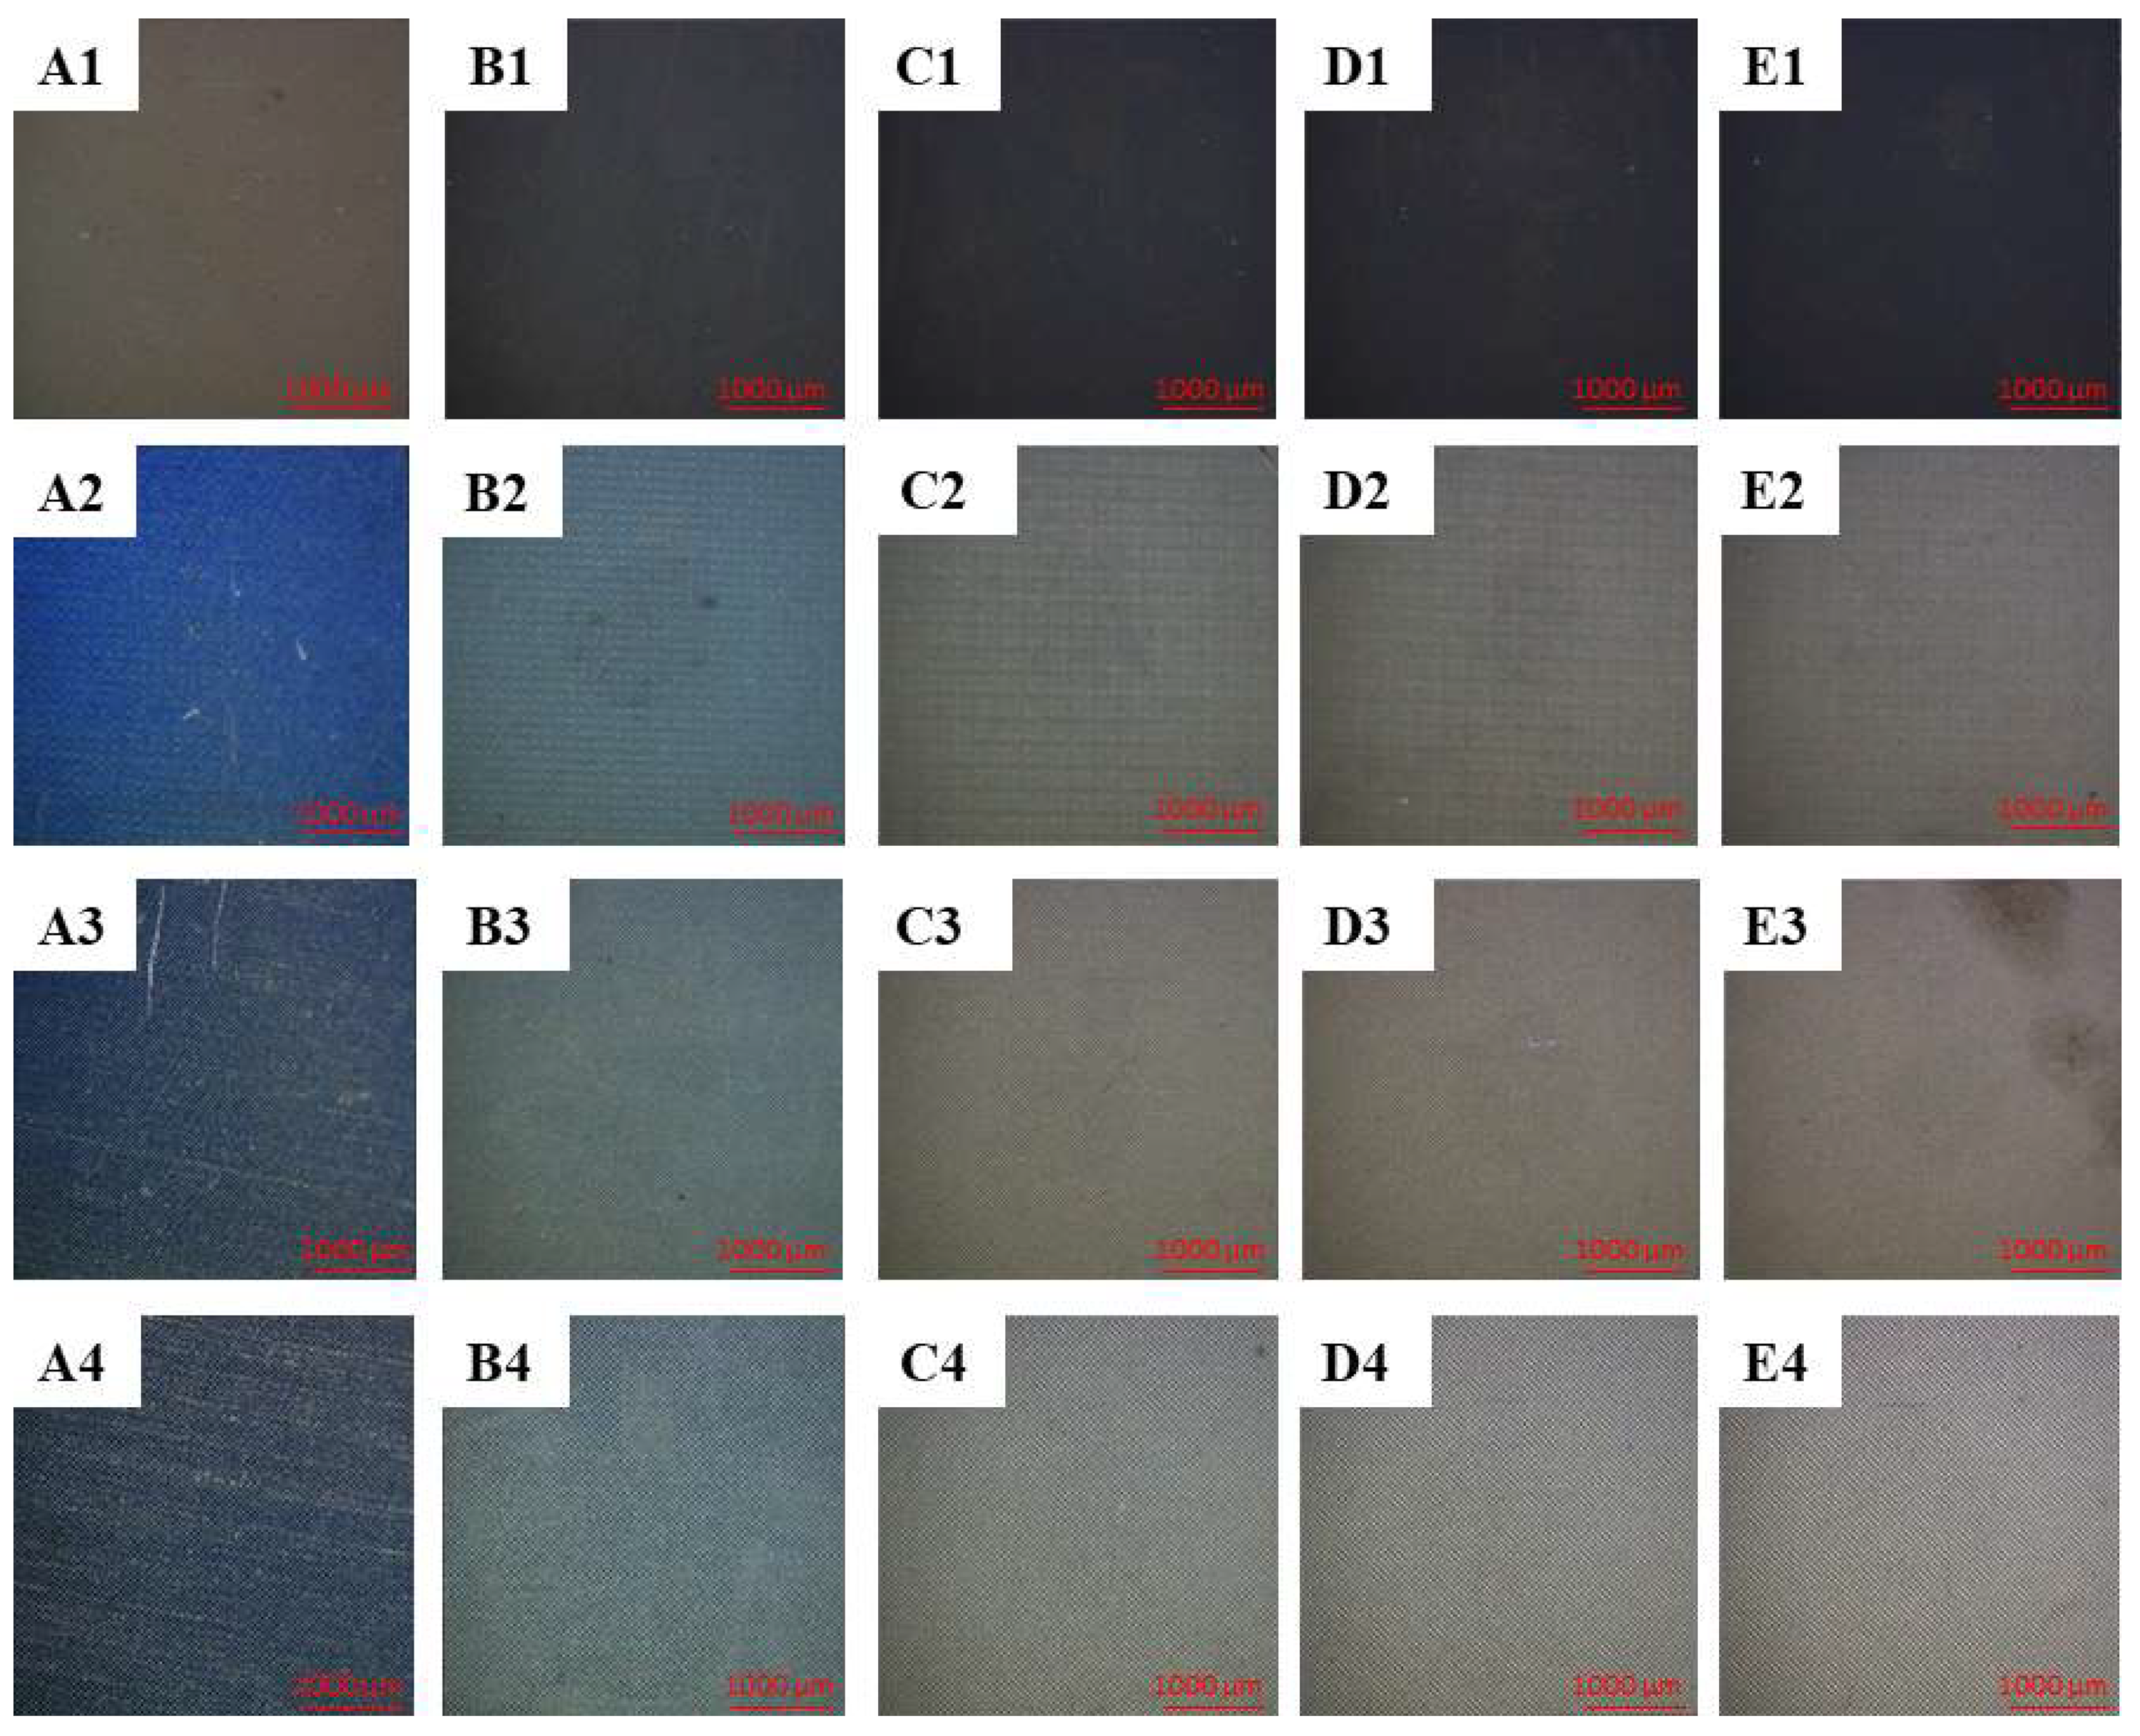
3.5. Optical Observations of the Laser-Structured Surfaces
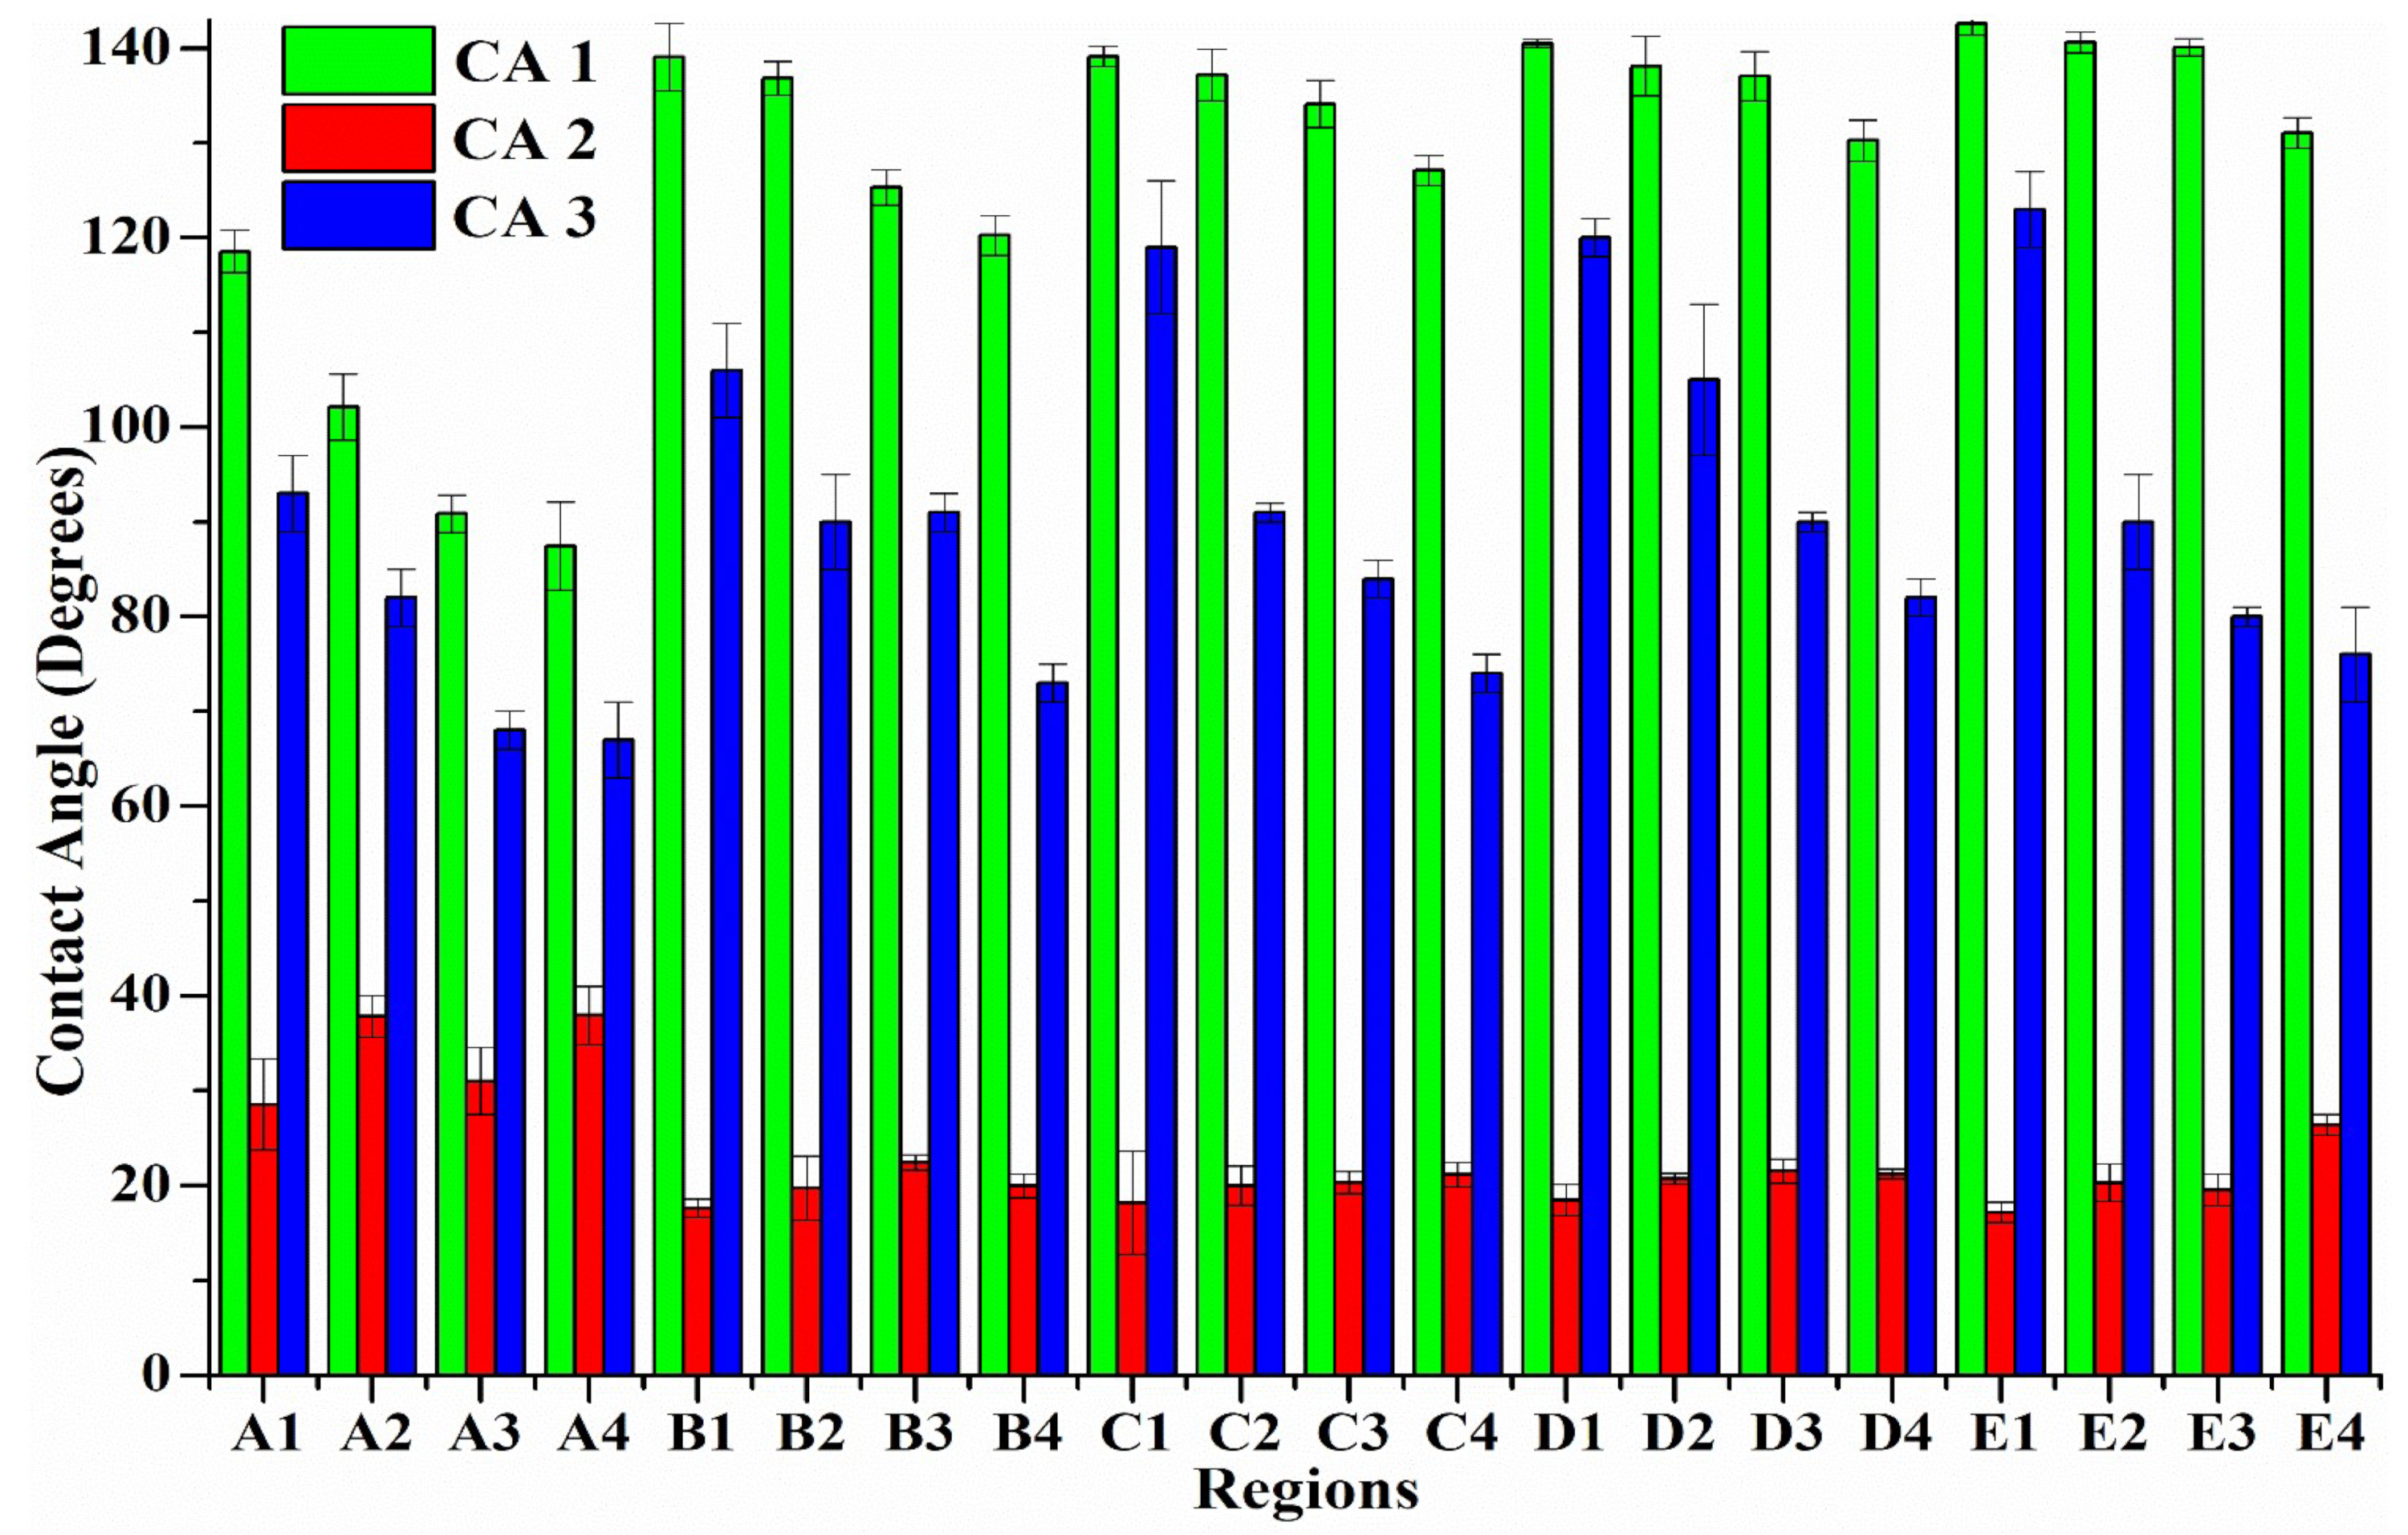
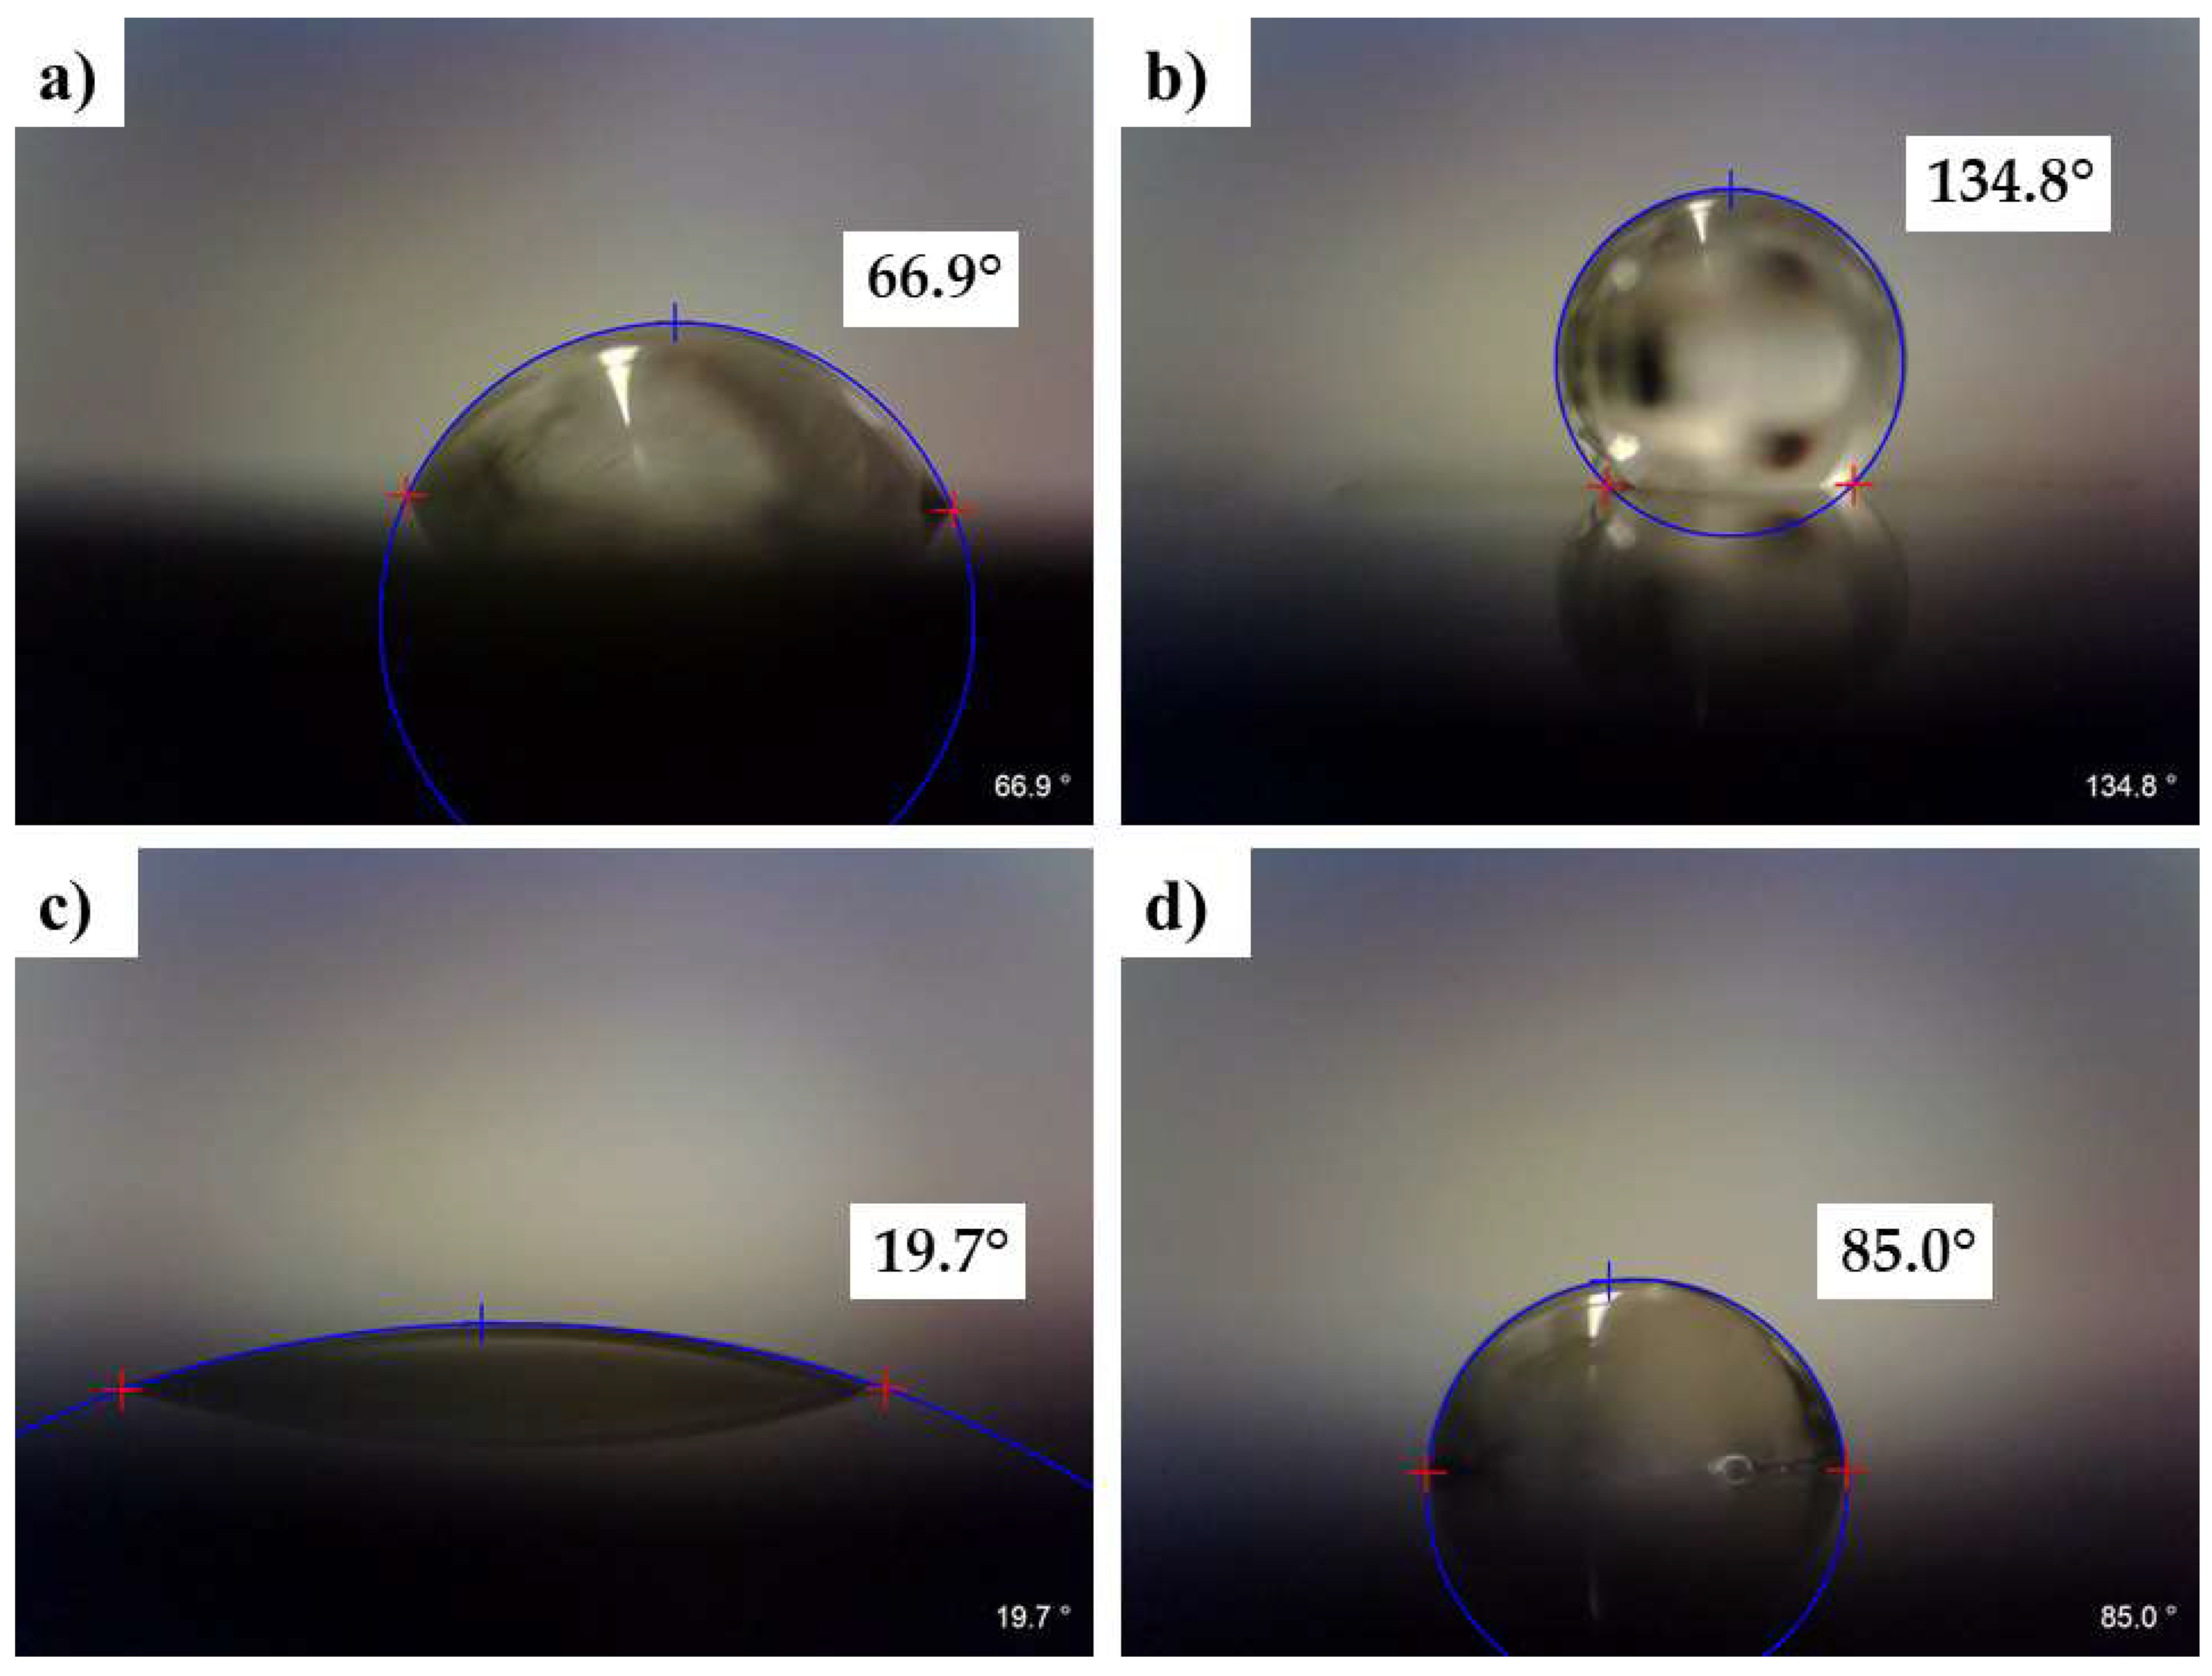
3.6. Wettability Analysis on the Laser-Treated Surfaces
4. Conclusions
Supplementary Materials
Author Contributions
Funding
Institutional Review Board Statement
Informed Consent Statement
Data Availability Statement
Acknowledgments
Conflicts of Interest
References
- Ronoh, K.; Mwema, F.; Dabees, S.; Sobola, D. Advances in sustainable grinding of different types of the titanium biomaterials for medical applications: A review. Biomed. Eng. Adv. 2022, 4, 100047. [Google Scholar] [CrossRef]
- Milovanović, D.; Rajčić, B.; Petronić, S.; Radulović, A.; Radak, B.; Gaković, B.; Zamfirescu, M.; Albu, C.; Savović, J. Comprehensive ablation study of near-IR femtosecond laser action on the titanium-based alloy Ti6Al4V: Morphological effects and surface structures at low and high fluences. Eur. Phys. J. D 2022, 76, 2. [Google Scholar] [CrossRef]
- Haase, F.; Siemers, C.; Rösler, J. Laser powder bed fusion (LPBF) of commercially pure titanium and alloy development for the LPBF process. Front. Bioeng. Biotechnol. 2023, 11, 1260925. [Google Scholar] [CrossRef] [PubMed]
- Fella, C.; Abida, B.; Samira, B.; El-Hadi, B.; Samia, A. Effects of Pulsed Laser Irradiation on Commercially Pure Titanium: Mechanical Properties and Corrosion Resistance in a Salty Environment. Surf. Eng. Appl. Electrochem. 2023, 59, 378–383. [Google Scholar] [CrossRef]
- Exir, H.; Weck, A. Mechanism of superhydrophilic to superhydrophobic transition of femtosecond laser-induced periodic surface structures on titanium. Surf. Coatings Technol. 2019, 378, 124931. [Google Scholar] [CrossRef]
- Ronoh, K.N.; Mwema, F.M.; Akinlabi, S.A.; Akinlabi, E.T.; Karuri, N.W.; Ngetha, H.T. Effects of cooling conditions and grinding depth on sustainable surface grinding of Ti-6Al-4V: Taguchi approach. AIMS Mater. Sci. 2019, 6, 697–712. [Google Scholar] [CrossRef]
- Antończak, A.J.; Stępak, B.; Kozioł, P.E.; Abramski, K.M. The influence of process parameters on the laser-induced coloring of titanium. Appl. Phys. A 2014, 115, 1003–1013. [Google Scholar] [CrossRef]
- Hulka, I.; Florido-Suarez, N.R.; Mirza-Rosca, J.C.; Saceleanu, A. Mechanical Properties and Corrosion Behavior of Thermally Treated Ti-6Al-7Nb Dental Alloy. Materials 2022, 15, 3813. [Google Scholar] [CrossRef] [PubMed]
- Dou, H.-Q.; Liu, H.; Xu, S.; Chen, Y.; Miao, X.; Lü, H.; Jiang, X. Influence of laser fluences and scan speeds on the morphologies and wetting properties of titanium alloy. Optik 2020, 224, 165443. [Google Scholar] [CrossRef]
- Yilbas, B.; Ali, H.; Al-Sharafi, A.; Al-Qahtani, H. Laser processing of Ti6Al4V alloy: Wetting state of surface and environmental dust effects. Heliyon 2019, 5, e01211. [Google Scholar] [CrossRef]
- Weng, W.-X.; Deng, Q.-W.; Yang, P.-Y.; Yin, K. Femtosecond laser-chemical hybrid processing for achieving substrate-independent superhydrophobic surfaces. J. Central South Univ. 2024, 31, 1–10. [Google Scholar] [CrossRef]
- Kuczyńska-Zemła, D.; Sotniczuk, A.; Pisarek, M.; Chlanda, A.; Garbacz, H. Corrosion behavior of titanium modified by direct laser interference lithography. Surf. Coatings Technol. 2021, 418, 127219. [Google Scholar] [CrossRef]
- Wang, Y.; Chen, J.; Yang, Y.; Liu, Z.; Wang, H.; He, Z. Nanostructured Superhydrophobic Titanium-Based Materials: A Novel Preparation Pathway to Attain Superhydrophobicity on TC4 Alloy. Nanomaterials 2022, 12, 2086. [Google Scholar] [CrossRef] [PubMed]
- Kümmel, D.; Linsler, D.; Schneider, R.; Schneider, J. Surface engineering of a titanium alloy for tribological applications by nanosecond-pulsed laser. Tribol. Int. 2020, 150, 106376. [Google Scholar] [CrossRef]
- Lian, Z.; Xu, J.; Yu, Z.; Yu, P.; Ren, W.; Wang, Z.; Yu, H. Bioinspired Reversible Switch between Underwater Superoleophobicity/Superaerophobicity and Oleophilicity/Aerophilicity and Improved Antireflective Property on the Nanosecond Laser-Ablated Superhydrophobic Titanium Surfaces. ACS Appl. Mater. Interfaces 2020, 12, 6573–6580. [Google Scholar] [CrossRef]
- Simões, I.G.; dos Reis, A.C.; Valente, M.L.d.C. Influence of surface treatment by laser irradiation on bacterial adhesion on surfaces of titanium implants and their alloys: Systematic review. Saudi Dent. J. 2023, 35, 111–124. [Google Scholar] [CrossRef] [PubMed]
- Vanithakumari, S.C.; Kumar, C.A.; Thinaharan, C.; Kishor, G.R.; George, R.P.; Kaul, R.; Bindra, K.S.; Philip, J. Laser patterned titanium surfaces with superior antibiofouling, superhydrophobicity, self-cleaning and durability: Role of line spacing. Surf. Coatings Technol. 2021, 418, 127257. [Google Scholar] [CrossRef]
- Ahmmed, K.M.T.; Grambow, C.; Kietzig, A.-M. Fabrication of Micro/Nano Structures on Metals by Femtosecond Laser Micromachining. Micromachines 2014, 5, 1219–1253. [Google Scholar] [CrossRef]
- Yu, Z.; Yin, S.; Zhang, W.; Jiang, X.; Hu, J. Picosecond laser texturing on titanium alloy for biomedical implants in cell proliferation and vascularization. J. Biomed. Mater. Res. Part B Appl. Biomater. 2020, 108, 1494–1504. [Google Scholar] [CrossRef]
- Li, Y.; Qian, J.; Bai, F.; Wang, Z.; Wang, C.; Fan, W.; Zhang, Y.; Zhao, Q. Azimuthal angle- and scanning pitch-dependent colorization of metals by ultrashort laser pulses. Appl. Phys. A 2016, 122, 282. [Google Scholar] [CrossRef]
- Li, G.; Li, J.; Hu, Y.; Zhang, C.; Li, X.; Chu, J.; Huang, W. Femtosecond laser color marking stainless steel surface with different wavelengths. Appl. Phys. A 2015, 118, 1189–1196. [Google Scholar] [CrossRef]
- Zhu, H.; Ehrhardt, M.; Lorenz, P.; Zajadacz, J.; Lu, J.; Zimmer, K. Combined effects of nanosecond laser-induced surface oxidation and nanostructure formation for selective colorization of nickel surfaces. Appl. Phys. A 2019, 125, 701. [Google Scholar] [CrossRef]
- Vorobyev, A.Y.; Guo, C. Multifunctional surfaces produced by femtosecond laser pulses. J. Appl. Phys. 2015, 117, 033103. [Google Scholar] [CrossRef]
- Vorobyev, A.Y.; Guo, C. Direct femtosecond laser surface nano/microstructuring and its applications. Laser Photonics Rev. 2013, 7, 385–407. [Google Scholar] [CrossRef]
- Hermens, U.; Kirner, S.; Emonts, C.; Comanns, P.; Skoulas, E.; Mimidis, A.; Mescheder, H.; Winands, K.; Krüger, J.; Stratakis, E.; et al. Mimicking lizard-like surface structures upon ultrashort laser pulse irradiation of inorganic materials. Appl. Surf. Sci. 2017, 418, 499–507. [Google Scholar] [CrossRef]
- Dusser, B.; Sagan, Z.; Soder, H.; Faure, N.; Colombier, J.; Jourlin, M.; Audouard, E. Controlled nanostructrures formation by ultra fast laser pulses for color marking. Opt. Express 2010, 18, 2913–2924. [Google Scholar] [CrossRef] [PubMed]
- Barmina, E.V.; Stratakis, E.; Fotakis, K.; Shafeev, G.A. Generation of nanostructures on metals by laser ablation in liquids: New results. Quantum Electron. 2010, 40, 1012–1020. [Google Scholar] [CrossRef]
- Ronoh, K.; Novotný, J.; Mrňa, L.; Knápek, A.; Sobola, D. Effects of laser and scanning parameters on surface modification of MONEL® alloy 400 by picosecond laser. Opt. Laser Technol. 2024, 172, 110514. [Google Scholar] [CrossRef]
- Mohamed, A.M.A.; Abdullah, A.M.; Younan, N.A. Corrosion behavior of superhydrophobic surfaces: A review. Arab. J. Chem. 2015, 8, 749–765. [Google Scholar] [CrossRef]
- Rao, Q.; Weng, L.; Zhang, J.; Liu, D.; Zhang, W.; Chen, S.; Chen, J.; Li, X.; Qiu, H.; Cao, Y.; et al. Research Progress in Superhydrophobic Titanium-Based Implants for Antibacterial Applications. Coatings 2023, 13, 419. [Google Scholar] [CrossRef]
- Ronoh, K.; Sobola, D.; Mrňa, L.; Novotný, J.; Dallaev, R.; Knápek, A.; Kolařík, V.; Holcman, V. Characterization of the picosecond laser-ablated HOPG using Raman spectroscopy and SEM microscopy. Mater. Today Commun. 2023, 34, 105181. [Google Scholar] [CrossRef]
- Ronoh, K.N.; Novotný, J.; Mrňa, L.; Knápek, A.; Sobola, D. Analysis of processing efficiency, surface, and bulk chemistry, and nanomechanical properties of the Monel® alloy 400 after ultrashort pulsed laser ablation. Mater. Res. Express 2024, 11, 016514. [Google Scholar] [CrossRef]
- Cunha, A.; Serro, A.P.; Oliveira, V.; Almeida, A.; Vilar, R.; Durrieu, M.-C. Wetting behaviour of femtosecond laser textured Ti–6Al–4V surfaces. Appl. Surf. Sci. 2013, 265, 688–696. [Google Scholar] [CrossRef]
- Arasteh-Khoshbin, O.; Seyedpour, S.M.; Ricken, T. The effect of Caspian Sea water on mechanical properties and durability of concrete containing rice husk ash, nano SiO2, and nano Al2O3. Sci. Rep. 2022, 12, 20202. [Google Scholar] [CrossRef] [PubMed]
- Tuzhilkin, V.S.; Katunin, D.N.; Nalbandov, Y.R. Natural Chemistry of Caspian Sea Waters. In The Caspian Sea Environment; Springer: Berlin/Heidelberg, Germany, 2005; pp. 83–108. [Google Scholar] [CrossRef]
- Li, D.; Neumann, A. Equation of state for interfacial tensions of solid-liquid systems. Adv. Colloid Interface Sci. 1992, 39, 299–345. [Google Scholar] [CrossRef]
- Ahadian, S.; Mohseni, M.; Moradian, S. Ranking proposed models for attaining surface free energy of powders using contact angle measurements. Int. J. Adhes. Adhes. 2009, 29, 458–469. [Google Scholar] [CrossRef]
- Kalová, J.; Mareš, R. Reference Values of Surface Tension of Water. Int. J. Thermophys. 2015, 36, 1396–1404. [Google Scholar] [CrossRef]
- Bonse, J.; Gräf, S. Maxwell Meets Marangoni—A Review of Theories on Laser-Induced Periodic Surface Structures. Laser Photon- Rev. 2020, 14, 2000215. [Google Scholar] [CrossRef]
- Bonse, J.; Krüger, J.; Höhm, S.; Rosenfeld, A. Femtosecond laser-induced periodic surface structures. J. Laser Appl. 2012, 24, 042006. [Google Scholar] [CrossRef]
- Vorobyev, A.Y.; Guo, C. Colorizing metals with femtosecond laser pulses. Appl. Phys. Lett. 2008, 92, 041914. [Google Scholar] [CrossRef]
- Zhao, W.; Wang, W.; Jiang, G.; Li, B.Q.; Mei, X. Ablation and morphological evolution of micro-holes in stainless steel with picosecond laser pulses. Int. J. Adv. Manuf. Technol. 2015, 80, 1713–1720. [Google Scholar] [CrossRef]
- Semaltianos, N.G.; Perrie, W.; French, P.; Sharp, M.; Dearden, G.; Logothetidis, S.; Watkins, K.G. Femtosecond laser ablation characteristics of nickel-based superalloy C263. Appl. Phys. A 2009, 94, 999–1009. [Google Scholar] [CrossRef]
- Sharma, N.; Destouches, N.; Florian, C.; Serna, R.; Siegel, J. Tailoring metal-dielectric nanocomposite materials with ultrashort laser pulses for dichroic color control. Nanoscale 2019, 11, 18779–18789. [Google Scholar] [CrossRef] [PubMed]
- Kobayashi, T.; Wakabayashi, T.; Takushima, Y.; Yan, J. Formation behavior of laser-induced periodic surface structures on stainless tool steel in various media. Precis. Eng. 2019, 57, 244–252. [Google Scholar] [CrossRef]
- Segovia, P.; Wong, A.; Santillan, J.R.; Camacho-Lopez, M.; Camacho-Lopez, S. Multi-phase titanium oxide LIPSS formation under fs laser irradiation on titanium thin films in ambient air. Opt. Mater. Express 2021, 11, 2892–2906. [Google Scholar] [CrossRef]
- Bizi-Bandoki, P.; Benayoun, S.; Valette, S.; Beaugiraud, B.; Audouard, E. Modifications of roughness and wettability properties of metals induced by femtosecond laser treatment. Appl. Surf. Sci. 2011, 257, 5213–5218. [Google Scholar] [CrossRef]
- Ronoh, K.; Fawaeer, S.H.; Holcman, V.; Knápek, A.; Sobola, D. Comprehensive characterization of different metallic thin films on highly oriented pyrolytic graphite substrate. Vacuum 2023, 215, 112345. [Google Scholar] [CrossRef]
- Florian, C.; Wonneberger, R.; Undisz, A.; Kirner, S.V.; Wasmuth, K.; Spaltmann, D.; Krüger, J.; Bonse, J. Chemical effects during the formation of various types of femtosecond laser-generated surface structures on titanium alloy. Appl. Phys. A 2020, 126, 266. [Google Scholar] [CrossRef]
- Yang, C.-J.; Mei, X.-S.; Tian, Y.-L.; Zhang, D.-W.; Li, Y.; Liu, X.-P. Modification of wettability property of titanium by laser texturing. Int. J. Adv. Manuf. Technol. 2016, 87, 1663–1670. [Google Scholar] [CrossRef]
- Wang, Q.; Wang, H.; Zhu, Z.; Xiang, N.; Wang, Z.; Sun, G. Switchable wettability control of titanium via facile nanosecond laser-based surface texturing. Surfaces Interfaces 2021, 24, 101122. [Google Scholar] [CrossRef]
- Conradi, M.; Kocijan, A.; Klobčar, D.; Godec, M. Influence of Laser Texturing on Microstructure, Surface and Corrosion Properties of Ti-6Al-4V. Metals 2020, 10, 1504. [Google Scholar] [CrossRef]
- Dinh, T.-H.; Ngo, C.-V.; Chun, D.-M. Controlling the Wetting Properties of Superhydrophobic Titanium Surface Fabricated by UV Nanosecond-Pulsed Laser and Heat Treatment. Nanomaterials 2018, 8, 766. [Google Scholar] [CrossRef] [PubMed]
- Hess, C. New advances in using Raman spectroscopy for the characterization of catalysts and catalytic reactions. Chem. Soc. Rev. 2021, 50, 3519–3564. [Google Scholar] [CrossRef] [PubMed]
- Ekoi, E.; Gowen, A.; Dorrepaal, R.; Dowling, D. Characterisation of titanium oxide layers using Raman spectroscopy and optical profilometry: Influence of oxide properties. Results Phys. 2019, 12, 1574–1585. [Google Scholar] [CrossRef]
- Wiatrowski, A.; Mazur, M.; Obstarczyk, A.; Wojcieszak, D.; Kaczmarek, D.; Morgiel, J.; Gibson, D. Comparison of the Physicochemical Properties of TiO2 Thin Films Obtained by Magnetron Sputtering with Continuous and Pulsed Gas Flow. Coatings 2018, 8, 412. [Google Scholar] [CrossRef]
- Mino, L.; Mandrile, L.; Iannarelli, L.; Portesi, C.; Martra, G.; Rossi, A.M. Vibrational spectroscopy. In Characterization of Nanoparticles; Elsevier: Amsterdam, The Netherlands, 2020; pp. 457–480. [Google Scholar] [CrossRef]
- Shaikh, S.; Kedia, S.; Majumdar, A.G.; Subramanian, M.; Sinha, S. In vitro bioactivity and biocompatibility of femtosecond laser-modified Ti6Al4V alloy. Appl. Phys. A 2018, 124, 821. [Google Scholar] [CrossRef]
- Kristensen, A.; Yang, J.K.W.; Bozhevolnyi, S.I.; Link, S.; Nordlander, P.; Halas, N.J.; Mortensen, N.A. Plasmonic colour generation. Nat. Rev. Mater. 2016, 2, 16088. [Google Scholar] [CrossRef]
- Riveiro, A.; Pou, P.; del Val, J.; Comesaña, R.; Arias-González, F.; Lusquiños, F.; Boutinguiza, M.; Quintero, F.; Badaoui, A.; Pou, J. Laser texturing to control the wettability of materials. In Procedia CIRP; Elsevier B.V.: Amsterdam, The Netherlands, 2020; pp. 879–884. [Google Scholar] [CrossRef]
- Kietzig, A.-M.; Hatzikiriakos, S.G.; Englezos, P. Patterned Superhydrophobic Metallic Surfaces. Langmuir 2009, 25, 4821–4827. [Google Scholar] [CrossRef] [PubMed]
- Cassie, A.B.D.; Baxter, S. Wettability of porous surfaces. Trans. Faraday Soc. 1944, 40, 546–551. [Google Scholar] [CrossRef]
- Jung, Y.C.; Bhushan, B. Contact angle, adhesion and friction properties of micro-and nanopatterned polymers for superhydrophobicity. Nanotechnology 2006, 17, 4970–4980. [Google Scholar] [CrossRef]
- Yan, Y.; Gao, N.; Barthlott, W. Mimicking natural superhydrophobic surfaces and grasping the wetting process: A review on recent progress in preparing superhydrophobic surfaces. Adv. Colloid Interface Sci. 2011, 169, 80–105. [Google Scholar] [CrossRef] [PubMed]
- Boinovich, L.B.; Emelyanenko, A.M. Hydrophobic materials and coatings: Principles of design, properties and applications. Russ. Chem. Rev. 2008, 77, 583–600. [Google Scholar] [CrossRef]
- Li, B.-J.; Li, H.; Huang, L.-J.; Ren, N.-F.; Kong, X. Femtosecond pulsed laser textured titanium surfaces with stable superhydrophilicity and superhydrophobicity. Appl. Surf. Sci. 2016, 389, 585–593. [Google Scholar] [CrossRef]
- Wenzel, R.N. Resistance of solid surfaces to wetting by water. Ind. Eng. Chem. 1936, 28, 988–994. [Google Scholar] [CrossRef]
- Manoharan, K.; Bhattacharya, S. Superhydrophobic surfaces review: Functional application, fabrication techniques and limitations. J. Micromanufact. 2019, 2, 59–78. [Google Scholar] [CrossRef]


| Regions | Laser Fluence, [J·cm−2] | Scanning Velocity, [mm·s−1] | Hatching Distance, [µm] | Scanning Passes, | Regions | Laser Fluence [J·cm−2] | Scanning Velocity [mm·s−1] | Hatching Distance [µm] | Scanning Passes |
|---|---|---|---|---|---|---|---|---|---|
| A1 | 0.2 | 100 | 5 | 1 | C3 | 1 | 200 | 40 | 4 |
| A2 | 0.2 | 150 | 25 | 2 | C4 | 1 | 400 | 50 | 8 |
| A3 | 0.2 | 200 | 40 | 4 | D1 | 1.2 | 100 | 5 | 1 |
| A4 | 0.2 | 400 | 50 | 8 | D2 | 1.2 | 150 | 25 | 2 |
| B1 | 0.5 | 100 | 5 | 1 | D3 | 1.2 | 200 | 40 | 4 |
| B2 | 0.5 | 150 | 25 | 2 | D4 | 1.2 | 400 | 50 | 8 |
| B3 | 0.5 | 200 | 40 | 4 | E1 | 1.5 | 100 | 5 | 1 |
| B4 | 0.5 | 400 | 50 | 8 | E2 | 1.5 | 150 | 25 | 2 |
| C1 | 1 | 100 | 5 | 1 | E3 | 1.5 | 200 | 40 | 4 |
| C2 | 1 | 150 | 25 | 2 | E4 | 1.5 | 400 | 50 | 8 |
| Regions | Mean Roughness Sa (nm) | Skewness, Ssk | Kurtosis, Sku | RMS Surface Slope, Sdq | Projected Area (µm2) | Surface Area, (µm2) | Roughness Factor, r * |
|---|---|---|---|---|---|---|---|
| A1 | 118.2790 | −0.7021 | −0.0444 | 0.0834 | 40,006.7000 | 40,138.8000 | 1.0033 |
| B1 | 157.3180 | −0.3043 | −0.0626 | 0.1375 | 40,006.7000 | 40,362.3000 | 1.0089 |
| C1 | 136.5680 | −0.2754 | 0.2999 | 0.1376 | 40,006.7000 | 40,363.3000 | 1.0089 |
| D1 | 127.0170 | 0.1471 | 0.7541 | 0.1531 | 40,006.7000 | 40,447.4000 | 1.0110 |
| D4 | 510.3000 | −0.4424 | −0.6126 | 0.1316 | 40,007.0000 | 40,341.0000 | 1.0083 |
| E1 | 136.7490 | 0.2370 | 0.1862 | 0.1766 | 40,006.7000 | 40,592.7000 | 1.0146 |
| Elements (% Weight) | ||||||||||
|---|---|---|---|---|---|---|---|---|---|---|
| Before Immersion | After Immersion | |||||||||
| Ti | O | C | Fe | Al | Ti | O | C | Fe | Al | |
| Polished | 99.1 | 0.7 | 0.1 | 0.1 | 0.1 | |||||
| A1 | 90.1 | 9.6 | 0.1 | 0.1 | 0.1 | 91.5 | 8.2 | 0.0 | 0.1 | 0.1 |
| A4 | 91.9 | 7.4 | 0.4 | 0.2 | 0.1 | 91.3 | 8.6 | 0.0 | 0.0 | 0.1 |
| B1 | 89.1 | 10.6 | 0.1 | 0.1 | 0.1 | 89.3 | 10.5 | 0.1 | 0.0 | 0.0 |
| C1 | 88.8 | 10.9 | 0.1 | 0.1 | 0.1 | 89.0 | 10.8 | 0.0 | 0.1 | 0.1 |
| D1 | 88.5 | 11.2 | 0.1 | 0.1 | 0.1 | 88.9 | 10.8 | 0.0 | 0.1 | 0.1 |
| E1 | 86.9 | 12.9 | 0.1 | 0.1 | 0.0 | 87.1 | 12.8 | 0.0 | 0.0 | 0.1 |
| Before Immersion | After Immersion | ||||||||||
|---|---|---|---|---|---|---|---|---|---|---|---|
| Peaks | A1 | B1 | C1 | D1 | E1 | A1 | B1 | C1 | D1 | E1 | Assigned Mode |
| P1 | 153 | 157 | 154 | 143 | 154 | 169 | 151 | 167 | 151 | 154 | B1g |
| P2 | 242 | 242 | 242 | 259 | 266 | 246 | 264 | 254 | 272 | 261 | Multi-photon process |
| P3 | 417 | 418 | 419 | 422 | 423 | 420 | 420 | 417 | 415 | 416 | Eg |
| P4 | 608 | 605 | 609 | 608 | 605 | 597 | 609 | 603 | 604 | 606 | A1g |
Disclaimer/Publisher’s Note: The statements, opinions and data contained in all publications are solely those of the individual author(s) and contributor(s) and not of MDPI and/or the editor(s). MDPI and/or the editor(s) disclaim responsibility for any injury to people or property resulting from any ideas, methods, instructions or products referred to in the content. |
© 2024 by the authors. Licensee MDPI, Basel, Switzerland. This article is an open access article distributed under the terms and conditions of the Creative Commons Attribution (CC BY) license (https://creativecommons.org/licenses/by/4.0/).
Share and Cite
Ronoh, K.; Novotný, J.; Mrňa, L.; Knápek, A.; Sobola, D. Surface Structuring of the CP Titanium by Ultrafast Laser Pulses. Appl. Sci. 2024, 14, 3164. https://doi.org/10.3390/app14083164
Ronoh K, Novotný J, Mrňa L, Knápek A, Sobola D. Surface Structuring of the CP Titanium by Ultrafast Laser Pulses. Applied Sciences. 2024; 14(8):3164. https://doi.org/10.3390/app14083164
Chicago/Turabian StyleRonoh, Kipkurui, Jan Novotný, Libor Mrňa, Alexandr Knápek, and Dinara Sobola. 2024. "Surface Structuring of the CP Titanium by Ultrafast Laser Pulses" Applied Sciences 14, no. 8: 3164. https://doi.org/10.3390/app14083164
APA StyleRonoh, K., Novotný, J., Mrňa, L., Knápek, A., & Sobola, D. (2024). Surface Structuring of the CP Titanium by Ultrafast Laser Pulses. Applied Sciences, 14(8), 3164. https://doi.org/10.3390/app14083164