Article

Analysis of the Magnetic Properties of Ultra-Thin Grain-Oriented Silicon Steel and Fe-Based Amorphous Alloys from Power Frequency to Intermediate Frequency

State Key Laboratory of Advanced Power Transmission Technology, State Grid Smart Grid Research Institute Co., Ltd., Changping District, Beijing 102209, China
*
Authors to whom correspondence should be addressed.
Appl. Sci. 2024, 14(8), 3162; https://doi.org/10.3390/app14083162
Submission received: 16 March 2024 / Revised: 1 April 2024 / Accepted: 5 April 2024 / Published: 9 April 2024
(This article belongs to the Special Issue Advanced Methodology and Analysis in Electrical Materials Science)

Abstract

:
The magnetic properties of a 0.10 mm ultra-thin, grain-oriented (UTGO) silicon steel and an Fe-based amorphous (FBA) alloy under sinusoidal excitation were experimentally researched, and the magnetic field strength and iron loss of the two materials under different frequencies and magnetic densities were obtained. Based on the measured data, the magnetization and loss characteristics of the two materials were analyzed and compared. Furthermore, two Epstein square ring models of the same dimensions and different materials were designed, and the reliability of the models was verified. Then, the electromagnetic characteristics of the two Epstein square ring models at higher and lower frequencies were calculated using the finite element method, and the iron losses were obtained and compared. The results show that the FBA alloy has good application characteristics at low frequencies and low power, and the 0.10 mm UTGO silicon steel has good application characteristics at high frequencies and high power. This research provides important data, promoting the application of these two materials in new energy equipment.

1. Introduction

The vigorous development of clean energy presents traditional AC distribution networks with the challenges of increasing DC power supplies and loads and a diversified power demand. The electric energy produced by wind and solar generation cannot be directly fed into the AC power grid, especially in the case of wind farms located far offshore; a converter platform with high efficiency and high reliability is essential to collect and transmit the electric energy produced by wind turbines [1]. Through the use of a dedicated direct current-direct current converter at the output of each wind turbine, organized in a modular, parallel, or in-series manner, a more economical high-voltage direct current transmission system can be achieved. Advancements in power semiconductors, magnetic materials, and advanced control methods promote the development of power electronic transformers with isolated medium- and high-frequency transformers as core components in industrial applications of wind power, photovoltaics, and other energy conversion systems [2]. Taking wind power generation systems as an example of an electric energy conversion device, the primary side converter of a high-frequency transformer converts the power frequency of the electric AC energy produced by the wind generator into high-frequency square wave signals, and the subside converter restores the high-frequency square wave signals into power frequency electric AC energy to be used by subsequent power equipment [3]. The intermediate DC link in the power electronic transformer (PET) can be used as a port for large-scale distributed power generation systems, energy storage systems, and DC loads (such as those from electric vehicles) to connect to the grid. The most significant difference between PETs in wind power generation equipment and 50 Hz power frequency transformers is the former’s higher operating frequency, usually in the range of a few kHz to tens of kHz [4]. Therefore, the bulky magnetic components of the traditional power transformers can be replaced by lighter-weight and smaller high-frequency magnetic cores, reducing the use of transformer metal materials, thus reducing the manufacturing cost of the transformer and effectively improving the power density of the device. PETs’ advantages in terms of work efficiency and controllability also provide an effective guarantee for the efficient operation of wind power transmission and distribution systems. In wind farms, traditional power transformers usually require the use of the installation platform of a distribution station, whereas high-frequency transformers can be installed either in the engine room or in the base of the wind turbines; this is due to their reduced volume and weight, eliminating the need for bulky substation platforms and improving the performance of wind turbines in terms of cost, design, and maintenance [5].
A medium- and high-frequency transformer is the core piece of equipment in power electronic transformers. As the frequency increases, the loss of the medium- and high-frequency transformer core will become higher, resulting in a greater increase in the temperature of the power equipment and even damage, which shortens the equipment’s service life. Because the loss characteristics between different magnetic materials will differ, in the process of designing power equipment, it is necessary to consider the influence of the core materials’ magnetic properties. In one study, a new permanent magnet linear synchronous motor structure using oriented silicon steel sheets as the moving core material instead of the traditional non-oriented silicon steel sheets has been proposed, which improves the electromagnetic thrust and overload capacity [6]. Moreover, the use of grain-oriented silicon steel in axial flux permanent magnet machines improves their torque and efficiency, highlighting the advantages of grain-oriented silicon steel in the application of yokeless stator axial flux permanent magnet (AFPM) machines [7]. Using three test motors made of conventional steel, high-silicon steel, and amorphous iron, the authors of [8] proved that magnetostriction has a significant effect on amorphous iron, but an almost negligible effect on high-silicon steel. Considering the use of high-silicon steel instead of amorphous metal as a rotor can improve the mechanical strength without affecting the performance of the motor, proving the feasibility of high-silicon steel as a rotor material and its potential for large-scale production [9]. The performance of a multistage axial flux permanent magnet motor with different stator core materials has been proposed and analyzed, and the difference in the application performances of the three materials has been compared [10]. The comparative analysis, prototyping, and testing of two kinds of surface-mounted permanent magnet synchronous motors (PMSMs) with the same physical size but different stator core materials were carried out, and it was found that the additive PMSM had very low no-load iron loss characteristics [11]. Finally, the influence of a 6.5% silicon steel and a cobalt–ferro alloy, two soft magnetic materials, on the design of high-speed machines was studied in [12]. Therefore, the manufacturing of new materials and the exploration of the magnetic properties of different magnetic materials are of great significance for the application of these materials in power equipment.
In this work, an Epstein square ring is used to measure the magnetic properties of 0.10 mm UTGO silicon steel at different frequencies, and the magnetic properties are compared with those of FBA alloys at different frequencies. Then, the COMSOL Mutiphysics 6.0 finite element calculation software is used to simulate the Epstein square ring. Based on the electromagnetic characteristics of the 0.10 mm UTGO silicon steel and FBA alloy, the core magnetic field distribution and loss of the Epstein square ring of these two magnetic materials are calculated and analyzed at higher and lower frequencies, and the analyses are compared.

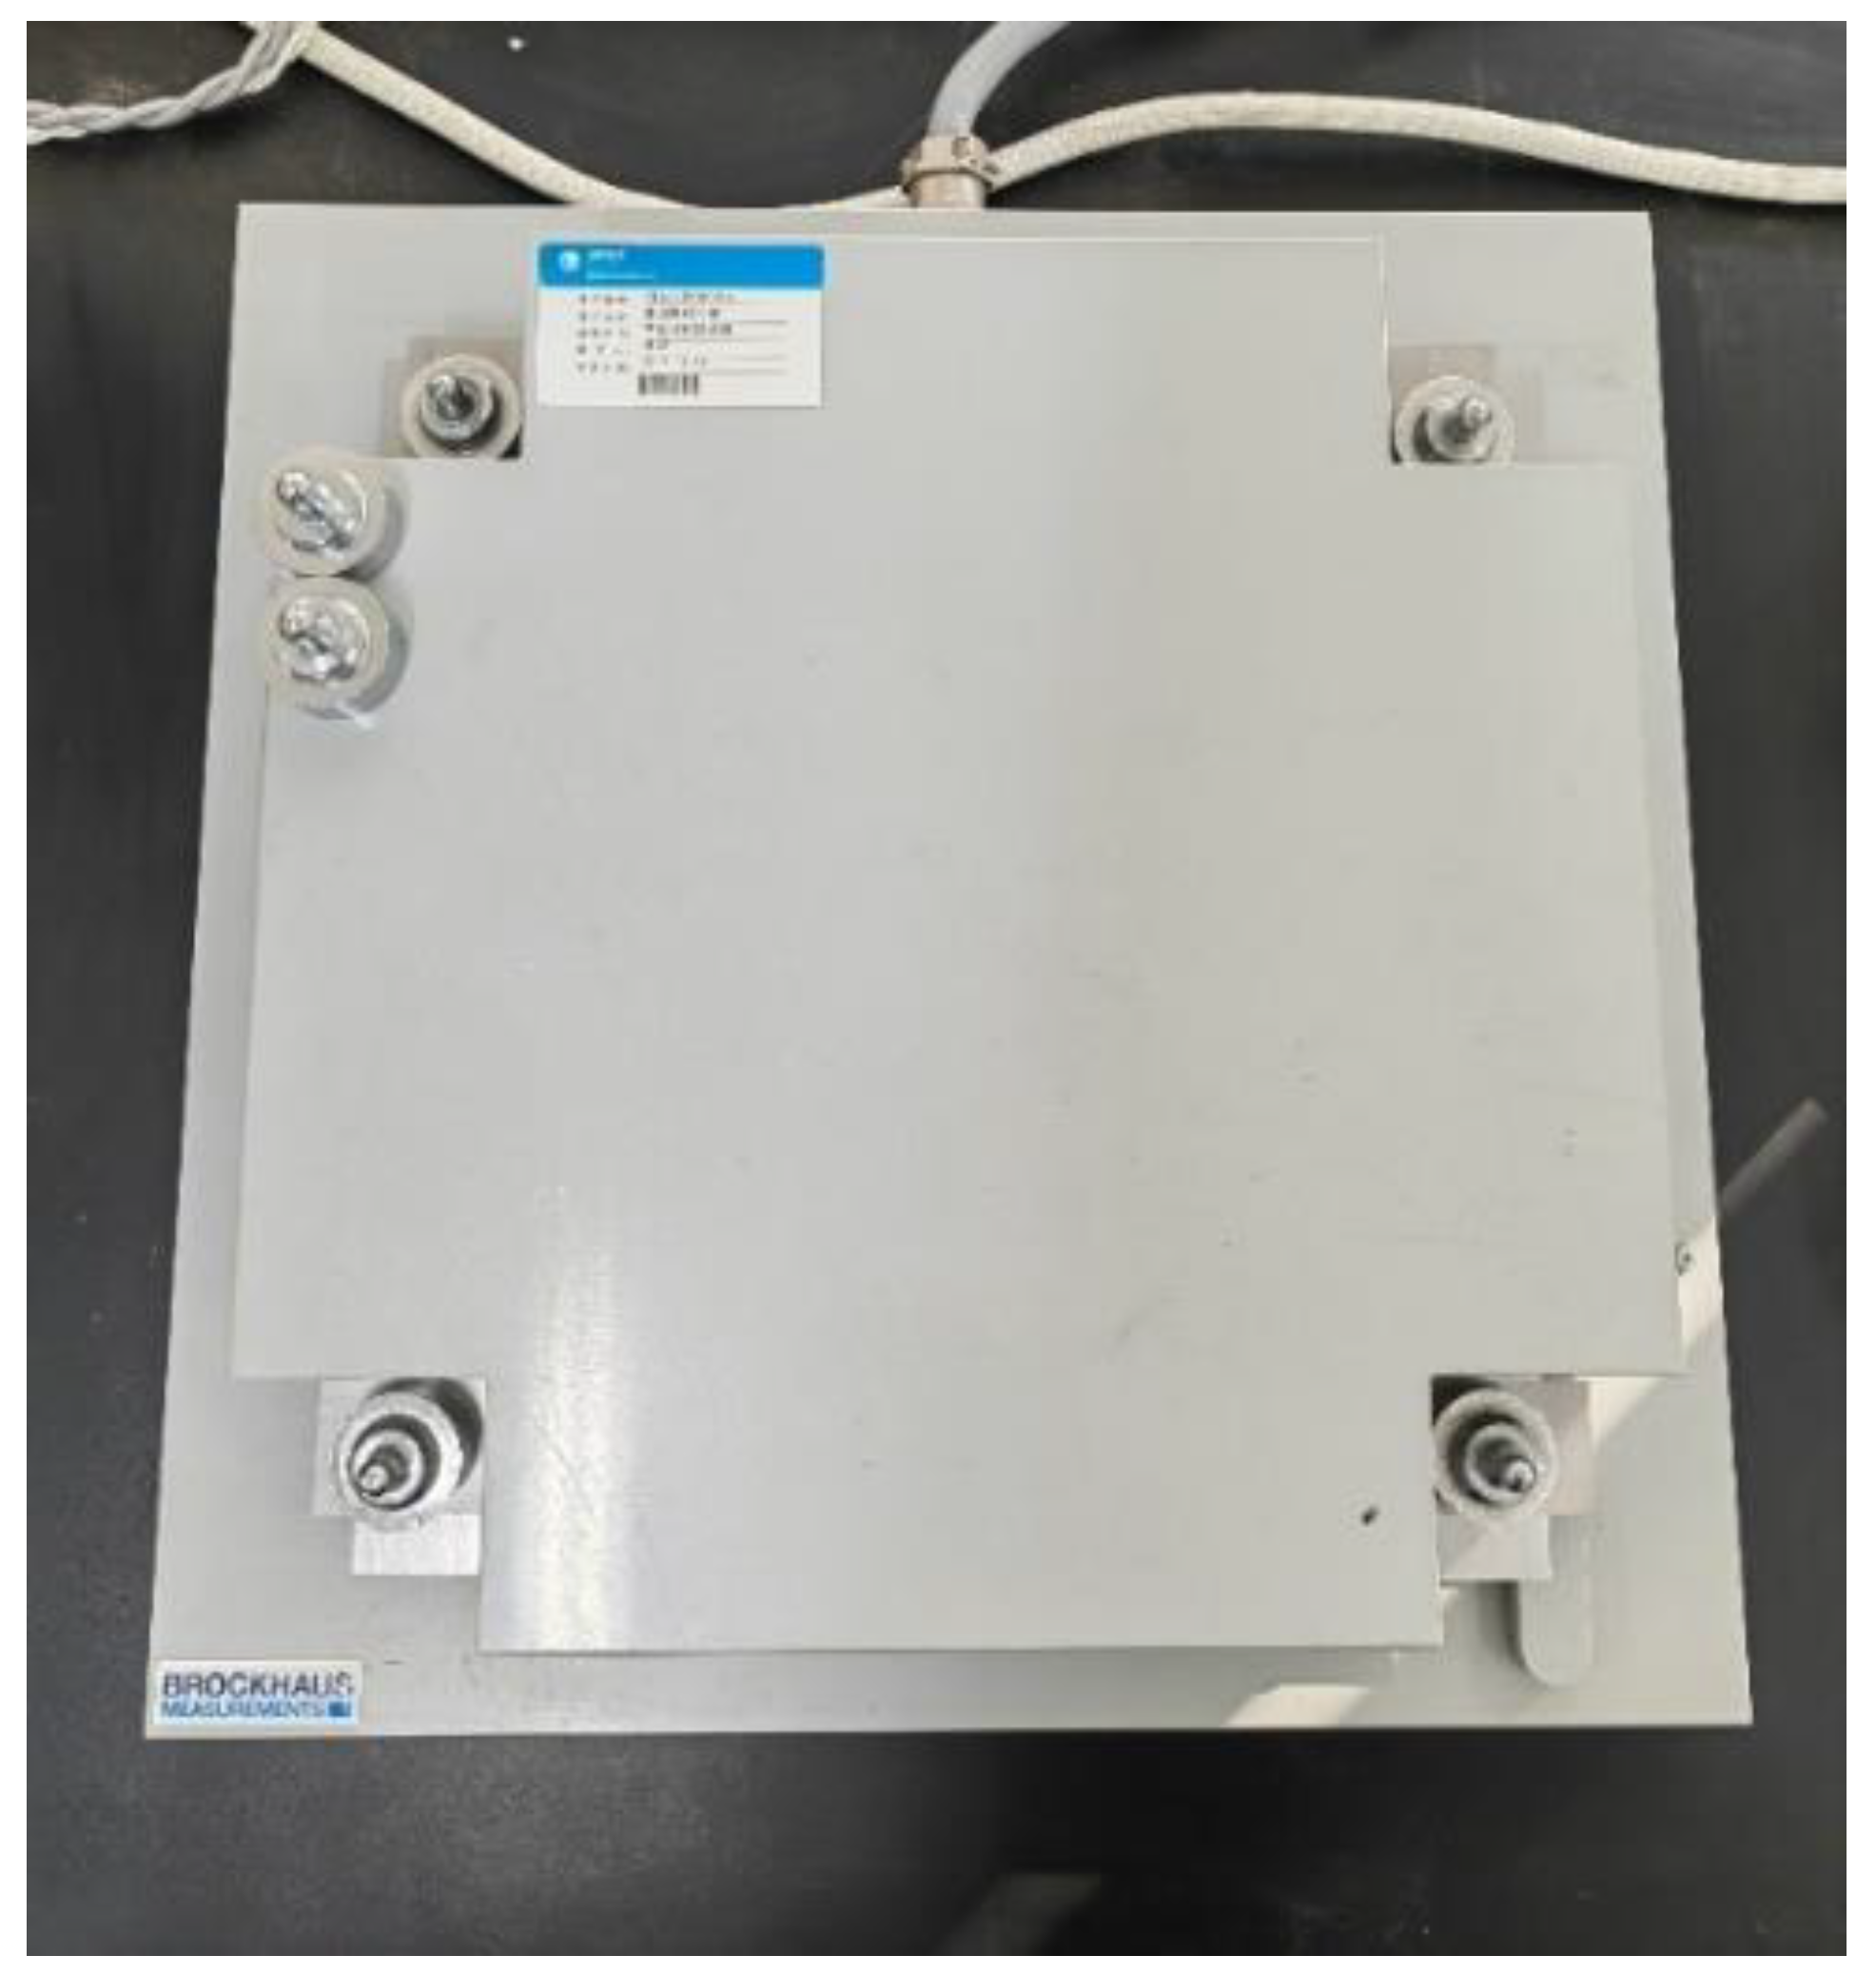
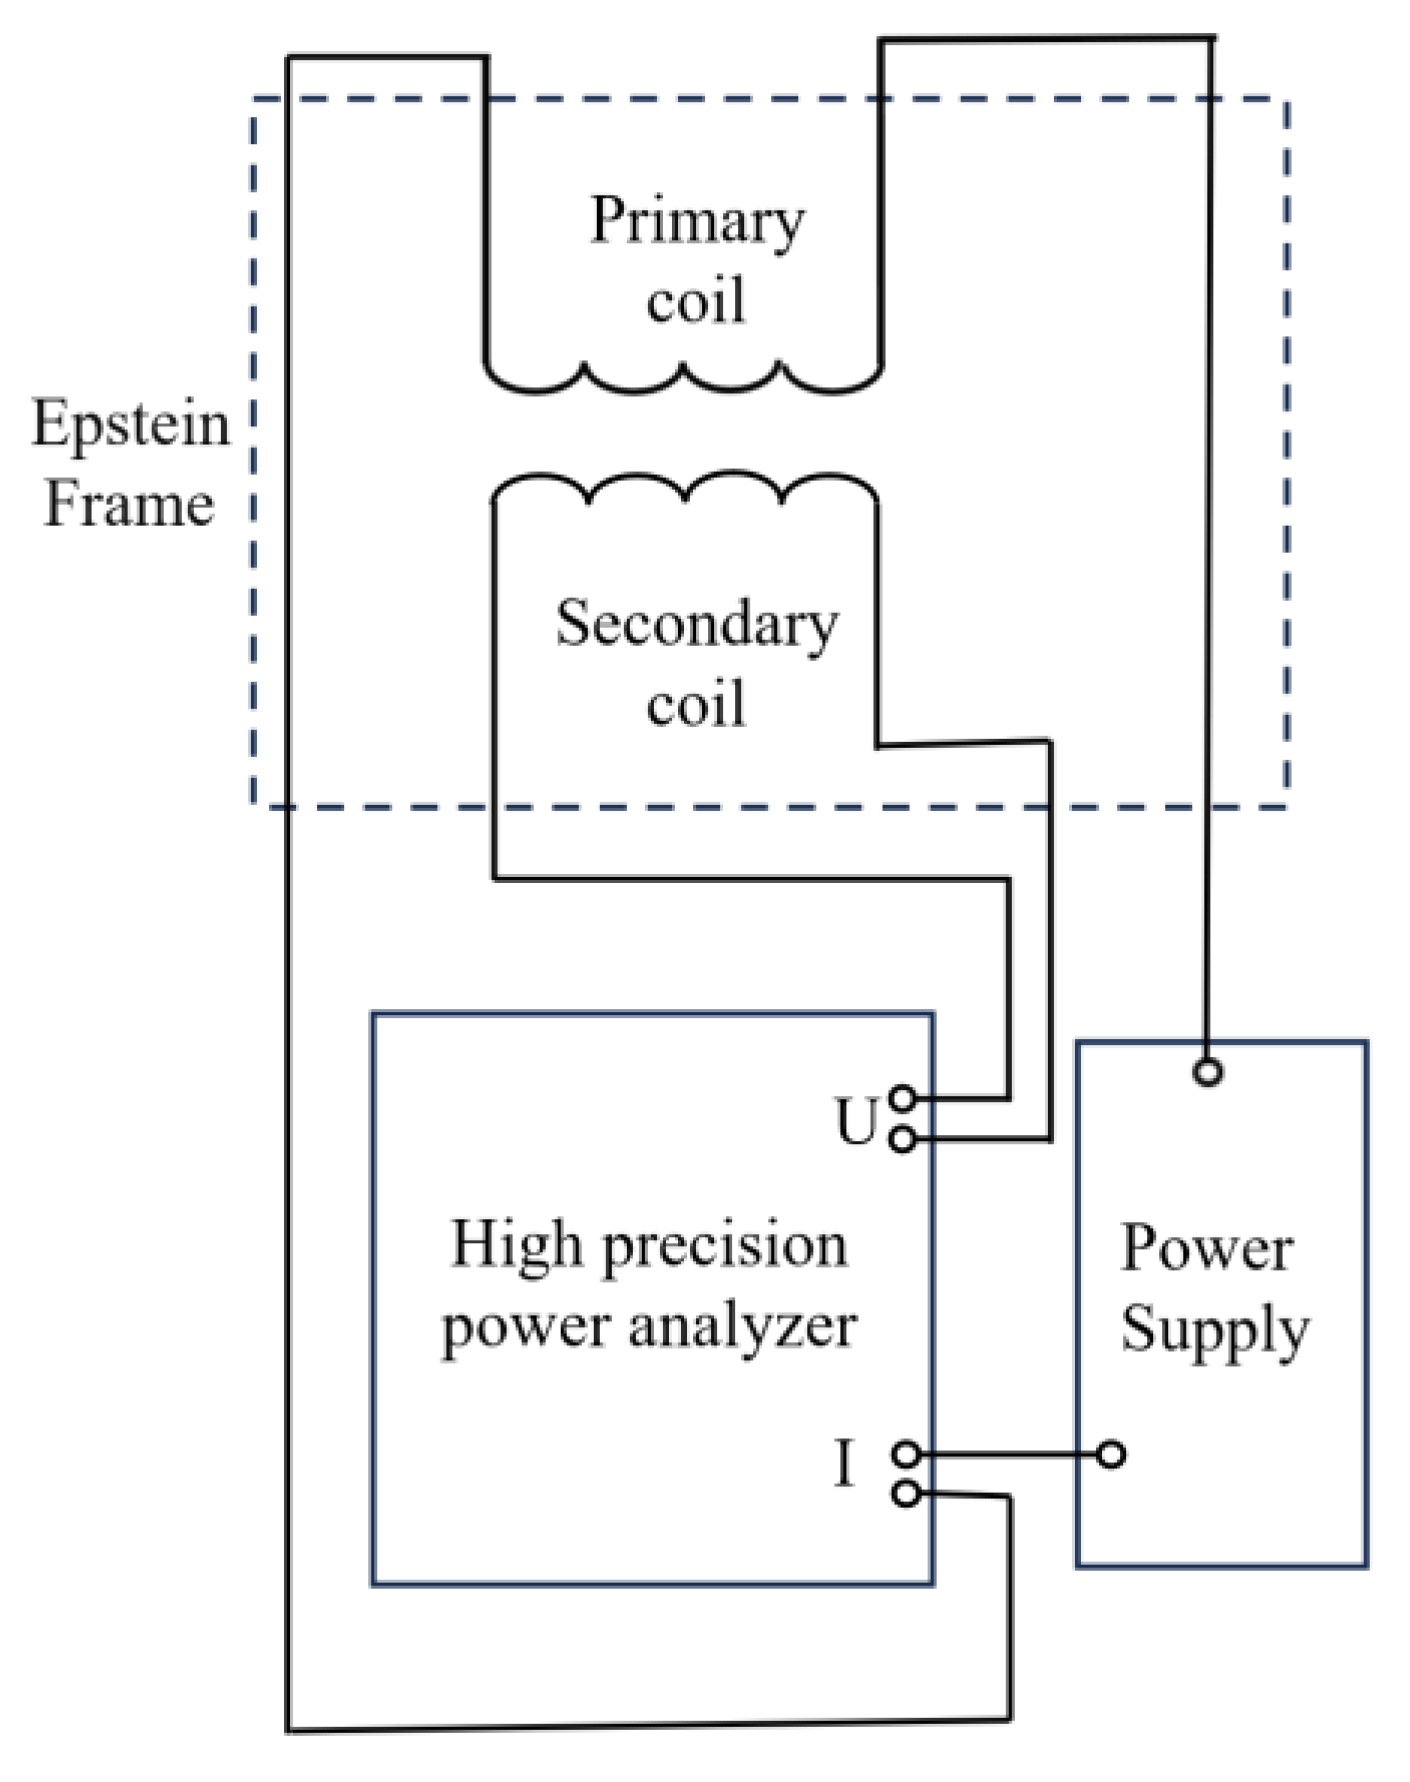
2. Experimental Measurement System

Scholars and engineers attach great importance to the method used to measure the electromagnetic properties of magnetic materials. At present, there are essentially three kinds of measurement methods: the single-slice measurement method, the standard Epstein square ring method, and the ring sample method [13,14,15,16,17]. Among them, the more traditional measurement methods are the Epstein square ring method and the ring sample method. The basic principle of the Epstein square ring method is to form a box of silicon steel sheets joined by double tower joints, form four beams with equal lengths and cross-sections, and insert them into four coils. To conduct the square ring sample test, we used the MPG-200D soft magnetic measurement system (including an arbitrary waveform generator, power amplifier, control program, etc.) made by the Brockhaus Messtechnik GmbH & Co. KG in Germany (Lüdenscheid, Germany). The Epstein square coil consists of a primary coil (magnetization winding) in the outer layer, a secondary coil (induction voltage winding) in the inner layer, and a sample as the core [18]. A physical diagram of the Epstein square ring is shown in Figure 1.
The 0.10 mm UTGO silicon steel was selected as the research object, and the magnetic field strength and loss value of the magnetic material were measured using the Epstein square ring method at 0.1–1.7 T under sinusoidal excitation. The sample’s dimensions are 300 mm × 30 mm, and the number of primary- and secondary-side turns is 100. An experimental schematic diagram is shown in Figure 2. The electromagnetic properties of the FBA alloy materials measured using the ring sample method are then compared. The TEM images of the microstructure and corresponding SAD pattern for the Fe-based amorphous alloy sample are shown in Figure 3. A single diffraction ring means this sample is an amorphous structure.

3. Measurement Results

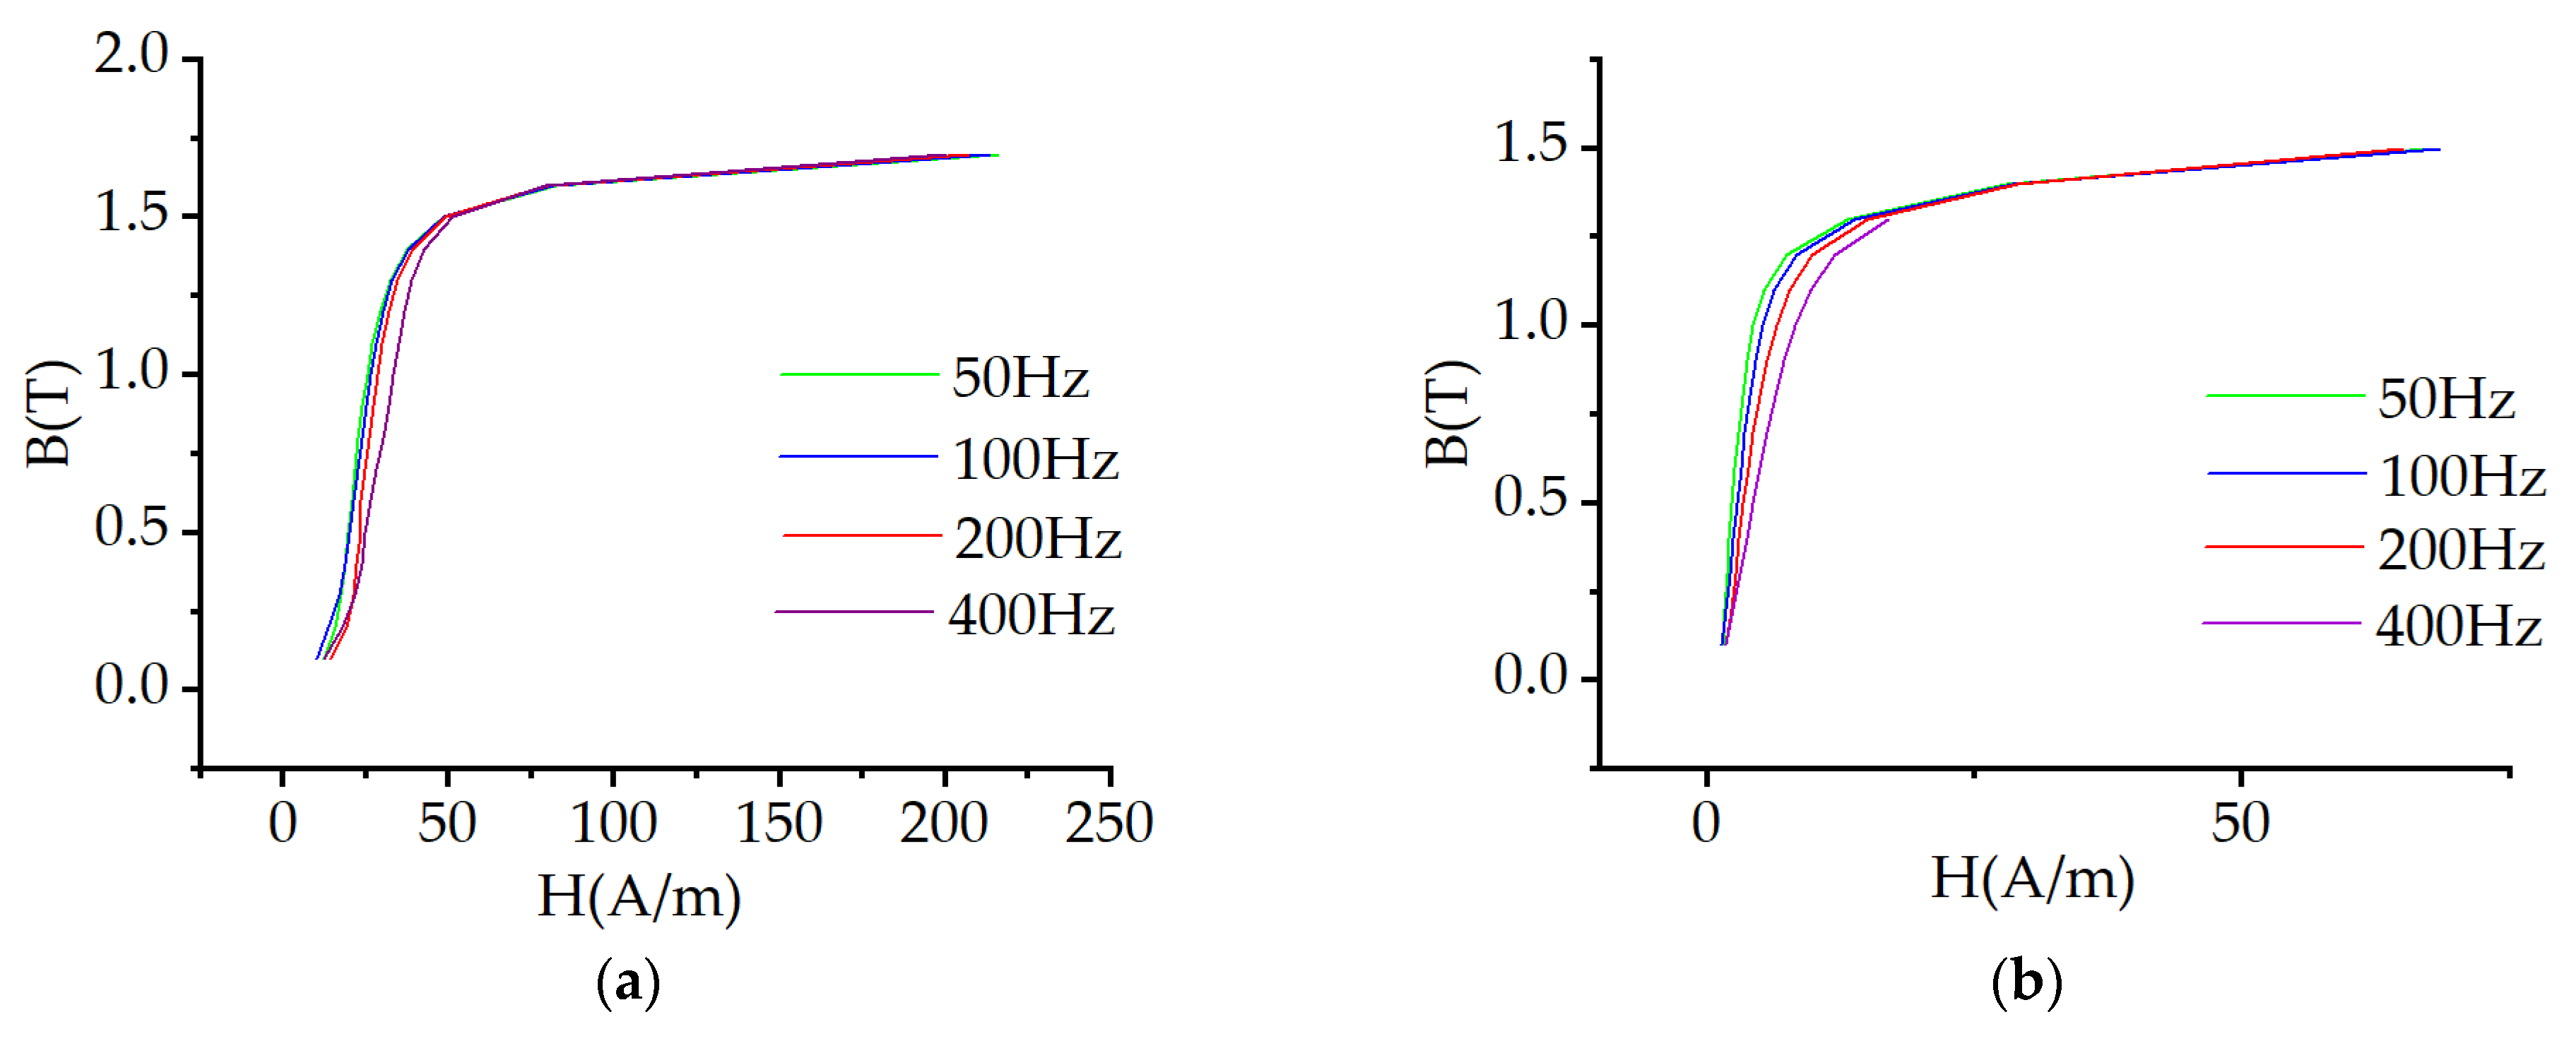
3.1. Magnetization Curve Measurement Results

By comparing the magnetic properties of different silicon magnetic materials under different frequencies of sinusoidal magnetization, suggestions regarding different types of magnetic materials to be used under different operating conditions can be given, which provide empirical support for the design of power electronic equipment [19].
Figure 4 shows the magnetization curves of the 0.10 mm UTGO silicon steel and FBA alloy. It can be seen from the figure that the magnetization curve of the 0.10 mm UTGO silicon steel tends to become saturated when the magnetic induction intensity is 1.6 T, and the magnetic field intensity is about 80 A/m. The magnetization curve of the FBA alloy tends to become saturated when the magnetic field intensity is about 28.5 A/m, and the magnetic induction intensity is 1.4 T. Thus, the 0.10 mm UTGO silicon steel has a high-saturation magnetic induction strength and a high permeability, whereas the FBA alloy has a low-saturation magnetic induction strength and a low permeability. With the increase in frequency, the permeability of the 0.10 mm UTGO silicon steel and FBA alloy decreases.

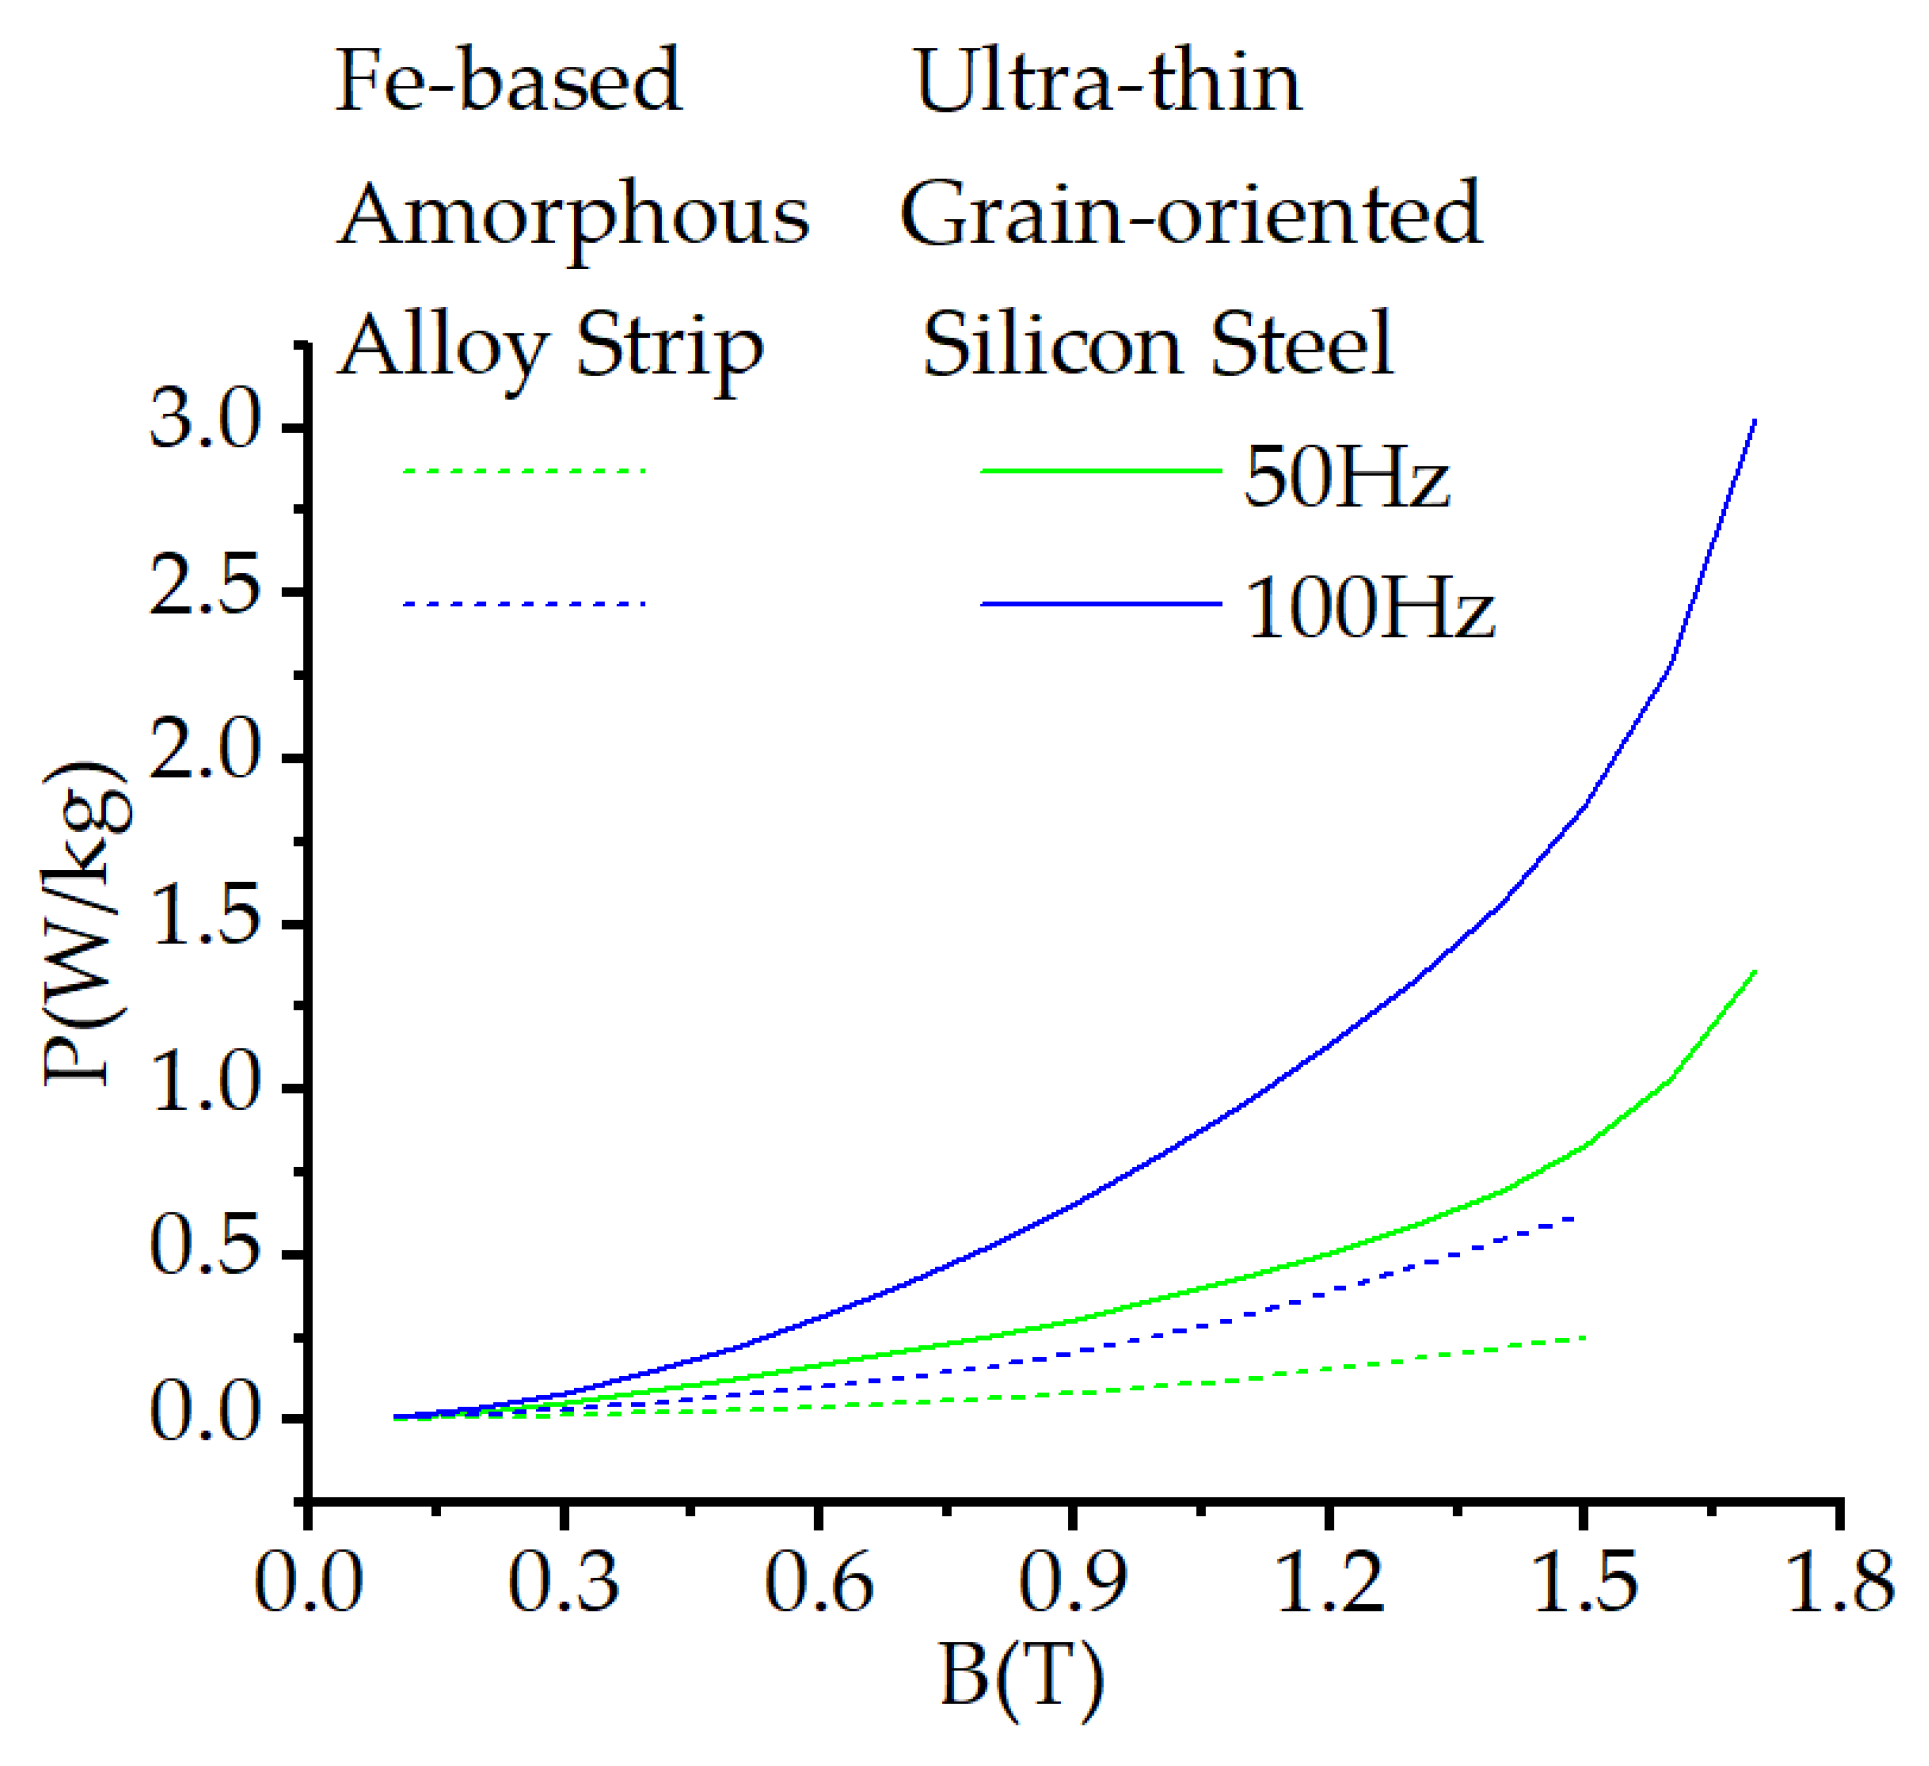
3.2. Measurement Results of Loss Characteristics at Lower Frequencies

To facilitate observation and comparison, this paper classifies frequencies of 50–100 Hz as a low frequency and frequencies of 200–400 Hz as a high frequency. Figure 4 shows the loss characteristics of the 0.10 mm UTGO silicon steel and FBA alloy at 50–100 Hz.
It can be seen from Figure 5 that the loss curve of the FBA alloy at 50–100 Hz is lower than that of the 0.10 mm UTGO silicon steel at 50 Hz. In the range of 0.1–1.0 T, the loss curve of the FBA alloy at 50–100 Hz and the loss curve of the 0.10 mm UTGO silicon steel at 50–100 Hz are both relatively gentle, while the loss curve of the 0.10 mm UTGO silicon steel increases rapidly after 1.5 T. The iron loss density of the 0.10 mm UTGO silicon steel is 1.03 W/kg when the frequency is 50 Hz and the magnetic induction intensity is 1.6 T, and the iron loss density is 0.37 W/kg when the magnetic induction intensity is 1.0 T. The iron loss density of the FBA alloy is 0.25 W/kg when the frequency is 50 Hz and the magnetic induction intensity is 1.5 T, and the iron loss density is 0.10 W/kg when the magnetic induction intensity is 1.0 T. In addition, the loss density of the 0.10 mm UTGO silicon steel at 50 Hz is higher than that of the 0.18 mm oriented silicon steel [20].

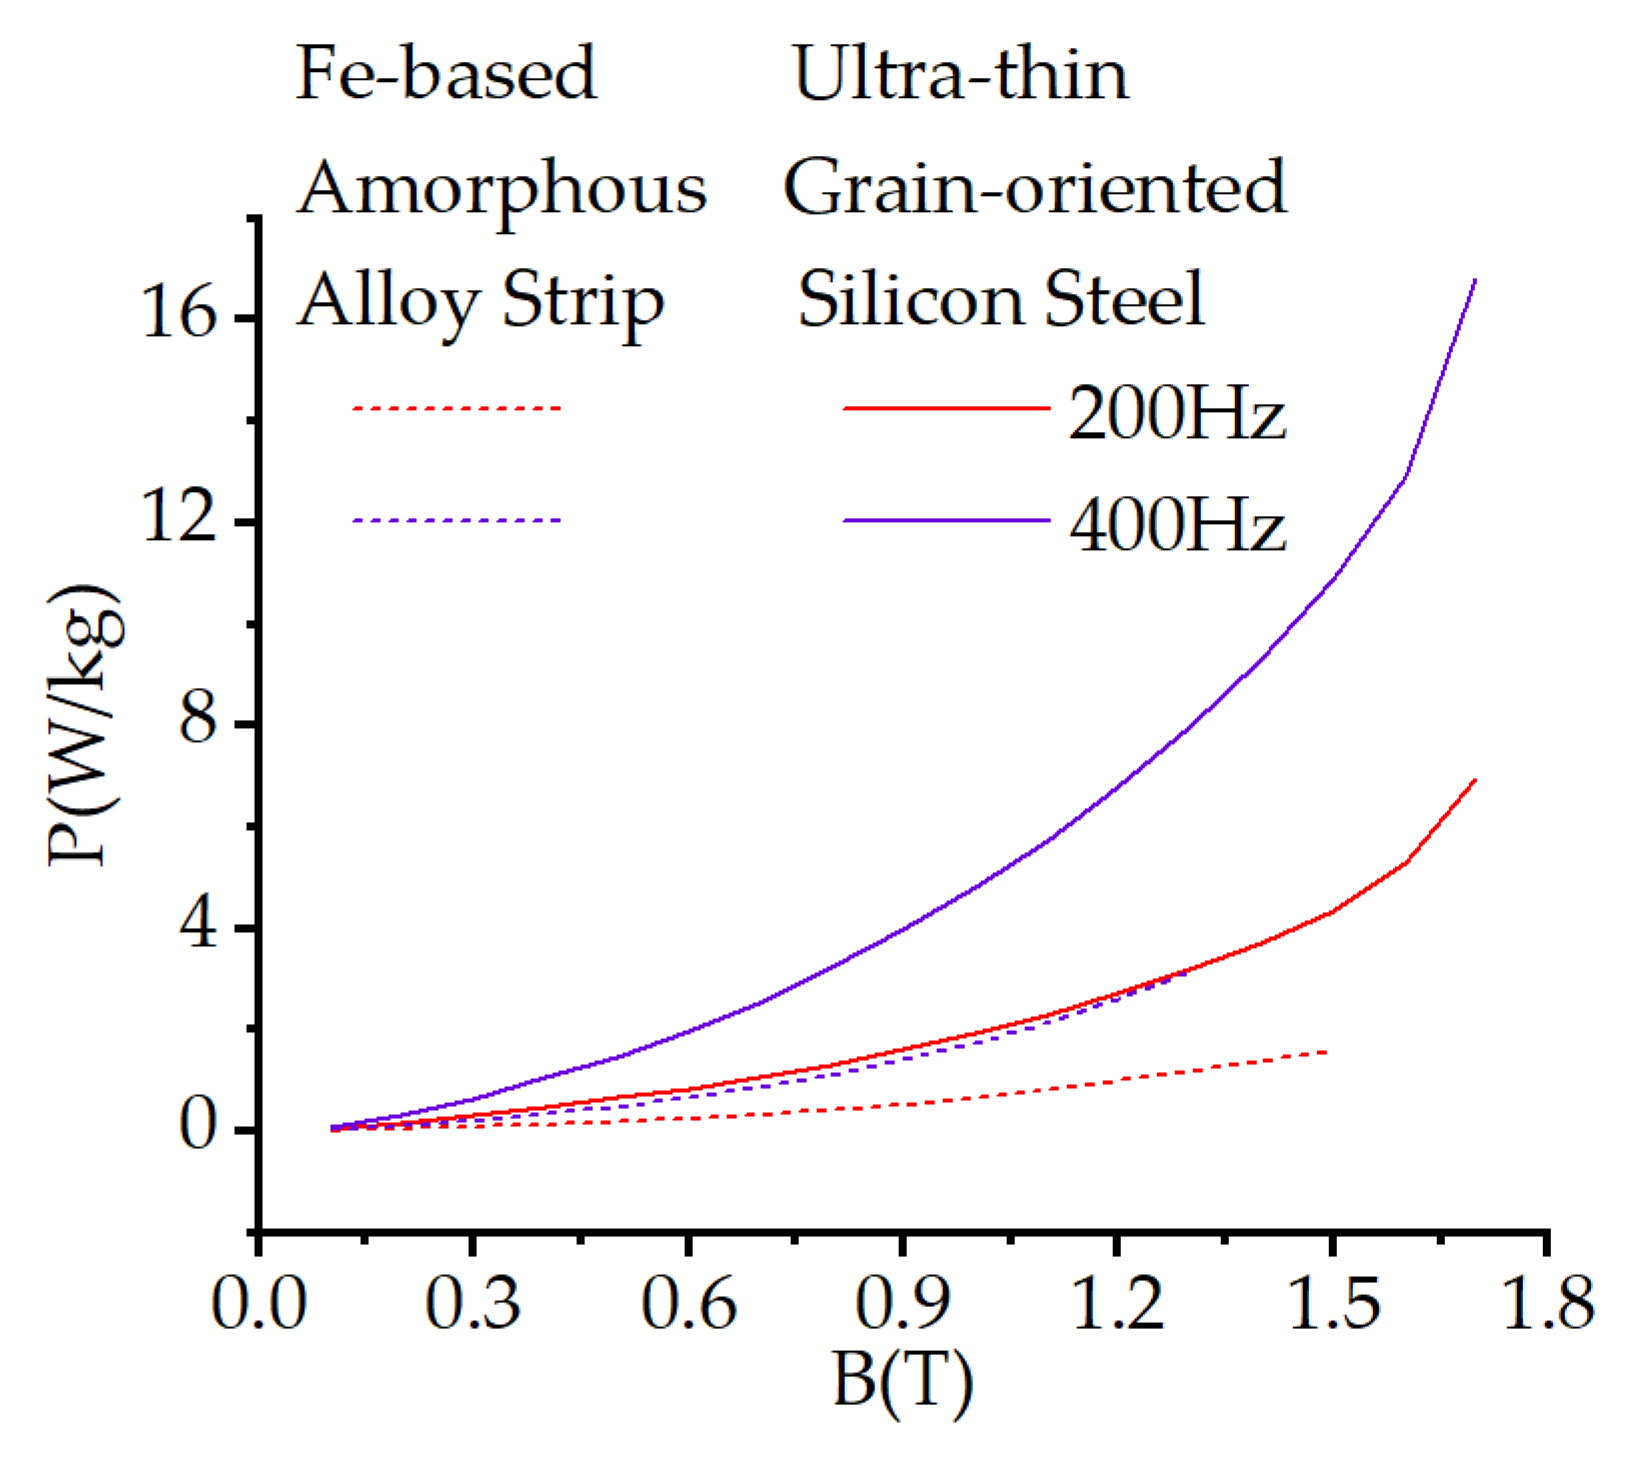
3.3. Measurement Results of Loss Characteristics at Higher Frequencies

Figure 6 shows the loss characteristics of the 0.10 mm UTGO silicon steel and FBA alloy at 200–400 Hz frequencies.
It can be seen from the diagram that, in the high-frequency range, the loss difference between the 0.10 mm UTGO silicon steel and the FBA alloy is more obvious. With the increase in frequency, the growth rate of the loss curve of the 0.10 mm UTGO silicon steel is greater than that of the FBA alloy. When the frequency is 200 Hz and the magnetic induction intensity is 1.0 T, the iron loss density of the 0.10 mm UTGO silicon steel is 1.95 W/kg, and the iron loss density of the FBA alloy is 0.66 W/kg. When the frequency is 400 Hz and the magnetic induction intensity is 1.0 T, the iron loss density of the 0.10 mm UTGO silicon steel is 4.81 W/kg, and the iron loss density of the FBA alloy is 1.75 W/kg.
The loss characteristics of the FBA alloy at 200 Hz are lower than those of the 0.10 mm UTGO silicon steel at 100 Hz, but higher than those of the 0.10 mm UTGO silicon steel at 50 Hz. The change rate of the 0.10 mm UTGO silicon steel’s loss curve at 200 Hz increases rapidly. With the increase in frequency, the losses of the 0.10 mm UTGO silicon steel and FBA alloy increase, with the largest increase occurring between 100 Hz and 200 Hz.
The above results show that the 0.10 mm UTGO silicon steel has a lower loss at higher frequencies, and has better high-frequency magnetic characteristics. The FBA alloy shows the lowest loss at both low and high frequencies, and has the best magnetic properties.

4. Establishment of the Model

From the above analysis, it can be seen that the 0.10 mm UTGO silicon steel has a high saturation magnetic induction strength and a high permeability; when applied to power equipment, this material can reduce the equipment’s volume and achieve miniaturization. FBA alloys have lower losses at high frequencies and can also achieve the miniaturization of power equipment. In order to ensure that the performance of the two materials can be compared, two Epstein square rings of the same specifications were designed in this work to analyze and compare the magnetic characteristics of the 0.10 mm UTGO silicon steel and the FBA alloy at higher and lower frequencies.

4.1. Structural Parameters of Epstein Square Ring

In order to compare and analyze the performance of the 0.10 mm UTGO silicon steel and FBA alloy in power equipment with the same specifications, two Epstein square rings with the same design parameters were constructed based on the electromagnetic characteristic curves measured above. To ensure the feasibility of the method, we used the Epstein square rings when measuring the 0.10 mm UTGO silicon steel to build the model and verify its reliability. The main design parameters are shown in Table 1. In medium-frequency operations, the main magnetic flux density should not be close to the saturation magnetic flux density, and a magnetic flux far away from the saturation point should be selected as the working magnetic density. Therefore, the working magnetic flux in our model is set to 1.0 T.

4.2. Computational Model

4.2.1. Electromagnetic Field Calculation Model

The finite element analysis software COMSOL Mutiphysics 6.0 is used to simulate the Epstein square ring, and the transient field is used to simulate its electromagnetic characteristics. The following assumptions are made before performing the calculation: the core, winding, and other materials are isotropic; the influence of the lead current and displacement current on the magnetic field is not considered; and there is no free charge in the Epstein frame. The mathematical calculation of the Epstein square ring is used for the electromagnetic field; the equations involved are as follows:
× H = J
B = × A
J = σ E + J e
E = A t
The constitutive relation of the equation is
B = μ H
According to Equations (1)–(5), the vector magnetic potential equation of the magnetic field of the Epstein square ring is derived as follows:
1 μ 2 A x 2 + 2 A y 2 + 2 A z 2 = σ A t + J e
where B represents the magnetic induction intensity vector; H represents the magnetic field intensity vector; E denotes the electric field intensity vector; A represents the vector magnetic potential; J represents the current density; Je represents the external current density; σ is the conductivity; and μ is the permeability.

4.2.2. Loss Calculation Model

Although it is desirable to reduce the volume of the power equipment by increasing the operating frequency, a higher operating frequency and a smaller volume leads to a smaller surface area through which heat can be dissipated; this also leads to a rapid increase in the high-frequency loss of the core and winding, resulting in low power transmission efficiency [21,22]. Therefore, it is necessary to calculate and analyze the loss.
There are two main methods for calculating the core loss under sinusoidal excitation: namely, the iron loss separation method and the Steinmetz empirical formula. According to the different mechanisms of magnetic core loss, the Bertotti iron loss separation method decomposes the magnetic core loss into hysteresis loss, eddy current loss, and residual loss. The formula of the iron loss separation method under sinusoidal excitation is as follows [23]:
P V = P h + P e + P c = k h B m α f + k e B m 2 f 2 + k c B m 1.5 f 1.5
where PV is the total loss, kh is the hysteresis loss coefficient, ke is the eddy current loss coefficient, kc is the residual loss coefficient, and α is the magnetic density coefficient.
Generally, as long as the magnetic core loss experimental data measured under sinusoidal excitation are fitted, the magnetic core loss coefficient and the magnetic flux density index value can be obtained, following which, the analytical formula of the iron loss separation method can be obtained.
As the degree of saturation increases, a local hysteresis loop will be produced, which will increase the hysteresis loss. If the coefficient α is fitted with only one constant, the error between the fitting value of the hysteresis loss and the measured value will increase when the peak magnetic induction intensity, Bm, is higher. Moreover, the hysteresis loss, Ph, is the energy loss caused by the magnetic domain overcoming the field force during the rotation process. Its size depends on the intensity, Bm, of the magnetic flux density, and is independent of the frequency, f, of the external excitation [24]. Therefore, we express α in the form of a Bm polynomial [25], namely
α B m = α 3 B m 3 + α 2 B m 2 + α 1 B m + α 0
In the above formula, αi (i = 0, 1, 2, 3) is the coefficient of the i-th power of Bm, and αi is obtained by fitting the measured values.
The hysteresis loss formula can be obtained as follows:
P h = k h B m α 3 B m 3 + α 2 B m 2 + α 1 B m + α 0 f
The coefficient of the hysteresis loss of the 0.10 mm UTGO silicon steel and the FBA alloy can be obtained using the least square method, as shown in Table 2.
At this time, the total loss PV is
P V = k h B m α 3 B m 3 + α 2 B m 2 + α 1 B m + α 0 f + k e B m 2 f 2 + k c B m 1.5 f 1.5

4.3. Finite Element Calculation Model

The finite element model presented in this paper is an idealized three-dimensional model used to calculate the flux and loss of the magnetic material surrounded by the coil. The loss is mainly concentrated on the magnetic material surrounded by the coil, and the loss at the corners is extremely low, meaning the error is within a controllable range. Firstly, a three-dimensional model of the Epstein frame is established according to the design parameters in the finite element calculation software COMSOL Mutiphysics 6.0 [26]. The magnetic properties of the 0.10 mm ultra-thin silicon steel sheet and the amorphous alloy measured above are added to the three-dimensional model, including the magnetization curve and density. The magnetic field–physical field interface is integrated in order to combine the calculation model with the three-dimensional model of the Epstein frame, and the corresponding excitation is applied to the coil. The model is then meshed.

5. Results and Discussion

In order to make the comparison of the electromagnetic properties of the 0.10 mm UTGO silicon steel and FBA alloy more intuitive and reliable, this work uses the same Epstein square ring specifications to compare and analyze the electromagnetic properties of these materials.

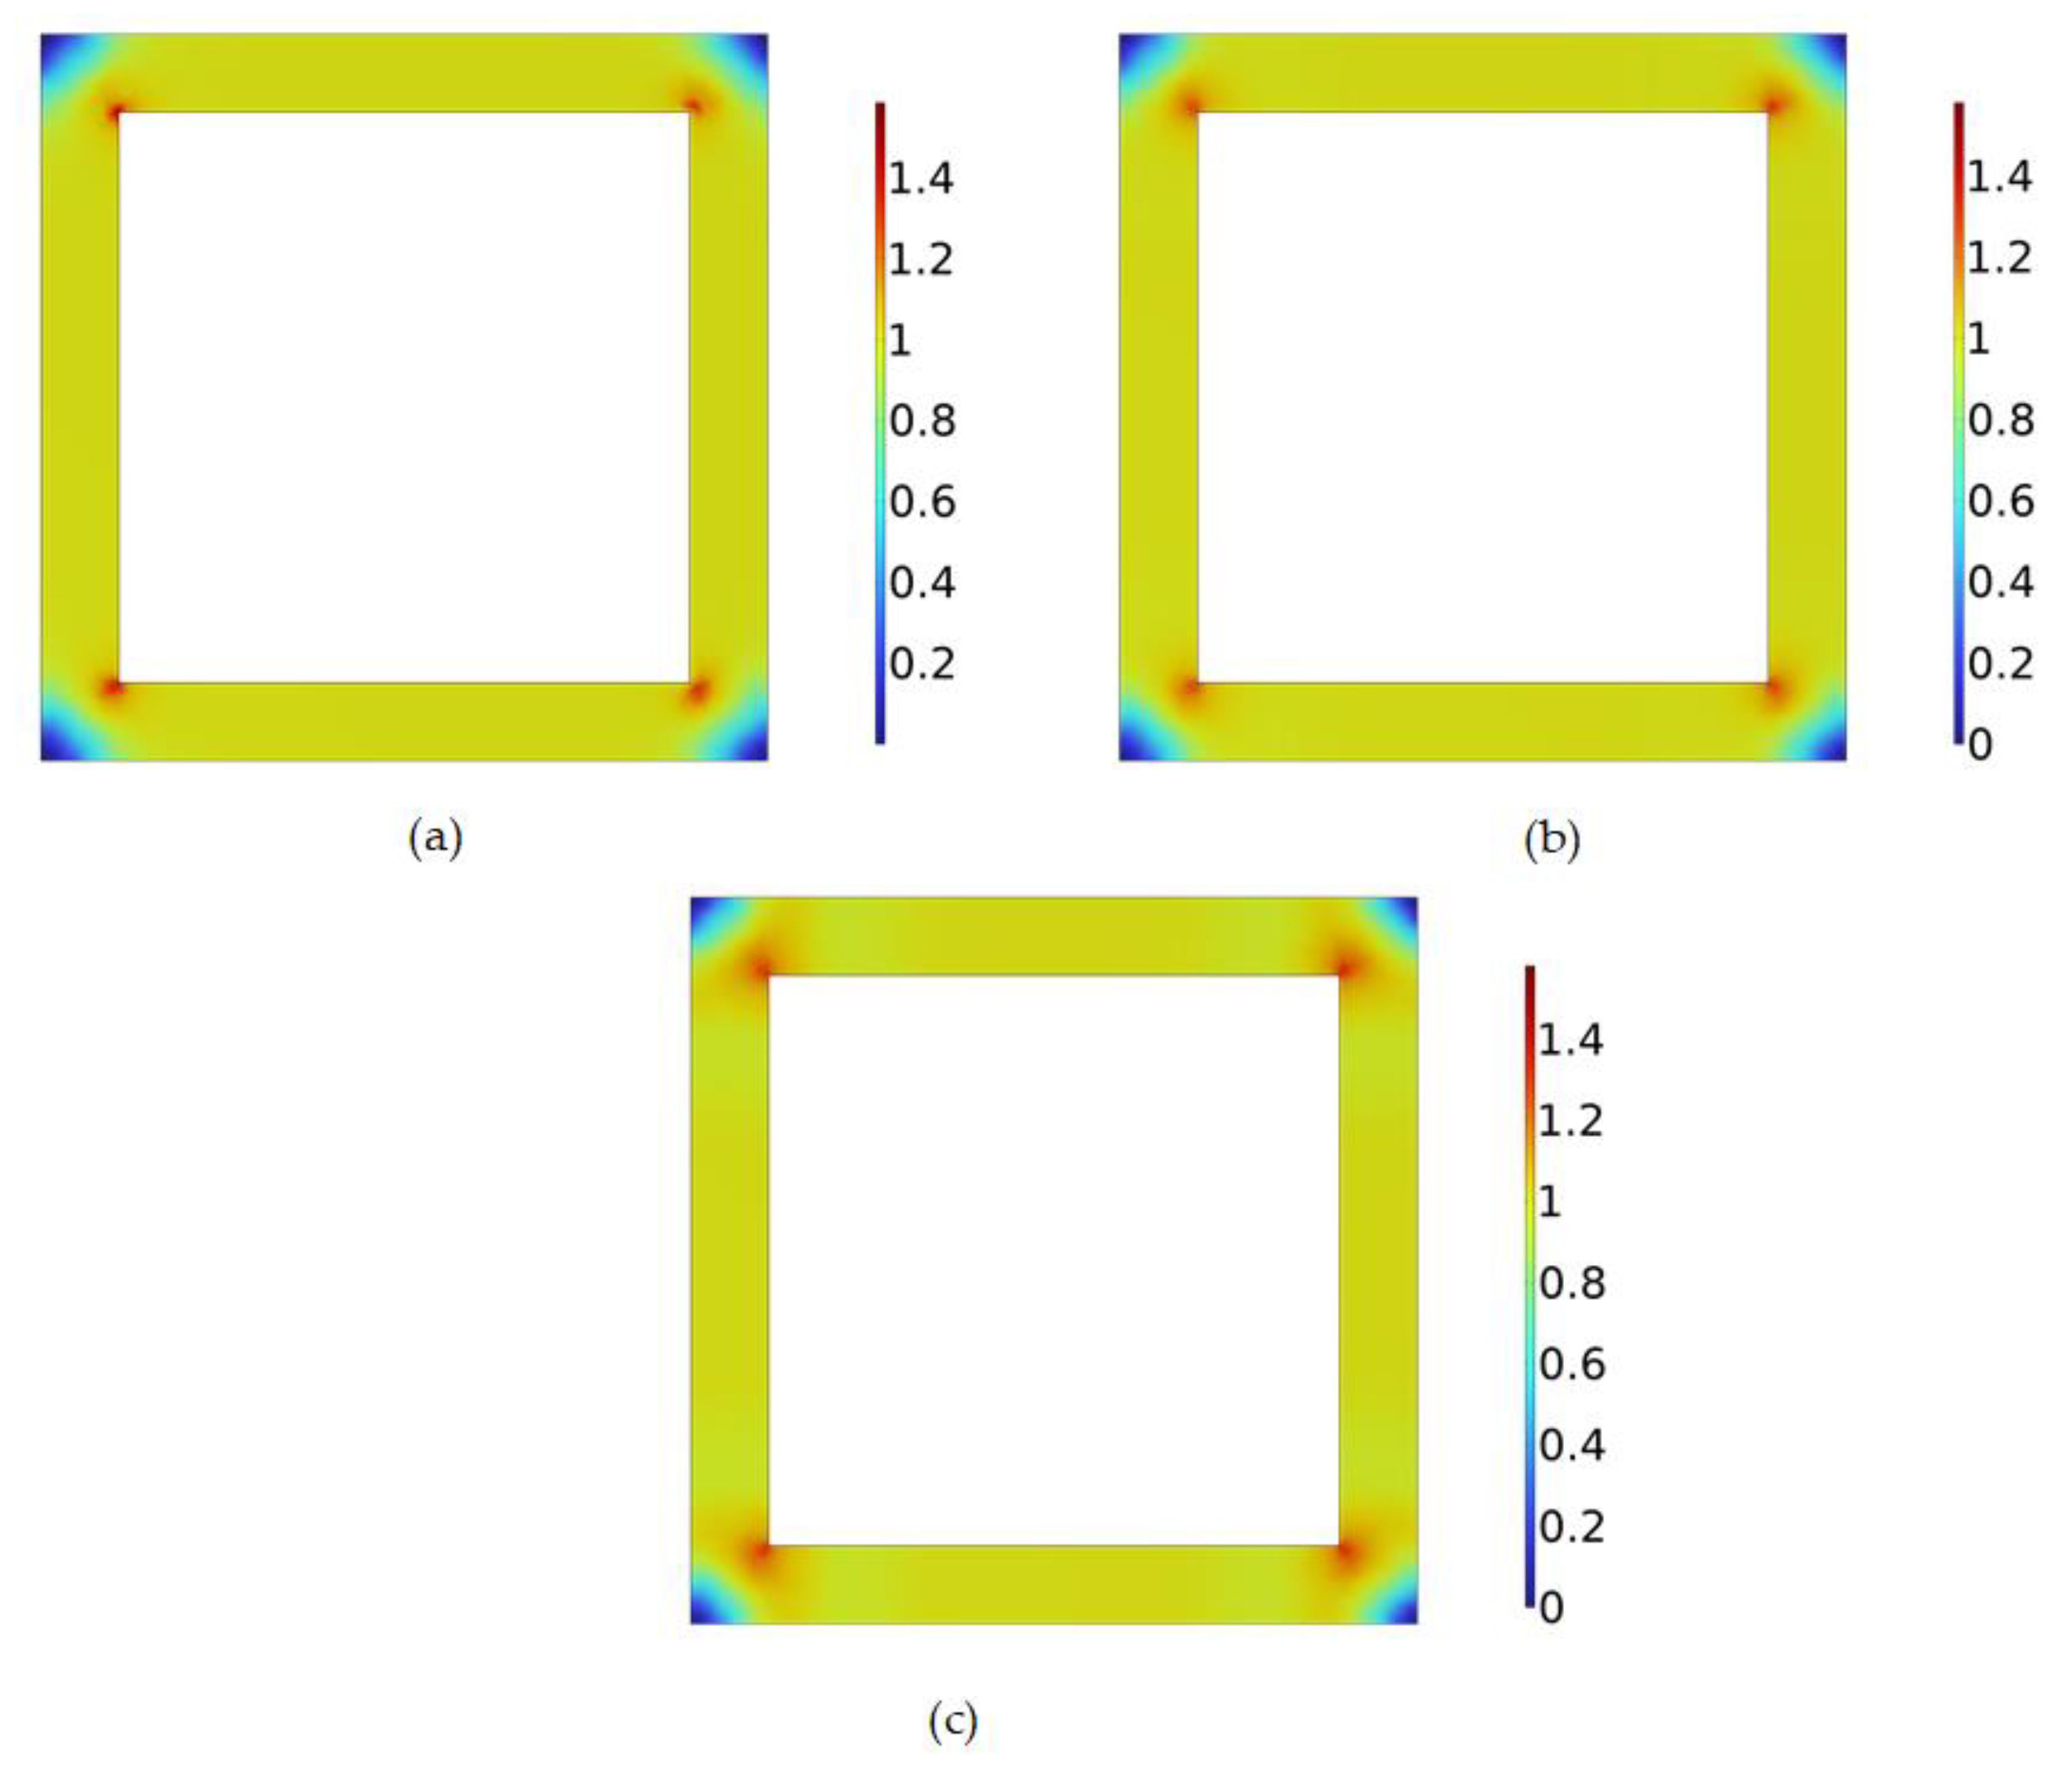
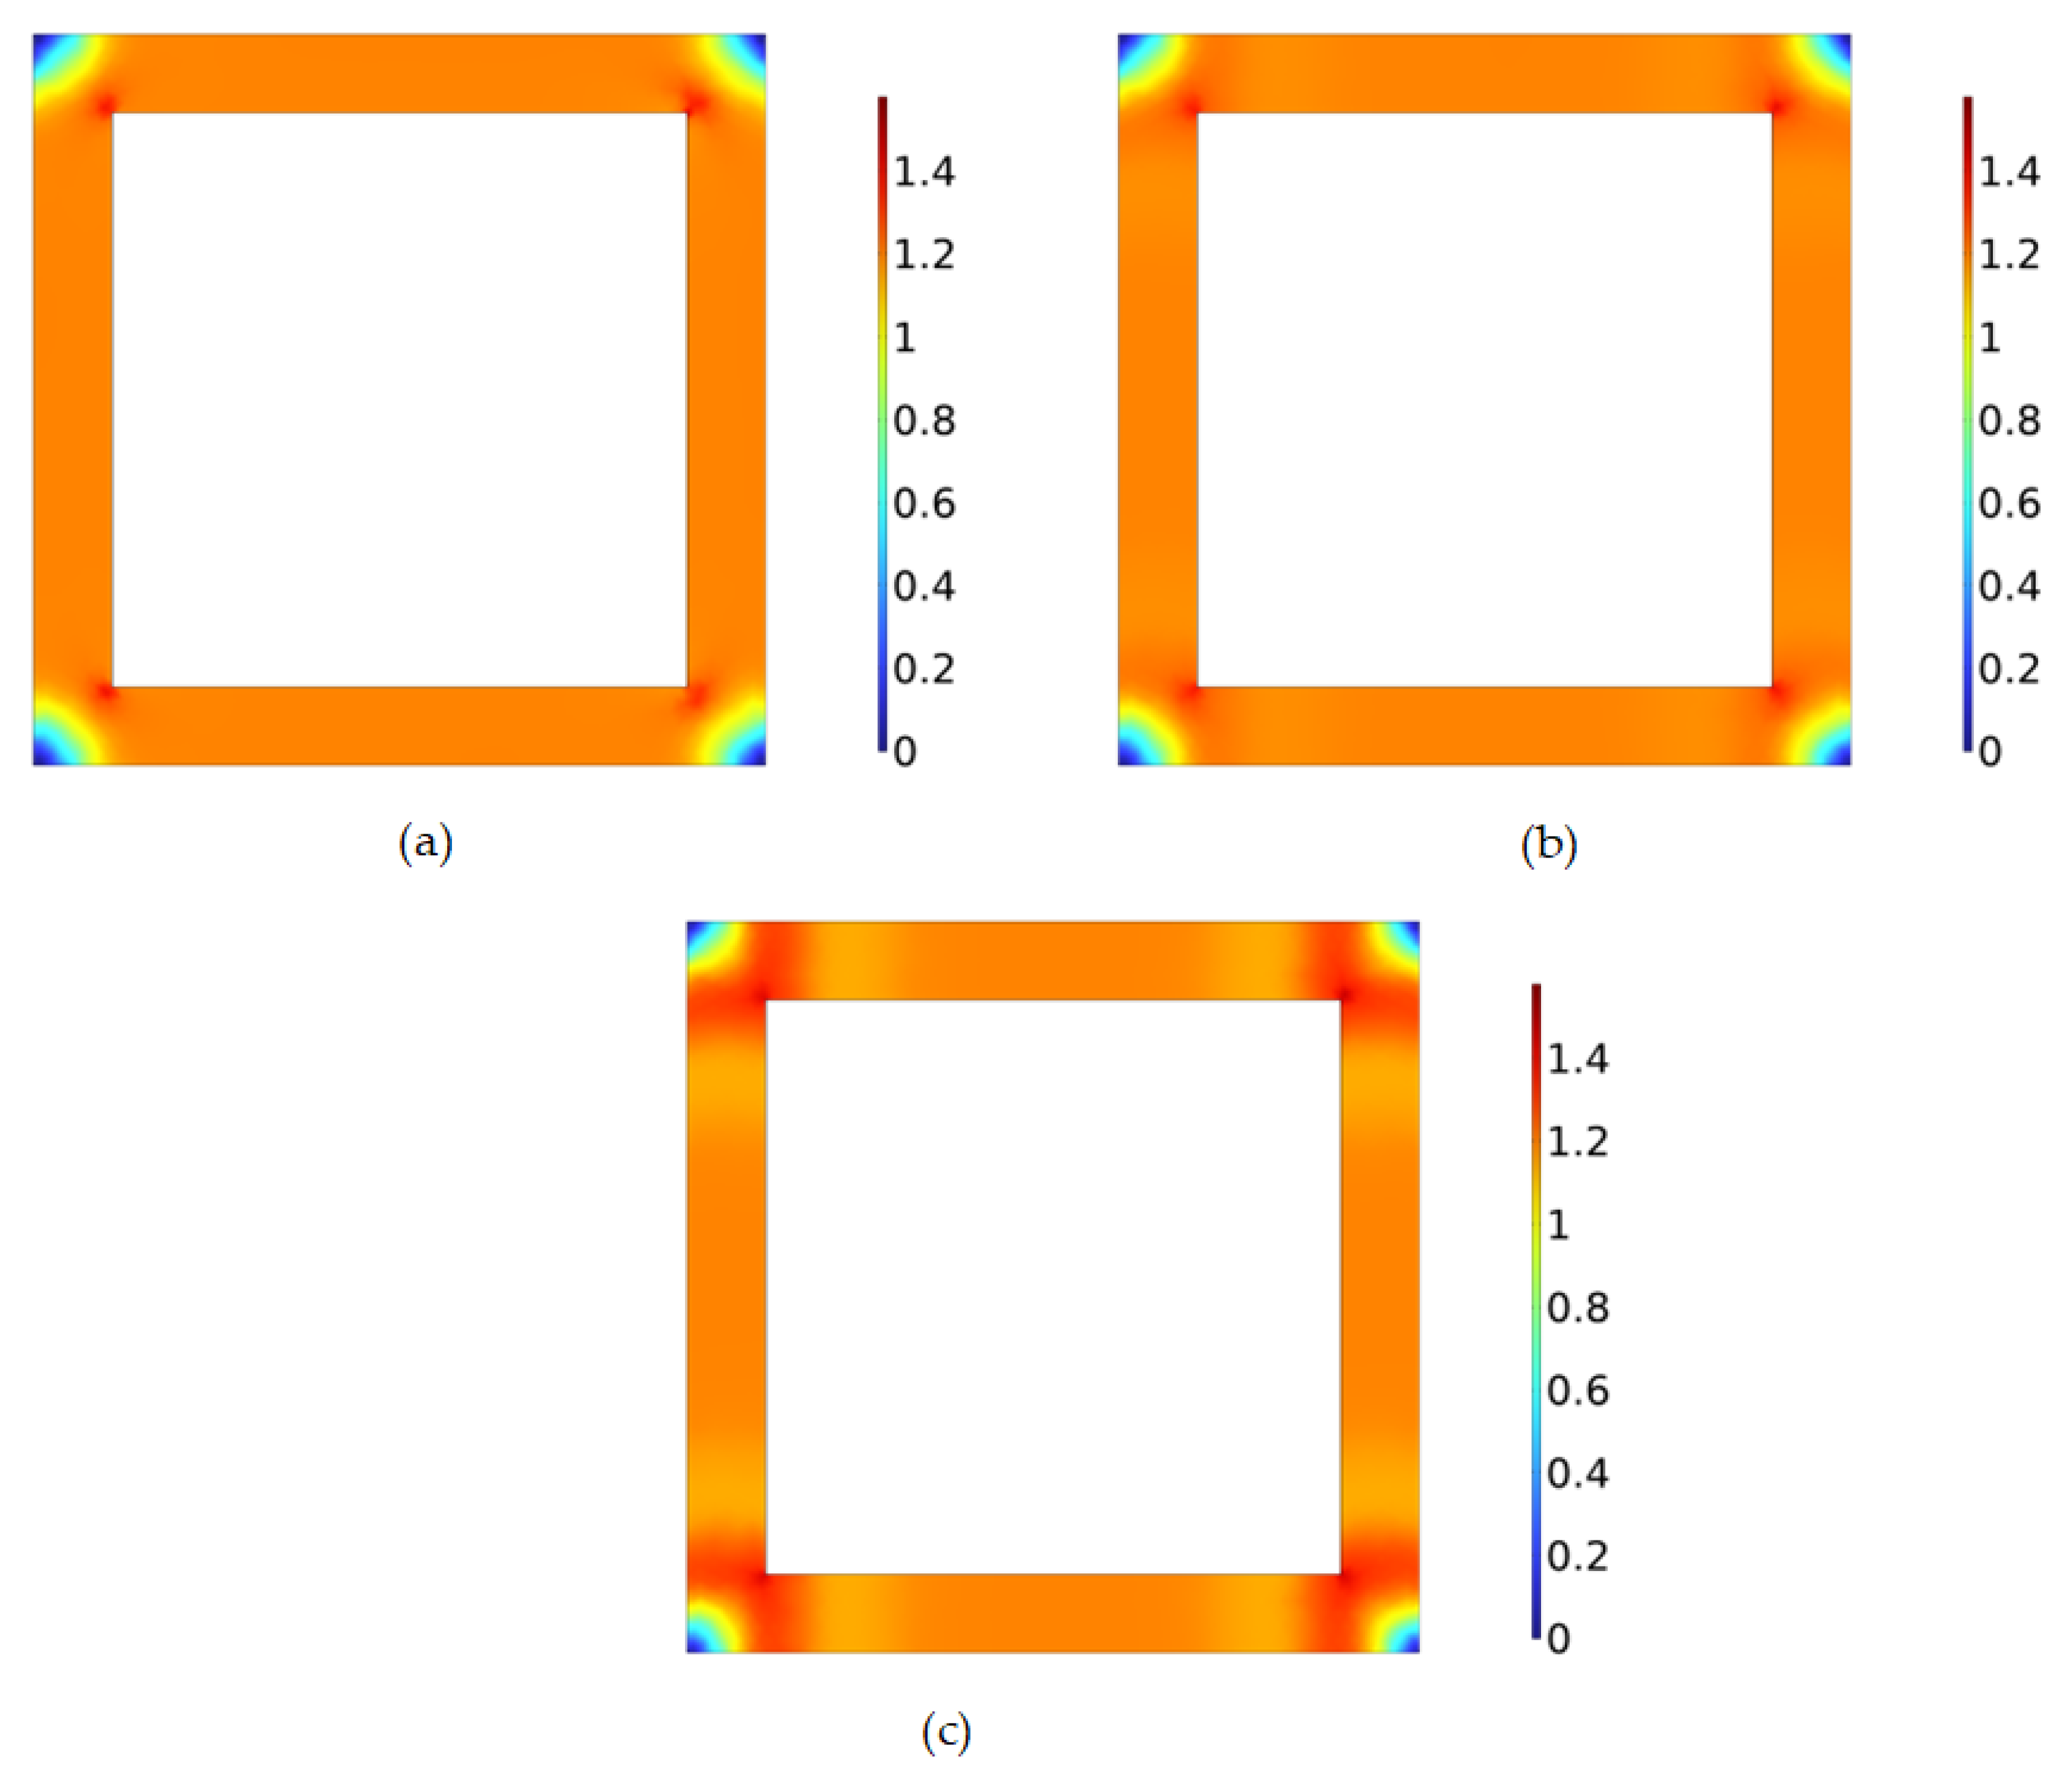
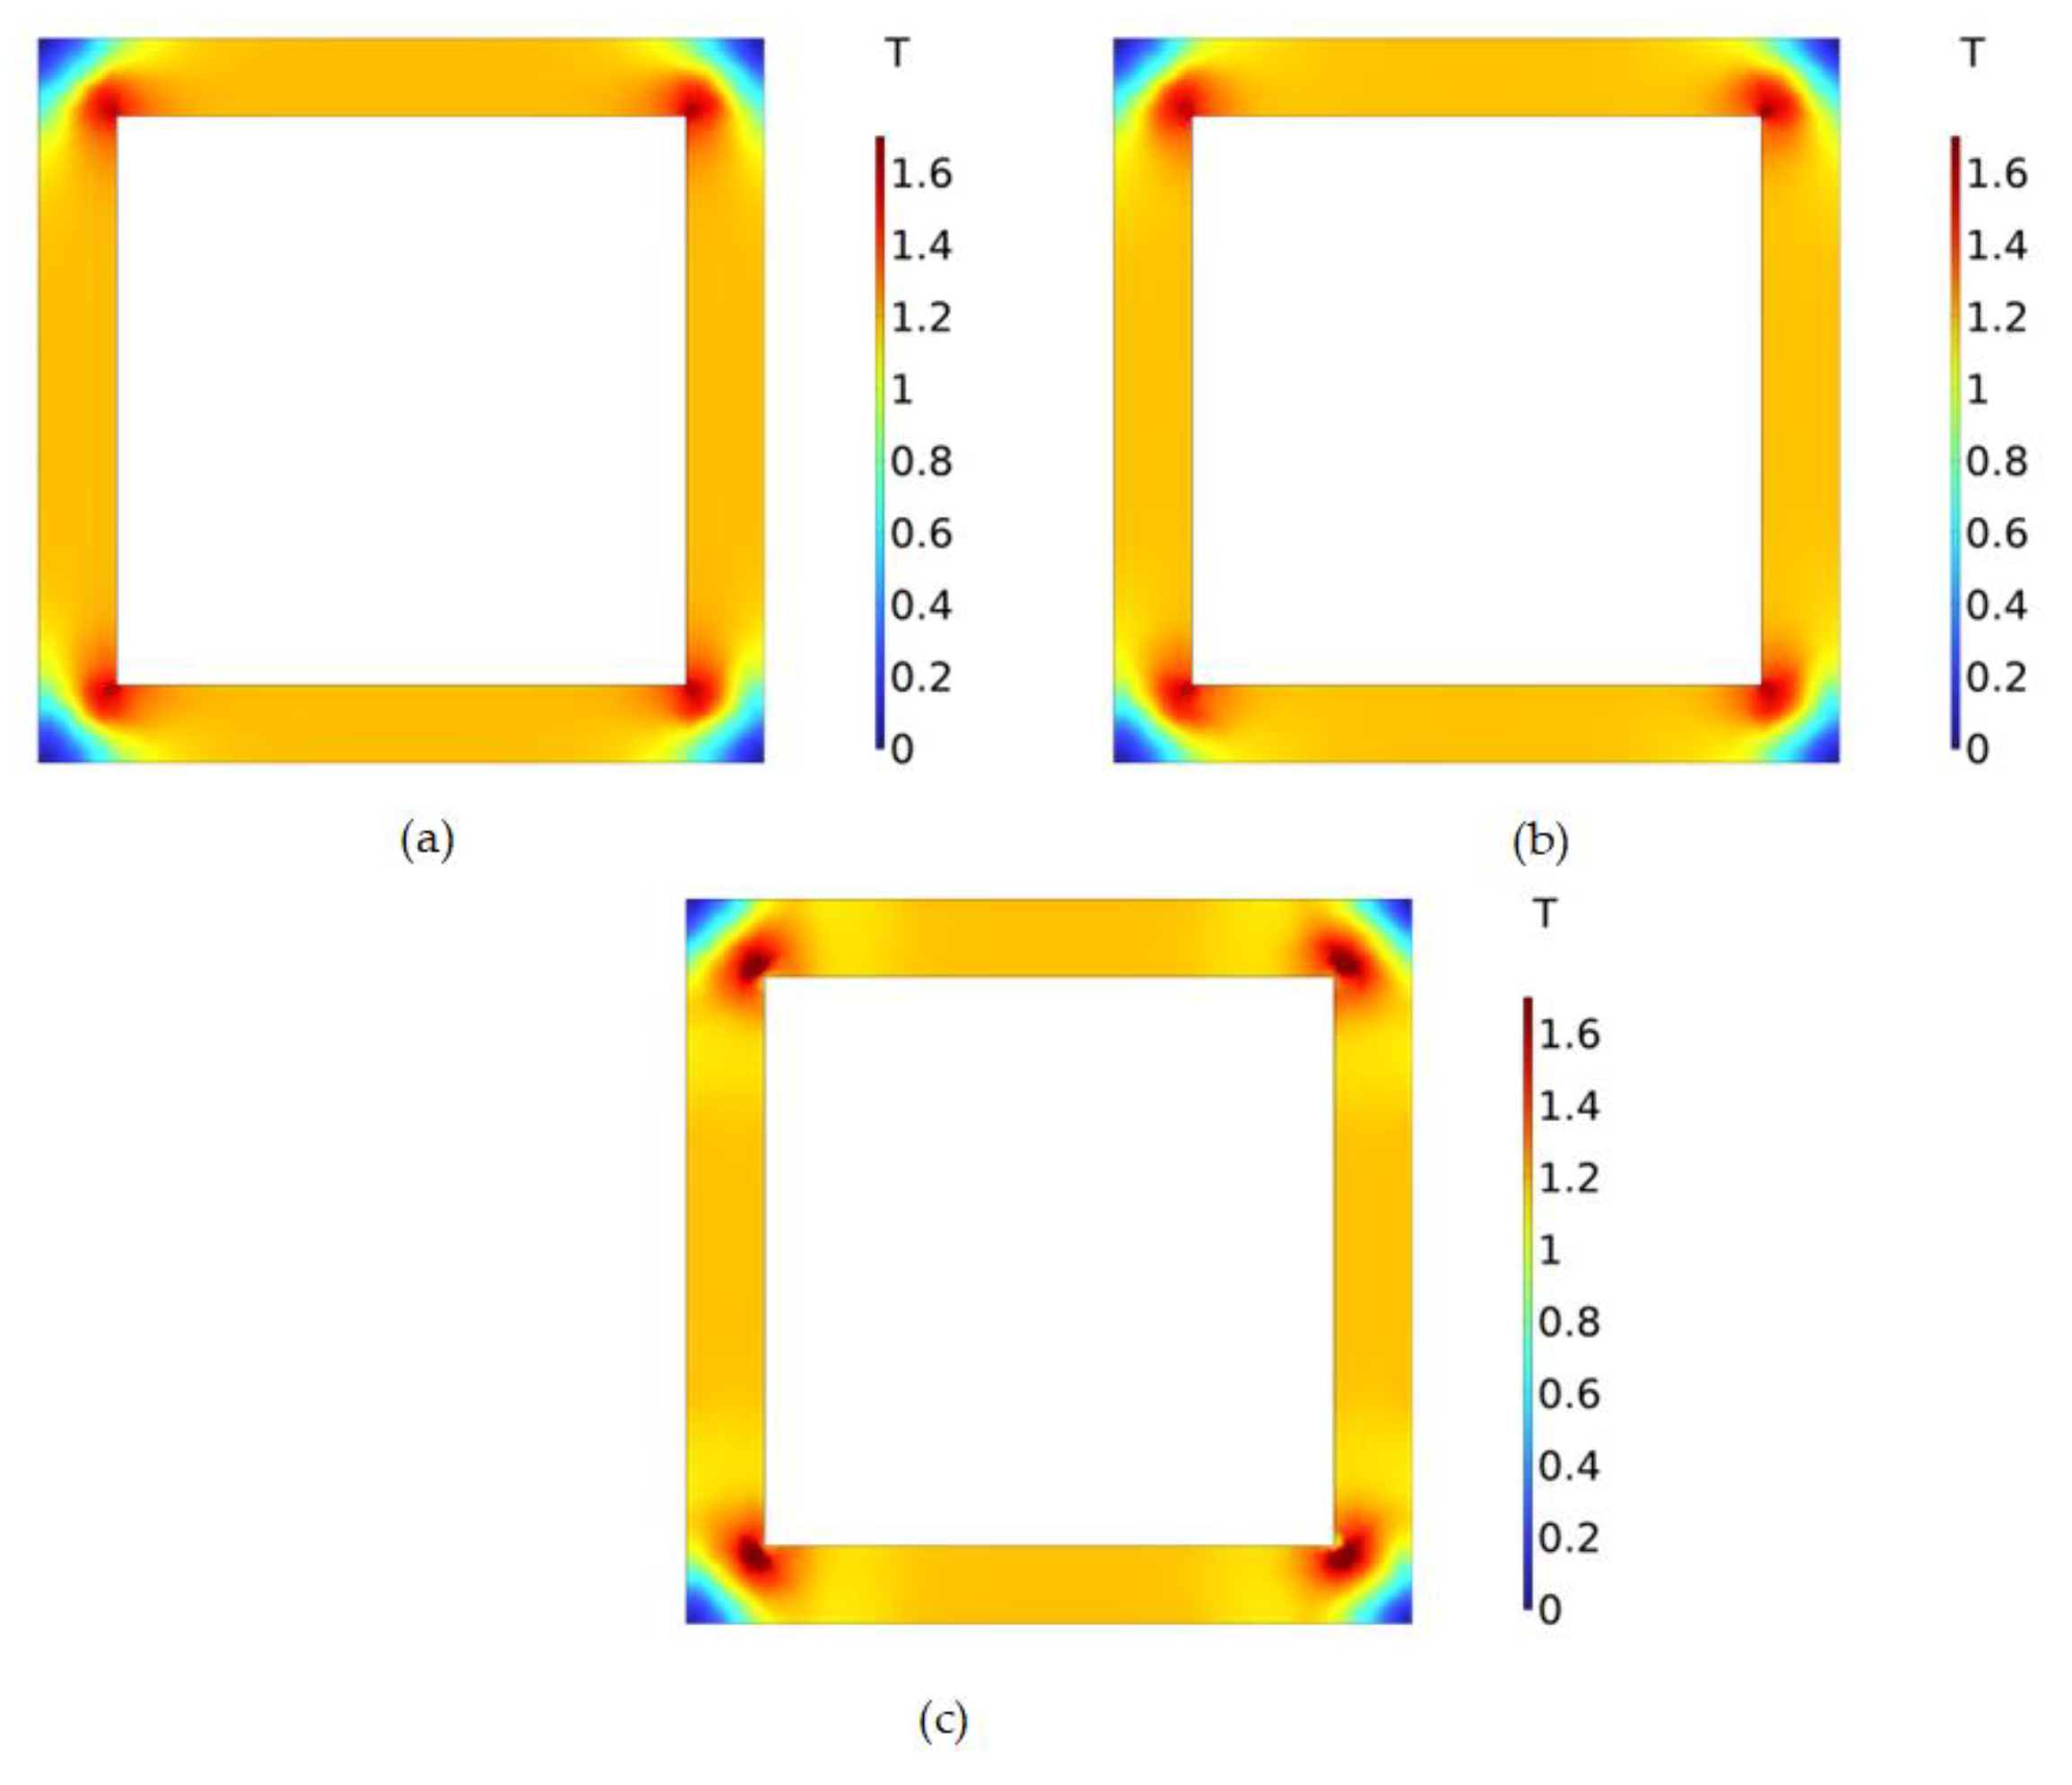
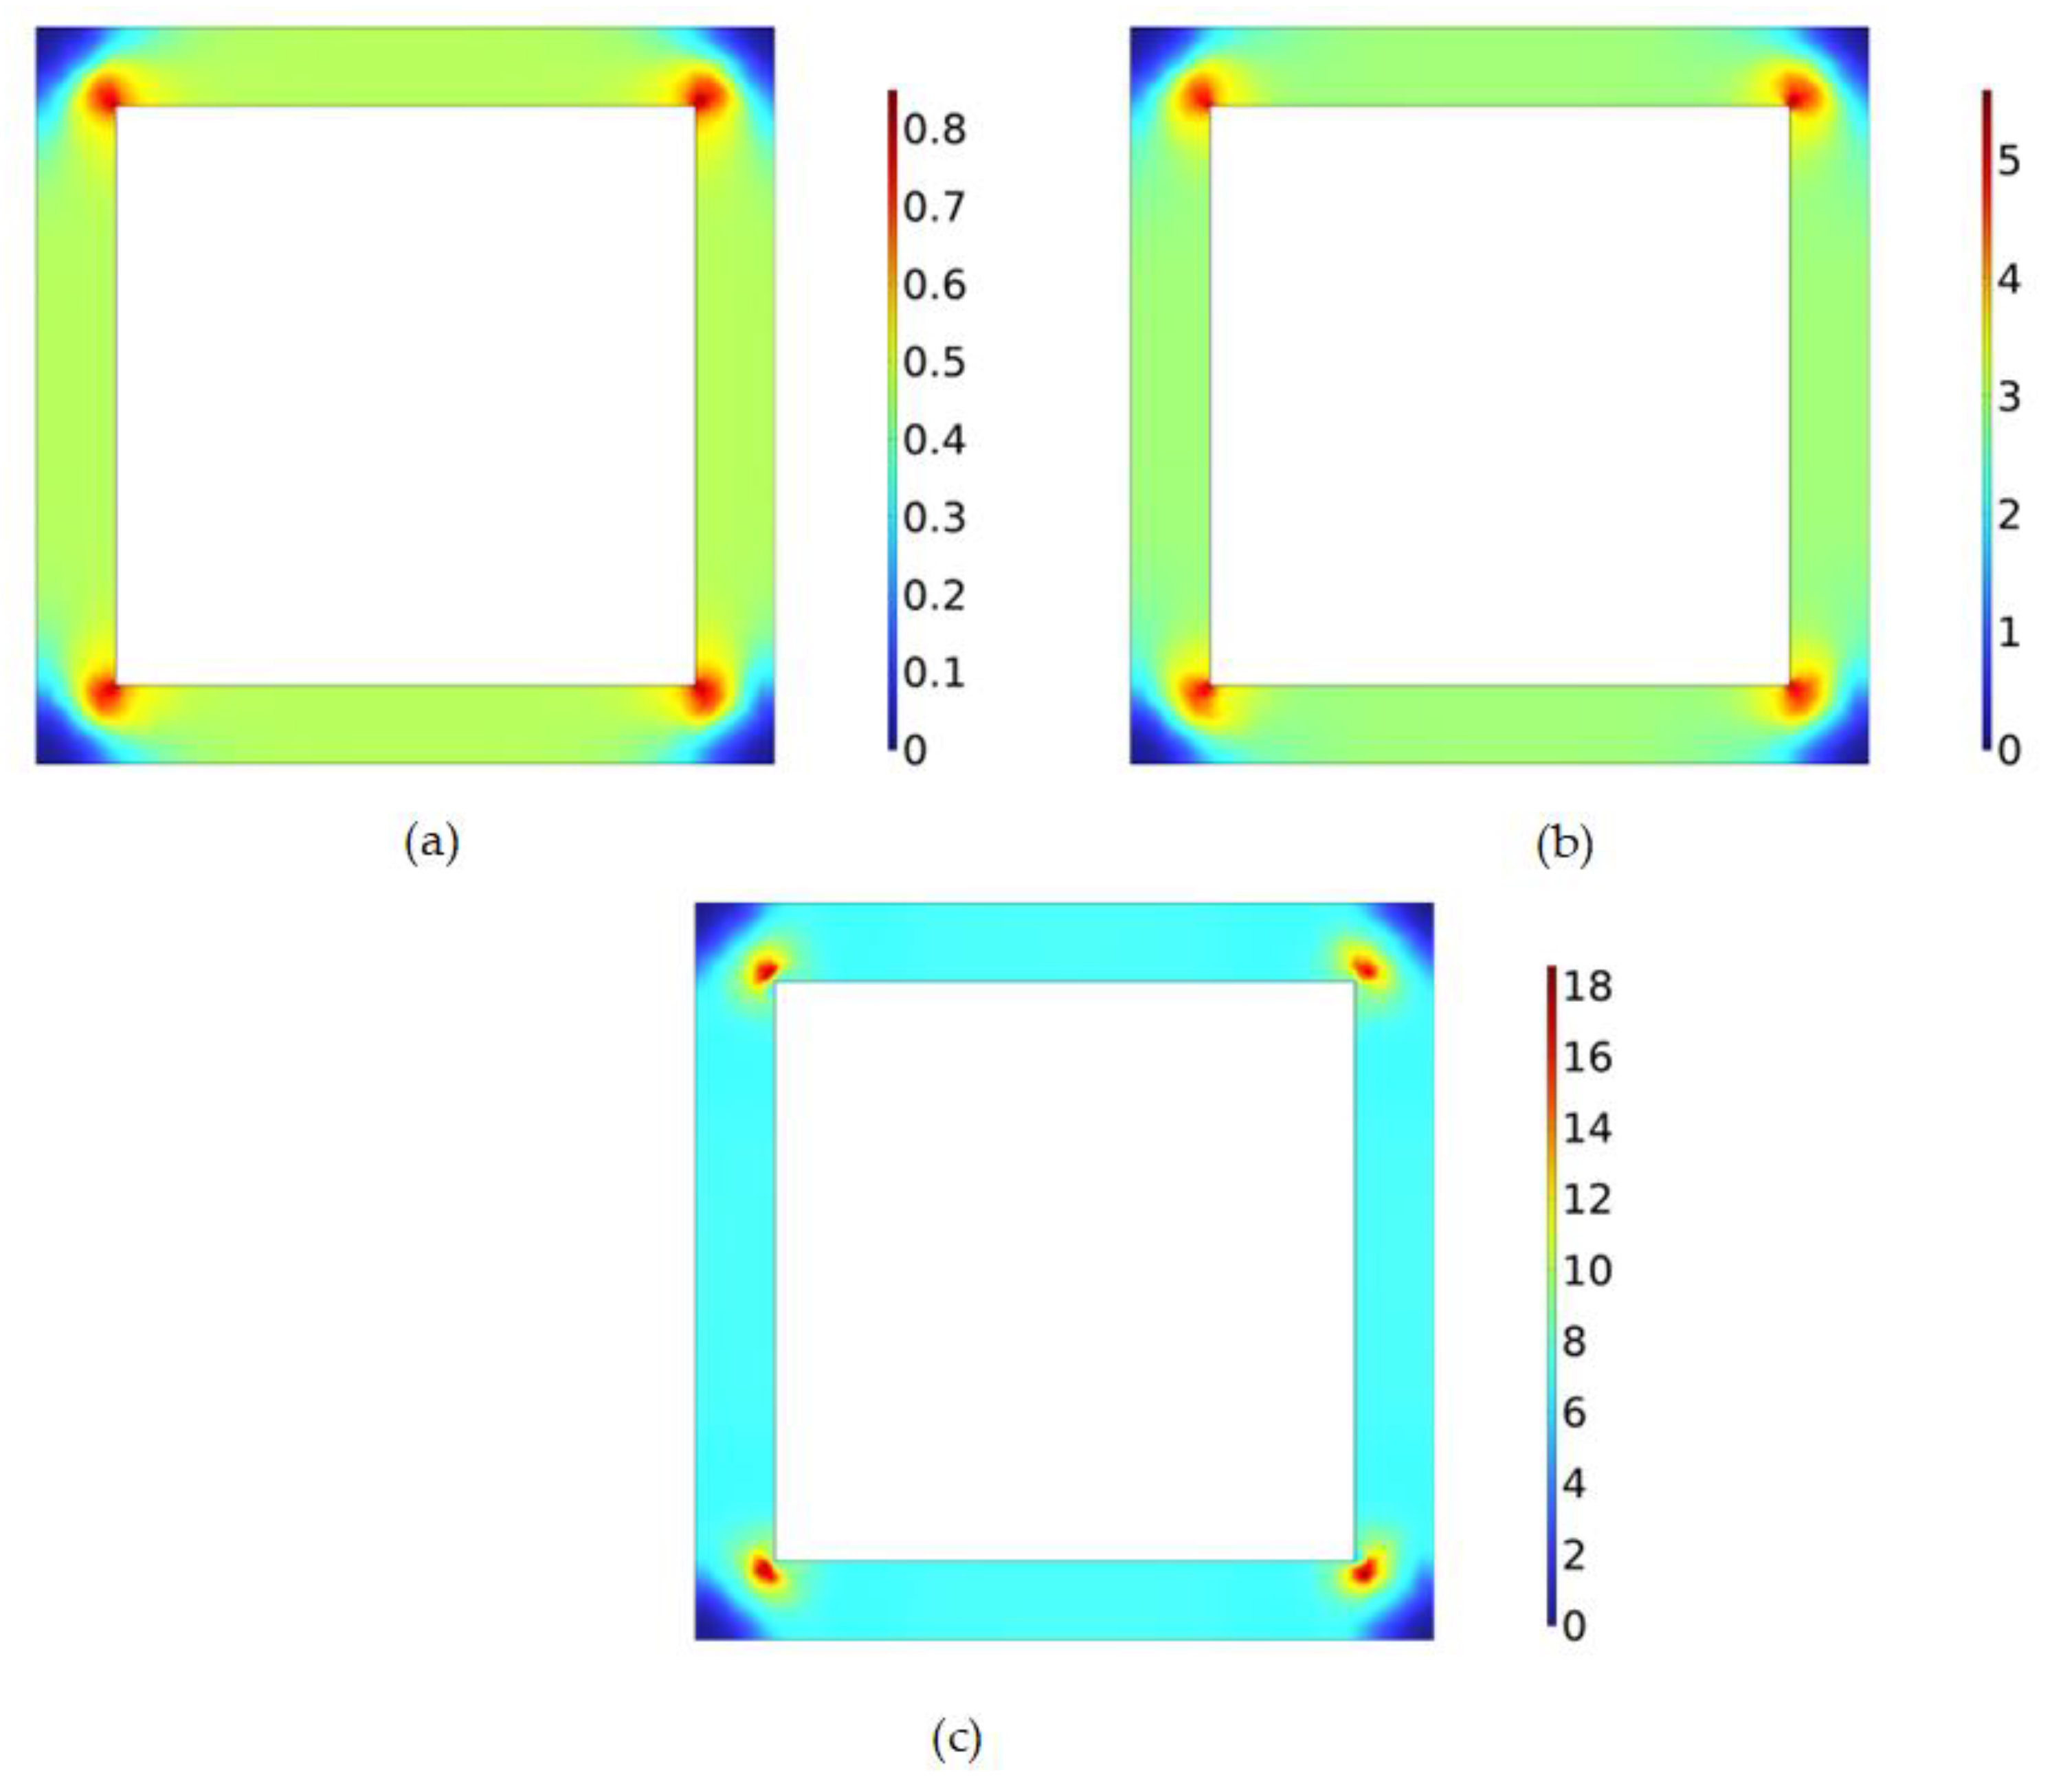
5.1. Magnetic Flux Density Cloud of Epstein Square Ring

To analyze the distribution of the magnetic flux density in the Epstein frame more intuitively, this paper obtains the magnetic flux density distribution of the FBA alloy and the 0.10 mm UTGO silicon steel Epstein frames at different frequencies at magnetic flux densities of 1.0 T and 1.2 T, as shown in Figure 7, Figure 8, Figure 9 and Figure 10.
It can be seen from these diagrams that the magnetic density distribution of the Epstein square rings is the same and uniform on each side. Moreover, the magnetic flux density is high and unevenly distributed only at the corners. With the increase in frequency, the magnetic flux density at the corner of the Epstein square ring also increases significantly, while the magnetic flux density at locations other than the corner remains unchanged. At the same frequency, the magnetic induction intensity at the corners of the 0.10 mm UTGO silicon steel Epstein square ring is higher than in the FBA alloy Epstein square ring. With the increase in the working magnetic flux density, the magnetic flux density at the corners of the Epstein square ring also increases significantly and tends to be more saturated.

5.2. Epstein Square Ring Loss Calculation Results

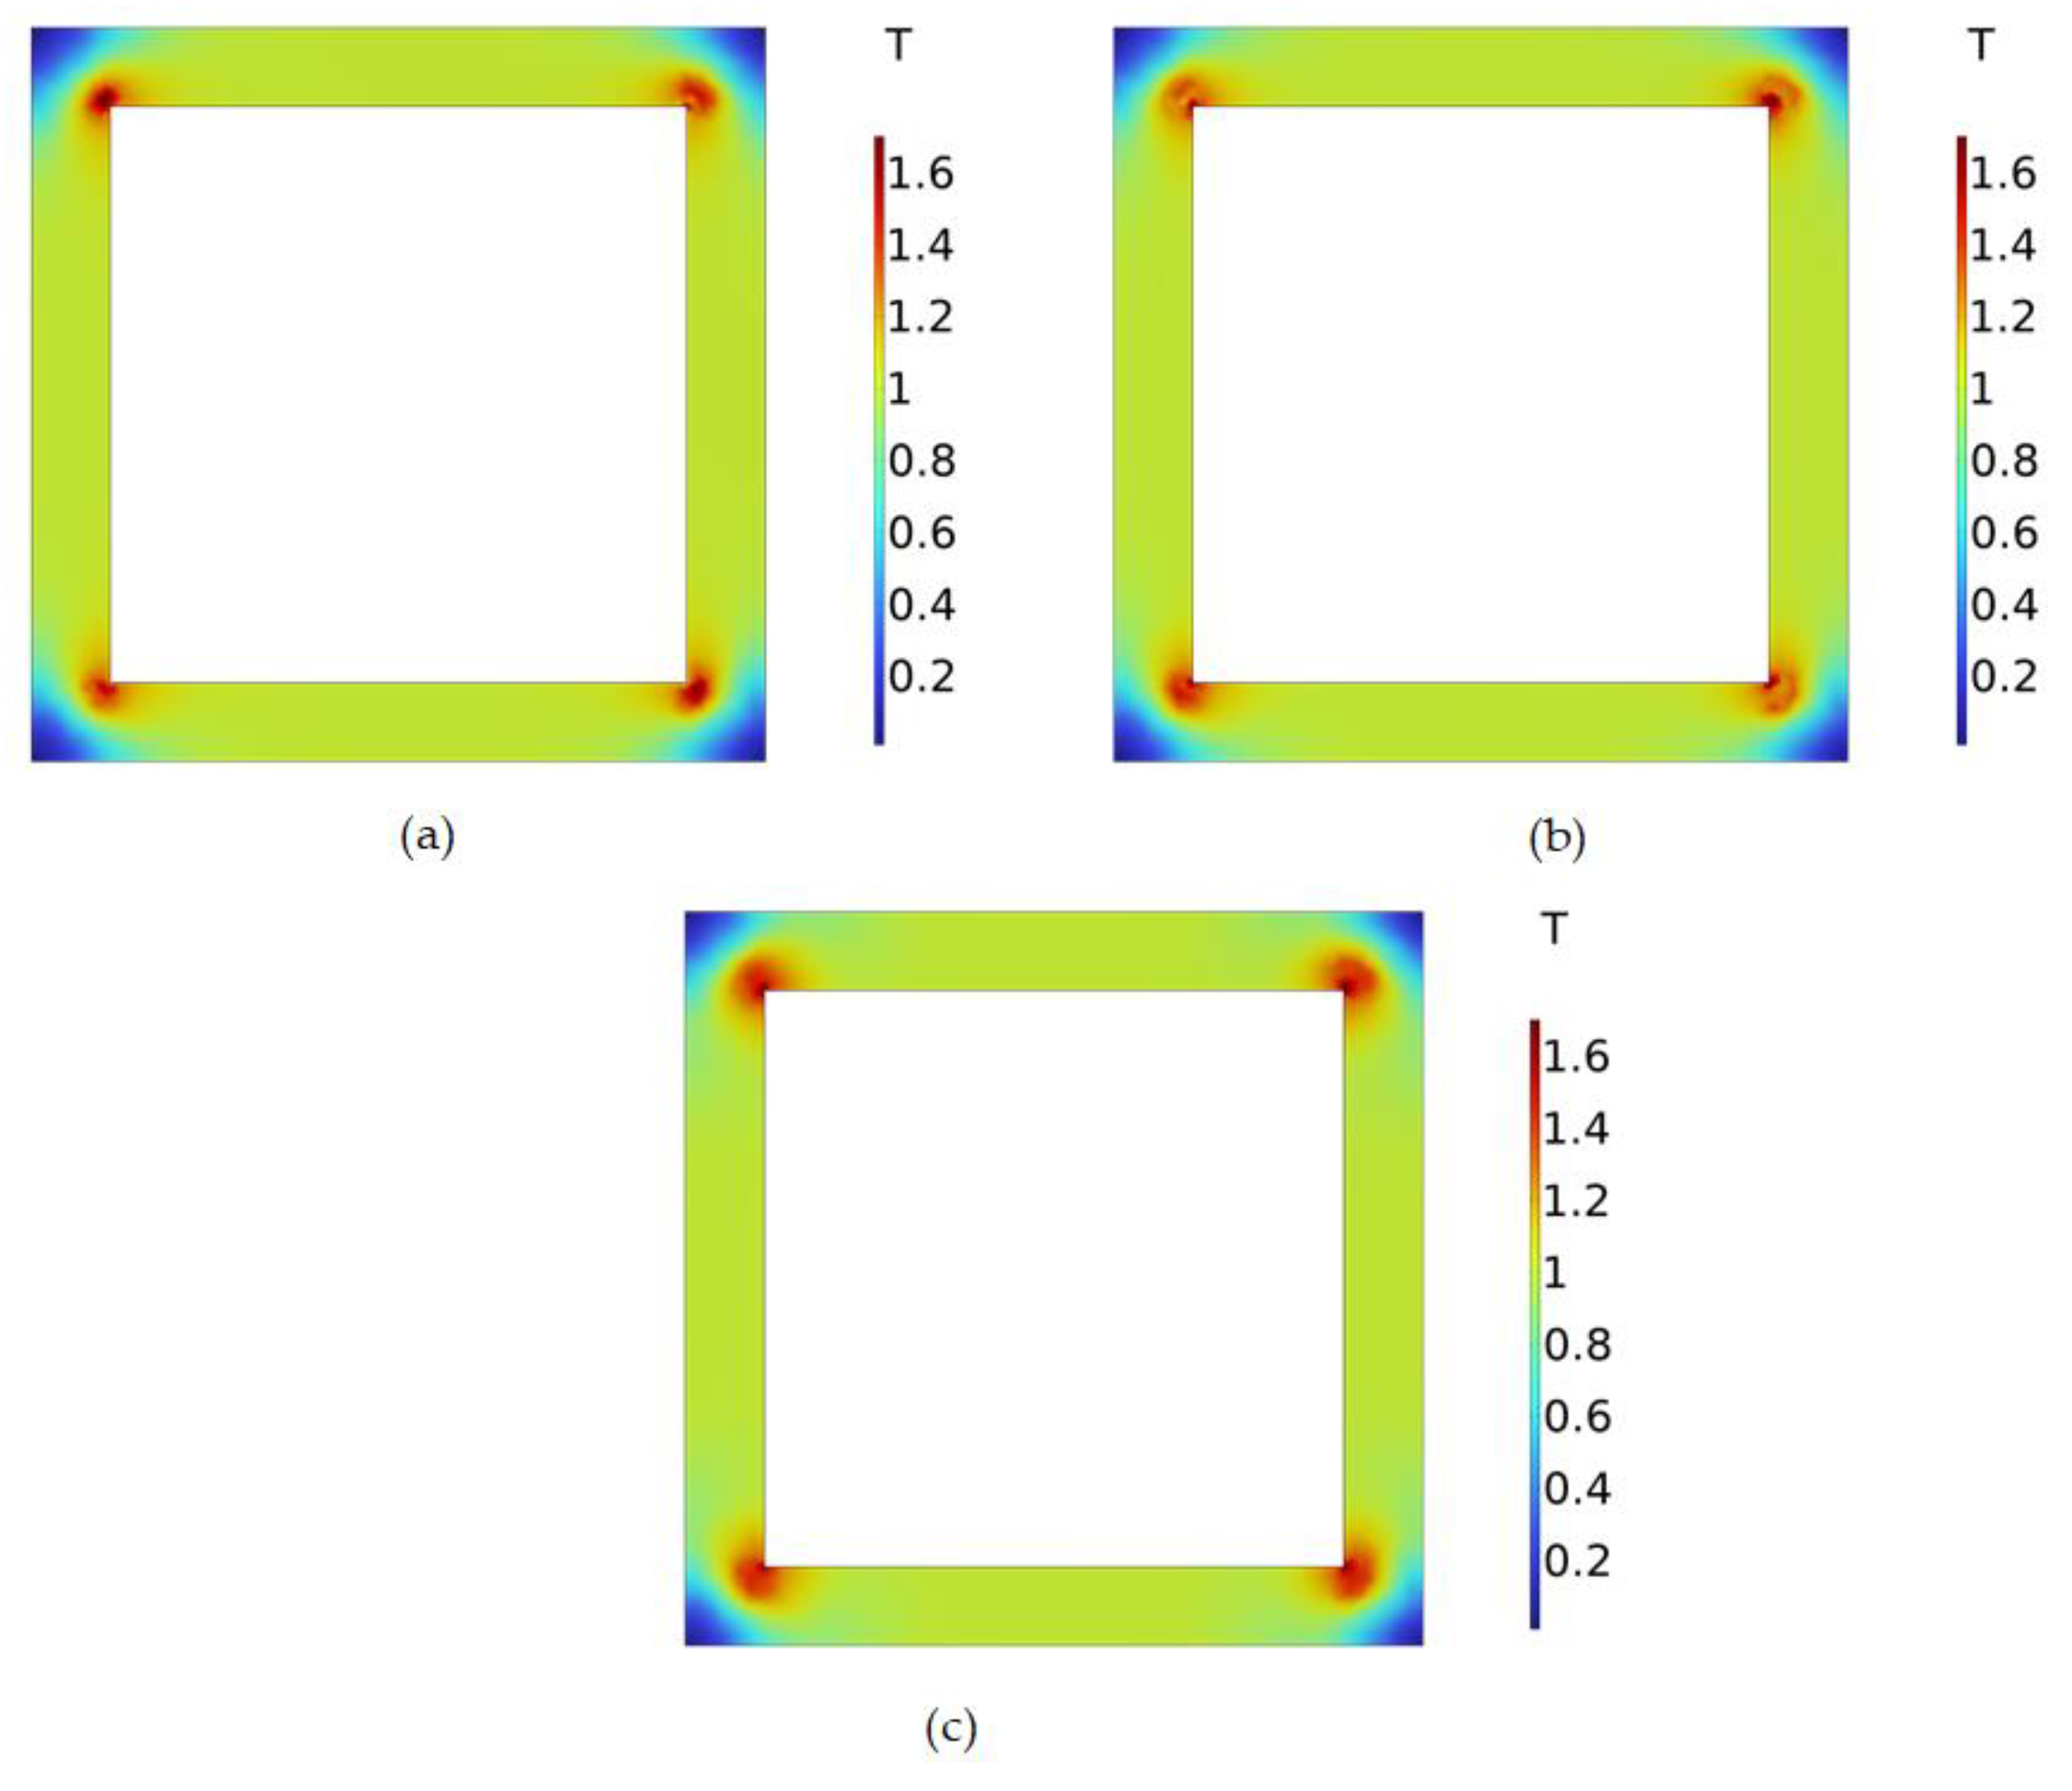
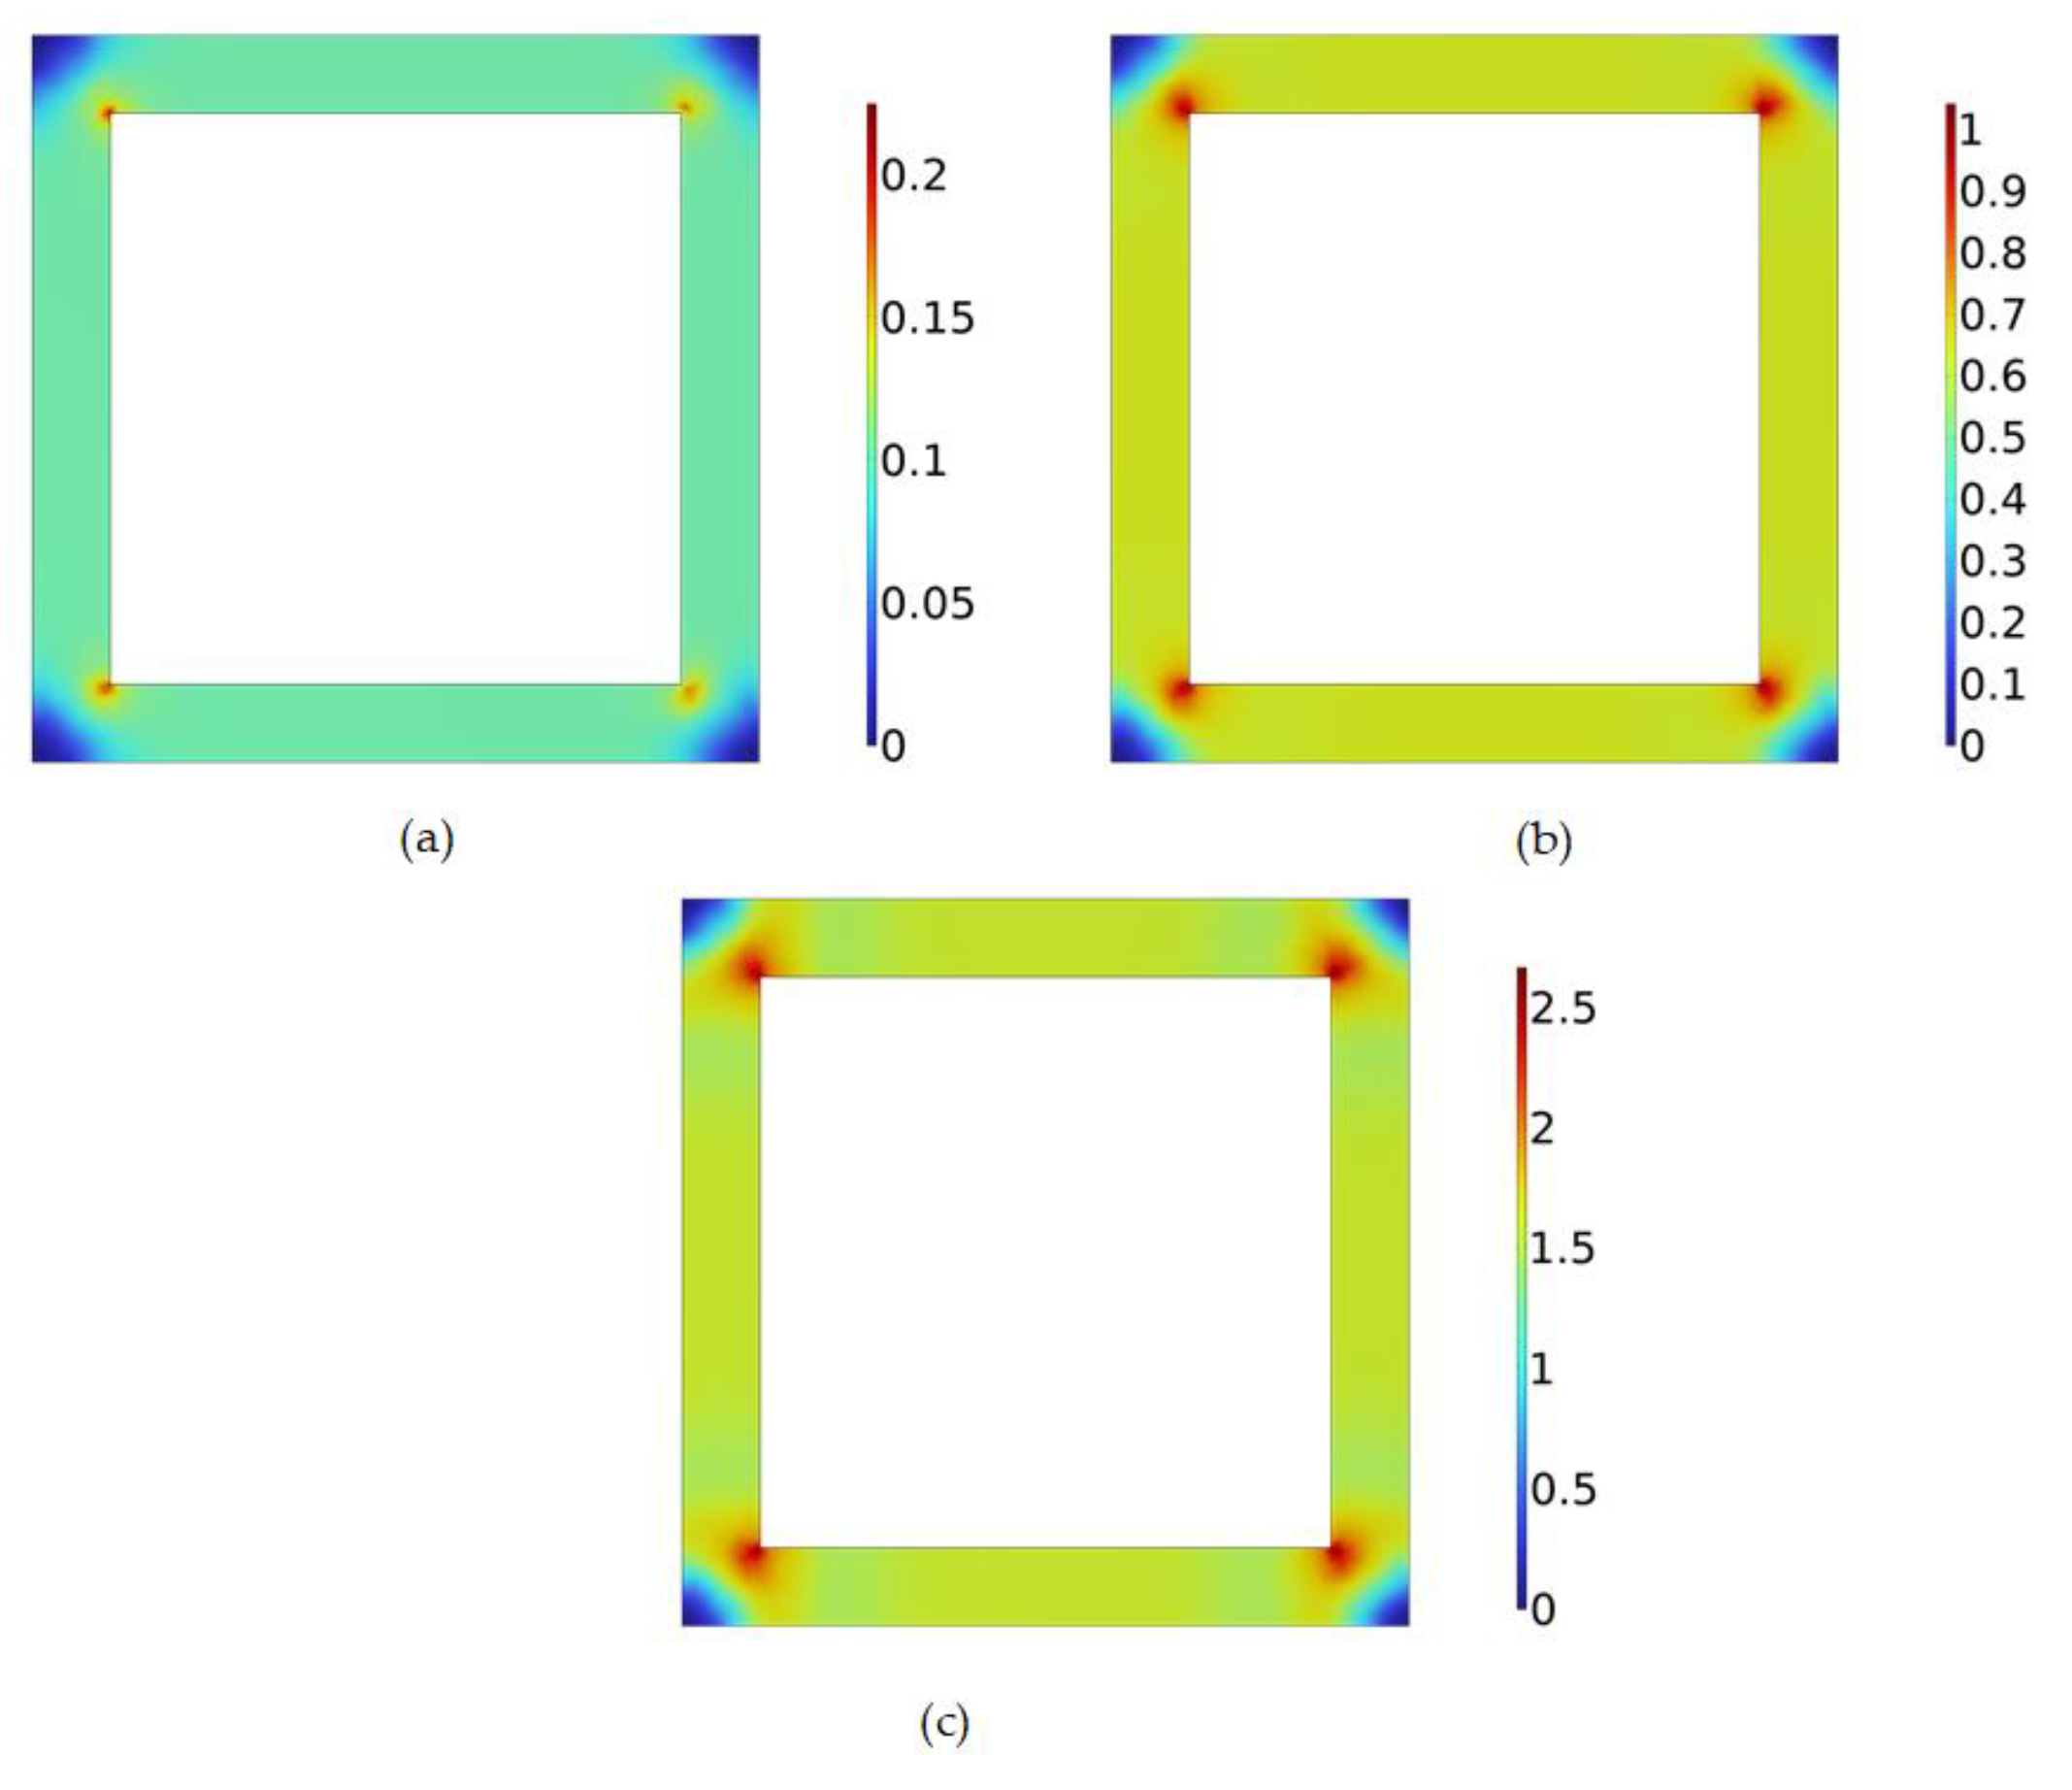
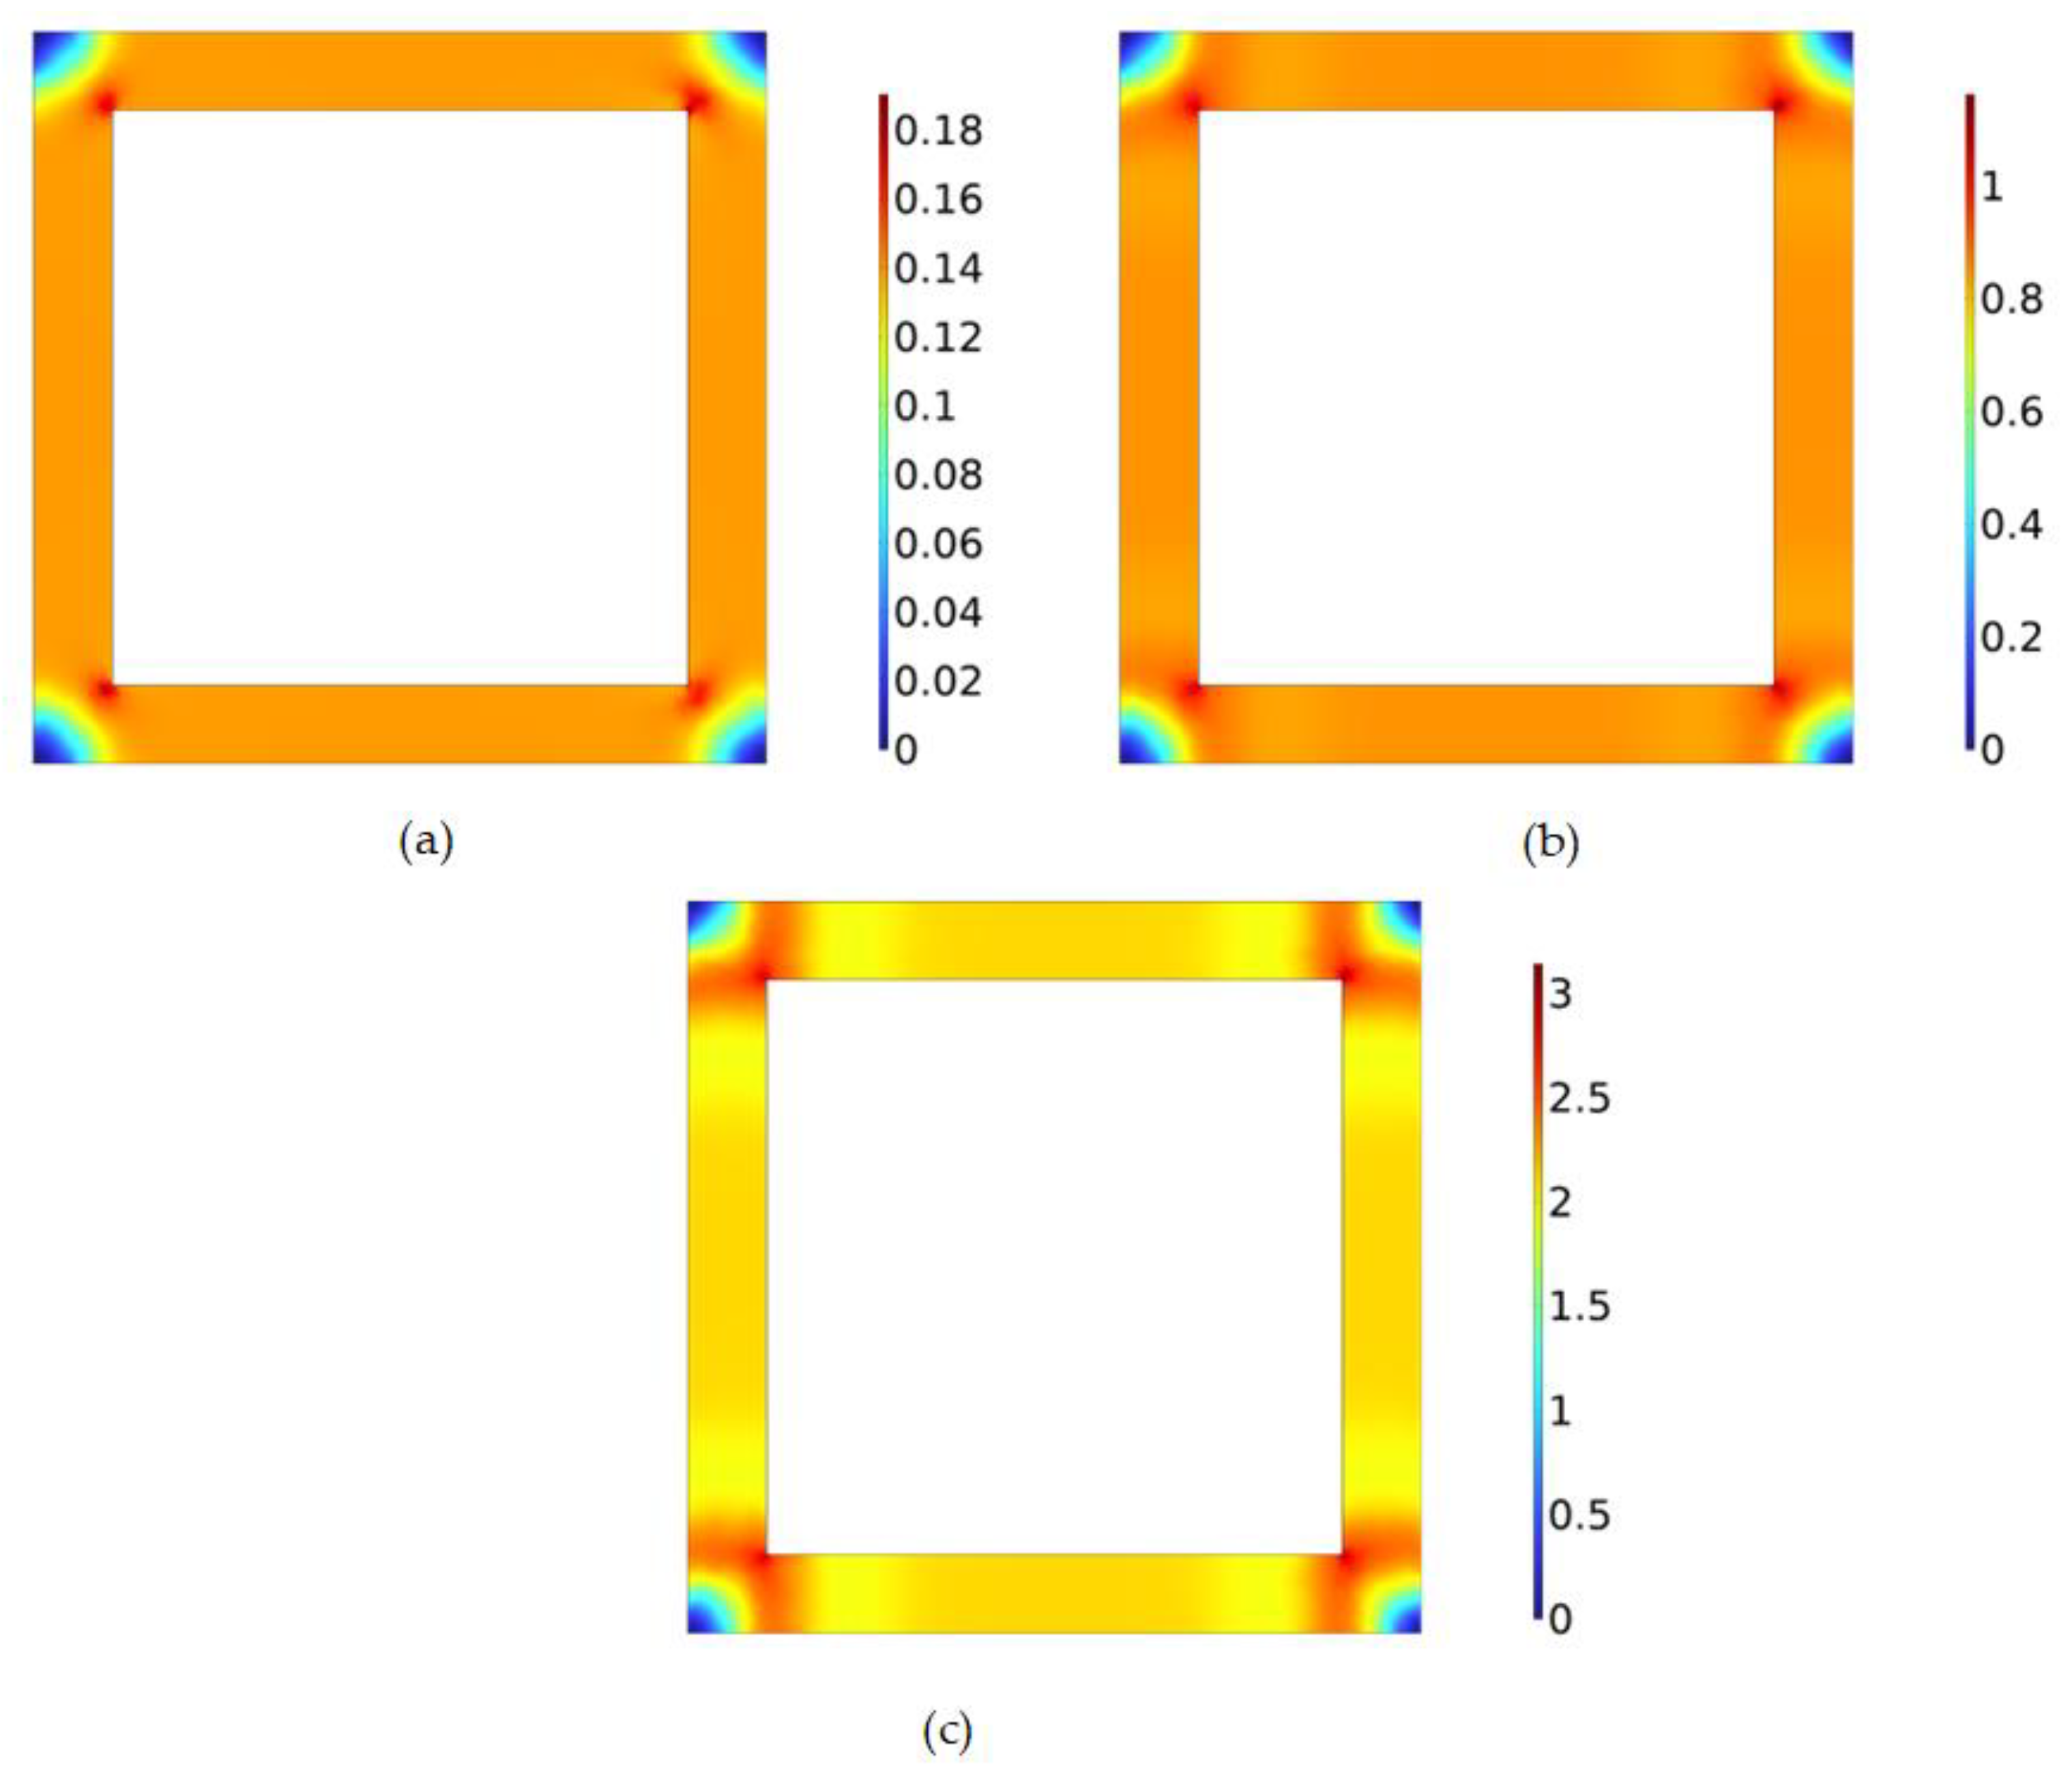
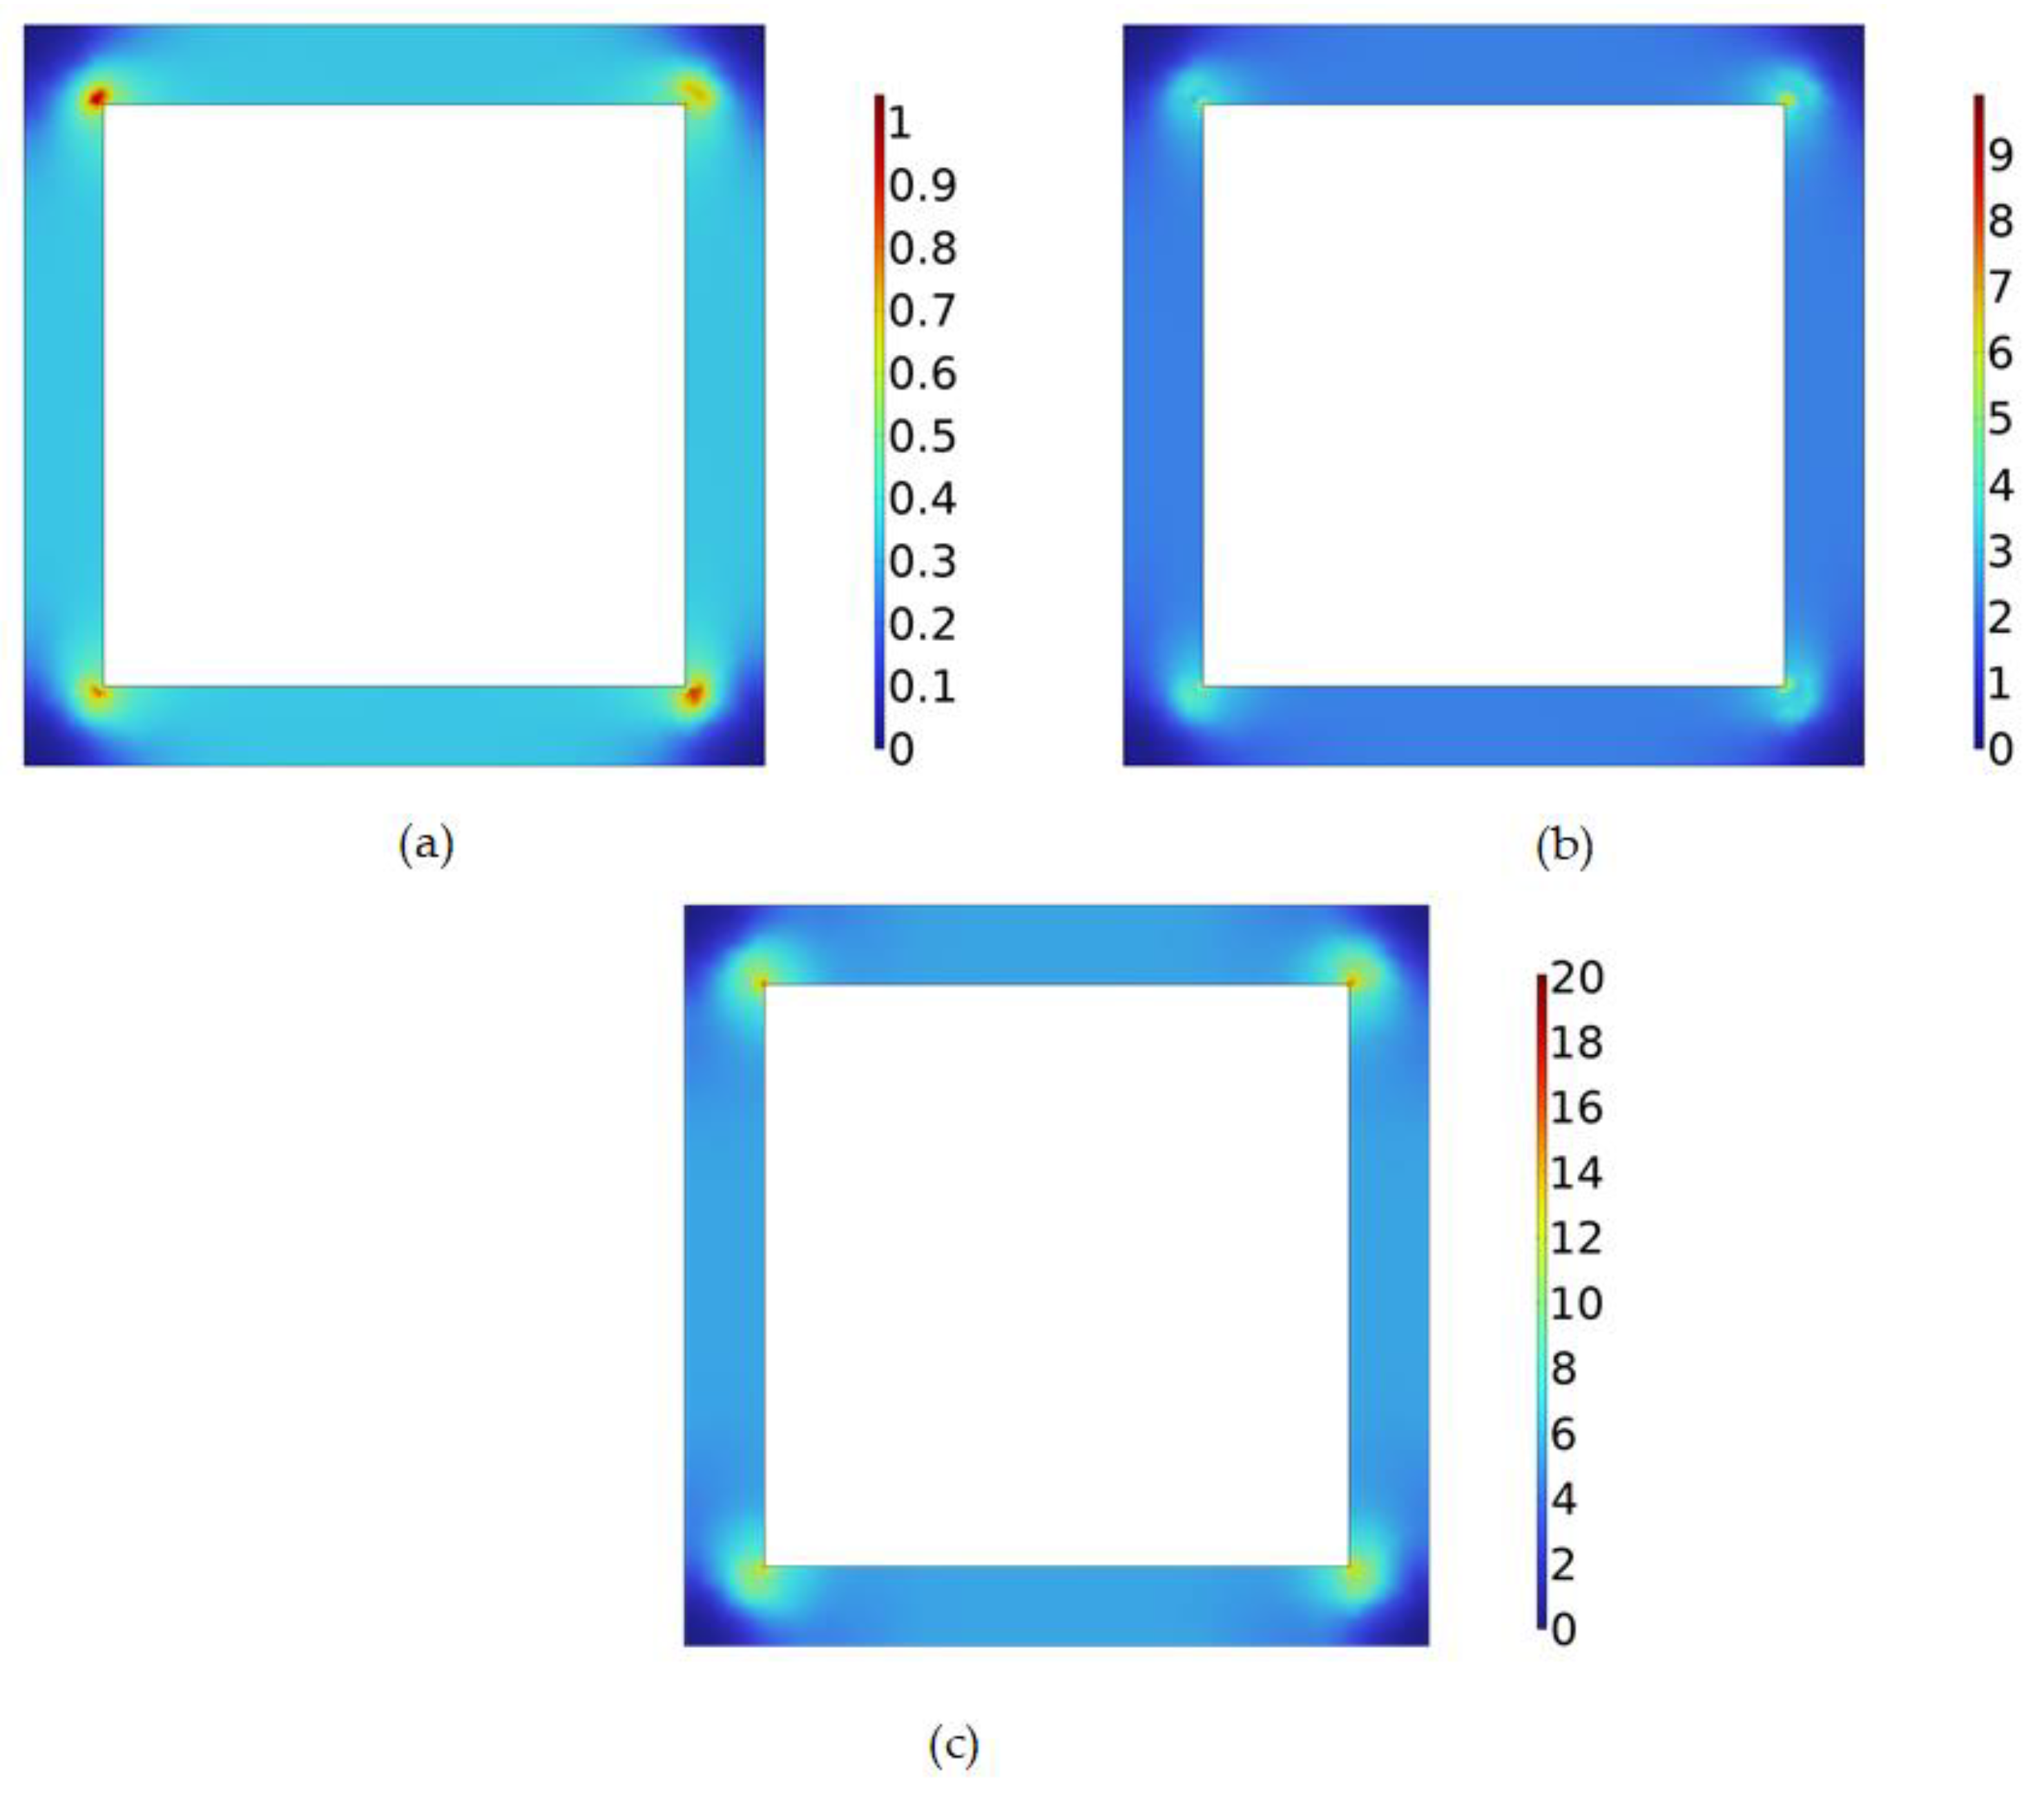
5.2.1. Epstein Square Ring Loss Cloud Map

Similarly, to analyze the distribution of loss in the Epstein frame more intuitively, this paper obtains the loss distribution nephograms of the FBA alloy and the 0.10 mm UTGO silicon steel Epstein frames at different frequencies when the magnetic flux density is 1.0 T and 1.2 T, as shown in Figure 11, Figure 12, Figure 13 and Figure 14. It can be seen from these diagrams that the loss and magnetic density have the same distribution law. With the increase in the frequency and magnetic flux density, the overall loss of the Epstein frame increases, and the losses at the corners are significantly higher than they are at other positions. The loss at positions other than the corner remains evenly distributed. At the same frequency and magnetic flux density, the loss of the 0.10 mm UTGO silicon steel Epstein frame is higher than that of the FBA alloy Epstein frame.

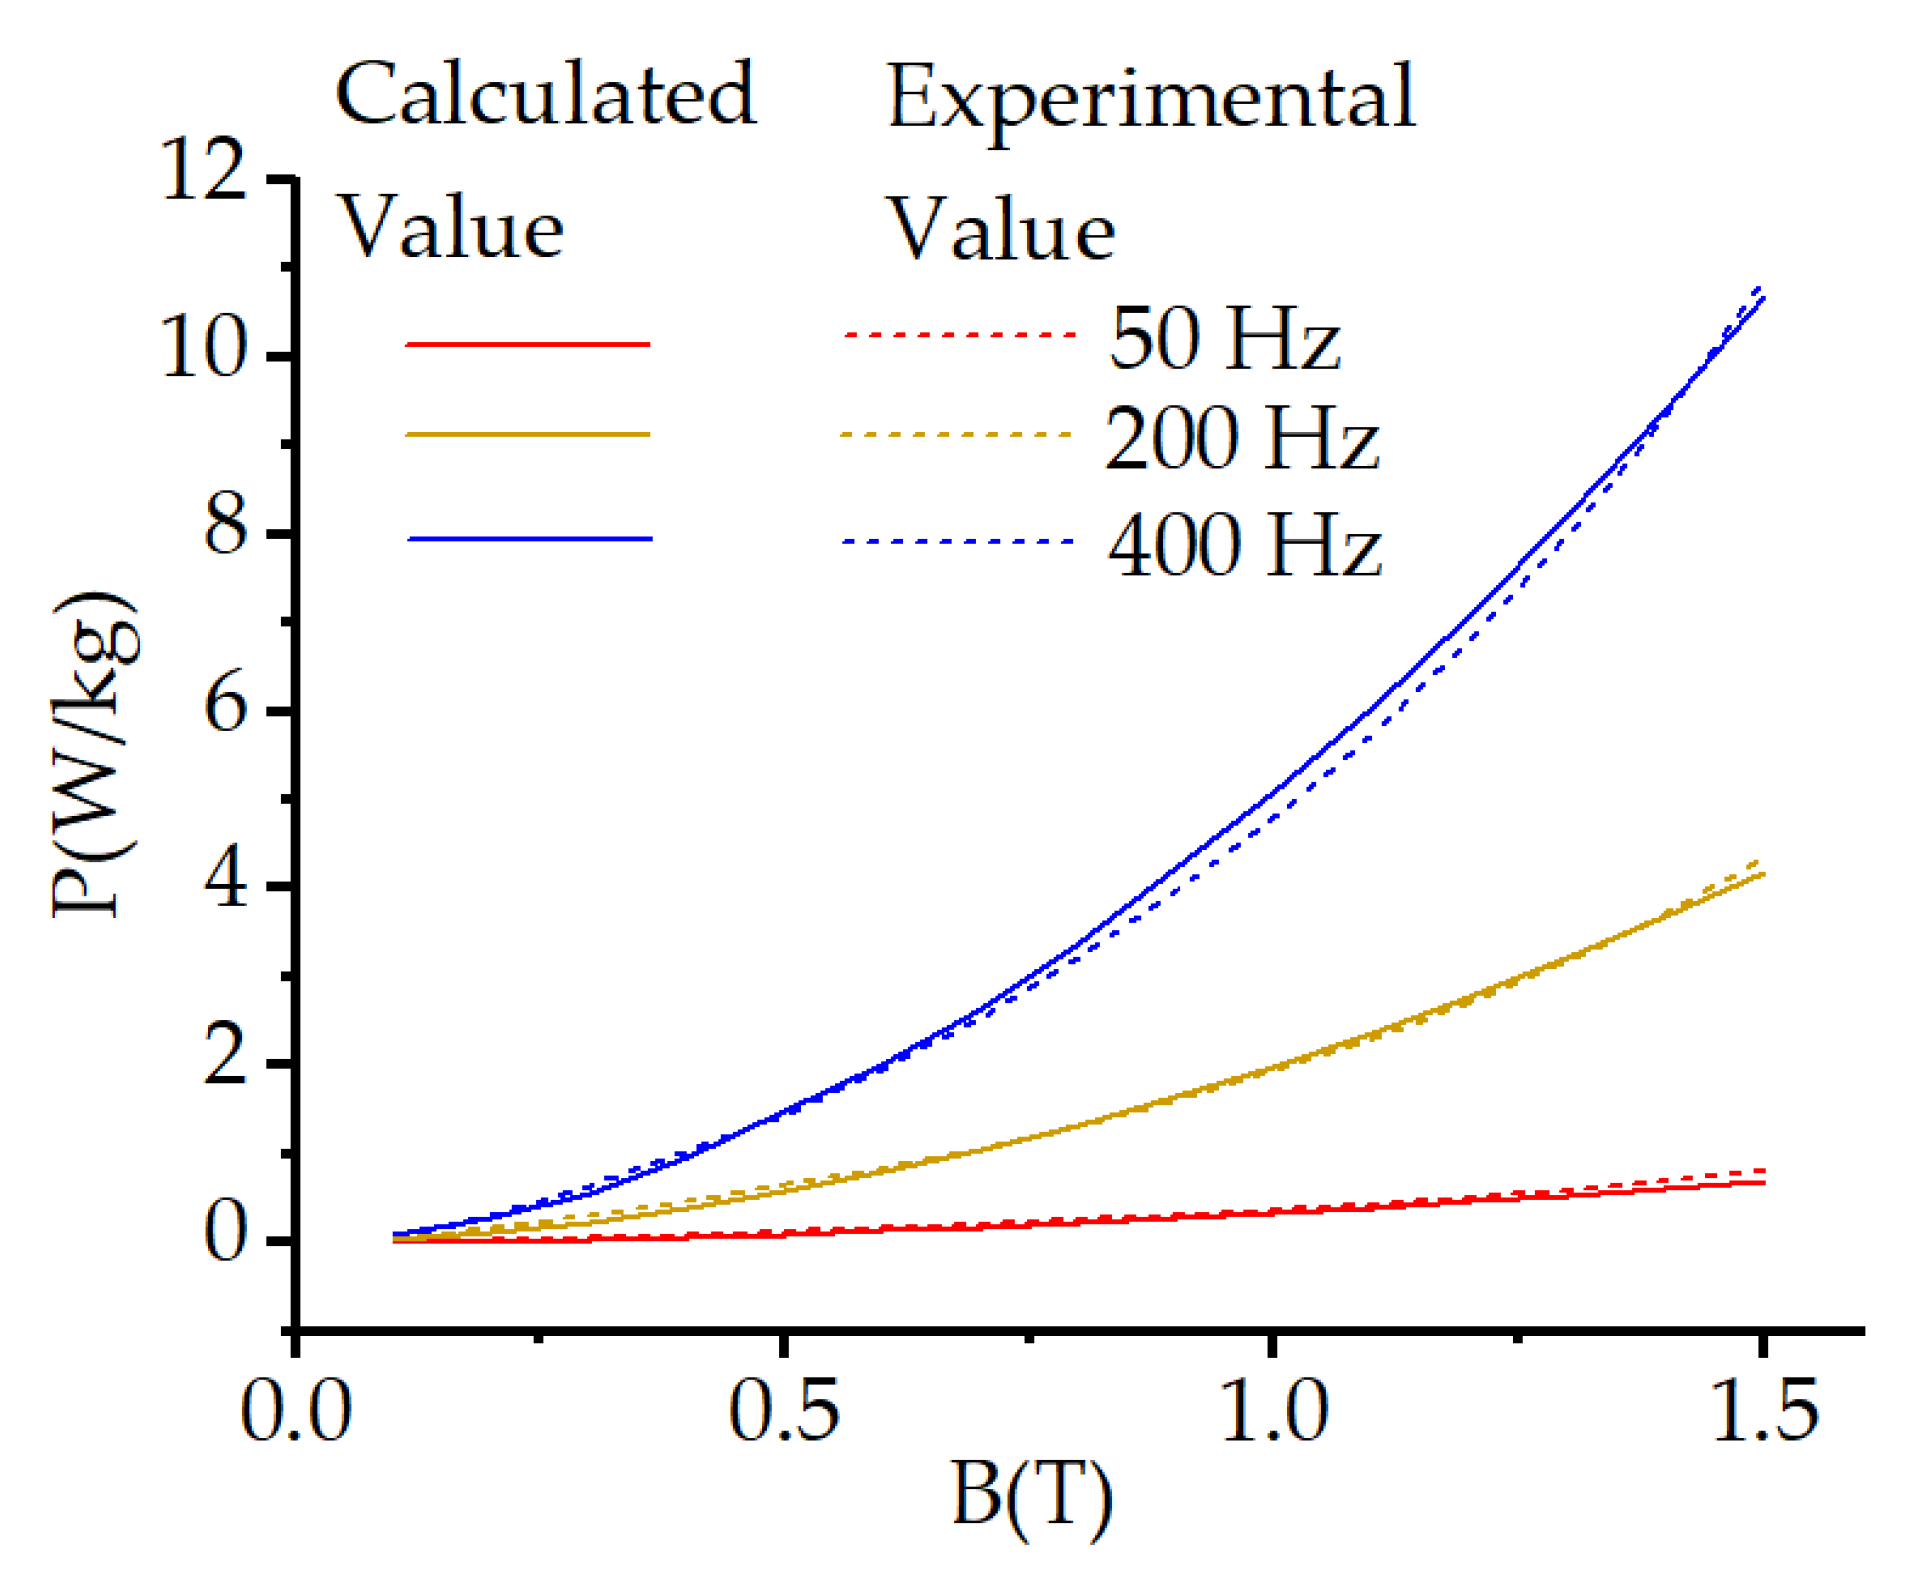
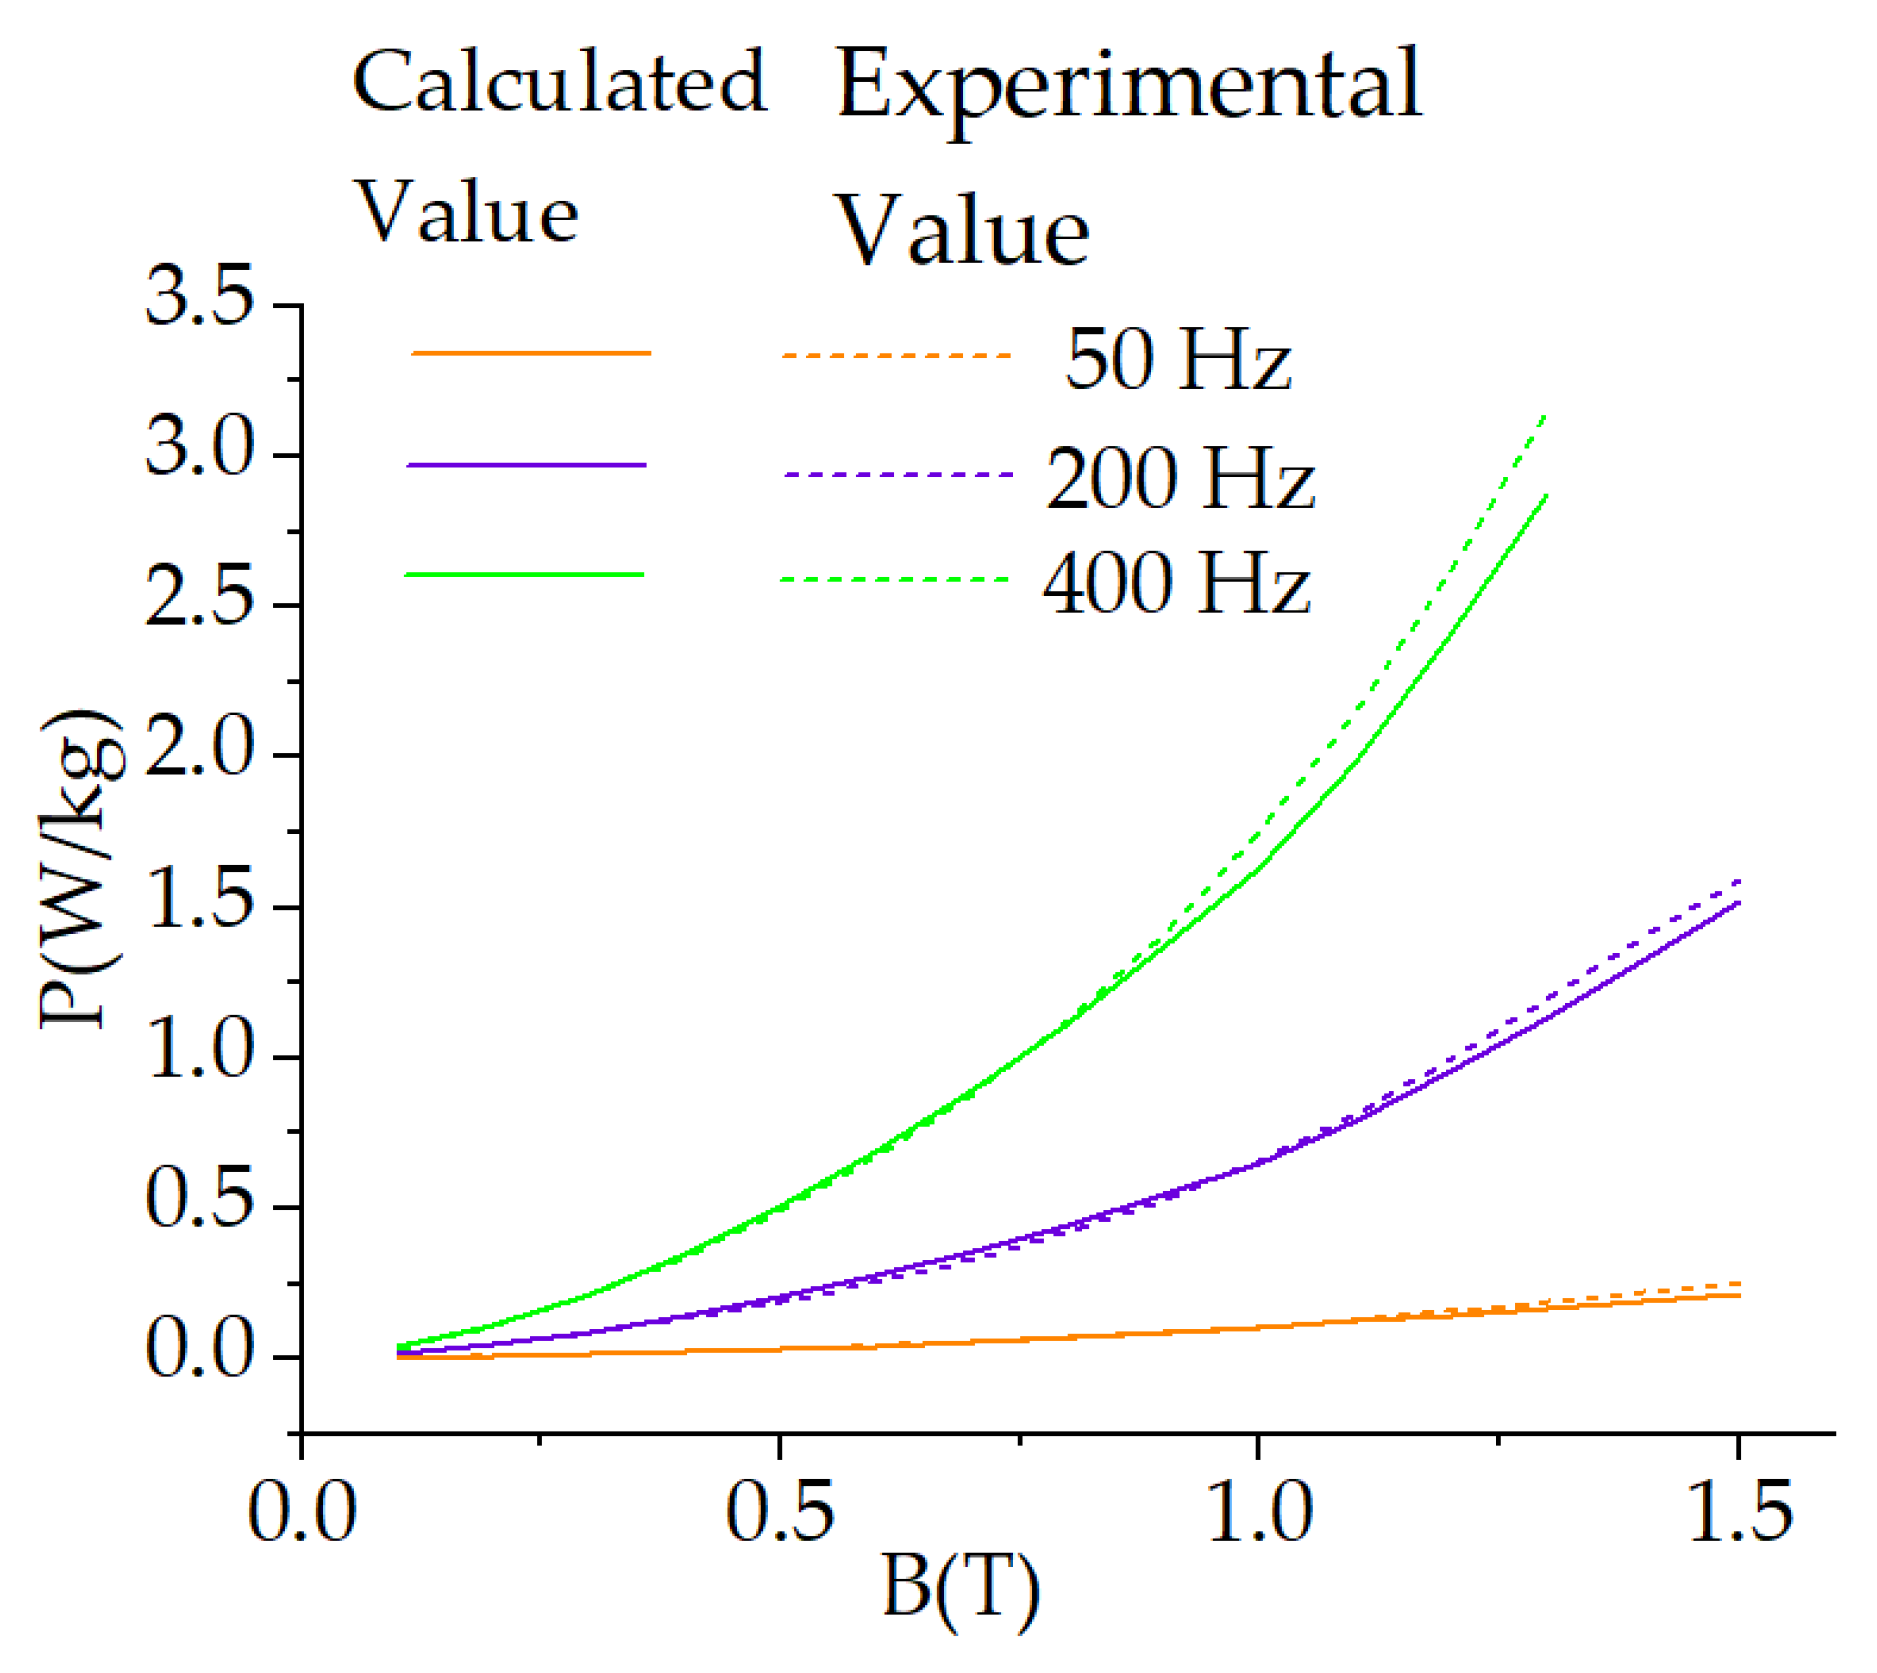
5.2.2. Comparison between the Calculated Value of the Epstein Square Ring Loss and the Experimental Value

The specific gravity loss of the Epstein square ring is calculated as follows:
P V = i = 1 n p i / m = p d V m
where pi is the loss of the Epstein square ring under the i-th calculation unit and m is the mass of the Epstein square ring.
The magnetic properties of the 0.10 mm UTGO silicon steel are measured using the Epstein square ring method; the electromagnetic properties of the 0.10 mm UTGO steel are therefore calculated first.
As shown in Figure 15, the calculated values of the Epstein square ring’s loss curve using 0.10 mm UTGO steel were compared with the experimental values at 50 Hz, 200 Hz, and 400 Hz frequencies. It can be seen from the figure that the error between the calculated value and the experimental value of the electromagnetic characteristics of the 0.10 mm UTGO steel Epstein square ring is generally large at a frequency of 50 Hz and a range of 0.1–1.5 T, with a maximum error of 9.53%. The maximum error between the calculated value and the experimental value of the electromagnetic characteristics of the 0.10 mm UTGO steel Epstein square ring is 9.87% at a frequency of 200 Hz and a range of 0.1–1.5 T, and the maximum error in the range of 0.7–1.5 T is 3.86%. The error between the calculated value and the experimental value of the electromagnetic characteristics of the Epstein square ring is small at a frequency of 400 Hz and a range of 0.1–1.5 T. In the magnetic flux density range of 0.1–0.4 T, the error is relatively large, with the maximum deviation being 8.87%. In the magnetic flux density range of 0.4–1.5 T, the error is relatively small, with a maximum error of 4.65%.
Figure 16 shows a comparison between the calculated and experimental values of the Epstein square ring loss curves using the FBA alloy at 50 Hz, 200 Hz, and 400 Hz.
It can be seen from Figure 16 that, when the magnetic induction intensity is in the range of 0.1–0.4 T, the error between the value calculated by the mathematical model and the experimental value of the electromagnetic characteristics of the FBA alloy Epstein square ring is relatively small at 50 Hz, with a maximum error of 3.14%. When the magnetic flux density Bm is 0.5–1.5 T, the error is larger, with a maximum error of 8.62%. Moreover, the error between the calculated value and the experimental value of the electromagnetic characteristics of the Epstein square ring of the FBA alloy is 8.12% at a frequency of 200 Hz and a range of 0.1–1.5 T. When the Bm is 0.1–0.9 T at a frequency of 400 Hz, the error between the calculated value and the experimental value is relatively small, with a maximum error of 4.40%. When the Bm is 1.0–1.3 T, the error is large, with a maximum error is 8.81%.
It can be seen from the above results that the mathematical models of the electromagnetic properties adopted by different magnetic materials will be affected by nonlinearity and produce large errors. Especially under high-frequency and high-flux conditions, the smaller hysteresis loop further increases the influence of the nonlinearity. The established electromagnetic characteristics model can thus accurately calculate the magnetic field and the loss of the Epstein frame within the allowable error range.

6. Conclusions

In this paper, the magnetic field strength and iron loss of the 0.10 mm UTGO silicon steel and the FBA alloy under different magnetic induction intensities at high and low frequencies were measured and analyzed using experiments and simulations.
In the frequency range of 50–400 Hz, the saturation magnetic induction intensity of the 0.10 mm UTGO silicon steel is higher, as is the loss. The FBA alloy has the lowest saturation magnetic induction, as well as a low loss. Due to the brittleness of the FBA alloy, it has strong potential in low-frequency and low-power applications. Moreover, although the loss characteristics of the 0.10 mm UTGO silicon steel at high frequencies are not as low as those of the FBA alloy, it has good mechanical strength and demonstrates potential for use in high-frequency and high-power applications.
Finally, the established calculation model can be used to accurately calculate the electromagnetic characteristics of Epstein square rings.

Author Contributions

Conceptualization, G.M. and L.C.; methodology, L.C. and Y.H.; software, L.C. and C.H.; validation, G.M., L.C. and C.H.; formal analysis, L.C.; investigation, L.C. and C.H.; resources, L.C.; data curation, L.C. and C.H.; writing—original draft preparation, L.C.; writing—review and editing, G.M.; visualization, C.H.; supervision, Y.H.; project administration, Y.H.; funding acquisition, Y.H. All authors have read and agreed to the published version of the manuscript.

Funding

This research was funded by the State Grid Corporation of China, grant number 5500-202258353A-2-0-SY.

Institutional Review Board Statement

Not applicable.

Informed Consent Statement

Not applicable.

Data Availability Statement

The data presented in this study are available in the article.

Conflicts of Interest

Authors Guang Ma, Ling Cheng, Yu Han and Chengxu He were employed by the company State Key Laboratory of Advanced Power Transmission Technology, State Grid Smart Grid Research Institute Co., Ltd. All authors declare that the research was conducted in the absence of any commercial or financial relationships that could be construed as a potential conflict of interest.

References

  1. Elangovan, S. Recent trends in sustainable development of renewable energy. In Proceedings of the 2017 International Conference on Advances in Electrical Technology for Green Energy (ICAETGT), Coimbatore, India, 23 September 2017. [Google Scholar]
  2. Ahmed, S.D.; Al-Ismail, F.S.M.; Shafiullah, M.; Al-Sulaima, F.A.; El-Amin, I.M. Grid Integration Challenges of Wind Energy: A Review. IEEE Access 2020, 8, 10857–10878. [Google Scholar] [CrossRef]
  3. Sun, C.; Chen, J.; Tang, Z. New Energy Wind Power Development Status and Future Trends. In Proceedings of the 2021 International Conference on Advanced Electrical Equipment and Reliable Operation (AEERO), Beijing, China, 15–17 October 2021. [Google Scholar]
  4. Roasto, I.; Romero-Cadaval, E.; Martins, J.; Smolenski, R. State of the art of active power electronic transformers for smart grids. In Proceedings of the IECON 2012—38th Annual Conference on IEEE Industrial Electronics Society, Montreal, QC, Canada, 25–28 October 2012. [Google Scholar]
  5. Zhu, L.; Zheng, H.; Ji, H.; Li, G.; Li, H.; Yao, S. Development Trends and Suggestions on Offshore Wind Power of China. In Proceedings of the 2021 IEEE Sustainable Power and Energy Conference (iSPEC), Nanjing, China, 23–25 December 2021. [Google Scholar]
  6. Dong, T.; Fu, R.; Zhang, B.; Peng, B.; Wei, X. Analysis of Permanent Magnet Linear Synchronous Motor made by Oriented Silicon Steel Sheet. In Proceedings of the 2021 13th International Symposium on Linear Drives for Industry Applications (LDIA), Wuhan, China, 1–3 July 2021. [Google Scholar]
  7. Geng, W.; Hou, J.; Li, Q. Electromagnetic Analysis and Efficiency Improvement of Axial-Flux Permanent Magnet Motor with Yokeless Stator by Using Grain-Oriented Silicon Steel. IEEE Trans. Magn. 2022, 58, 8200905. [Google Scholar] [CrossRef]
  8. Sobue, H.; Chiba, A.; Cai, Y.; Kiyota, K.; Fujii, Y.; Senda, K.; Yoshizaki, S. Analysis and Experimental Comparison of Acoustic Noise of Three Switched Reluctance Motors Made of Conventional Steel, High Silicon Steel, and Amorphous Iron. IEEE Trans. Ind. Appl. 2021, 57, 5907–5915. [Google Scholar] [CrossRef]
  9. Ou, J.; Liu, Y.; Breining, P.; Gietzelt, T.; Wunsch, T.; Doppelbauer, M. Experimental Characterization and Feasibility Study on High Mechanical Strength Electrical Steels for High-Speed Motors Application. IEEE Trans. Ind. Appl. 2020, 57, 284–293. [Google Scholar] [CrossRef]
  10. Sun, S.; Jiang, F.; Li, T.; Xu, B.; Yang, K. Comparison of A Multi-Stage Axial Flux Permanent Magnet Machine with Different Stator Core Materials. IEEE Trans. Appl. Supercond. 2020, 30, 1–6. [Google Scholar] [CrossRef]
  11. Tong, W.; Dai, S.; Wu, S.; Tang, R. Performance Comparison Between an Amorphous Metal PMSM and a Silicon Steel PMSM. IEEE Trans. Magn. 2019, 55, 1–5. [Google Scholar]
  12. Fernando, N.; Vakil, G.; Arumugam, P.; Amankwah, E.; Gerada, C.; Bozhko, S. Impact of Soft Magnetic Material on Design of High-Speed Permanent-Magnet Machines. IEEE Trans. Ind. Electron. 2017, 64, 2415–2423. [Google Scholar] [CrossRef]
  13. Sato, Y.; Uehara, Y.; Okamoto, S.; Yoshida, S.; Endo, Y.; Ono, N.; Misono, N.; Matsumoto, H. Accuracy Investigation of High-Frequency Core Loss Measurement for Low-Permeability Magnetic Materials. In Proceedings of the 2023 IEEE International Magnetic Conference—Short Papers (INTERMAG Short Papers), Sendai, Japan, 15–19 May 2023. [Google Scholar]
  14. Ioniţă, V.; Petrescu, L.; Cazacu, E. Coils-Based Measurement System for Soft Magnetic Materials. In Proceedings of the 2021 12th International Symposium on Advanced Topics in Electrical Engineering (ATEE), Bucharest, Romania, 25–27 March 2021. [Google Scholar]
  15. Sarker, P.C.; Guo, Y.; Lu, H.Y.; Zhu, J.G. Measurement and Modeling of Rotational Core Loss of Fe-Based Amorphous Magnetic Material Under 2-D Magnetic Excitation. IEEE Trans. Magn. 2021, 57, 8402008. [Google Scholar] [CrossRef]
  16. Wan, Z.; Liu, Z.; Yuan, W. Automated Measurement System for Hysteresis Lines and Magnetic Parameters of Magnetic Materials. In Proceedings of the 2021 IEEE Far East NDT New Technology & Application Forum (FENDT), Kunming, China, 14–17 December 2021. [Google Scholar]
  17. Yang, M.; Li, Y.; Yang, Q.; Lin, Z.; Yue, S.; Wang, H.; Liu, C. Magnetic Properties Measurement and Analysis of High Frequency Core Materials Considering Temperature Effect. IEEE Trans. Appl. Supercond. 2020, 30, 5900905. [Google Scholar] [CrossRef]
  18. Shilyashki, G.; Pfützner, H.; Giefing, M.; Bengtsson, C. Giant Epstein Tester for Magnetic Energy Loss Measurements of Non-Annealed Domain-Refined Fe–Si. IEEE Trans. Magn. 2022, 58, 6000606. [Google Scholar] [CrossRef]
  19. Liu, Y.; Gong, X.H.; Chen, X. Measurement and Comparative Analysis of Magnetic Properties of 0.10 mm and 0.23 mm Oriented Silicon Steel under Different Operating Conditions. China Electr. Power 2022, 55, 181–189. [Google Scholar]
  20. Ling, C.; Guang, M.; Chao, H.Z. Analysis of Performance Simulation of Iron Core and Electromagnetic Characteristics of 0.18 mm Grain-oriented Silicon Steel with Ultra-low Loss. Electr. Steel 2020, 2, 15–21. [Google Scholar]
  21. Chen, J.; Hu, H.; Jiang, S.; Deng, L.; Peng, T. Calculation of the Core Loss of High-Frequency High-Voltage Transformer Considering the Influence of Temperature. In Proceedings of the 2021 IEEE 4th Student Conference on Electric Machines and Systems (SCEMS), Huzhou, China, 1–3 December 2021. [Google Scholar]
  22. Liu, X.; Zhao, L.; Ma, C.; Ge, Q.; Li, Y. Optimization Simulation Analysis of Leakage Magnetic Field and Loss Characteristics of High Frequency Nanocrystalline Transformer. In Proceedings of the 2022 25th International Conference on Electrical Machines and Systems (ICEMS), Chiang Mai, Thailand, 2 December 2022. [Google Scholar]
  23. Giorgio, B. General properties of power losses in soft ferromagnetic materials. IEEE Trans. Magn. 1988, 24, 621–630. [Google Scholar]
  24. Yang, M.; Yang, Q.; Li, Y.; Lin, Z.; Yue, S.; Wang, H.; Bahman, A.S. Application-oriented characterization and analysis of core materials under medium-frequency condition. IEEE Trans. Power Electron. 2023, 38, 11245–11259. [Google Scholar] [CrossRef]
  25. Gang, L.; Peng, S.L.; Gang, W.X. Improvement and simulation application of core loss calculation method under sinusoidal and harmonic excitation. Trans. China Electrotech. Soc. 2018, 33, 4909–4918. [Google Scholar]
  26. Sorokhaibam, N.M.; Abhiiit, S.; Kunal, B.; Saibal, C. Hot Spot Detection in High Voltage Transformer by Thermal Sensor Using COMSOL Multiphysics. In Proceedings of the 2018 2nd International Conference on Power, Energy and Environment: Towards Smart Technology (ICEPE), Shillong, India, 1–2 June 2018. [Google Scholar]
Figure 1. Physical diagram of the Epstein square ring.
Applsci 14 03162 g001
Figure 2. Schematic diagram of the experiment.
Applsci 14 03162 g002
Figure 3. TEM images of microstructure and corresponding SAD pattern for the Fe-based amorphous alloy sample.
Applsci 14 03162 g003
Figure 4. Magnetization curve: (a) 0.10 mm UTGO silicon steel magnetization curve; (b) FBA alloy magnetization curve.
Applsci 14 03162 g004
Figure 5. Loss characteristics at low frequencies.
Applsci 14 03162 g005
Figure 6. Loss characteristics at high frequencies.
Applsci 14 03162 g006
Figure 7. Cloud maps of the magnetic flux density of the FBA alloy at different frequencies while Bm is 1.0 T. (a) 50 Hz; (b) 200 Hz; (c) 400 Hz.
Applsci 14 03162 g007
Figure 8. Cloud maps of the magnetic flux density of the FBA alloy at different frequencies while Bm is 1.2 T. (a) 50 Hz; (b) 200 Hz; (c) 400 Hz.
Applsci 14 03162 g008
Figure 9. Cloud images of the magnetic flux density of the 0.10 mm UTGO steel at different frequencies while Bm is 1.0 T. (a) 50 Hz; (b) 200 Hz; (c) 400 Hz.
Applsci 14 03162 g009
Figure 10. Cloud images of the magnetic flux density of the 0.10 mm UTGO steel at different frequencies while Bm is 1.2 T. (a) 50 Hz; (b) 200 Hz; (c) 400 Hz.
Applsci 14 03162 g010
Figure 11. Cloud maps of the loss of the FBA alloy at different frequencies while Bm is 1.0 T: (a) 50 Hz; (b) 200 Hz; (c) 400 Hz.
Applsci 14 03162 g011
Figure 12. Cloud maps of the loss of the FBA alloy at different frequencies while Bm is 1.2 T: (a) 50 Hz; (b) 200 Hz; (c) 400 Hz.
Applsci 14 03162 g012
Figure 13. Cloud images of the loss of the 0.10 mm UTGO steel at different frequencies while Bm is 1.0 T: (a) 50 Hz; (b) 200 Hz; (c) 400 Hz.
Applsci 14 03162 g013
Figure 14. Cloud images of the loss of the 0.10 mm UTGO steel at different frequencies while Bm is 1.2 T: (a) 50 Hz; (b) 200 Hz; (c) 400 Hz.
Applsci 14 03162 g014
Figure 15. Comparison between the calculated and experimental values of the Epstein frame loss of the 0.10 mm UTGO silicon steel.
Applsci 14 03162 g015
Figure 16. Comparison between the calculated and experimental values of the Epstein frame loss of the FBA alloy.
Applsci 14 03162 g016
Table 1. Main design parameters of 0.10 mm UTGO silicon steel Epstein square rings.
Outer PerimeterInner PerimeterMagnetic CircuitN1N2
280 mm220 mm940 mm100100
Table 2. Coefficient of hysteresis loss.
FBA Alloy0.10 mm UTGO Silicon Steel
kh0.00160.00686
α01.301.65
α10.610
α20.55−1.01
α3−0.400.74
Disclaimer/Publisher’s Note: The statements, opinions and data contained in all publications are solely those of the individual author(s) and contributor(s) and not of MDPI and/or the editor(s). MDPI and/or the editor(s) disclaim responsibility for any injury to people or property resulting from any ideas, methods, instructions or products referred to in the content.

