Article

Study on Fatigue Life of PC Composite Box Girder Bridge with Corrugated Steel Webs under the Combined Action of Temperature and Static Wind Loads

College of Civil Engineering and Transportation, Northeast Forestry University, Harbin 150040, China
*
Author to whom correspondence should be addressed.
Appl. Sci. 2024, 14(8), 3165; https://doi.org/10.3390/app14083165
Submission received: 2 March 2024 / Revised: 5 April 2024 / Accepted: 5 April 2024 / Published: 9 April 2024

Abstract

:
The large-span bridge is highly sensitive to temperature and wind loads. Therefore, it is essential to study the bridge’s fatigue life under the combined effects of temperature and static wind loads. This study focuses on the main bridge of Qiao Jia-fan 2# on the Yinkun Expressway (G85), with a span of 250 m and a configuration of a PC composite box girder bridge with corrugated steel webs. Firstly, on-site temperature and wind direction measurements with wind speed were conducted at the bridge site. Origin 2022 software is used to make mathematical statistics on the data, the representative values of atmospheric temperature difference between day and night and the basic wind speeds are calculated. Secondly, based on the basic wind speed in the most unfavorable wind direction, the static three-component force coefficients of bridge at different angles of attack are calculated by FLUENT 2022 R1 software. By comparison, the most unfavorable wind angle of attack, wind direction and wind load value of Qiao Jia-fan 2# Bridge are obtained. Finally, the finite element software MIDAS/FEA NX 2022 is used to analyze the fatigue life of the main bridge of the Qiao Jia-fan 2# Bridge. The analysis results show that the representative value of the temperature difference between day and night in the area where PC composite box girder bridge with corrugated steel webs is located is 22 °C, the most unfavorable wind direction is NNE wind direction, and the most unfavorable wind attack angle is 3° wind attack angle. It is found that the maximum stress of concrete and corrugated steel webs appears near the 0# block, and the life of corrugated steel webs is far greater than that of concrete.

1. Introduction

Qiao Jia-fan 2# Bridge is located on the LJ09-1 section of Taiyang Development Zone to Pengyang section of Yinkun Expressway (G85). The upper structure of the main bridge is a prestressed concrete continuous beam with corrugated steel webs. Prefabricated prestressed concrete T beams are used in the upper structure of the approach bridge. The bridge span arrangement is (3 × 40) + (65 + 120 + 65) + (3 × 40) = 490 m, and the upper deck arrangement is arranged with a two-way four-lane expressway. The area where the project is located belongs to the semi-arid zone of the middle temperate zone, which has obvious continental climate characteristics. It is characterized by a strong influence of topography, low average temperature throughout the year, large temperature difference between day and night, and more disastrous weather.
For long-span Prestressed concrete (PC) box girder bridge with corrugated steel webs, the combined working condition of live load, temperature load and wind load is the control working condition of structural design, temperature load and wind load and should therefore be considered at the same time during the design. However, in the operation process, the bridge structure is in the external environment for a long time [1], and the load condition may exceed the design estimation, which leads to an impact on the durability of the bridge. It is reported that many bridges in the world have fatigue cracks or even brittle fractures during operation, so it is necessary to study the fatigue life of bridges [2,3,4,5,6,7].
In recent years, significant research has been conducted on the fatigue behavior of Prestressed concrete box girder bridge with corrugated steel webs. Ibrahim et al. [8] and Kövesdi et al. [9] both investigated plate girders with trapezoidally corrugated webs and studied their fatigue performance. They examined stress concentrations, identified causes of fatigue cracking, and proposed techniques for determining the fatigue life of these girders. The studies assessed various factors such as corrugation profile, stress ratio, combined stresses, and weld size, providing valuable insights for optimizing the design of girders with corrugated webs. Additionally, Kövesdi et al. [10] explored the impact of additional normal stresses on the bending resistance of girders with corrugated webs, highlighting the differences in stress distribution compared to conventional I-girders. These studies aim to enhance our understanding of the fatigue and bending behavior of corrugated web girders, ultimately improving our knowledge of their structural performance.
At present, the research on wind load of bridge structure is mainly concentrated on suspension bridge and cable-stayed bridge, and the research on wind load effect of long-span PC composite box girder bridge with corrugated steel webs is relatively insufficient. In addition, considering that the bridge has different longitudinal and transverse dimensions, the current bridge wind resistance specifications are usually considered in accordance with the full wind direction. However, this approach fails to fully consider the difference of wind load on the bridge structure under different wind directions. Therefore, it is necessary to distinguish the wind direction more carefully to evaluate the wind speed of the bridge in all directions more accurately, so as to improve the accuracy and safety of the design.
Therefore, this study takes the main bridge of Qiao Jia-fan 2# bridge as the research object. Firstly, Origin 2022 software was used to conduct mathematical statistics on the temperature from February to July 2023 and the measured data of wind speed and wind direction from February 2023 to February 2024 at the bridge site, and the representative value of atmospheric diurnal temperature difference at the bridge site [11,12,13] and the basic wind speed in different return periods under different wind direction angles [14,15] were obtained. Based on the basic wind speed of the most unfavorable wind direction, the wind load value of the most unfavorable wind attack angle is calculated by FLUENT 2022 R1 software. Finally, the finite element model of the whole bridge is established by MIDAS/FEA NX 2022 software, and the fatigue life of PC composite box girder bridge with corrugated steel webs under the combined action of temperature and static wind load is studied.
By observing the wind speed and temperature change data of Ningxia Autonomous Region over the years, it is found that the extreme temperature difference usually occurs in summer and winter, while the maximum wind speed generally occurs in spring. Therefore, this study selects the data from February to July 2023 to calculate the extreme maximum temperature and uses the wind speed data from February 2023 to February 2024 to calculate the most unfavorable wind load. The extreme maximum temperature and the most unfavorable wind load are loaded on the bridge to study the fatigue life of the bridge, which has certain engineering application value.

2. Collation and Analysis of Measured Data of Temperature and Wind

2.1. Wind Speed Warning and Monitoring System

Qiao Jia-fan 2# Bridge adopts a wind speed early warning system for high-altitude operations suitable for highway construction. The early warning system includes wind speed sensor, sound and light alarm, MCU control system, 4G module and power module. The wind speed sensor and the sound and light alarm are connected to the MCU control system. MCU control system is connected with 4G module. The 4G module is connected to the mobile phone terminal signal through Alibaba Cloud (Alibaba Group, Hong Kong, China). The power module is connected to the MCU control system and the 4G module. The wind speed early warning system is installed in each section. When the wind speed reaches level 5, information is sent to the mobile phone through the cloud system for early warning. When the wind speed reaches level 6, the sound and light alarm is sent to the mobile phone through the cloud system for the alarm. Construction is stopped on site, and the data is uploaded to the cloud in real time for researchers’ research. Early warning is carried out when the wind speed reaches Grade 5 and Grade 6. The whole early warning system is powered by solar energy and can be used outdoors for a long time. In this study, the data acquisition instrument is arranged at the 7# pier of Qiao Jia-fan 2# Bridge, 10 m from the ground, and measures the temperature, wind speed and wind direction data at the bridge site.

2.2. Representative Value of Atmospheric Temperature Difference between Day and Night Based on Statistical Analysis

Considering that the service life of the bridge is basically about 100 years, the extreme maximum temperature at the bridge site cannot be directly calculated only by collecting the temperature data of Qiao Jia-fan 2# Bridge for 6 months. Therefore, based on the measured data of 6 months, this section calculates the representative value of atmospheric temperature difference between day and night by mathematical statistics, and then obtains the extreme maximum temperature at the bridge site.
In this study, the two-parameter Weibull distribution is applied, which is determined by the shape parameter and the scale parameter [16]. The shape parameter controls the basic shape of the distribution density curve, the scale parameter controls the range of the curve and does not affect the shape of the distribution.
Its distribution function is as follows:
W ( x : α , β ) = 1 e ( x α ) β
where β is the shape parameter, α is the scale parameter.
The probability density function of the Weibull distribution is as follows:
x > 0 ;   f ( x ) = β α ( x α ) β 1 e ( x α ) β x 0 ;   f ( x ) = 0
In the area where Qiao Jia-fan 2# Bridge is located, the atmospheric temperature difference between day and night was analyzed for six months from 1 February 2023, to 31 July 2023, and statistical analysis was carried out according to the field measured data.
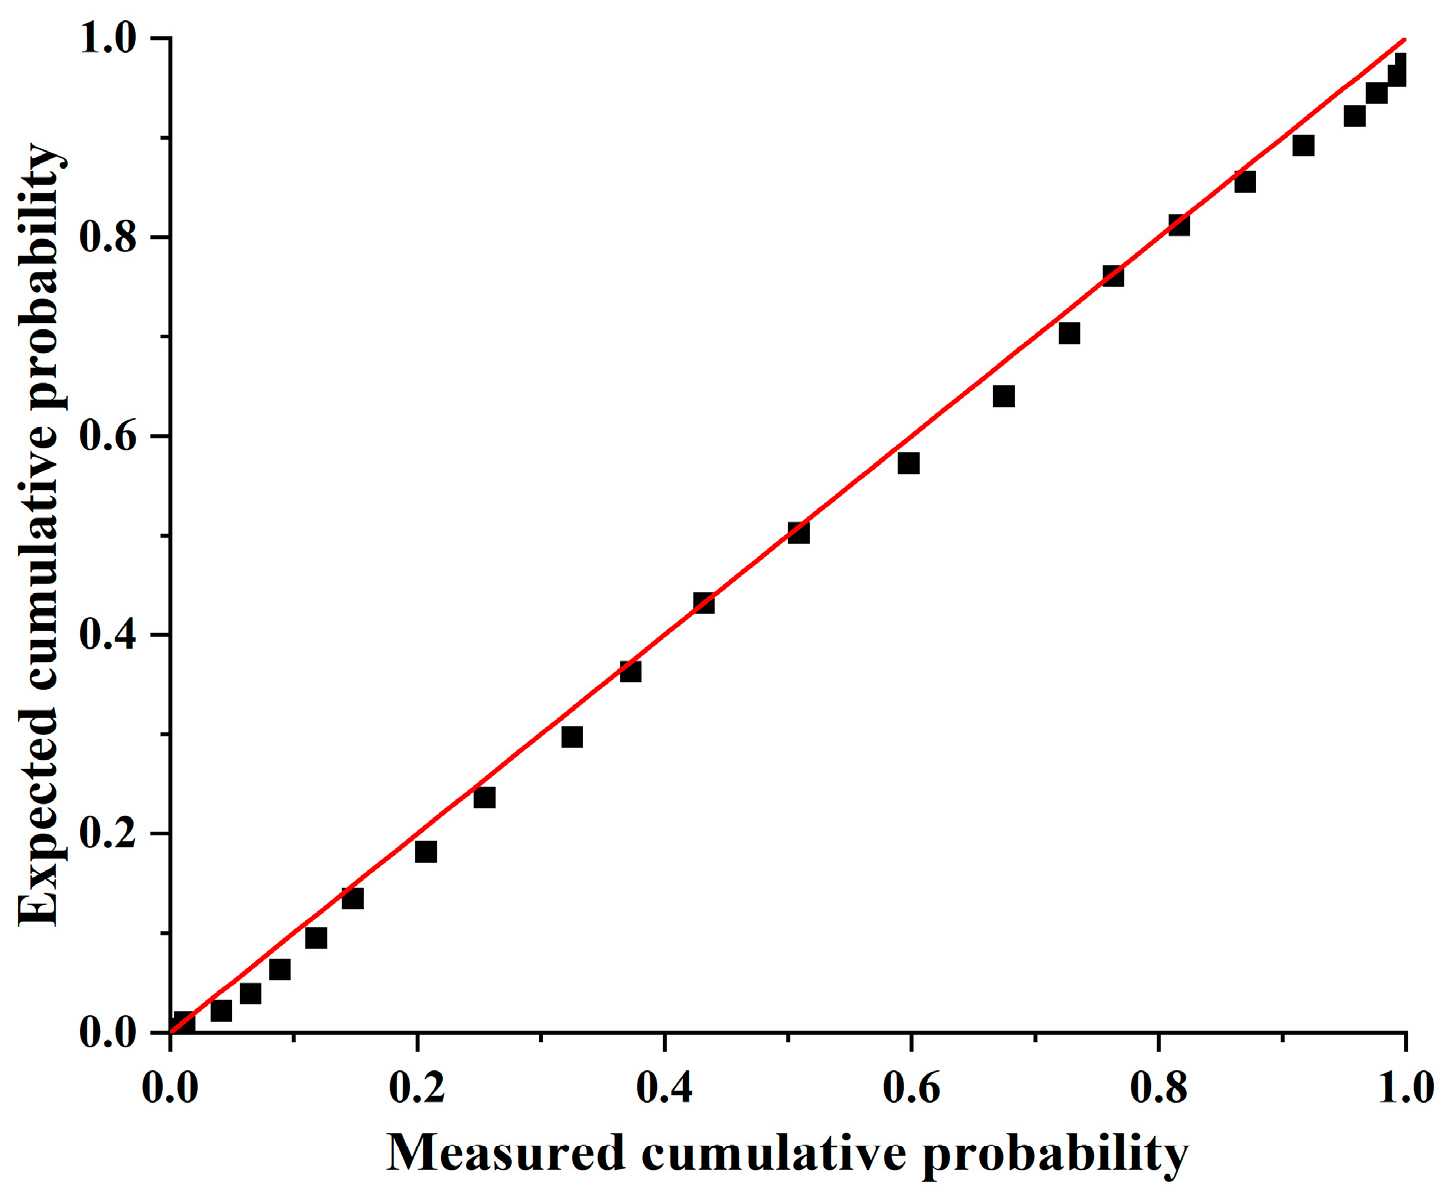
In Figure 1, the time starting point is 1 February 2023. By analyzing Figure 1, it can be seen that the daily maximum temperature difference of the atmosphere is 24 °C. The atmospheric data from 1 February 2023 to 31 July 2023 were collected and statistically analyzed. The nonlinear curve fitting was performed using Origin 2022 software, and the Pearson χ2 test showed that the temperature difference obeyed the Weibull distribution of W(15.287, 3.981). The P–P diagram can be drawn from the accumulated proportion of measured temperature difference and the accumulated proportion of Weibull distribution.
By analyzing Figure 2, it can be seen that the cumulative probability of the expected temperature difference and the cumulative probability of the measured temperature difference approximately shows a straight line. The measured data of temperature difference is in accordance with the Weibull distribution of W(15.287, 3.981). See Figure 3 for the histogram of temperature difference between day and night and Weibull distribution.
The characteristic value of temperature effect is the effect value with a return period of 50 years. If calculated according to the design reference period of 100 years in the Chinese bridge code, the probability that the maximum temperature difference effect exceeds the characteristic value during the design reference period is 2%. According to the Weibull distribution function, that is, Formula (1), the standard value of the temperature difference between day and night at the bridge site can be calculated to be 22 °C. According to the measured data, the average temperature can be calculated to be 17 °C, which is added to the standard value of day and night temperature difference, and the extreme maximum temperature can be obtained to be 39 °C.

2.3. Probability Model Fitting of Wind Speed and Direction

In this section, through the field measurement of wind direction and wind speed of Qiao Jia-fan 2# Bridge, the measured data from February 2023 to February 2024 are obtained. Three different probability distribution models are used to fit the data to obtain the basic wind speeds of 10, 50 and 100 years return periods of different wind directions and all wind directions at the bridge site. The calculated basic wind speed of the all-wind direction is compared with the basic wind speed at the bridge site in the General Specifications for Design of Highway Bridges and Culverts (JTGD60-2015) [17], and the accuracy of the basic wind speed obtained by the method is verified.

2.3.1. Fitting Method

According to previous studies, it can be considered that there are three probability models for wind speed distribution [18]: Gumbel distribution probability, Frechet distribution probability and Weibull distribution probability, and the expression of probability density function is as follows:
Gumbel :   y = 1 A e B x A e [ e B x A ]
Frechet :   y = C A e [ ( x A ) C ] ( x A ) 1 C
Weibull :   y = C A e [ ( x A ) C ] ( x A ) C 1
In the formula, A, B and C are scale parameter, position parameter and shape parameter, respectively, which can be fitted according to the principle of least square method.
In order to determine the wind speed distribution under all wind directions, the wind speed distribution law under discrete wind direction can be determined first, and then the distribution parameters under discrete wind directions can be fitted to obtain the wind speed distribution probability under continuous wind direction. Reference [19] assumes that the variation of wind direction density function f and wind speed fitting parameters A, B and C on the circumference of wind direction satisfies harmonic function.
The expressions are as follows:
f ( θ ) = c f + m = 1 n f d m f cos ( m θ e m f ) A ( θ ) = c A + m = 1 n A d m A cos ( m θ e m A ) B ( θ ) = c B + m = 1 n B d m f cos ( m θ e m B ) C ( θ ) = c C + m = 1 n f d m f cos ( m θ e m C )
where f(θ) is the frequency of occurrence of any wind direction interval obtained by harmonic fitting; A(θ), B(θ), C(θ) are the distribution function; c, dm, em are the harmonic function parameters; and nf, nA, nB, nC are the harmonic function order.
After obtaining the probability density function of the wind speed and direction distribution, the distribution function of the joint probability distribution of the wind speed and direction at the bridge site can be obtained by integration:
P ( θ , x ) = f ( θ ) y θ ( x ) d x d θ , θ ( 0 , 2 π )
In the formula, f(θ) is the probability density function of wind direction distribution fitted by Formula (6), and yθ(x) is the probability density function of wind speed under wind direction angle θ; The parameters A(θ), B(θ), C(θ) in yθ(x) are fitted by Formula (6), which are functions of wind direction angle θ.

2.3.2. Sampling and Fitting of Wind Speed and Direction

The statistical data are collected from the daily data of the bridge site from February 2023 to February 2024. Maximum wind speed refers to the maximum average wind speed in a certain period within 10 min at 10 m elevation. After calculation, the daily average wind speed is lower than the daily maximum wind speed, which is due to the longer action time of low wind speed and the shorter action time of high wind speed. However, high wind speed is the main reason for the fatigue damage of the structure. So, this section adopts the method of stage extremum to sample to determine the wind speed sample. The sample of average wind speed is divided into several sub-samples according to a certain time interval, and the extreme value of each sub-sample is taken as the sample point. Under normal circumstances, the sampling time can be 1 day [20], 4 days [21] or 30 days [22]. However, due to the short sampling time, in order to obtain more samples, the time interval of 1 day (the daily maximum 10 min average wind speed during the observation period) is taken as the time interval for the extreme value.
According to the specification [23], the 360° wind direction is divided into 16 wind directions with the interval of 22.5°. The wind direction statistics are carried out on the wind data sampled at intervals of 1 day, and the wind rose diagram representing the distribution frequency in each wind direction can be obtained, as shown in Figure 4.
It is not difficult to see from the rose diagram of wind direction that the wind direction in this area is mainly SSE, S and SW, followed by SE, SSW and NNE, and the frequency of other wind directions is low. Taking the maximum wind speed as the sample, the number of samples is too small, and the number of samples appearing in each wind direction is uneven, which leads to a small number of samples in some wind directions. According to Formulas (3)–(5), the distribution curves of wind speed probability density function under all wind directions are fitted with parameters under different probability distributions. Then, the probability density function of wind speed under each wind direction is fitted according to the wind speed distribution under discrete wind direction. Table 1 gives the parameter fitting values and correlation coefficients of wind speed probability distribution under discrete wind direction and full wind direction under three probability models.
In Table 1, A is the scale parameter, B is the position parameter, and C is the shape parameter. ∑ means all wind direction. r is the correlation coefficient, and the closer the value is to 1, the better the fitting effect.
For the correlation coefficient under each wind direction, the correlation coefficient under the fitting of Gumbel distribution and Weibull distribution is generally higher. However, for the all-wind direction, the correlation coefficient under the Gumbel distribution fitting is closer to 1 than the Weibull distribution, and the goodness is the best. Therefore, the calculation of basic wind speed in this study adopts the result of Gumbel distribution fitting. When the correlation coefficient is higher than 0.6, it is usually considered that there is a strong linear relationship, and the Gumbel distribution can be considered for fitting.

2.3.3. Basic Wind Speed Calculation and Result Analysis

After determining the three probability parameters of the joint distribution of wind speed and direction, the basic wind speed in a certain return period of different wind directions can be obtained. The basic wind speed calculation formulae, for the Gumbel distribution are as follows [24]:
1 R = N f ( θ ) { 1 exp [ U R B ( θ ) A ( θ ) ] } U R = A ( θ ) L n L n R N f ( θ ) R N f ( θ ) 1 + B ( θ )
In the formula, R is the return period, and N is the number of strong winds in any one year. In this study, N is 365. UR is the basic wind speed of the R-year return period.
The basic wind speed of 16 wind directions in different return periods can be obtained by Formula (8), as shown in Table 2.
It can be seen from Table 2 that the Gumbel distribution has the maximum basic wind speed in the NNE wind direction, and the maximum value is 30.69 m/s. In most cases, the basic wind speed obtained by considering the effect of wind direction is smaller than that obtained by ignoring the effect of wind direction. However, there are exceptions, that is, the basic wind speed considering the influence of wind direction is larger than that ignoring the influence of wind direction, such as NNE and SSW wind direction.
Compared with the basic wind speed of 26.9 m/s in the 100-year return period of Guyuan area in the General Specifications for Design of Highway Bridges and Culverts (JTGD60-2015), it is found that it is smaller than the basic wind speed of 30.21 m/s in the 100-year return period of the whole wind direction calculated in this study. Because the basic wind speed of the 100-year return period in the specification generally adopts conservative design criteria to ensure the safety of the structure, this means that the basic wind speed in the specification may be lower than the actual observed wind speed, and there is a certain safety margin.
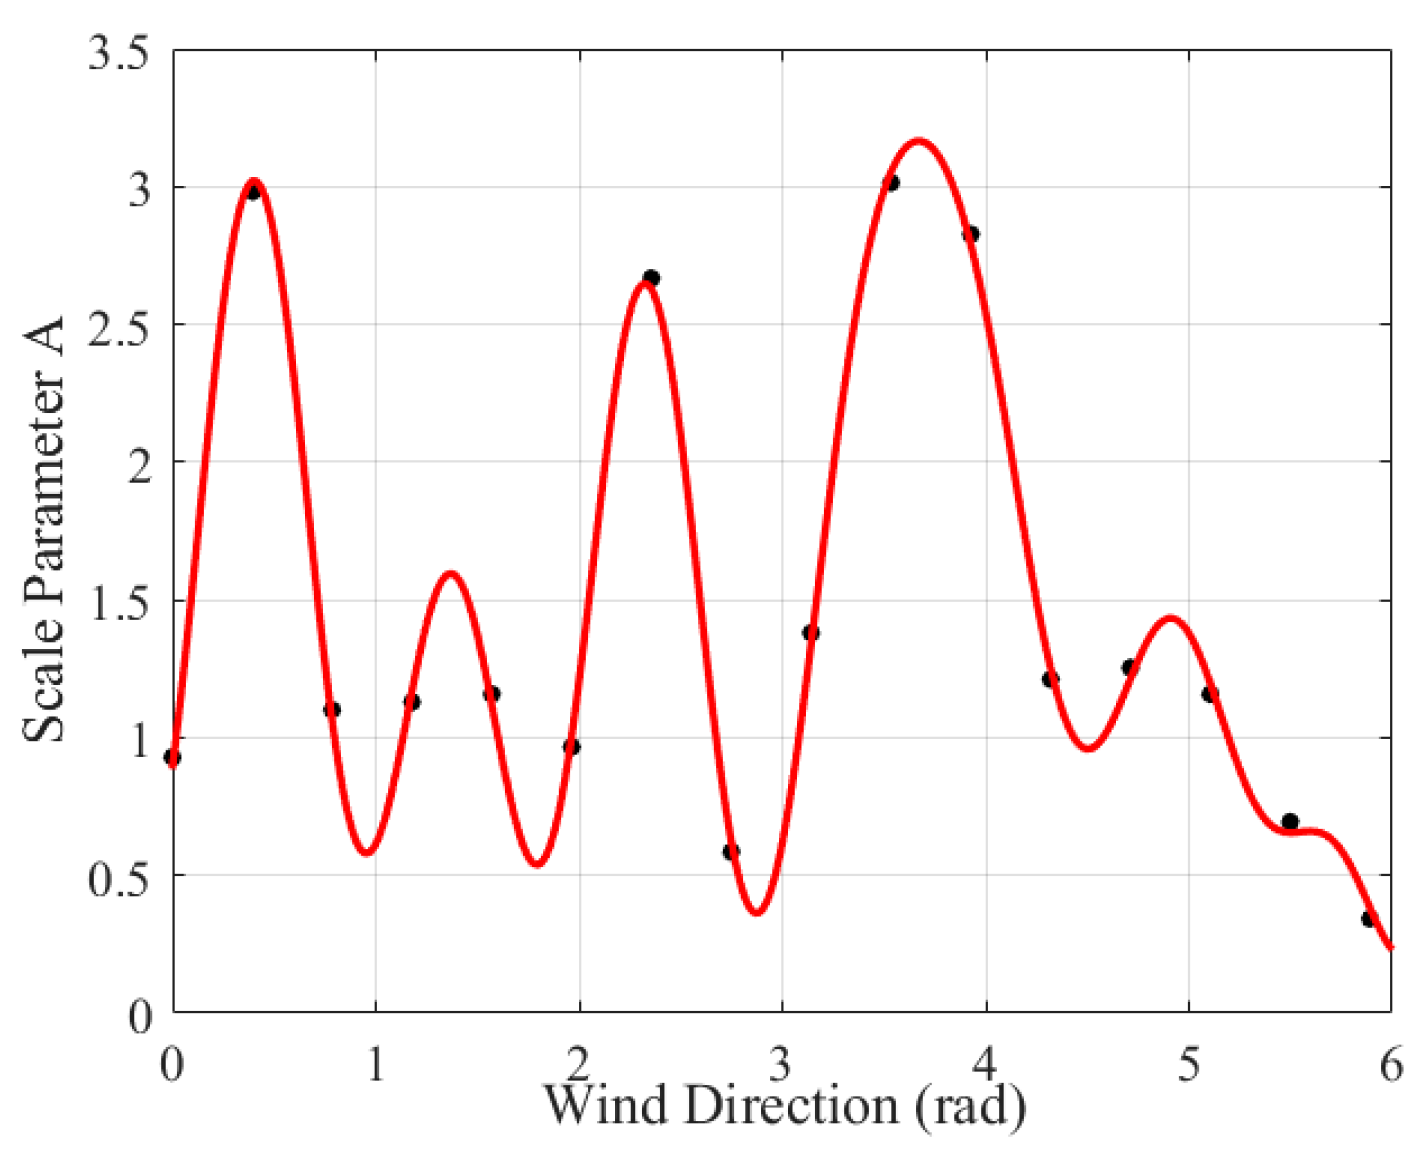
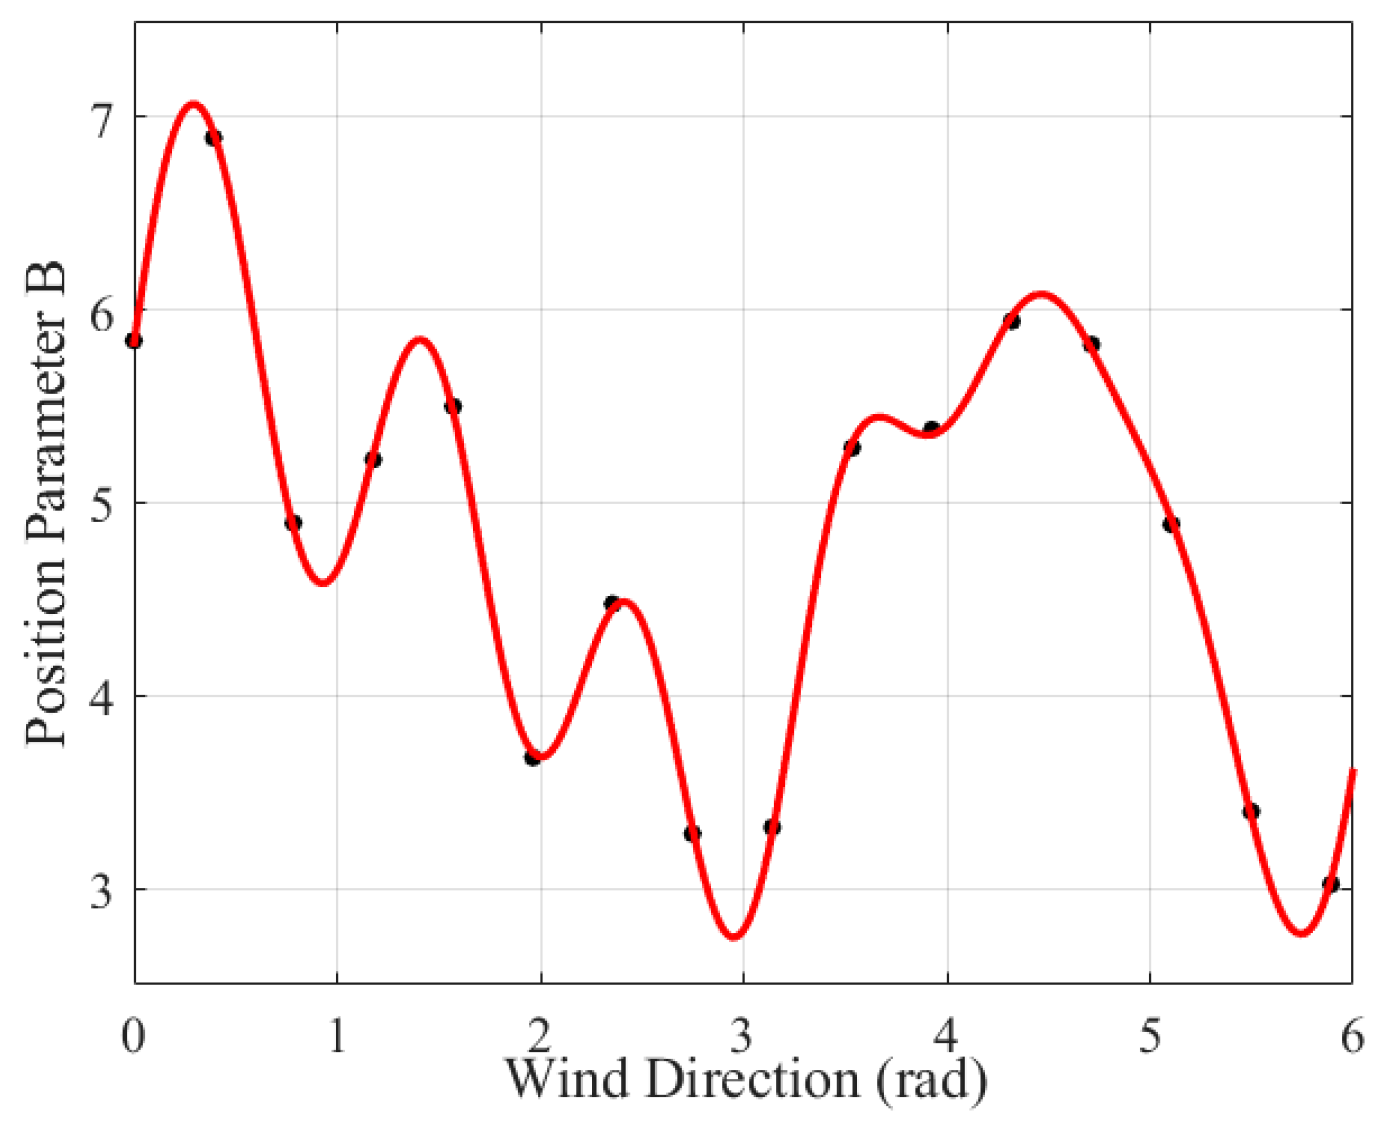
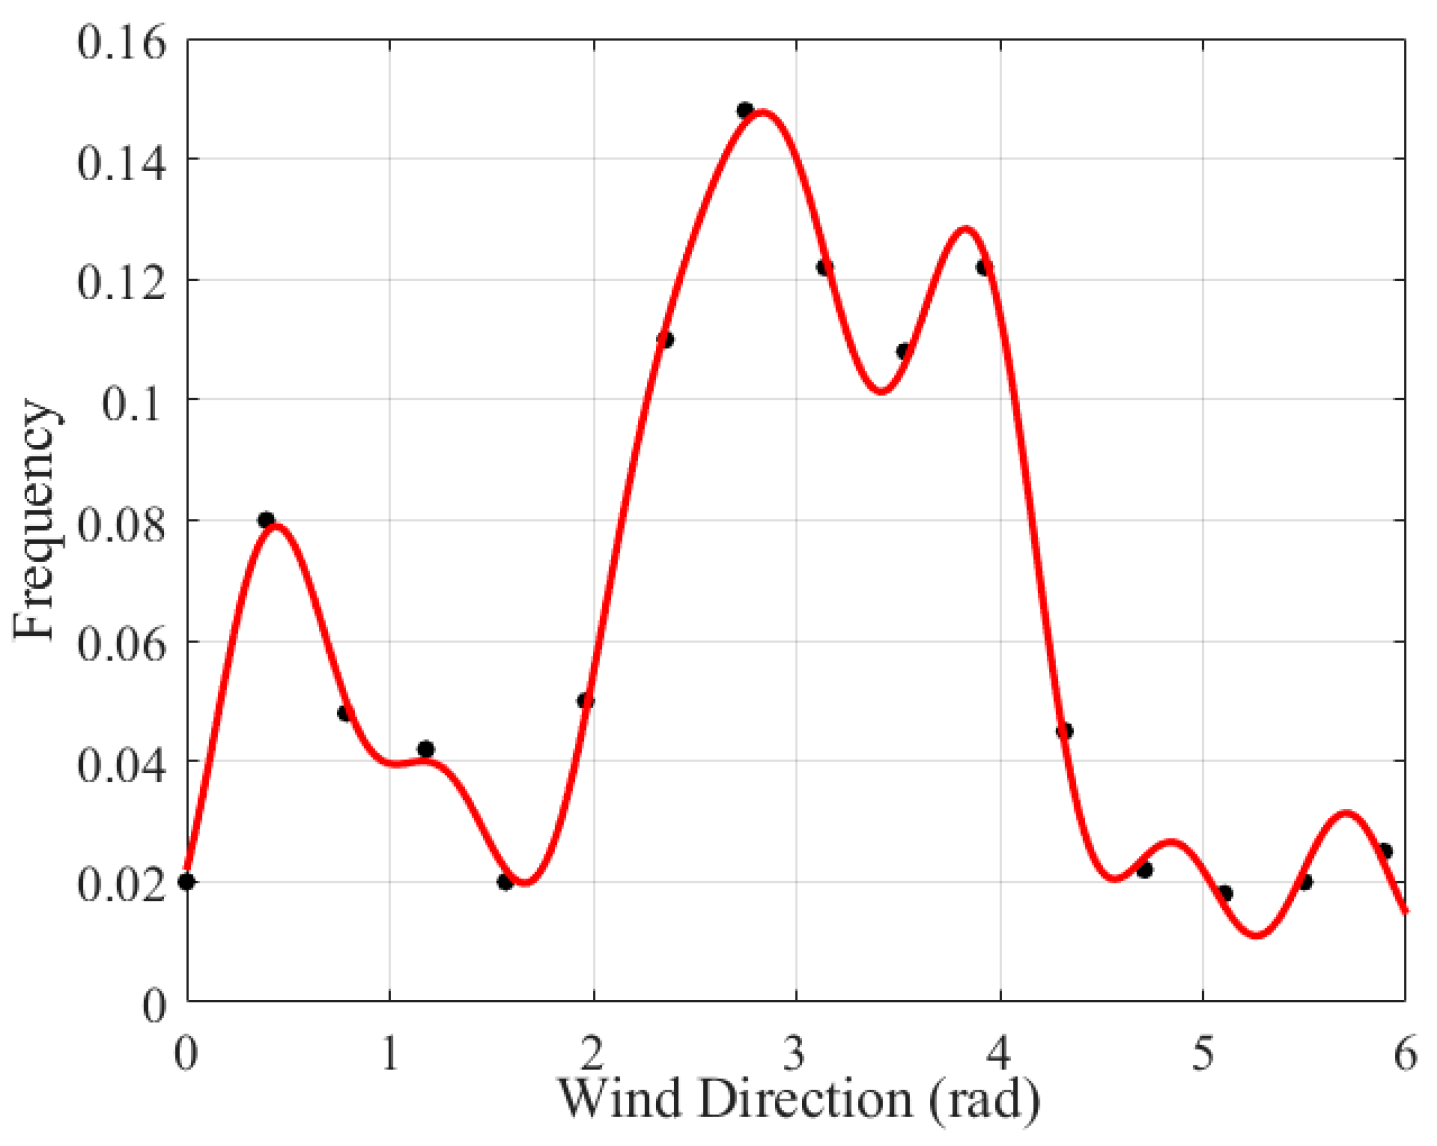
According to the Formula (6), the wind direction frequency and distribution parameters A and B of Gumbel distribution in Table 2 are fitted by Origin 2022 software, and the nf, nA, nB are taken as seven orders. The results are shown in Table 3.
The fitted harmonic function curves for each parameter are shown in Figure 5, Figure 6 and Figure 7.

3. Wind Load Calculation

3.1. Principle of Wind Load Calculation

Using FLUENT 2022 R1 software, the effect of the wind angle of attack on the wind load of the bridge was considered, and the change of the wind load of the bridge was analyzed under different wind angles of attack, so as to obtain the most unfavorable wind load value.
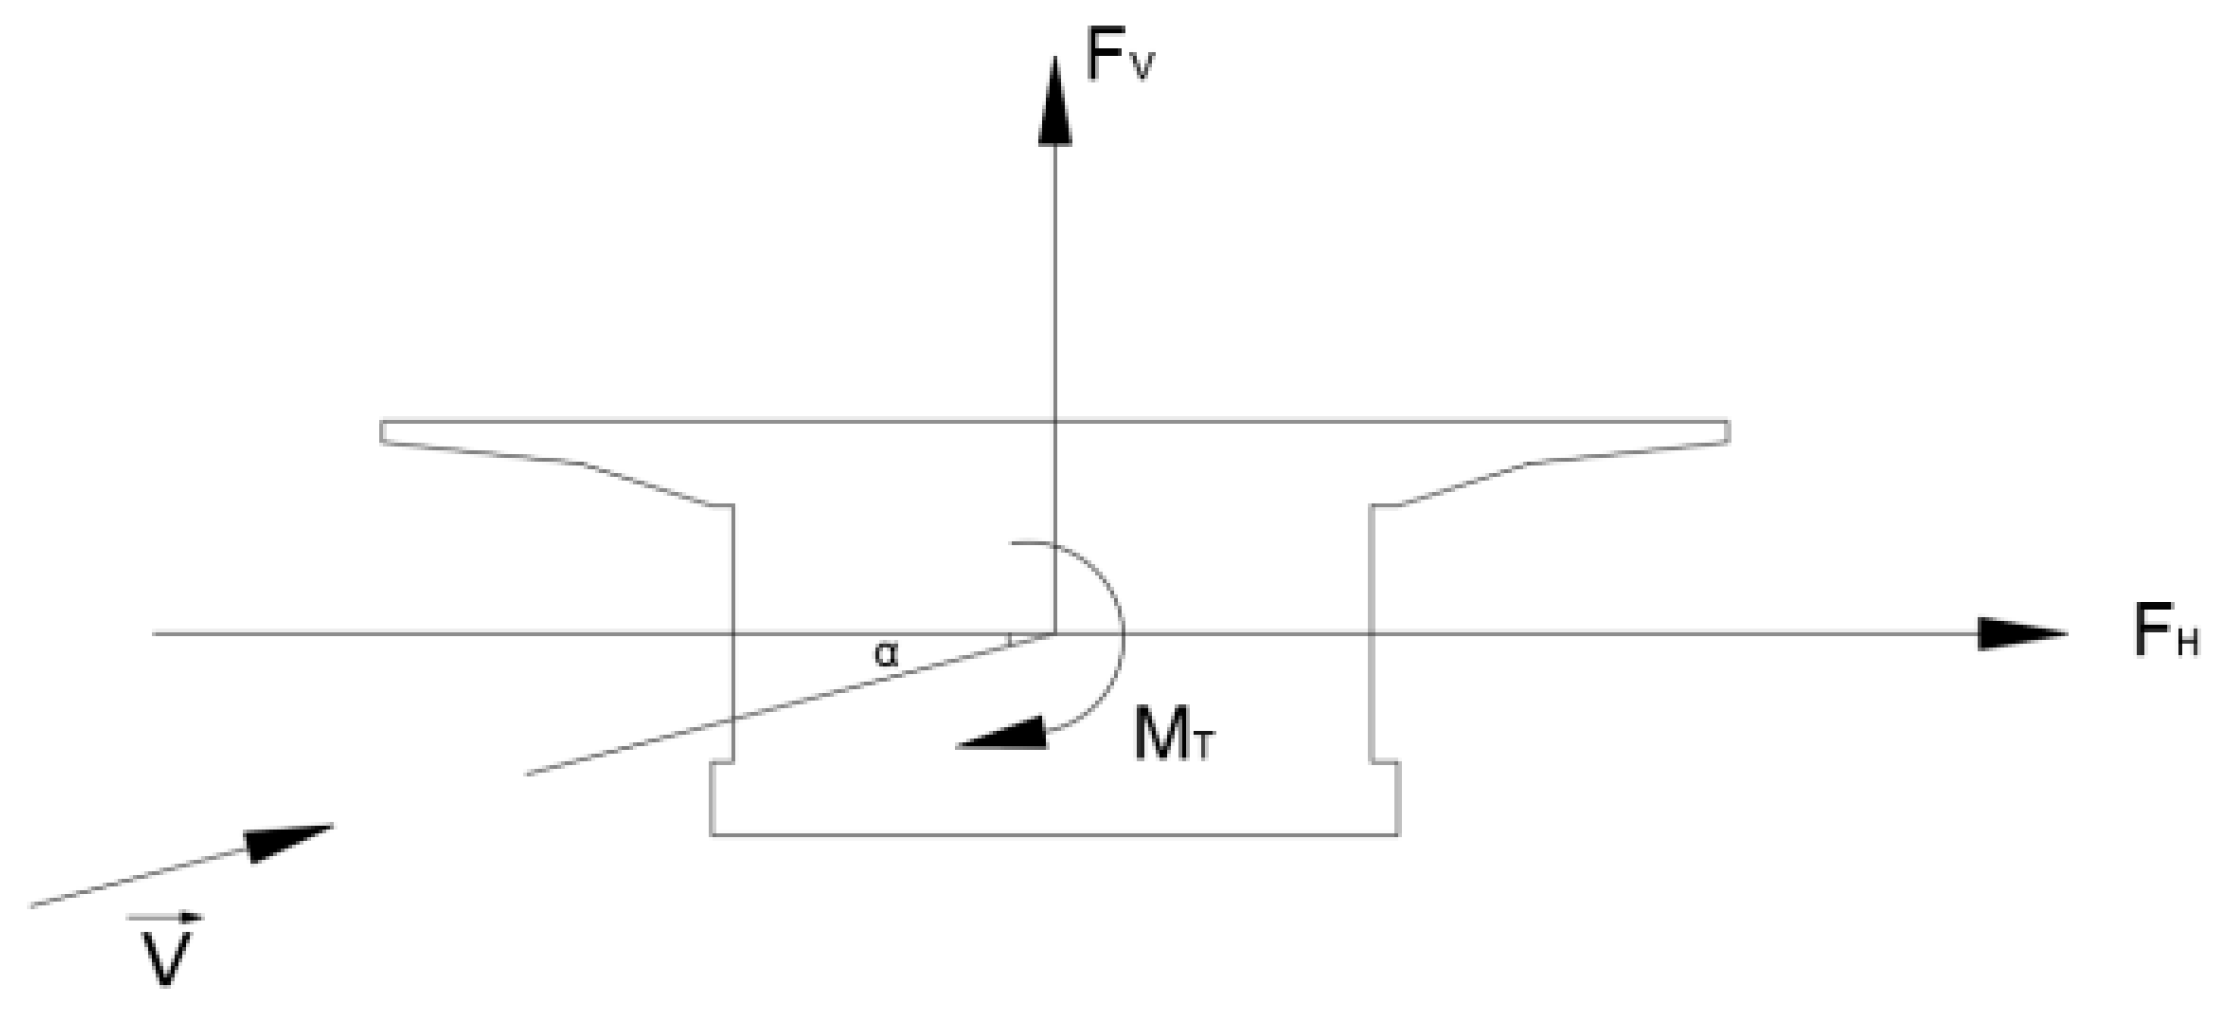
Because when the bridge section is considered as a rigid body in the wind field, the wind field will be disturbed, so that the flow point on the beam surface will change, and the faster the flow, the smaller the pressure. Therefore, the lift load is the difference in pressure between the upper and lower surfaces of the bridge section, and similarly, the drag load is the difference in pressure between the windward and leeward surfaces of the bridge section, and the pitching moment is generated by the inconsistency between the resultant force of lift and drag on the bridge section and its centroid. The bridge section in a fluid with velocity V will be subjected to forces FV along the bridge and FH in the trans-bridge direction, as well as the flow-induced static moment MT, as shown in Figure 8.
The static three-component coefficient on the bridge section is defined as [25]:
C H ( α ) = 2 F H ρ U 2 H C V ( α ) = 2 F V ρ U 2 B C M ( α ) = 2 M T ρ U 2 B 2
In the formula, CH(α), CV(α) and CM(α) are the drag coefficient, lift coefficient and lift moment coefficient, respectively; FH, FV and FT are lift, drag, and lift moment, respectively; ρ is the density of air, taken as 1.225 kg/m3; U is the average wind speed; H and B denote the height and width of the segmental model; and α is the wind angle of attack. Because the three-component force varies accordingly with the wind angle of attack, it is generally taken as the maximum value in the range of −3° to 3° deviating from the safe wind angle of attack.

3.2. Model Validation

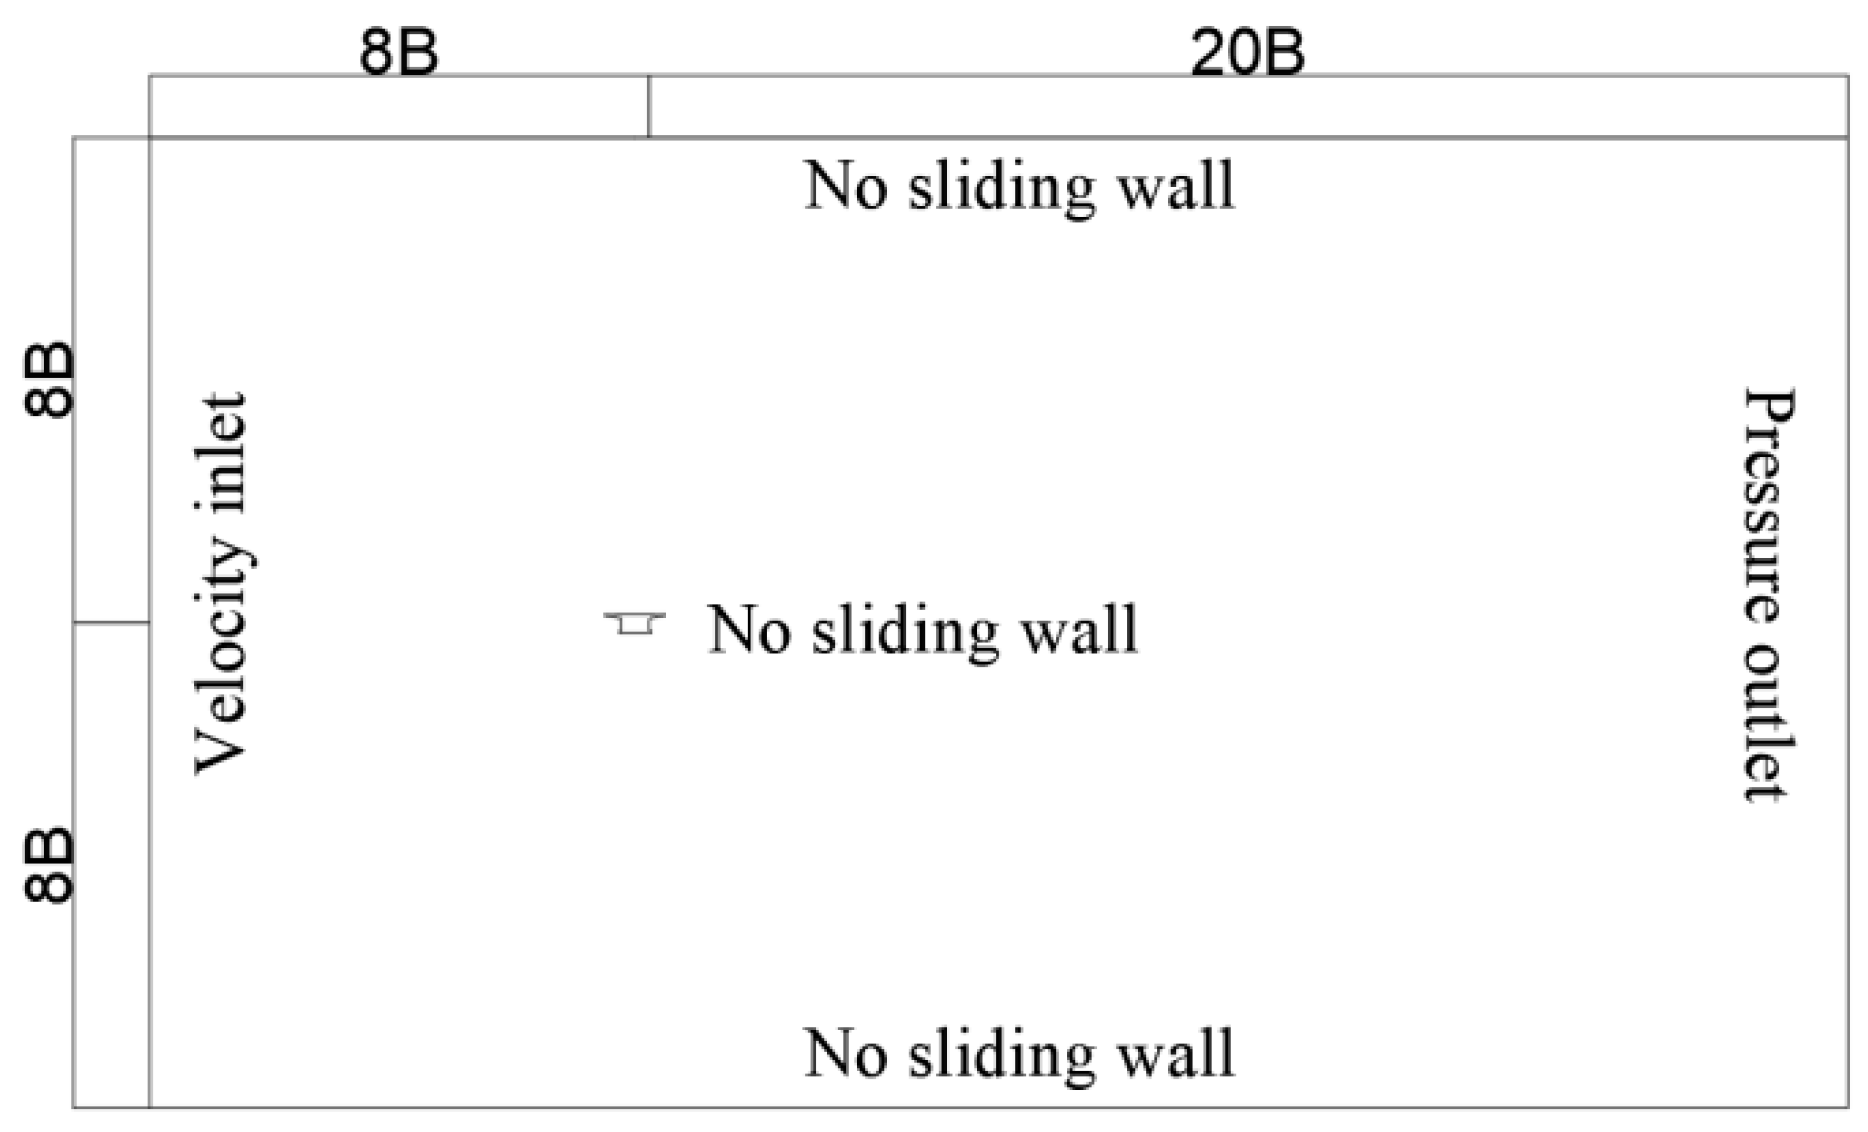
In order to ensure the accuracy of the simulation results, improve the calculation efficiency and accurately describe the flow characteristics near the wall, the Coupled numerical algorithm is used to study the static three-component force coefficient of the main girder section of the bridge by FLUENT 2022 R1 software. In the simulation process, the air is assumed to be an incompressible fluid that remains unchanged, and the SST k–ω model is selected as the turbulence model [26]. In this study, the computational domain is taken as a rectangle of 16B × 28B (B is the computed width of the box girder section, B = 12.75 m), as shown in Figure 9 boundary conditions of the calculation domain: the inlet is the velocity inlet boundary, the outlet is the pressure outlet boundary, upper and lower boundaries are symmetric boundaries. The maximum wind speed of the most unfavorable wind direction is 30.69 m/s, and the calculation cross-section is modeled by the actual size.
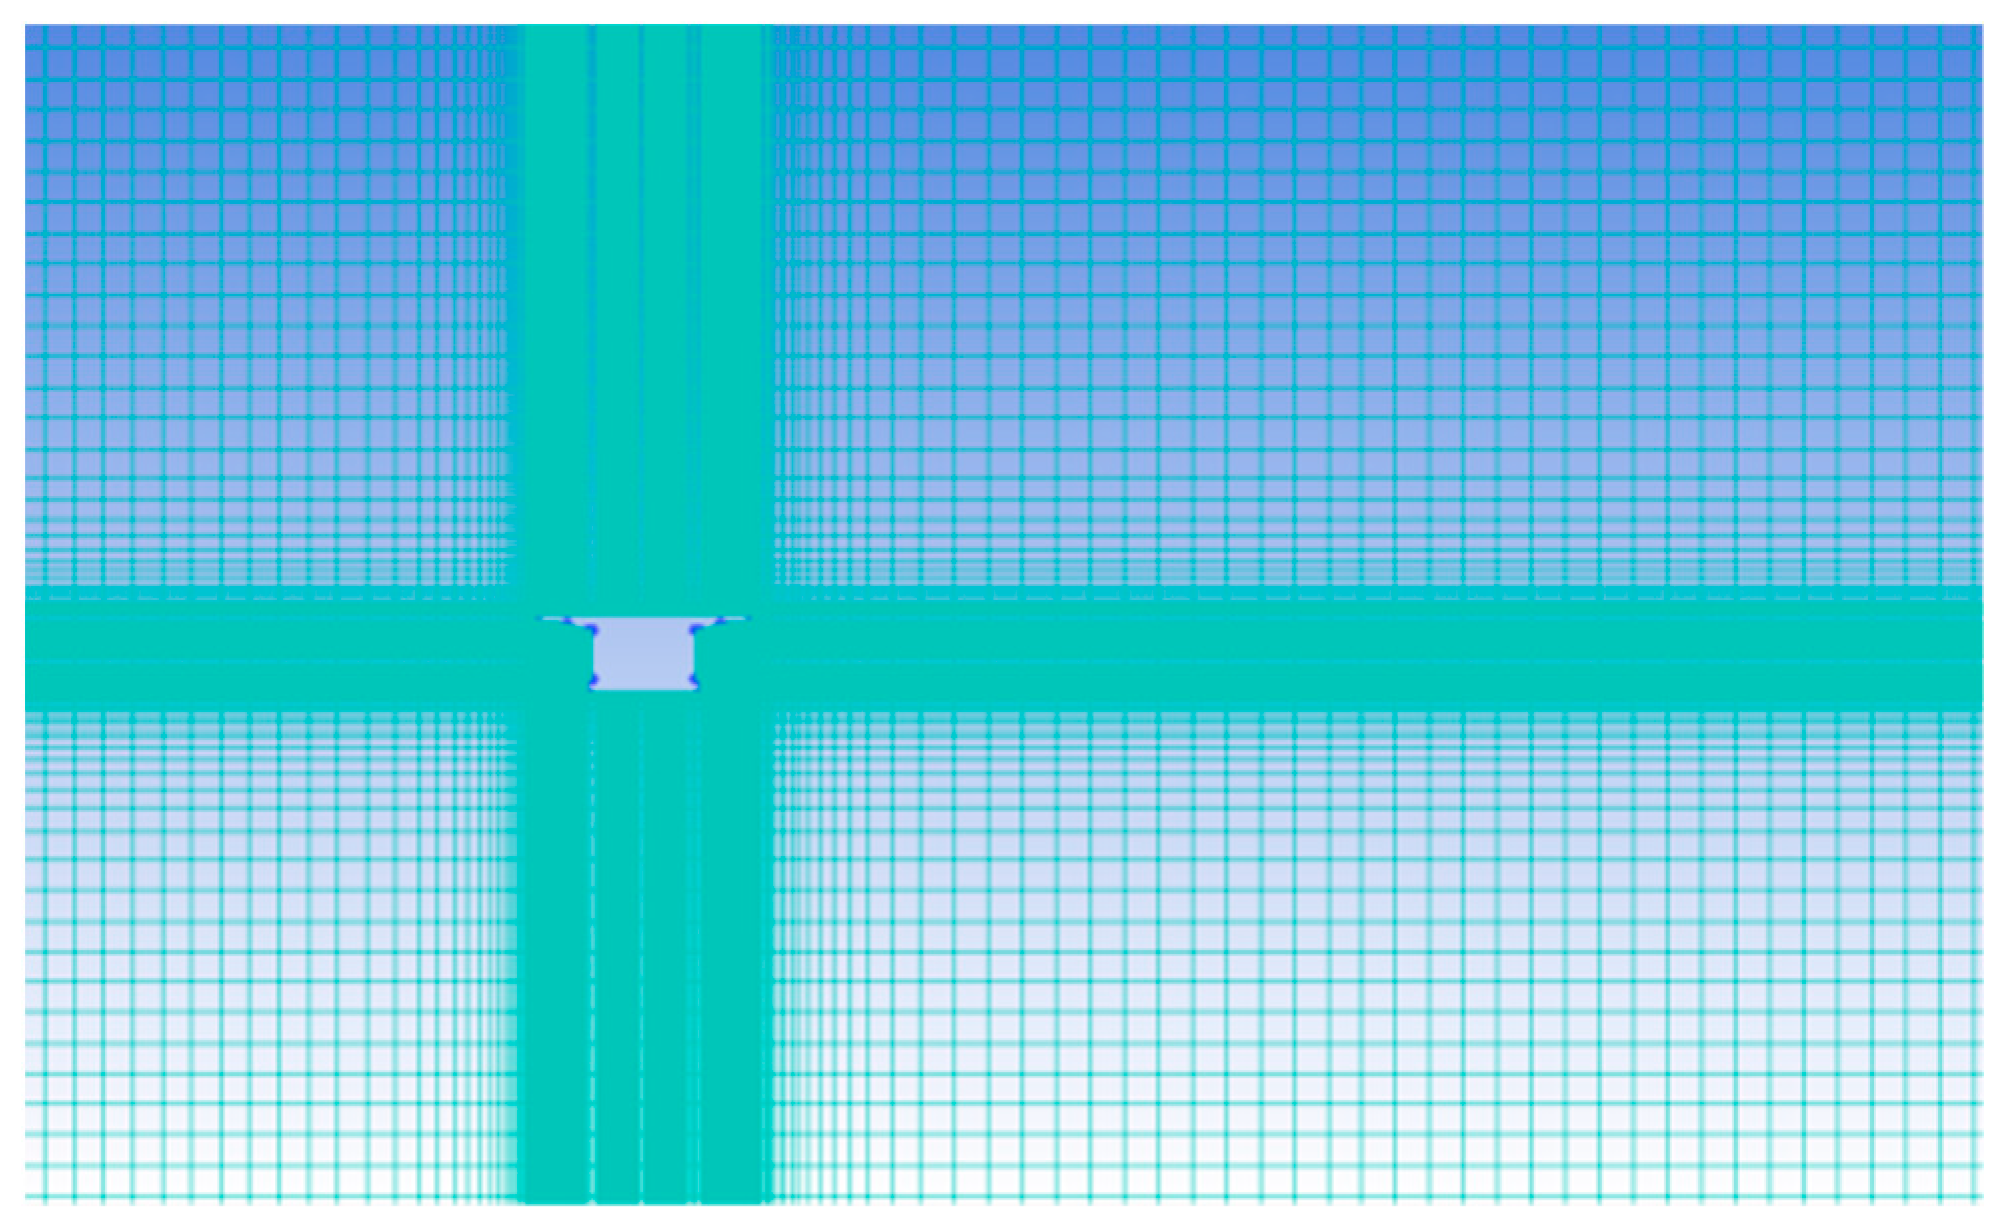
In the computational domain, the shape of the flow cross-section is established according to the shape and size of the object, and then the computational domain is divided into grids. In order to make the computational grid adapt to the changes in fluency variables, the grid division in places with drastic changes in fluency variables should be denser, while the grid division in places with slow changes should be sparse, and the grid size between the two should gradually transition, as shown in Figure 10.
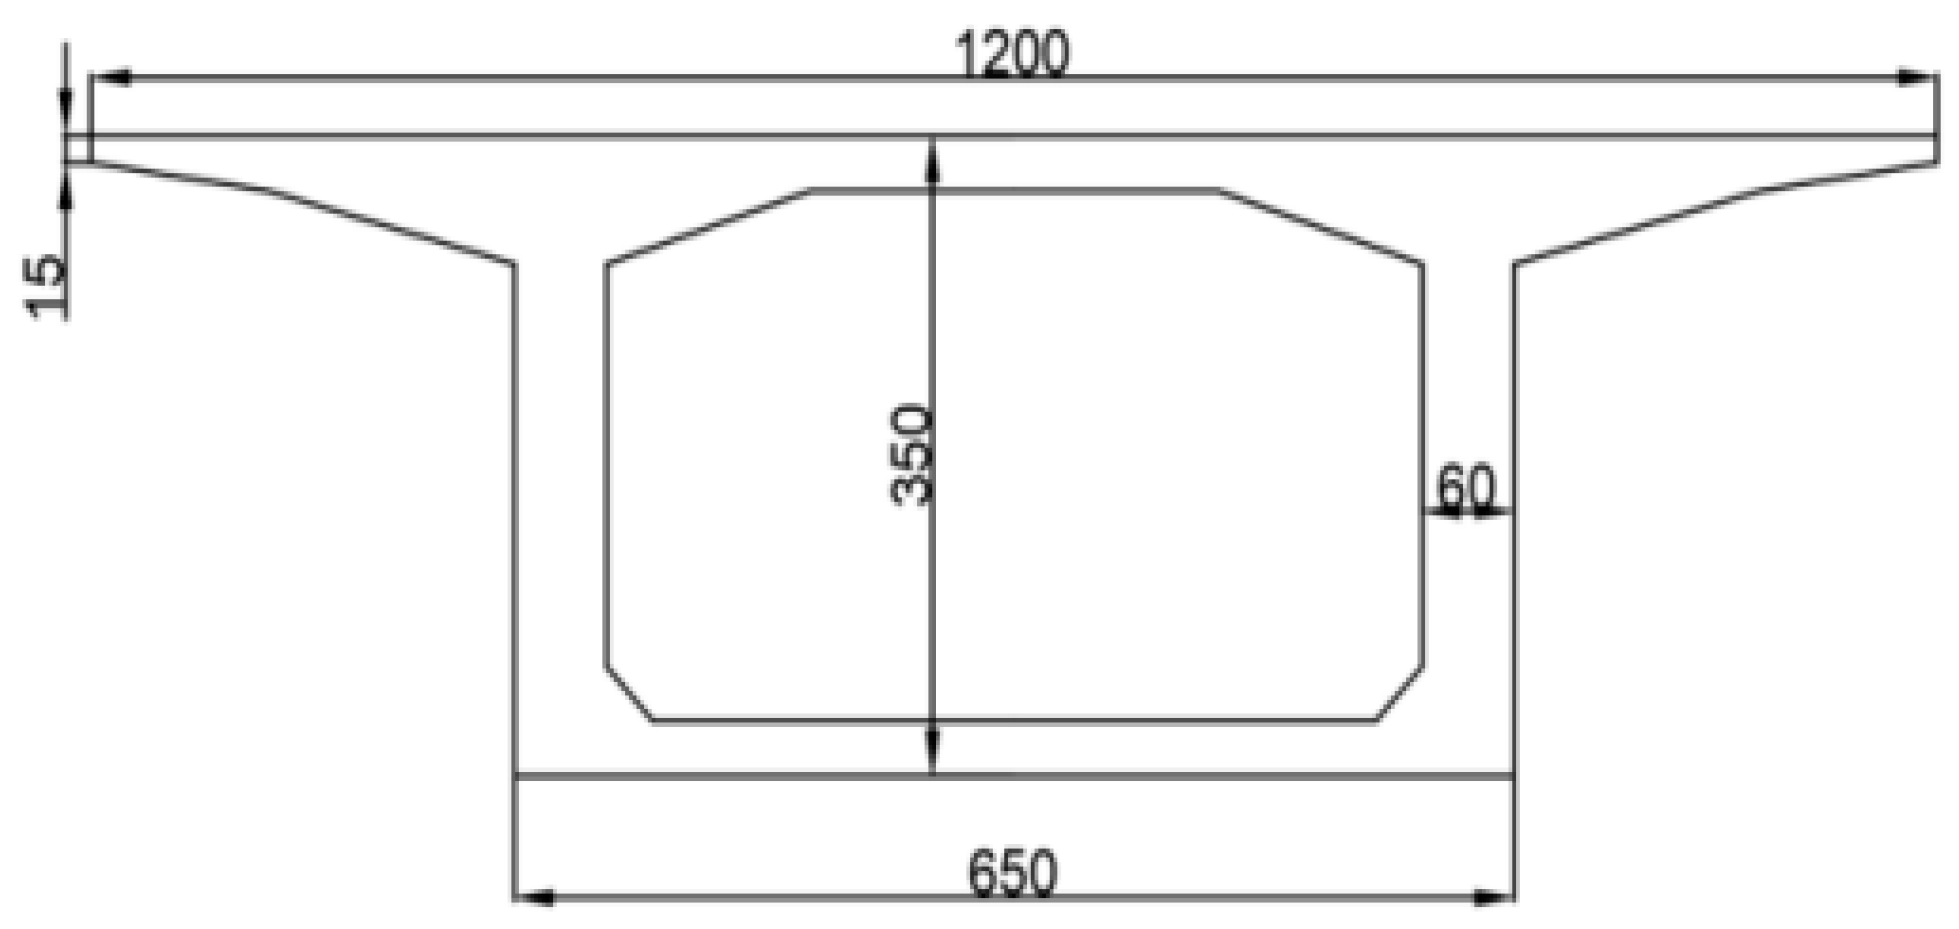
Aiming at a concrete rigid frame bridge with a total length of 1010 m, the bridge span arrangement is 105 m + 4 × 200 m + 105 m. The bridge is located in the mountainous area, but the terrain is relatively broad and flat. In this paper, the mid-span section of the bridge is selected (see Figure 11 below), and the two-dimensional modeling analysis is carried out at 0° wind attack angle. In order to verify the reliability of the model, we compare the numerical simulation results with the wind tunnel test results to verify the feasibility of the numerical simulation [27].
The simulated wind speed U is adopted as 10 m/s. The simulation results include the main beam drag coefficient, lift coefficient and lift moment coefficient. The comparison results are shown in Table 4.
It can be seen from Table 4 that the simulated three-component coefficient is in good agreement with the experimental data. Although there is a certain error between the lift coefficient and the experimental data, it is within the acceptable range.

3.3. Three-Component Force Coefficient and Three-Component Force Calculation Results and Analysis

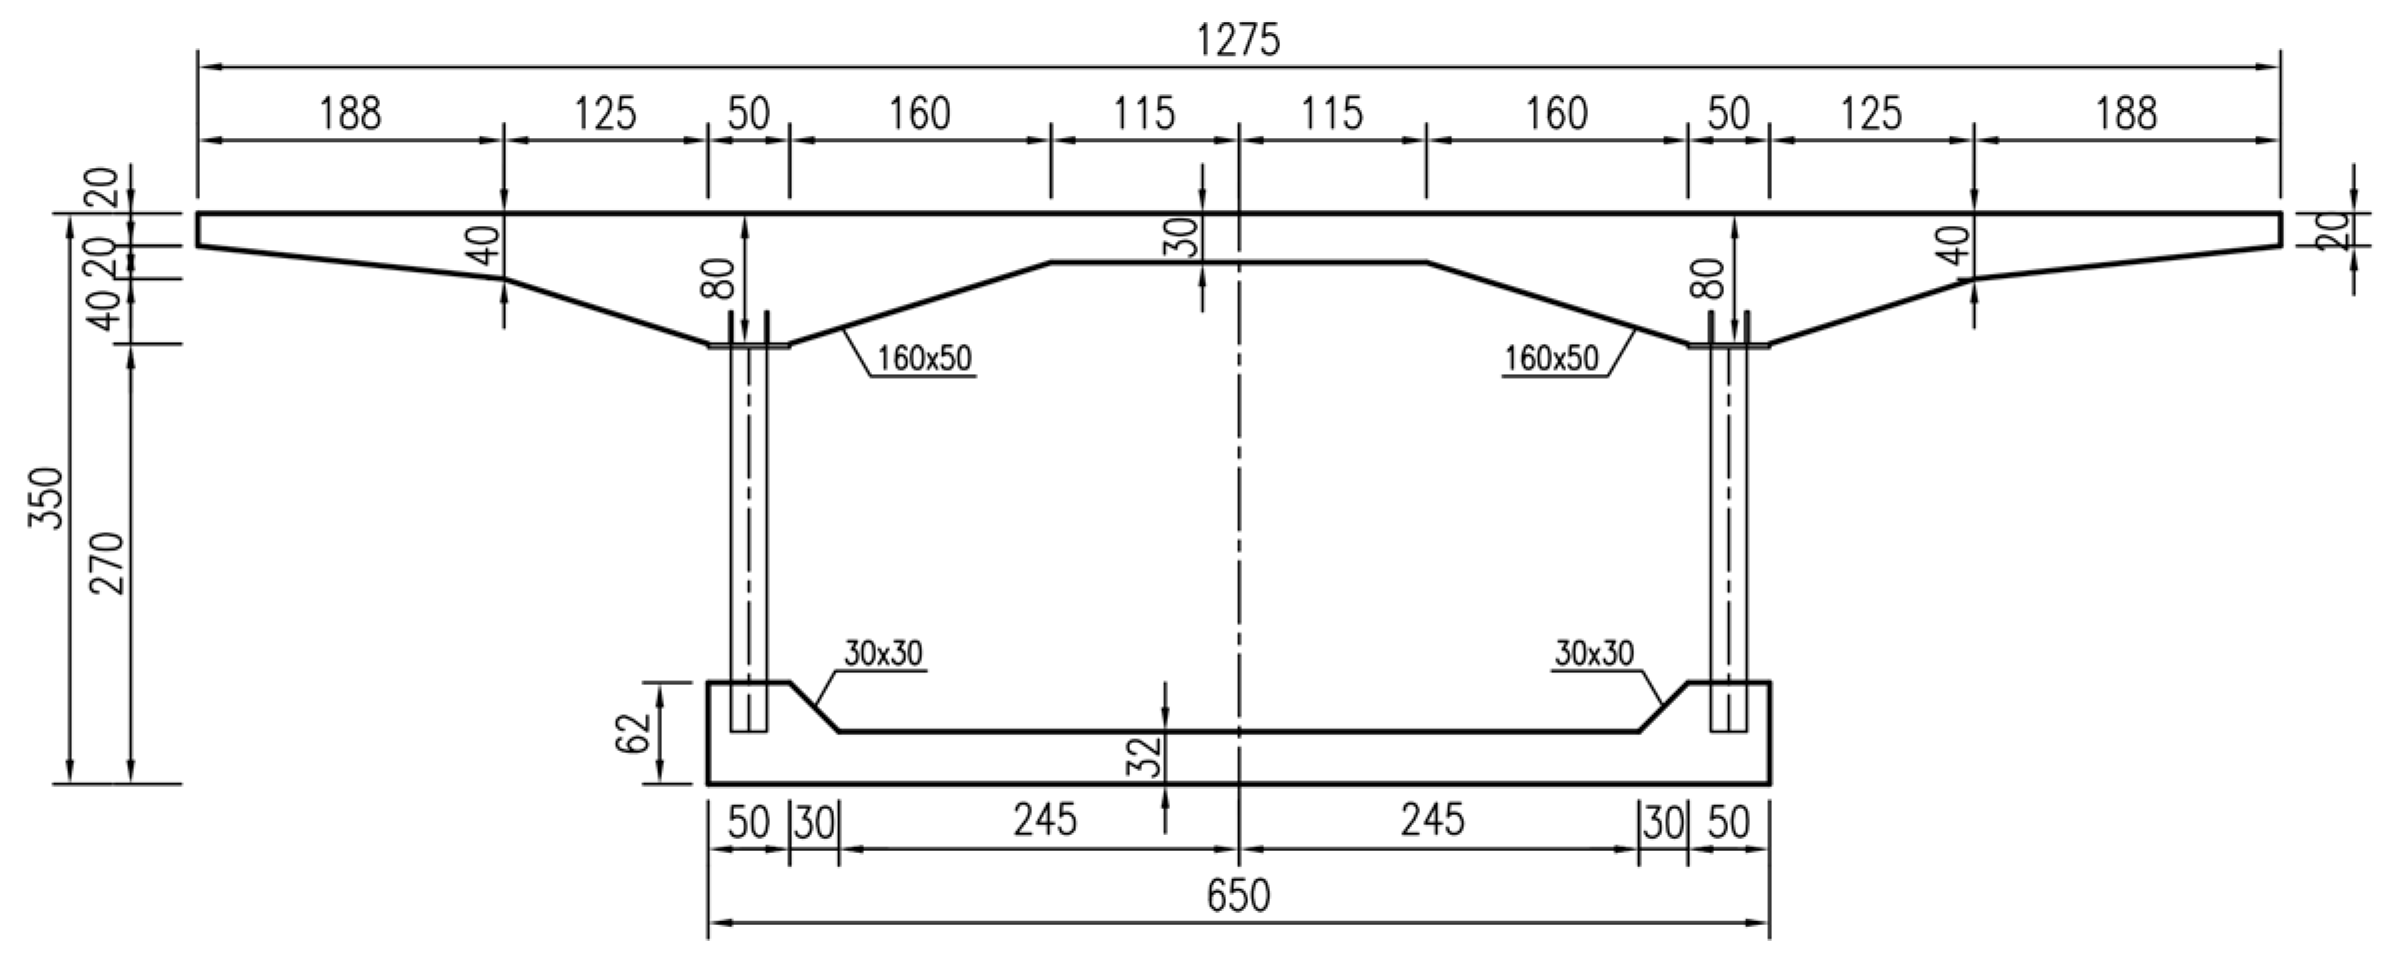
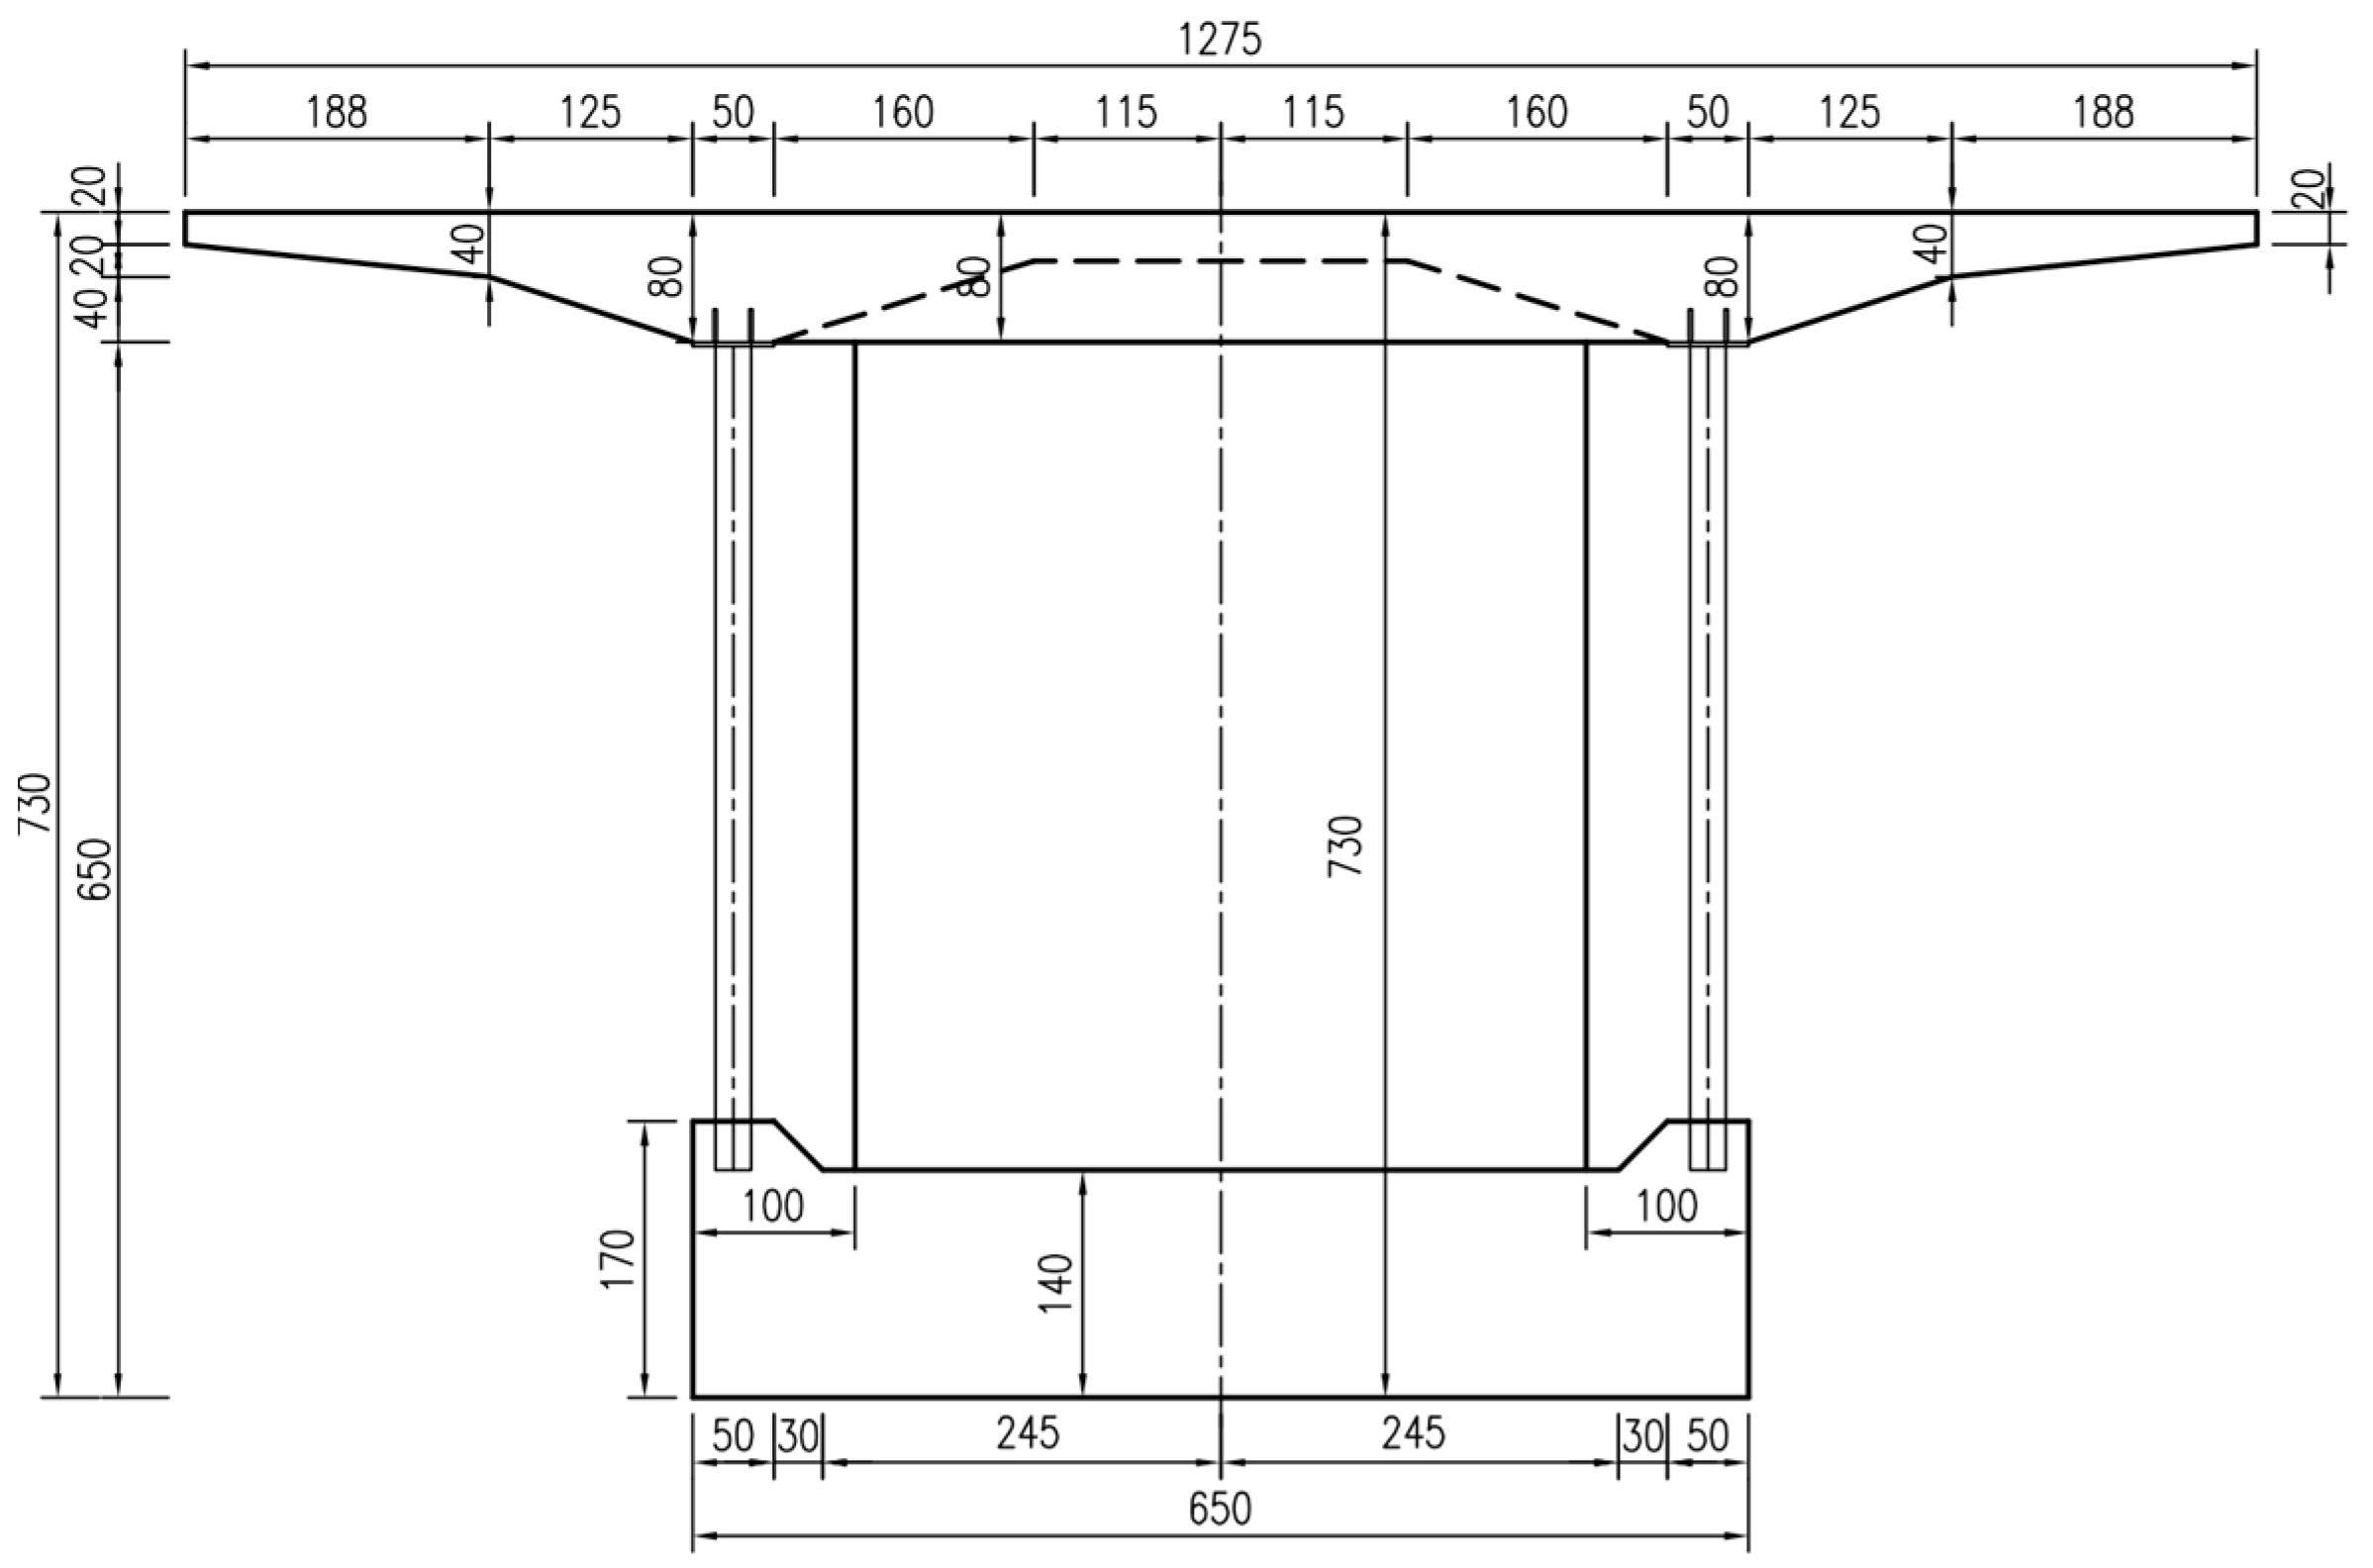
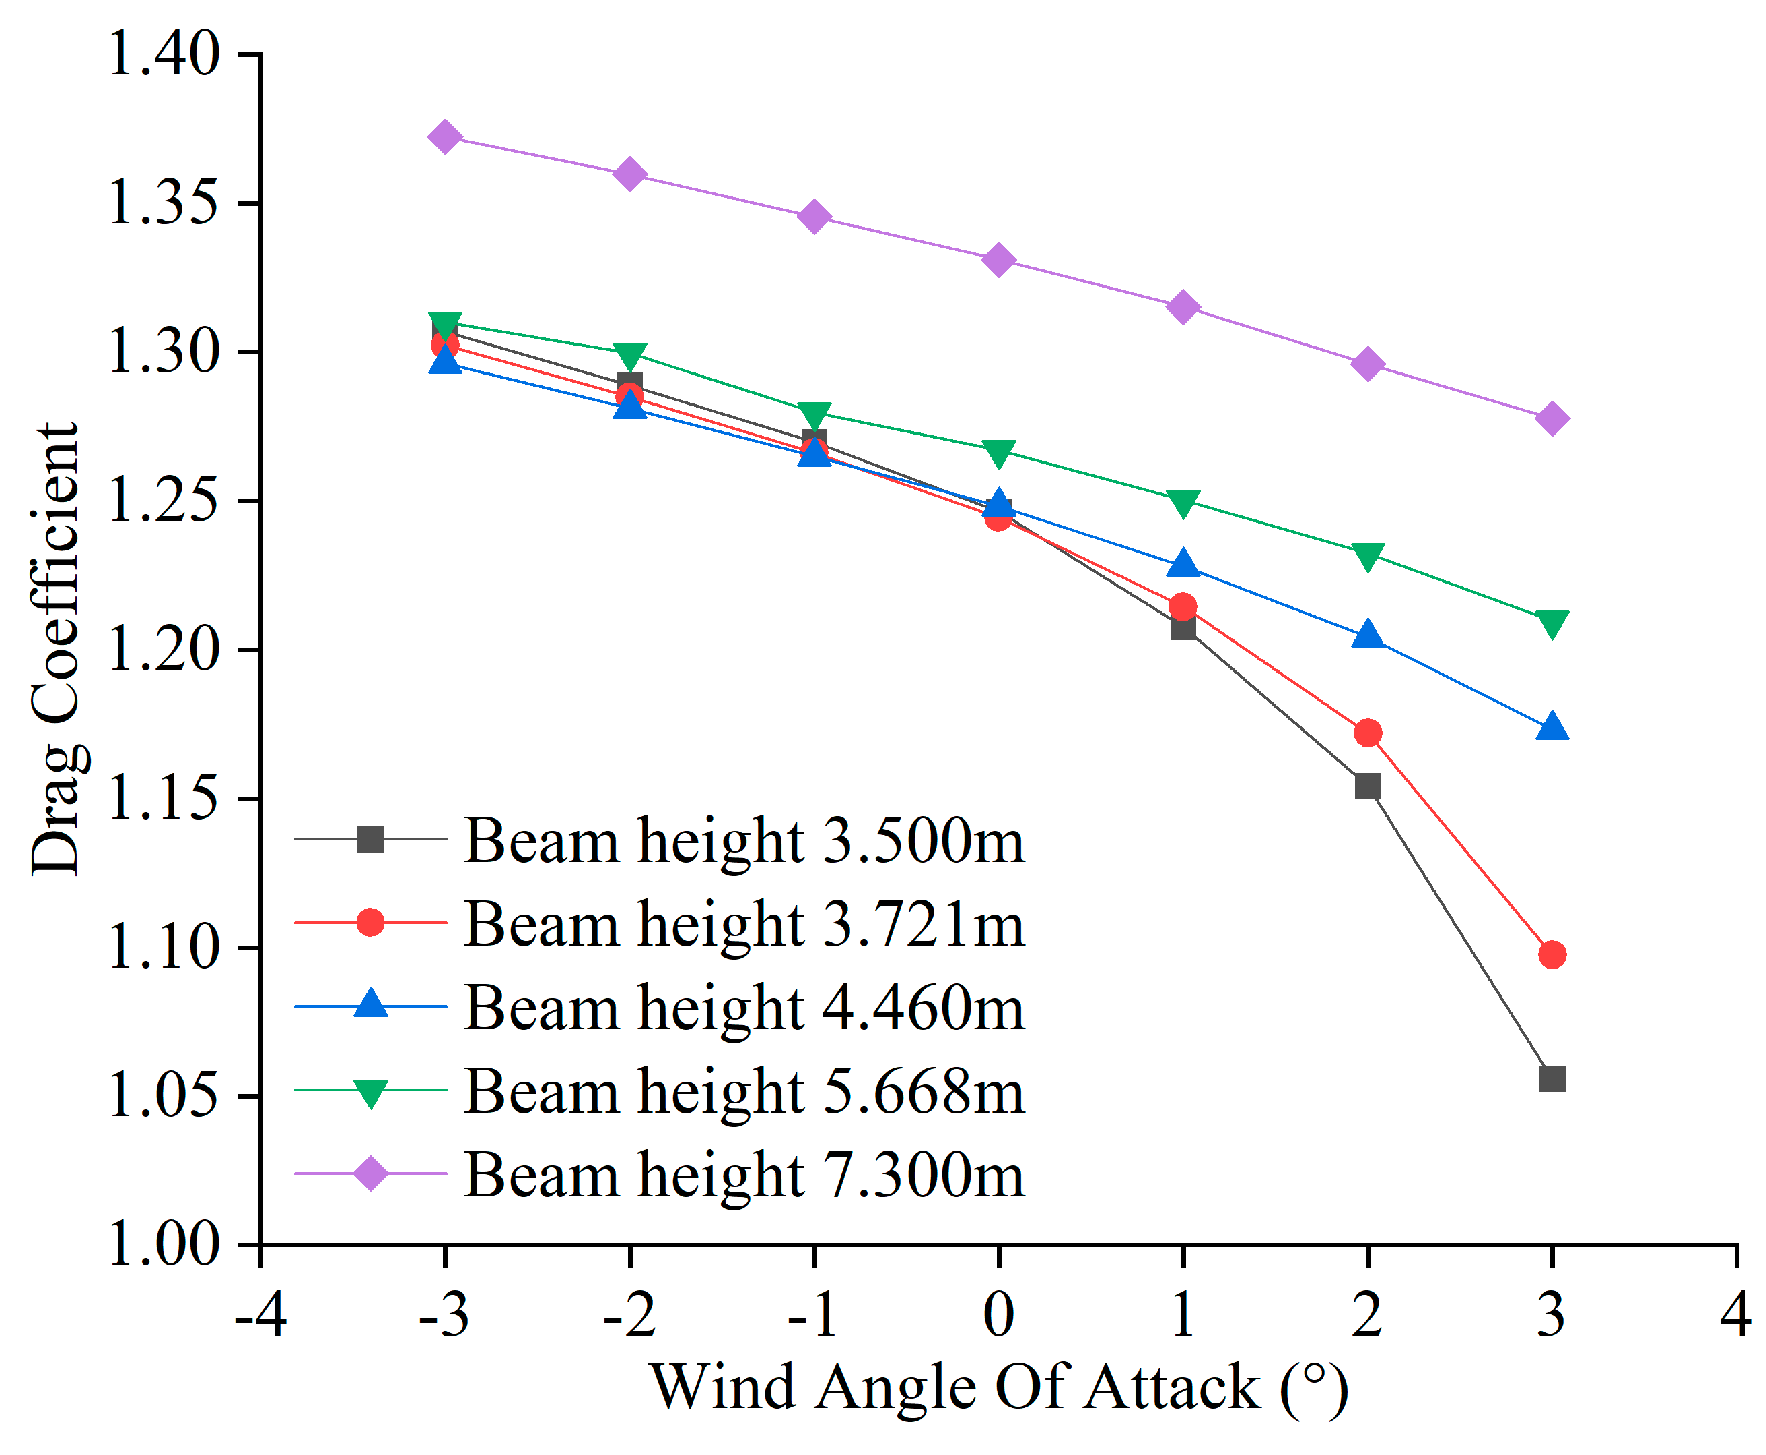
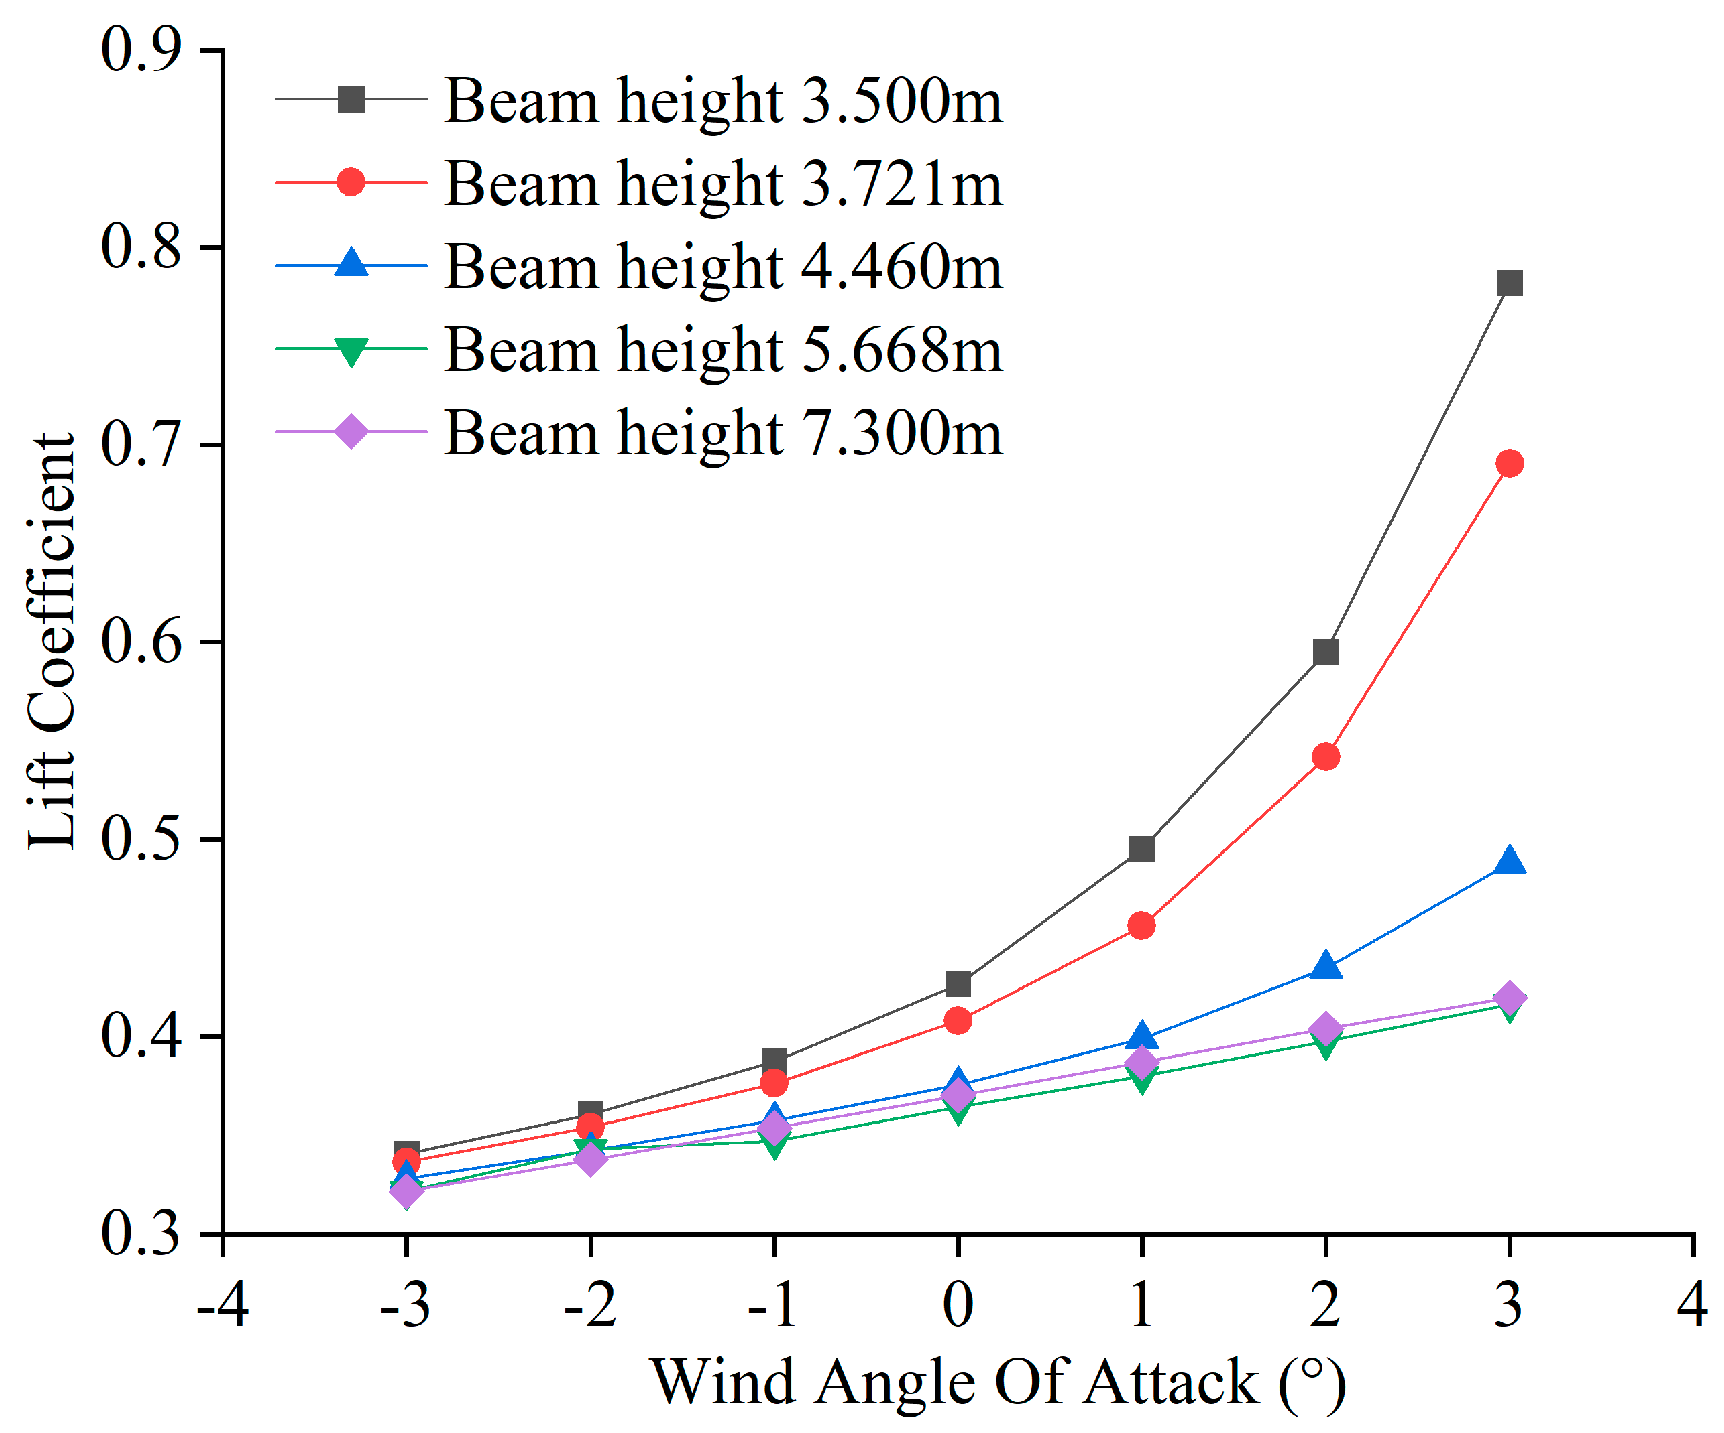
Five typical cross-sections are selected: side span 1/4 span (3.721 m,), side span middle span (4.460 m), abutment (7.300 m, as shown in Figure 12), middle span 1/4 span (5.668 m) and middle span center (3.500 m as shown in Figure 13). Since there is no measured wind attack angle data, selecting a smaller range of the wind attack angle can increase a certain degree of security. A total of seven wind angles of attack −3°, −2°, −1°, 0°, 1°, 2° and 3° are simulated for each calculation section and the incoming wind speed is taken as the design basic wind speed of 30.69 m/s in the 100-year return period of the most unfavorable wind direction.
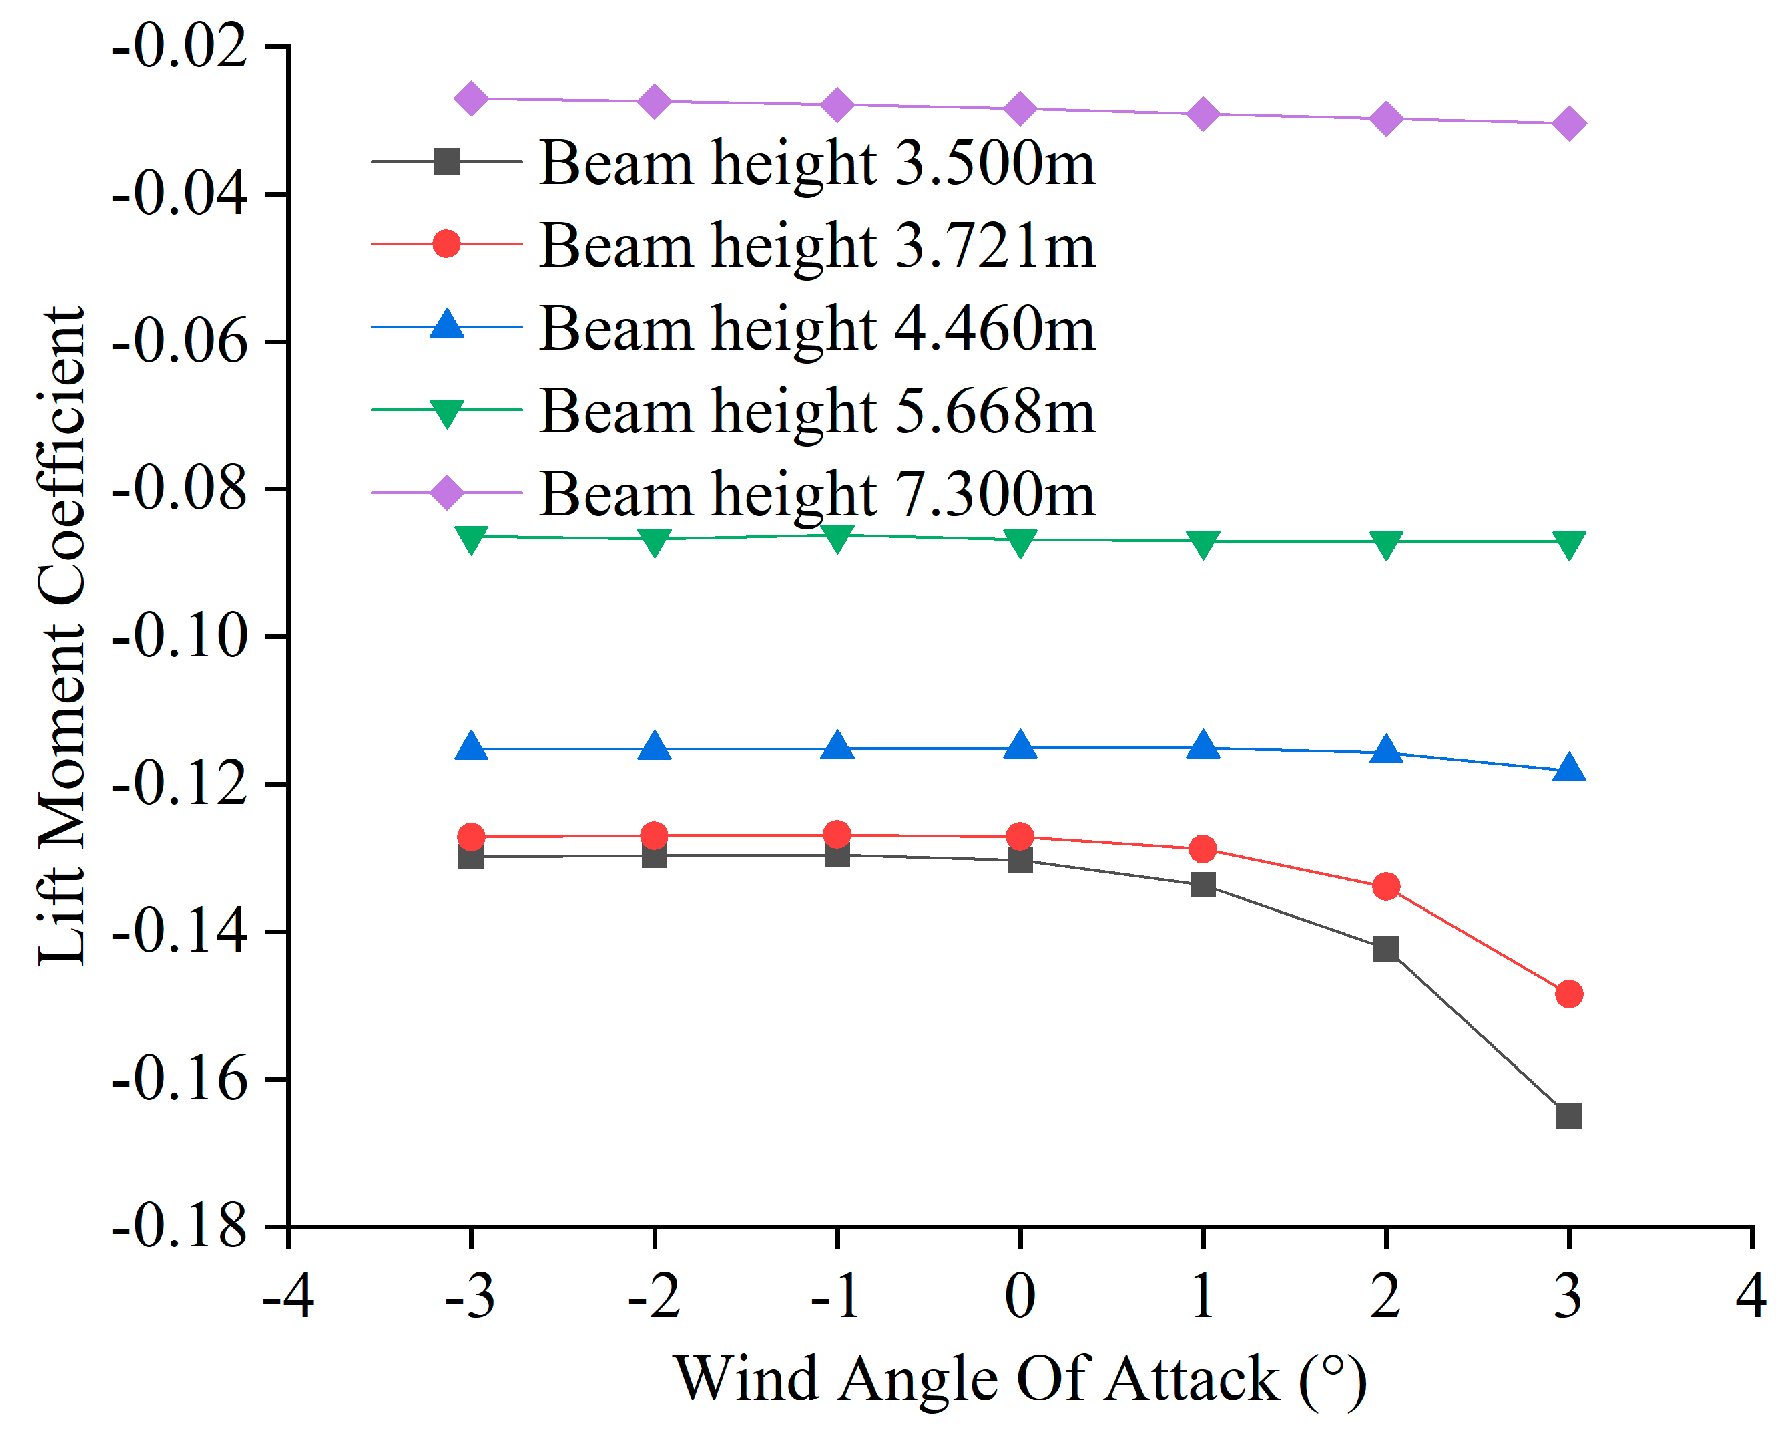
As shown in Figure 14, Figure 15 and Figure 16, when the angle of attack remains unchanged, the drag coefficient and lift moment coefficient increase with the increase in beam height, while the lift coefficient decreases with the increase in beam height. When the beam height is the same, the drag coefficient and pitching moment coefficient decrease with the increase in the angle of attack, and the lift coefficient increases with the increase in the angle of attack.
A concept of relative three-component force coefficient is introduced here, which is calculated as follows [24]:
C H 0 = C H C H ( 0 ° ) C V 0 = C V C V ( 0 ° ) C M 0 = C M C M ( 0 ° )
where CH0, CV0 and CM0 indicate relative drag coefficient, relative lift coefficient, and relative lift moment coefficient; CH(0°), CV(0°) and CM(0°) indicate the drag coefficient, lift coefficient, and lift moment coefficient of the bridge at 0° wind angle of attack.
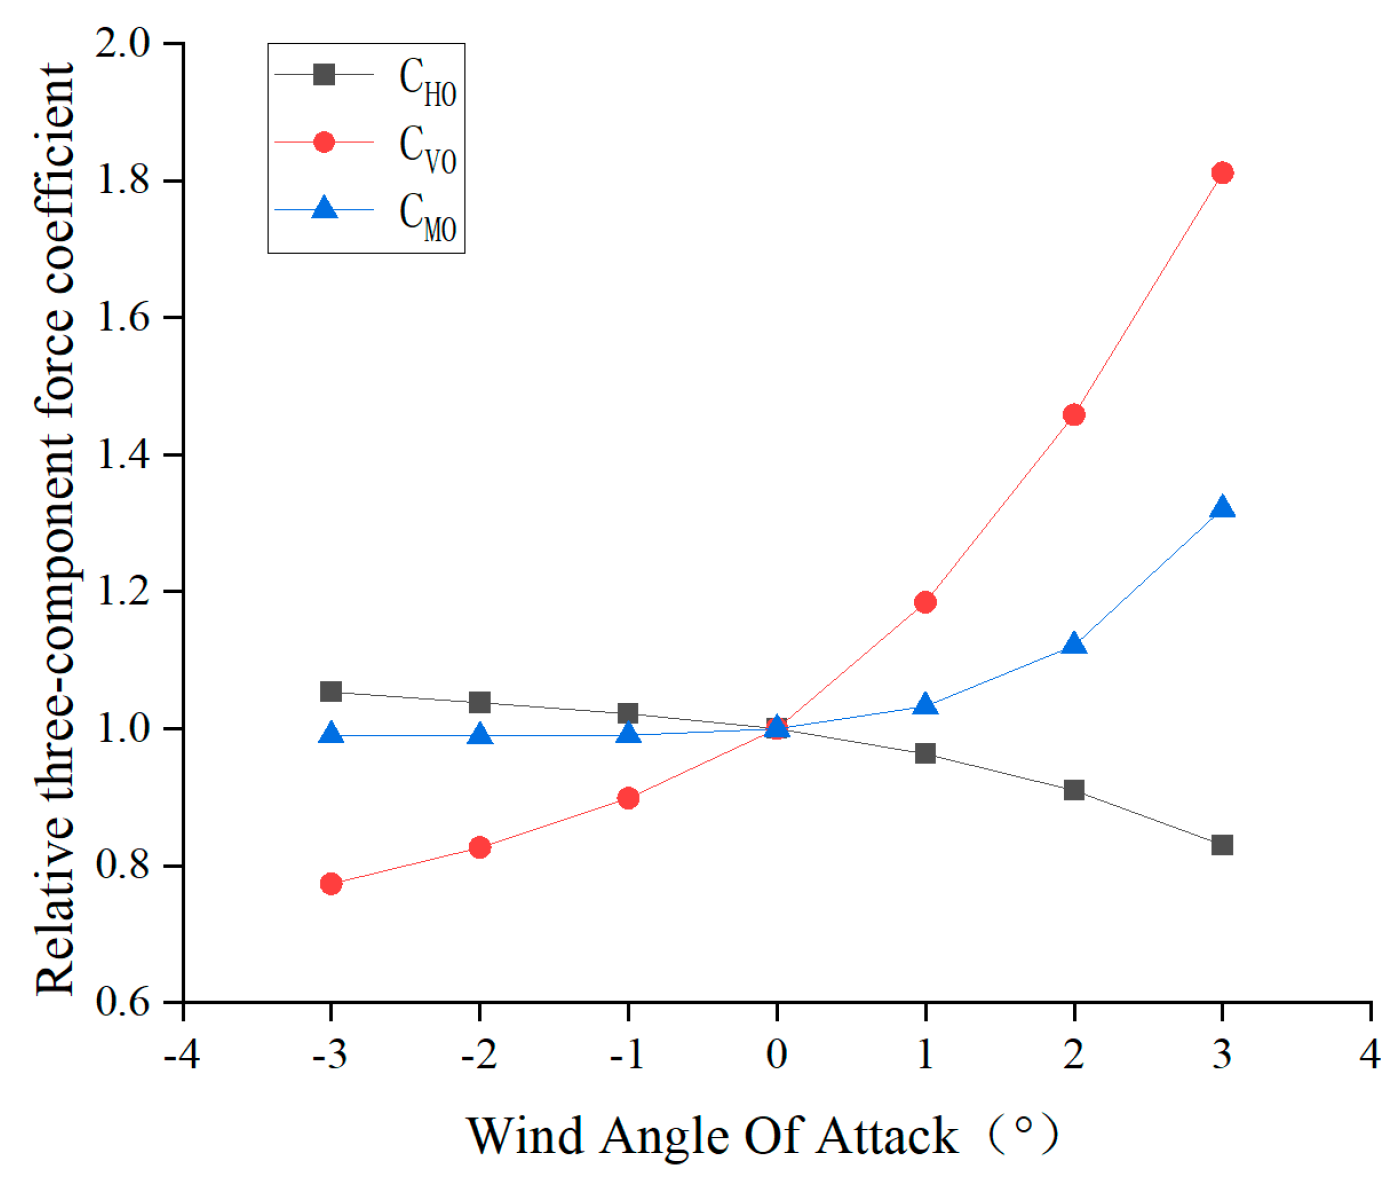
The effect of introducing the relative three-component coefficient is that the wind load at the known 0° wind attack angle can be multiplied by the relative three-component coefficient to obtain the wind load at different attack angles. Because the drag coefficient, lift coefficient and lift moment coefficient are quite different, the change trend of the three-component force coefficient under different wind attack angles can be analyzed more intuitively by the relative three-component force coefficient.
Because the variation law of wind attack angle-relative three-component coefficient of different beam heights is the same, only the wind attack angle-relative three-component coefficient diagram of the mid-span section of the bridge is given. As can be seen from the above Figure 17, the relative lift coefficient and relative lift moment coefficient gradually increase, and the relative drag coefficient gradually decreases as the wind angle of attack increases. The relative drag coefficient and the relative lift moment coefficient vary less, while the relative lift coefficient grows faster and takes the maximum value at 3° wind angle of attack, with a value of 1.81.
It can be seen that the wind load is the most unfavorable wind attack angle when the wind attack angle is 3°. It can be determined that the most unfavorable wind load direction is NNE and the most unfavorable wind angle of attack is 3°. Based on the basic wind speed of the 100-year return period of the most unfavorable wind direction, the static three-component force of each section of the corrugated steel web PC composite box girder bridge at 3° wind attack angle is calculated, as shown in Table 5. The load values in the table are applied to different sections of the bridge model built in Section 4 in the form of concentrated force and concentrated bending moment.

4. Fatigue Life Estimation of PC Composite Box Girder Bridge with Corrugated Steel Webs

4.1. Finite Element Solid Model

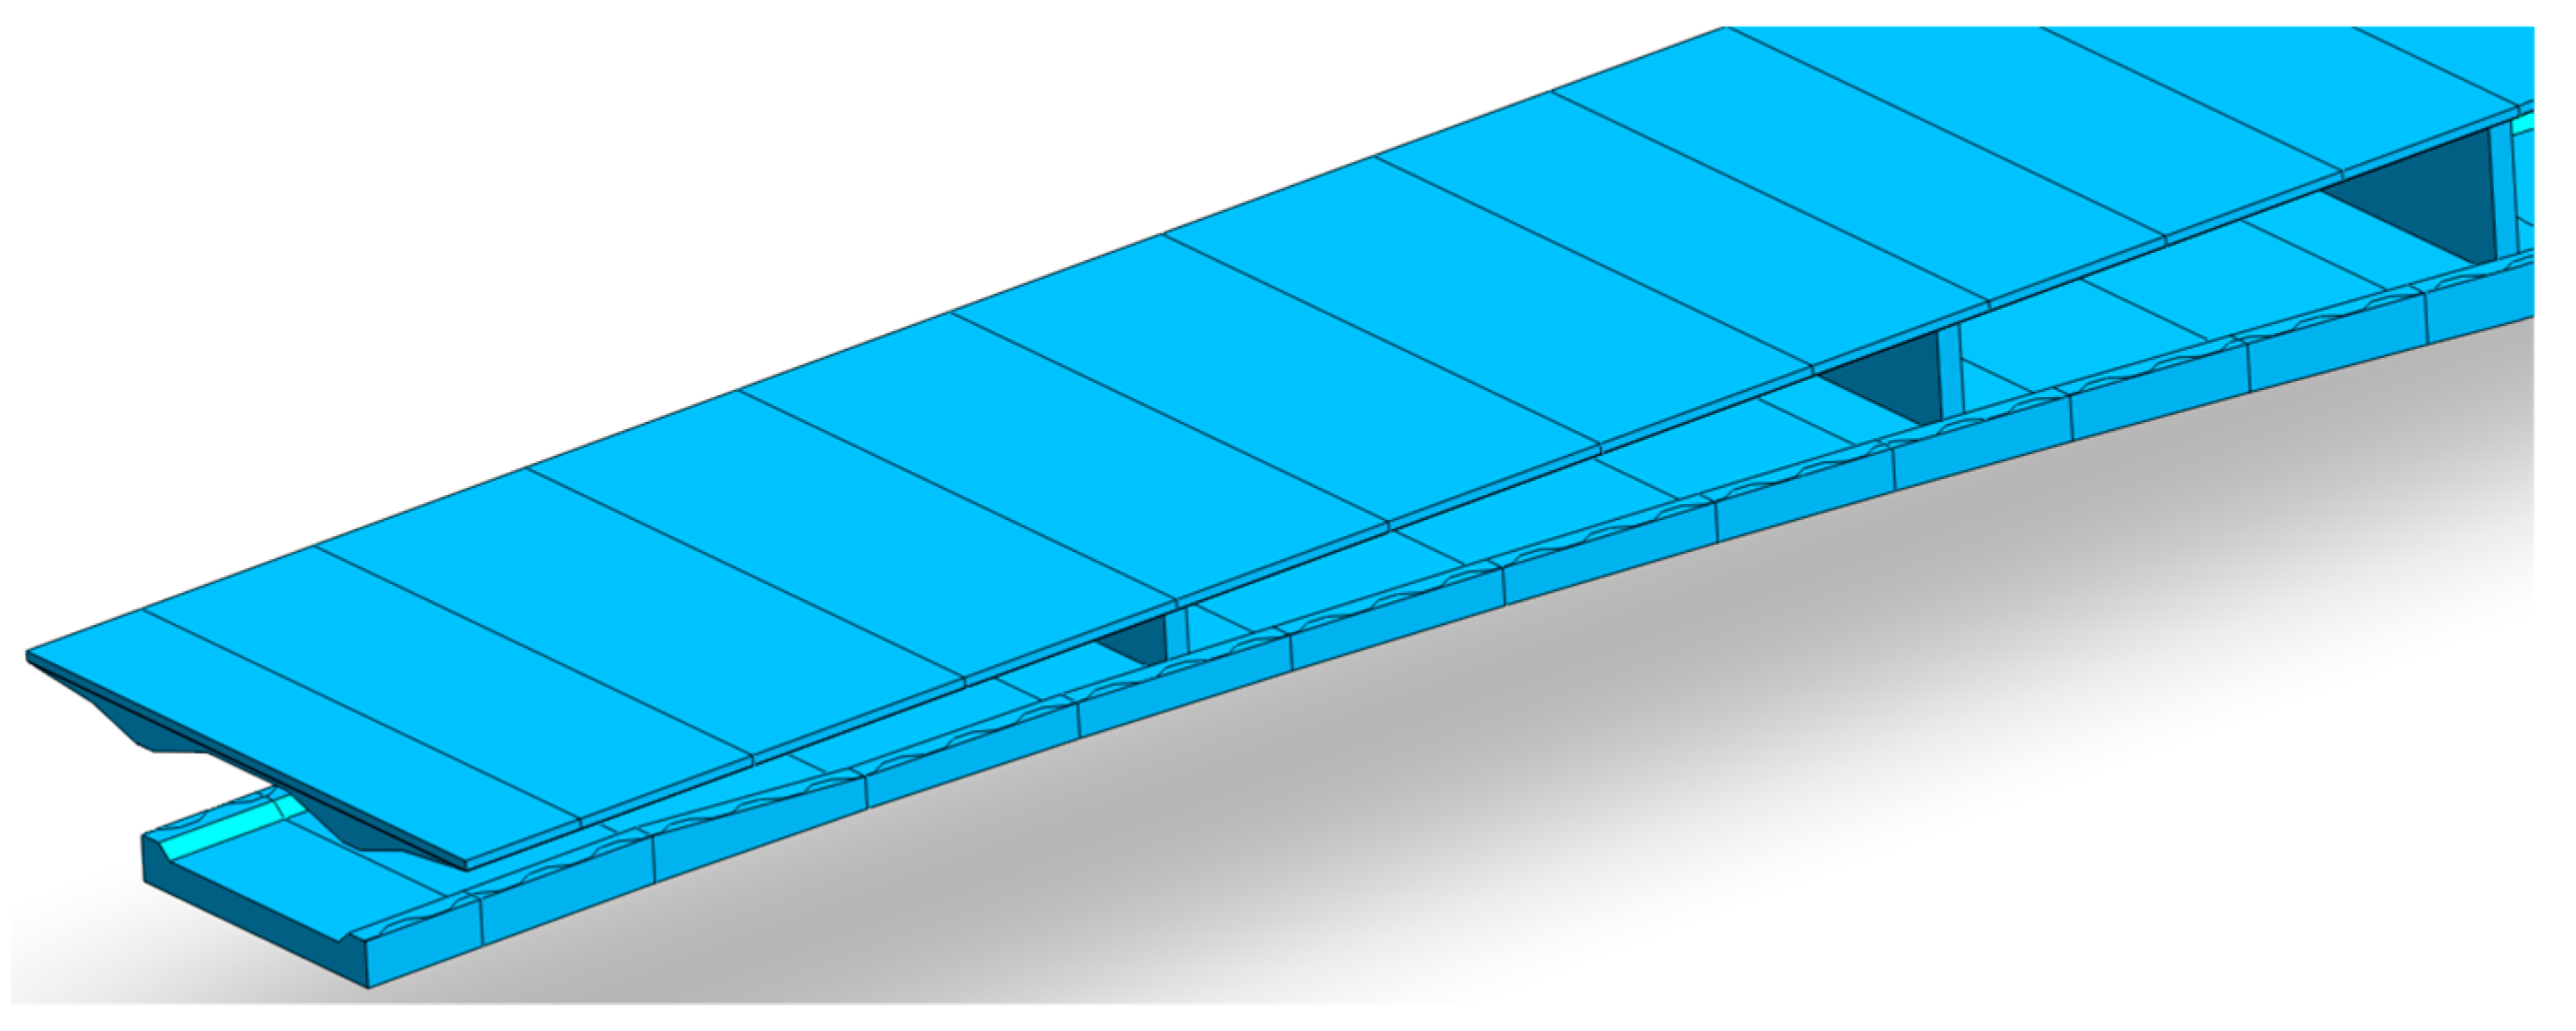
This study mainly studies the PC composite box girder bridge with corrugated steel webs with a span of 65 m + 120 m + 65 m. The upper structure of the bridge is shown in Figure 18.
There are five types of corrugated steel web thickness, which are 16 mm, 20 mm, 25 mm, 28 mm and 30 mm, respectively. The specific shape is shown in Figure 19.
According to the design drawings of Qiao Jia-fan 2# Bridge, the three-dimensional solid modeling of the main bridge of Qiao Jia-fan 2# Bridge is carried out by using MIDAS/FEA NX 2022 software, as shown in Figure 20. On the basis of ensuring the accuracy of the analysis, the necessary simplifications were made.
After fine meshing, the model contains 335,749 nodes and 303,422 units, as shown in Figure 21.
The modeling of each part is introduced in detail below.

4.1.1. Concrete Roof and Floor Model

The simulation of concrete roof and floor adopts the three-dimensional solid element and adopts automatic meshing technology in the process of meshing, as shown in Figure 22.

4.1.2. Simulation of Corrugated Steel Web Model

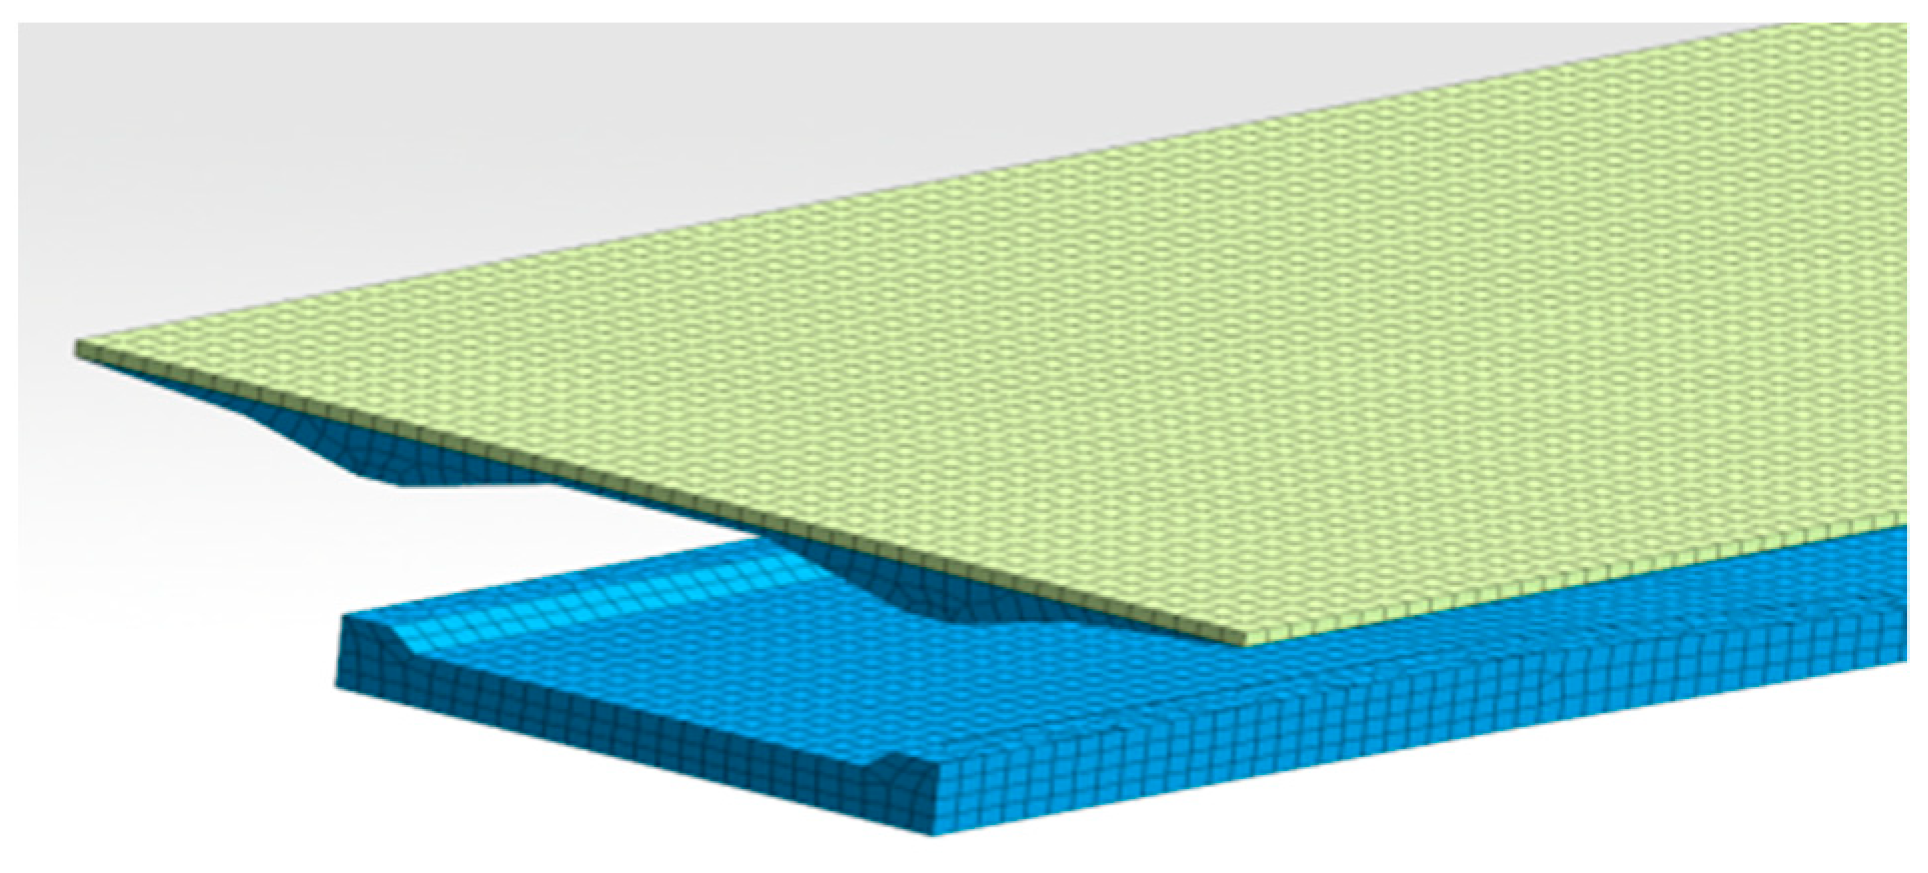
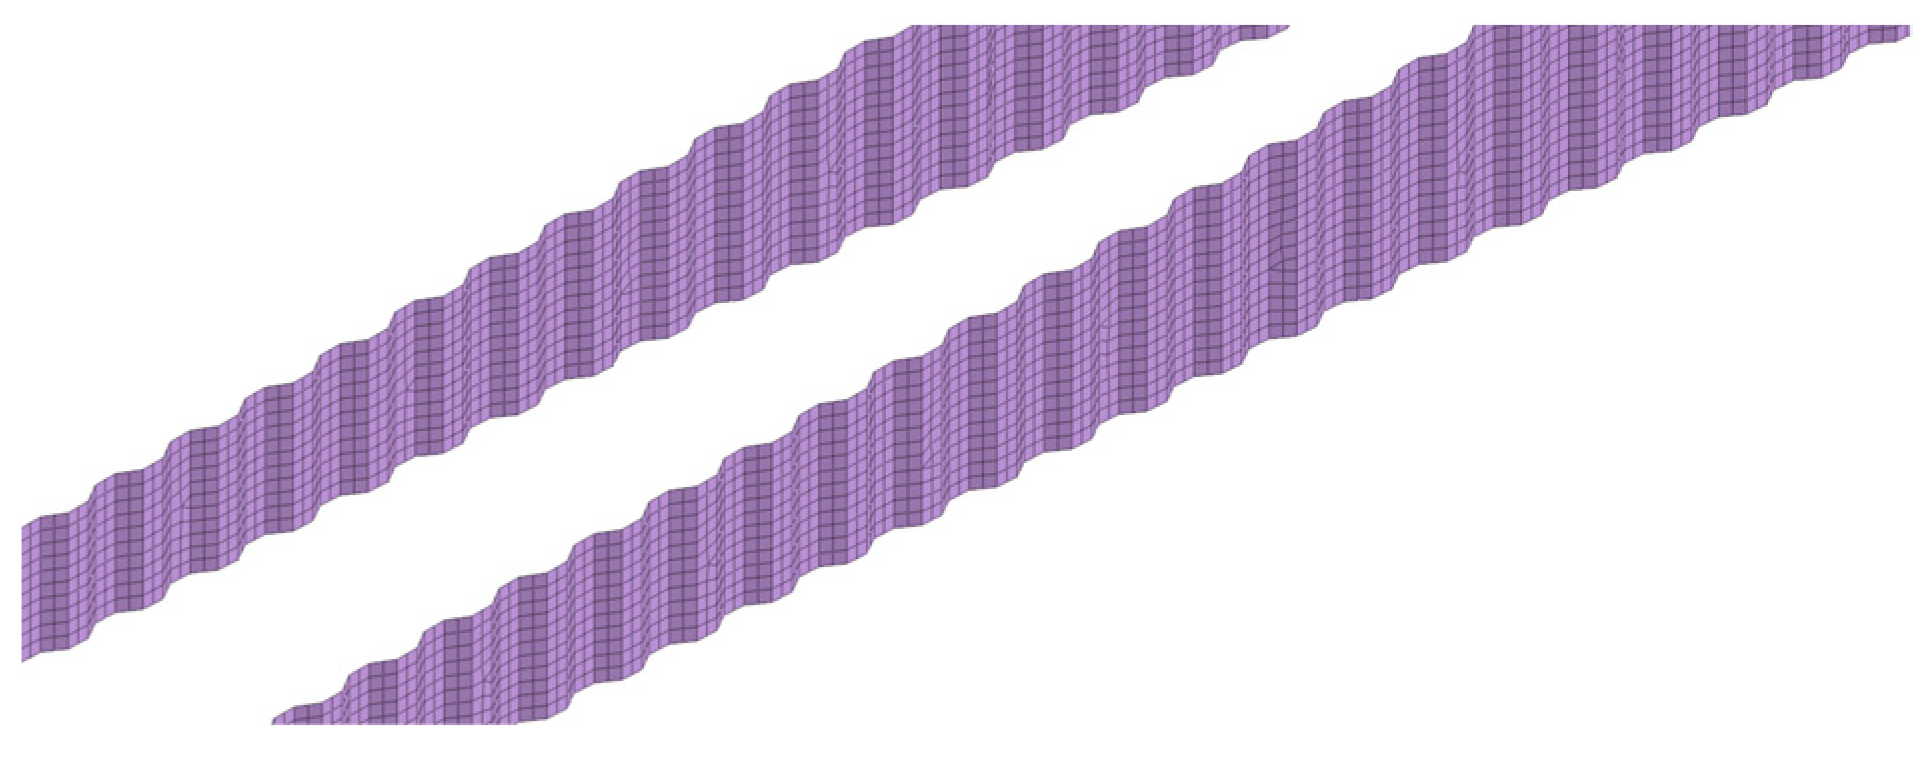
Because the thickness of the web varies from 14 mm to 30 mm, it is ideal to use the shell element to simulate the web structure, as shown in Figure 23.
By using the “engraving” function, that is, printing the waveform curve on the concrete roof and floor, as shown in Figure 24, the automatic coupling of the web and the roof and floor can be realized when the solid mesh is divided, thus forming an overall structure.

4.1.3. Simulation of Diaphragms

The model is composed of 12 diaphragms, which are connected to the top and bottom plates and corrugated steel webs. The diaphragm and the roof and floor use the same material, which are modeled by three-dimensional solid elements. When the MIDAS/FEA NX 2022 software is meshed, the nodes can be automatically shared to achieve automatic coupling. However, due to the different materials of the web and the diaphragm, the system cannot automatically connect them. Therefore, the diaphragm and the web in the model are only in contact with each other rather than automatically coupled. There is no mutually restrictive relationship between the two, which is consistent with the actual situation.

4.1.4. Simulation of Prestressed Steel Bundle

The external prestressing steel bundle is simulated by the truss element, as shown in Figure 25. By applying prestress on the truss element, the external beam tension process was successfully simulated, and good results were achieved.
The internal prestressing steel bundle adopts the implantable steel bar in MIDAS/FEA NX 2022, which is characterized by the method of adding the stiffness of the steel bar to the parent unit instead of using the element with nodes to simulate. As shown in Figure 26.

4.1.5. Material Property

C55 concrete (Anhui Conch Cement Co., Ltd., Anhui, China) is used in the concrete part of the box girder. Concrete is regarded as an isotropic homogeneous elastomer in the finite element method. The density of concrete is 2420 kg/m3, and the elastic modulus is 3.55 × 10⁴ MPa. Poisson’s ratio is 0.2, the standard compressive strength of C55 concrete is 55 MPa, and the standard tensile strength is 2.74 MPa.
The corrugated steel web is made of Q355 steel (Shanghai Zhongnan Special Steel Group Co., Ltd., Shanghai, China), the modulus of elasticity of the steel plate is 2.06 × 10⁵ MPa, Poisson’s ratio is 0.31, and the mass density of the steel plate is 7850 kg/m3.
The low relaxation and high strength steel strand is used as the internal prestressed steel bundle. The diameter of single strand steel strand is 15.20 mm, the area of steel strand is 140 mm2, the standard strength of strand is 1860 MPa, and the elastic modulus is 1.95 × 10⁵ MPa. The prestressed tensile strength of the concrete top and bottom of PC box girder bridge with corrugated steel webs adopts the standard strength of 75% steel strand, that is 1395 MPa. The external prestressed steel strand adopts unbonded low relaxation epoxy coated steel strand, and the tensile strength adopts 60% standard strength of steel strand, that is, 1116 MPa.

4.1.6. Boundary Condition

As is shown in Figure 27, No.6 bearing is a fixed bearing; No.2 bearing is a unidirectional movable bearing, which allows the beam to deform freely along the transverse bridge direction; No.5, No.7 and No.8 bearings are unidirectional movable bearings, allowing the beam to deform freely along the bridge direction; and No.1, No.3 and No.4 bearings are bidirectional movable bearings, allowing the beam to deform freely along the bridge direction and transverse bridge direction.

4.1.7. Load Action Value

  • Structural deadweight: automatically taken into account by the program;
  • Phase II pavement: 0.1 m thick asphalt concrete × 24 kN/m3 = 2.4 kN/m2; 0.08 m thick reinforced concrete × 26 kN/m3 = 2.08 kN/m2
  • Guardrails: 1.1 m × 26 kN/m3 = 28.6 kN/m2;
  • Internal tension control stress: 1395 MPa; external tension control stress: 1116 MPa;
  • Overall temperature rise: this study considers the overall temperature rise is considered to be 39 °C.
  • Temperature gradient: using the values in the General Specification for Design of Highway Bridge and Culverts (JTGD60-2015), consider the thickness of the paving layer is 10 cm asphalt concrete, in which the vertical sunshine positive temperature difference T1 = 14 °C, T2 = 5.5 °C.
  • Wind load: take the value of wind load in the most unfavorable wind direction (NNE) and at the most unfavorable wind angle of attack (3°).
  • Vehicle load: according to the fatigue load model I of “Specifications for Design of Highway Steel Bridge” (JTGD64-2015) [28], the moving load condition is added. The longitudinal reduction factor is 0.97, the structural fundamental frequency is 1.04 Hz, and the impact coefficient μ is 0.05.

4.1.8. Comparison of Detected and Simulated Values

The bridge is symmetrical as a whole and the comparison between the measured displacement value and the simulated finite element value of the upper structure of the main bridge is given. The influence of dead weight + prestress + overall temperature rise (average temperature) + temperature gradient + static wind load (average wind speed 0° angle of attack) is considered in the model simulation.
In this study, the vertical displacement values of different units of the bridge from the construction of the bridge to the closure of the actual measurement and the vertical displacement values obtained from the modeling are given, as shown in Figure 28.
The unit numbers are numbered from left to right on the bridge. In the above comparison, the average value of the ratio of the detection value to the simulated value is 1.101, and the variance is 0.055. The results show that the detection value is basically consistent with the simulated value. Considering the influence of bearing settlement, sunshine temperature difference and temporary load, the error is within the acceptable range. Therefore, it can be concluded that the model is consistent with the actual situation.

4.2. Fatigue Life Estimation

When the bridge structure is subjected to constantly changing loads (such as vehicle load, temperature load and wind load) during operation, the internal stress of the structure will be constantly changing. We call this constantly changing load the fatigue load of the bridge structure during operation, and the stress produced by the fatigue load in the structure is called fatigue stress. Under repeated fatigue loads, the maximum stress that the structure can bear is called fatigue strength of the structure, which can also be called fatigue limit.
In this section, MIDAS/FEA NX 2022 is used for theoretical analysis, and MIDAS/FEA NX 2022 has been verified many times in terms of calculation accuracy. At first, MIDAS/FEA NX 2022 is compared with the similar examples of related application software such as Ansys, and the conclusion is basically the same. Then, compared with a large number of experimental data and measured data in engineering practice, it is found that its accuracy is very high. It is worth explaining that MIDAS/FEA NX 2022 adopts a new solver and applies modern new calculation methods and theories, and the calculation results are more accurate than those of other software.

4.2.1. Lane Loading

According to the fatigue load model I of “Specifications for Design of highway Steel Bridge” (JTGD64-2015), the moving load condition is added. In this study, the most unfavorable layout of fatigue load is the position where the maximum bending moment occurs in the middle beam of the middle span. Uniform load is distributed in the middle span, and concentrated load is applied in the middle span. Positive load is considered in the lane division of this bridge, and positive load is loaded according to the lane position divided in the drawing.

4.2.2. Fatigue Simulation Analysis Principle of MIDAS/FEA

Fatigue failure is mainly brittle fracture of structural materials under the fatigue load cycle, which is caused by cumulative damage of materials. The commonly used fatigue analysis methods include the stress-life method and strain-life method. The stress-life method is used for fatigue analysis in MIDAS/FEA NX 2022.
In general, the fatigue calculation in MIDAS/FEA NX 2022 is based on different materials, the bridge materials are Q355 corrugated steel web and C55 concrete. Observe the life cycle of box girder, that is, the number of repeated loads when fatigue failure occurs under repeated fatigue loads, and calculate the fatigue life of all positions, and the minimum value in the data is the fatigue life of the whole structure.
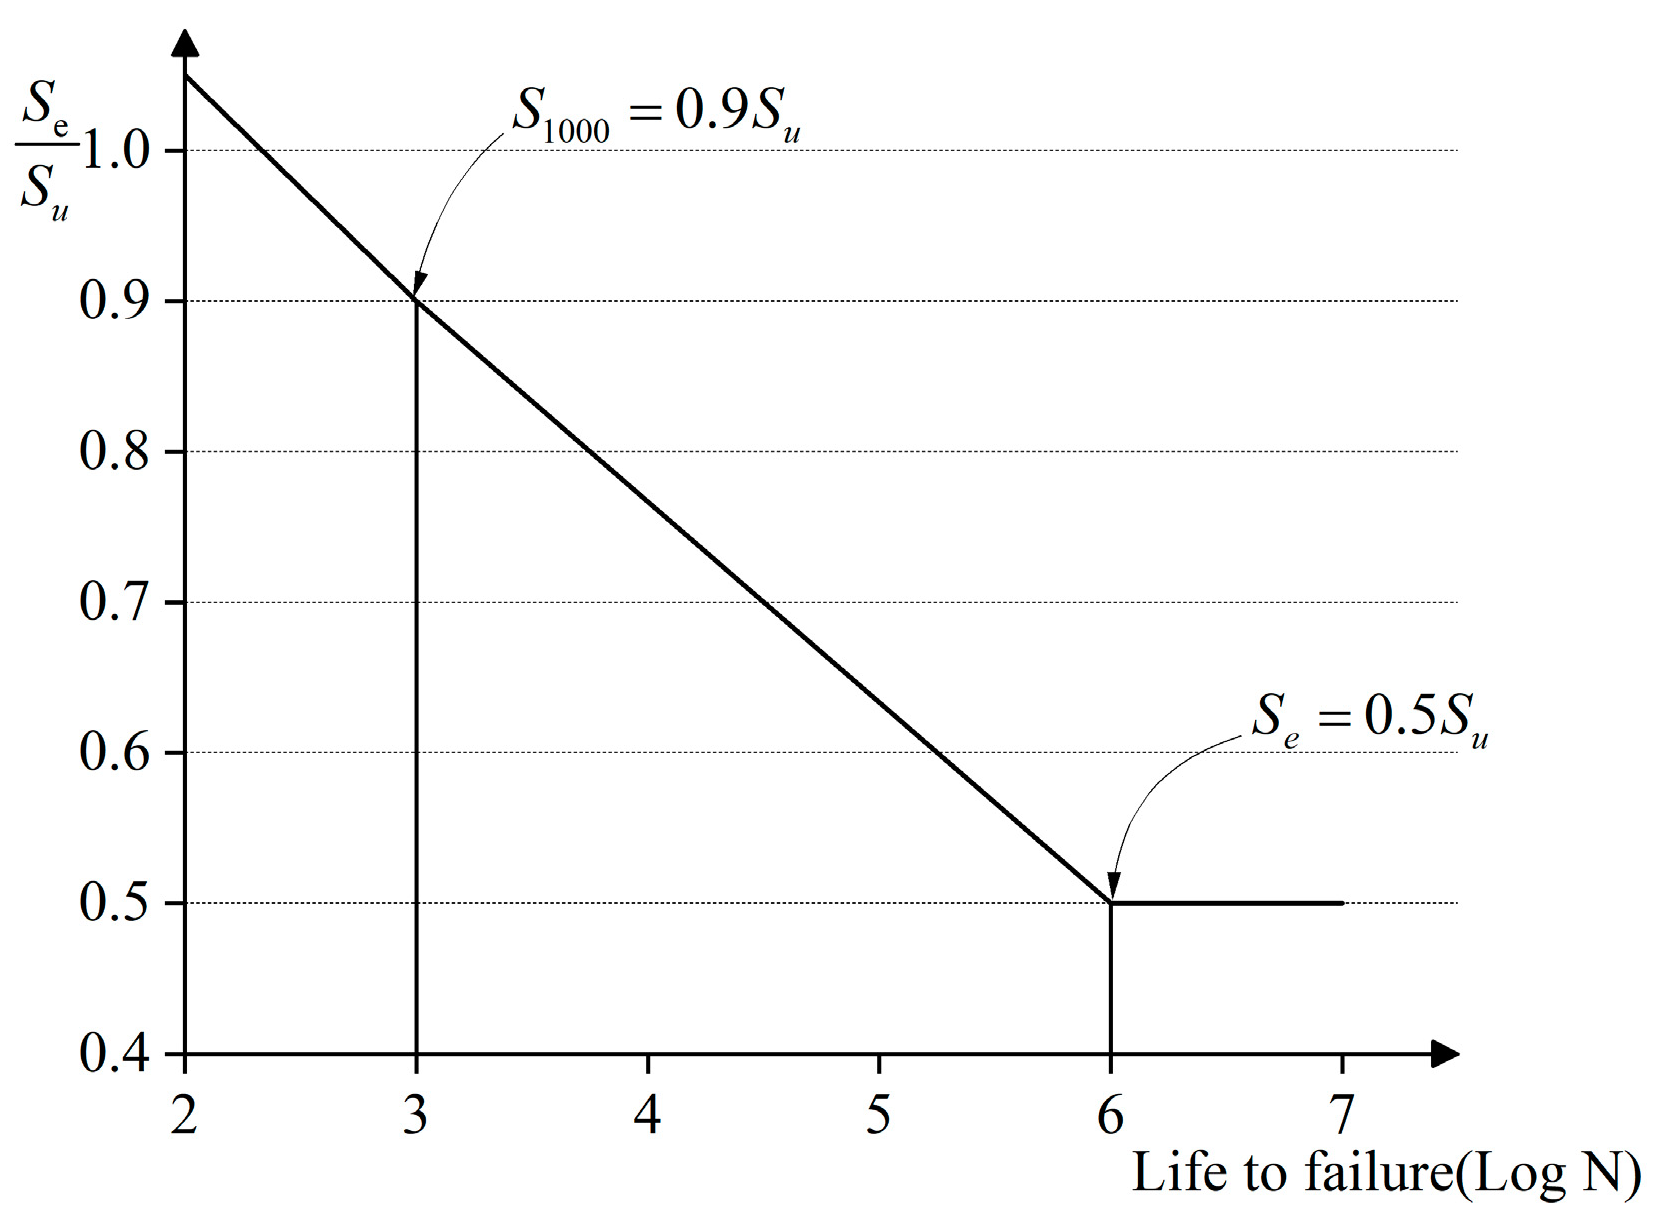
The S–N curve in MIDAS/FEA NX 2022 is the load amplitude with the same difference between the peak value and the valley value. The relationship between the stress ratio S under cyclic action and the number of loading cycles N when the model reaches failure. After inputting the material properties, an ideal S–N curve will be automatically generated inside the program [29]. The S–N curve is shown in Figure 29 below. The upper part is the point where 90% (Su) of the maximum stress amplitude is cycled 1000 times, and the lower part is the point where the fatigue limit stress amplitude (Se = 0.5Su) is cycled 1,000,000 times. The curve connects the two points.
The average stress in the material at the time of damage is much smaller than that at fracture damage, so the degree of fatigue damage to the structure at different stress levels should be considered in the fatigue performance analysis. The higher the average stress, the shorter the fatigue life. In order to analyze the effect of average stress on fatigue life, the software also provides two modified methods, Goodman and Gerber.
Goodman   modified   formula : σ a S e + σ m S u = 1 Gerber   modified   formula :   σ a S e + ( σ m S u ) 2 = 1
where σa—stress amplitude, σa = (σmaxσmin)/2; σm—mean stress, σm = (σmax + σmin)/2; Se—fatigue limit stress range; and Su—maximum stress amplitude.
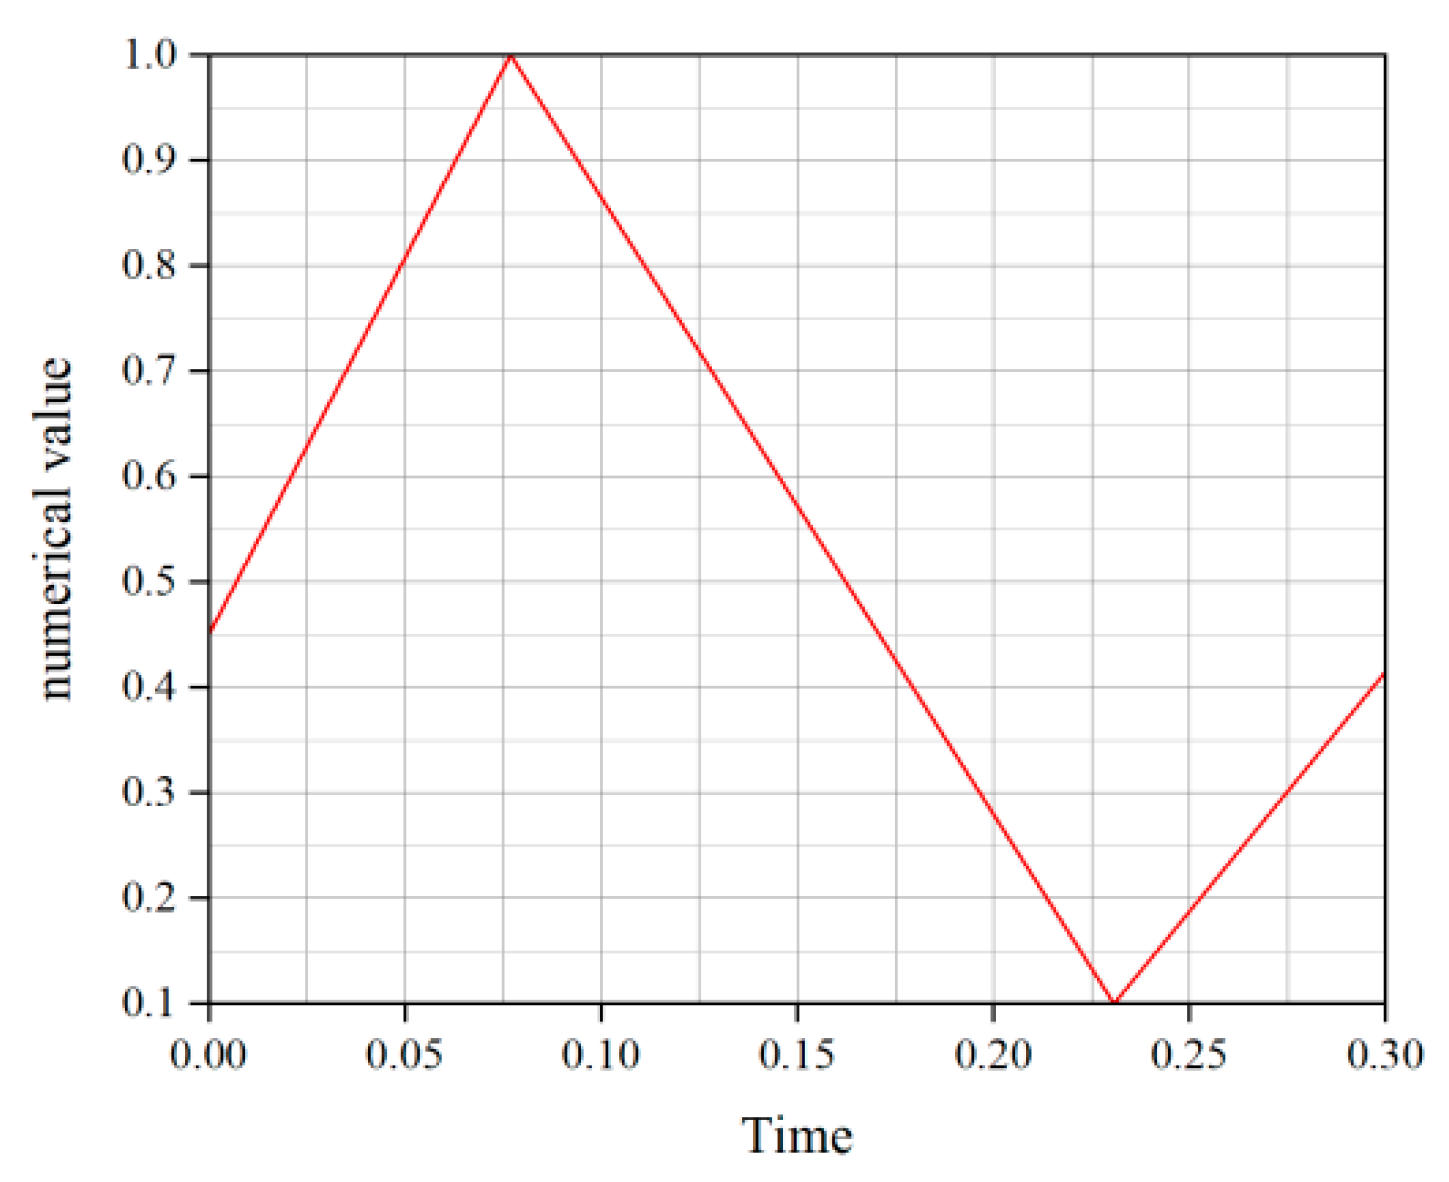
Load curve reference [29] selects a toothed waveform with a period of 0.3077 s, as shown in Figure 30 below.

4.2.3. Fatigue Calculation Analysis

When using MIDAS/FEA NX 2022to establish the finite element model, the main analysis steps are three parts: establishing three-dimensional model, linear static analysis and stress fatigue calculation analysis. Generally, the stress of the model in MIDAS/FEA NX 2022 refers to the Von Mises stress of the analytical model, which can be regarded as a combination of normal stress and shear stress and can also be used to describe the joint action of complex stress states. Usually, we call this stress Van Mises stress. When the material changes, the fourth strength theory, which is the shape change energy theory in material mechanics, is more in line with reality.
As shown in Figure 31, the maximum Von.Mises stress in the concrete section is 24.22 MPa. As shown in Figure 32, the maximum Von.Mises stress in the web portion of the corrugated steel is 135.74 MPa. The maximum stresses all occur near block 0#.
The fatigue calculation results in the post-processing of MIDAS/FEA NX 2022 finite element analysis mainly include None life, Goodman life and Gerber life. Table 6 and Table 7 are the fatigue calculation results of the maximum Von.Mises stress point of the concrete part and the corrugated steel web part, respectively.
From Table 6 and Table 7, it can be concluded that the fatigue life of the maximum Von.Mises stress position of concrete can be regarded as the fatigue life of the PC composite box girder bridge with corrugated steel webs is 705,882 times, and the damage degree is 1.41 × 10⁻⁴%.
The simulation results show that the fatigue life of concrete is much smaller than that of corrugated steel webs, and the maximum stress of corrugated steel webs is much smaller than its design strength, and fatigue failure will not occur. And the maximum stress received by each part is smaller than the allowable stress.

5. Conclusions

In this study, the main bridge of Qiao Jia-fan 2# bridge is taken as the research background. Through the mathematical statistics of the temperature and wind speed and wind direction data in the area, the representative value of day and night temperature difference and the basic wind speed of different wind directions are obtained. Based on the basic wind speed of the 100-year return period of the most unfavorable wind direction, a two-dimensional finite element model was established by FLUENT 2022 R1 software to obtain the wind load value of the most unfavorable wind attack angle. Finally, the finite element model of the whole bridge is established by MIDAS/FEA NX 2022 software. Under the combined action of temperature and static wind, on the basis of theoretical discussion, the fatigue life of PC composite box girder bridge with corrugated steel webs is estimated. Through the above analysis, the following conclusions are drawn:
  • The temperature difference of PC composite box girder bridge with corrugated steel webs obeys the Weibull distribution of W(15.287, 3.981). The temperature difference of PC composite box girder bridge with corrugated steel webs is 22.33 °C, the average temperature is 17.46 °C, and the extreme maximum temperature is 39 °C. The temperature difference of PC composite box girder bridge with corrugated steel webs obeys the Weibull distribution of W(15.287, 3.981), and the temperature difference of PC composite box girder bridge with corrugated steel webs obeys the Weibull distribution of W(15.287,3.981).
  • According to the measured data of wind speed and direction in the area, the statistical method of joint probability distribution of wind speed and direction is adopted, and the extreme value distribution of wind speed at the bridge site is closer to Gumbel distribution; secondly, the harmonic function of Gumbel distribution parameters is fitted to the curve, and the distribution parameters under any wind direction are obtained. Then, the basic wind speed (30.69 m/s) is designed according to the 100-year return period of the most unfavorable wind direction, and it is brought into FLUENT 2022 R1 software. Finally, the most unfavorable wind load direction is NNE, and the most unfavorable wind angle of attack is 3°.
  • The MIDAS/FEA NX 2022 finite element model was developed, and it was found that the maximum stresses in both the concrete and the corrugated steel web occurred near block 0#. Estimating the fatigue life of PC composite box girder bridge with corrugated steel webs under the combined effect of temperature and static wind, the fatigue life of the stress concentration location with larger stress amplitude was obtained to be 705,882 times, with a damage level of 1.41 × 10⁻⁴%. It can also be seen that the fatigue life of concrete is much smaller than that of the corrugated steel web.
  • In summary, fatigue life and the extent of damage when loaded within the allowable stress range need to be analyzed in detail to avoid sudden fatigue damage at locations of stress concentrations and locations subjected to continuous repetitive loading.

Author Contributions

Conceptualization, S.W. and J.J.; methodology, S.W.; software, S.W.; validation, S.W. and J.J.; formal analysis, S.W.; investigation, S.W. and J.J.; resources, J.J.; data curation, S.W. and J.J.; writing—original draft preparation, S.W. and J.J.; writing—review and editing, S.W. and J.J.; visualization, S.W.; supervision, J.J.; project administration, S.W. and J.J.; funding acquisition, J.J. All authors have read and agreed to the published version of the manuscript.

Funding

This research was funded by the National Natural Science Foundation of China (No. 51908108).

Institutional Review Board Statement

Not applicable.

Informed Consent Statement

Not applicable.

Data Availability Statement

The data presented in this study are available on request from the corresponding author. The data are not publicly available due to privacy.

Conflicts of Interest

The authors declare no conflicts of interest.

References

  1. Wang, L.; Liu, S.Z.; Li, Z.Q.; Huang, J.J.; Ding, W.P. Temperature effect of combined deck slab wave web steel box simply supported combination girder. Eng. Sci. Technol. 2022, 54, 133–140. (In Chinese) [Google Scholar]
  2. Liu, X.J. Fatigue Performance Analysis of Steel-Mixed Structures with Shear Bond under Different Fatigue Loads. Master’s Thesis, Changsha University of Science and Technology, Changsha, China, 2021. (In Chinese). [Google Scholar]
  3. Zheng, G. Study on Fatigue Reliability of Tension Cables of Large-Span Cable-Stayed Bridges under the Combined Effect of Random Traffic and Wind Loads. Master’s Thesis, Changsha University of Science and Technology, Changsha, China, 2019. (In Chinese). [Google Scholar]
  4. Ye, X.W.; Su, Y.H.; Han, J.P. A state-of-the-art review on fatigue life assessment of steel bridges. Math. Probl. Eng. 2014, 2014, 956473. [Google Scholar] [CrossRef]
  5. Caglayan, B.O.; Ozakgul, K.; Tezer, O. Fatigue life evaluation of a through-girder steel railway bridge. Eng. Fail. Anal. 2009, 16, 765–774. [Google Scholar] [CrossRef]
  6. HParodi-Figueroa, C.; D’Ayala, D.; Sebastian, W. Fatigue assessment of historic retrofitted through-truss riveted railway bridge. Eng. Struct. 2024, 307, 117812. [Google Scholar] [CrossRef]
  7. Jiang, H.B.; Chen, Y.H.; Liu, B.; Feng, W.X.; Zhou, C.X. Research on static characteristics of large span wave form steel web PC combined continuous box girder bridge. Guangdong Build. Mater. 2018, 34, 56–58. (In Chinese) [Google Scholar]
  8. Ibrahim, S.A.; El-Dakhakhni, W.W.; Elgaaly, M. Behavior of Bridge Girders with Corrugated Webs under Monotonic and Cyclic Loading. Eng. Struct. 2006, 28, 1941–1955. [Google Scholar] [CrossRef]
  9. Kövesdi, B.; Dunai, L. Fatigue Life of Girders with Trapezoidally Corrugated Webs: An Experimental Study. Int. J. Fatigue 2014, 64, 22–32. [Google Scholar] [CrossRef]
  10. Kövesdi, B.; Jáger, B.; Dunai, L. Bending and Shear Interaction Behavior of Girders with Trapezoidally Corrugated Web. J. Constr. Steel Res. 2016, 121, 383–397. [Google Scholar] [CrossRef]
  11. Xu, X.F.; Zhang, F.; Liu, J.Q. Temperature distribution of corrugated steel web box girder. J. Chongqing Jiaotong Univ. (Nat. Sci. Ed.) 2018, 37, 1–10. (In Chinese) [Google Scholar]
  12. Yao, C. Research on Temperature Effect of PC Composite Box Girder with Corrugated Steel Web under Extreme Temperature. Master’s Thesis, Shandong University, Jinan, China, 2017. (In Chinese). [Google Scholar]
  13. Ning, Z. Study on Temperature Gradient Mode and Its Effect on Corrugated Steel Web Combined Box Girder Bridge. Master’s Thesis, Changsha University of Science and Technology, Changsha, China, 2021. (In Chinese). [Google Scholar]
  14. Wang, H.; Xu, Z.D.; Tao, T.Y.; Yao, C.Y.; Li, A.Q. Analysis of joint distribution of wind speed and direction at Sutong Bridge based on measured data from 2008–2015. J. Southeast Univ. (Nat. Sci. Ed.) 2016, 46, 836–841. (In Chinese) [Google Scholar]
  15. Li, W.R.; Zhang, G.L.; Li, L.; Du, Y.F. Analysis of joint probability distribution of wind speed and direction in wind farms in Northwest China based on long-term measured data. J. Lanzhou Univ. Technol. 2022, 48, 115–124. (In Chinese) [Google Scholar]
  16. Lucas, J.M.; Virlogeux, M.; Louis, C. Temperature in the box girder of the normandy bridge. Struct. Eng. Int. 2005, 15, 156–165. [Google Scholar] [CrossRef]
  17. JTGD60-2015; General Code for Design of highway Bridges and Culverts. Ministry of Transport of the People’s Republic of China: Beijing, China, 2015.
  18. Dargahi-Noubary, G.R. New method for prediction of extreme wind speeds. J. Eng. Mech. 1989, 115, 859–866. [Google Scholar] [CrossRef]
  19. Chen, X.; Zhao, X.D. Study on joint distribution function of wind speed and Wind direction under population sample. In Proceedings of the 13th National Structural Wind Engineering Conference, Dalian, China, 1 October 2007. [Google Scholar]
  20. Zhang, C.T.; Li, Z.L.; Fan, W.L.; Wang, Z.S. Study on wind vibration fatigue of transmission tower line system considering the joint distribution of wind direction and wind speed. Eng. Mech. 2013, 30, 315–322. (In Chinese) [Google Scholar]
  21. Zhang, Y.J. Fatigue Reliability Analysis of Large-Span Cable-Stayed Bridges Considering the Combined Effect of Wind and Traffic Vehicles. Master’s Thesis, Beijing Jiaotong University, Beijing, China, 2021. (In Chinese). [Google Scholar]
  22. Wang, Q.H.; Zhang, L.L. Statistical analysis of basic wind speed in Foshan area considering the influence of wind direction. Guangdong Civ. Eng. Constr. 2011, 18, 22–24. (In Chinese) [Google Scholar]
  23. National Standard GB/T 35227-2017; Specification for Surface Meteorological Observation. Standardization Administration of China: Beijing, China, 2017.
  24. Yao, L.L.; Liu, Q. Wind load analysis of girder bridge based on joint distribution theory of wind speed and direction. Sichuan Build. Mater. 2022, 48, 161–163. [Google Scholar]
  25. Simiu, E.; Scanlon, R.H. Wind Effects on Structures—An Introduction to Wind Engineering, 3rd ed.; The Macmillan Company: New York, NY, USA, 1996. [Google Scholar]
  26. Chen, A.; He, X.; Xiang, H. Identification of 18 flutter derivatives of bridge decks. J. Wind Eng. Ind. Aerodyn. 2002, 90, 2007–2022. [Google Scholar] [CrossRef]
  27. Liu, Y.; Chen, Z.Q.; Zhang, Z.T. CFD numerical simulation of static wind force co-efficient of box girder section. Vib. Shock 2010, 29, 133–137+242. [Google Scholar]
  28. JTGD64-2015; Code for Design of Highway Steel Bridges. Ministry of Transport of the People’s Republic of China: Beijing, China, 2015.
  29. Zhou, J. Fatigue Test and Research on Improved Embedded Shear Key of PC Composite Box Girder with Corrugated Steel Web. Master’s Thesis, Chongqing Jiaotong University, Chongqing, China, 2015. (In Chinese). [Google Scholar]
Figure 1. Temperature difference statistics.
Applsci 14 03165 g001
Figure 2. P–P diagram.
Applsci 14 03165 g002
Figure 3. Diurnal temperature difference histogram.
Applsci 14 03165 g003
Figure 4. Rose diagram of wind direction.
Applsci 14 03165 g004
Figure 5. Scale Parameter.
Applsci 14 03165 g005
Figure 6. Position Parameter.
Applsci 14 03165 g006
Figure 7. Wind Frequency.
Applsci 14 03165 g007
Figure 8. Static three-component force acting on the main beam.
Applsci 14 03165 g008
Figure 9. Calculation domain arrangement of main beam section.
Applsci 14 03165 g009
Figure 10. Schematic diagram of structural meshing of the computed cross-section.
Applsci 14 03165 g010
Figure 11. Mid-span section of main beam.
Applsci 14 03165 g011
Figure 12. Mid-span section of main girder.
Applsci 14 03165 g012
Figure 13. Pier top section of main girder.
Applsci 14 03165 g013
Figure 14. Drag coefficient of different beam height under different wind attack angle.
Applsci 14 03165 g014
Figure 15. Lift coefficient of different beam height under different wind attack angle.
Applsci 14 03165 g015
Figure 16. Lift moment coefficient of different beam heights under different wind attack angles.
Applsci 14 03165 g016
Figure 17. Wind angle of attack-relative three-component force coefficient diagram.
Applsci 14 03165 g017
Figure 18. Bridge superstructure diagram.
Applsci 14 03165 g018
Figure 19. Corrugated steel webs (unit: mm).
Applsci 14 03165 g019
Figure 20. Finite element model entity.
Applsci 14 03165 g020
Figure 21. Finite element model grid.
Applsci 14 03165 g021
Figure 22. Roof and floor grid division diagram.
Applsci 14 03165 g022
Figure 23. Grid division diagram of corrugated steel webs.
Applsci 14 03165 g023
Figure 24. The top and bottom plates and webs are coupled by “engraving”.
Applsci 14 03165 g024
Figure 25. Externally prestressed steel bundle.
Applsci 14 03165 g025
Figure 26. Internal prestressed steel bundle.
Applsci 14 03165 g026
Figure 27. Support arrangement.
Applsci 14 03165 g027
Figure 28. Comparison of measured and simulated values.
Applsci 14 03165 g028
Figure 29. Concrete S–N curve.
Applsci 14 03165 g029
Figure 30. Schematic diagram of loading curve of finite element simulation.
Applsci 14 03165 g030
Figure 31. Von.Mises stress diagram for concrete section.
Applsci 14 03165 g031
Figure 32. Von.Mises stress diagram for steel web section.
Applsci 14 03165 g032
Table 1. Fitting parameters of wind speed probability density curve under discrete wind direction.
Wind DirectionWind FrequencyGumbel DistributionFrechet DistributionWeibull Distribution
ABrACrACr
N2.00%0.9295.8420.8565.8756.1310.8866.5515.2550.716
NNE8.00%2.9826.8930.7867.0452.2430.7869.1632.5540.738
NE4.75%1.1014.8950.8494.9684.1520.8345.3495.8460.844
ENE4.25%1.1295.2240.9205.3234.5280.9385.8504.7390.859
E2.00%1.1585.5000.8465.8664.2110.7976.3044.3310.859
ESE5.00%0.9663.6790.8083.7423.5990.8694.2683.8770.718
SE11.00%2.6674.4750.6364.3791.7970.7156.8911.9830.634
SSE14.75%0.5853.2840.7933.2405.8510.8513.7286.5830.725
S12.25%1.3803.3160.8403.4932.2920.9284.4922.4460.744
SSW10.75%3.0145.2850.7475.3021.5480.7037.5552.1440.749
SW12.25%2.8275.3790.7115.3141.8810.7177.6102.3060.713
WSW4.50%1.2125.9420.7406.0354.7710.7266.3087.2860.742
W2.25%1.2535.8210.7625.9564.6730.7396.3925.5620.861
WNW1.75%1.1584.8880.8964.8814.0390.8515.7065.0190.946
NW2.00%0.6943.3980.9323.3454.9590.9243.8785.8890.937
NNW2.50%0.3433.0210.8823.0537.7740.8773.5916.2970.818
12.3985.0140.9805.1991.9620.9346.7962.4220.948
Table 2. Basic wind speed in different return periods.
Wind Directionf(θ)Gumbel Distribution
10 Years (m/s)50 Years (m/s)100 Years (m/s)
N2.00%9.82 11.32 11.97
NNE8.00%23.82 28.62 30.69
NE4.75%10.58 12.35 13.12
ENE4.25%10.90 12.72 13.50
E2.00%10.46 12.33 13.13
ESE5.00%8.71 10.26 10.93
SE11.00%20.46 24.76 26.60
SSE14.75%6.96 7.91 8.31
S12.25%11.73 13.95 14.91
SSW10.75%23.30 28.15 30.24
SW12.25%22.62 27.17 29.13
WSW4.50%12.12 14.07 14.92
W2.25%11.31 13.33 14.20
WNW1.75%9.73 11.60 12.40
NW2.00%6.37 7.49 7.97
NNW2.50%4.57 5.12 5.36
124.68 28.54 30.21
Table 3. The Gumbel distribution parameters of harmonic function fitting.
Fifth-Order Fitting ParametersA(θ)B(θ)f(θ)
c1.4624.8030.062
d1−0.409−0.377−0.047
e10.029−3.468−0.193
d20.5761.1160.032
e21.2078.2020.255
d30.2550.6110.011
e30.2830.715−4.585
d40.6860.503−0.015
e4−4.2250.9520.034
d50.2960.4960.009
e50.0120.4501.014
d6−0.458−0.476−0.006
e611.5205.0550.336
d7−0.3580.145−0.011
e70.088−7.861−0.691
Table 4. Comparison of three-component force coefficients between numerical simulation and test.
Three-Component Force CoefficientExperimental ResultCFD Simulated ResultError
CH0.3708680.3844443.66%
CV0.5583850.49153811.9%
CM−0.129795−0.1357944.62%
Table 5. Three-component forces of different sections at 3° wind angle of attack.
Beam HeightDrag Force (N)Lift Force (N)Lift Moment (N·mm)
3.500 m20375496−14,789
3.573 m21115335−14,178
3.721 m22514854−13,303
3.923 m24594181−12,188
4.170 m26623786−11,330
4.460 m28853431−10,587
4.725 m30953219−9947
5.017 m33143078−9306
5.332 m35642984−8559
5.668 m37802927−7806
6.026 m40562905−6868
6.326 m43132913−6032
6.638 m45662915−5069
6.963 m48522931−3968
7.300 m51412950−2730
Table 6. Fatigue calculation results of concrete parts.
Mean Stress CorrectionCycle IndexDamage
None1060
Goodman705,882.311.41 × 10−6
Gerber1060
Table 7. Fatigue calculation results of corrugated steel web section.
Mean Stress CorrectionCycle IndexDamage
None1060
Goodman1060
Gerber1060
Disclaimer/Publisher’s Note: The statements, opinions and data contained in all publications are solely those of the individual author(s) and contributor(s) and not of MDPI and/or the editor(s). MDPI and/or the editor(s) disclaim responsibility for any injury to people or property resulting from any ideas, methods, instructions or products referred to in the content.