Abstract
Under the background of climate warming in the Qinghai-Tibetan Plateau (QTP), frequent freeze–thaw cycling (FTC) brings about great geological disasters such as subgrade failure, landslides, and mudslides, which is closely related to the strength reduction caused by the structural damage of soils. In this study, to explore the association between macro shear strength and microstructure evolution of soils subjected to FTC, the red clay distributed widely in the QTP was chosen and used to conduct a series of triaxial shear and nuclear magnetic resonance (NMR) tests in the range of 1 to 7 FTCs. Triaxial shear test results reveal that the shear strength reduction of specimens mainly occurs within five FTCs, and the trend of peak deviator stress with increasing FTCs can be described in three stages: rapid descent (FTCs less than three), slow descent (FTCs between three and five), and stabilization (FTCs greater than five). NMR tests show that the T2 spectrum curves exhibit a distinct bimodal distribution characteristic, corresponding to macropores and micropores. Part of the micropores gradually develop into macropores with increasing FTCs, especially within five FTCs. The increase in macropores proportion leads to a loose soil structure, which is consistent with the deterioration of the shear strength of specimens. Finally, based on the experimental results and classical Mohr–Coulomb theory, a new shear strength model with structural damage for red clay has been proposed by introducing a damage factor expressed by T2 spectral area.
1. Introduction
Red clay is a brownish-red or yellowish-brown clayey soil formed by the weathering of carbonate rocks in a humid climate and is widely distributed in the Qinghai-Tibet Plateau (QTP) [1]. The physical properties of red clay are less favorable compared with general clays, characterized by a high natural moisture content, large void ratio, high liquid-plastic limit, and strong water sensitivity. However, its mechanical properties are relatively good, such as high shear strength, low compressibility, and permeability. Therefore, it is chosen as a superior natural engineering material, extensively employed in subgrade and foundation engineering practices [2,3,4]. In recent years, the climate in the QTP has become increasingly warmer and wetter [5,6]. The area, thickness, and distribution of permafrost have changed significantly under the influence of climate variation. Engineering disasters such as subgrade settlement and slope landslides occur frequently due to the degradation of frozen soil [7]. Seasonal freeze–thaw cycling (FTC) often happens in cold areas due to the atmospheric periodic temperature fluctuations during winter and spring [8], which causes the deterioration of soil mechanical properties [9] and brings potential risks for engineering construction and ecological environment protection in cold areas. Consequently, the variation of the shear strength of red clay in the QTP has attracted widespread attention, which can provide a better insight into engineering practices involving red clay in cold regions.
Nowadays, the studies on the soil engineering properties after FTCs are mostly concerned with the change in the soil mechanical properties [10,11,12,13], soil permeability and hydraulic properties [14,15,16,17], dynamic properties and strength evolution of soil after FTCs [18,19], and the freeze–thaw resistance characteristics of modified soil [20,21,22]. Previous studies have informed that the FTCs reduce the shear strength of soil [23]. However, the influence mechanisms of FTCs on soil strength failed to be completely unified due to different test materials and conditions [24]. Furthermore, there are few studies concerning the shear strength of red clay after FTCs. Understanding the variation of the shear strength of red clay is very important for the ecological and environmental protection of the QTP.
In essence, the FTC affects the strength properties by changing the structure of the soil, and the changes in the strength of the soil can be explained by quantitative changes in the microstructure. Therefore, numerous scholars endeavor to explain the effect of FTCs on soil strength from the microstructure level. Zhang et al. [25] conducted mercury intrusion porosimetry (MIP) and scanning electron microscope (SEM) tests on silty clay. They found that repeated FTC processes altered the distribution of pores inside specimens, with the increase in penetration pores and cracks, resulting in a decline in the strength of specimens. However, both MIP and SEM tests have a size effect, and the test specimens need to be freeze-dried, which leads to the distortion of pore data to a certain extent. Moreover, the utilization of computer tomography (CT) technology in geotechnical research is increasingly mature. The structural damage of soil induced by FTCs was analyzed quantitatively using CT scanning technology [26,27,28]. Xu et al. [29] attempted to uncover the change mechanism of the silty clay strength in the QTP under the influence of FTCs through SEM and CT tests. The findings revealed that when the number of FTCs increased, the structure of silty clay became loose, causing the bond between soil particles to weaken. After five FTCs, the porosity of silty clay and the content of large aperture pores increased significantly. However, CT detection is expensive, and the post-processing of image results is complex. Nuclear magnetic resonance (NMR) can carry out nondestructive detection of the pore distribution of objects. The accuracy of its results has been verified in many tests [30,31,32], providing a new idea for revealing the change mechanisms of the soil strength after FTCs from the micro level. Li et al. [33] performed SEM and NMR tests on expansive soil in seasonally frozen areas. The results revealed that, during the FTCs, the porosity of expansive soil decreased, with micropores remaining largely unchanged. Mesopore content increased while macropore content decreased. Ye et al. [34] performed NMR tests on loess-paleosol after FTCs. The test results revealed that an increase in FTCs led to a rise in the signal amplitude of the T2 spectrum curve of paleosol. Mesopore content decreased and that of macropores and maximum pores increased. Currently, scholars have achieved significant advances in the research of red clay’s strength and permeability alterations subjected to FTCs [35,36]. However, there has been little exploration of the micro mechanism of red clay strength degradation.
The shear strength criterion is an important theory to describe the shear strength of soils. Shear strength criteria were proposed to describe the soil strength under different FTC conditions. Ye et al. [37] proposed a strength model of loess based on the variation in cohesion with the number of FTCs and water content. The strength degradation of loess after FTCs was well predicted. Wang et al. [38] proposed a new shear strength criterion based on the Mohr–Coulomb strength model, considering the influence of the number of FTCs on the cohesion and the internal friction angle of clay. Actually, FTC leads to strength degradation by changing the structure of the soil. However, the change in structure was not considered in the above shear strength criteria. Therefore, it is urgent to propose a shear strength criterion to consider the FTC effect on soil microstructure.
In this research, to clarify the impact of FTCs on the shear strength and microstructure of red clay, triaxial shear and NMR tests were performed. According to the multiscale analysis of shear strength and NMR tests, an extended Mohr–Coulomb strength model was proposed. The model can reflect the macroscopic strength deterioration through the soil structural damage by the FTC effect. Valuable references about engineering design involving red clay and ecological conservation in the QTP can be provided through research findings.
2. Materials and Methods
2.1. Study Site
The location of the study site is Nangqian County, Yushu Prefecture, Qinghai Province, in the east of the QTP (as shown in Figure 1). The climate of Nangqian County, situated at an altitude of 3500–4500 m, is a typical continental monsoon climate governed by the cold high pressure in Qinghai Tibet and influenced by the southeast warm air flow invading from the Tongtian River. The climate undergoes drastic changes, with no clear distinction between the four seasons, primarily divided into cold and warm seasons.
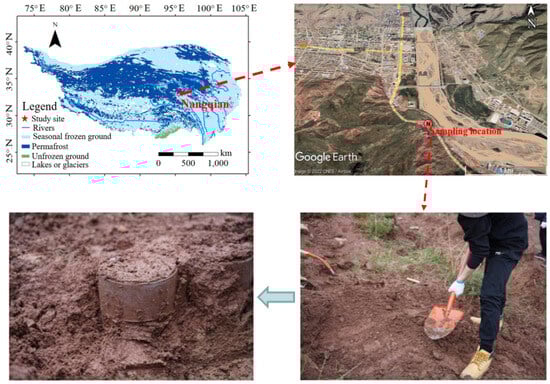
Figure 1.
Location of the study site.
2.2. Materials
The red clay collected from a slope near Nangqian County was used as the material in this study. The red clay was air-dried and pulverized, then sieved through a 2 mm sieve. Table 1 displays the basic physical properties of red clay. Figure 2 illustrates the particle composition of red clay. The liquid limit and plastic limit of the soil are 45.5% and 23.9%, respectively. The soil is classified as “CL” (clay of low plasticity) according to the Unified Soil Classification System.

Table 1.
The basic physical properties of red clay.
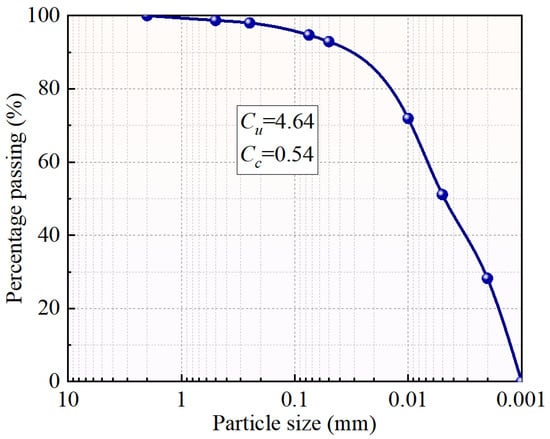
Figure 2.
Particle-size distribution of red clay.
2.3. Specimens Preparation
Distilled water was blended with soil particles to get a moisture content of 24%. Mixed soil was wrapped in plastic wrap and placed in a moisture box for 24 h to guarantee the even moisture distribution. Then, compacted specimens were prepared by static compaction in a mold in five layers. Following the compaction of each layer, the surface was scraped to ensure the uniform compaction of specimens. The cylindrical specimens measured 50 mm in diameter and 100 mm in height.
2.4. Testing Procedure
First, the specimens prepared according to the specimen preparation method in Section 2.3 were saturated by vacuum. Then, red clay was subjected to FTC. Finally, triaxial strength tests were executed to acquire the shear strength, and NMR tests were executed to acquire the structure information of red clay. The test procedure can be seen in Figure 3.
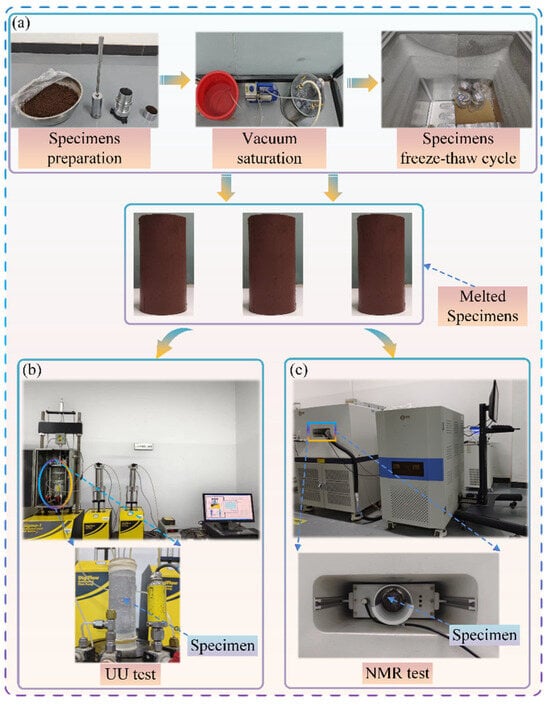
Figure 3.
Test flowsheet: (a) freeze–thaw cycling; (b) triaxial shear strength test; (c) NMR test.
2.4.1. Freeze–Thaw Cycling Tests
The FTC test process is shown in Figure 3a. A low-temperature test chamber with a range of −20 to 25 °C was used for FTC tests. The annual extreme temperature fluctuations that have occurred in the Nangqian area over the past 40 years were collected by consulting the National Meteorological Science Data Center, as shown in Figure 4. The minimum extreme low temperature of the year was taken as the freezing ambient temperature in this test, which is about −17 °C. The maximum extreme high temperature of the year was taken as the melting ambient temperature, which is about 20 °C. The timeframe for freezing and thawing was designated as 12 h to ensure that the specimens were completely frozen and fully melted, and this process was defined as a complete FTC. The number of FTCs was set to 0, 1, 2, 3, 4, 5, 6, and 7. The necessary specimens were removed for subsequent tests after reaching the designed number of FTCs. The rest of the specimens continued to undergo FTC tests.
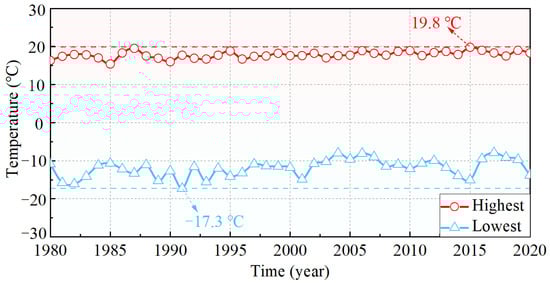
Figure 4.
Annual temperature extremes in the Nangqian region in the past 40 years. (“https://data.cma.cn/ (accessed on 9 January 2023)”).
2.4.2. Triaxial Shear Tests
BS01015 full-automatic stress path triaxial apparatus manufactured by American GEOTAC company (Houston, TX, USA) was selected as the triaxial shear test instrument, as shown in Figure 3b. The amounts of 50 kPa, 100 kPa, 200 kPa, and 400 kPa were the confining pressures during the triaxial shear tests. To reduce the disturbance of the consolidation and drainage process to the soil structure after FTCs, unconsolidated and undrained (UU) triaxial shear tests were conducted. The axial loading rate was set at 0.4 mm/min, and the end strain was controlled at 20%.
2.4.3. Nuclear Magnetic Resonance Tests
Assuming that water in the soil meets the condition of “rapid diffusion state” [39,40], the equation below can be given as
where SV−1 is the ratio of the surface area and volume of the pore water; ρ2 is the surface relaxivity, which is a characteristic of soil and is strongly affected by paramagnetic ions on the surface of soil particles [41,42].
The NMR test instrument was a MesoMR14-060H-1 low-field nuclear magnetic resonance instrument manufactured by Jiangsu NIUMAG company (Suzhou, China), as shown in Figure 3c. Carr–Purcell–Meiboom–Gill (CPMG) pulse sequence was used in the test. Table 2 displays the parameters. Specimens were tested after FTCs for 0, 1, 3, 5, and 7. The same specimen was used for the test to avoid the error caused by the difference in the specimen itself. In addition, the specimen was vacuumized and saturated before each NMR test to ensure the accuracy of pore information.
Table 2.
The parameters of CPMG pulse sequence.
3. Results
3.1. Triaxial Shear Test Results
Figure 5 shows the results of the tested stress–strain relationship. The deviator stress increases with the development of the axial strain. The deviator stress also increases with the increase in the confining pressures. In addition, the deviator stress decreases as the number of FTCs increases. In particular, the slope of the stress–strain curves decreases significantly following the initial FTCs. However, the change in stress–strain curves is not significant after five FTCs. Besides this, the FTC has no apparent impact on the type and characteristics of the red clay stress–strain curves, and the deviator stresses usually increase as the axial strain increases until they tend to be stable in the later stage, exhibiting a strong strain-hardening type.
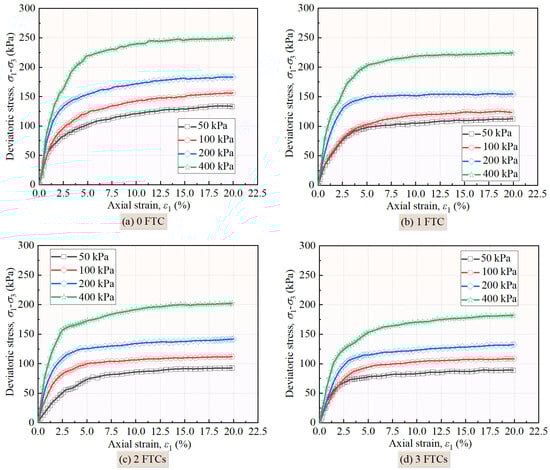
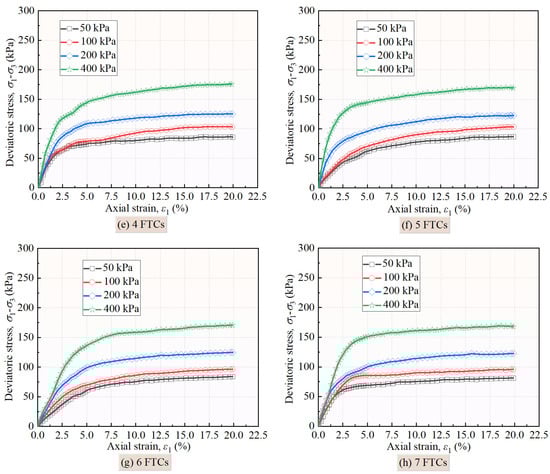
Figure 5.
Stress–strain curves under different numbers of freeze–thaw cycles.
3.2. Nuclear Magnetic Resonance Test Results
The T2 distribution curves (Figure 6) of red clay exhibit a distinct bimodal distribution characteristic. It reflects the water content inside the red clay and the corresponding pore size distribution, whereby the soil pores are primarily distributed between two sizes. The prominent main peak accounts for about 95% of the total area of the T2 spectrum, primarily between 0.01 and 4.82 ms. The secondary peak accounts for about 5% of the total area of the T2 spectrum, primarily between 7.31 and 72.32 ms. To facilitate analysis, the pores inside the red clay are categorized according to distinct peaks. The primary peak corresponds to micropores, while the secondary peak corresponds to macropores. The pore structure of red clay was influenced strongly by FTC. As the number of FTCs increases, the peak value of the main peak moves down slightly, and the area of the primary peak decreases. The secondary peak value moves up slightly, and the pore distribution range becomes wider, resulting in an increase in the area of the secondary peak. It indicates that some micropores transform into macropores because of the FTC process. As the number of FTCs increases, the proportion of macropores increases gradually, which can be shown by the damage degree of specimens due to the FTC process.
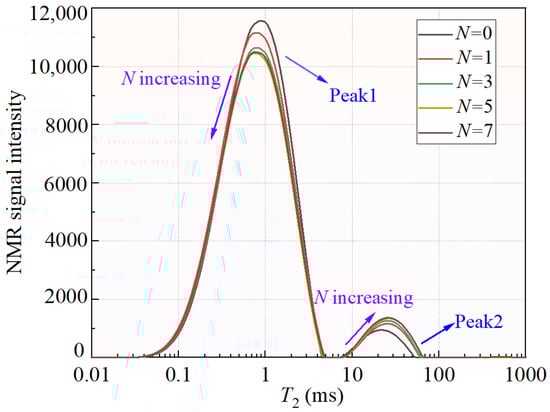
Figure 6.
T2 distribution curve of red clay.
4. Discussion
4.1. Analysis of Shear Strength
To further analyze the deterioration of the shear strength of red clay after FTCs, the deviatoric stress at an axial strain of 15% is taken as the peak deviator stress. Figure 7 shows the peak deviator stress of specimens subjected to FTCs under different confining pressures. The strength is significantly deteriorated by the FTC process. The peak deviator stress gradually declines with the increase in FTCs, yet the rate of deterioration slows down. As the radial stress increases, the range of peak deviator stress reduction increases. Furthermore, the reduction process of the shear strength can be classified into three phases: rapid reduction, slow reduction, and stabilization. Among them, the attenuation degree of the shear strength is the most significant in the rapid reduction stage where the shear strength decreases by approximately 30% under four radial stresses. Additionally, the peak deviator stress after seven FTCs is approximately 65% of the initial strength.
Figure 7.
Variation curves of peak deviator stress of specimens under four confining pressures.
According to the value of failure strength in Figure 7, the stress Mohr circle and strength envelope under different confining pressures are drawn with the shear stress as the ordinate and the normal stress as the abscissa. The intercept between the strength envelope and the ordinate is cohesion, and the angle between the strength envelope and the abscissa is the internal friction angle. According to this method, the cohesion and internal friction angle of red clay are calculated. The shear strength parameters of the red clay are illustrated in Figure 8. As the number of FTCs increases, the cohesion gradually declines to stable, showing a characteristic of deceleration degradation. The cohesion decreases the most after the first FTC, accounting for 46.26% of the total degradation. After three FTCs, the cohesion deteriorates to about 83% of the total degradation. After five FTCs, the cohesion changes weakly and the change trend gradually tends to be stable. It can be seen that the decreasing trend of the shear strength and cohesion is similar, indicating that cohesion is the most important factor for the shear strength of red clay. In addition, the internal friction angle also displays a decreasing tendency, but the change range is small compared with the cohesion. The curves of the measured values of the cohesion and internal friction angle with the number of FTCs were both in line with the logistic model. The specific fitting functions relationship can be expressed as Equations (2) and (3):
where c and φ are the cohesion and internal friction angle, respectively. N is the number of FTCs.
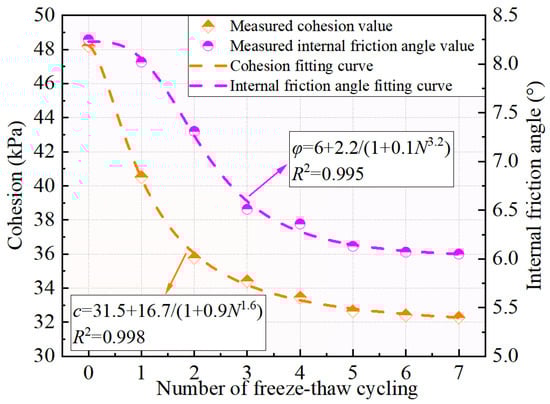
Figure 8.
The shear strength parameters of red clay change with the number of freeze–thaw cycles.
4.2. Analysis of Microstructure
The shear strength of red clay is continuously deteriorating due to the action of FTCs (see Figure 7 and Figure 8). Through NMR test results, as the number of FTCs increases, an increase in macropores leads to a loose structure and weakens the strength of red clay. During the freezing phase, the low ambient temperature causes the pore water to turn into ice. The ice crystals squeeze the soil skeleton, causing irreversible damage and reducing the bond between soil structures. This will result in a sharp reduction in cohesion and deterioration in the shear strength of red clay. The formation of through pores or cracks weakens the friction and occlusion between soil particles, causing a slight reduction in the friction angle.
Recalling that the pore size distribution of saturated soils can be reflected through T2 distribution curves, the calculation method of the area below the T2 distribution curves is to sum the signal amplitude I corresponding to the T2 value, and the result is shown in Figure 9.
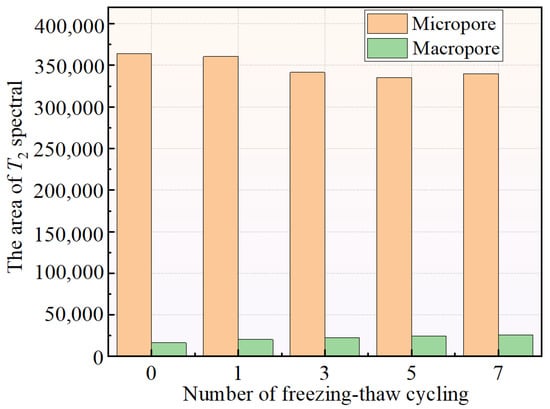
Figure 9.
Variation of T2 spectral area with the number of freeze–thaw cycles.
According to Figure 9, as the number of FTCs increases, the area of micropores declines to a stable level, while the area of macropores increases to a stable level. After five FTCs, the T2 spectral area largely stays in place and the pore size distribution remains unaltered. It indicates that the red clay has reached a new stable structure at the microscale. The corresponding macroscale performance is that the shear strength of the specimens essentially reaches a stable value. This demonstrates that the structural damage of red clay caused by FTCs is mainly caused by macropores. Therefore, a damage factor based on the area of T2 spectral is defined as η, which can represent the changing rate of T2 spectral area after FTCs. The redistribution of pores inside the red clay will lead to soil structure looseness and strength deterioration. The damage factor can characterize the damage degree of soil microstructure caused by FTCs. The greater the value of η, the greater the deterioration of the soil structure. The calculation formula of η is as below
where I0 is the signal amplitude corresponding to the T2 value of the specimen without FTC, and IN is the signal amplitude corresponding to the T2 value of the specimen after N FTCs. IMicropore,0 is the signal amplitude corresponding to the T2 value of peak 1 without FTC, and IMicropore, N is the signal amplitude corresponding to the T2 value of peak 1 after N FTCs.
The change in η with the increase in the number of FTCs can be fitted as Equation (5), and the result is illustrated in Figure 10.
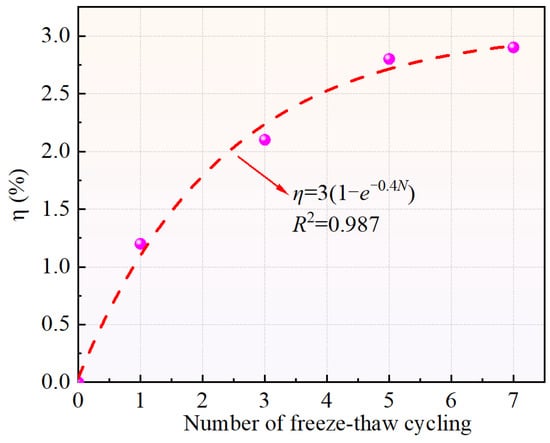
Figure 10.
The fitting curve of η with the number of freeze–thaw cycles.
Figure 10 reveals that as the number of FTCs increases, the damage factor gradually rises to a stable state. This suggests that the redistribution of pores significantly influences the shear strength of red clay. Therefore, the study of such pores should be given special attention in engineering practices.
4.3. Extended Mohr–Coulomb Strength Model
The shear strength of red clay deteriorated after FTCs, and the deterioration process of the shear strength must be accompanied by structural damage. The NMR test results can accurately reflect the alterations in the microstructure of red clay during the FTC process. The damage factor was established through the microscopic test results, and then the shear strength was characterized at the macroscale. Therefore, an extended Mohr–Coulomb strength criterion was proposed, considering the structural damage caused by the action of FTCs. Under the triaxial compression condition, the expression of the Mohr–Coulomb strength criterion is
where q is the deviator stress, the difference between the axial stress σ1 and radial stress σ3; c is the cohesion; φ is the internal friction; M is the critical state stress ratio, which can be obtained through the friction angle φ; p is the mean stress.
where σ1 is the axial stress; σ3 is the radial stress. In the triaxial shear test with invariable confining pressure, the radial stress σ3 is constant. By substituting Equations (7) and (8) into Equation (6), the expression of the Mohr–Coulomb strength criterion can be expressed as Equation (11).
The microstructure of red clay is altered due to the effect of FTCs. The ability of specimens to resist shear displacement weakens, causing a sharp decrease in cohesion. Therefore, the expression of cohesion of red clay considering the microstructure damage caused by FTCs is established as Equation (12).
where c0 indicates the cohesion of the specimens that have not undergone the FTC; A is an introduced coefficient, which is a constant, representing the evolution rate of cohesion with the structural damage.
Similarly, due to the increase in macropores in the soil, the contact area of soil particles decreases, causing a reduction in the internal friction angle. Therefore, the expression of the internal friction angle of red clay considering structural damage caused by FTCs is established as Equation (13).
where φ0 indicates the internal friction angle of the specimens that have not undergone the FTC; B and b are two introduced coefficients, which are constants. B represents the evolution rate of the internal friction angle with structural damage caused by FTCs; is the compensation coefficient, ensuring that the internal friction angle degenerates to φ0 when η = 0.
By substituting Equations (12) and (13) into Equation (11), the shear strength model considering structural damage caused by FTCs is obtained as follows.
In practice, coefficient A can be calibrated through the measured cohesion, and coefficients b and B can be calibrated through the measured internal friction angle. c0 and φ0 of the specimens are 48.2 kPa and 8.25°, respectively. The results of parameter calibration are displayed in Figure 11.
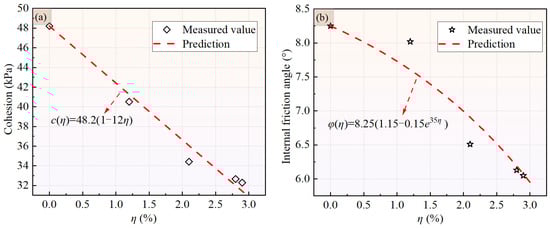
Figure 11.
Parameter calibration: (a) calibration of parameter A; (b) calibration of parameters b and B.
Figure 12 shows the contrast between the predicted and the measured shear strength values of the specimens after different numbers of FTCs. As the structural damage intensifies, the shear strength of red clay gradually declines. Considering the structural damage caused by the action of FTCs in the proposed shear strength criterion, the variation in the shear strength of red clay after FTCs is accurately predicted. The results can offer a theoretical basis for engineering construction amid similar working conditions.
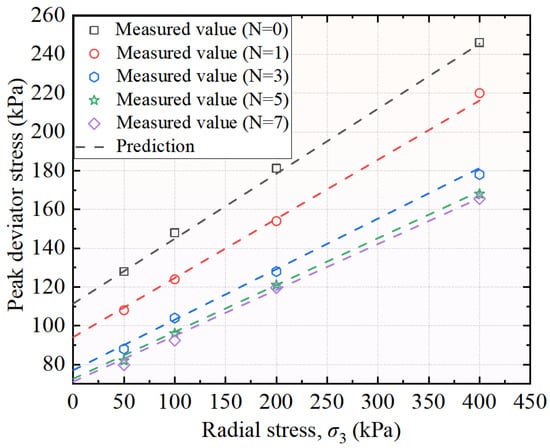
Figure 12.
Comparison between predicted and measured peak deviator stress values of the strength model.
5. Conclusions
In this paper, the deterioration mechanism of the shear strength of QTP red clay was analyzed at multiscale through triaxial shear and NMR tests. The conclusions of the present work are summarized as follows.
- As the number of FTCs increases, the peak deviator stress of red clay declines significantly, and the decreasing trend can be described in three phases: rapid reduction, slow reduction, and stabilization.
- The T2 spectrum curves of red clay exhibit a distinct bimodal distribution characteristic. The primary type of pores within the specimens is micropores. After FTCs, part of the micropore develops into a macropore, leading to structural damage.
- The mechanism of the shear strength deterioration of red clay after FTCs is revealed. The phase transformation of water inside red clay causes a frost-heaving force to act on the soil skeleton and pore volume expansion. The area of macropores inside the red clay increases, leading to a looser structure and a deterioration of the shear strength of the soil.
- An extended Mohr–Coulomb strength model considering the structural damage caused by the action of FTCs is established. The shear strength of red clay after FTCs can be well predicted by the extended strength model. In future work, more freeze–thaw cycles and experimental studies will be conducted to verify the proposed model. The research results have a reference value for exploring the disaster mechanism of freezing and thawing in the QTP.
Author Contributions
Conceptualization, Y.Y. and Z.Z.; methodology, Y.Y. and Z.Z.; software, Y.Y. and Z.Z.; validation, Y.Y., Z.Z. and F.D.; investigation, Y.Y.; writing—original draft preparation, Y.Y.; writing—review and editing, Z.Z., F.D. and S.B.; visualization, Y.Y., Z.Z., F.D. and S.B.; project administration, Z.Z., F.D. and S.B.; funding acquisition, Z.Z. and F.D. All authors have read and agreed to the published version of the manuscript.
Funding
The financial support provided by the Second Tibetan Plateau Scientific Expedition and Research (STEP) Program (No. 2019QZKK0905) is gratefully recognized.
Institutional Review Board Statement
Not applicable.
Informed Consent Statement
Not applicable.
Data Availability Statement
The original contributions presented in the study are included in the article, further inquiries can be directed to the corresponding author.
Conflicts of Interest
The authors declare no conflict of interest.
References
- Zhang, Y.Z.; Pu, S.Y.; Li, R.T.Y.M.; Zhang, J. Microscopic and mechanical properties of undisturbed and remoulded red clay from Guiyang, China. Sci. Rep. 2020, 10, 18003. [Google Scholar] [CrossRef]
- Sani, J.E.; Etim, R.K.; Joseph, A. Compaction behaviour of lateritic soil–calcium chloride mixtures. Geotech. Geol. Eng. 2019, 37, 2343–2362. [Google Scholar] [CrossRef]
- Lang, L.; Chen, B.W.; Chen, B. Strength evolutions of varying water content-dredged sludge stabilized with alkali-activated ground granulated blast-furnace slag. Constr. Build. Mater. 2021, 275, 122111. [Google Scholar] [CrossRef]
- Zeng, L.; Yu, H.C.; Gao, Q.F.; Liu, J.; Liu, Z.H. Evolution of tensile properties of compacted red clay under wet and dry cycles. KSCE J. Civ. Eng. 2021, 26, 606–618. [Google Scholar] [CrossRef]
- Kuang, X.; Jiao, J.J. Review on climate change on the Tibetan Plateau during the last half century. J. Geophys. Res.-Atmos. 2016, 121, 3979–4007. [Google Scholar] [CrossRef]
- Zhang, Z.Q.; Wu, Q.B.; Jiang, G.L.; Gao, S.R.; Chen, J.; Liu, Y.Z. Changes in the permafrost temperatures from 2003 to 2015 in the Qinghai-Tibet Plateau. Cold Reg. Sci. Technol. 2020, 169, 102904. [Google Scholar] [CrossRef]
- Lu, J.G.; Tan, L.L.; Yang, H.H.; Wan, X.S.; Wang, Y.D.; Yan, Z.G. Experimental study on the hydro-thermal-deformation characteristics of cement-stabilized soil exposed to freeze-thaw cycles. Front. Earth Sci. 2023, 10, 1041249. [Google Scholar] [CrossRef]
- Xue, P.; Fu, Q.; Li, T.X.; Liu, D.; Hou, R.J.; Li, Q.L.; Li, M.; Meng, F. Effects of biochar and straw application on the soil structure and water-holding and gas transport capacities in seasonally frozen soil areas. J. Environ. Manag. 2022, 301, 113943. [Google Scholar] [CrossRef]
- Ma, W.; Wang, D.Y. Frozen Soil Mechanics; Science Press: Beijing, China, 2014. [Google Scholar]
- Wang, D.Y.; Ma, W.; Niu, Y.H.; Chang, X.X.; Wen, Z. Effects of cyclic freezing and thawing on mechanical properties of Qinghai-Tibet clay. Cold Reg. Sci. Technol. 2007, 48, 34–43. [Google Scholar] [CrossRef]
- Liu, J.K.; Chang, D.; Yu, Q.M. Influence of freeze-thaw cycles on mechanical properties of a silty sand. Eng. Geol. 2016, 210, 23–32. [Google Scholar] [CrossRef]
- Tang, L.; Cong, S.Y.; Geng, L.; Ling, X.Z.; Gan, F.D. The effect of freeze-thaw cycling on the mechanical properties of expansive soils. Cold Reg. Sci. Technol. 2018, 145, 197–207. [Google Scholar] [CrossRef]
- Liu, X.Q.; Liu, J.K.; Tian, Y.H.; Chang, D.; Hu, T.F. Influence of the freeze-thaw effect on the Duncan-Chang model parameter for lean clay. Transp. Geotech. 2019, 21, 100273. [Google Scholar] [CrossRef]
- Tang, Y.Q.; Yan, J.J. Effect of freeze-thaw on hydraulic conductivity and microstructure of soft soil in Shanghai area. Environ. Earth Sci. 2015, 73, 7679–7690. [Google Scholar] [CrossRef]
- Ishikawa, T.; Tokoro, T.; Miura, S. Influence of freeze-thaw action on hydraulic behavior of unsaturated volcanic coarse-grained soils. Soils Found. 2016, 56, 790–804. [Google Scholar] [CrossRef]
- Rui, D.; Ji, M.J.; Nakamur, D.; Suzuki, T. Experimental study on gravitational erosion process of vegetation slope under freeze–thaw. Cold Reg. Sci. Technol. 2018, 151, 168–178. [Google Scholar] [CrossRef]
- Zou, W.L.; Ding, L.Q.; Han, Z.; Wang, X.Q. Effects of freeze-thaw cycles on the moisture sensitivity of a compacted clay. Eng. Geol. 2020, 278, 105832. [Google Scholar] [CrossRef]
- Cui, Z.D.; He, P.P.; Yang, W.H. Mechanical properties of a silty clay subjected to freezing-thawing. Cold Reg. Sci. Technol. 2014, 98, 26–34. [Google Scholar] [CrossRef]
- Wang, D.; Liu, E.L.; Yang, C.S.; Liu, Y.Q.; Zhu, S.X.; Yu, Q.H. Dynamic mechanical characteristics of frozen subgrade soil subjected to freeze-thaw cycles. J. Mt. Sci. 2023, 20, 242–255. [Google Scholar] [CrossRef]
- Hotineanu, A.; Bouasker, M.; Aldaood, A.; Al-Mukhtar, M. Effect of freeze–thaw cycling on the mechanical properties of lime-stabilized expansive clays. Cold Reg. Sci. Technol. 2015, 119, 151–157. [Google Scholar] [CrossRef]
- Zhang, W.Y.; Guo, A.B.; Lin, C. Effects of cyclic freeze and thaw on engineering properties of compacted loess and lime-stabilized loess. J. Mater. Civil Eng. 2019, 31, 04019205. [Google Scholar] [CrossRef]
- Lu, Y.; Liu, S.H.; Zhang, Y.G.; Li, Z.; Xu, L. Freeze-thaw performance of a cement-treated expansive soil. Cold Reg. Sci. Technol. 2020, 170, 102926. [Google Scholar] [CrossRef]
- Feng, D.C.; Lin, B.; Zhang, F.; Feng, X. A review of freeze-thaw effects on soil geotechnical properties. Sci. Sin. Technol. 2017, 47, 111–127. [Google Scholar] [CrossRef]
- Qi, J.L.; Vermeer, P.A.; Cheng, G. A review of the influence of freeze-thaw cycles on soil geotechnical properties. Permafr. Periglac. 2006, 17, 245–252. [Google Scholar] [CrossRef]
- Zhang, Y.; Bing, H.; Yang, C.S. Influences of freeze-thaw cycles on mechanical properties of silty clay based on SEM and MIP test. Chin. J. Rock Mech. Eng. 2015, 34 (Suppl. S1), 3597–3603. [Google Scholar] [CrossRef]
- Xu, J.; Li, Y.F.; Lan, W.; Wang, S.H. Shear strength and damage mechanism of saline intact loess after freeze-thaw cycling. Cold Reg. Sci. Technol. 2019, 164, 102779. [Google Scholar] [CrossRef]
- Li, Z.; Liu, L.L.; Yan, S.H.; Zhang, M.K.; Xia, J.J.; Xie, Y.L. Effect of freeze-thaw cycles on mechanical and porosity properties of recycled construction waste mixtures. Constr. Build. Mater. 2019, 210, 347–363. [Google Scholar] [CrossRef]
- Fan, W.; Yang, P.; Yang, Z.J. Freeze-thaw impact on macropore structure of clay by 3D X-ray computed tomography. Eng. Geol. 2021, 280, 105921. [Google Scholar] [CrossRef]
- Xu, W.B.; Wang, X.C. Effect of freeze-thaw cycles on mechanical strength and microstructure of silty clay in the Qinghai-Tibet Plateau. J. Cold Reg. Eng. 2022, 36, 04021018. [Google Scholar] [CrossRef]
- Feng, S.X.; Xu, Z.G.; Chai, J.R.; Li, Y. Using pore size distribution and porosity to estimate particle size distribution by nuclear magnetic resonance. Soils Found. 2020, 60, 1011–1019. [Google Scholar] [CrossRef]
- Song, Z.Y.; Zhang, Z.H.; Du, X.L. Shear strength of compacted bentonite saturated with saline solutions under different specimen saturation methods. Int. J. Geomech. 2024, 24, 04024004. [Google Scholar] [CrossRef]
- Song, Z.Y.; Zhang, Z.H.; Lu, Y.Q.; Du, X.L. Shrinkage behavior of compacted bentonite considering physicochemical effects. Sci. Total Environ. 2024, 906, 167547. [Google Scholar] [CrossRef]
- Li, T.G.; Kong, L.W.; Wang, J.T.; Wang, F.H. Trimodal pore structure evolution characteristics and mechanical effects of expansive soil in seasonally frozen areas based on NMR test. Rock Soil Mech. 2021, 42, 2741–2754. [Google Scholar] [CrossRef]
- Ye, W.J.; Qiang, Y.H.; Jing, H.J.; Zou, Y. Freeze-thaw cycle experiment of loess paleosol with different water content based on nuclear magnetic resonance. J. Eng. Geol. 2022, 30, 144–153. [Google Scholar] [CrossRef]
- Wang, X.W.; Li, J.D.; Wang, X.; Zhang, Y.J.; Jiang, D.J.; Zhao, G. Study on strength and microstructure of red clay reinforced by F1 ionic soil stabilizer. Appl. Sci. 2022, 12, 9831. [Google Scholar] [CrossRef]
- Chen, C.; Zhang, C.Z.; Liu, X.; Pan, X.A.; Pan, Y.A.; Jia, P.J. Effects of freeze-thaw cycles on permeability behavior and desiccation cracking of Dalian red clay in China considering saline intrusion. Sustainability 2023, 15, 3858. [Google Scholar] [CrossRef]
- Ye, W.J.; Liu, K.; Yang, G.S.; Ma, W.C.; Xie, Z.W. Experimental study on shear strength deterioration of loess under freeze-thaw cycling. Sci. Technol. Eng. 2018, 18, 313–318. [Google Scholar] [CrossRef]
- Wang, M.; Meng, S.J.; Sun, Y.Q.; Fu, H.Q. Shear strength of frozen clay under freezing-thawing cycles using triaxial tests. Earthq. Eng. Eng. Vib. 2018, 17, 761–769. [Google Scholar] [CrossRef]
- Brownstein, K.R.; Tarr, C.E. Importance of classical diffusion in NMR studies of water in biological cells. Phys. Rev. A 1979, 19, 2446. [Google Scholar] [CrossRef]
- Jaeger, F.; Shchegolikhina, A.; As, H.V.; Schaumann, G.E. Proton NMR relaxometry as a useful tool to evaluate swelling processes in peat soils. Open Magn. Reson. J. 2010, 3, 27–45. [Google Scholar] [CrossRef]
- Kenyon, W.E.; Kolleeny, J.A. NMR surface relaxivity of calcite with adsorbed Mn2+. J. Colloid Interf. Sci. 1995, 170, 502–514. [Google Scholar] [CrossRef]
- Bryar, T.R.; Daughney, C.J.; Knight, R.J. Paramagnetic effects of iron (III) species on nuclear magnetic relaxation of fluid protons in porous media. J. Magn. Reson. 2000, 142, 74–85. [Google Scholar] [CrossRef]
Disclaimer/Publisher’s Note: The statements, opinions and data contained in all publications are solely those of the individual author(s) and contributor(s) and not of MDPI and/or the editor(s). MDPI and/or the editor(s) disclaim responsibility for any injury to people or property resulting from any ideas, methods, instructions or products referred to in the content. |
© 2024 by the authors. Licensee MDPI, Basel, Switzerland. This article is an open access article distributed under the terms and conditions of the Creative Commons Attribution (CC BY) license (https://creativecommons.org/licenses/by/4.0/).