
Strength, Deformation and Fracture Properties of Hard Rocks Embedded with Tunnel-Shaped Openings Suffering from Dynamic Loads
1
Hubei Key Laboratory of Blasting Engineering, Jianghan University, Wuhan 430056, China
2
Yunnan Phosphate Chemical Group Co., Ltd., Kunming 650600, China
3
School of Mines, China University of Mining and Technology, Xuzhou 221116, China
*
Author to whom correspondence should be addressed.
Appl. Sci. 2024, 14(8), 3175; https://doi.org/10.3390/app14083175
Submission received: 1 March 2024
/
Revised: 3 April 2024
/
Accepted: 4 April 2024
/
Published: 10 April 2024
(This article belongs to the Section Civil Engineering)
Abstract
:In rock engineering, the dynamic loads caused by mechanical action and rock blasting have an extremely significant influence on the stableness of surrounding rock masses. To examine the impact of dynamic load on the mechanical properties and fracturing characteristics of hard rocks as well as the failure responses of underground openings, a number of prismatic samples with holes of different numbers and configurations were prepared for dynamic tests employing an SHPB loading device. The experimental results demonstrate that the order of dynamic compressive strength of each group of samples under the impact nitrogen pressure of 0.45 MPa is: G3 > G2 > G5 > G4 > G7 > G6, and the dynamic deformation process of the samples is parted into three phases: linear elastic deformation, plastic deformation and post-peak deformation. A total of three categories of cracks, i.e., spalling cracks, shear cracks and tensile cracks, occur in the specimens. The failure mode of the samples having one or two holes arranged in a vertical direction is controlled by shear cracks, whilst that of the rest groups of pre-holed specimens belongs to tensile-shear failure. The existence of the fabricated holes in the samples significantly weakens the mechanical properties and affects the fracture evolution characteristics, which rely on the quantity and layout of the cavities in the specimens. The interesting results are also discussed and explained, and could supply some insight in the mechanisms of tunnel surrounding rock failure and rock dynamic hazards such as rock burst.
1. Introduction
Crack and hole are two common kinds of defects existing in natural rock mass. At present, it is generally known that the occurrence of the defects worsens the internal structure of rock mass, and the concentrated stress that distributes at the periphery of the defects makes crack initiation tend to emerge at their tips or corners, resulting in a significant weakening of the mechanical performance and complex deformation and instability behaviors of rock mass. In rock engineering, the common types of crack-like flaws include micro-crack, weak planes, fissures, faults, joints, and beddings. Up to now, considerable theoretical, laboratory and numerical attempts have been made upon the mechanical responses of rock or rock-like media containing diverse crack flaws under different loading conditions, which greatly improves the understanding of rock mass failure characteristics and instability mechanisms [1,2,3]. In our previous studies, the crack initiation, development and penetration behaviors of jointed specimens were also systematically reviewed, which is found to be attributed to multiple factors, e.g., the size, inclination, number and configuration of crack flaws, material properties and loading conditions [4,5]. Additionally, the failure is considered to be the course of crack initiation, development and intersection, and the instability mode and coalescence type are the results of competition between tensile cracks and shear cracks.
Likewise, a variety of openings varying from tiny holes to large-scale cavities are widespread in rock masses, such as the pores in basalt, natural caves in mountain and Karst caves in underground carbonate strata (see Figure 1). In addition, the excavated tunnels in hard rock mines could also be regarded as holes in plates according to elastic mechanics theory. Obviously, the impact of holes on the quality and performance of rock mass is noticeable, raising the concerns of scholars in recent decades. Inspired by the V-shaped failure phenomenon of surrounding rock in deep-buried tunnels, Hoek [6] took the lead in conducting biaxial compression photo-elastic tests on prismatic resin glasses and granite samples with a circular cavity, and observed the existence of primary tensile cracks and remote cracks. This fracture phenomenon has also been found in uniaxial compression experiments of other rock materials with one single circular hole, and the two sorts of cracks were verified towards the direction of compression [7,8]. In summary, there exist three types of cracks formed around a round hole in prismatic specimens under uniaxial and biaxial loads with low-confined pressure, namely the primary tensile cracks at the top and bottom of the opening, the spalling cracks at the hole sidewalls and the remote cracks at the hole corners. Dzik and Lajtai [9] successfully measured the initiation stresses of the three categories of cracks through attaching substantial resistance strain gauges near the round hole, and revealed the relation between the fracture propagation speed and the cavity diameter. Wong et al. [10] held that the primary tensile fractures are prone to initiate and propagate in small-width specimens with a large-diameter round hole. Sammis and Ashby [11] further proposed a functional equation of the primary crack length on fracture toughness, hole radius, sample strength and lateral pressure coefficient. Given that the holes in rock engineering are not generally circular, Li et al. [12] incorporated AE plus DIC measurements to reproduce the strain localization characteristics and fracturing process of samples with an elliptical hole of different geometries subjected to uniaxial compression. In addition, other scholars [13,14] have further investigated the fracturing responses of samples with a hole of different shapes under axial and biaxial loading numerically and experimentally, and found the effect of hole shape upon the strength and fracturing law is remarkable. By PFC code, Wu et al. [15] modeled the fracturing process of the samples with circular, horseshoe-shaped, trapezoidal, rectangular or square holes under biaxial compressive loads, and claimed that their fracture evolution is similar but with different initiation stress and crack strength under identical loading conditions, and the tensile cracks and remote cracks are restricted as the confining pressure rises, which were clearly explained according to the stress distributed near the cavities derived by an improved complex variable method. In addition, other loading methods such as general triaxial loading [16], true triaxial loading [17], Brazilian split tension [18], one-dimensional impact loading [5,19], one-dimensional static-dynamic loading [20,21,22], two-dimensional static and one-dimensional dynamic loading [23,24,25,26] and dynamic Brazilian split tension [27] were employed on samples with one circular, elliptical, horseshoe-shaped or rectangular hole to examine the fracturing behaviors and mechanical properties, providing some insights into the failure characteristics of underground openings under geo-stress.
Actually, there is rarely one single hole but multiple holes in rock mass, and holes like air pores in basalt and tunnels in underground rock engineering generally occur in groups. It is evident that performing different loading tests on specimens with two or more holes is of more practical value. For this purpose, numerous efforts have been devoted to studying the crack development and intersection features of samples with more than one opening subjected to various loads. Zhao et al. [28] analyzed the strength, deformation and AE properties of rock-like samples with two round holes with various rock bridge inclinations in uniaxial compression, and concluded three failure modes and two deformation stages. Literature [29] conducted a list of axial compression experiments on sandstone samples with two oval holes with different configurations, and discovered six types of cracks and four failure modes. With the aid of DIC measurement, Zhou et al. [30] clearly presented the deformation fields and crack coalescence patterns of marble samples with two rectangular openings in axial compression. Tang et al. [31] applied the RFPA code to investigate the intersection mechanisms and failure modes of samples with three or numerous round openings under axial loading, and the numerical outcomes agree well with the laboratory conclusions obtained by Lin et al. [32]. In our previous work [33,34], we also experimentally investigated the strength, deformation and fracturing responses of sandstone samples with two, three and four inverted-U shaped openings under uniaxial loading, and deemed that the intersection of the tensile cracks, shear cracks and holes leads to failure. Haeri et al. [35] studied the crack extension and connection of different concrete specimens with cavities under Brazilian split tension both experimentally and numerically. Moreover, the influence of material type, material heterogeneity and temperature treatment on the fracturing feature was also explored [36,37,38]. Since tunnel excavation and stope mining are usually constructed by the drilling and blasting method in hard-rock mines, the surrounding rocks frequently suffer from the dynamic loads. In mining engineering, a large number of tunnels are distributed in various locations underground, and there may be two, three or more parallel tunnels in a certain space. As a result, tunnel stability is affected by dynamic disturbances from surrounding tunnel excavation activities. However, much of the aforementioned literature is based on static tests, and studies are still limited regarding dynamic experiments. Thus, it is especially essential to fabricate samples with different numbers of holes according to the spatial position of the roadways and carry out dynamic loading experiments on them, which is of huge guiding value on revealing the instability mechanism of roadway groups in close distances and developing effective rock disaster prevention methods. In this research, plenty of impact tests on prismatic rock samples with varied amounts of circular openings were performed utilizing the split Hopkinson pressure bar (SHPB) testing system first, and then the impacts of opening quantity and opening configuration on deformation and fracturing processes of specimens were discussed in detail.
2. Experimental Material and Method
2.1. Rock Material and Physical-Mechanical Properties
In this research, the distinctive sandstone rock originating from Junan county, China, was chosen as the testing material owing to the wide distribution and good homogeneity of this kind of rock in the strata. First, we measured the micro structure of this rock using a polarizing microscope and scanning electron microscope (SEM), and obtained the chemical composition and corresponding volume content of this rock, that is: quartz (42%), plagioclase (35%), calcite (9%), zeolite (8%), K-feldspar (5%) and other opaque minerals (1%), as shown in Figure 2. Clearly, the red sandstone could be grouped as tuffaceous–feldspar–quartz rock, which has fine–medium sand texture along with a blocky structure. Secondly, we tested the physical properties, such as density (2472.20 kg/m3), porosity (5.08%) and P-wave velocity (3174.50 m/s).
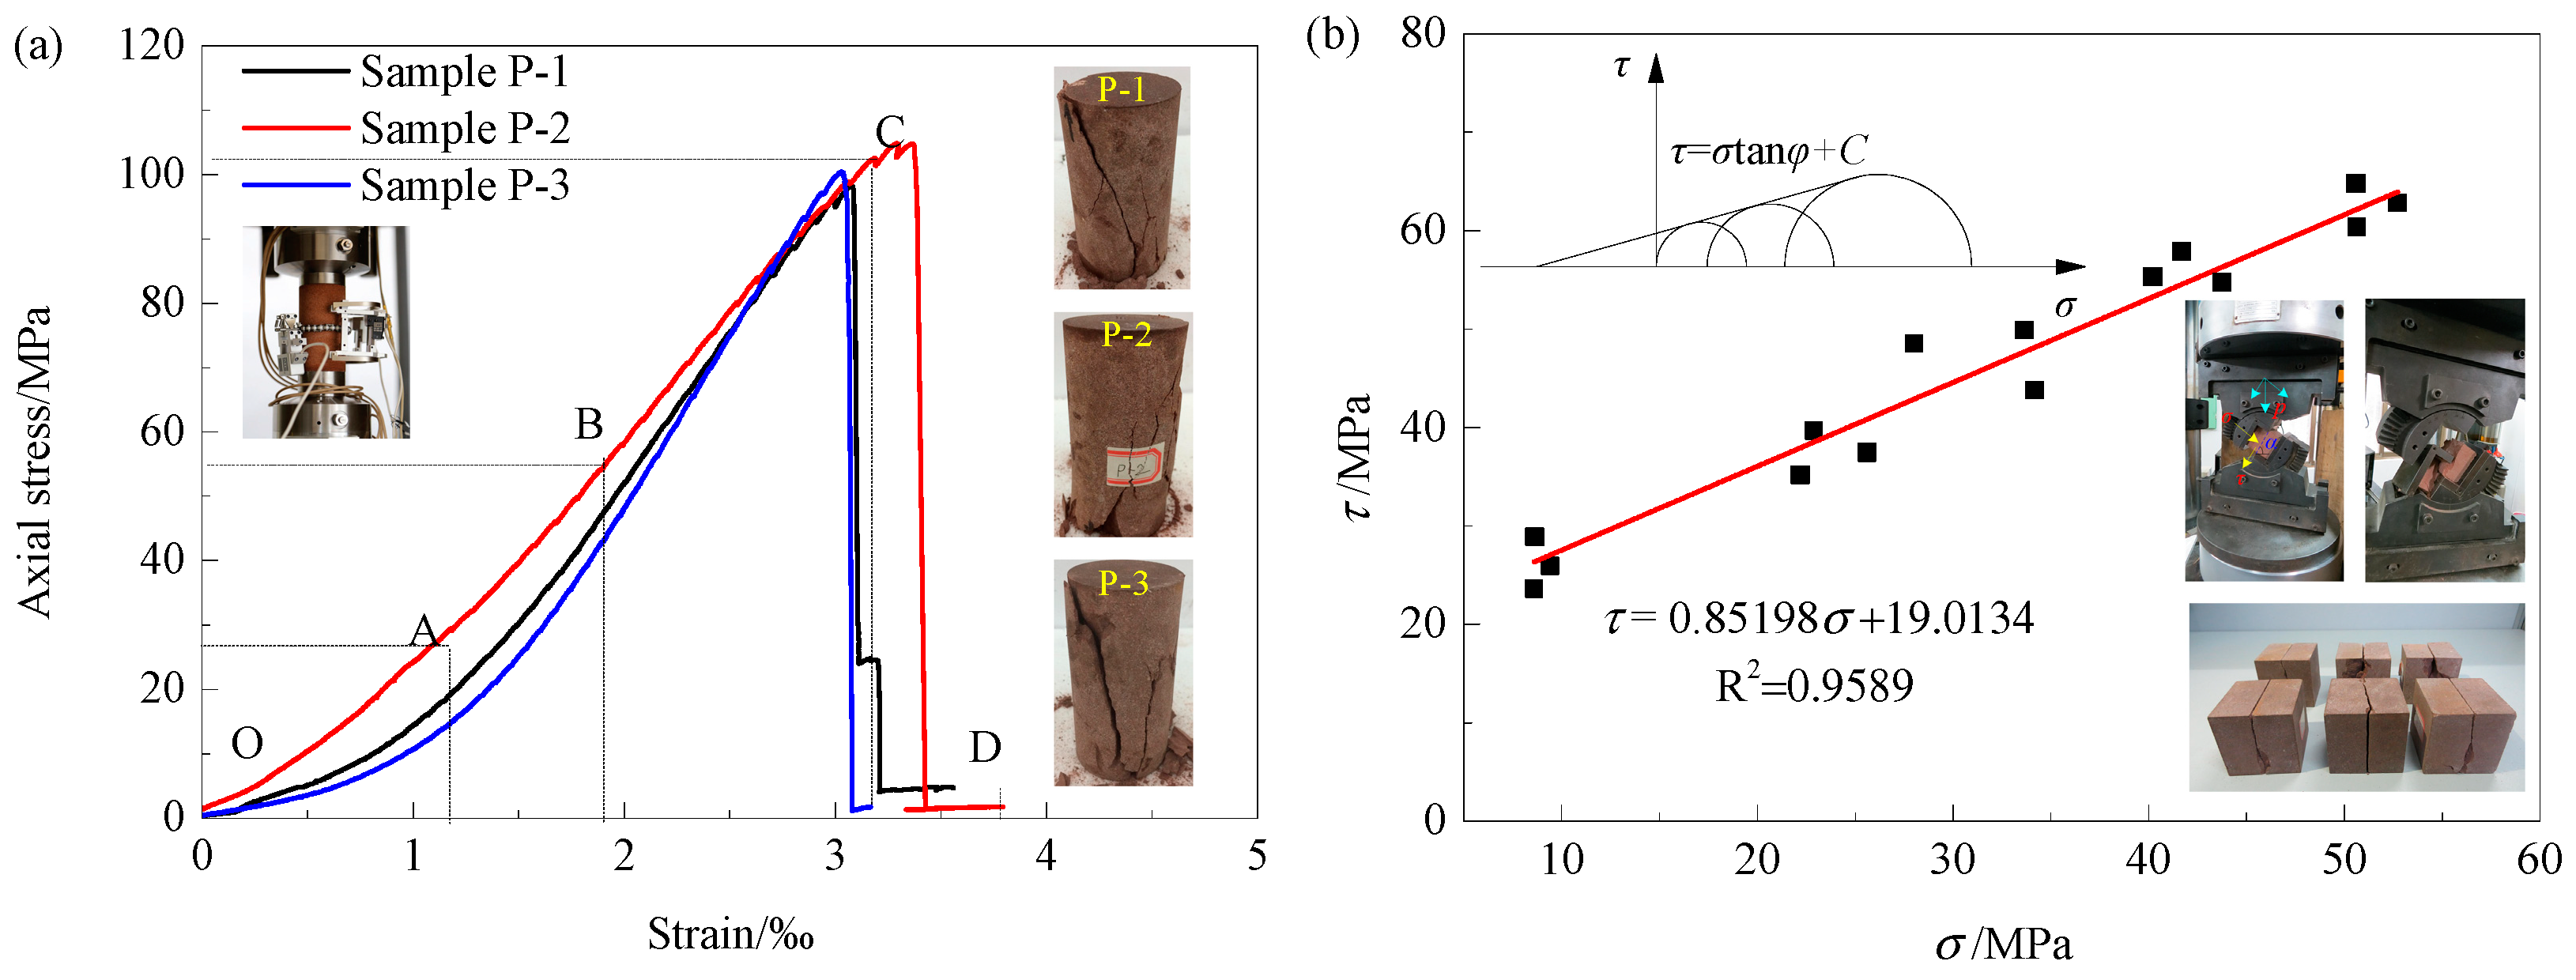
To acquire the mechanical properties of this class of rock, we fabricated various rock specimens with the help of a professional geotechnical company, including three cylindrical specimens (diameter 50 × height 100 mm) for uniaxial compression tests, three Brazilian specimens (diameter 50 × thickness 25 mm) for Brazilian split tension tests, 15 cuboid samples (edge length 50 × 50 × 50 mm) for indirect shear tests and 3 semi-circular bend (SCB) samples for three-point bending tests. The processing accuracy of all samples strictly meets the demands of the relevant experimental standards. The above tests were conducted on rock mechanics testing machines such as MTS 815, Instron 1346 and MTS Landmark at Central South University. The part test outcomes are shown in Figure 3, and Table 1 lists the measured values of the uniaxial compressive strength (σc), tensile strength (στ), elastic modulus (Ee), Poisson’s ratio (μ), cohesive force (Fc), internal friction angle (θ) and fracture toughness (Tf) based on the above series of tests. In addition, according to the stress versus strain curves under axial loading, we found that the deformation process of specimens could be parted into four phases (the initial compaction stage OA, elastic deformation AB, plastic deformation BC and the post-peak stage CD), and the steep post-peak curve indicates that the medium-hard rock is very brittle.
2.2. Experimental Apparatus and Principle
Since the deformation rate of rock-like materials under explosive loading belongs to a medium–high level, we selected the modified SHPB testing equipment of CSU to conduct the dynamic compressive tests on pre-holed specimens. In this device, the impact component is designed from the original cylindrical shape to a spindle shape, which could produce the half-sine loading waves, solving the issues of waveform distortion and P-C oscillation compared with the previous rectangular loading wave. The experimental equipment is composed of a launch system, a bar system and a monitoring system. The launch system includes a nitrogen storage device, a striker excitation device and a special-shaped striker. The bar system is made up of an incident bar, a transmitted bar and an absorption bar. The monitoring system consists of a pedestal, a dynamic strain apparatus along with an oscilloscope, two strain gauges together with two bridge boxes, a floodlight and an industrial camera, a speedometer and a rock debris collection box, as shown in Figure 4.
A valve installed on the nitrogen tank can control the pressure of nitrogen charged into the excitation device, and there is a group of combined switches on the excitation device, which can realize the charging and discharging of nitrogen. The incident, transmitted and buffer bars made up of 40Cr alloy have lengths of 2.0 m, 1.5 m and 0.5 m, respectively. The density, elastic modulus and wave velocity are 7821 kg/m3, 233 GPa and 5461 m/s. All the bars have a diameter of 50 mm. The dynamic strain-meter (DL-850E) and oscilloscope (CS-1D) are applied to monitor the dynamic strain and display the waveform, while the industrial camera (Fastcam Sa1.1) with a maximum shooting speed of 675,000 fps is used to capture the photos of rock specimens during loading. In this work, the shooting speed was set as 75,000 fps, that is, one image was collected every 13.33 μs. To clearly capture the sample image, a high-power supplementary light source was set up next to the camera during the tests. Also, a self-made rock debris collection box was arranged on the pedestal to collect the rock fragments during the tests. Note that the several monitoring devices need to be turned on simultaneously to ensure that the monitored parameters are synchronized.
The principle of the dynamic impact tests employing the SHPB system is as follows [5]: Firstly, by opening the excitation device, the high-pressure gas delivered from the nitrogen tank drives the spindle-shaped striker to strike the tail of the incident bar, resulting in the occurrence of elastic stress wave. The strike speed of the striker could be captured using the laser velocimeter (model TT-02). Then the elastic stress wave extends steadily at a speed of Ce = (Ee/ρe)½ along the incident bar, and it will reach the interface I through a time of (Le/Ce). At this time, the stress wave could transmit and reflect because of the different wave impedance in samples and bars. Afterward, the stress wave keeps on propagating in the sample. When the propagation time is (Ls/Cs), it approaches the interface II and the stress wave generates transmission and reflection again. Further on, the voltage signals of the stress wave on the incident and transmitted bars can be captured using the dynamic strain-meter through the bridge box and displayed on the oscilloscope. Finally, the dynamic mechanical parameters, including the dynamic stress, dynamic strain and strain rate of the specimen could be derived based on the stress wave theory.
In accordance with the stress wave theory, the displacement function u(t) of a point on the sine wave can be expressed as:
where C represents the stress wave velocity in the media (bars), whilst t and ε(t) denote the time and strain function with respect to time, respectively.
Assuming the strain functions of the three types of the stress waves are εi(t), εr(t) and εt(t), respectively, the horizontal displacement functions (u1(t) and u2(t)) on the I and II interfaces in Figure 4 could be written as:
If the sample length is denoted as Ls, the dynamic strain function εs(t) can be expressed as:
In accordance with the uniformity hypothesis, Equation (3) can be rewritten by substituting εt(t) = εi(t) + εr(t), namely,
By differentiating Equation (4) with regard to t, then the strain rate of the specimen could be deduced as:
Obviously, the two forces imposing on the two end surfaces of the specimen could be obtained by:
where F1 and F2 mean the forces acting on the top and bottom ends of the specimen, respectively. Ei and Ai represent the Young’s modulus and cross sectional area of the incident bar, while Et and At mean those of the transmitted bar. In this research, E = Ei = Et and A = Ai = At.
Based on Equation (6), it is quite easy to solve the dynamic stress in the specimen by:
where σs(t) and As denote the average internal stress and cross sectional area of the specimen, respectively.
In this study, we define the tensile stress as positive and compressive stress as negative. Combining Equations (6) and (7), leads to:
in which σi(t), σr(t) and σt(t) denote the absolute values of the incident, reflected and transmitted stresses with respect to the loading time t.
From Equations (3) and (4), the expressions of and εs(t) could be further obtained by:
To sum up, according to the obtained strain signals, the real-time dynamic mechanical property parameters of the sample can be solved by Equations (8)–(10). Evidently, the dynamical strength of the sample is positively related to the strain of the transmitted wave.
Additionally, the relation among the incident, reflected and transmitted energy (WI, WR, and WS) can be solved according energy theory, and the expression of the dissipated energy WS can be obtained on the basis of the energy conservation equation, namely,
where ρw and Vs mean the specimen dissipated energy density and volume, respectively.
3. Experimental Program
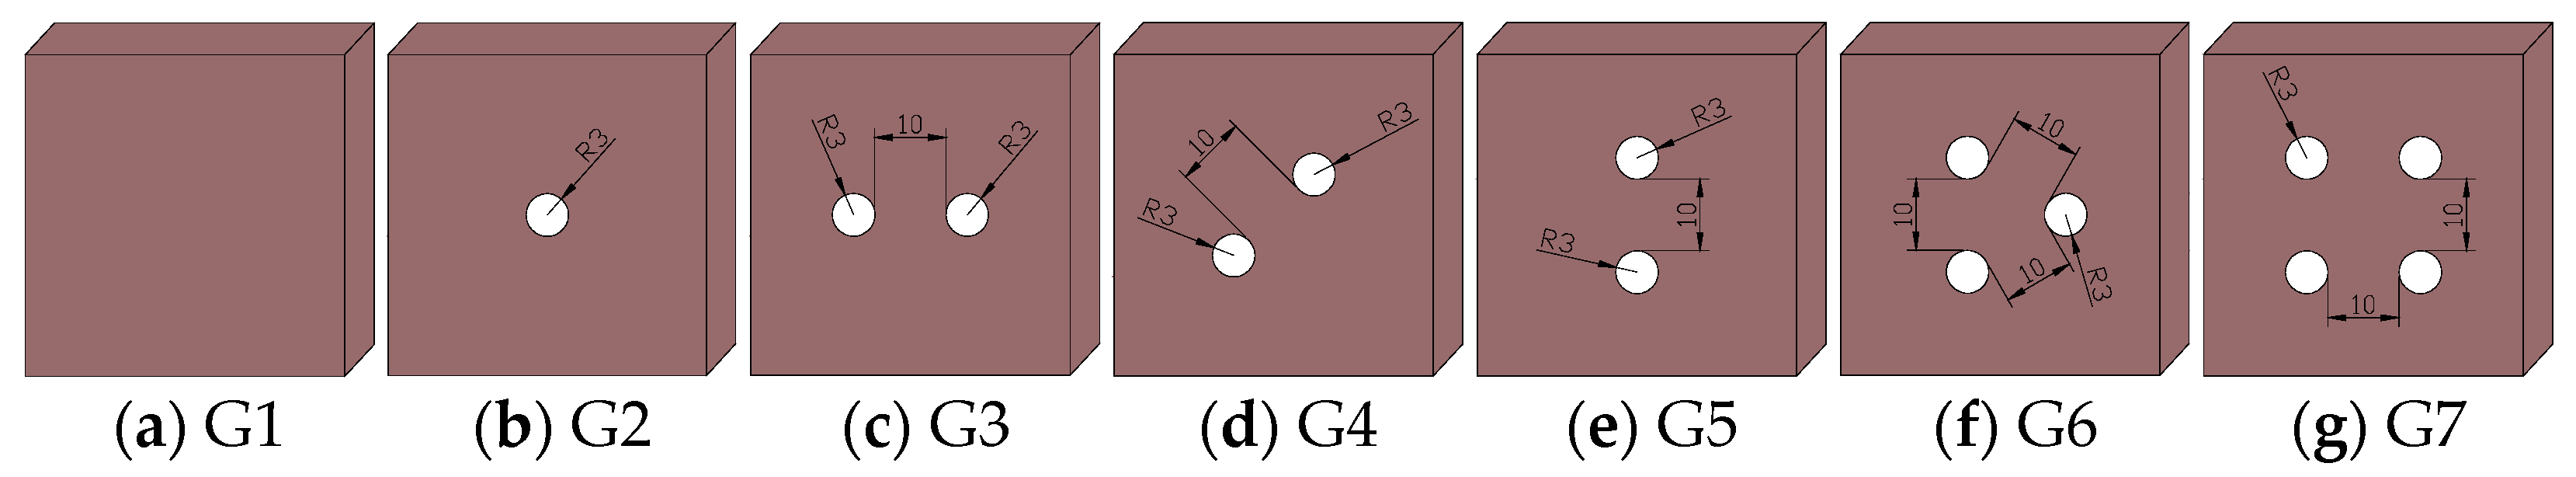
In the study, the purpose is to explore the impacts of the numbers of holes and hole configuration on the mechanical properties along with the fracturing behavior of pre-holed samples subjected to impact loads. Together with a group of intact specimens, 7 classes of specimens were prepared. Note that each class had the 3 same specimens, and the holes in the samples were precisely manufactured using a high-pressure water cutting device. The shape of all of the samples was machined into prismatic to ensure the internal damage could be reflected by the observed surface cracks, and the dimension of all the samples was set to be 45 × 20 × 45 mm (length × width × height). The seven groups of samples are defined as G1, G2, G3, G4, G5, G6 and G7, respectively, representing the intact samples, the samples with one circular opening, the samples with two circular openings arranged horizontally, the samples with two circular holes arranged obliquely, the samples with two circular holes arranged vertically, the specimens with three circular openings and the specimens with four circular holes, as shown in Figure 5. Among them, group G1 was set for reference, while the other groups G2, G3, G6 and G7 were used for studying the effect of hole number. Combing groups G3, G4 and G5, we could explore the hole configuration effect. It is noted that the impact direction was along the horizontal direction, and the radius of all holes and the spacing between holes were 3 mm and 10 mm, respectively.
On basis of the static compressive strength of this kind of specimen and testing experience, the released air pressure of the nitrogen tank was determined as 0.45 MPa. Before the tests, it is necessary to carry out several empty impact tests, that is, not putting the specimen, to verify the feasibility of the stress wave waveform. If there are significant reflected waves during the empty impact tests, we need to adjust the alignment of the bars and the orientation of the strain gauges or the wiring method of the bridge box until the amplitude of the incident stress wave and the transmitted stress wave waveform are fairly the same. Figure 6 demonstrates the stress wave signals and the reliability verification results of the empty impact test after the adjustment of the SHPB system. As can be seen in Figure 6, the stacking curve of the incident and reflected waves is basically consistent with that of the transmitted wave.
4. Results and Analysis of Impact Tests
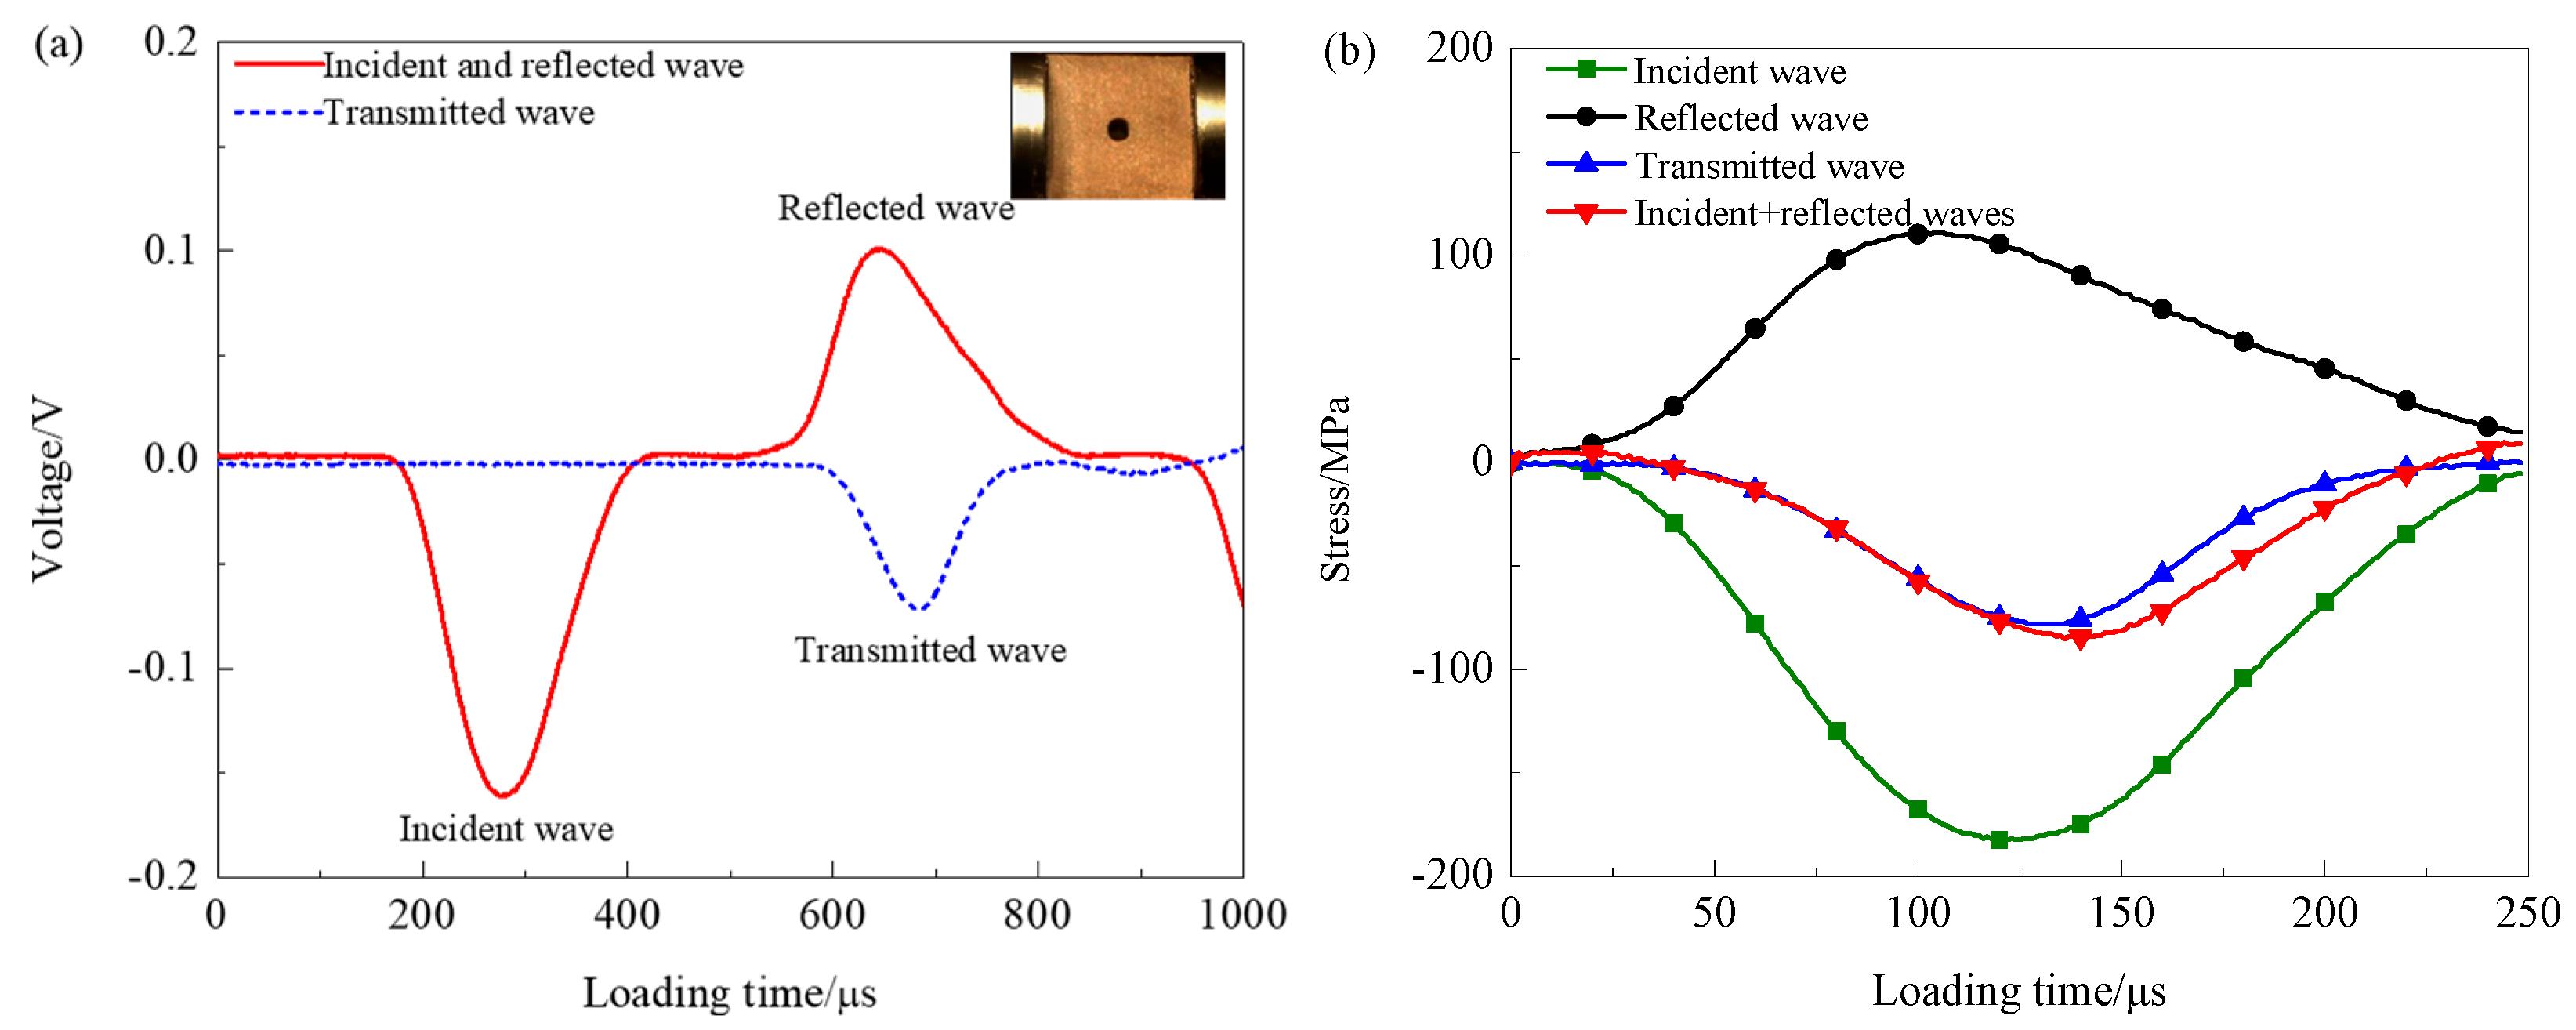
4.1. Stress Uniformity Verification of Prismatic Sample
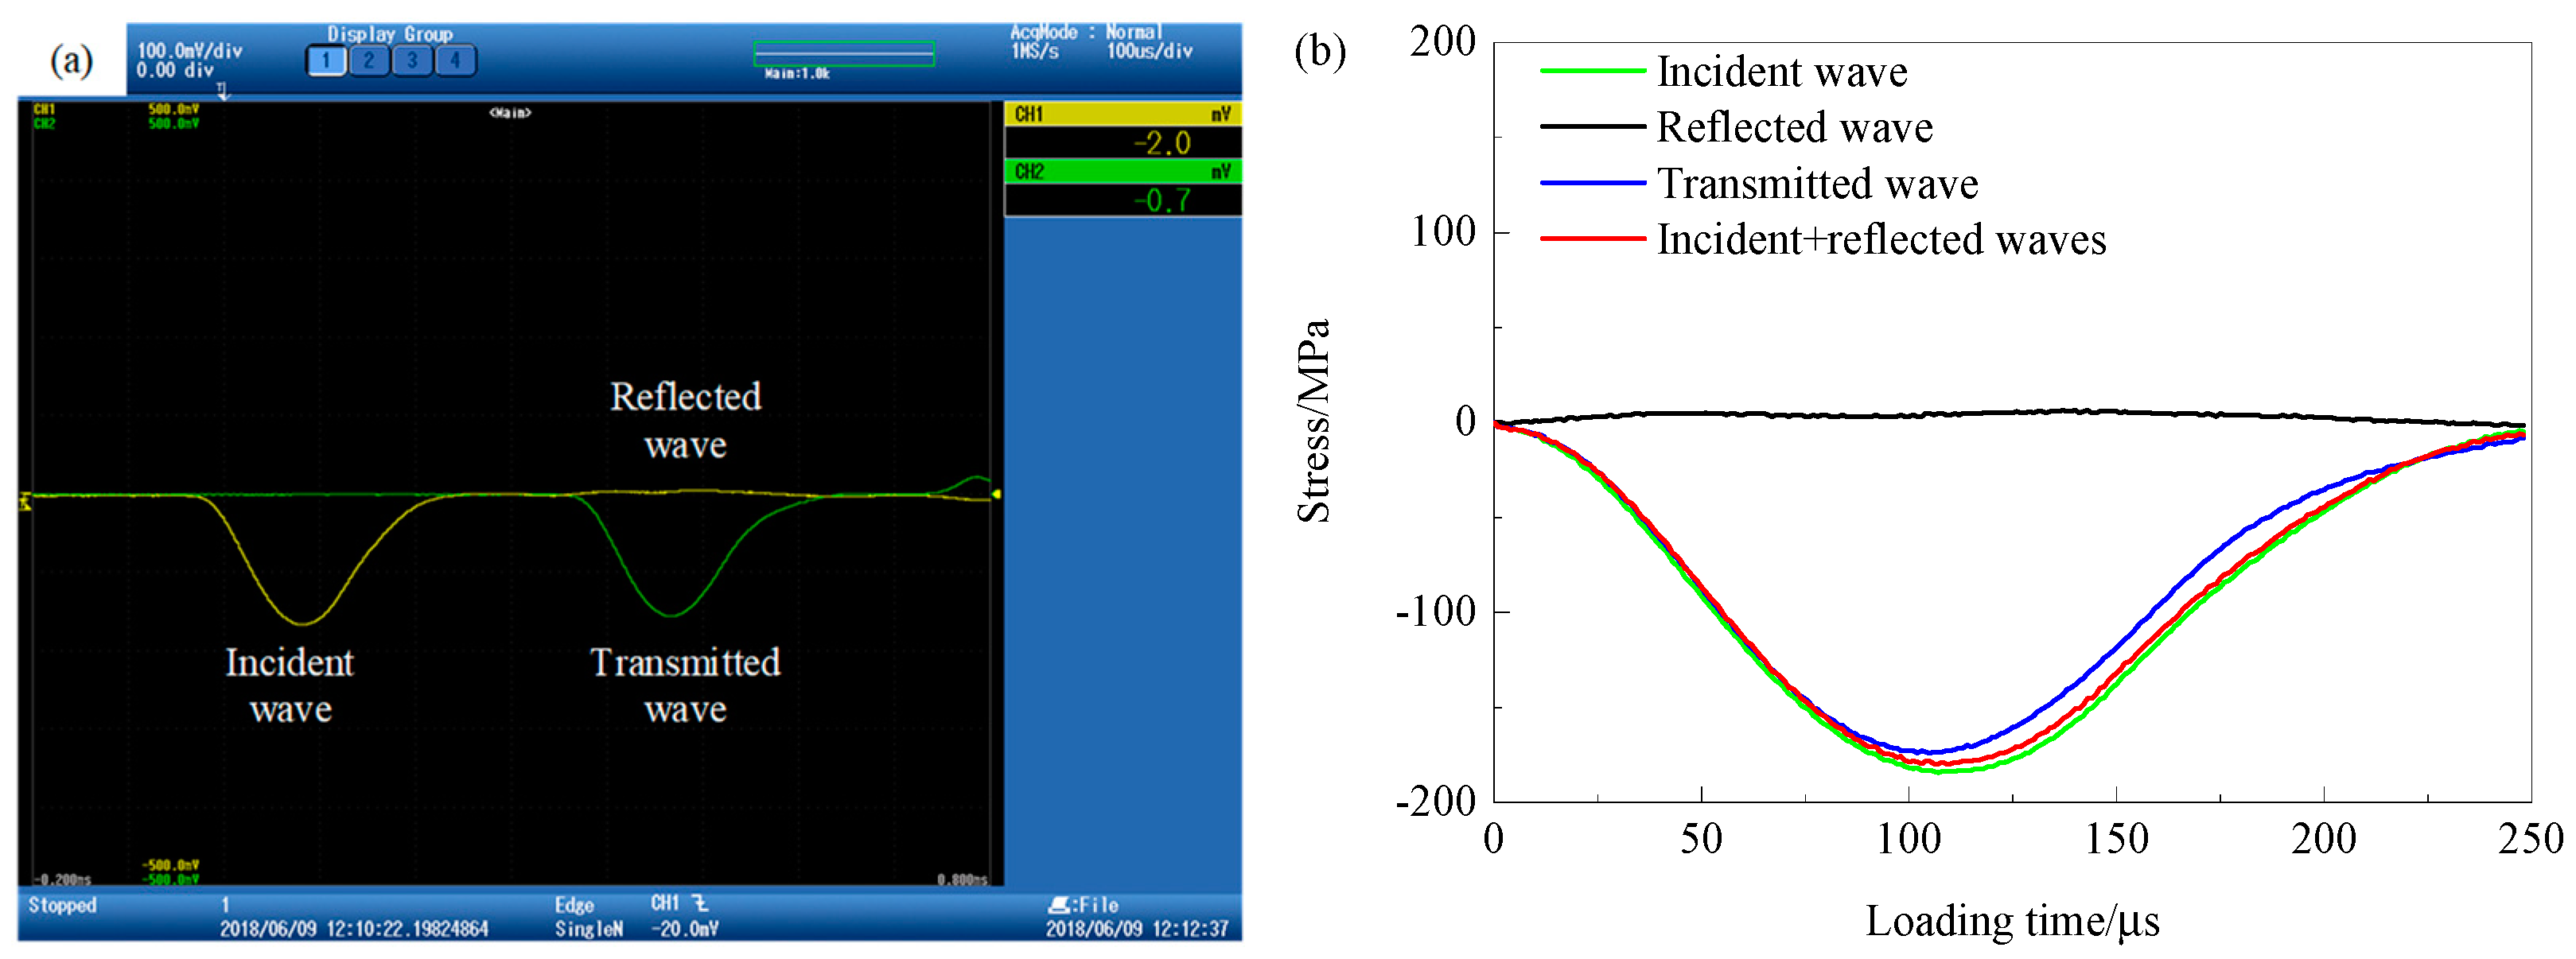
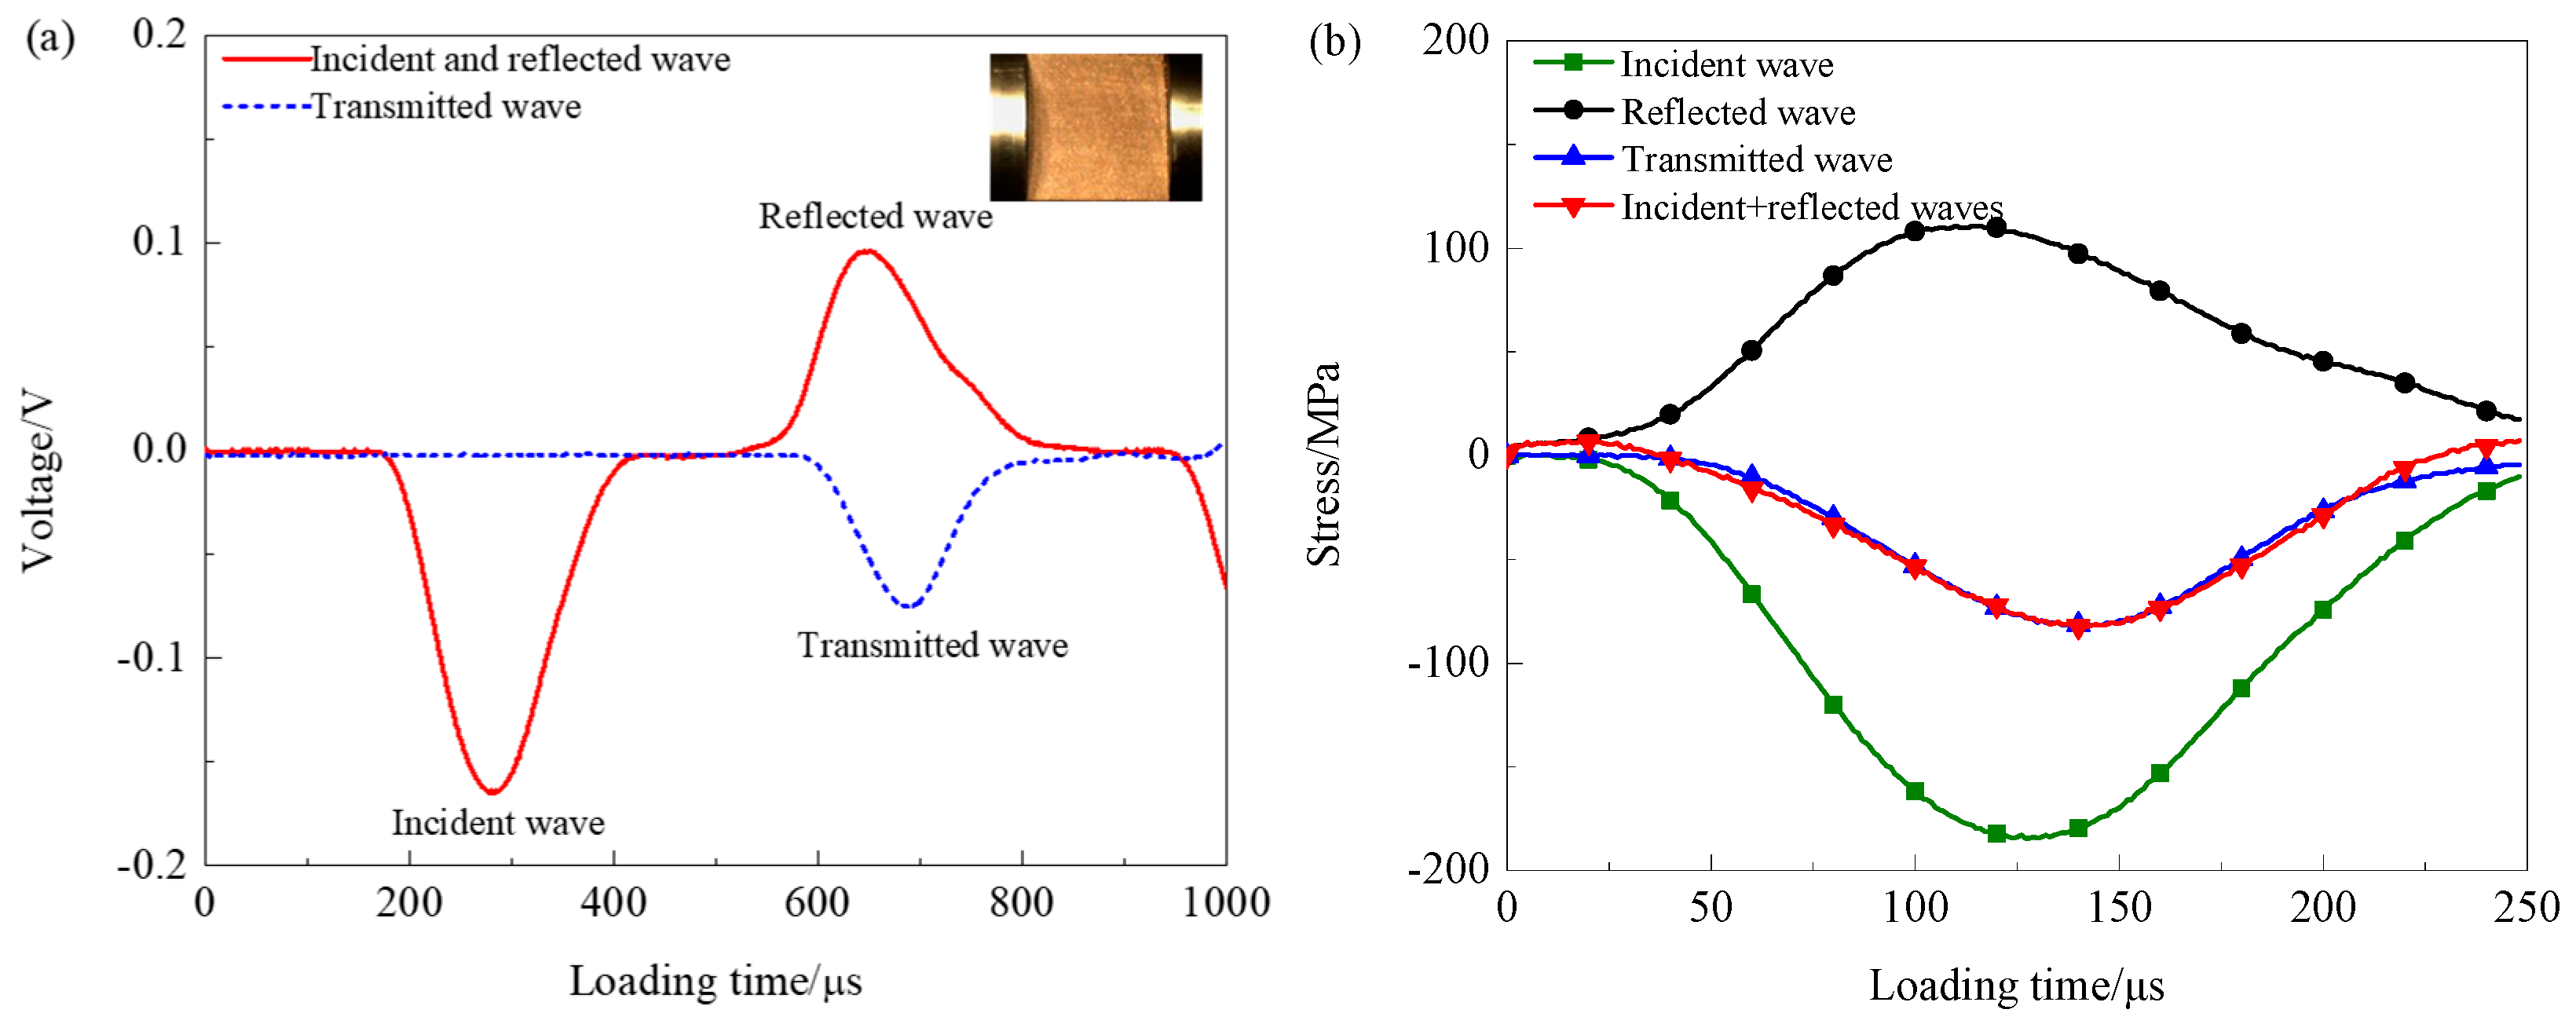
In addition to the condition that the SHPB system must satisfy a one-dimensional stress state, the other experimental principle that must be satisfied is that the dynamic stress and strain distributed in the bars and the specimens must satisfy stress uniformity assumption during the impact tests, that is, the stress distribution on the cross sections of the samples should be uniform. Numerous experimental studies have shown that the cylindrical specimen with the same diameter as that of the bars used for the impact test has been proved to satisfy the stress uniformity assumption [5]. However, it is still not clear whether the prismatic specimens can be used for the SHPB impact test, so we need to check their stress uniformity. In this work, taking the specimen G1-A as an example, the comparison of the transmitted wave curve and the stacking curves of the incident and reflected waves can be plotted based on the wave voltage versus time curve of the specimen, as presented in Figure 7. Clearly, the stacking curve of the incident and the reflected stress wave agree well with the transmitted stress wave, indicating that the stress is balanced and the prismatic specimens are available for impact tests. Similarly, we can also plot the stress balance verification diagrams of the pre-holed specimens when the air pressure is 0.45 MPa. As an example, Figure 8 illustrates the curves of wave voltage versus loading time and the stress-loading time curves of different waves of the specimen G2-A. We find the superimposed amplitude of the incident and reflected waves is larger than the amplitude of the transmitted stress wave, suggesting that the amplitude of the propagating stress wave attenuates when it passes through the opening. Nevertheless, it is observed that the superimposed amplitude of the incident and reflected waves are nearly coincident with the amplitude of the transmitted stress wave before the peak. Thereby, the stress balance condition is satisfied before the peak point. In brief, the processed prismatic samples applied for impact tests satisfy the assumption of stress uniformity.
4.2. Mechanical Performance of Samples under Dynamic Loading
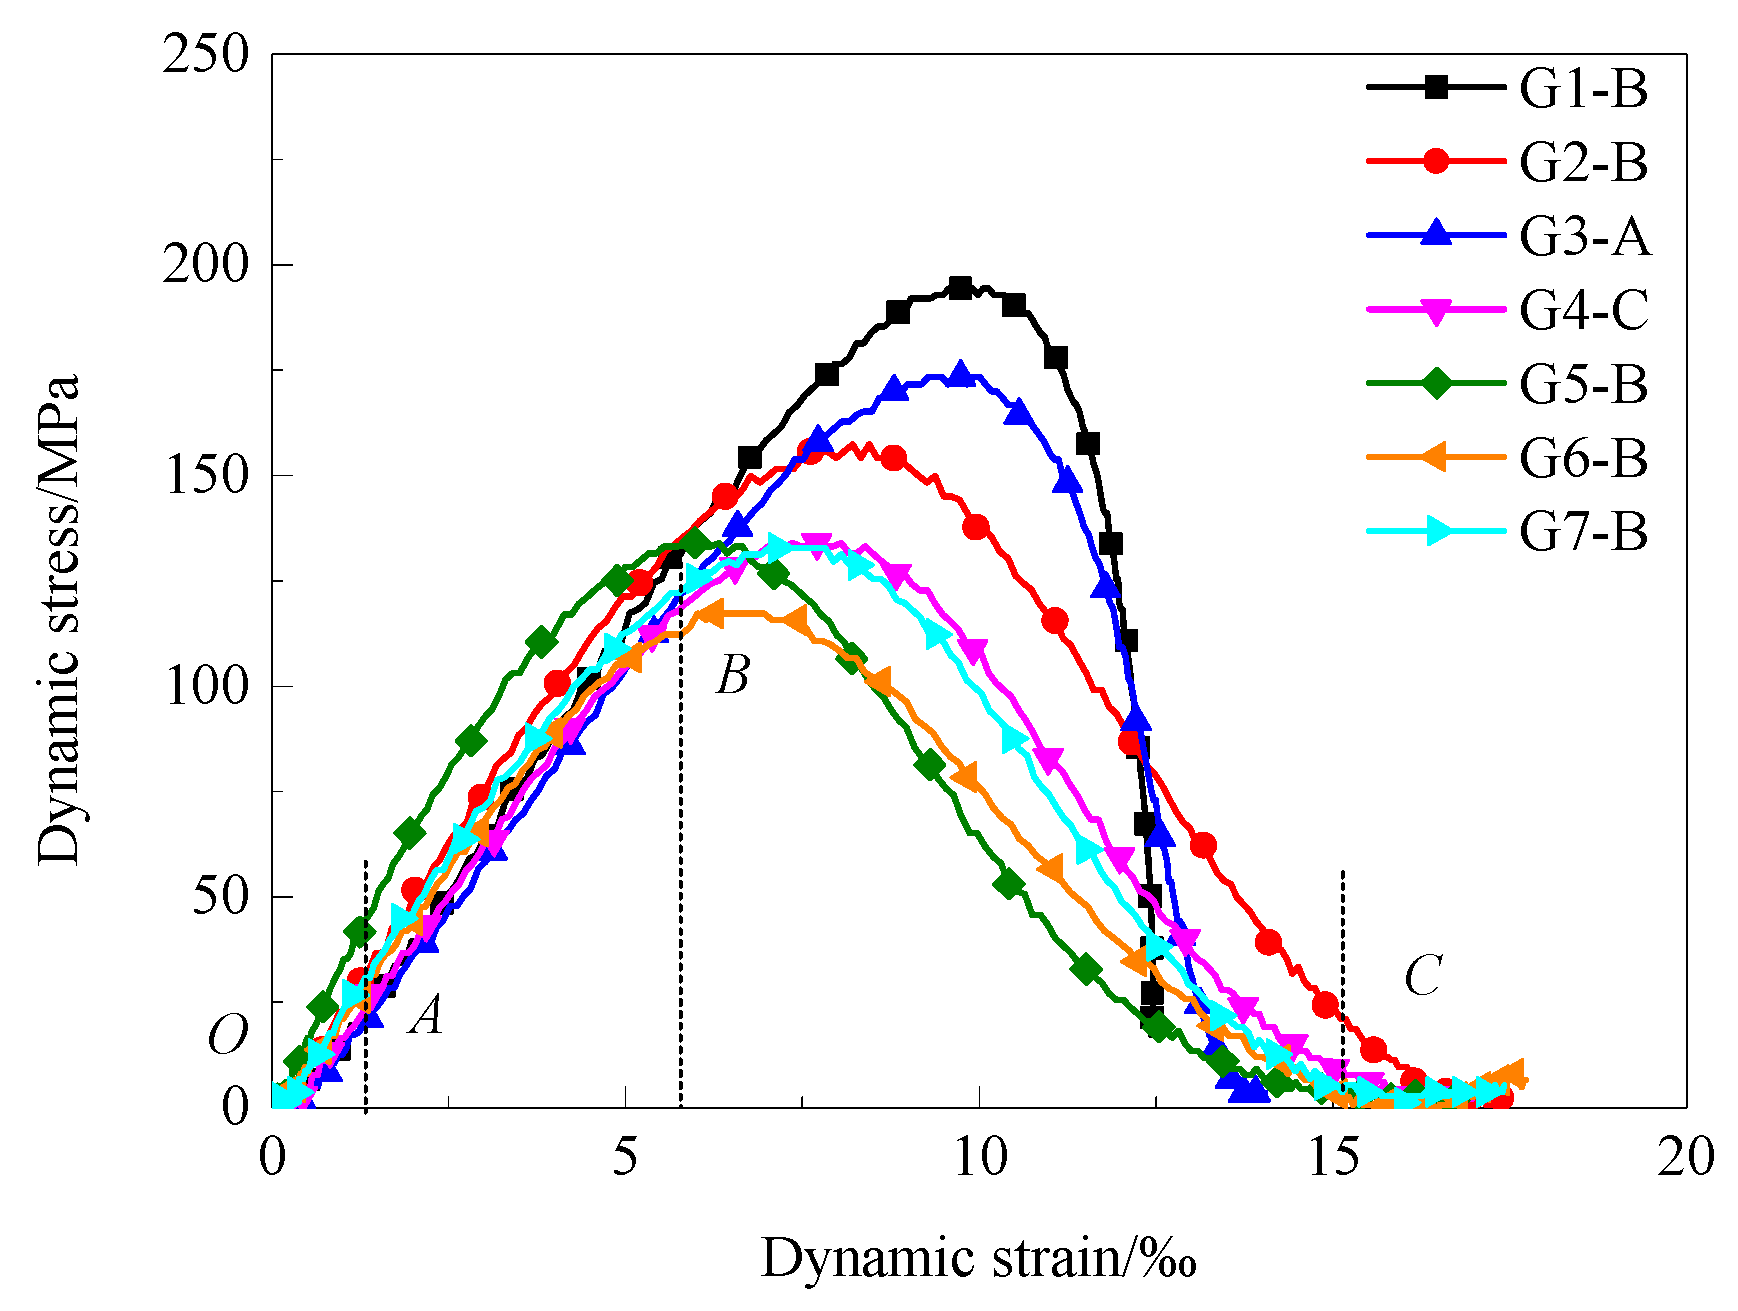
On basis of the wave voltage signals monitored using the strain gauges and dynamic strain meter, the dynamic property parameters such as the incident, reflected and transmitted wave stresses, dynamic compressive strength, dynamic strain and with strain rate could be derived according to Equations (8)–(10). Figure 9 presents the typical dynamic-stress versus dynamic strain curves of the representative specimens for each group. On this basis, we can further calculate the dynamic elastic modulus, namely the tangent modulus of the point at 50% peak on the curve, as listed in Table 2. In addition, to find the law among the groups of specimens, we solved the average property parameters of each group of samples (see Figure 10).
According to Table 2, we can calculate the average dynamic compressive strength of each group of specimens, namely, 186.69 MPa, 161.23 MPa, 165.50 MPa, 133.33 MPa, 137.61 MPa, 110.87 MPa and 126.18 MPa. It can be seen that the dynamic strength of each group of samples is different. Compared with the intact specimens, the dynamic compressive strength of the specimens of G2 to G7 drops by 13.64%, 11.35%, 28.58%, 26.29%, 40.61% and 32.41%, respectively. Apparently, the presence of the prefabricated holes significantly deteriorates the dynamic compressive strength of the rock, and the weakening influence is found to be associated with the quantity and layout of the holes. Among the pre-holed specimens, the strength order of each group of samples is: G3 > G2 > G5 > G4 > G7 > G6. For specimens with one, two, three or four circular holes, the dynamic compressive strength of the specimen basically declines with the rise in the number of holes. However, an interesting thing is that the dynamic compressive strength of the specimen with four holes is higher than that of the specimen with three holes. This is attributed to the interaction of the holes, that is, the right hole on the same level is located in the unloading area of the left hole, so that the concentrated dynamic tensile stress around the hole is relatively small. This deeply explains that the strength of the samples of G3 is greater than that in G2. With regard to the samples with two openings with different configurations, the strength of the sample with double horizontal holes is the highest, followed by the sample with two vertical holes, and finally the sample with two oblique holes. This phenomenon may be related to the distribution of dynamic stress around the holes since the strength change law of samples with holes of different numbers and configurations under uniaxial loading are also the same [33,34].
As can be observed in Figure 9, the dynamic deformation process can be parted into three phases, namely the elastic deformation stage OA, plastic deformation stage AB and the post-peak stage BC. In comparison with the steep post-peak stage of the intact specimens, the slope of the after-peak curve of the pre-holed specimens is small. This indicates that the pre-holed samples present plastic failure at the last stage rather than the brittle failure of the intact specimens. In comparison with the deformation stages of the specimens under uniaxial loading, it is found that the initiation compaction stage of the specimens under impact loads is absent. This is resulted from the strain rate of the samples under impact being very high (51~81 s−1 in this work), that is, the deformation process is so fast that time is short for the initial compaction stage to occur under dynamic loading. According to the dynamic stress versus strain curve, we can solve the elastic modulus of these specimens, as presented in Table 2 and Figure 10. In conclusion, the elastic modulus of the complete samples under impact loads is larger than that of the samples embedded with openings, but it showed no regularity among the samples with holes. The peak strain of the samples also exhibits similar characteristic. In addition, we find that the hit velocity range is 9.83~10.18 m/s, indicating that the reliability of this testing system is very high and the experimental error is very small.
4.3. Energy Dissipation Characteristics of Specimens
Combining Equations (1)–(8), the energy parameters including the incident, reflected energy, transmitted and dissipated energy, and the dissipated energy density of the specimens under dynamic loads could be easily derived. The dissipated energy is applied to prompt the occurrence, development and intersection of fractures in specimens, and the crushing dimension is mainly used to drive the initiation, propagation and coalescence of cracks inside the sample, and the dissipated energy density index could reflect the severity of the damage. The larger the index value, the more energy is absorbed by the specimen, the more violently the specimen is broken and the smaller the fragment of the sample. Table 3 shows the energy index value of each sample suffering from dynamic loads, and we observed that the incident energy of the samples subjected to dynamic loading is between 133.16 J and 145.69 J. Theoretically, the impact velocity and incident energy of each group of specimens at 0.45 MPa nitrogen pressure should be exactly the same. The main causes for the gap in incident energy may be: first, there are some differences in the weight of nitrogen gas filled in the excitation device every time; second, the speed of opening the switch of the excitation device is different, resulting in different speeds of releasing nitrogen; third, the striker was not manually placed in the same position in each experiment.
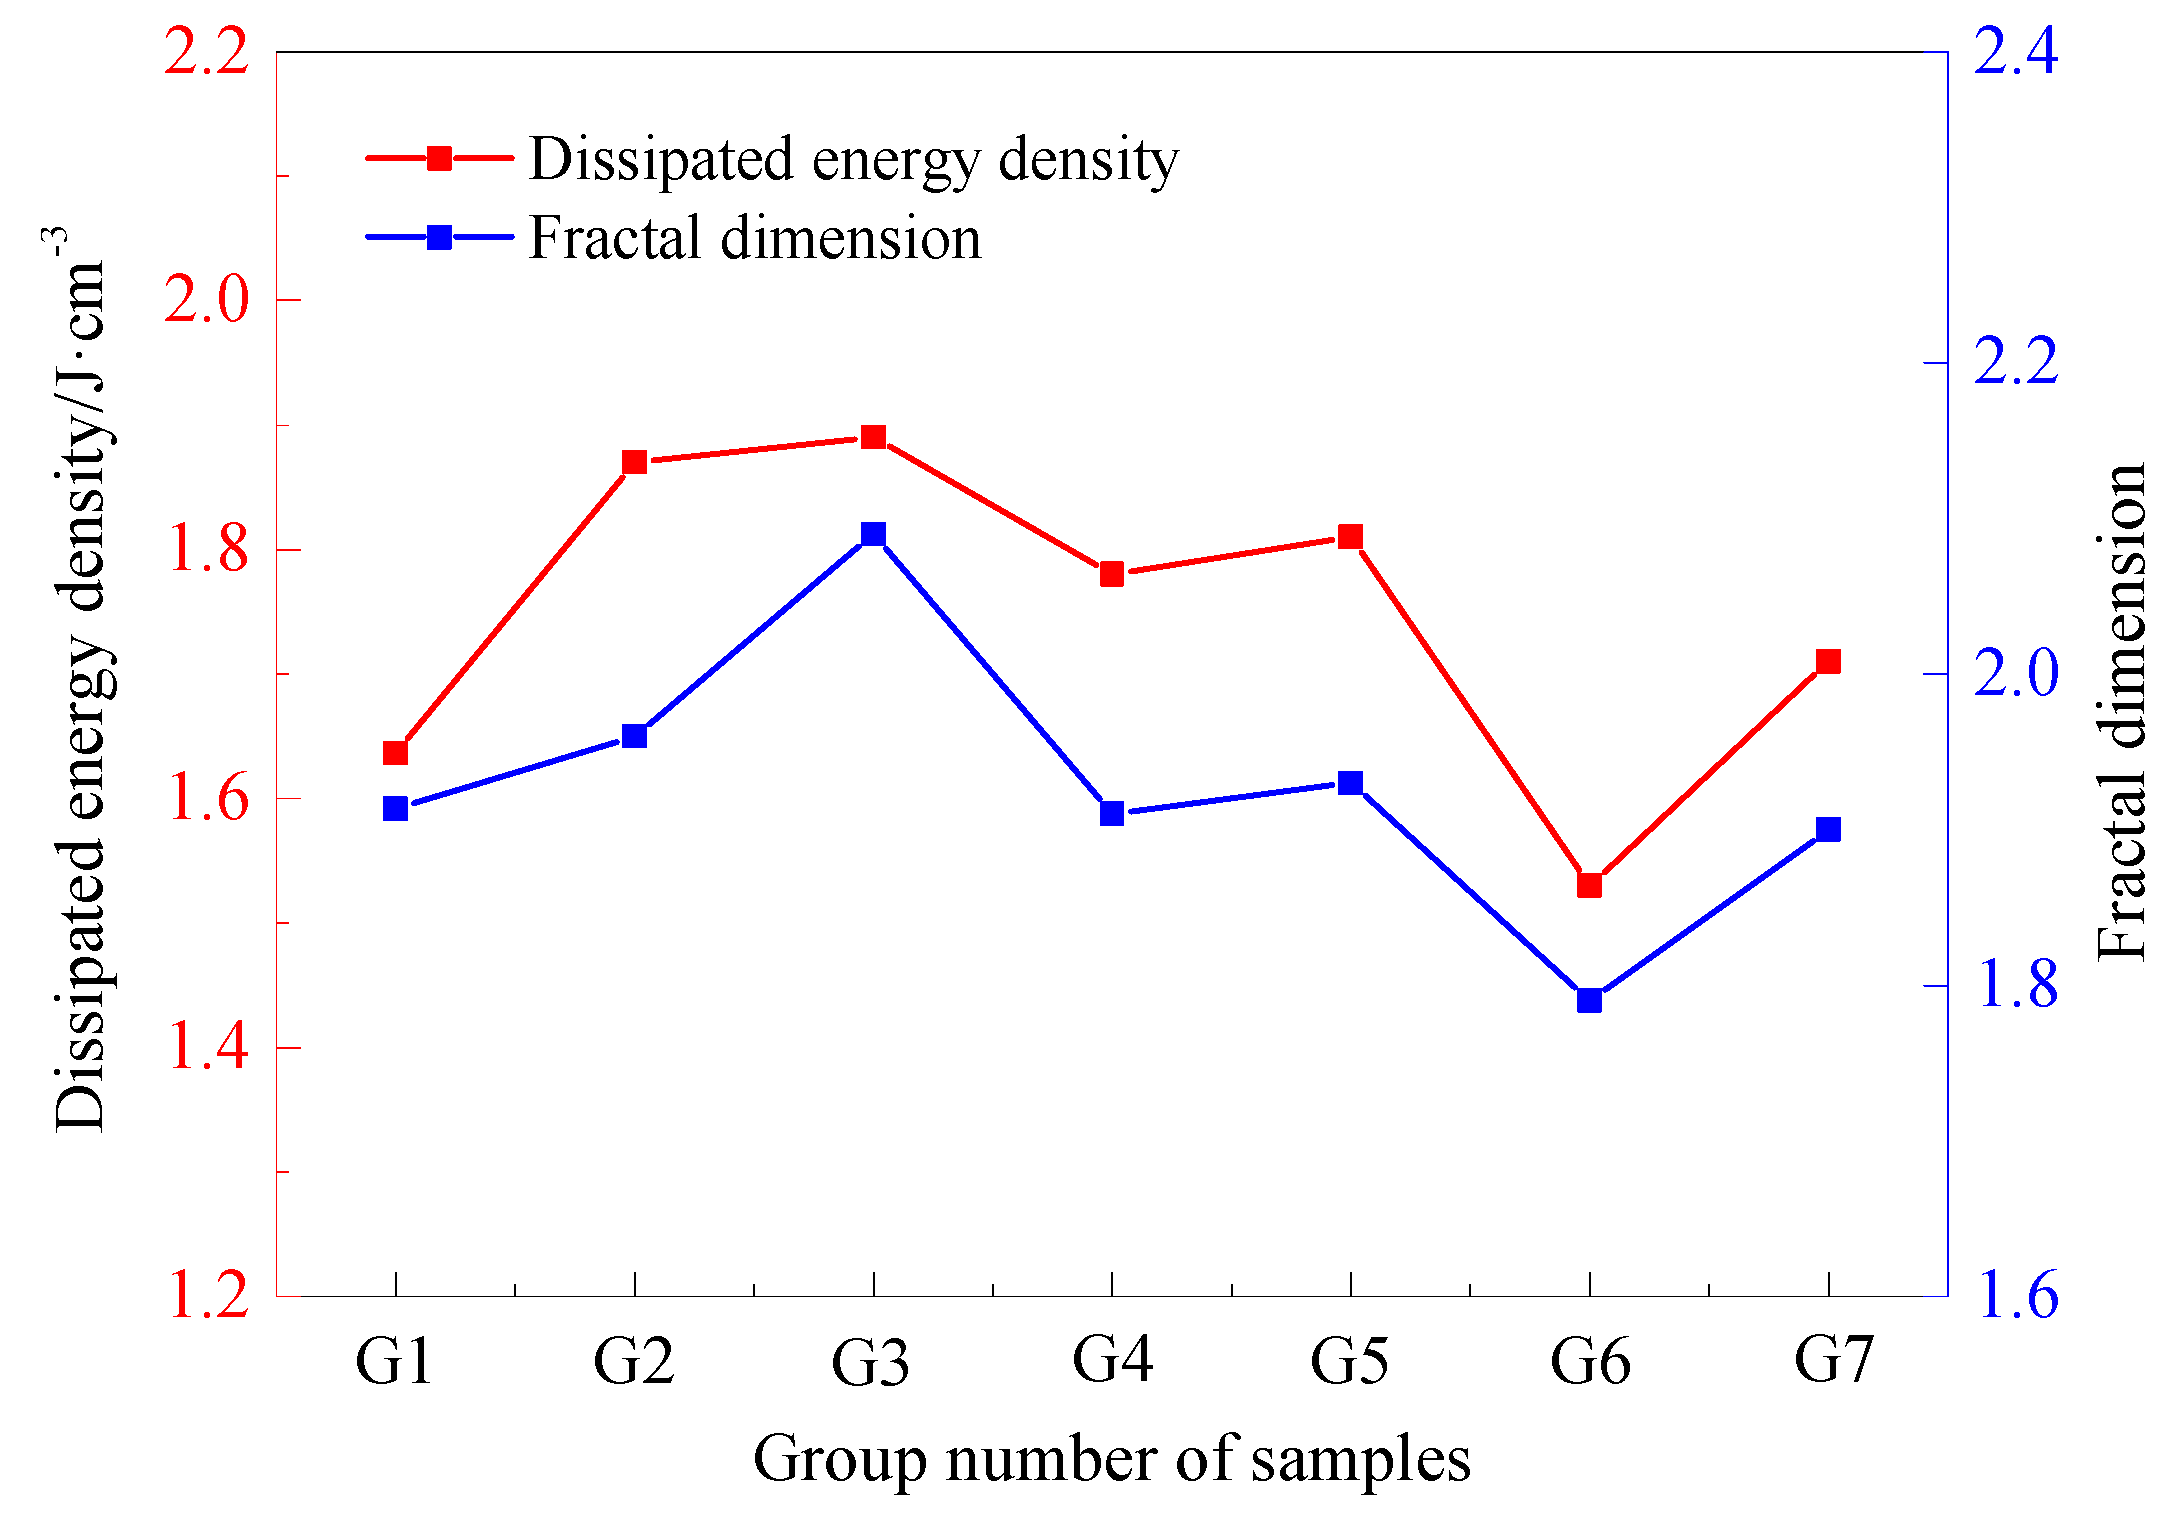
According to Table 3, it is calculated that the average dissipated energy densities of the above specimens are: 1.64 J/cm3, 1.87 J/cm3, 1.89 J/cm3, 1.78 J/cm3, 1.81 J/cm3, 1.53 J/cm3 and 1.71 J/cm3. Apparently, the absorbed energy of the specimen containing three circular holes under impact loads is the smallest, whilst that of the specimen with two circular holes arranged in a horizontal direction is the largest. Compared with the intact specimens, the dissipated energy density of the specimen with holes is basically high. However, for samples with holes, the basic law is that the higher the dynamic compressive strength, the larger the dissipated energy density. Thus, the change law of the dissipated energy density of the rock specimens with holes is completely similar to that of the dynamic compressive strength among the several classes of specimens.
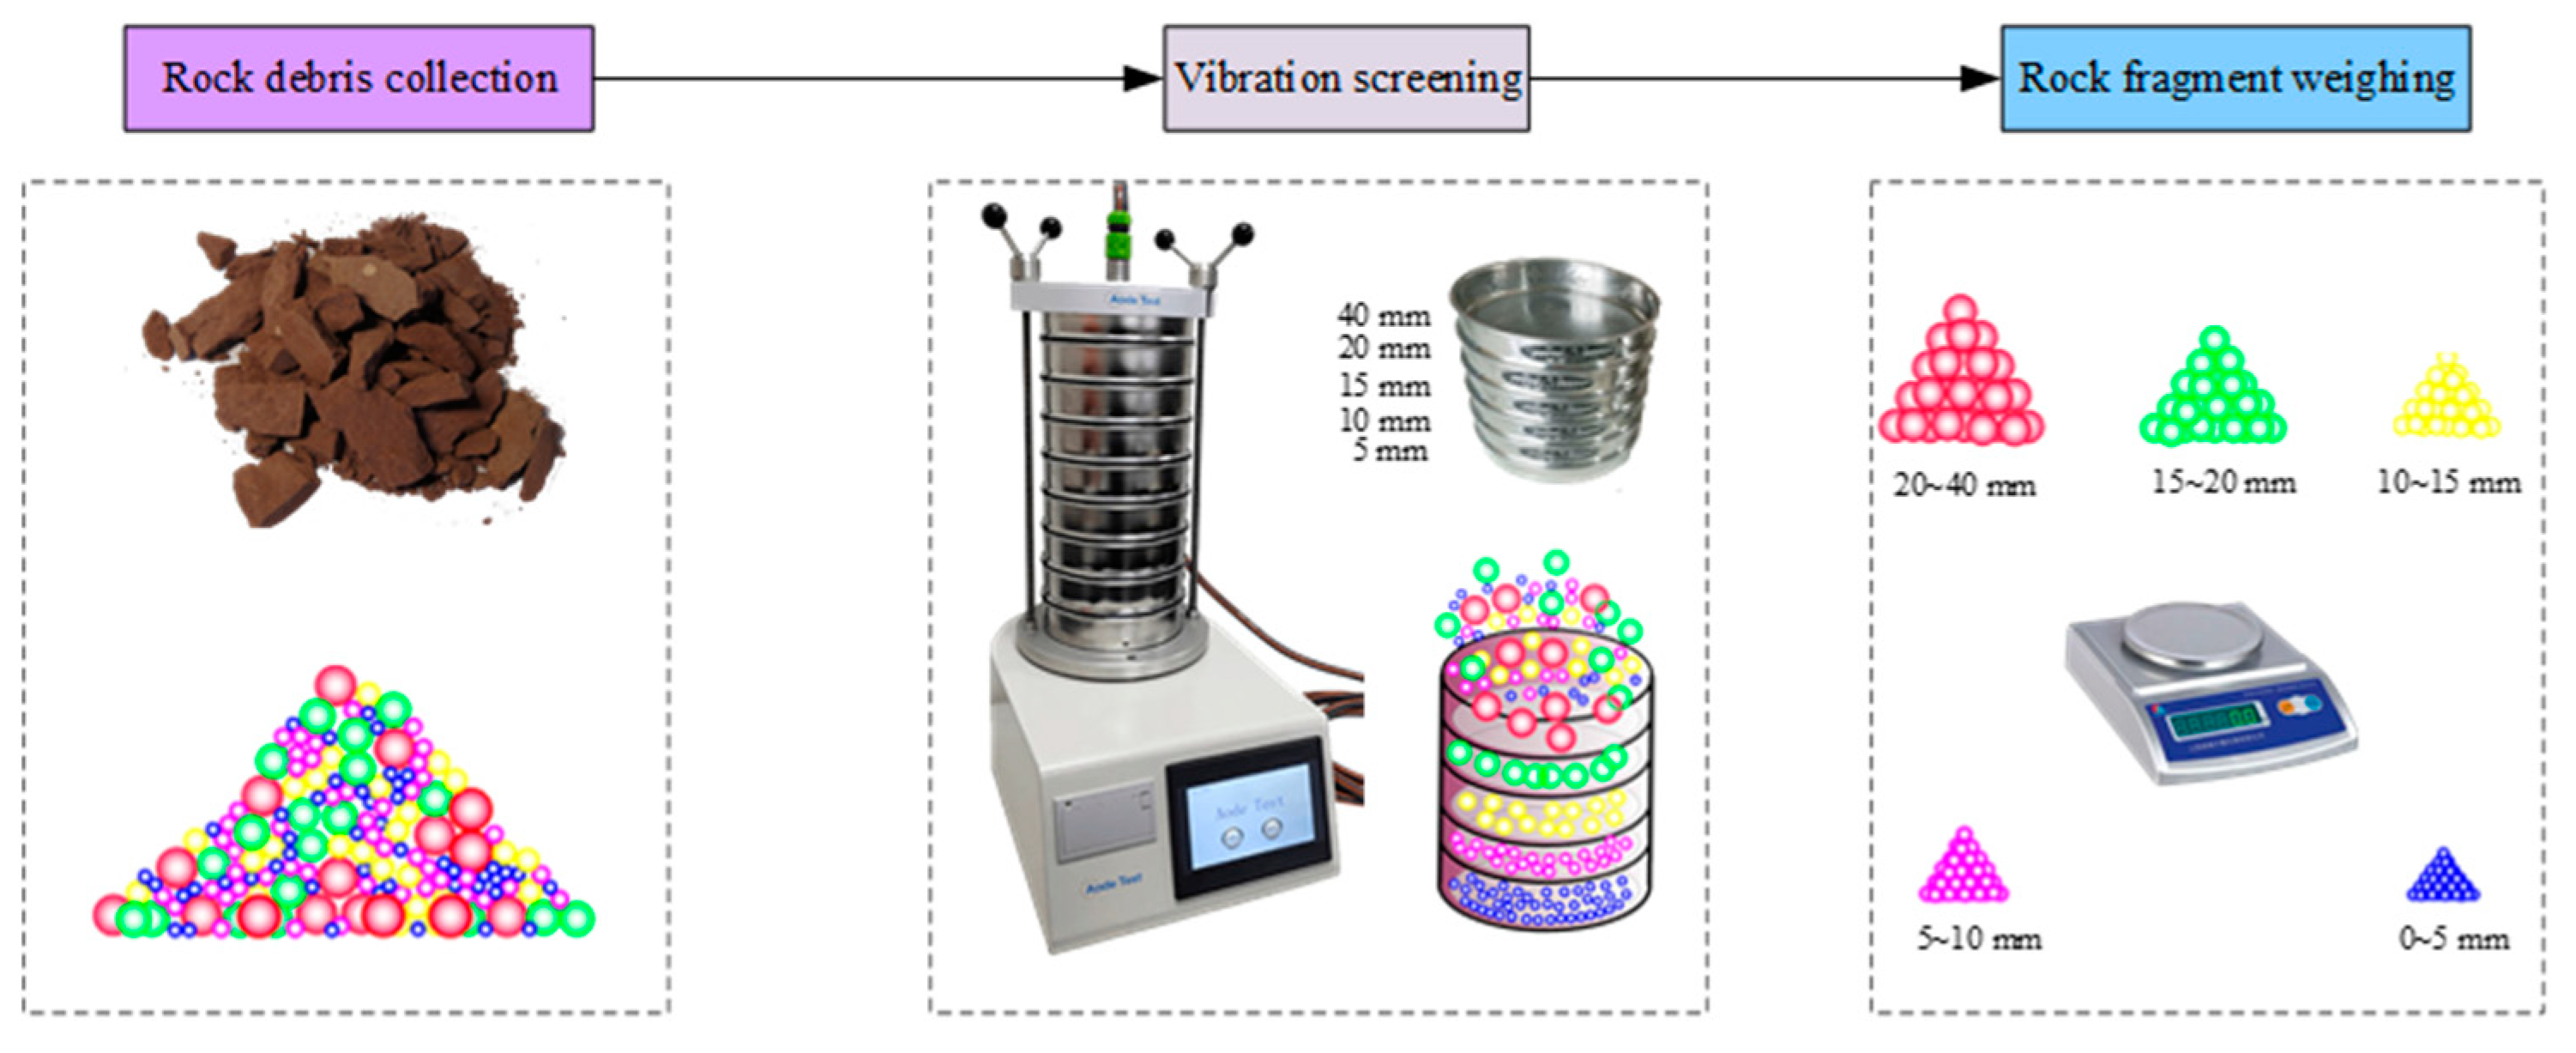
To figure out the failure features of rock samples under dynamic loads, the fractal geometry method was employed to characterize the fragment distribution of the specimens. Generally, the larger the fractal dimension, the more severe the sample fails and the smaller the fragment. As shown in Figure 4, a rock debris collection box was placed on the pedestal to store as much rock debris of the specimen as possible in the tests. In order not to affect the shooting of the industrial camera, openings were left on the front and top surfaces of the box. After the tests, we employed a set of vibrating screens to sieve the rock fragments, as demonstrated in Figure 11. The screening grades included five kinds: 0~5 mm, 5~10 mm, 10~15 mm, 15~20 mm and 20~40 mm. Table 4 lists the cumulative weight of fragments of each sample. Note that md < 5 in Table 4 represents the weight of rock fragments whose size is less than 5 mm, and the meanings of md < 10, md < 15, md < 20 and md < 40 are deduced by analogy. In accordance with the fractal geometry theory, the sample fragment distribution equation can be expressed as [39,40]:
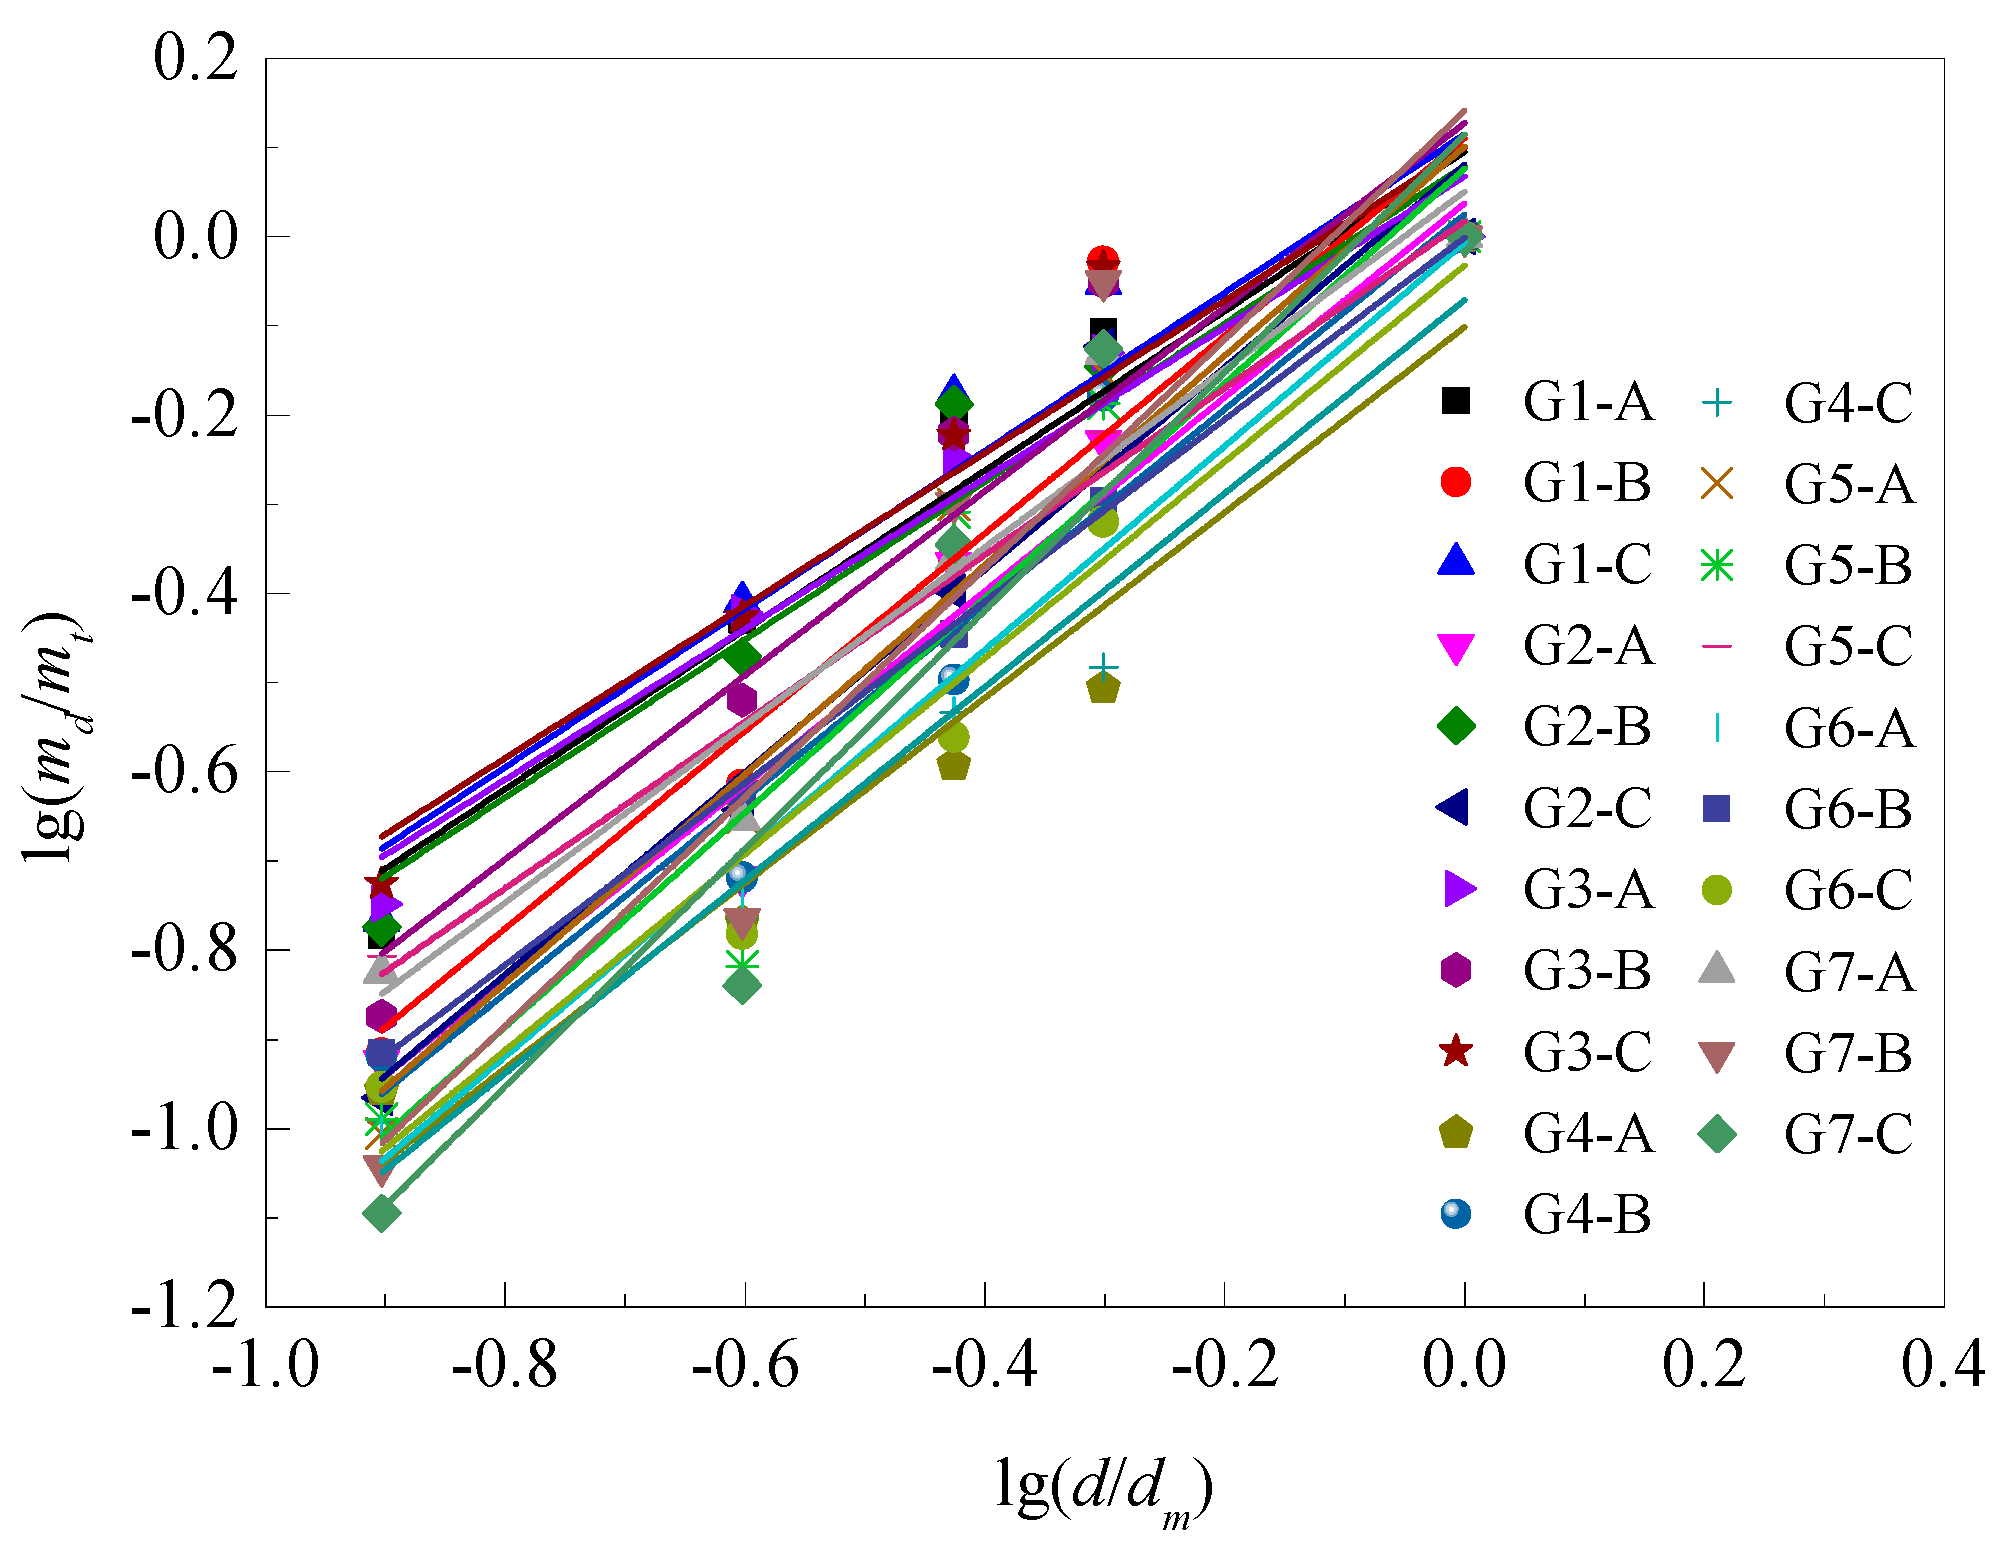
in which d denotes the fragment dimension, dm means the maximum dimension of fragment (40 mm in the study), md represents the cumulative weight of fragment whose dimension is less than d, and mt is the total weight of sample fragment. Further on, D means the fractal dimension of the fragment.
As can be seen in Equation (16), we can obtain the value of (3-D) if we take the logarithm on both sides of Equation (16), that is, (3-D) could be derived as the slope of the fitting line of lg(md/mt) − lg(d/dm). Hence, D could be derived by multi-point linear fitting based on the weight of rock fragments of different grades. The calculation result of the specimen fragment of each sample is presented in Table 4 and Figure 12. In Figure 12, the relation coefficient square R2 of the fitted straight lines of each sample is larger than 0.86, suggesting that the fitting results of every sample are basically satisfactory. The average fractal dimension of the seven classes of specimens is 1.91, 1.96, 2.09, 1.91, 1.93, 1.79 and 1.90, respectively. In comparison with the intact samples, the fractal dimension of the samples with a hole is generally large. In addition, the fractal dimension of the pre-holed specimens is found to be associated with the hole number and hole configuration. It is observed that the fractal dimension of the sample with two circular openings along the horizontal direction is the largest, whilst that of the specimen containing three circular holes is the smallest. With regard to the specimen containing two holes, the order of fractal dimension is G3 > G5 > G4. Moreover, for samples with various numbers of openings, the order of fractal dimension is: G2 > G5 > G7 > G6. Apparently, there is a positive relation between the fractal dimension of the specimens and their dynamic compressive strength. On the other hand, the changing laws of the fractal dimension and dissipated energy density of the samples show a good consistency, as illustrated in Figure 13. In brief, the application of these two indicators for characterizing the degree of rock fragmentation is scientific and reliable.
4.4. Failure Features of Samples under Impact Loading
In the tests, the industrial camera was employed to capture the progressive instability process of the samples under impact loading in real time. According to the captured photos, the dynamic development process of the internal cracks and failure states of the specimens at different loading times were illustrated in Table 5. In Table 5, the marked blue numbers mean the crack types, while the superscript letters on the numbers represent the sequence in which cracks of the same kind occur, and the marked cyan texts denote the acting time. During impact loading, three kinds of cracks appeared in the specimen, that is, tensile cracks (1a~1d), shear cracks (2a~2e) and spalling cracks (2a~2b, as shown by the arrow).
As can be seen in Table 5, the dynamic failure process of the intact specimen G1-B under impact loads is clearly displayed. As the loading time increases, a tensile crack 1a on the top location propagating along the horizontal direction and a shear crack 1b initiated from the lower-right corner of the specimen are found at the time of 2172 μs. When the loading time reaches 2200 μs, the other two tensile cracks 1b and 1c occur at the right and left ends, respectively, and propagate towards the other end. At the loading time of 2269 μs, the fourth tensile crack 1d is emanated from the left end and the second shear crack 1b emerges in the middle of the specimen. At this moment, it is observed that the tensile cracks 1a and 1b have penetrated the sample. Eventually, the tensile crack1c also propagates from the left end of the specimen to the right end, but the shear cracks 2a and 2b and the tensile crack 1d do not penetrate the specimen when the failure occurs. This indicates that they do not play a leading role in the failure of the sample. Apparently, the failure of the intact specimen is dominated by the three tensile cracks 1a~1c propagating horizontally, that is, the failure type can be classified as tensile failure.
For the specimen with one single circular hole, it is observed that rock debris (spalling crack 3) eject from the top and bottom sidewalls of the hole at the beginning of loading. Afterward, three shear cracks 2a~2c on the diagonals of the specimen occur when the loading time is 2039 μs. With the rise in the loading time, the shear cracks propagate diagonally towards the hole. At the moment of 2066 μs, another two shear cracks 2d and 2e emerge at the lower-right corner of the specimen. When the loading time 2146 μs is approached, the four shear cracks (2a, 2b, 2c, 2e) are coalesced with the hole, leading to the failure of the specimen. However, the shear crack 2d coalesces with the shear crack 2e, but it does not propagate to the right end. To conclude, the failure mode of the specimen G2-C can be attributed to shear failure.
In respect of the specimen G3-C, we can find that the spalling cracks occur violently at the initial moment of loading. At the loading time of 2478 μs, a near-horizontal tensile crack 1a develops between the two holes. At the same time, three shear cracks 2a~2c initiate and grow along the specimen diagonals. When the loading time reaches 2506 μs, the two holes are penetrated by the two horizontal tensile cracks 1a and 1b between them, and the shear cracks 2b and 2c intersect with the right hole and the left hole, respectively. Meanwhile, a tensile crack 1c at the bottom of the sample propagates horizontally from left to right. Finally, the tensile crack 1c reaches to the right end, and the shear crack 2a coalesces with the shear crack 2b. Obviously, we can classify the failure pattern of the specimen G3-C as tensile-shear failure. In contrast, the failure state of the specimen containing two circular holes arranged obliquely is similar to that of the specimens G2-C and G3-C at the start of dynamic loading. As the loading time rises, one shear crack 2a appears between the two holes and intersects them. After that, the other four shear cracks 2b~2e occur on the diagonals of the specimen at the moment of 2436 μs. Finally, the shear cracks 2d and 2c penetrate the hole in the upper-right corner of the sample, while the shear crack 2b penetrates the hole in the lower-left corner of the sample and intersects with the shear crack 2e. Thus, the failure mode of the specimen is shear-dominated failure. For the specimen with two holes arranged in a vertical direction, the initial fracture process is similar to that of the above samples with openings. In other words, the spalling cracks occur first, and then the shear cracks along the diagonals of the specimen develop towards the holes. The difference is that the rock bridge between the two cavities is not penetrated by a tensile or shear crack directly. Instead, it is seen that the upper hole in specimen G5-B is coalesced by the shear cracks 2b, 2c and 2e, whilst the lower hole is intersected by the shear cracks 2a and 2d. The coalescence of the two holes is through the connection of the two shear cracks 2c and 2d. In addition, a horizontal tensile crack 1a is found propagating from the left end to the right end of the specimen. In a word, the failure mode of the specimen can be treated as tensile-shear failure.
With regard to the sample containing three holes, it is observed that spalling cracks appear first at the roofs and floors of the holes, and then the hole in the upper-left corner of the sample and the hole in the lower-left corner of the sample are, respectively, connected with the right hole in the sample through two shear cracks 2a and 2b. Subsequently, the shear cracks 2d and 2c generated on the diagonals of the sample intersect with the left two holes in the sample, respectively. In the meantime, a tensile crack 1a extends from the right sidewall of the hole to the right end of the specimen. The specimen fails once the tensile crack 1a reaches the right end. Therefore, the failure type of the specimen could be regarded as tensile-shear failure. In terms of the specimen with four holes, the failure behavior is complex. Spalling cracks emerge first on the top and bottom locations of each hole. At the moment of 1964 μs, tensile cracks 1a and 1b appear between the horizontal holes, and three shear cracks 2a~2c appear on the diagonals. Further on, the upper two horizontal holes are fully connected by two tensile cracks 1a and 1c, and the lower two horizontal holes are fully connected by two tensile cracks 1b and 1d. At this moment, two shear cracks 2a and 2d are connected to the tensile crack 1a, while the other two shear cracks 2b and 2c are found to be connected to the tensile crack 1b. Finally, there is also a tensile crack 1e generated in the middle of the sample, which propagates from the left end to the right end of the sample. In short, the failure mode could be categorized as tensile-shear failure.
From the above description, we found that the failure process of the specimens is quite fast. There are three kinds of cracks that occurred around the holes, namely spalling cracks, tensile cracks and shear cracks. Concerning the failure modes of these kinds of specimens, they can be summarized as follows: the samples of group G1 exhibit split tensile failure, the samples of groups G2 and G4 present shear failure, and the samples of groups G3, G5, G6 and G7 all suffered from tensile-shear failure. Consequently, the failure behaviors of the specimens highly relied on the opening number and opening layout. When the impact direction was horizontal, tensile cracks appeared between two horizontally arranged holes, shear cracks appeared between two inclined holes, but no direct cracks occurred between two vertical holes. With regard to the violent occurrence of spalling cracks, it is very similar to rock burst in deep hard-rock tunnel. Therefore, the fracturing characteristics of the specimens with different layouts could provide some useful guidance for the understanding of tunnel instability mechanisms and the prevention and control of rock dynamic disasters.
5. Conclusions
Given the dynamic load effect of mechanical impact and explosive blasting on surrounding rock during the excavation of underground openings in rock engineering, a number of impact tests were carried out using the SHPB testing system on seven groups of prismatic specimens (including one group of intact samples and six groups of rock samples containing holes with different numbers and layouts) in this work to explore the dynamic mechanical properties and failure behavior. In the tests, the influence of hole quantity and hole layout was deeply explored and discussed, and some conclusions could be refined as follows.
- (1)
- A series of tests on rock chemical composition, microstructure and basic physical-mechanical parameters indicate that this kind of rock can be graded as tuffaceous–feldspar–quartz sandstone which has a fine–medium sand texture and a blocky structure, and belongs to medium-strength brittle rock.
- (2)
- The prismatic specimens applied for dynamic experiments using SHPB device meet the stress uniformity assumption, and the stress waves attenuate when encountering holes. The dynamic compressive strength of the specimens is significantly deteriorated by the opening number and layout. The dynamic deformation process of the samples containing holes under impact loads could be parted into three phases: the elastic deformation phase, plastic deformation phase and the post peak phase. However, no regularity was found in the dynamic elastic modulus and peak strain of the pre-holed samples.
- (3)
- The dissipated energy densities and the dynamic compressive strength of several groups of samples showed the same change rule. The size order of the sample fragmentation can be listed as G3 < G2 < G5 < G4 < G7 < G6, which is consistent with the result derived from employing fractal dimensions to describe the rock fragmentation. In addition, the dynamic fracturing process of the sample with openings could be clearly captured with a high-speed camera, and it was found that there are three sorts of cracks, namely spalling cracks, shear cracks and tensile cracks, which formed around the holes during the tests. The samples of groups G2 and G4 suffered from shear-dominated failure, while the samples of groups G3, G5, G6 and G7 presented tensile-shear failure, suggesting that the fracturing behaviors are highly related to the opening configuration.
Author Contributions
Conceptualization, H.W. and Y.J.; methodology, H.W.; validation, Y.J.; investigation, H.W.; resources, Y.J.; writing—original draft preparation, H.W.; writing—review and editing, Y.J.; supervision, Y.J.; funding acquisition, H.W. All authors have read and agreed to the published version of the manuscript.
Funding
This study was jointly granted by the National Key R&D Program of China (2022YFC2905600), National Natural Science Foundation of China (52204160), the Natural Science Foundation of Jiangsu Province (BK20210515), the China Postdoctoral Science Foundation (2022MD713814, 2023T160555) and the Foundation of Hubei Key Laboratory of Blasting Engineering (No. BL2021-10). Additionally, the support from the Yunnan Postdoctoral Science Foundation and the “Double Innovation Plan (JSSCBS20221519)” of Jiangsu Province are also greatly appreciated.
Data Availability Statement
The original contributions presented in the study are included in the article, further inquiries can be directed to the corresponding author.
Acknowledgments
Authors thank to Shujian Li, Bin Zhang and Yinghui Liu for their contribution to this article.
Conflicts of Interest
Author Hao Wu was employed by the company Yunnan Phosphate Chemical Group Co., Ltd. The remaining author declare that the research was conducted in the absence of any commercial or financial relationships that could be construed as a potential conflict of interest.
References
- Singh, M.; Rao, K.S.; Ramamurthy, T. Strength and deformational behaviour of a jointed rock mass. Rock Mech. Rock Eng. 2002, 35, 45–64. [Google Scholar] [CrossRef]
- Jade, S.; Sitharam, T.G. Characterization of strength and deformation of jointed rock mass based on statistical analysis. Int. J. Geomech. 2003, 3, 43–54. [Google Scholar] [CrossRef]
- Cao, R.H.; Cao, P.; Lin, H.; Fan, X.; Zhang, C.Y.; Liu, T.Y. Crack initiation, propagation, and failure characteristics of jointed rock or rock-like specimens: A review. Adv. Civ. Eng. 2019, 2019, 6975751. [Google Scholar] [CrossRef]
- Wu, H.; Kulatilake, P.; Zhao, G.Y.; Liang, W.Z. Stress distribution and fracture evolution around a trapezoidal cavity in sandstone loaded in compression. Theor. Appl. Fract. Mech. 2019, 104, 102348. [Google Scholar] [CrossRef]
- Wu, H.; Dai, B.; Cheng, L.; Lu, R.; Zhao, G.Y.; Liang, W.Z. Experimental study of dynamic mechanical response and energy dissipation of rock having a circular opening under impact loading. Min. Metall. Explor. 2021, 38, 1111–1124. [Google Scholar] [CrossRef]
- Hoek, E. Rock Fracture under Static Stress Conditions. Ph.D. Dissertation, The Faculty of Engineering, University of Cape Town, Cape Town, South Africa, 1965. [Google Scholar]
- Kobayashi, A.S.; Johnson, B.; Wade, B.G. Crack approaching a hole. Fract. Anal. 1974, 560, 53–68. [Google Scholar]
- Gay, N.C. Fracture growth around openings in large blocks of rock subjected to uniaxial and biaxial compression. Int. J. Rock Mech. Min. Sci. 1976, 13, 231–243. [Google Scholar] [CrossRef]
- Lajtai, E.Z.; Carter, B.J.; Duncan, E.J.S. Mapping the state of fracture around cavities. Eng. Geol. 1991, 31, 277–289. [Google Scholar] [CrossRef]
- Wong, R.H.C.; Lin, P.; Tang, C.A. Experimental and numerical study on splitting failure of brittle solids containing single pore under uniaxial compression. Mech. Mater. 2006, 38, 142–159. [Google Scholar] [CrossRef]
- Sammis, C.G.; Ashby, M.F. The failure of brittle porous solids under compressive stress states. Acta Metall. 1986, 34, 511–526. [Google Scholar] [CrossRef]
- Li, D.Y.; Zhu, Q.Q.; Zhou, Z.L.; Li, X.B.; Ranjith, P.J. Fracture analysis of marble specimens with a hole under uniaxial compression by digital image correlation. Eng. Fract. Mech. 2017, 183, 109–124. [Google Scholar] [CrossRef]
- Zhu, W.C.; Liu, J.S.; Tang, C.A.; Zhao, X.D.; Brady, B.H. Simulation of progressive fracturing processes around underground excavations under biaxial compression. Tunn. Undergr. Space Technol. 2005, 20, 231–247. [Google Scholar] [CrossRef]
- Zeng, W.; Yang, S.Q.; Tian, W.L. Experimental and numerical investigation of brittle sandstone specimens containing different shapes of holes under uniaxial compression. Eng. Fract. Mech. 2018, 200, 430–450. [Google Scholar] [CrossRef]
- Wu, H.; Fan, A.Q.; Ma, D.; Spearing, A.J.S.; Zheng, Z. Fracturing process and initiation mechanism of hard rock tunnels with different shapes: Particle flow modeling and analytical study. Comput. Part. Mech. 2023, 10, 1859–1875. [Google Scholar] [CrossRef]
- Aker, E.; Kühn, D.; Vavryčuk, V.; Soldal, M.; Oye, V. Experimental investigation of acoustic emissions and their moment tensors in rock during failure. Int. J. Rock Mech. Min. Sci. 2014, 70, 286–295. [Google Scholar] [CrossRef]
- Zhang, S.R.; Sun, B.; Wang, C.; Yan, L. Influence of intermediate principal stress on failure mechanism of hard rock with a pre-existing circular opening. J. Cent. South Univ. 2014, 21, 1571–1582. [Google Scholar] [CrossRef]
- Van De Steen, B.; Vervoort, A.; Napier, J.A.L. Observed and simulated fracture pattern in diametrically loaded discs of rock material. Int. J. Fract. 2005, 131, 35–52. [Google Scholar] [CrossRef]
- Tao, M.; Zhao, R.; Du, K.; Cao, W.Z.; Li, Z.W. Dynamic stress concentration and failure characteristics around elliptical cavity subjected to impact loading. Int. J. Solids Struct. 2020, 191–192, 401–417. [Google Scholar] [CrossRef]
- Li, Y.H.; Peng, J.Y.; Zhang, F.P.; Qiu, Z.G. Cracking behavior and mechanism of sandstone containing a pre-cut hole under combined static and dynamic loading. Eng. Geol. 2016, 213, 64–73. [Google Scholar] [CrossRef]
- Tao, M.; Ma, A.; Cao, W.Z.; Li, X.B.; Gong, F.Q. Dynamic response of pre-stressed rock with a circular cavity subject to transient loading. Int. J. Rock Mech. Min. Sci. 2017, 99, 1–8. [Google Scholar] [CrossRef]
- Weng, L.; Li, X.B.; Taheri, A.; Wu, Q.H.; Xie, X.F. Fracture evolution around a cavity in brittle rock under uniaxial compression and coupled static–dynamic loads. Rock Mech. Rock Eng. 2018, 51, 531–545. [Google Scholar] [CrossRef]
- Wang, S.Y.; Sun, L.; Yang, C.; Yang, S.Q.; Tang, C.A. Numerical study on static and dynamic fracture evolution around rock cavities. J. Rock Mech. Geotech. Eng. 2013, 5, 262–276. [Google Scholar] [CrossRef]
- Tang, Z.L.; Yao, W.; Zhang, J.C.; Xu, Q.J.; Xia, K.W. Experimental evaluation of PMMA simulated tunnel stability under dynamic disturbance using digital image correlation. Tunn. Undergr. Space Technol. 2019, 92, 101039. [Google Scholar] [CrossRef]
- Long, Y.; Liu, J.P.; Lei, G.; Si, Y.T.; Zhang, C.Y.; Wei, D.C.; Shi, H.X. Progressive fracture processes around tunnel triggered by blast disturbances under biaxial compression with different lateral pressure coefficients. Trans. Nonferrous Met. Soc. China 2020, 30, 2518–2535. [Google Scholar] [CrossRef]
- Qiu, J.D.; Li, X.B.; Li, D.Y.; Zhao, Y.Z.; Hu, C.W.; Liang, L.S. Physical model test on the deformation behavior of an underground tunnel under blasting disturbance. Rock Mech. Rock Eng. 2021, 54, 91–108. [Google Scholar] [CrossRef]
- Li, X.B.; Wu, Q.H.; Tao, M.; Weng, L.; Dong, L.J.; Zou, Y. Dynamic Brazilian splitting test of ring-shaped specimens with different hole diameters. Rock Mech. Rock Eng. 2016, 49, 4143–4151. [Google Scholar] [CrossRef]
- Zhao, Z.L.; Jing, H.W.; Shi, X.S.; Han, G.S. Experimental and numerical study on mechanical and fracture behavior of rock-like specimens containing pre-existing holes flaws. Eur. J. Environ. Civ. Eng. 2022, 26, 299–319. [Google Scholar] [CrossRef]
- Yang, S.Q.; Huang, Y.H.; Tan, W.L.; Zhu, J.B. An experimental investigation on strength, deformation and crack evolution behavior of sandstone containing two oval flaws under uniaxial compression. Eng. Geol. 2017, 217, 35–48. [Google Scholar] [CrossRef]
- Zhou, Z.L.; Tan, L.H.; Cao, W.Z.; Zhou, Z.Y.; Cai, X. Fracture evolution and failure behaviour of marble specimens containing rectangular cavities under uniaxial loading. Eng. Fract. Mech. 2017, 184, 183–201. [Google Scholar] [CrossRef]
- Tang, C.A.; Wong, R.H.C.; Chau, K.T.; Lin, P. Modeling of compression-induced splitting failure in heterogeneous brittle porous solids. Eng. Fract. Mech. 2005, 72, 597–615. [Google Scholar] [CrossRef]
- Lin, P.; Wong, R.H.C.; Tang, C.A. Experimental study of coalescence mechanisms and failure under uniaxial compression of granite containing multiple holes. Int. J. Rock Mech. Min. Sci. 2015, 77, 313–327. [Google Scholar] [CrossRef]
- Wu, H.; Ma, D.; Spearing, A.J.S.; Zhao, G.Y. Fracture response and mechanisms of brittle rock with different numbers of openings under uniaxial loading. Geomech. Eng. 2021, 25, 481–493. [Google Scholar]
- Wu, H.; Zhao, G.Y.; Liang, W.Z. Mechanical response and fracture behavior of brittle rocks containing two inverted U-shaped holes under uniaxial loading. Appl. Sci. 2019, 9, 5327. [Google Scholar] [CrossRef]
- Haeri, H.; Khaloo, A.; Marji, M.F. Fracture analyses of different pre-holed concrete specimens under compression. Acta Mech. Sin. 2015, 31, 855–870. [Google Scholar] [CrossRef]
- Jespersen, C.; Maclaughlin, M.; Hudyma, N. Strength, deformation modulus and failure modes of cubic analog specimens representing macroporous rock. Int. J. Rock Mech. Min. Sci. 2010, 47, 1349–1356. [Google Scholar] [CrossRef]
- Wang, S.H.; Lee, C.I.; Ranjith, P.J.; Tang, C.A. Modeling the Effects of Heterogeneity and Anisotropy on the Excavation Damaged/Disturbed Zone (EDZ). Rock Mech. Rock Eng. 2009, 42, 229–258. [Google Scholar] [CrossRef]
- Yang, S.Q.; Tian, W.L.; Huang, Y.H. Failure mechanical behavior of pre-holed granite specimens after elevated temperature treatment by particle flow code. Geothermics 2018, 72, 124–137. [Google Scholar] [CrossRef]
- Xie, H.P.; Chen, Z.D. Fractal geometry and fracture of rock. Acta Mech. Sin. 1988, 4, 255–264. [Google Scholar]
- Choi, Y.C.; Park, B. Effects of high-temperature exposure on fractal dimension of fly-ash-based geopolymer composites. J. Mater. Res. Technol. 2020, 9, 7655–7668. [Google Scholar] [CrossRef]
Figure 1.
Holes in rock mass: (a) gas pores in basalt, (b) natural cave in mountain, (c) karst cave in phosphate mine, and (d) tunnel in gold mine.
Figure 1.
Holes in rock mass: (a) gas pores in basalt, (b) natural cave in mountain, (c) karst cave in phosphate mine, and (d) tunnel in gold mine.
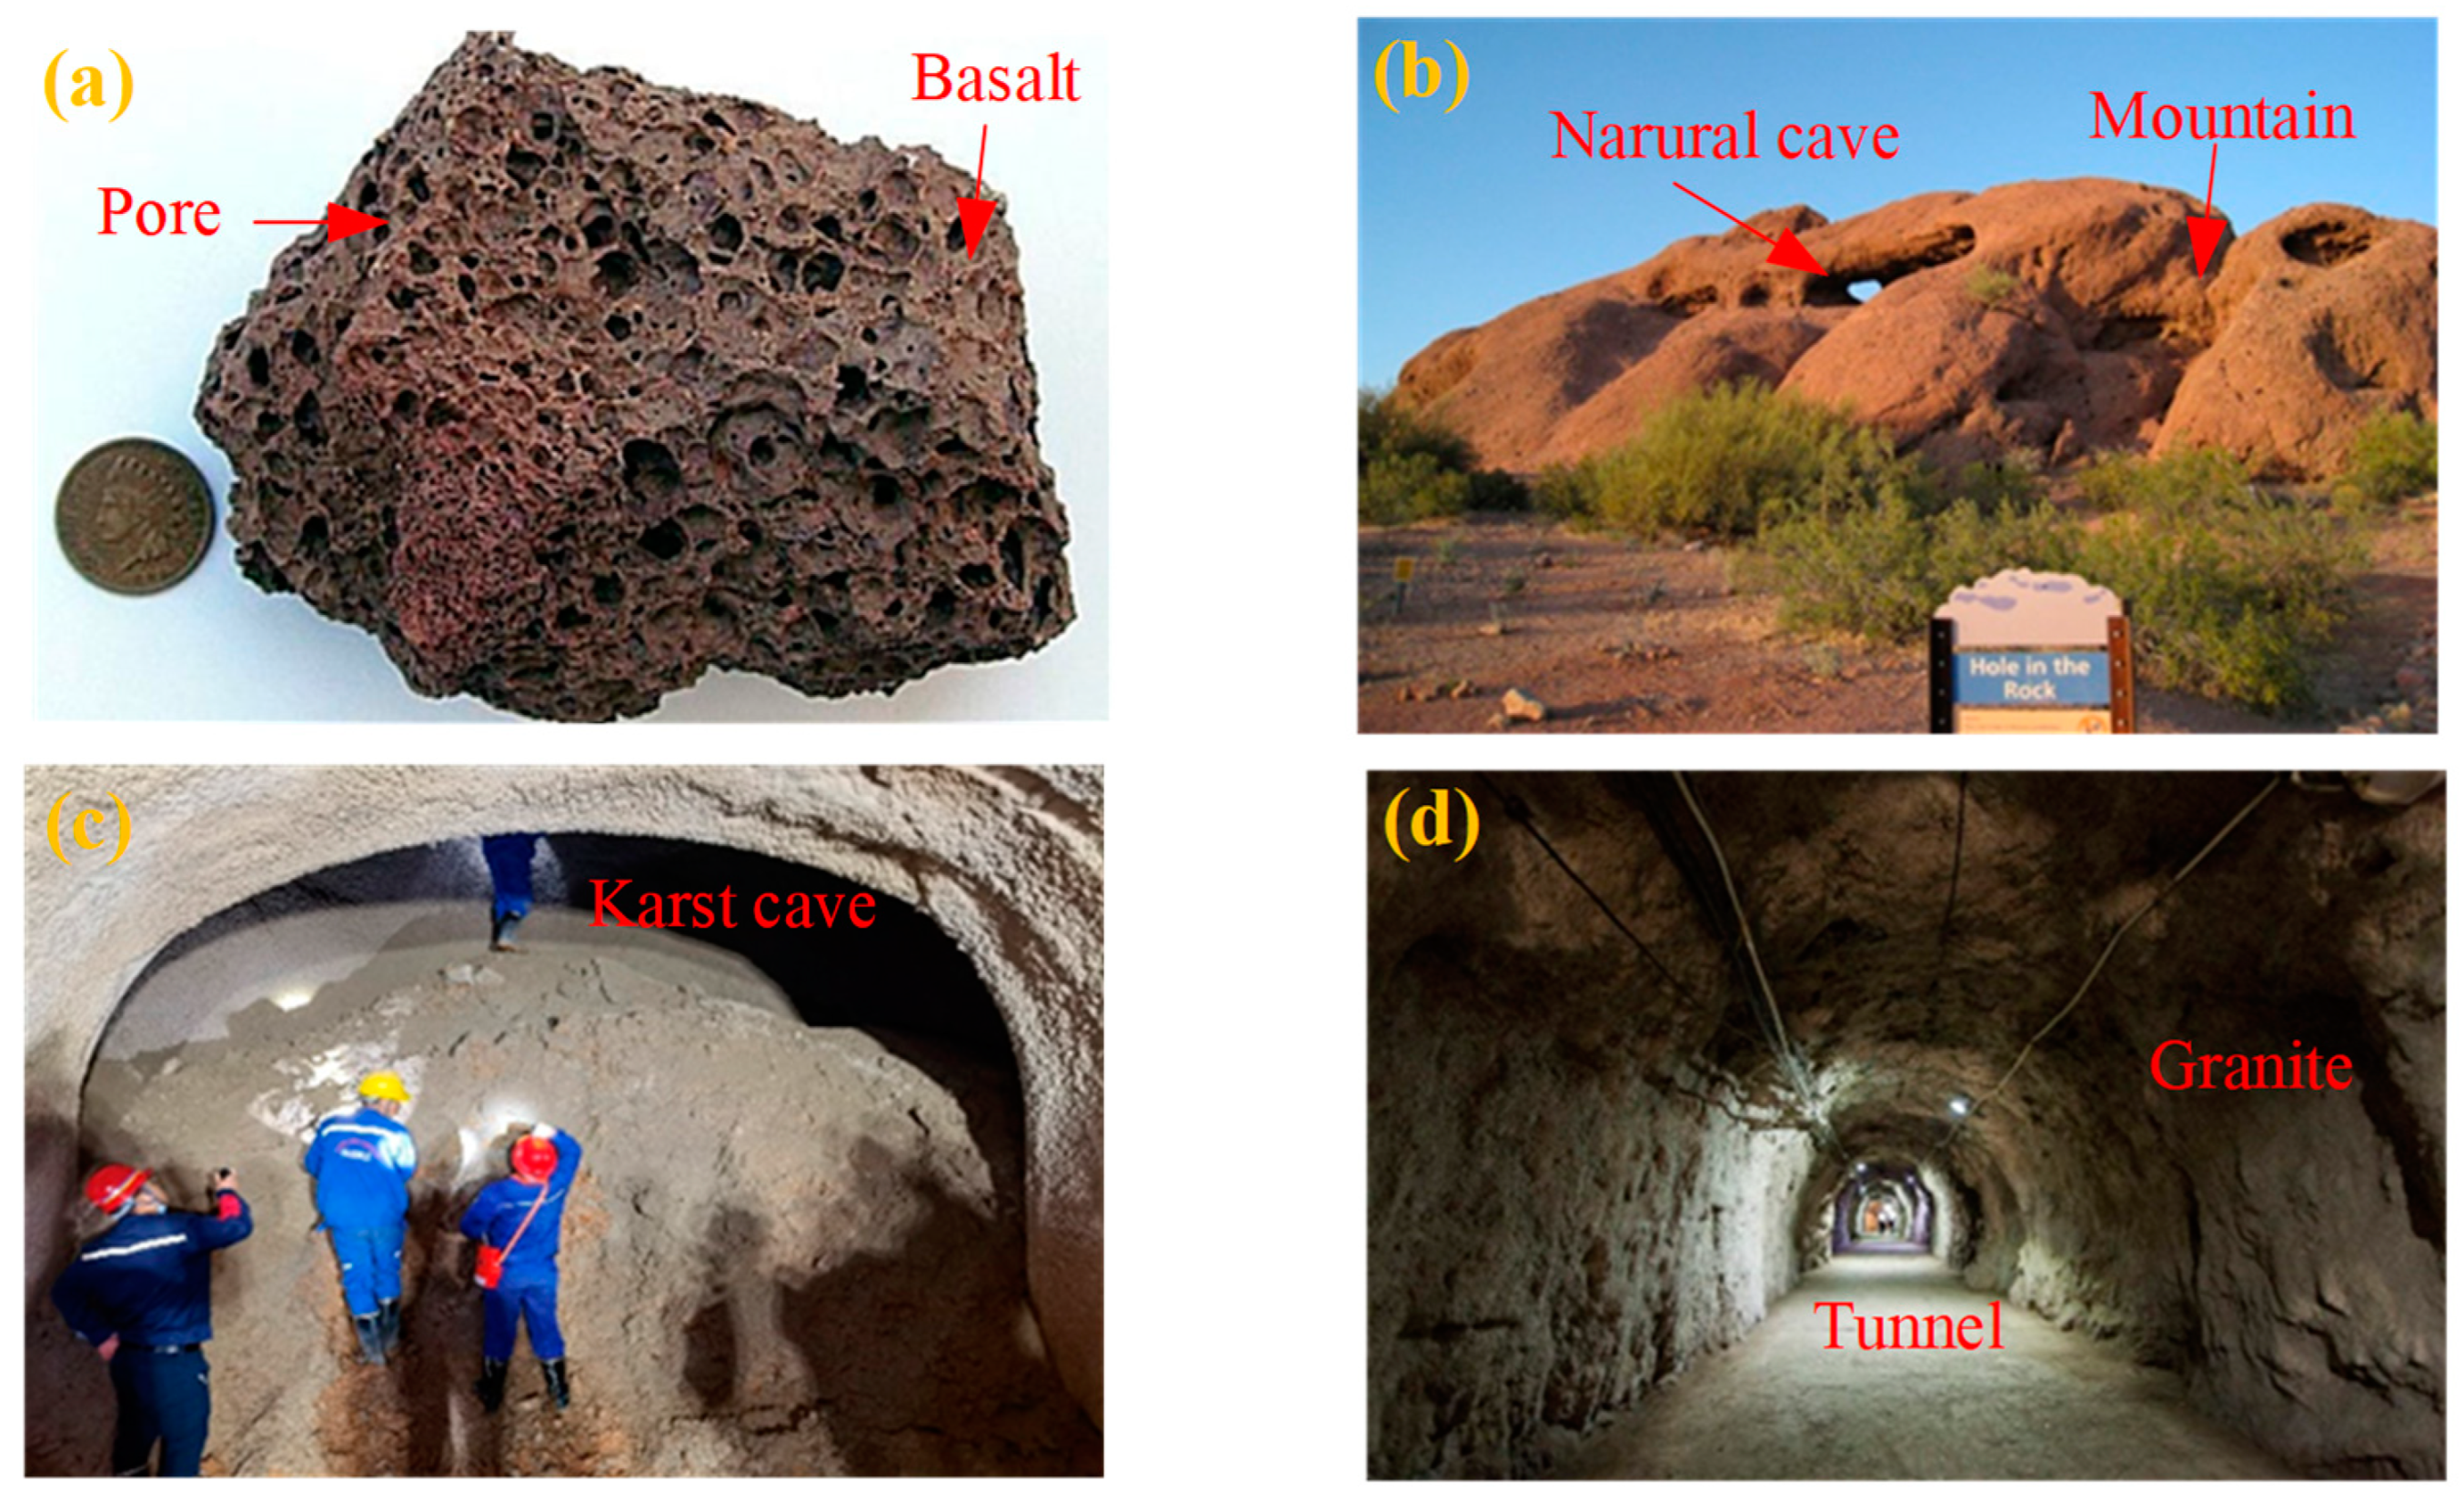
Figure 2.
Microstructure and mineral composition of experimental materials: (a) viewed under cross-polarized light, (b) viewed under plane-polarized light, (c) 200 times magnification under SEM, and (d) 500 times magnification under SEM.
Figure 2.
Microstructure and mineral composition of experimental materials: (a) viewed under cross-polarized light, (b) viewed under plane-polarized light, (c) 200 times magnification under SEM, and (d) 500 times magnification under SEM.
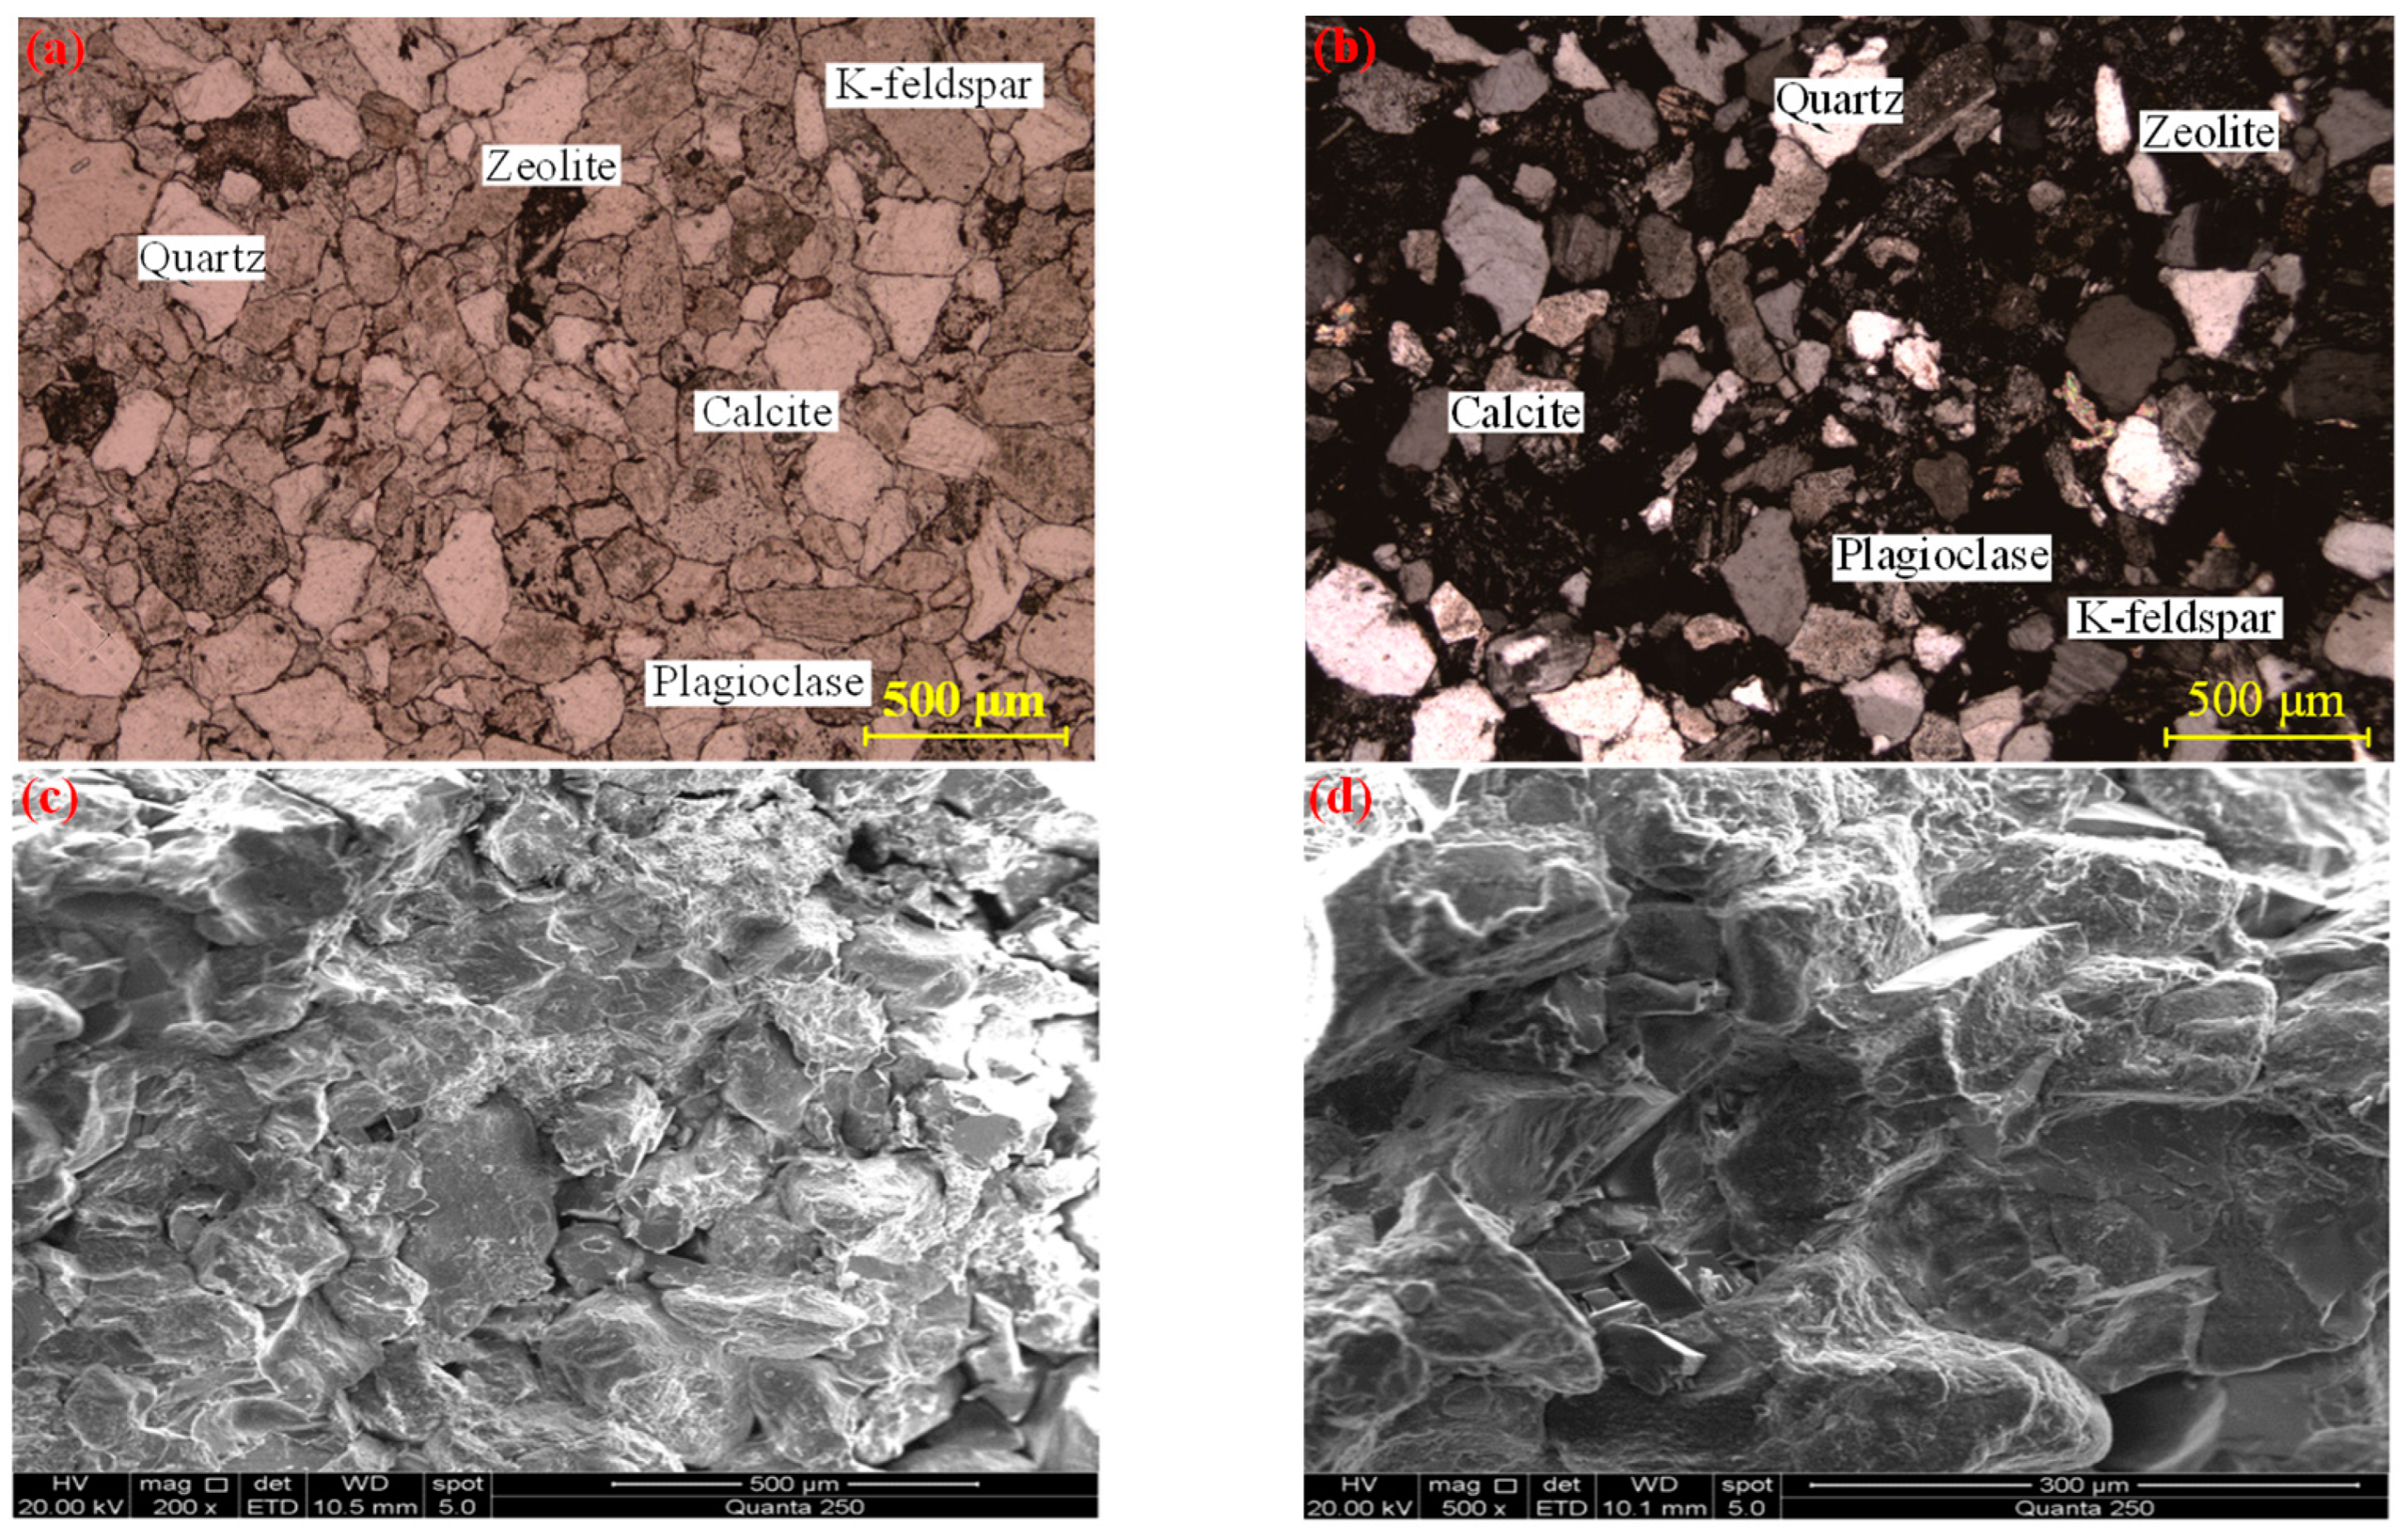
Figure 3.
Experimental results of mechanical properties: (a) stress–strain curve of specimen subjected to axial loading, and (b) Mohr–Coulomb fitting curve of sandstone on the basis of shear results.
Figure 3.
Experimental results of mechanical properties: (a) stress–strain curve of specimen subjected to axial loading, and (b) Mohr–Coulomb fitting curve of sandstone on the basis of shear results.

Figure 4.
Experimental principle and equipment: (a) schematic of SHPB system, and (b) SHPB components.
Figure 4.
Experimental principle and equipment: (a) schematic of SHPB system, and (b) SHPB components.
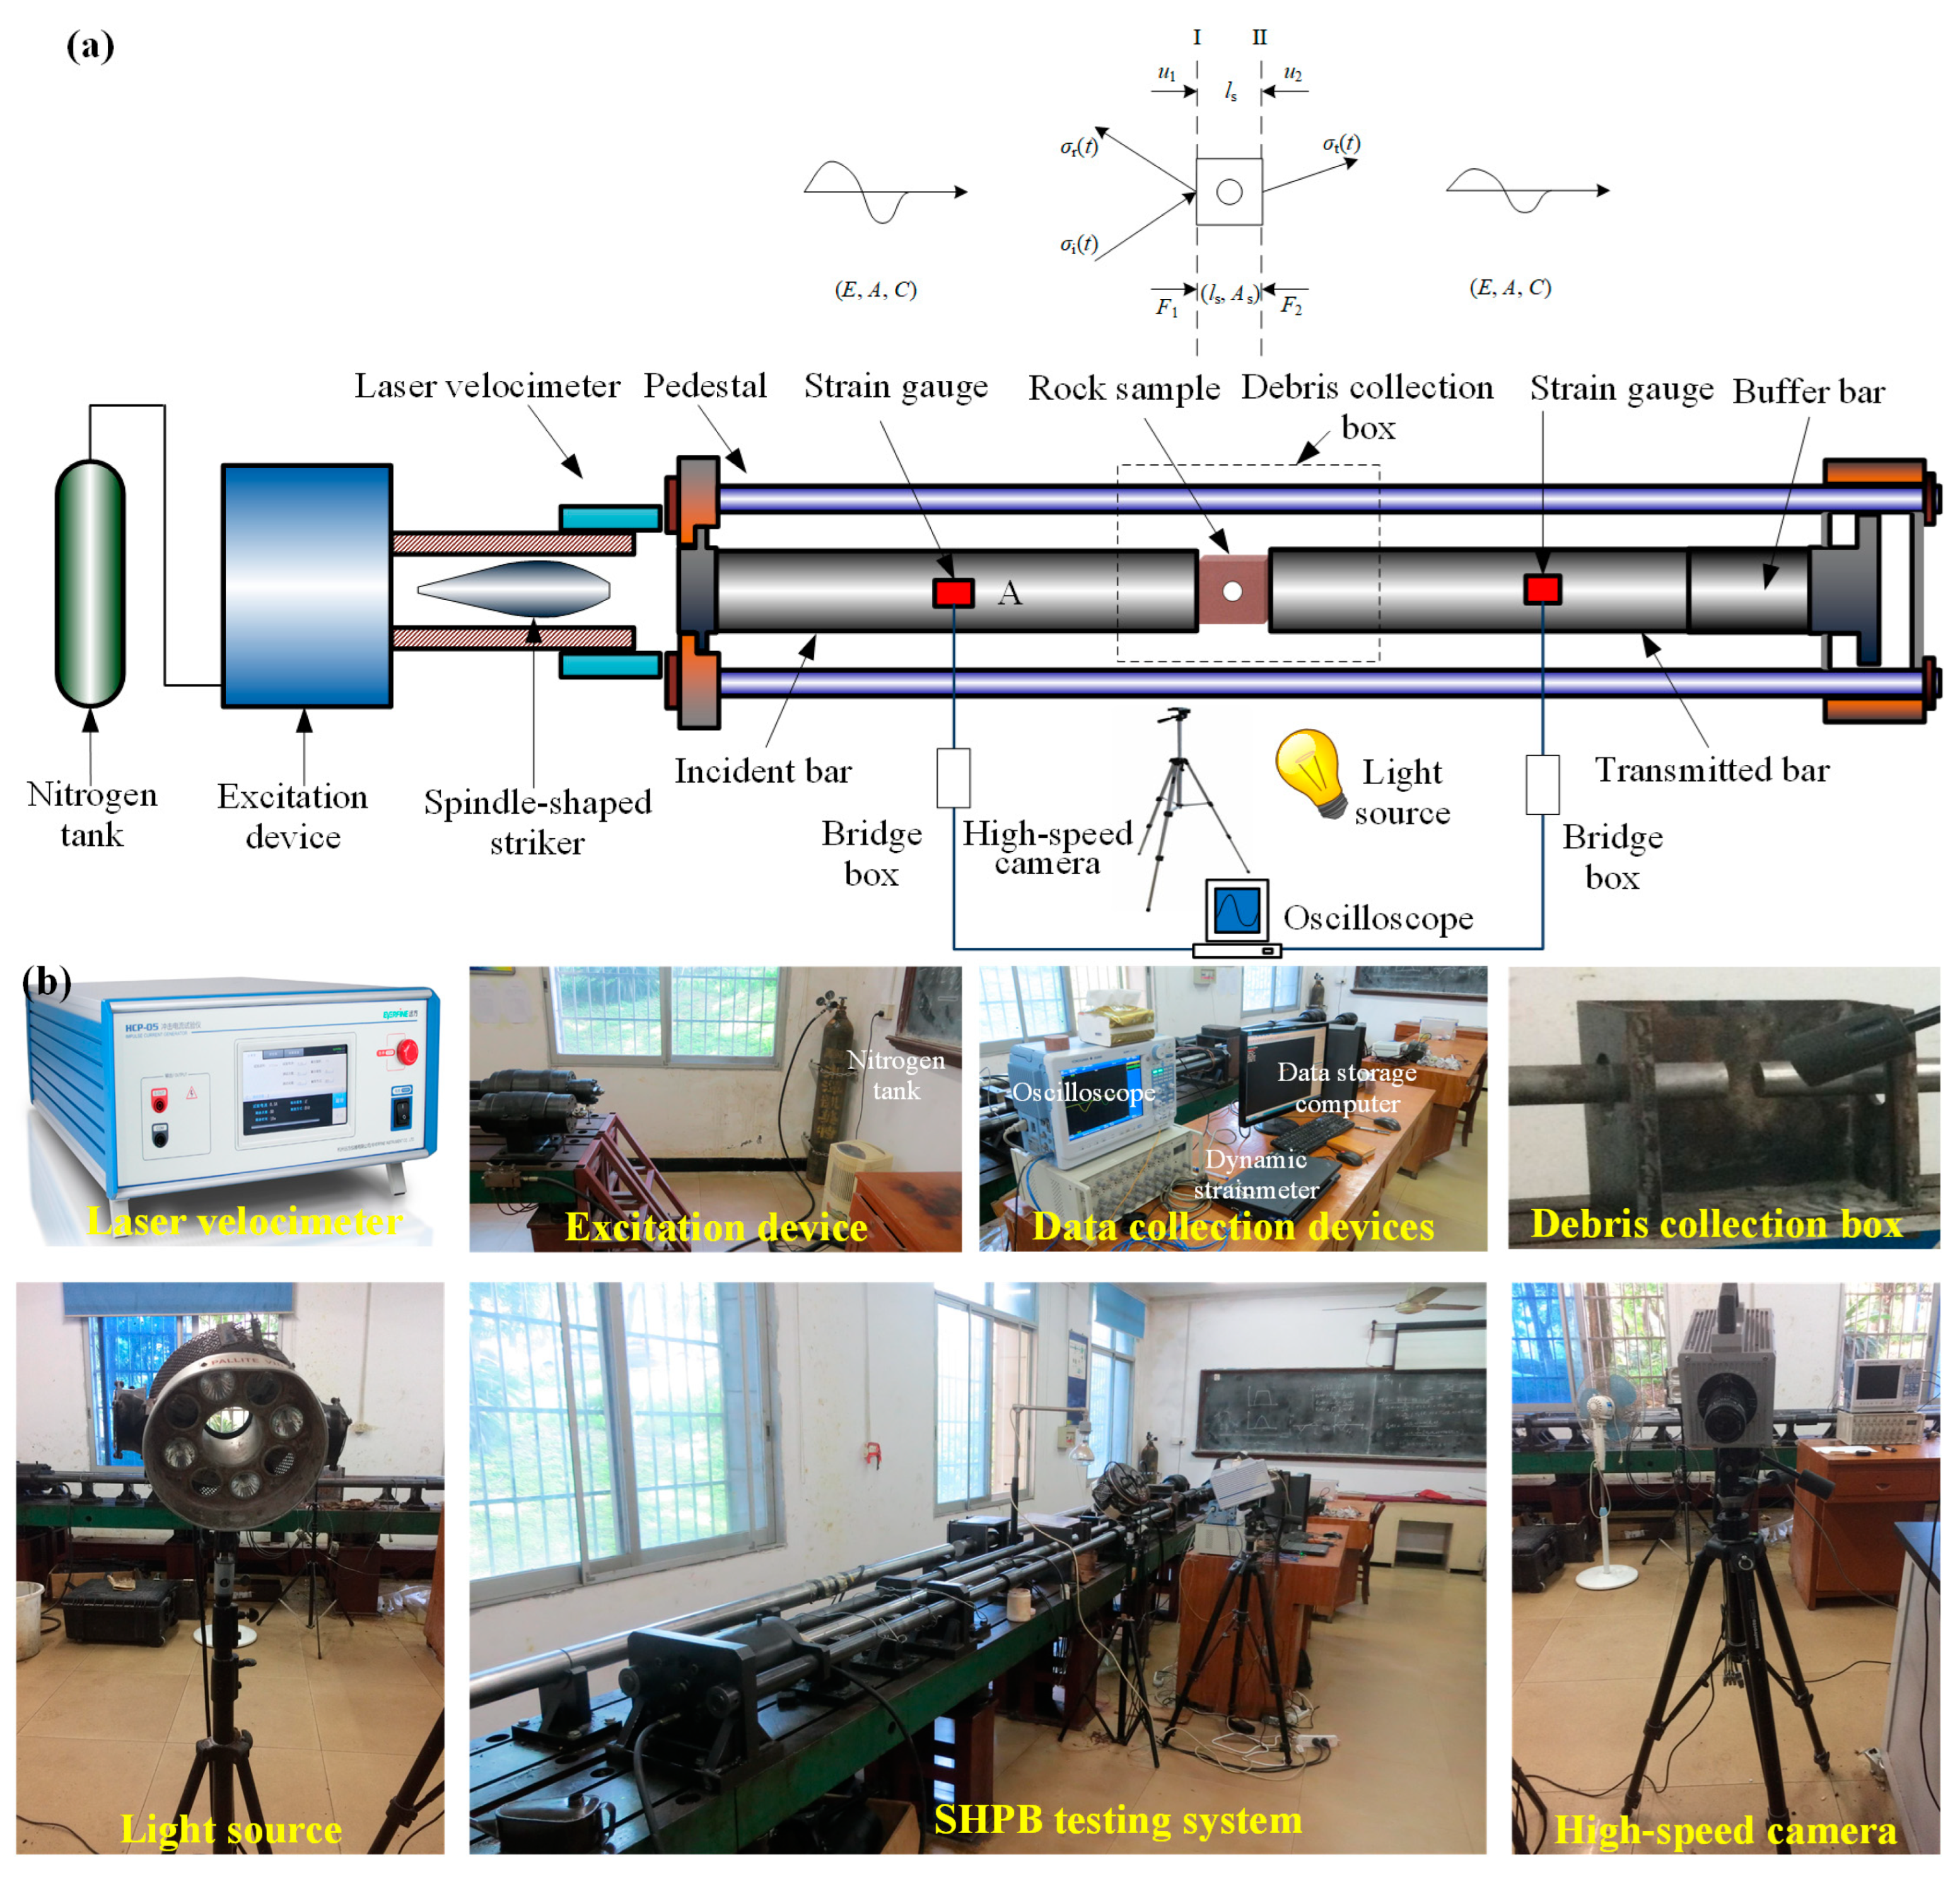
Figure 5.
Seven groups of sandstone specimens prepared for impact tests (unit:mm).

Figure 6.
Results of empty impact test: (a) wave voltage–loading time curves, and (b) stress–loading time curves of different waves.
Figure 6.
Results of empty impact test: (a) wave voltage–loading time curves, and (b) stress–loading time curves of different waves.

Figure 7.
Impact test results of specimen G1-A: (a) wave voltage–loading time curves, and (b) stress–loading time curves of different stress waves.
Figure 7.
Impact test results of specimen G1-A: (a) wave voltage–loading time curves, and (b) stress–loading time curves of different stress waves.

Figure 8.
Impact test results of specimen G2-A: (a) wave voltage–loading time curves, and (b) stress–loading time curves of different waves.
Figure 8.
Impact test results of specimen G2-A: (a) wave voltage–loading time curves, and (b) stress–loading time curves of different waves.

Figure 9.
Curves of dynamic stress versus dynamic strain.

Figure 10.
Dynamic parameters of samples.
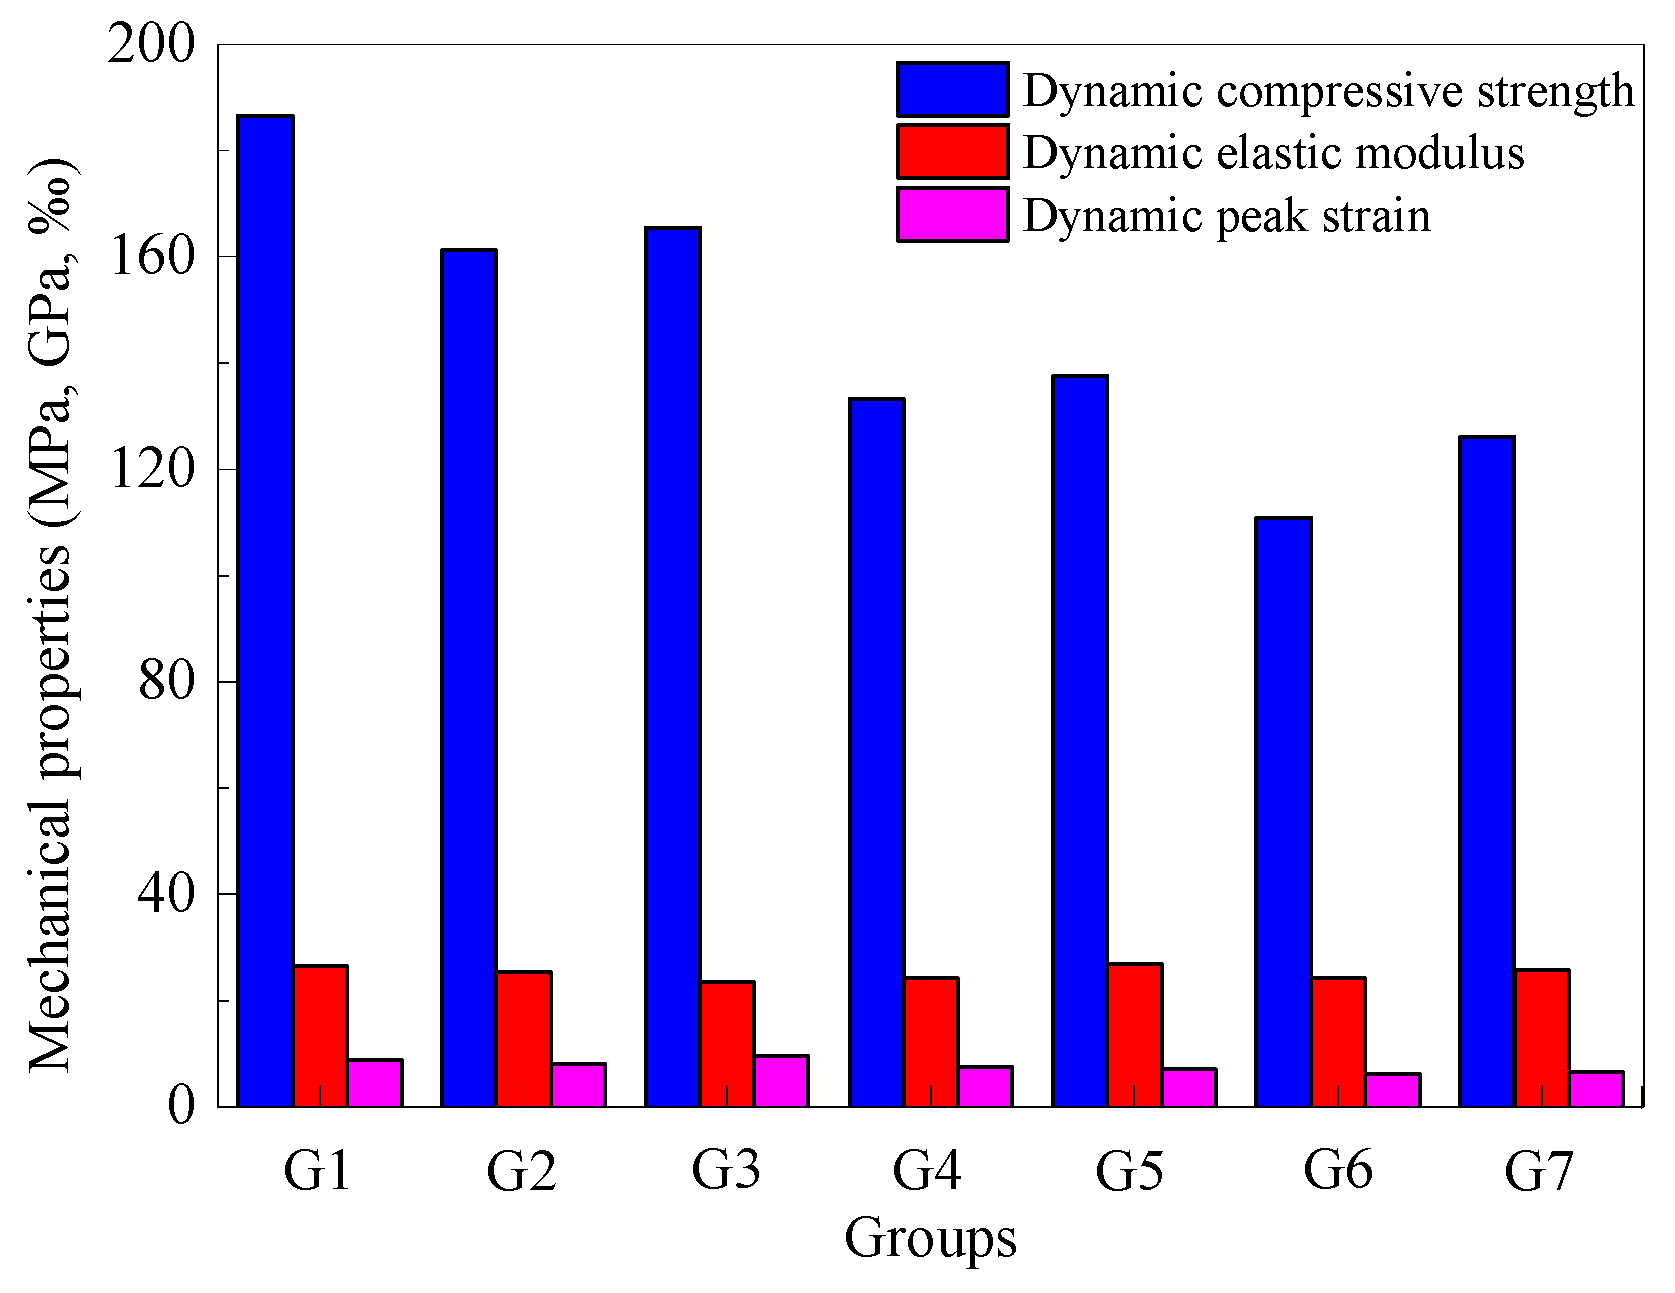
Figure 11.
Schematic diagram of screening process of rock fragments.

Figure 12.
Linear fitting of fractal dimension of each rock sample fragment.

Figure 13.
Comparison of dissipated energy density and fractal dimension of each group of samples.


Table 1.
Mechanical parameters of experimental materials.
| σc/MPa | σt/MPa | Ee/GPa | μ | Fc/MPa | θ /° | Tf/MPa·m½ |
|---|---|---|---|---|---|---|
| 102.61 | 5.28 | 20.78 | 0.258 | 19.01 | 40.43 | 0.59 |
Table 2.
Mechanical properties of samples subjected to impact loads.
| Specimen Number | Length /mm | Width /mm | Height /mm | Density /g∙cm−3 | Hit Velocity/ m∙s−1 | Dynamic Compressive Strength/MPa | Dynamic Elastic Modulus /GPa | Peak Strain/‰ | Strain Rate/s−1 |
|---|---|---|---|---|---|---|---|---|---|
| G1-A | 45.7 | 19.8 | 45.6 | 2.44 | 10.05 | 180.50 | 22.99 | 9.18 | 64.65 |
| G1-B | 45.0 | 19.9 | 44.9 | 2.45 | 9.76 | 194.46 | 26.03 | 10.09 | 74.78 |
| G1-C | 45.1 | 20.7 | 45.2 | 2.47 | 10.18 | 185.11 | 30.60 | 7.48 | 50.67 |
| G2-A | 45.5 | 19.9 | 45.7 | 2.43 | 9.97 | 169.16 | 26.22 | 8.82 | 68.81 |
| G2-B | 45.1 | 19.8 | 45.1 | 2.43 | 10.27 | 157.36 | 25.44 | 8.21 | 79.52 |
| G2-C | 45.2 | 19.8 | 45.2 | 2.45 | 9.83 | 157.18 | 24.58 | 7.30 | 66.73 |
| G3-A | 45.0 | 20.1 | 45.1 | 2.43 | 9.96 | 173.29 | 22.47 | 9.64 | 75.42 |
| G3-B | 44.7 | 19.9 | 45.7 | 2.40 | 9.97 | 150.00 | 23.79 | 7.72 | 75.18 |
| G3-C | 45.1 | 20.0 | 45.1 | 2.44 | 9.92 | 173.20 | 24.35 | 9.35 | 75.50 |
| G4-A | 45.1 | 19.9 | 45.1 | 2.43 | 9.85 | 134.39 | 23.13 | 8.03 | 79.17 |
| G4-B | 45.0 | 19.7 | 45.0 | 2.42 | 9.89 | 131.61 | 25.50 | 6.87 | 76.29 |
| G4-C | 45.5 | 19.9 | 45.5 | 2.42 | 10.03 | 134.00 | 23.87 | 7.70 | 78.72 |
| G5-A | 45.0 | 19.7 | 45.0 | 2.44 | 9.92 | 139.88 | 27.84 | 7.26 | 75.89 |
| G5-B | 44.7 | 19.9 | 45.5 | 2.41 | 9.99 | 134.01 | 27.53 | 6.10 | 74.91 |
| G5-C | 45.1 | 19.8 | 45.1 | 2.43 | 9.94 | 138.94 | 25.37 | 7.72 | 76.12 |
| G6-A | 45.1 | 20.1 | 45.0 | 2.43 | 9.92 | 117.42 | 22.22 | 6.69 | 80.56 |
| G6-B | 45.1 | 20.1 | 45.1 | 2.43 | 9.86 | 117.22 | 23.14 | 6.49 | 79.53 |
| G6-C | 45.1 | 20.2 | 45.1 | 2.42 | 9.94 | 97.97 | 27.18 | 4.92 | 78.46 |
| D7-A | 45.1 | 19.7 | 45.1 | 2.42 | 9.96 | 127.49 | 26.40 | 6.40 | 75.32 |
| D7-B | 45.0 | 19.8 | 45.0 | 2.42 | 9.97 | 132.84 | 24.81 | 7.43 | 75.14 |
| D7-C | 45.1 | 20.0 | 45.1 | 2.43 | 9.96 | 118.21 | 25.81 | 5.82 | 68.50 |
Table 3.
Energy index value of the sample under dynamic load.
| Specimen Number | WI/J | WR/J | WT/J | WS/J | ρw/J∙cm−3 |
|---|---|---|---|---|---|
| G1-A | 142.08 | 52.69 | 22.57 | 66.82 | 1.62 |
| G1-B | 136.65 | 44.31 | 28.83 | 63.51 | 1.58 |
| G1-C | 140.35 | 40.89 | 27.32 | 72.14 | 1.71 |
| G2-A | 143.46 | 57.15 | 10.80 | 75.51 | 1.95 |
| G2-B | 144.97 | 62.06 | 9.72 | 73.19 | 1.86 |
| G2-C | 142.35 | 61.41 | 10.45 | 70.50 | 1.80 |
| G3-A | 143.69 | 49.00 | 20.43 | 74.27 | 1.87 |
| G3-B | 144.41 | 55.10 | 13.73 | 75.57 | 1.91 |
| G3-C | 142.85 | 47.65 | 20.52 | 74.67 | 1.89 |
| G4-A | 140.69 | 61.66 | 9.89 | 69.14 | 1.76 |
| G4-B | 141.96 | 62.25 | 9.18 | 70.53 | 1.82 |
| G4-C | 145.51 | 64.89 | 10.08 | 70.55 | 1.76 |
| G5-A | 143.38 | 68.47 | 8.33 | 66.58 | 1.76 |
| G5-B | 145.69 | 65.40 | 9.72 | 70.57 | 1.86 |
| G5-C | 143.47 | 66.20 | 7.74 | 69.53 | 1.81 |
| G6-A | 141.72 | 53.62 | 18.03 | 70.07 | 1.72 |
| G6-B | 150.02 | 69.50 | 14.22 | 66.31 | 1.67 |
| G6-C | 133.16 | 49.25 | 14.76 | 69.14 | 1.73 |
| G7-A | 141.72 | 53.62 | 18.03 | 70.07 | 1.72 |
| G7-B | 150.02 | 69.50 | 14.22 | 66.31 | 1.67 |
| G7-C | 133.16 | 49.25 | 14.76 | 69.14 | 1.73 |
Table 4.
Fractal dimension and grade weight of specimen fragments subjected to dynamic loads.
| Sample Number | md < 5 /g | md < 10 /g | md < 15 /g | md < 20 /g | md < 40 /g | mt /g | D | R2 |
|---|---|---|---|---|---|---|---|---|
| G1-A | 12.32 | 27.82 | 47.57 | 58.63 | 74.90 | 74.90 | 2.11 | 0.91 |
| G1-B | 10.13 | 20.30 | 36.39 | 78.30 | 83.57 | 83.57 | 1.89 | 0.88 |
| G1-C | 12.06 | 27.44 | 46.86 | 62.4 | 70.45 | 70.45 | 2.11 | 0.87 |
| G2-A | 9.15 | 14.69 | 33.08 | 45.40 | 76.91 | 76.91 | 1.91 | 0.95 |
| G2-B | 14.25 | 28.69 | 55.03 | 60.72 | 84.80 | 84.80 | 2.11 | 0.92 |
| G2-C | 9.63 | 20.22 | 35.60 | 67.01 | 88.97 | 88.97 | 1.86 | 0.94 |
| G3-A | 15.37 | 32.58 | 48.68 | 63.83 | 86.17 | 86.17 | 2.15 | 0.95 |
| G3-B | 10.93 | 24.71 | 49.23 | 72.72 | 81.83 | 81.83 | 1.97 | 0.88 |
| G3-C | 15.06 | 29.95 | 47.89 | 73.9 | 80.06 | 80.06 | 2.14 | 0.89 |
| G4-A | 8.68 | 15.85 | 25.66 | 43.23 | 87.26 | 87.26 | 1.86 | 0.98 |
| G4-B | 11.52 | 22.54 | 33.96 | 47.88 | 94.71 | 94.71 | 1.98 | 0.99 |
| G4-C | 10.08 | 14.96 | 24.89 | 43.35 | 90.58 | 90.58 | 1.90 | 0.95 |
| G5-A | 9.73 | 15.03 | 22.55 | 27.52 | 88.30 | 88.30 | 1.96 | 0.92 |
| G5-B | 9.55 | 15.15 | 25.27 | 52.6 | 79.27 | 79.27 | 1.91 | 0.93 |
| G5-C | 8.57 | 14.46 | 24.75 | 27.79 | 84.41 | 84.41 | 1.92 | 0.96 |
| G6-A | 12.29 | 18.22 | 35.76 | 60.79 | 82.17 | 82.17 | 2.00 | 0.92 |
| G6-B | 7.56 | 14.31 | 41.99 | 74.36 | 83.45 | 83.45 | 1.72 | 0.86 |
| G6-C | 7.02 | 12.66 | 39.52 | 65.53 | 87.49 | 87.49 | 1.66 | 0.89 |
| G7-A | 8.29 | 18.75 | 42.10 | 58.94 | 84.06 | 84.06 | 1.83 | 0.93 |
| G7-B | 9.59 | 14.25 | 46.00 | 60.97 | 93.75 | 93.75 | 1.80 | 0.89 |
| G7-C | 13.01 | 20.40 | 36.13 | 50.36 | 83.38 | 83.38 | 2.06 | 0.98 |
Table 5.
Dynamic failure evolution of samples subjected to impact loads.
| Sample No. | Moment 1 | Moment 2 | Moment 3 | Moment 4 | Moment 5 |
|---|---|---|---|---|---|
| G1-B |  |  |  | 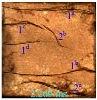 |  |
| G2-C |  |  |  |  | 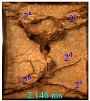 |
| G3-C | 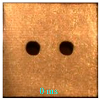 |  | 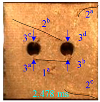 | 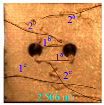 |  |
| G4-C |  |  |  | 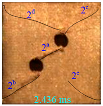 | 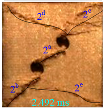 |
| G5-B |  |  | 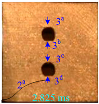 | 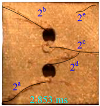 | 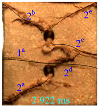 |
| G6-A |  | 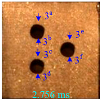 | 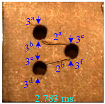 | 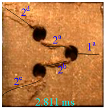 | 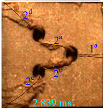 |
| G7-A |  | 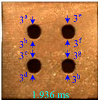 |  | 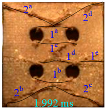 | 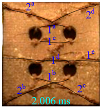 |
Disclaimer/Publisher’s Note: The statements, opinions and data contained in all publications are solely those of the individual author(s) and contributor(s) and not of MDPI and/or the editor(s). MDPI and/or the editor(s) disclaim responsibility for any injury to people or property resulting from any ideas, methods, instructions or products referred to in the content. |
© 2024 by the authors. Licensee MDPI, Basel, Switzerland. This article is an open access article distributed under the terms and conditions of the Creative Commons Attribution (CC BY) license (https://creativecommons.org/licenses/by/4.0/).
Share and Cite
MDPI and ACS Style
Wu, H.; Jia, Y. Strength, Deformation and Fracture Properties of Hard Rocks Embedded with Tunnel-Shaped Openings Suffering from Dynamic Loads. Appl. Sci. 2024, 14, 3175. https://doi.org/10.3390/app14083175
AMA Style
Wu H, Jia Y. Strength, Deformation and Fracture Properties of Hard Rocks Embedded with Tunnel-Shaped Openings Suffering from Dynamic Loads. Applied Sciences. 2024; 14(8):3175. https://doi.org/10.3390/app14083175
Chicago/Turabian StyleWu, Hao, and Yongsheng Jia. 2024. "Strength, Deformation and Fracture Properties of Hard Rocks Embedded with Tunnel-Shaped Openings Suffering from Dynamic Loads" Applied Sciences 14, no. 8: 3175. https://doi.org/10.3390/app14083175
Note that from the first issue of 2016, this journal uses article numbers instead of page numbers. See further details here.