Article

A Hierarchy of Variables That Influence the Force–Velocity Profile of Acrobatic Gymnasts: A Tool Based on Artificial Intelligence

by
Isaura Leite
1,2,*,
Márcio Goethel
1,2,
Pedro Fonseca
2,
João Paulo Vilas-Boas
1,2,*,
Lurdes Ávila-Carvalho
1,
Luis Mochizuki
3 and
Filipe Conceição
1,2
1
Centre for Research, Education, Innovation and Intervention in Sport (CIFI2D), Faculty of Sports, University of Porto, 4200-450 Porto, Portugal
2
Porto Biomechanics Laboratory (LABIOMEP), 4200-450 Porto, Portugal
3
School of Arts, Sciences and Humanities, University of São Paulo, São Paulo 03828-000, Brazil
*
Authors to whom correspondence should be addressed.
Appl. Sci. 2024, 14(8), 3191; https://doi.org/10.3390/app14083191
Submission received: 3 March 2024 / Revised: 3 April 2024 / Accepted: 9 April 2024 / Published: 10 April 2024
(This article belongs to the Special Issue Machine Learning in Sports: Practical Applications for Practitioners)

Abstract

:
Jumping performance is considered an overall indicator of gymnastics ability. Acrobatic Gymnastics involves base and top gymnasts, considering the type of training that is performed and the distinct anthropometric traits of each gymnast. This work aims to investigate a hierarchy of variables that influence the force–velocity (F-V) profile of top and base acrobatic gymnasts through a deep artificial neural network model. Twenty-eight first division and elite acrobatic gymnasts (eleven tops and seventeen bases) performed two evaluations to assess the F-V profile during the Countermovement Jump and its mechanical variables, using My Jump 2 (a total of 56 evaluations). A training background survey and anthropometric assessments were conducted. The final model (R = 0.97) showed that the F-V imbalance (F-Vimb) increases with higher force and decreases with higher maximal power, fat percentage, velocity, and height. Coaches should prioritize the development of force, followed by maximal power, and velocity for the optimization of gymnasts’ F-Vimb. For training planning, the influences of body mass and push-off height are higher for the bases, and the influences of years of practice and competition level are higher for the tops.

1. Introduction

Jumping performance is considered an overall indicator of gymnastics ability, demanding high power outputs [1], which are possible through specialized power training complemented with high force production [2]. In Acrobatic Gymnastics (ACRO), gymnasts work in pairs or groups to perform balance (static positions) and dynamic elements, characterized by flight from throws, boosts, pitches, and catches. Therefore, each gymnast plays a distinct role in achieving the requirements defined by the Code of Points: base and top gymnasts [3]. Bases are generally older and present larger morphological measurements compared to top gymnasts, with no differences in the muscular component [4].
Therefore, the use of progressive loads and training planification according to the gymnasts’ age are key aspects in ACRO [5]. In a typical training session, top gymnasts work on specific balance positions, while bases perform strength training to learn the appropriate techniques to provide a stable platform for tops to balance on, launch from, and land on [6]. Both perform trampoline training and individual elements, divided into balance, flexibility, agility, and floor categories [3]. Two studies investigated the differences between roles in ACRO, focusing on the unipedal balance [7] and the anthropometric profile [4]. One study evaluated the jumping performance of 5–8-year-old girls (role unknown) training ACRO twice a week [8]. Recently, the differences in the jumping skills of bases, tops, and rhythmic gymnasts were investigated [9], and the results showed that the specificity of the role and gymnastics discipline influenced the gymnasts’ jumping performance.
To maximize the individual ballistic performance, it is important to consider the force–velocity (F-V) profile, which represents the balance between force and velocity qualities [10,11], and is considered a relevant parameter for the jumping ability assessment [12]. However, as the athlete’s level and training background increase, the difficulty of producing training adaptations to maximal power activities, such as vertical jumps, also increases [2]. There is also a greater specialization as gymnasts progress in age [7]. Evaluating to what extent this applies to the F-V profile and investigate the variables that explain variations between roles would improve coaches’ knowledge of each specific role.
Nevertheless, the multifactorial nature of the variables that influence sports performance requires an evaluation method with an extraordinary ability to deal with complex nonlinear problems, such as the multilayer neural network system, with strong self-learning, self-adaptability, and fault tolerance [13]. Unlike classic statistical models and correlative methods, neural networks consist of multiple indirect interconnections between input and output variables and nonlinear mathematical equations and statistical techniques to successively minimize the variance between actual and predicted outputs, yielding a model that can be applied to an independent data set [14]. This approach offers better optimization possibilities for predicting sports results, athlete recruitment, and selection processes than the widely applied regression models [15]. Two key factors of this tool are its explainability and interpretability, focusing on the results but also on the data’s inherent patterns and the ability of the algorithms to explain them [16]. As an efficient tool for studying and disseminating data populations into groups, this approach has been applied in team sports such as football [16], body composition research [14], and sports psychology [13], but no studies have applied this method to gymnastics.
Accordingly, this work aims to investigate a hierarchy of variables that influence the F-V profile of base and top gymnasts, using a deep artificial neural network model. We hypothesized that the selected variables should explain variations in the F-V profile of acrobatic gymnasts. Our second hypothesis was that the model could distinguish between top and base gymnasts, considering the specificity of the role performed. These data will allow us to identify the main characteristics of acrobatic gymnasts’ jumping skill, considering their specific training and role. It will also provide information to coaches on the hierarchy of key variables for top and bases training, as well as the imbalances detected when considering the specific function of each gymnast.

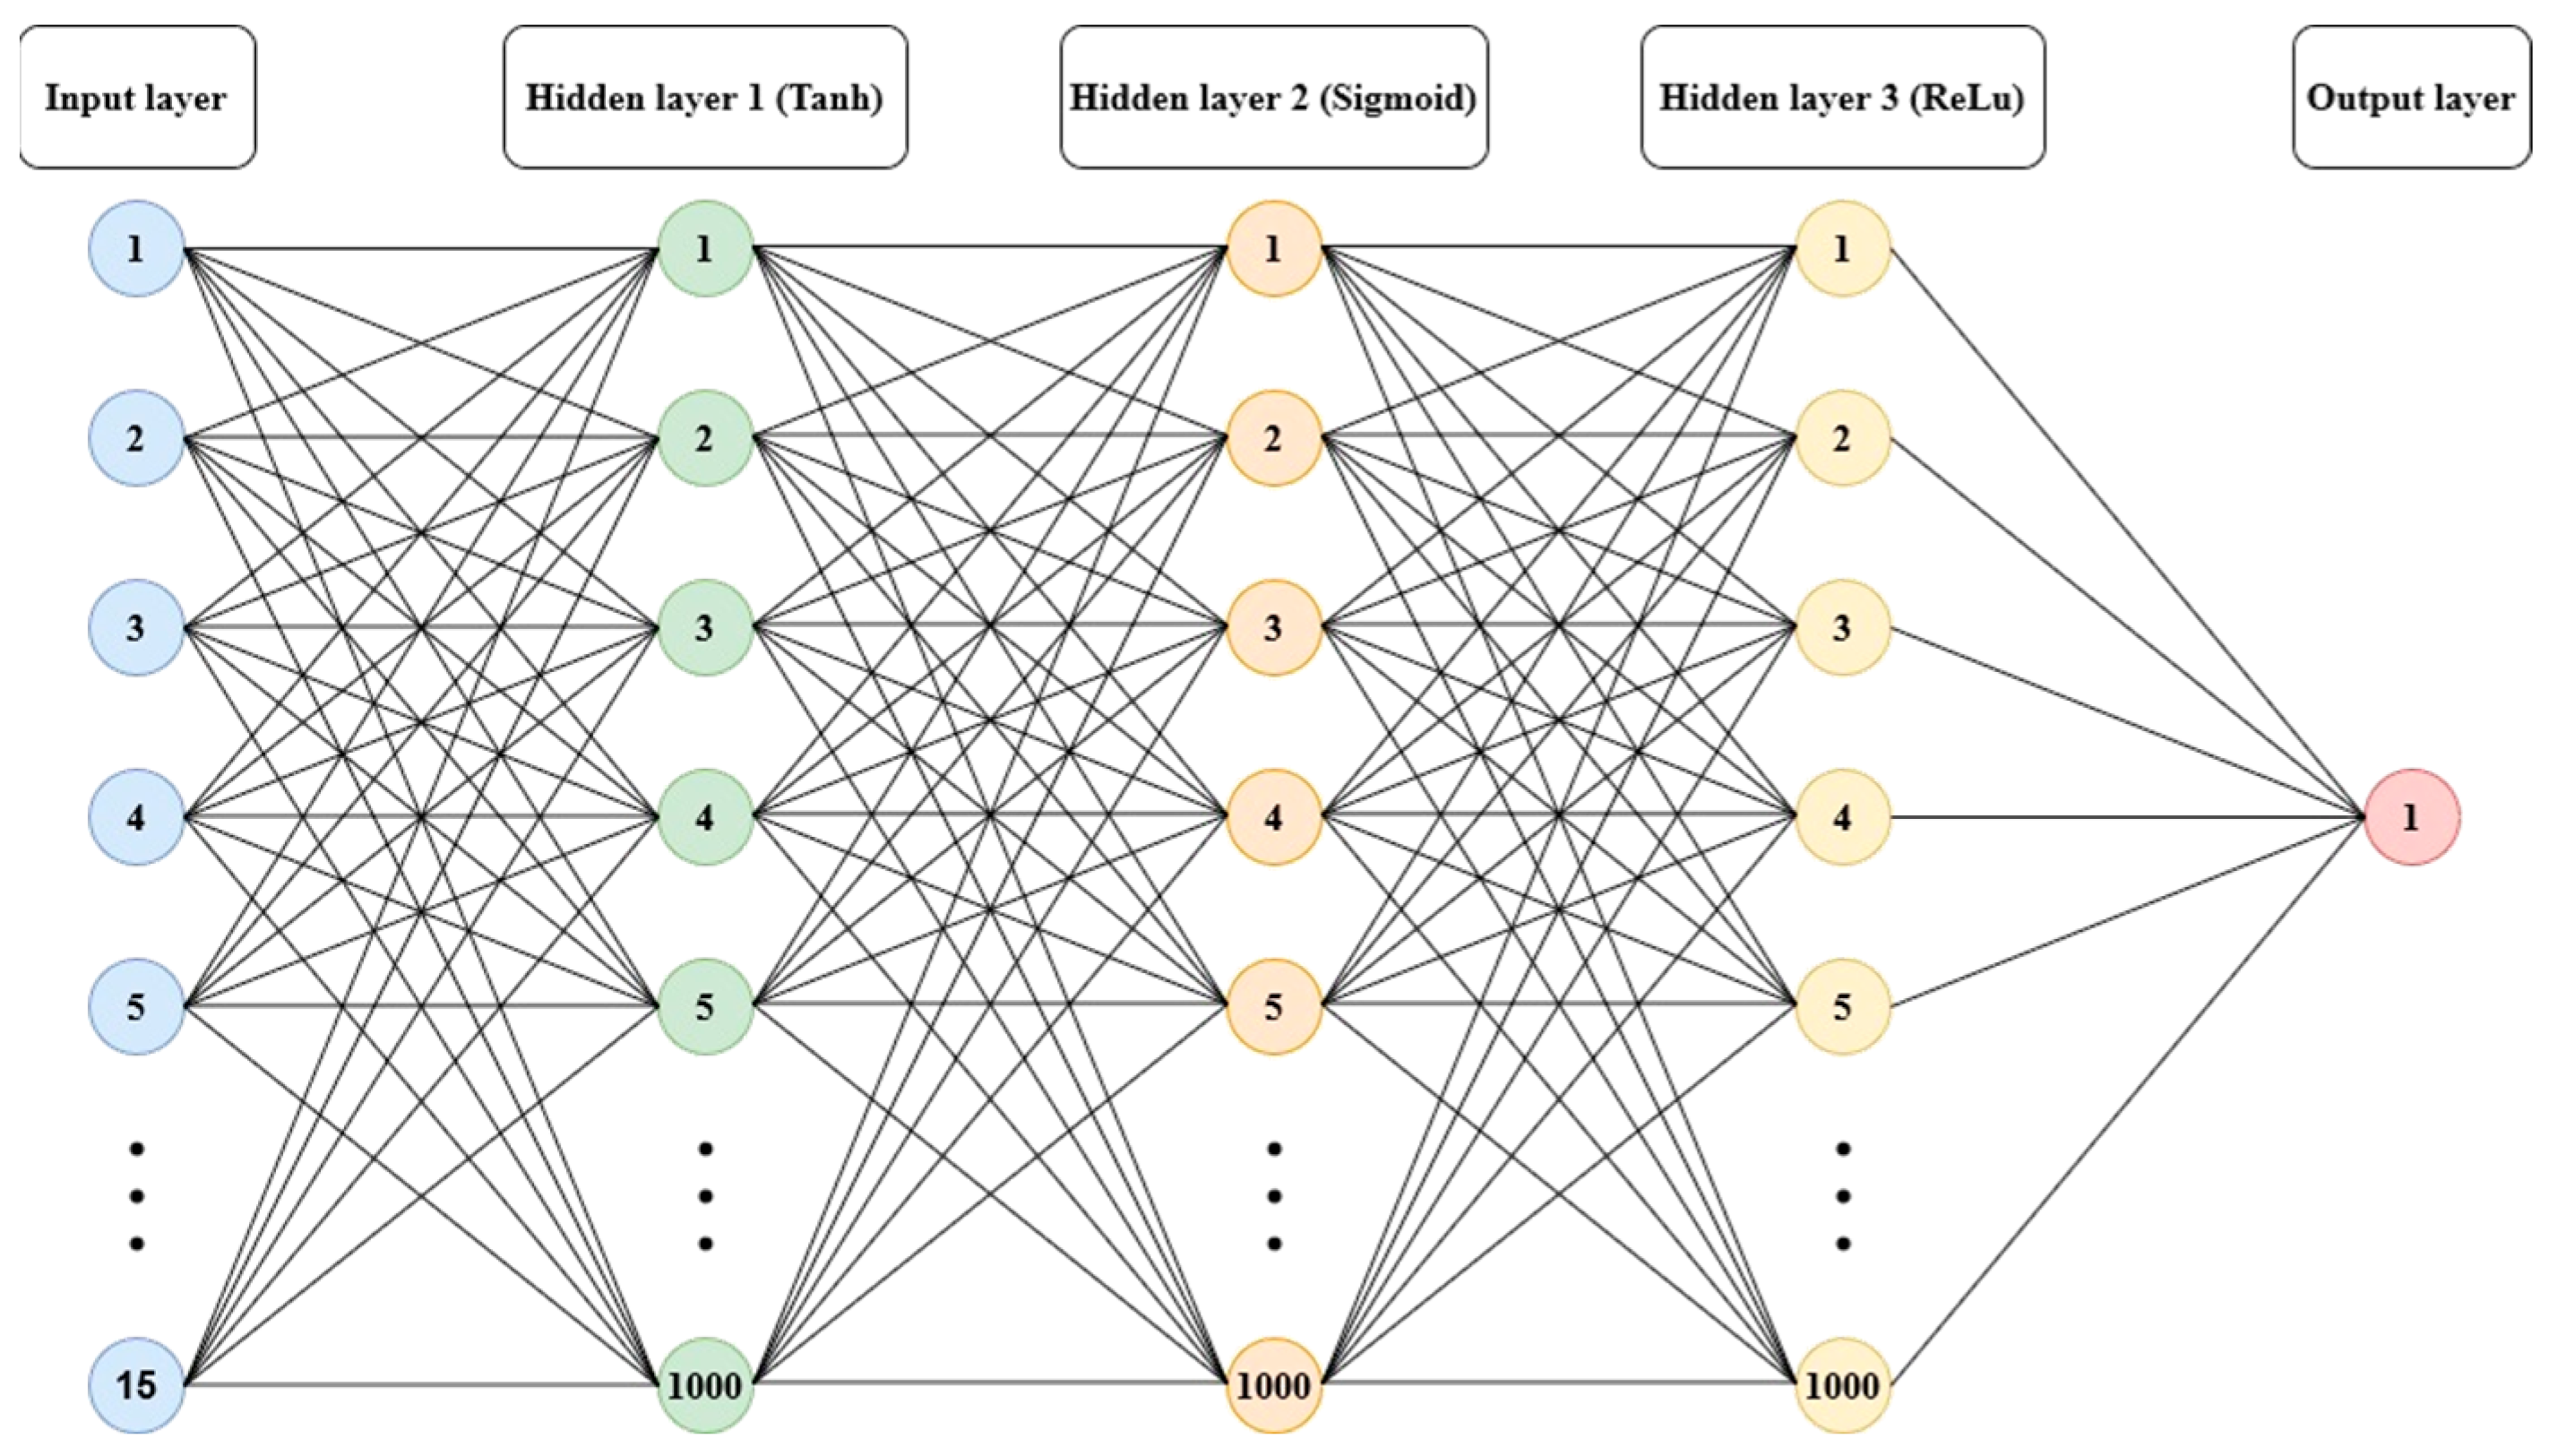
2. Materials and Methods

2.1. Sample Characterization

A total of 28 Portuguese acrobatic gymnasts (23 females and 5 males), including 11 tops—10 females (age: 13.39 ± 2.14 years old, body mass: 33.37 ± 5.92 kg, and height: 143.90 ± 8.54 cm) and 1 male (age: 16.10 years old, body mass: 49.90 kg, and height: 162.00 cm)—and 17 bases—12 females (age: 17.07 ± 2.04 years old, body mass: 59.63 ± 7.12 kg, and height: 164.92 ± 3.60 cm) and 5 males (age: 20.33 ± 4.18 years old, body mass: 70.44 ± 14.57 kg and height: 174.20 ± 5.63 cm)—from the first division and elite competition levels volunteered to participate in this study. These gymnasts competed in official categories: Age Group 1 (11–16 years old), Age Group 2 (12–18 years old), Junior Elite (13–19 years old), and Senior Elite (from 12 years old). All subjects and their legal guardians (in case of subjects being younger than 18 years old), after being informed of the study’s purpose, procedures, benefits, and risks, gave their voluntary and informed consent to participate under the Declaration of Helsinki and the approval of the local research Ethics Committee (CEFADE 02.2022).

2.2. Procedures and Instruments

A brief training background survey was conducted to obtain information regarding the training experience (years) and the weekly training volume (hours) of each gymnast. Anthropometric data were collected, namely, the height of push-off (HPO), height, body mass, and fat percentage. HPO is the difference between the right greater trochanter height from the ground (measured at 90° knee angle in a squat position) and the extended lower limb length with maximal foot plantar flexion (greater trochanter to tiptoe distance) while the subject is in supine position [17]. This measure consists of the lower limbs’ length change between the starting position and take-off, collected using a measuring tape and a goniometer (BASELINE, 12-1001). A stadiometer was used for height measurements, and the bioimpedance scale Tanita SC-330 (TANITA Corp, Tokyo, Japan) was used to measure body mass (kg) and fat percentage (%).
After the usual training warm-up, a brief familiarization with the Countermovement Jump (CMJ) was facilitated. For the F-V profile assessment, an incremental loading jumping protocol was applied using the scientifically validated smartphone app My Jump 2 in an iPhone 5s, with a camera frame rate of 40 fps [18,19]. This instrument uses basic measures of body mass, lower limb length, jump height, and distance–time or speed–time measurements [17,20] to measure the CMJ height and F-V profile of each athlete.
Each subject performed a maximum CMJ without additional load, followed by three progressive loading conditions, i.e., there was an increment of 5 kg for tops in each condition (body weight, 5 kg, 10 kg, and 15 kg) [21] and 10 kg for bases (body weight, 10 kg, 20 kg, and 30 kg) [22]. For attempts without additional load, the participants were instructed to remain in a standing position with their hands on their hips. For attempts with an external load, tops used weighted vests and bases placed their hands on a barbell, since they used higher loads. From these positions, participants performed the CMJs [23]. A 2 min interval was used for the unloaded condition [10,11] and a 4–5 min interval was allowed between attempts using additional loads [11]. The protocol was considered successfully finished when gymnasts achieved 20 cm of jump height with the last load selected, as recommended by previous studies [24,25]. Each gymnast performed two jumping performance evaluations.
This instrument also provides information regarding the magnitude and direction of the F-V imbalance of each gymnast and the three variables that summarize the changes in external force generation and power output with increasing movement velocity, such as the theoretical maximal force at null velocity (F0); the maximal power output (Pmax); and the theoretical maximal velocity at which the lower limbs can extend during one extension under zero load (V0) [10]. The ratio between F0 and V0 (i.e., the slope of the linear F-V relationship) characterizes the F-V profile of the neuromuscular system [10]. There are five F-V imbalance categories according to the percentage of optimal thresholds, namely, a high-force deficit (<60%), low-force deficit (60–90%), well-balanced (90–110%), low-velocity deficit (>110–140%), and high-velocity deficit (>140%) [26].
The relative difference between the actual and optimal F-V profiles for a given individual represents the magnitude and the direction of the unfavorable balance between force and velocity qualities (i.e., the force–velocity imbalance, FVimb in %), allowing us to determine the individual force or velocity deficit [26]. A FVimb value around 0% indicates a F-V profile that is equal to 100% of the optimal profile (a perfect balance between force and velocity qualities), whereas a F-V profile value that is higher or lower than the optimal indicates a profile that is too oriented toward force or velocity capabilities [26].
Three types of variables were assessed to includemultifactorial data: (1) subject information: age (years), sex, training experience (years), weekly training volume (hours), and competition level (1st division and elite); (2) anthropometrics: body mass (kg), height (cm), HPO (cm), fat percentage (%), and body mass index (kg/m2); and (3) F-V-profile-associated variables: F0 (N/kg), V0 (m/s), Pmax (W/kg), CMJ height (cm), and FVimb (%).

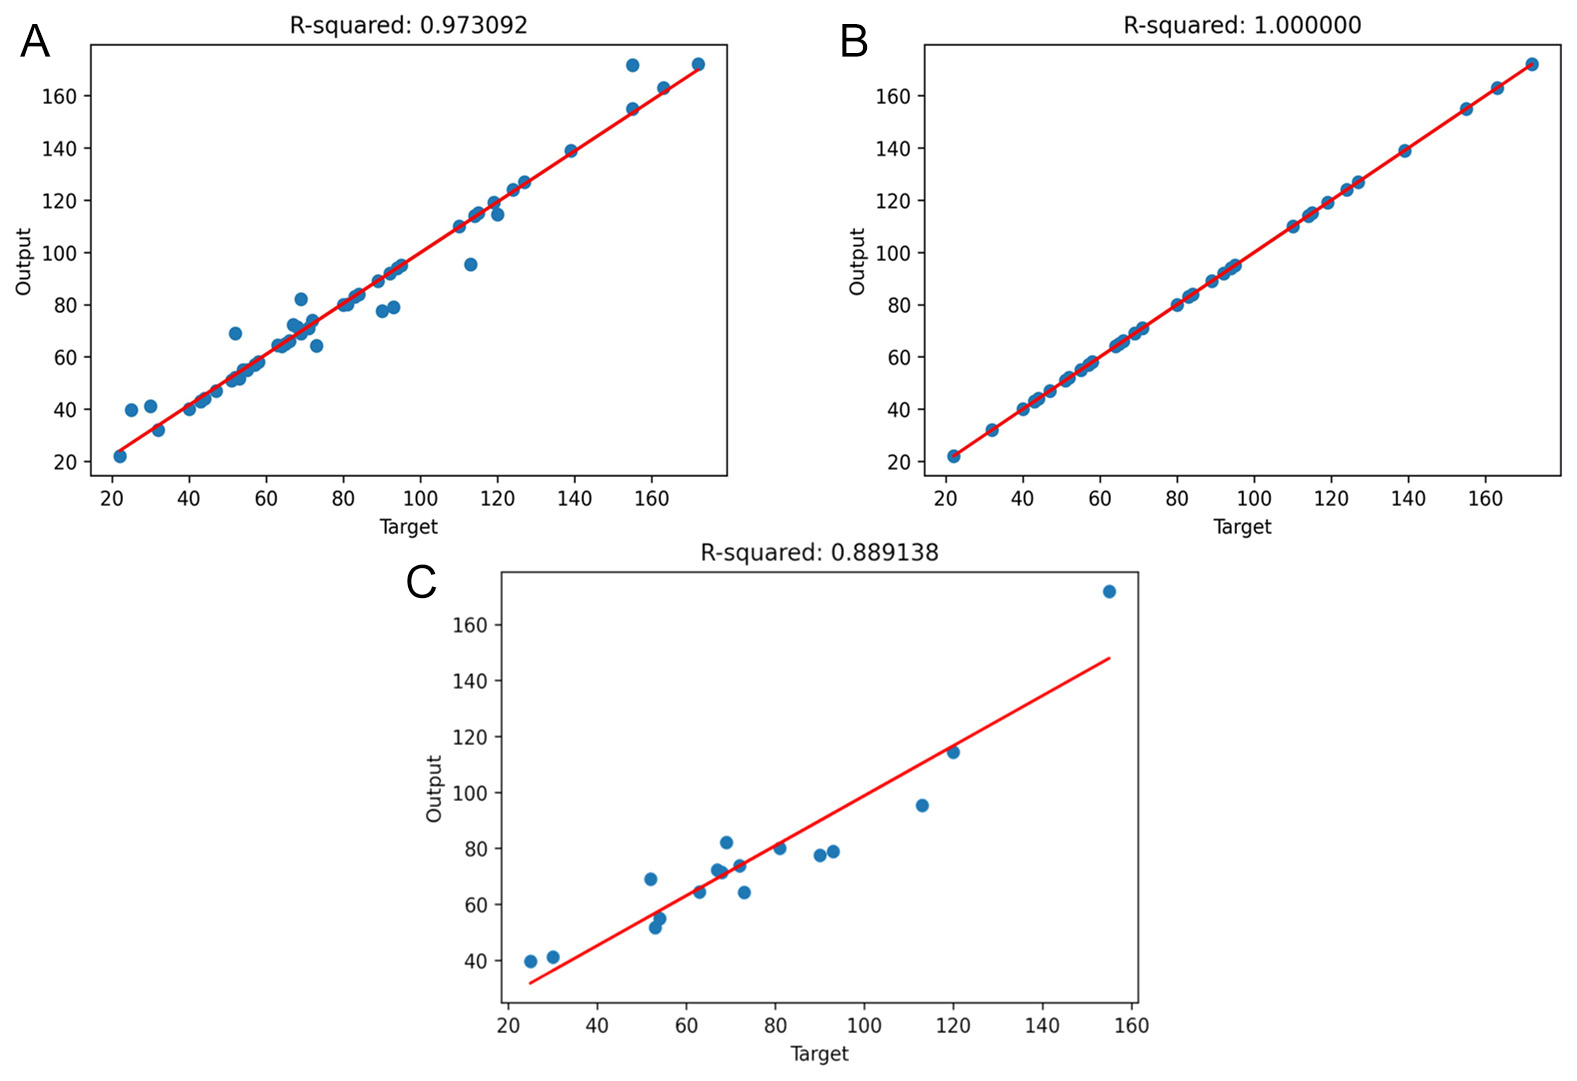
2.3. Statistical Analysis
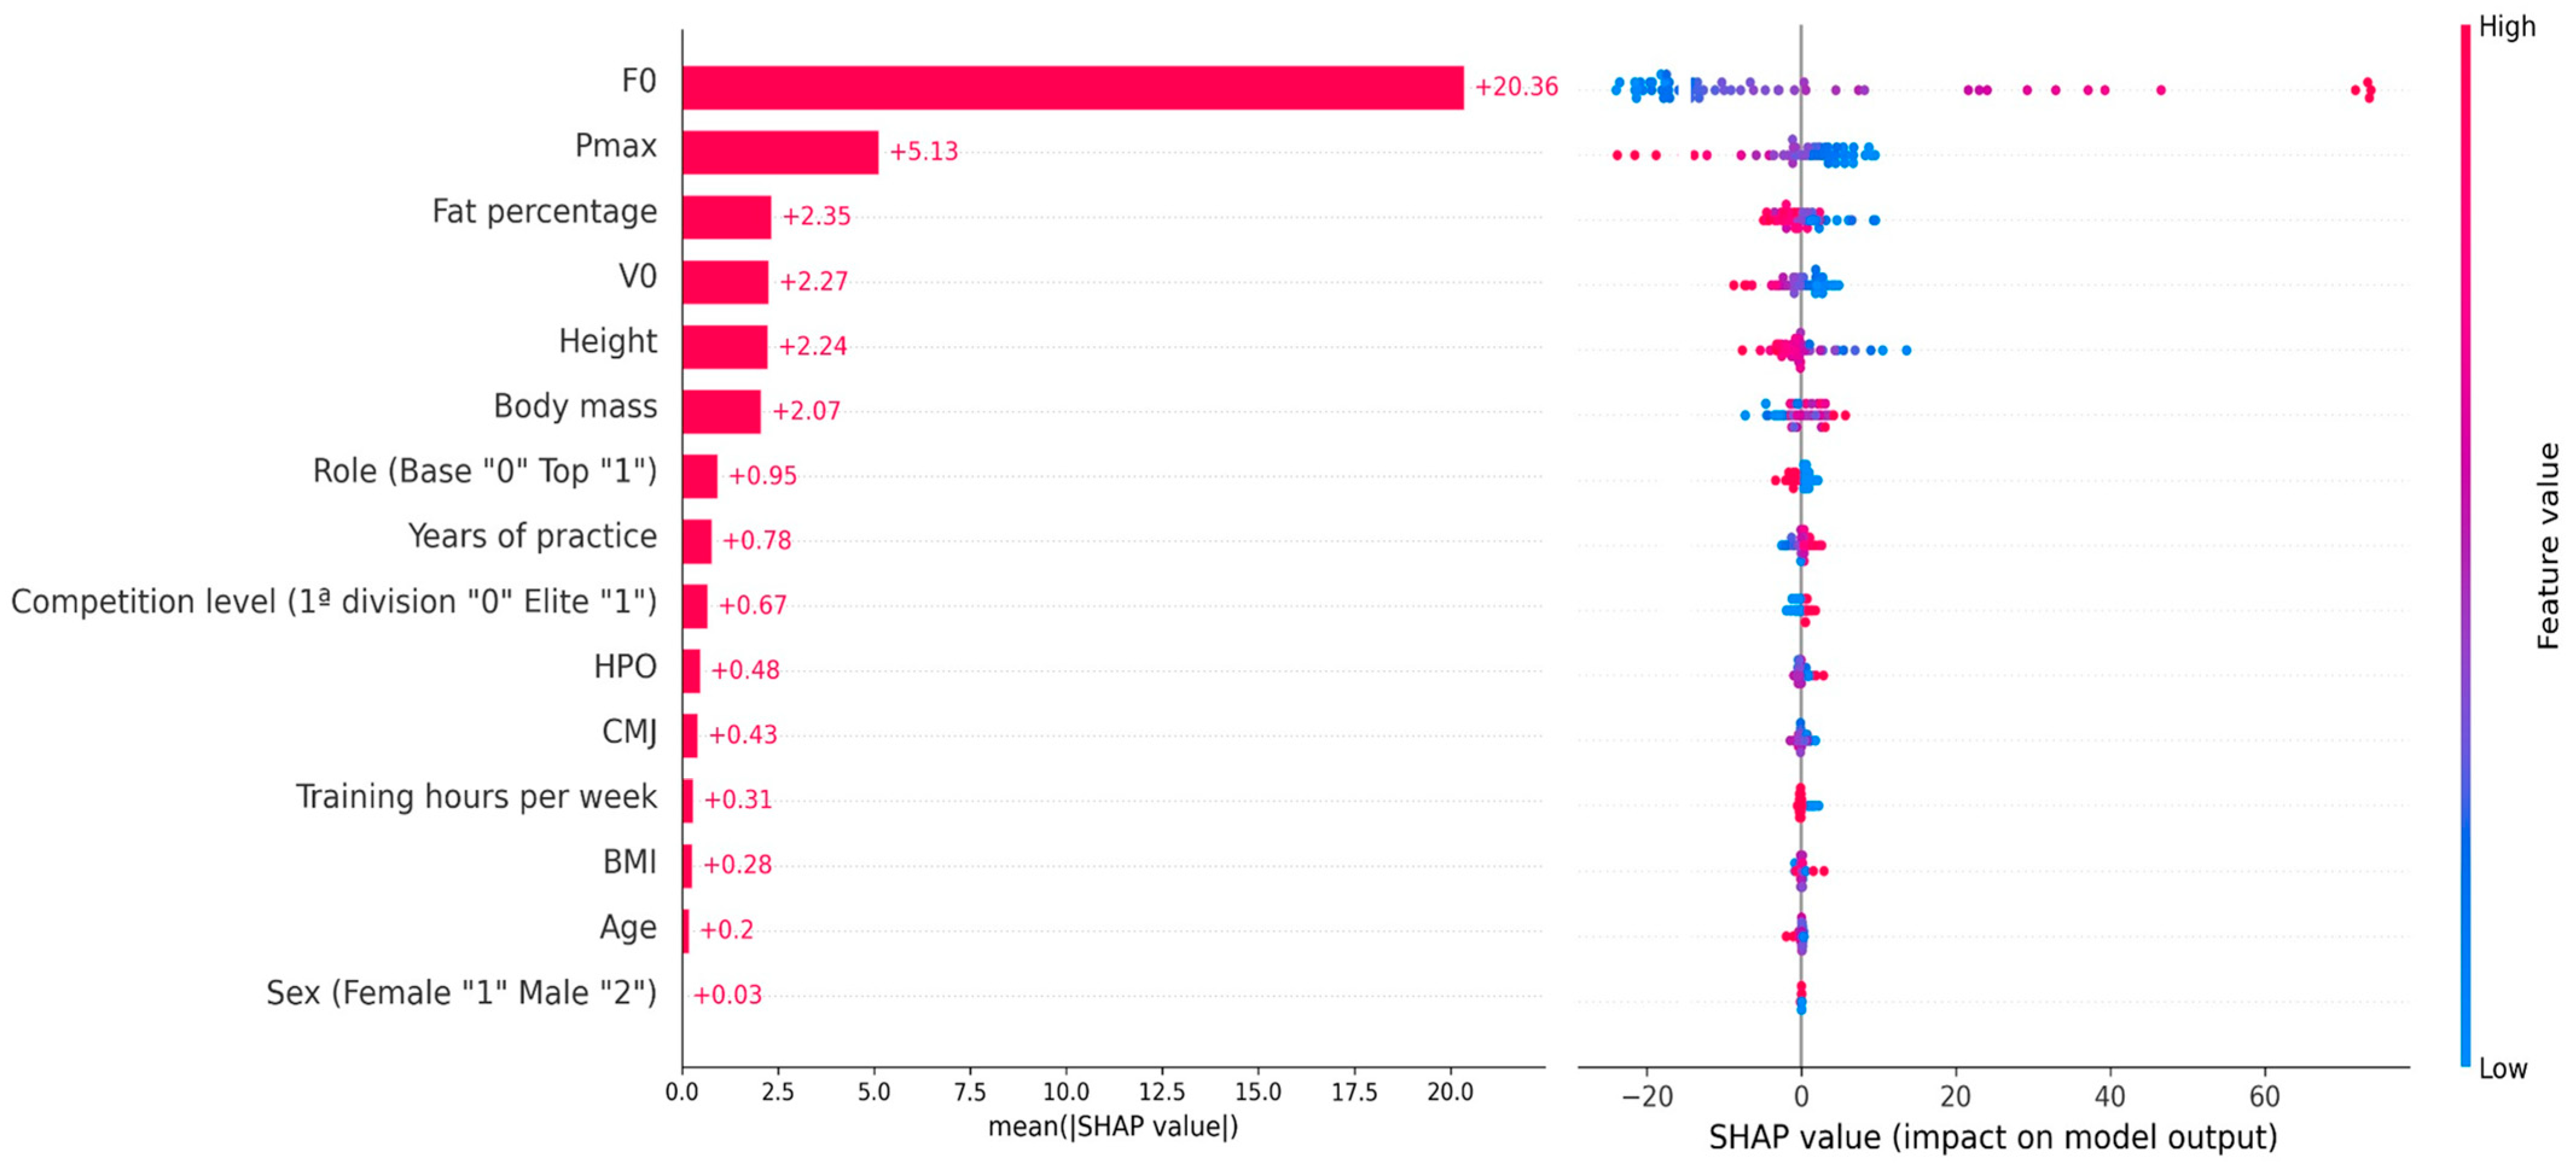
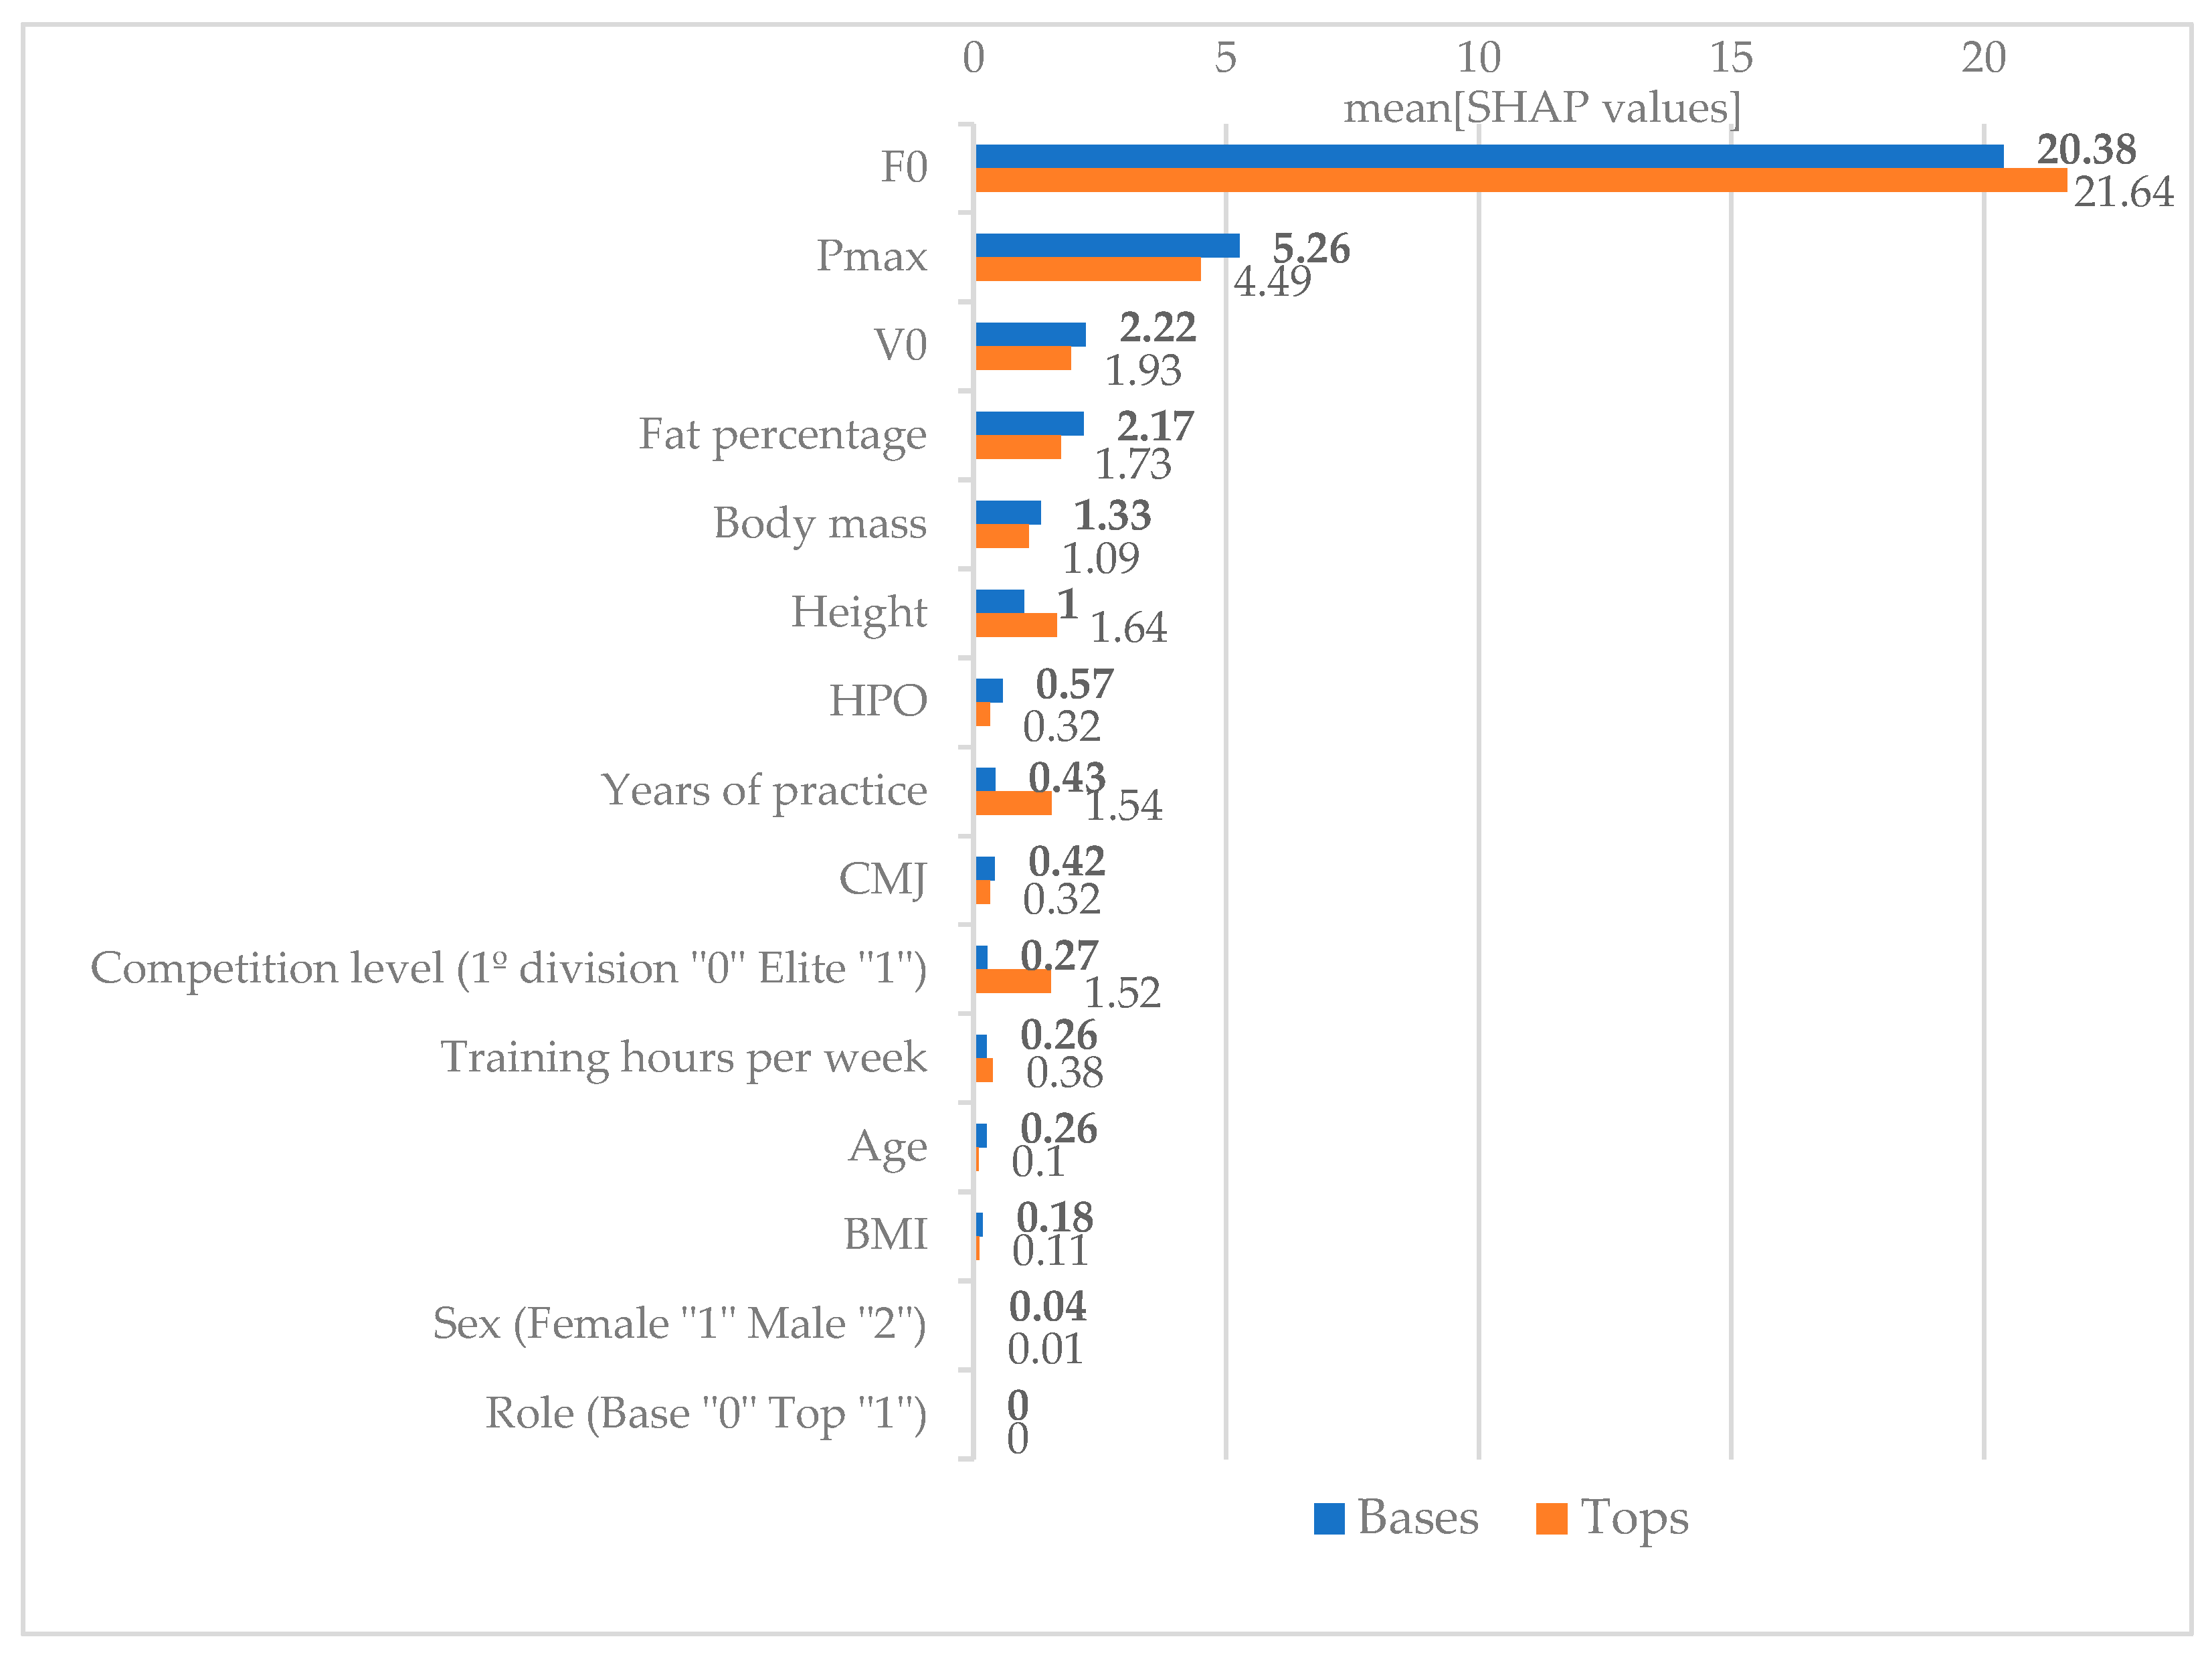
Data are presented as mean ± SD using IBM SPSS Statistics for Windows, Version 27.0., Armonk, NY, USA. The variables’ normal distribution was confirmed by Shapiro–Wilk’s test and variance homogeneity by Levene’s test. Descriptive analysis was obtained for all variables. Student’s t-test for independent samples with effect size estimation was used for comparing tops and bases. The guidelines used for the interpretation of Cohen’s d effect size were that a small effect = 0.2, a medium effect = 0.5, and a large effect = 0.8 [27]. The significance level was set at p ≤ 0.05.
A deep artificial neural network model was then developed to assess the relationship between the dependent variables and gymnasts’ FVimb. Considering that 28 gymnasts participated in this work and that each gymnast performed two jumping performance evaluations, the neural network accounted for 56 inputs, since each subject represents an independent input. The structure was developed in Python (version 3.9.2) through the TensorFlow© library (Google), using an input layer with 15 variables, representing the dependent variables, 3 hidden layers (hyperbolic tangent, sigmoid, and linear rectified activation functions, respectively) with 1000 neurons each, and the output layer with 1 variable, representing the independent variable (FVimb, Figure 1).
The sample was randomly divided into training and test sets (70% and 30% of the subjects, respectively). In the model training, the root mean square propagation adaptive learning algorithm was used, with a loss function based on the mean square error and a learning rate of 0.001. A limit of 200.000 epochs was established for training, and a checkpoint function was used to store the information of the best weight configuration (by monitoring the root mean square error), thus avoiding overtraining. The final model reached a value of 0.0001 of the latter error after 58.480 epochs, with R2 = 0.97. Training, test sets, and all subjects’ performance were measured using the coefficient of determination of linear regressions between targets and output values (Figure 2). The model interpretation was based on the Shapley additive explanations values (SHAPs), which are aligned with human intuition and allow to discriminate among model output classes with improved generalization and representation of the nonlinear systems’ behavior, like human athletic performance [28,29].

3. Results

Table 1 presents the results from the comparison of the subject information, anthropometric, and F-V variables of top and base gymnasts.
Age, sex, all the anthropometric variables, Pmax, and CMJ height present significant differences between roles. Bases present higher values for all variables, except for fat percentage, which is, on average, 2% higher in tops (Table 1).
The relative importance of each variable for the F-V profile that was demonstrated by all the gymnasts are presented in Figure 3. The left side of this figure presents the mean SHAP values that were obtained for each variable. The F0 variable presents the highest contribution (20.36 SHAP values), followed by Pmax (5.13 SHAP values). Fat percentage, V0, height, and body mass make similar contributions (2.35, 2.27, 2.24, and 2.07 SHAP values, respectively). The role performed, years of practice, and competition level are placed in the middle of the hierarchy (0.95, 0.78, and 0.67 SHAP values, respectively). The age and sex variables showed marginal effects in explaining the F-V profile but remained relevant for the model construction.
A variable’s positive or negative impact on the F-V profile (the model output) can be interpreted on the right panel of Figure 3. The results show that the FVimb increases with higher F0 values and decreases with higher values of Pmax, fat percentage, V0, height, and the role performed (bases “0” or tops “1”). This result suggests that being a top gymnast may be associated with a reduced FVimb in comparison to being a base gymnast (0.95 SHAP values). With a smaller individual expression, more years of practice and a higher competition level, i.e., being an elite-level gymnast contribute to a higher FVimb (0.67 SHAP values). Although the variables body mass index, age, and sex play a collaborative role in the model construction, they do not show relevant individual contributions. In addition, when the red color appears on both the positive and negative sides of the graphic (e.g., fat percentage or body mass), this indicates that these variables are important for the model as cooperative variables and should be interpreted in combination with other variables.
When the model was exposed only to tops or bases separately, the hierarchy of importance of the first four variables remained the same, regardless of the role that gymnastsperformed. This means that the changes in FVimb were promoted mostly by changes in F0, followed by Pmax, V0, and fat percentage for both roles (Figure 4). From this point on, Figure 4 shows the different contributions of each input variable according to the role performed, indicating the discriminating variables between roles. Height, years of practice, and competition level are relevant for top gymnasts, and body mass, height, and HPO have greater impact for base gymnasts.

4. Discussion

This work aimed to investigate a hierarchy of factors that influence the F-V profile of base and top acrobatic gymnasts, using a deep artificial neural network model. The results showed that the selected variables explained the variations in the F-Vimb of acrobatic gymnasts and that such a model was also able to distinguish between top and base groups, allowing us to understand the main characteristics of their jumping skill, considering their specific training and role.
Age and anthropometric measures were different between tops and bases, with the body fat percentage being the only variable that was higher in tops (2%). This finding was not expected, since top gymnasts have a greater role specificity, being responsible for carrying out a variety of elements while being supported and propelled by the bases [30]. However, this can be an effect of gymnasts’ growth, development, and maturation [1] and can also be associated with increases in muscle mass and neuromuscular development of the bases, that are positively linked to responses to training and competition [31].
The role played in ACRO is strongly influenced by physical characteristics, with bases being associated with an endo-mesomorphic and tops with a balanced mesomorphic somatotype, similar to artistic gymnasts [4]. Although anthropometric variations are part of this gymnastics discipline, they are limited by the Code of Points. For instance, in the senior age group, athletes may receive a penalty in the final score of each exercise if the height difference between partners is larger than 29.99 cm [3].
In fact, gymnasts develop jumping and bouncing skills at early ages [1], and the CMJ has been used to evaluate the power of the lower limbs of dancers and rhythmic gymnasts [21,32]. Compared to the present top group, 13-year-old ballet dancers presented similar CMJ heights when evaluated with the same instrument [32]. Bases presented higher Pmax and CMJ height than tops considering that jumping performance is expected to increase with growth and/or age [33,34]. In fact, the additional effects of training experience and biological maturation positively influenced the performance of young basketball players, suggesting that coaches should focus not only on athletes’ body sizes, but also on their skill level, especially during adolescence [35].
Professional ballet dancers at all company ranks (18.94 ± 1.32 years old) were classified as velocity-oriented [12], and adolescents (13.6 years old) also tend to show a more velocity-oriented profile compared to children (8.1 years old) [36]. The interpretation of the F-V profile of the present sample indicates that both roles present, on average, a low-force deficit, which may negatively affect the jumping skill and, therefore, the quality of their performance [26]. Accordingly, it is important that ACRO coaches invest in strength- and jump-specific training, both in younger and older gymnasts. A previous study demonstrated that a combination of heavy resistance training with high-impact plyometric jumps is effective in prepubertal gymnasts, despite their initial high level of physical conditioning [1].
In the present sample, F0 was the most important variable for the F-V relationship, followed by Pmax. However, while a higher F0 contributed to an increased FVimb, a higher Pmax reduced the FVimb, as well as the V0. This was expected, considering that the maximal concentric muscle force decreases as the velocity of movement increases [2]. Previous studies also showed the influence of the range of motion in the vertical jumping performance of children training ACRO twice a week, instead of improving the ground reaction force in the same phases [8]. The influence of the range of motion was also relatively greater in prepubescent girls than in adult females [37]. These considerations show the importance of coaches having clear information on the variables that are required to develop in ACRO, considering the role performed. The identification of the vertical jump mechanical determinants may assist in strengthening the weaker components of the F-V profile throughout the training process [38].
The role performed in ACRO shows different F-V relationships. There is a tendency for top gymnasts to present a reduced F-Vimb, suggesting that the force and velocity components may be more balanced compared to bases. A higher competition level, i.e., being an elite gymnast, is also associated with a higher F-Vimb. Still, these findings must be interpreted carefully, since both the role performed and the competition level presented reduced individual contributions, i.e., 0.95 and 0.67 SHAP values, respectively, which makes it difficult to generalize this specific result to the gymnastics community. A possible remark is that this may be linked to a greater specialization [7], which is expected as gymnasts get older. In fact, as the athlete’s level and training background increase, the difficulty of producing training adaptations in maximal power activities, such as vertical jumps, also increases [2].
In sprint performance, the F-V slope decreases with maturation and age, strengthening the relevance of F0 in contrast to V0 [39]. For young soccer players, jumping force highly explained the variability in maturity offset and chronological age, along with the F-V slope, indicating that force is the mechanical determinant that develops the most across the maturation process or age, while other variables, such as velocity, are not expected to increase [38]. However, a significant improvement in sprint performance is associated with the ability to develop horizontal forces at high velocities and to not develop a high level of resultant force, which is mainly associated with an increase in the mechanical effectiveness of the force application to the ground with increasing velocity [36]. Learning the consequences of applied forces is necessary to improve a sports skill. In ACRO, the balance between force and power is necessary to achieve the expected effect on motion, either for the top or the base. Further studies are required to evaluate if this information applies to the pair/group execution.
The neural networks of the separate data from tops or bases showed that the hierarchy of importance of the first four variables was the same for both roles. From that point on, the variables were presented in a different hierarchy for tops and bases, suggesting different adaptations for each role. In the following order, body mass, height, and HPO are the salient variables for explaining the FVimb of base gymnasts, while height, years of practice, and competition level are the same for tops. Our work has highlighted the different anthropometric measures between roles, since bases are heavier and taller and present a higher HPO. A possible remark is that the anthropometric differences, as well as maturation and age variations between roles, gave an advantage to the bases for achieving a higher CMJ height, which is similar to a previous work’s findings [9]. In fact, the largest correlations were identified in the F0 and Pmax and both the maturity offset and chronological age of both horizontal and vertical F-V profiles, regardless of body size and experience [38]. These findings highlight the importance of task specificity to assess the neuromuscular capabilities of athletes [22].
The major limitation of this work is the reduced male sample, which results from the imbalance between the number of males and females practicing the sport and at this level of competition. The general sample size is also reduced, making it difficult to generalize the results to different contexts. We have included all the available gymnasts at this competition level and two evaluations for each gymnast; therefore, the results apply to this specific context of high-level acrobatic gymnasts with different roles (bases and tops). Like other gymnastics disciplines, Acrobatics is characterized by its early specialization, in which from the age of 12, gymnasts can compete at a high-performance level. Therefore, another limitation is the uncontrolled effect of age/maturation processes in a large age span, which could have provided important information to support several outcomes, using variables such as the maturity offset and peak height and weight velocity. We have collected anthropometric measures, in which the HPO is the one that provides more detailed information in terms of the effect of the lower limb length on jumping performance. For future studies, we recommend the use of representative samples to verify the results achieved, perhaps using gymnasts from different clubs and nationalities, to assess a larger number of high-performance gymnasts.
The hierarchy of variables established in this investigation (regardless of and considering the role) provides an important tool for ACRO coaches to understand the weight that each input has on the final output. Our results showed that F0, Pmax, V0, and body fat percentage are key for both roles, i.e., they present the same hierarchy of importance. From this point on, the discriminating variables between roles, which are important for the training of tops and bases, are height, years of practice, and competition level for top gymnasts and body mass, height, and HPO, with a greater impact for base gymnasts (in this order).

5. Conclusions

On average, acrobatic gymnasts present a low-force deficit, regardless of the role performed, which may negatively affect their jumping skill and quality of performance. Therefore, it is important that ACRO coaches invest in strength- and jump-specific training, both in younger and older gymnasts.
The neural network results showed that F0 is the key variable for the F-V profile of acrobatic gymnasts, followed by Pmax. In addition, the FVimb of acrobatic gymnasts increases with higher F0 values and decreases with higher values of Pmax, fat percentage, V0, and height. With a minor individual contribution, being a top gymnast may lead to more balanced force and velocity components in comparison to being a base gymnast, and a higher competition level, i.e., being an elite gymnast is also associated with a higher F-Vimb. Nevertheless, further studies are required to understand the impact of these two findings in the gymnastics community.
Thus, FVimb could be considered a potentially useful variable for monitoring jumping performance in this sport. ACRO coaches should target F0 development as their main priority, followed by Pmax and V0 for the optimization of gymnasts’ jumping performance. In addition, ACRO coaches should also focus on the contribution of the anthropometric measures (bases) and the training experience and competition level (tops) for the F-V profile, according to the role performed.

Author Contributions

Conceptualization, M.G., L.Á.-C., F.C. and I.L.; methodology, I.L., P.F., L.Á.-C. and F.C.; formal analysis, I.L. and M.G.; writing—original draft preparation, I.L., L.M. and L.Á.-C.; writing—review and editing, P.F., J.P.V.-B. and F.C.; visualization, M.G., P.F. and I.L. All authors have read and agreed to the published version of the manuscript.

Funding

This research was funded by Fundação para a Ciência e Tecnologia (FCT), grant number 2021.06653.BD (https://doi.org/10.54499/2021.06653.BD).

Institutional Review Board Statement

The study was conducted in accordance with the Declaration of Helsinki and approved by the Institutional Ethics Committee of the Faculty of Sport, University of Porto (CEFADE 02 2022, 18 January 2022).

Informed Consent Statement

Informed consent was obtained from all subjects involved in the study.

Data Availability Statement

The data presented in this study are available on request from the corresponding author.

Acknowledgments

We would like to thank all the gymnasts and coaching staff for collaborating in this investigation.

Conflicts of Interest

The authors declare no conflicts of interest. The funders had no role in the design of the study; in the collection, analyses, or interpretation of data; in the writing of the manuscript; or in the decision to publish the results.

References

  1. Marina, M.; Jemni, M. Plyometric training performance in elite-oriented prepubertal female gymnasts. J. Strength Cond. Res. 2014, 28, 1015–1025. [Google Scholar] [CrossRef] [PubMed]
  2. Kraemer, W.J.; Newton, R.U. Training for muscular power. Phys. Med. Rehabil. Clin. 2000, 11, 341–368. [Google Scholar] [CrossRef]
  3. Fédération Internationale de Gymnastique. Acrobatic Gymnastics Code of Points 2022–2024. Available online: https://www.gymnastics.sport/publicdir/rules/files/en_2022-2024%20ACRO%20CoP.pdf (accessed on 13 September 2023).
  4. Taboada-Iglesias, Y.; Gutierrez-Sanchez, A.; Vernetta Santana, M. Anthropometric profile of elite acrobatic gymnasts and prediction of role performance. J. Sports Med. Phys. Fit. 2016, 56, 433–442. [Google Scholar]
  5. Vernetta, M.; Montosa, I.; López-Bedoya, J. Lesiones en jóvenes gimnastas femeninas de acrobática de la élite nacional. Rev. Iberoam. De Cienc. De La Act. Física Y El Deporte 2019, 7, 71–84. [Google Scholar] [CrossRef]
  6. Bradley, E.; Harrington, K.; Tiffin, C. A comparison of a tucked back somersault between novice and experienced acrobatic gymnasts: An inertial measurement approach. In Proceedings of the ISBS Proceedings Archive: ISBS Conference 2020, Liverpool, UK, 21–25 July 2020. [Google Scholar]
  7. Gómez-Landero, L.A.; Leal Del Ojo, P.; Walker, C.; Floría, P. Static balance performance differs depending on the test, age and specific role played in acrobatic gymnastics. Gait Posture 2021, 90, 48–54. [Google Scholar] [CrossRef]
  8. Floria, P.; Harrison, A.J. Influence of the range of motion of jumping height in childhood. In Proceedings of the 29 International Conference on Biomechanics in Sports (2011), Porto, Portugal, 27 June–1 July 2011. [Google Scholar]
  9. Leite, I.; Goethel, M.; Conceição, F.; Ávila-Carvalho, L. How Does the Jumping Performance Differs between Acrobatic and Rhythmic Gymnasts? Biomechanics 2023, 3, 457–468. [Google Scholar] [CrossRef]
  10. Samozino, P.; Rejc, E.; Di Prampero, P.E.; Belli, A.; Morin, J.-B. Optimal force–velocity profile in ballistic movements—Altius: Citius or Fortius? Med. Sci. Sports Exerc. 2012, 44, 313–322. [Google Scholar] [CrossRef] [PubMed]
  11. Samozino, P.; Edouard, P.; Sangnier, S.; Brughelli, M.; Gimenez, P.; Morin, J.-B. Force-velocity profile: Imbalance determination and effect on lower limb ballistic performance. Int. J. Sports Med. 2014, 35, 505–510. [Google Scholar] [CrossRef]
  12. Alvarez, J.A.E.; Reyes, P.J.; Sousa, M.A.P.; Conceicao, F.; Garcia, J.P.F. Analysis of the Force-Velocity Profile in Female Ballet Dancers. J. Danc. Med. Sci. 2020, 24, 59–65. [Google Scholar] [CrossRef]
  13. Yang, H. Application of Multilayer Neural Network in Sports Psychology. Sci. Program. 2022, 2022, 3692428. [Google Scholar] [CrossRef]
  14. Linder, R.; Mohamed, E.I.; De Lorenzo, A.; Pöppl, S.J. The capabilities of artificialneural networks in body composition research. Acta Diabetol. 2003, 40, s9–s14. [Google Scholar] [CrossRef] [PubMed]
  15. Maszczyk, A.; Gołaś, A.; Pietraszewski, P.; Roczniok, R.; Zając, A.; Stanula, A. Application of Neural and Regression Models in Sports Results Prediction. Procedia—Soc. Behav. Sci. 2014, 117, 482–487. [Google Scholar] [CrossRef]
  16. Garnica-Caparrós, M.; Memmert, D. Understanding gender differences in professional European football through machine learning interpretability and match actions data. Sci. Rep. 2021, 11, 10805. [Google Scholar] [CrossRef] [PubMed]
  17. Jiménez-Reyes, P.; Samozino, P.; Pareja-Blanco, F.; Conceição, F.; Cuadrado-Peñafiel, V.; González-Badillo, J.J.; Morin, J.-B. Validity of a simple method for measuring force-velocity-power profile in countermovement jump. Int. J. Sports Physiol. Perform. 2017, 12, 36–43. [Google Scholar] [CrossRef]
  18. Balsalobre-Fernández, C.; Glaister, M.; Lockey, R.A. The validity and reliability of an iPhone app for measuring vertical jump performance. J. Sports Sci. 2015, 33, 1574–1579. [Google Scholar] [CrossRef] [PubMed]
  19. Bogataj, Š.; Pajek, M.; Hadžić, V.; Andrašić, S.; Padulo, J.; Trajković, N. Validity, reliability, and usefulness of My Jump 2 App for measuring vertical jump in primary school children. Int. J. Environ. Res. Public Health 2020, 17, 3708. [Google Scholar] [CrossRef] [PubMed]
  20. Morin, J.-B.; Samozino, P. Interpreting power-force-velocity profiles for individualized and specific training. Int. J. Sports Physiol. Perform. 2016, 11, 267–272. [Google Scholar] [CrossRef]
  21. Ferreira Melo de Sá, L.; Leite, I.; Batista Santos, A.; Tristão Ávila Carvalho, M.d.L. Jump ability and force-velocity profile in Rhythmic Gymnastics. Sci. Gymnast. J. 2023, 15, 225–237. [Google Scholar] [CrossRef]
  22. Junge, N.; Morin, J.-B.; Nybo, L. Leg extension force-velocity imbalance has negative impact on sprint performance in ball-game players. Sports Biomech. 2020, 22, 1027–1040. [Google Scholar] [CrossRef]
  23. Jimenez-Reyes, P.; Samozino, P.; Cuadrado-Penafiel, V.; Conceicao, F.; Gonzalez-Badillo, J.J.; Morin, J.B. Effect of countermovement on power-force-velocity profile. Eur. J. Appl. Physiol. 2014, 114, 2281–2288. [Google Scholar] [CrossRef]
  24. Jimenez-Reyes, P.; Cuadrado, V.; Blanco, F.; Montilla, J.A.; Bendala, F.; González-Badillo, J. Load that maximizes power output in countermovement jump. Rev. Bras. Med. Esporte 2016, 22, 13–16. [Google Scholar] [CrossRef]
  25. Loturco, I.; Nakamura, F.Y.; Tricoli, V.; Kobal, R.; Cal Abad, C.C.; Kitamura, K.; Ugrinowitsch, C.; Gil, S.; Pereira, L.A.; González-Badillo, J.J. Determining the Optimum Power Load in Jump Squat Using the Mean Propulsive Velocity. PLoS ONE 2015, 10, e0140102. [Google Scholar] [CrossRef] [PubMed]
  26. Jimenez-Reyes, P.; Samozino, P.; Brughelli, M.; Morin, J.B. Effectiveness of an individualized training based on force-velocity profiling during jumping. Front. Physiol. 2017, 7, 677. [Google Scholar] [CrossRef] [PubMed]
  27. Cohen, J. Statistical Power Analysis for the Behavioral Sciences, 2nd ed.; Routledge: New York, NY, USA, 1988; p. 567. [Google Scholar]
  28. Lundberg, S.M.; Lee, S.-I. A unified approach to interpreting model predictions. Adv. Neural Inf. Process. Syst. 2017, 30, 1–10. [Google Scholar] [CrossRef]
  29. Perl, J. Artificial Neural Networks in Sports: New Concepts and Approaches. Int. J. Perform. Anal. Sport 2001, 1, 106–121. [Google Scholar] [CrossRef]
  30. Taboada-Iglesias, Y.; Vernetta-Santana, M.; Alonso-Fernandez, D.; Gutierrez-Sanchez, A. Anthropometric Specificity and Level of Participation in Acrobatic Gymnastics Based on Sex. Int. J. Morphol. 2019, 37, 1534–1540. [Google Scholar] [CrossRef]
  31. Guimarães, E.; Baxter-Jones, A.D.G.; Williams, A.M.; Tavares, F.; Janeira, M.A.; Maia, J. The role of growth, maturation and sporting environment on the development of performance and technical and tactical skills in youth basketball players: The INEX study. J. Sports Sci. 2021, 39, 979–991. [Google Scholar] [CrossRef]
  32. Ávila-Carvalho, L.; Conceição, F.; Escobar-Álvarez, J.A.; Gondra, B.; Leite, I.; Rama, L. The Effect of 16 Weeks of Lower-Limb Strength Training in Jumping Performance of Ballet Dancers. Front. Physiol. 2021, 12, 774327. [Google Scholar] [CrossRef]
  33. Temfemo, A.; Hugues, J.; Chardon, K.; Mandengue, S.-H.; Ahmaidi, S. Relationship between vertical jumping performance and anthropometric characteristics during growth in boys and girls. Eur. J. Pediatr. 2009, 168, 457–464. [Google Scholar] [CrossRef]
  34. Focke, A.; Strutzenberger, G.; Jekauc, D.; Worth, A.; Woll, A.; Schwameder, H. Effects of age, sex and activity level on counter-movement jump performance in children and adolescents. Eur. J. Sport Sci. 2013, 13, 518–526. [Google Scholar] [CrossRef]
  35. Guimarães, E.; Baxter-Jones, A.; Maia, J.; Fonseca, P.; Santos, A.; Santos, E.; Tavares, F.; Janeira, M.A. The Roles of Growth, Maturation, Physical Fitness, and Technical Skills on Selection for a Portuguese Under-14 Years Basketball Team. Sports 2019, 7, 61. [Google Scholar] [CrossRef] [PubMed]
  36. Rossi, J.; Slotala, R.; Samozino, P.; Morin, J.B.; Edouard, P. Sprint acceleration mechanics changes from children to adolescent. Comput. Methods Biomech. Biomed. Eng. 2017, 20, 181–182. [Google Scholar] [CrossRef] [PubMed]
  37. Floría, P.; Harrison, A.J. The influence of range of motion versus application of force on vertical jump performance in prepubescent girls and adult females. Eur. J. Sport Sci. 2014, 14, S197–S204. [Google Scholar] [CrossRef] [PubMed]
  38. Fernández-Galván, L.M.; Boullosa, D.; Jiménez-Reyes, P.; Cuadrado-Peñafiel, V.; Casado, A. Examination of the Sprinting and Jumping Force-Velocity Profiles in Young Soccer Players at Different Maturational Stages. Int. J. Environ. Res. Public Health 2021, 18, 4646. [Google Scholar] [CrossRef]
  39. Samozino, P.; Rabita, G.; Dorel, S.; Slawinski, J.; Peyrot, N.; Saez de Villarreal, E.; Morin, J.-B. A simple method for measuring power, force, velocity properties, and mechanical effectiveness in sprint running. Scand. J. Med. Sci. Sports 2016, 26, 648–658. [Google Scholar] [CrossRef]
Figure 1. Model structure of the artificial neural network used. Input layer with 15 variables, representing the dependent variables, 3 hidden layers with 1000 neurons each, and the output layer with 1 variable (F-V imbalance), representing the independent variable.
Applsci 14 03191 g001
Figure 2. Coefficient of determination of the linear regressions between target (real F-V imbalance) and output (estimated F-V imbalance) values for all subjects, training, and testing sets (panel A, B, and C, respectively).
Applsci 14 03191 g002
Figure 3. Hierarchical average impact magnitude for the 15 input variables used on the artificial model and Shapley additive explanation (SHAP) values summary plot with the 15 input variables, ordered by feature importance. The color bar on the right is used to interpret the direction (red) of the relationship between one individual variable and the F-V profile. The strength of the relationships is defined by the amplitude of the SHAP values. F0: maximal theoretical force, Pmax: maximal power output, V0: maximal theoretical velocity, HPO: height of push-off, CMJ: Countermovement Jump, BMI: body mass index, and SHAP: Shapley additive explanations.
Applsci 14 03191 g003
Figure 4. Hierarchical average impact magnitude for the 15 input variables used on the artificial model for base and top gymnasts. SHAP: Shapley additive explanations, F0: maximal theoretical force, Pmax: maximal power output, V0: maximal theoretical velocity, HPO: height of push-off, CMJ: Countermovement Jump, BMI: body mass index.
Applsci 14 03191 g004
Table 1. Comparison of top and base gymnasts: subject information, anthropometrics, and F-V-profile-associated variables.
Variables (Mean ± SD)Top Gymnasts (n = 11)Base Gymnasts (n = 17)p-ValueEffect Size (95% CI)
Subject information
Age (years)13.75 ± 2.1418.15 ± 3.05<0.001 *1.6 (0.1–2.2)
Sex (M; F)M = 1; F = 10M = 3; F = 140.05 *0.5 (−0.0–1.0)
Training experience (years)7.09 ± 3.288.35 ± 3.430.170.4 (−0.2–0.9)
Weekly training volume (hours)29.45 ± 1.7729.29 ± 1.960.75−0.1 (−0.6–0.5)
Level (1st division and elite)1st = 5; E = 61st = 9; E = 80.59−0.1 (−0.7–0.4)
Anthropometrics
Body mass (kg)35.77 ± 7.7063.67 ± 10.70<0.001 *2.9 (2.1–3.6)
Height (cm)145.64 ± 9.66167.67 ± 5.86<0.001 *2.9 (2.1–3.7)
Height of push-off (cm)32.57 ± 4.0938.37 ± 5.25<0.001 *1.2 (0.6–1.8)
Body fat percentage (%)21.72 ± 4.8318.16 ± 5.920.01 *−0.6 (−1.1; −0.1)
BMI (kg/m2)16.64 ± 1.5322.53 ± 2.68<0.001 *2.6 (1.8–3.3)
F-V profile associated variables
F0 (N/kg)29.10 ± 3.1933.57 ± 7.090.88−0.0 (−0.6; 0.5)
V0 (m/s)2.98 ± 1.003.38 ± 1.250.210.3 (−0.2; 0.9)
Pmax (W/kg)24.15 ± 4.8727.20 ± 5.850.04 *0.6 (0.0; 1.1)
CMJ height (cm)29.10 ± 3.1935.30 ± 6.22<0.001 *1.2 (0.6; 1.8)
F-V imbalance (%)81.00 ± 34.9679.56 ± 36.610.88−0.0 (−0.6; 0.5)
BMI: body mass index, CMJ: Countermovement Jump, E: elite level, F: female, F-V: force–velocity, F0: maximal theoretical force, M: male, Pmax: maximal power output, V0: maximal theoretical velocity, 1st: first, * statistically significant differences.
Disclaimer/Publisher’s Note: The statements, opinions and data contained in all publications are solely those of the individual author(s) and contributor(s) and not of MDPI and/or the editor(s). MDPI and/or the editor(s) disclaim responsibility for any injury to people or property resulting from any ideas, methods, instructions or products referred to in the content.

