1. Introduction
The use of autonomous technologies in in the automotive industry is an inevitable trend, as automated driving systems (ADS) can reduce traffic congestion, increase fuel efficiency, and improve road safety [
1,
2,
3]. A prerequisite for realizing these benefits of technology advances and reaching the full potential of automation is that users must trust and accept ADS. But many users may harbor distrust due to their preconceived notions [
4,
5], which may subsequently lead to the disuse of part or all of the functions of the automation [
6]. On the contrary, over-trust in ADS could lead to excessive reliance on this technology, and further, to its misuse [
7], which is suspected to be a major cause of various accidents involving automated vehicles [
8]. To prevent such situations, drivers must be aware of the capabilities and limitations of the ADS they use and adjust their trust level to the real automation capability [
9].
According to the Society of Automotive Engineers (SAE), under certain conditions, highly automated driving systems are responsible for all driving maneuvers on the road [
10], and users of these systems will delegate operational, tactical, or strategic tasks to the driving system and will be encouraged to engage in non-driving related tasks (NDRT) [
11,
12]. In this case, users in the vehicle may have little information about the road ahead, prompting an insufficient awareness of potential hazards, which can exacerbate their feelings of insecurity. Therefore, building user trust in the vehicle system is particularly important in highly automated driving systems.
The industry and academia have been testing methods that have the potential to improve awareness and levels of trust in ADS, such as intelligent agents exhibiting human traits [
13] and system uncertainty information [
14]. One promising approach is the use of automation transparency, which can fill in gaps in people’s understanding of ADS’s behavior and also increase situational trust in ADS by communicating the agent’s explanations, upcoming strategies, or decision-making rationale [
15,
16,
17,
18]. Lyons and Havig defined automation transparency as “the degree of shared intent and shared awareness between a human and a machine” [
19], indicating that transparent automation should communicate its capability and performance, its decision-making logic and rationale, and its intent and future states to the human agent. The majority of research concerning achieving transparency involved the visualization of additional meta-information, or information qualifiers via user interfaces [
20,
21,
22,
23], which has been found to be an intuitive way to convey large amounts of information without increasing the perceived workload [
17,
20,
24].
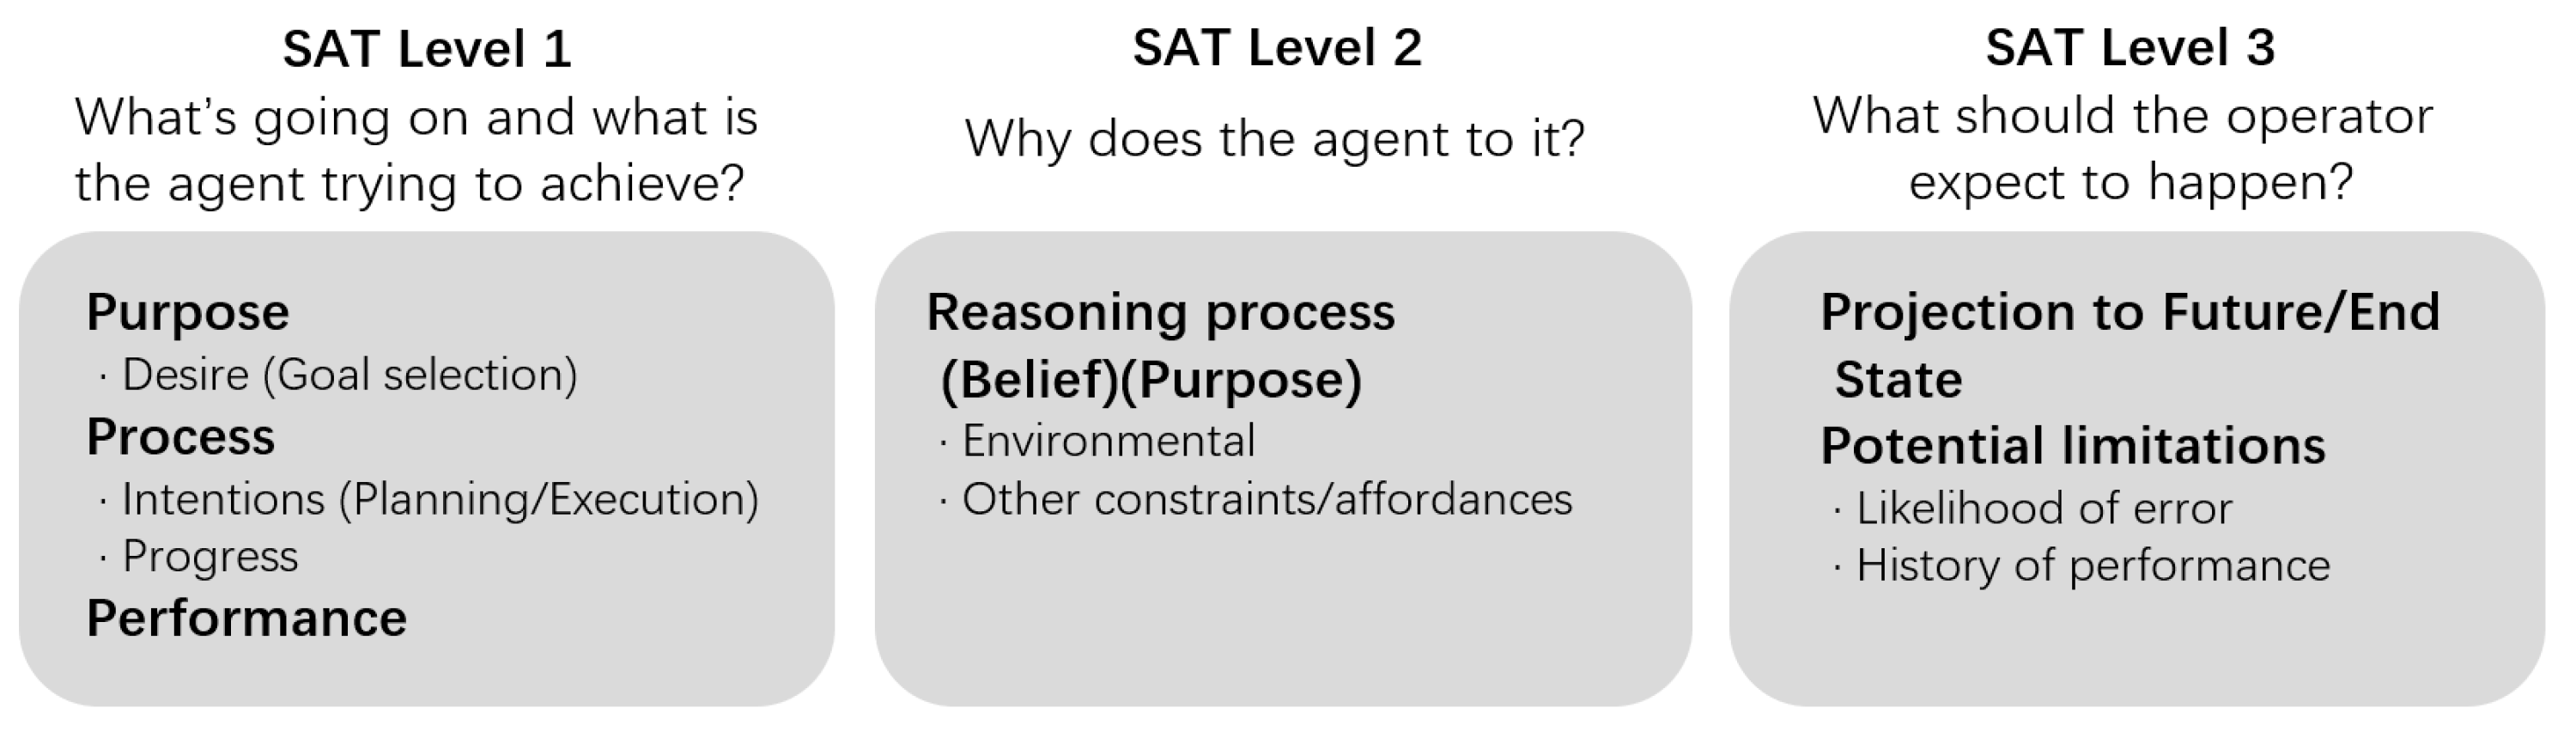
In order to clarify transparency requirements to understand the intelligent agent’s task parameters, logic, and predicted outcomes, Chen et al. developed the Situation Awareness-Based Agent Transparency (SAT) model [
25], based on the theory of situation awareness (SA) [
26], which mirrors the three levels of perception, comprehension, and projection (see
Figure 1). In the SAT model, the basic information about the agent’s current state and goals, intentions, and proposed actions are provided at the first level. The agent’s reasoning process and the constraints/affordances when planning those actions are provided at the second level. Information regarding the agent’s projections of the future states (such as predicted consequences and likelihood of success/failure) are provided at the third level. Previous studies have already confirmed the effects of SAT on operator trust. For example, Stowers et al. indicated that with increasing levels of agent transparency, operator performance and reliance on key parts of the interface increased [
27]. Mercado et al. found that operator performance and trust in the agent increased as a function of the agent transparency level [
20]. Chen et al. found that the SAT model continues to be an effective tool for facilitating shared understanding and proper calibration of trust in human–agent teams [
24]. And in recent studies, conveying the automation’s decision-making rationale via the display resulted in an increase in the participants’ level of trust, which became more calibrated over time [
28,
29].
While understanding the effect of uncertainty at various SAT levels is considered important in ADS, Chen et al. noted that all three levels may not be absolutely necessary to achieve transparency, and in time-sensitive situations, drivers may only need to know the agent’s actions (level 1) and the projections (level 3) to make a sufficiently informed decision [
24]. This is due to the fact that human attention resources are limited, and under time pressure, it may be more feasible to provide the correct levels of information than to provide all of the data, especially in regards to visual or auditory information [
30]. Recently, researchers have begun to emphasize the effect of transparency in time-critical decision and have found that integrating AI transparency into time-critical decision support is complex and requires consideration of the impact on human–machine teaming [
31]. However, according to our review, studies involving ADS transparency have not emphasized time or scenario urgency, but have focused primarily on the effects of the sequential stacking of transparency levels (i.e., comparing SAT level 1, SAT level 1 + 2, and SAT level 1 + 2 + 3) on human trust and reliance regarding ADS [
20,
28,
32]. One of the studies most relevant to our current research is the work of Li et al. [
28], in which the role of the SAT model in different driving scenarios was considered. Another relevant work was the study of Bhaskara et al., which discussed the implications of transparent interfaces to improve human–autonomy teaming outcomes in time-critical environments [
32]. However, these two studies did not focus on the particular role of SAT level 3 information in trust calibration. As of yet, there is still a limited understanding on how SAT affects trust and human–automation team performance, especially what transparency information supports trust calibration in different driving scenarios.
The Current Study
The main purpose of this paper was to examine how transparency information can be presented to support user trust calibration in highly automated driving systems (SAE level 4 automation) under different levels of driving scenario urgency. In highly automated driving systems, the system does not issue takeover requests (TORs), and the driver no longer has the responsibility of supervising driving task, but is free to engage in NDRT. The HMIs in highly automated driving systems are only used to present new possibilities that are not safety critical [
33], such as SAT information about the ADS.
Building on the discussion of projection information (SAT level 3) in a time-sensitive situation [
25,
32], we attempted for the first time to experimentally verify the effects of SAT information obtained from the HMI on driver trust and reliance and particularly, to verify whether SAT level 1 + 3 information offers advantages in terms of enhancing human trust without increasing the workload in urgent driving scenarios. Thus, we designed interface concepts with different levels of SAT information (SAT level 1, SAT level 1 + 3, and SAT level 1 + 2 + 3) and created different urgent driving scenarios in a simulated highly automated driving system to explore the benefits and limitations of these SAT conditions in impacting user trust and reliance on the ADS. We formulated the following hypotheses, based on prior research:
H1: Participants expressed greater reliance on and trust in the ADS after viewing the SAT interface than before this experience.
H2: Participants in high transparency conditions show a greater reliance on and trust in the ADS than those who were in the SAT level 1 condition.
H3: Participants in the low urgency driving scenarios expressed greater reliance on and trust in the ADS than those in the high urgency driving scenarios.
H4: Participants in the SAT level 1 + 3 condition did not have higher workloads compared to those in the SAT level 1 condition, but participants in the SAT level 1 + 2 + 3 condition had higher workloads compared to those in the SAT level 1 condition.
The remaining article is structured as follows; first, a detailed description of the methodology, including the participant details, the apparatus used, the experimental design, and procedures employed, is provided. Then, a statistical analysis is provided to demonstrate the relationship between the data collected and the independent variables. Further, the discussion and interpretation of the experiment results are provided, followed by the study limitations and the scope of future research. Finally, the conclusions of this study are reported.
2. Materials and Methods
2.1. Participants
A total of 38 participants from the local community and university were recruited for this experiment. Upon inspection, data from two participants were excluded from statistical analysis due to consistent manual driving and technical issues. Therefore, the data from a total of 36 participants (16 males and 20 females) were adopted for use in the experiment. The ages or the participants ranged from 23 to 44 years (M = 31.03, SD = 5.78). All participants were required to possess a valid Chinese driver license, and the average driving experience of the participants was 7.17 years (SD = 4.03, range: 1–16 years). All participants reported having normal or corrected-to-normal hearing and vision. The assignment of the participants was counter balanced among three groups, according to the SAT conditions.
2.2. Apparatus
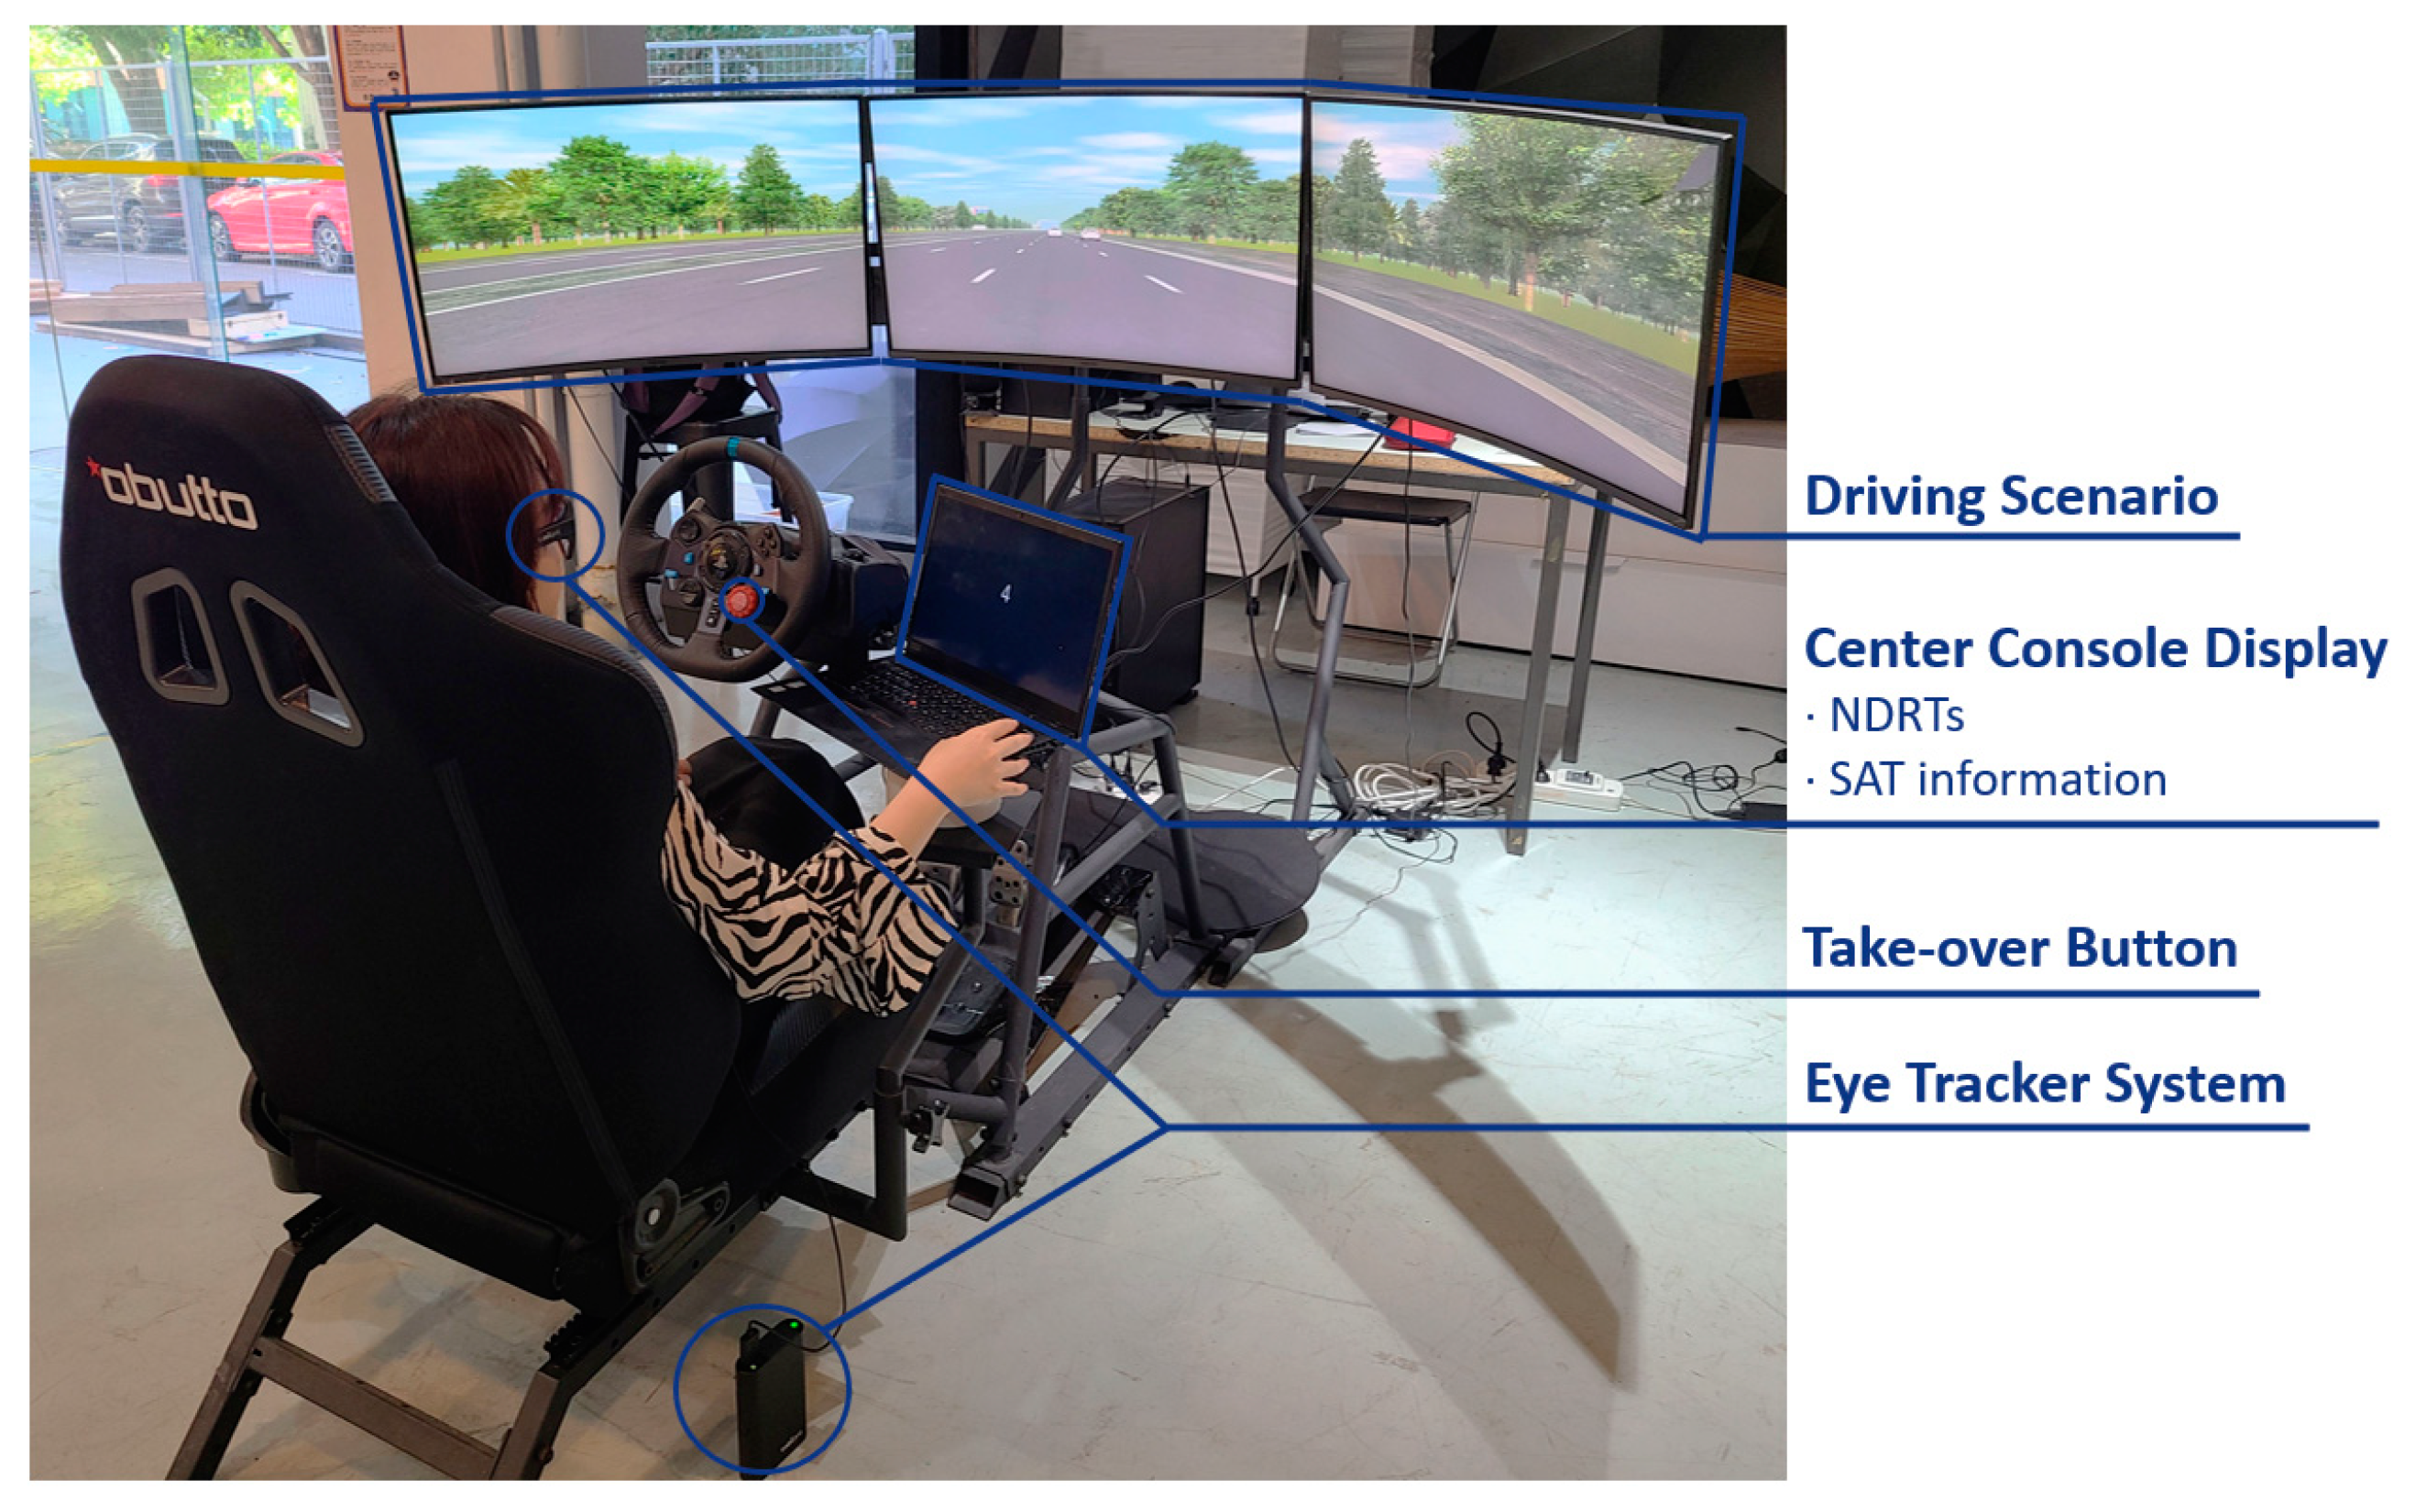
The experiment was carried out using a static driving simulator. The simulator includes three primary monitors (Samsung C32JG50FQC, 27 inches, 1920 × 1080 resolution, Samsung, Seoul, Republic of Korea), active pedals, a force-feedback steering wheel (Logitech G29 dual-motor force feedback steering wheel, Logitech, Lausanne, Switzerland), and an adjustable driver’s seat. A 2.1 surround sound audio system provides replications of the engine and driving sounds of the driver’s own and surrounding vehicles. The automated driving scenarios and functions were programmed and implemented using SCANeR™ studio (AVSimulation, Boulogne-Billancourt, France). The automation could be toggled via the red autopilot takeover button on the steering wheel. On the participants’ right-hand side, a laptop (ThinkPad X1 Carbon 344327C, 14 inches, 1600 × 900 resolution, Lenovo, Beijing, China) was mounted to simulate the vehicle center console display for presenting NDRT and SAT information for the participants. The NDRT and SAT information interface were programmed using ErgoLAB 3.0, which could present material in multiple formats and record participant responses. The SAT information interface for the components was drawn by Figma, and Adobe Premiere Pro 2023 was employed for the motion effects.
For the experiment, the participants were seated in the simulator. A head-mounted eye-tracking system (Tobii Pro Glasses 3) was used to record the participants’ eye gaze data. Tobii Glass 3 1.19.1 software was used to calibrate the eye-tracker, and Tobii Pro Lab was used to analyze the eye movement data of participants. The driving simulator, center console display, and eye-tracking system are shown in
Figure 2.
2.3. Study Design
To investigate the hypotheses, we designed a 3 × 2 × 2 mixed factorial experiment with SAT (SAT level 1/SAT level 1 + 3/SAT level 1 + 2 + 3) as a between-subject factor, and driving scenario urgency (high/low) and driving stage (stage 1/stage 2, referring to the stage before and after viewing the SAT interface) as within-subject factors. Each participant completed two trials of a simulated automated drive, in which each trial consisted of a specific driving event and two stages of smooth automated driving. The participants were required to decide whether to take over the vehicle by combining the driving scenario with the SAT interface during the special driving event. And they were asked to engage in NDRT through the center control display during both stages of smooth automated driving.
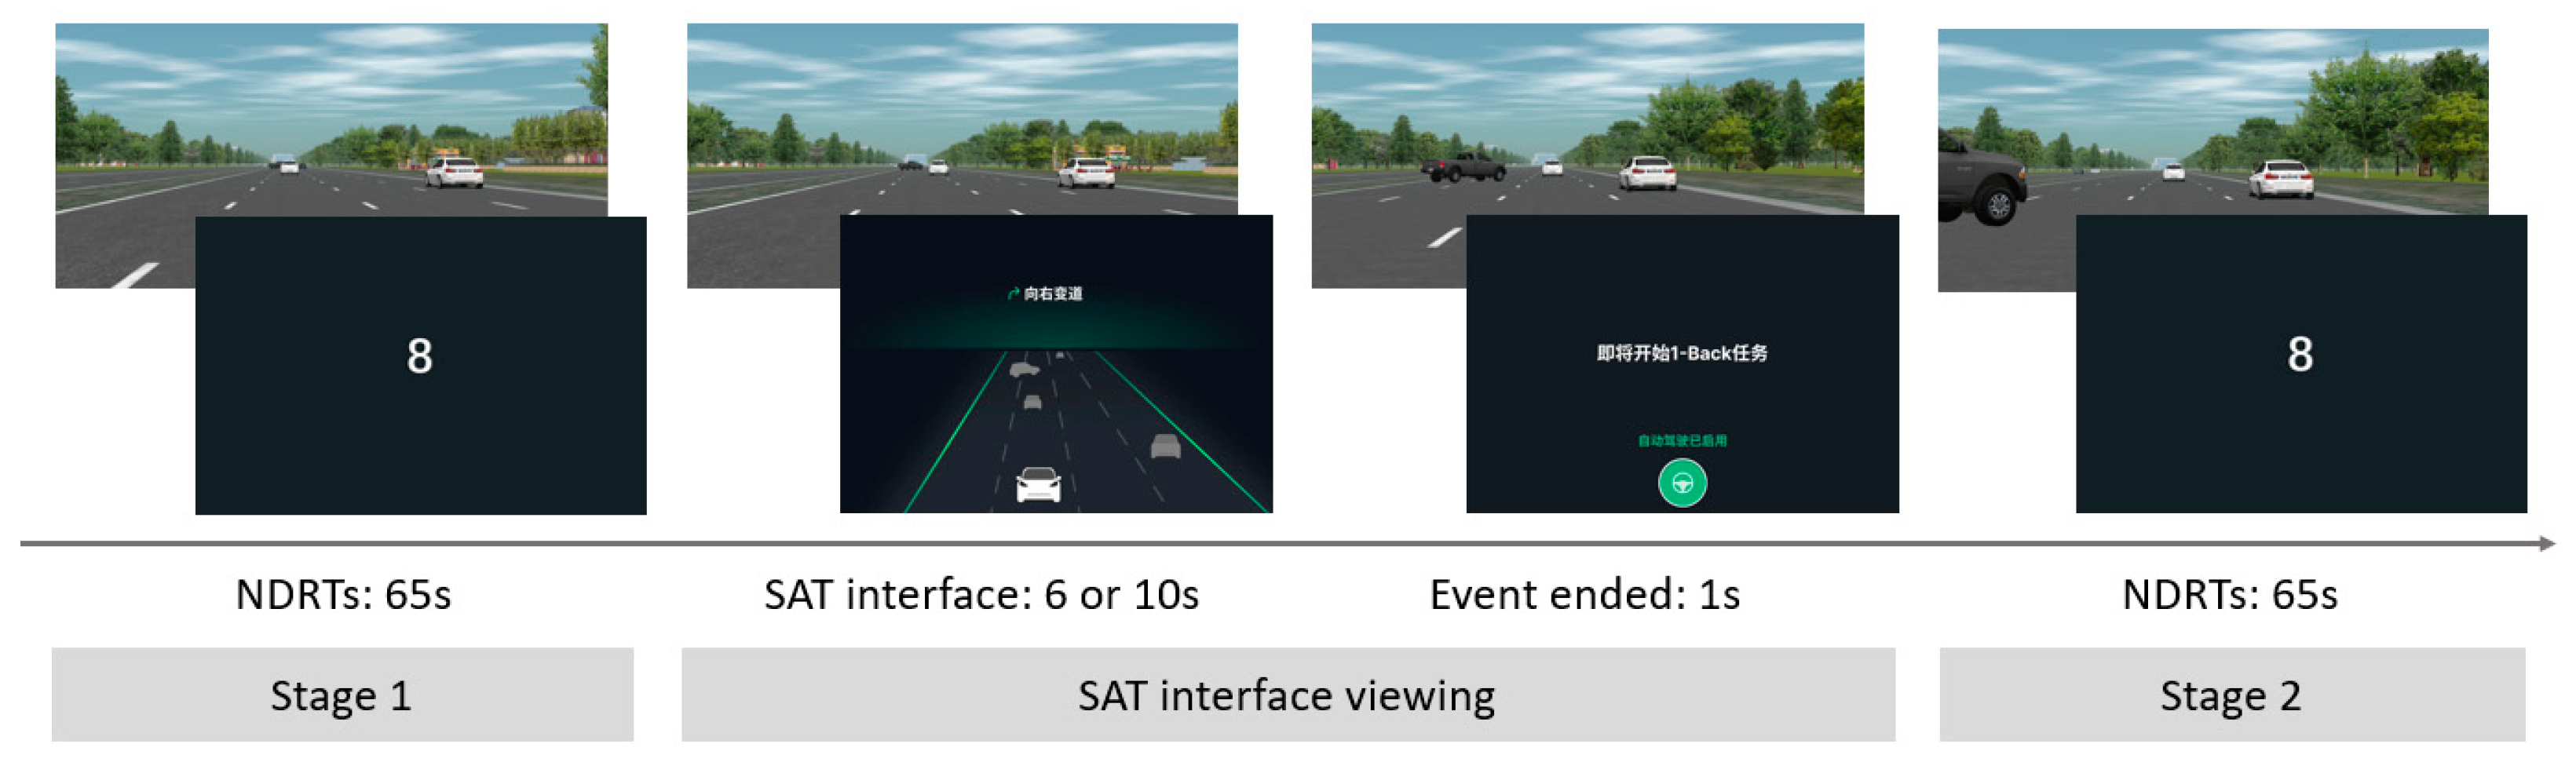
Figure 3 depicts the driving process under the default program (i.e., no takeovers).
The participants’ eye movement data, NDRT performance, and takeover performance throughout the drive were recorded as dependent variables. After the entire drive, the participants were asked to evaluate their trust in the ADS and workload during the drive via accepted scales. Since takeover performance and subjective evaluations were established for the entire trial, this portion of the data was only adopted as the dependent variables in a 3 × 2 (SAT × driving scenario urgency) factorial design. Thus, the dependent variables for the 3 × 2 × 2 mixed factorial design were inlcuded as the participants’ performance on the NDRT and eye-tracking metrics.
2.3.1. Driving Scenario Urgency
The driving scenario was a suburban road with low traffic levels. In this driving scenario, the participant’s vehicle started automatically, was able to handle all situations on the road automatically, and stopped automatically when it reached the destination. Precisely in the middle of the drive, a hazardous event, based on a high-profile collision involving ADS, occurred on the road [
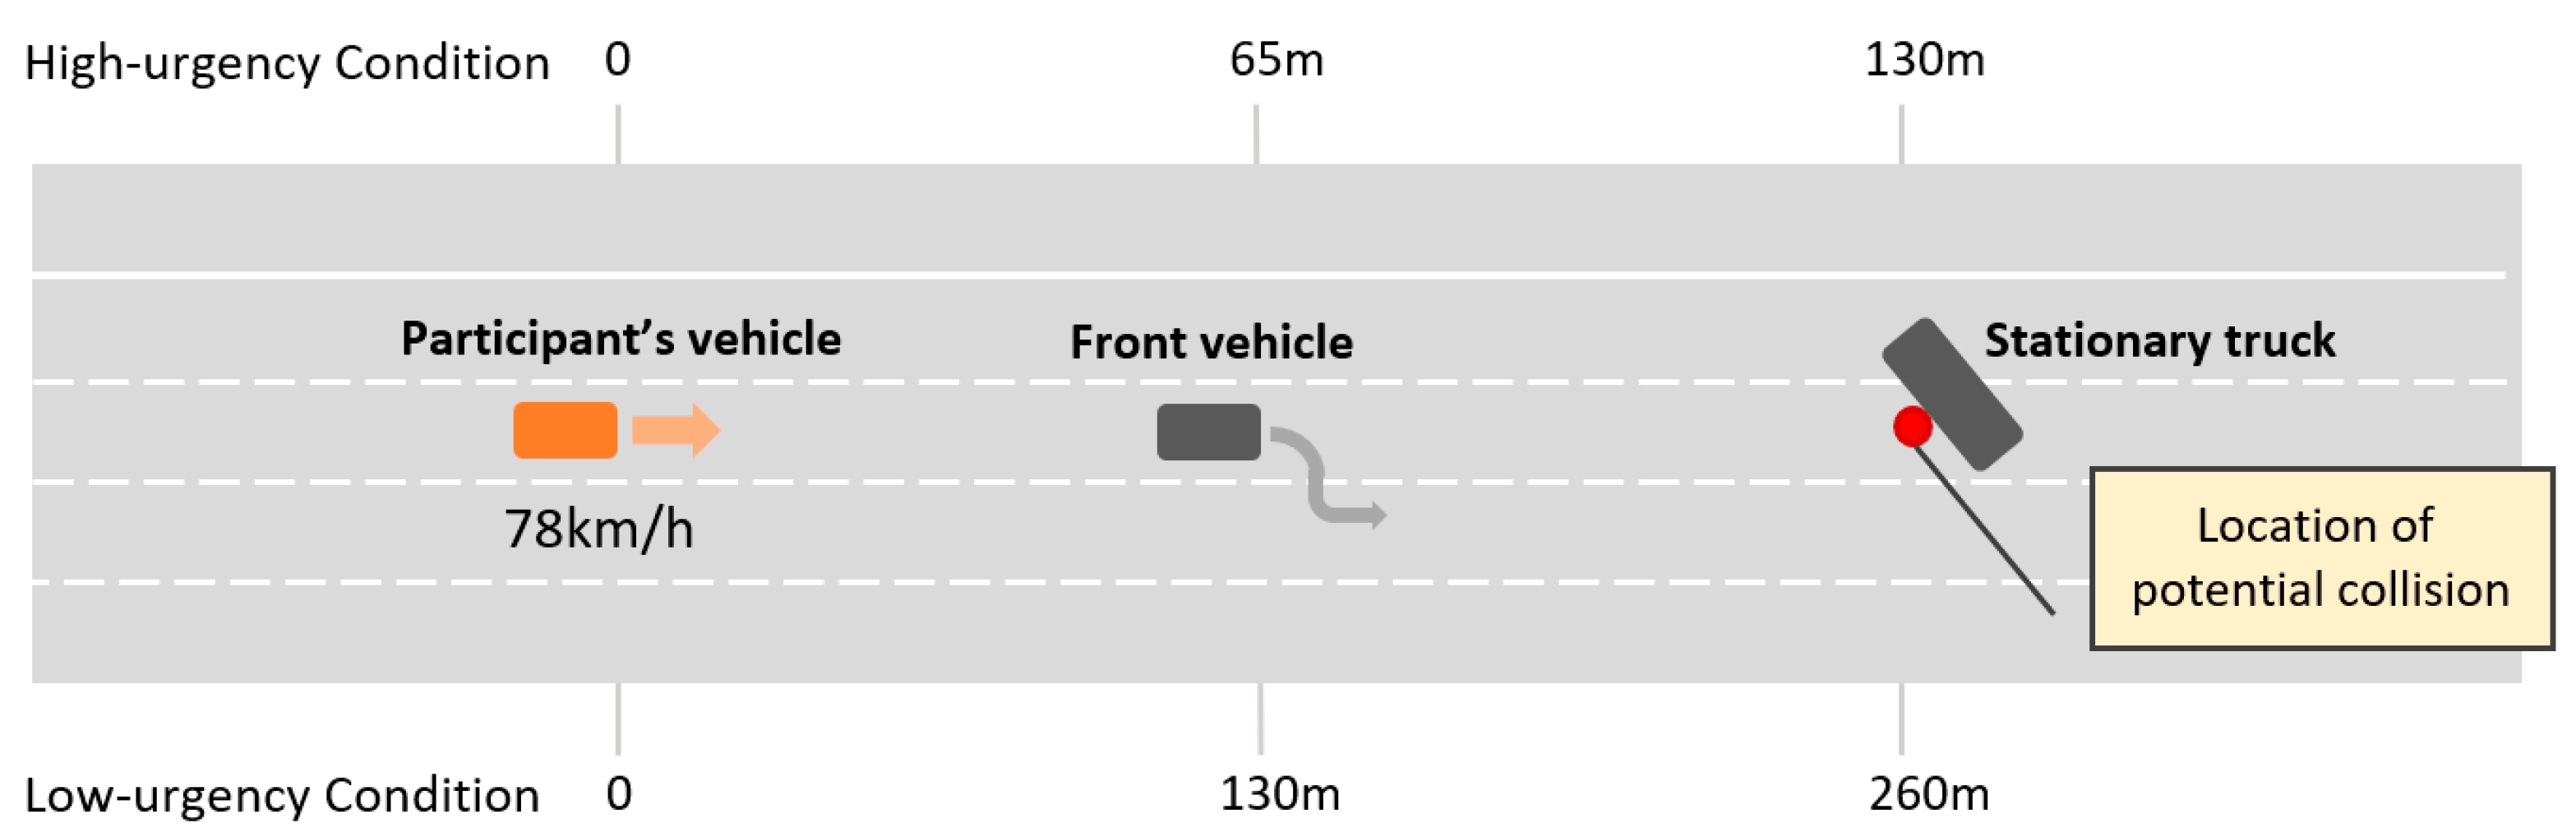
34]. In this real-life collision, an automated vehicle was traveling behind another vehicle. Due to an earlier collision, a truck was parked diagonally across the lane. The lead vehicle changed lanes to avoid the truck. The automated vehicle remained in the lane, accelerated, and struck the rear of the truck (
Figure 4). In this experiment, as soon as the front vehicle changed lanes, the ADS detected the truck ahead and presented the SAT interface. The beginning of the hazardous event occurred when the front vehicle changed lanes, exposing the stationary truck. The end of the hazardous event occurred when the participant’s vehicle completed the automated lane change or takeover and drove away from the hazardous event area.
The independent variable of driving scenario urgency was manipulated according to the timing of the system’s detection of the hazard and the presentation of the SAT interface. Since highly automated driving systems rarely issue TORs, in this experiment, the timing referenced the takeover request lead time (TORlt) in the conditionally automated driving system and the constant speed of 78 km/h of the vehicle during autopilot (taking into account the 70–80 km/h speed limit on Chinese suburban roads). Based on previous studies, an acceptable TORlt was about 6 s when engaged in NDRT [
35], and a relatively sufficient TORlt for driver to react was 12 s [
36]. Thus, under high- and low-urgency conditions, the participant’s vehicle was 130 and 260 m from the hazard when the system detected the danger and presented the SAT interface.
Figure 4 depicts the distances between vehicles under both urgency conditions. For each participant, the order of the two urgency conditions has been balanced using a random generator.
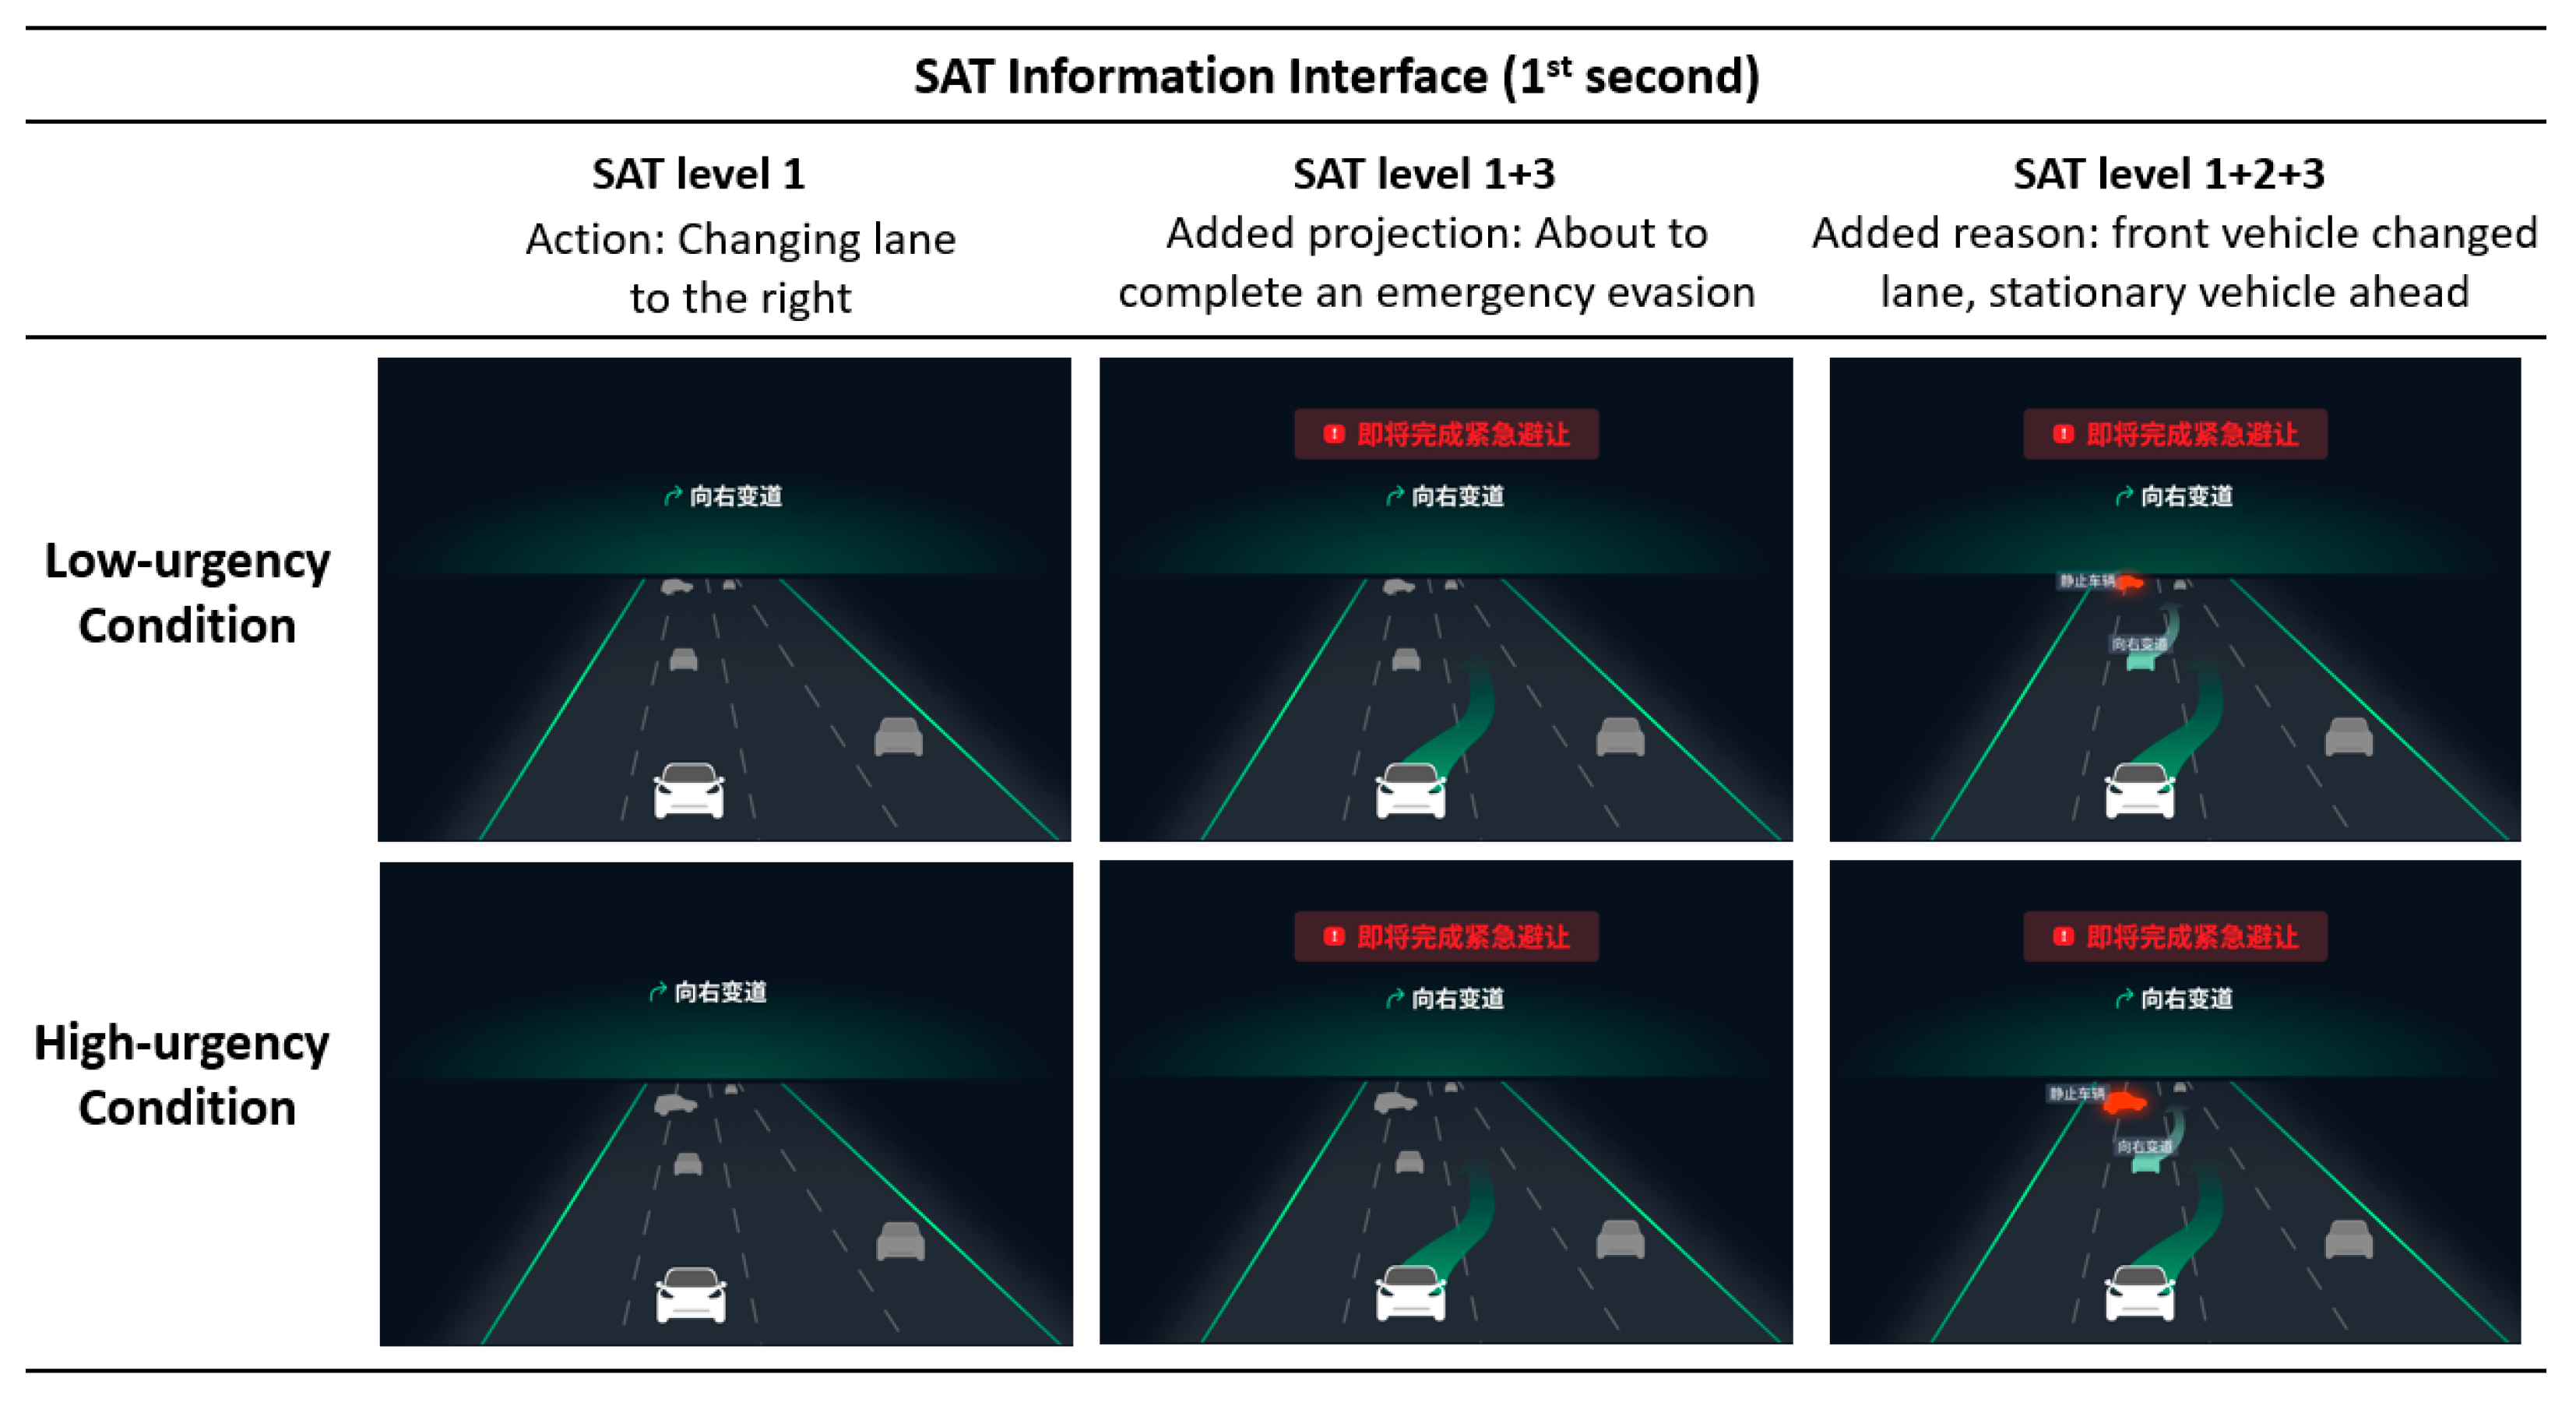
2.3.2. SAT Interface
The SAT interfaces consisted of bird’s eye view videos that correspond to the driving events, including the vehicle the participant was riding in, as well as the surrounding vehicles within a certain distance.
The independent variable of SAT was manipulated across the three experimental conditions. Under the SAT level 1 condition, only the vehicle’s current action was shown; in the SAT level 1 + 3 condition, the vehicle’s action and the projection of the event were revealed; and in SAT level 1 + 2 + 3 condition, the reason for the vehicle taking this action was presented.
Figure 5 depicts screenshots of the interface for the three SAT conditions at the 1st second under the two urgency conditions.
2.4. Dependent Measures
The dependent measures included objective indicators of takeover performance, NDRT performance, eye gaze durations, and subjective measures of situational trust and workload. All the dependent variables, except for workload, were shown to be related to trust or reliance.
2.4.1. Takeover Performance
Since the concept of reliance refers to the operator’s refraining from a response when the system is silent [
37], the driver takeover of the vehicle when the ADS does not issue a TOR represents non-reliance on the system. Takeover in this case was labeled as unanticipated takeover, or unplanned takeover, and was found to disrupt the human–ADS collaborative relationship [
38,
39]. The more frequent and longer this unanticipated takeover lasts, the greater the negative impact on the relationship. Thus, we considered unanticipated takeover (set as a binary variable, i.e., whether or not takeover occurred) and the duration of manual driving after takeover (unit: s) as non-reliance on the ADS, and these were included as dependent variables in this experiment.
2.4.2. NDRT Performance
Higher NDRT performance indicates that participants focus less on supervised driving, and this is often associated with trust in or reliance on the ADS [
40]. Therefore, we designed specific NDRTs and asked participants to engage in them while the vehicle was driving autonomously. The NDRT in this experiment was the one-back task. A series of integers from 0 to 9 was randomly presented in the center of the screen. Whenever the current number was the same as the previous one, the participants were required to press the “→” button on the laptop’s keyboard. During the task, the number switched every 1.1 s. The number would switch to the next one whenever the participant pressed any key. NDRT performance referred to the score for the correct completion of the NDRT, i.e., the number of times a participant correctly completed the NDRT divided by the total number of NDRTs.
In the formal trials, the participant’s vehicle would start automatically, and the center control display began to present the NDRTs. When the vehicle entered the hazardous event area, the NDRT interface switch to the SAT interface. If the participant did not take over the vehicle, the NDRT would be presented again when the event was over (
Figure 3); If the participant took over the vehicle, the NDRT switch to the interface of “manual driving”, and the NDRT would reappear after the participant reactivated the autopilot.
2.4.3. Eye-Tracking Metrics
In highly automated driving systems, the driver no longer has the responsibility for scanning the driving scenario and supervising the driving task [
10]. Therefore, whether or not drivers gaze at the driving scenario frequently or for long periods of time while driving is of interest in this experiment.
Two eye-tracking metrics—the percentage of the duration of the eye gaze on the driving scenario and the percentage of the duration of the eye gaze on the central control display—were used to assess driver monitoring while driving. The two measures referred to the percentage of the duration of eye gaze at the driving scenario or at the central control display under the eye-tracking system. These two gaze areas are shown in
Figure 2.
2.4.4. Subjective Measures
At the end of each drive, the participants were asked to provide subjective evaluations of both trust and workload for the drive they had just completed employing two scales. Each of the scales underwent two rounds of translations and revisions to accommodate the experimental scenario and endure participant understanding.
Table 1 presents the definitions and descriptions of the subjective measures employed in this study.
2.5. Procedure
Upon arrival at the laboratory, each participant was provided with the basic setup of the experiment and was asked to sign an informed consent form and complete a demographic questionnaire. The participants were then asked to sit in a driving simulator and adjust their seats so that they could comfortably reach the wheel, pedals, and keypad for the center control display. Then they were asked to put on the head-mounted eye-tracker, which was then calibrated.
Next, a task introduction and practice session was provided, lasting approximately 5 min. In this session, participants would practice the basic processes of highly automated driving 1–2 times, including auto start, manual takeover, autopilot activation, and auto parking. This session did not involve the hazardous events employed in the formal experiment. The participants in this session were also told that the reliability of the ADS was very high, and that even if the vehicle did not issue a TOR during automated driving, they could take over the vehicle by pressing the takeover button, if they felt that the conditions were unsafe. If the participant took over the vehicle, then they were required to return driving control to the ADS by pressing the same button once they felt that they had reached a safe roadway.
For each drive, the participants were asked to engage in NDRT in the center control display for about 65 s while the vehicle experienced automated driving, followed by a beep from the center control system, at which point the participant could see the SAT interface on the center control display regarding the hazardous event.
The participants could recognize the ADS and hazardous event by combining the driving scenario with the SAT interface and then considering whether or not to take over the vehicle. After the event, the NDRT would reappear on the center control display, and the participants were required to engaged in the task again until the vehicle automatically parked.
After driving, the participants used two scales to complete an online survey platform, wjx. At the end of the formal trial, the participants answered questions via an interview and received the participation fee. The total duration of the experimental procedure was approximately 25 min.
3. Results
The data from a total of 36 participants were collected in this study. There were two participants who exhibited a significant loss of eye movement data (<85% data logging). Consequently, the eye movement data from four trials were excluded from the analysis. For all data, the Shapiro–Wilk test was used to check the normal distribution of all dependent variables. If the data were normally distributed, binary variables were predicted using binary logistic regression, and other discrete and continuous variables were analyzed using the Kruskal–Wallis or Mann–Whitney tests. Dependent variables data that were normally distributed and passed the test of homogeneity of variance were analyzed using ANOVA. Post hoc analysis was conducted using Tukey’s HSD test. The significance was set at 0.05 for the statistical tests.
3.1. Takeover Performance
In this study, takeover performance consisted of two variables: unanticipated takeover and the duration of manual driving after takeover. The two data samples were not normally distributed (p < 0.05); thus, non-parametric tests were performed. A binary logistic regression revealed that the model of unanticipated takeover was statistically insignificant (p > 0.001), and none of the independent variables in the equation were statistically significant (p > 0.05). The data of duration of manual driving was not normally distributed (p < 0.05), but tests showed that there were no statistically significant effects of the independent variables on this factor. This suggests that there was no significant difference in the likelihood of takeover, nor for the duration of manual driving across SAT conditions and scenario urgency conditions.
In fact, since very few unanticipated takeovers occurred during the experiment, the data were not significant. From the descriptive statistics, three takeovers occurred in the SAT level 1* high-urgency condition; all other conditions resulted in only one unanticipated takeover. Overall, according to the results for unanticipated takeover, the participants trusted the ADS and let the vehicle handle the hazardous events on its own.
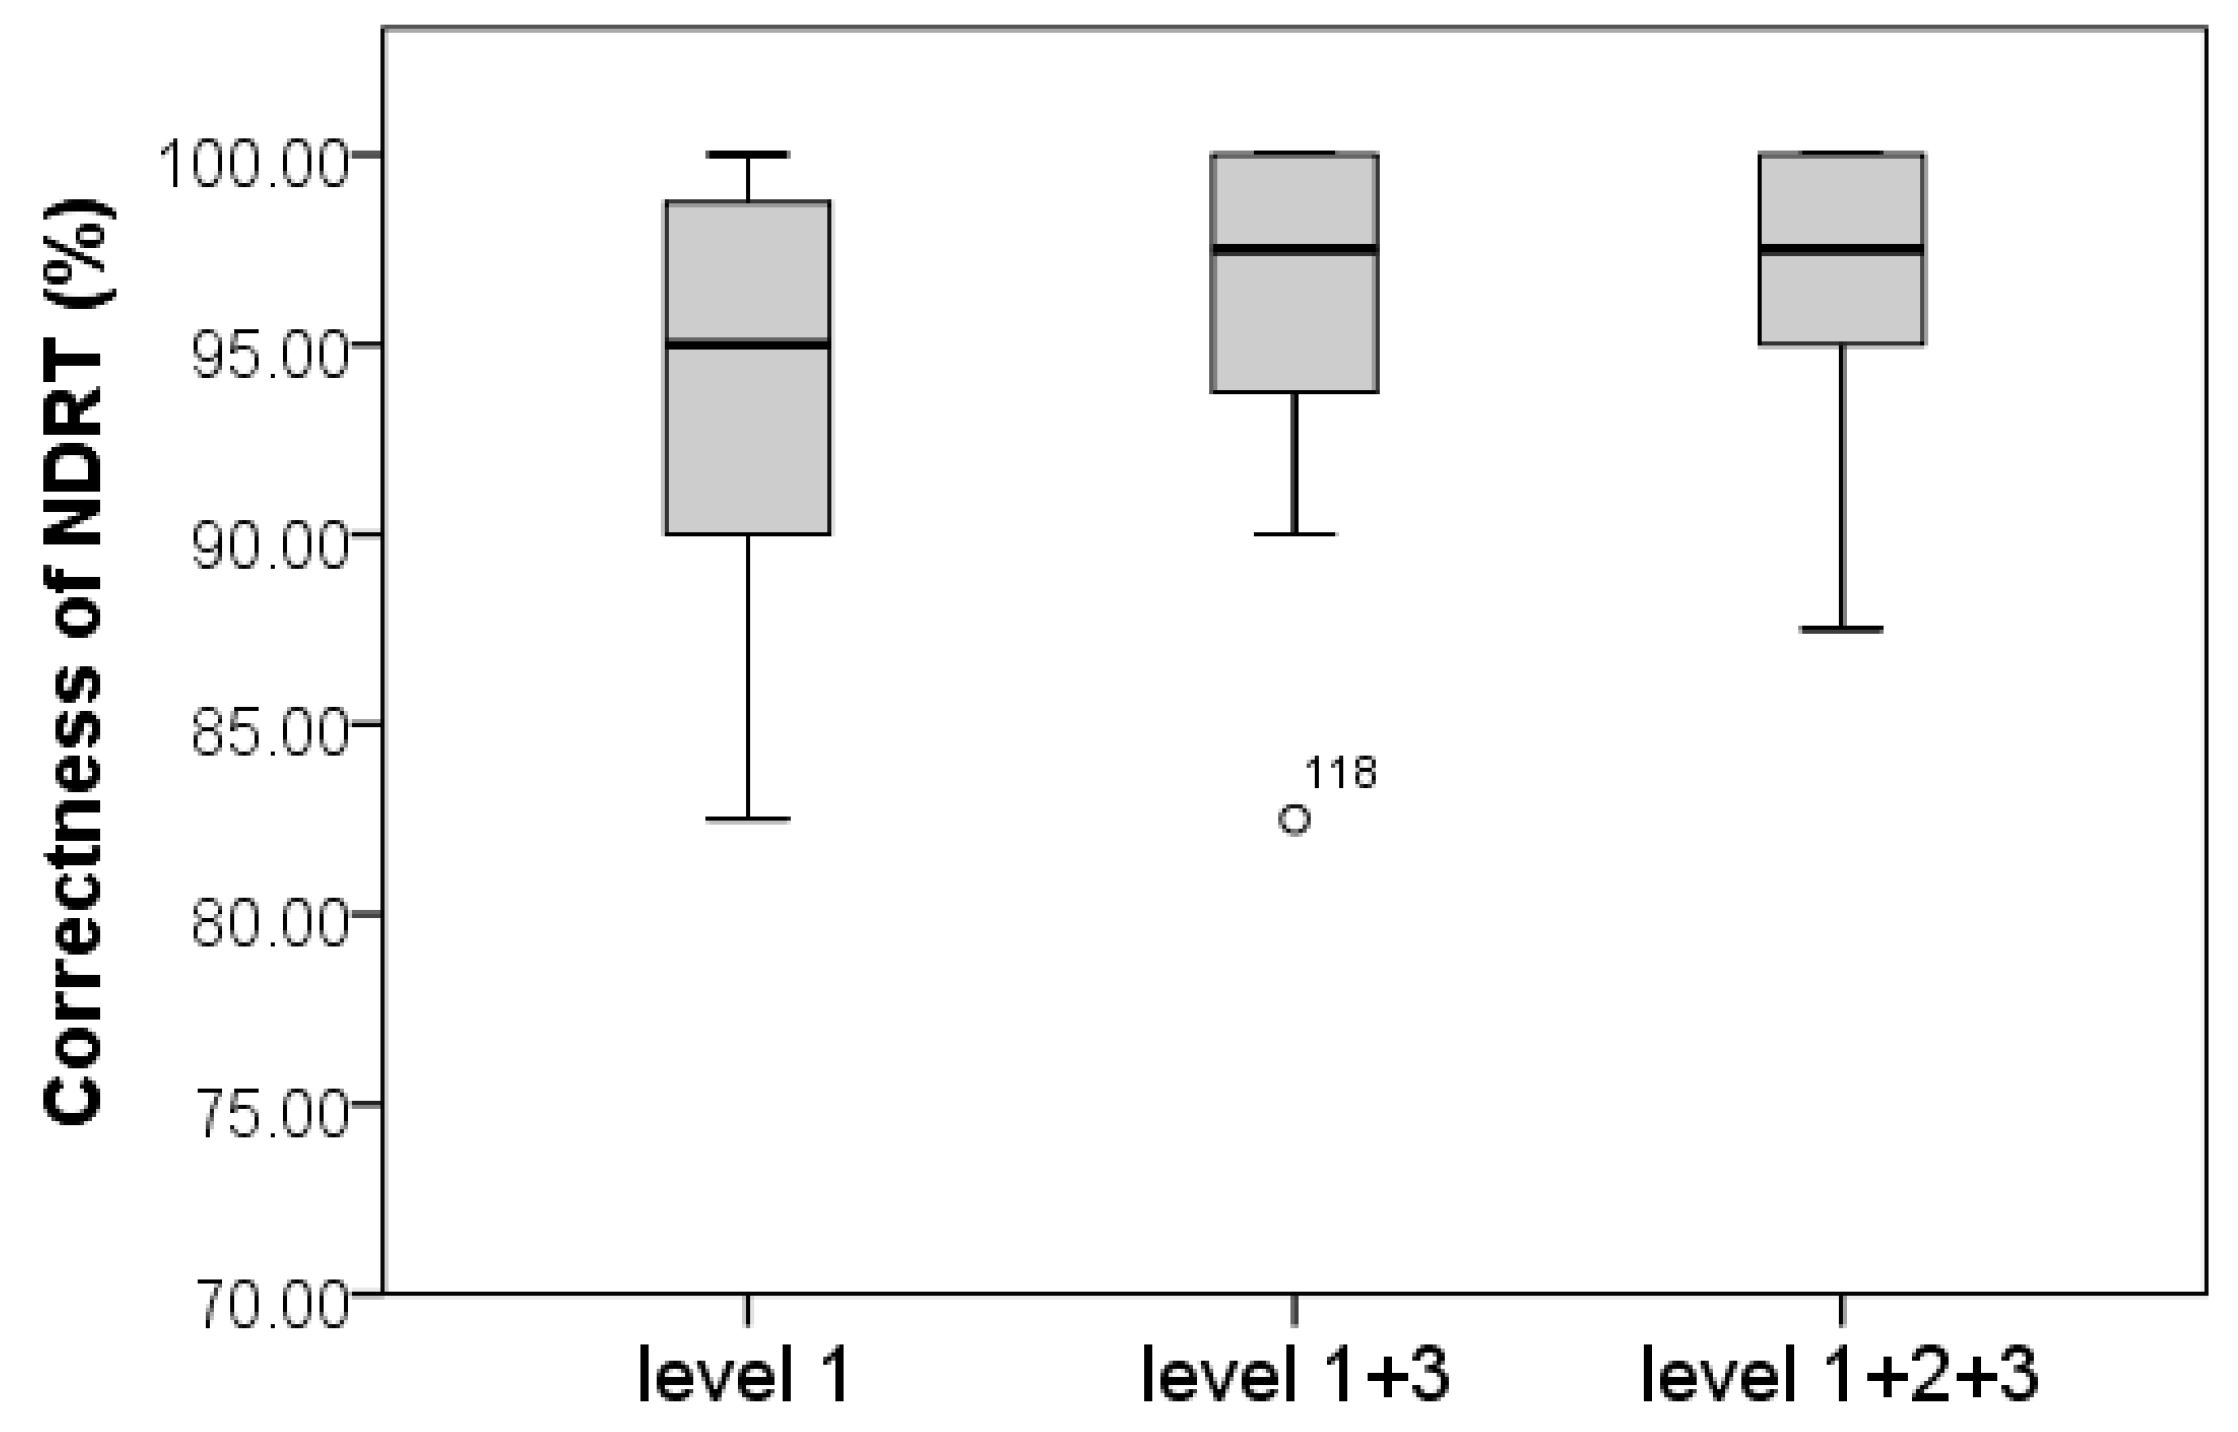
3.2. NDRT Performance
The program recorded all NDRT results. After data organization, the correctness of the NDRTs were presented as percentages. The data revealed no outliers, but were not normally distributed (
p < 0.05). Tests showed that there was a significant effect of SAT on the correctness of the NDRT, i.e., χ
2(2) = 8.475,
p < 0.05, mean rank = 58.63, 80.25, and 78.63 for SAT level 1, SAT level 1 + 3, and SAT level 1 + 2 + 3, respectively (
Figure 6). Pairwise comparisons showed that the difference between the SAT level 1 + 3 condition and the SAT level 1 condition and the SAT level 1 + 2 + 3 condition and the SAT level 1 condition were significant. However, tests revealed that there was no significant effect on correctness of NDRT in regards to scenario urgency and driving stage (
p > 0.05).
Although the effects of the scenario urgency and driving stage were not significant, from the descriptive statistics, the correctness of the NDRT was higher under the low-urgency condition (M = 95.97, SD = 4.207) than under the high-urgency condition (M = 95.49, SD = 4.570), and was higher in stage 2 (M = 95.90, SD = 4.139) than in stage 1 (M = 95.56, SD = 4.639).
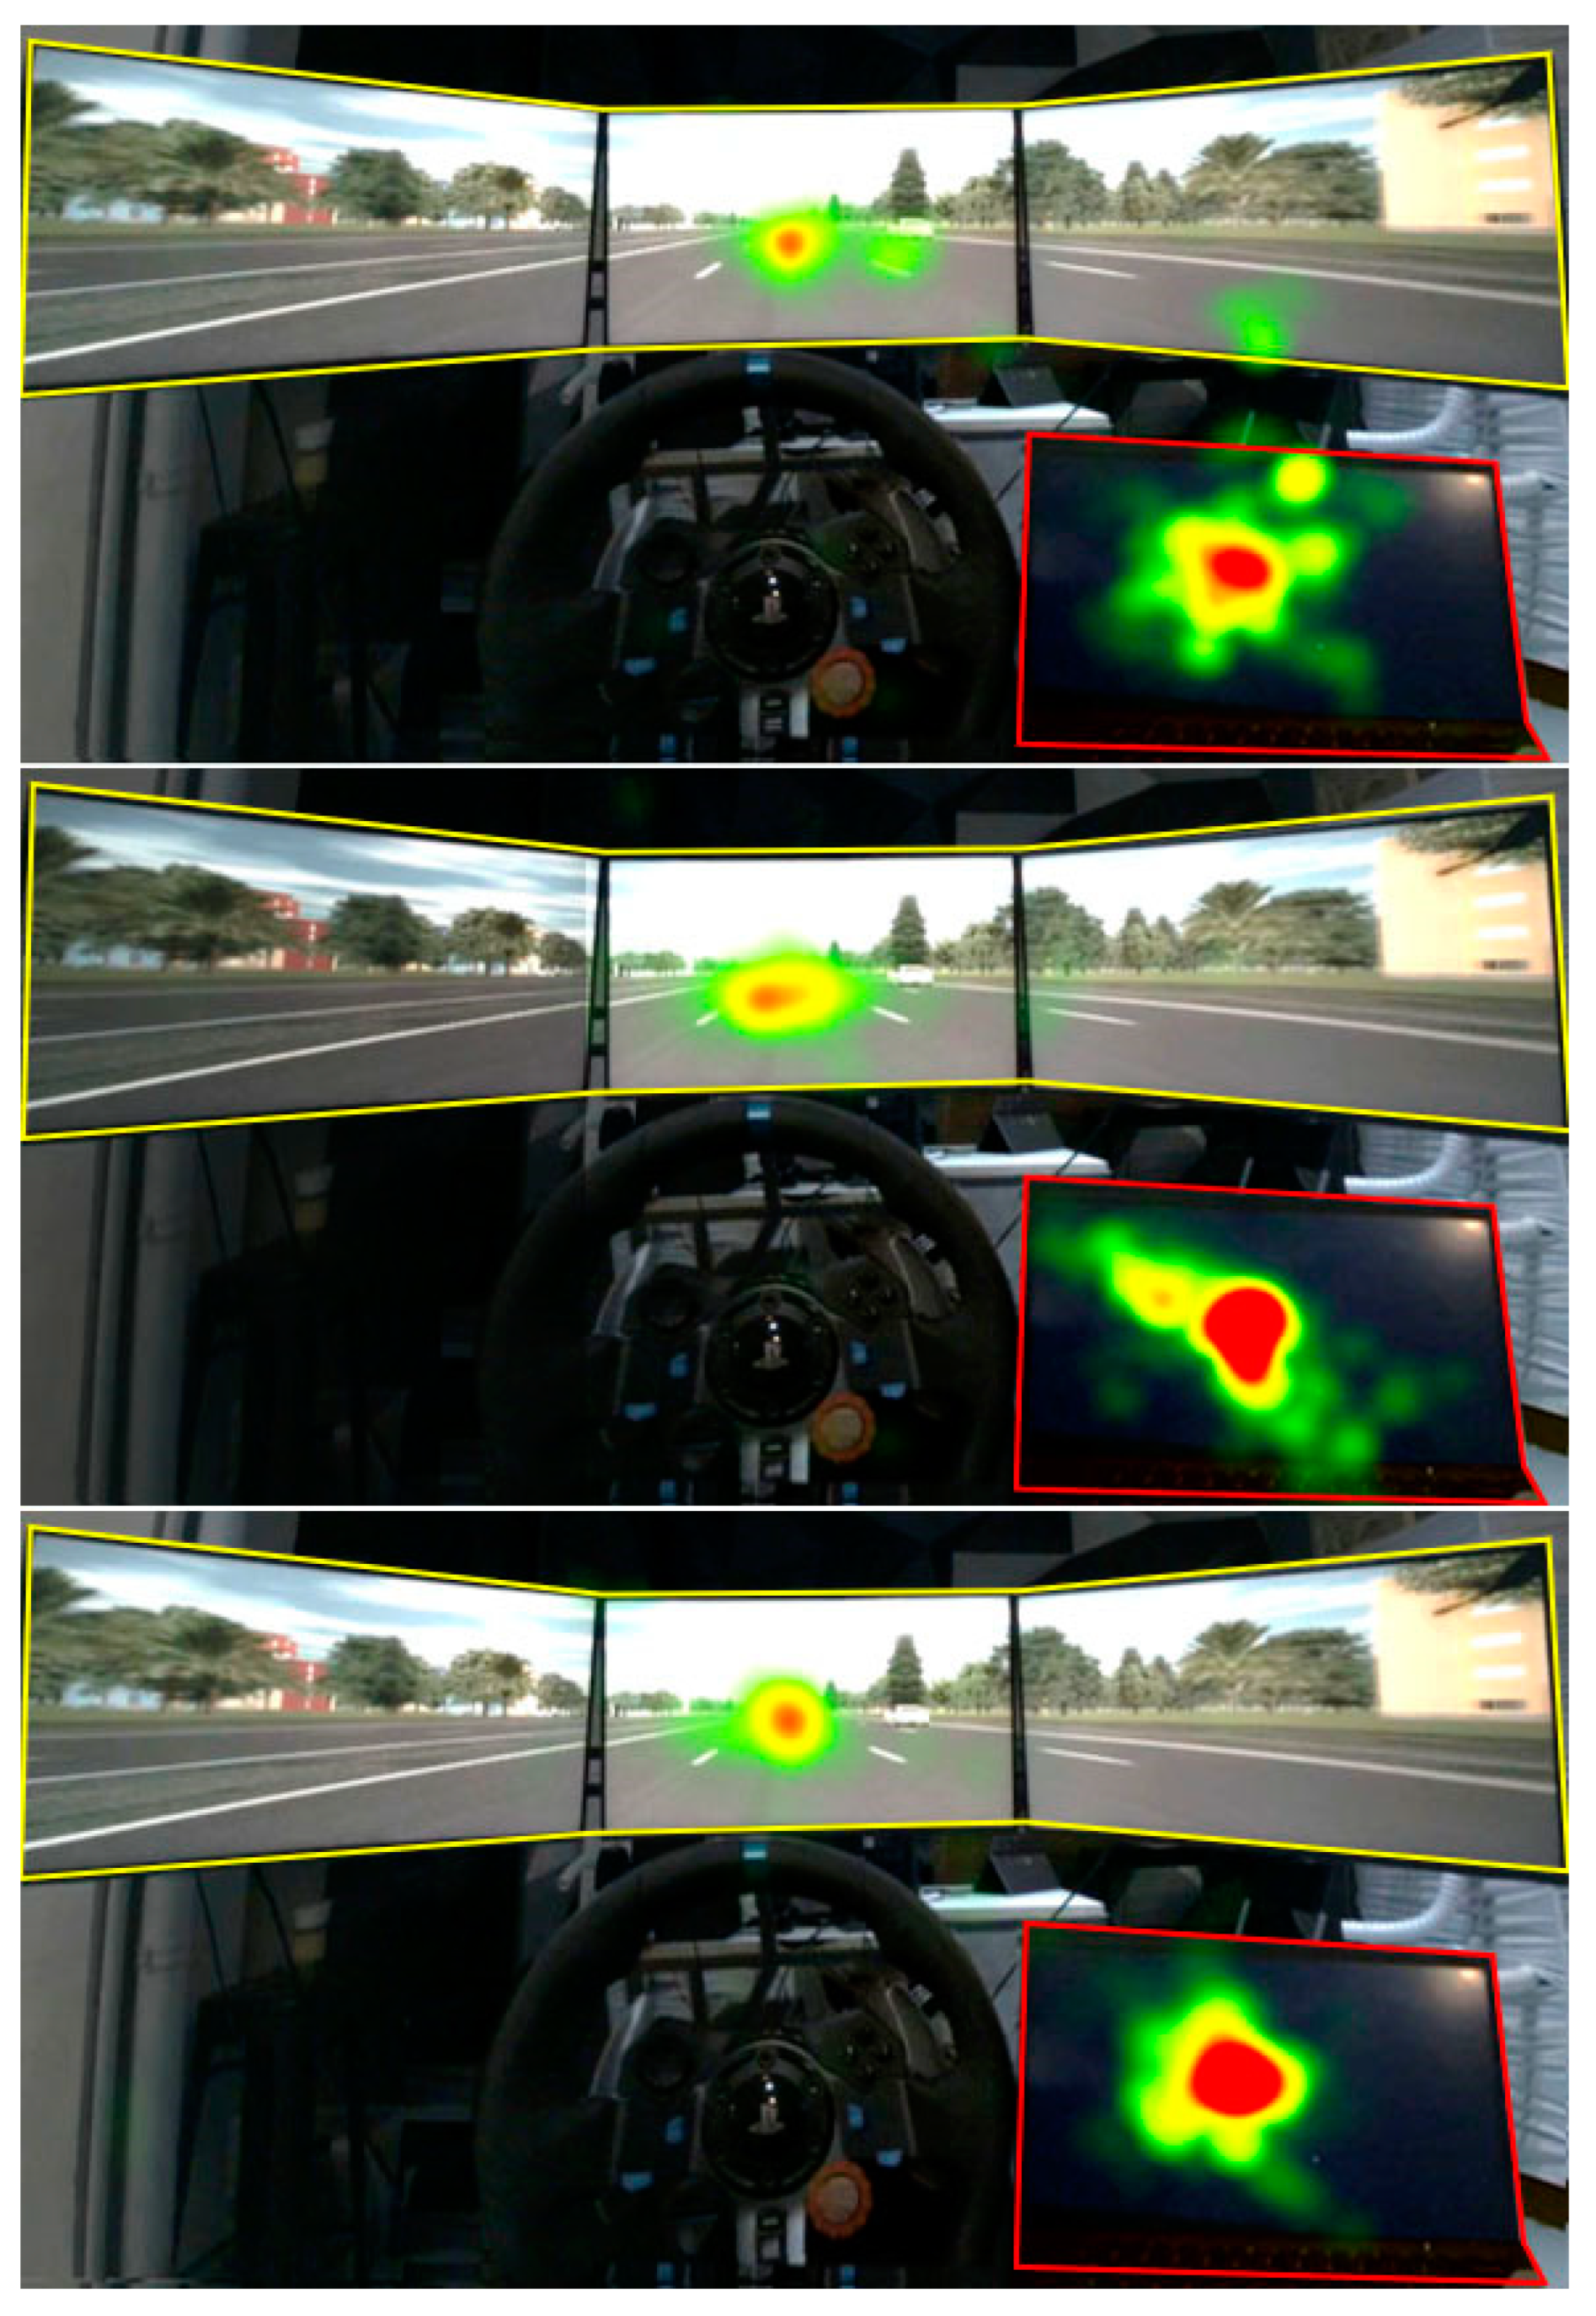
3.3. Eye-Tracking Metrics
To assess the influence of SAT and scenario urgency on the participants’ visual attention, the percentage of the duration of eye gaze on the driving scenario and the central control display were analyzed. First, the 3D eye movement data were mapped in 2D pictures, then the driving scenario and central control display were set as areas of interest (AOIs) (As shown in
Figure 7, the yellow box vs. the red box), and the duration of eye gaze on the two AOIs was measured during the entire driving experiment.
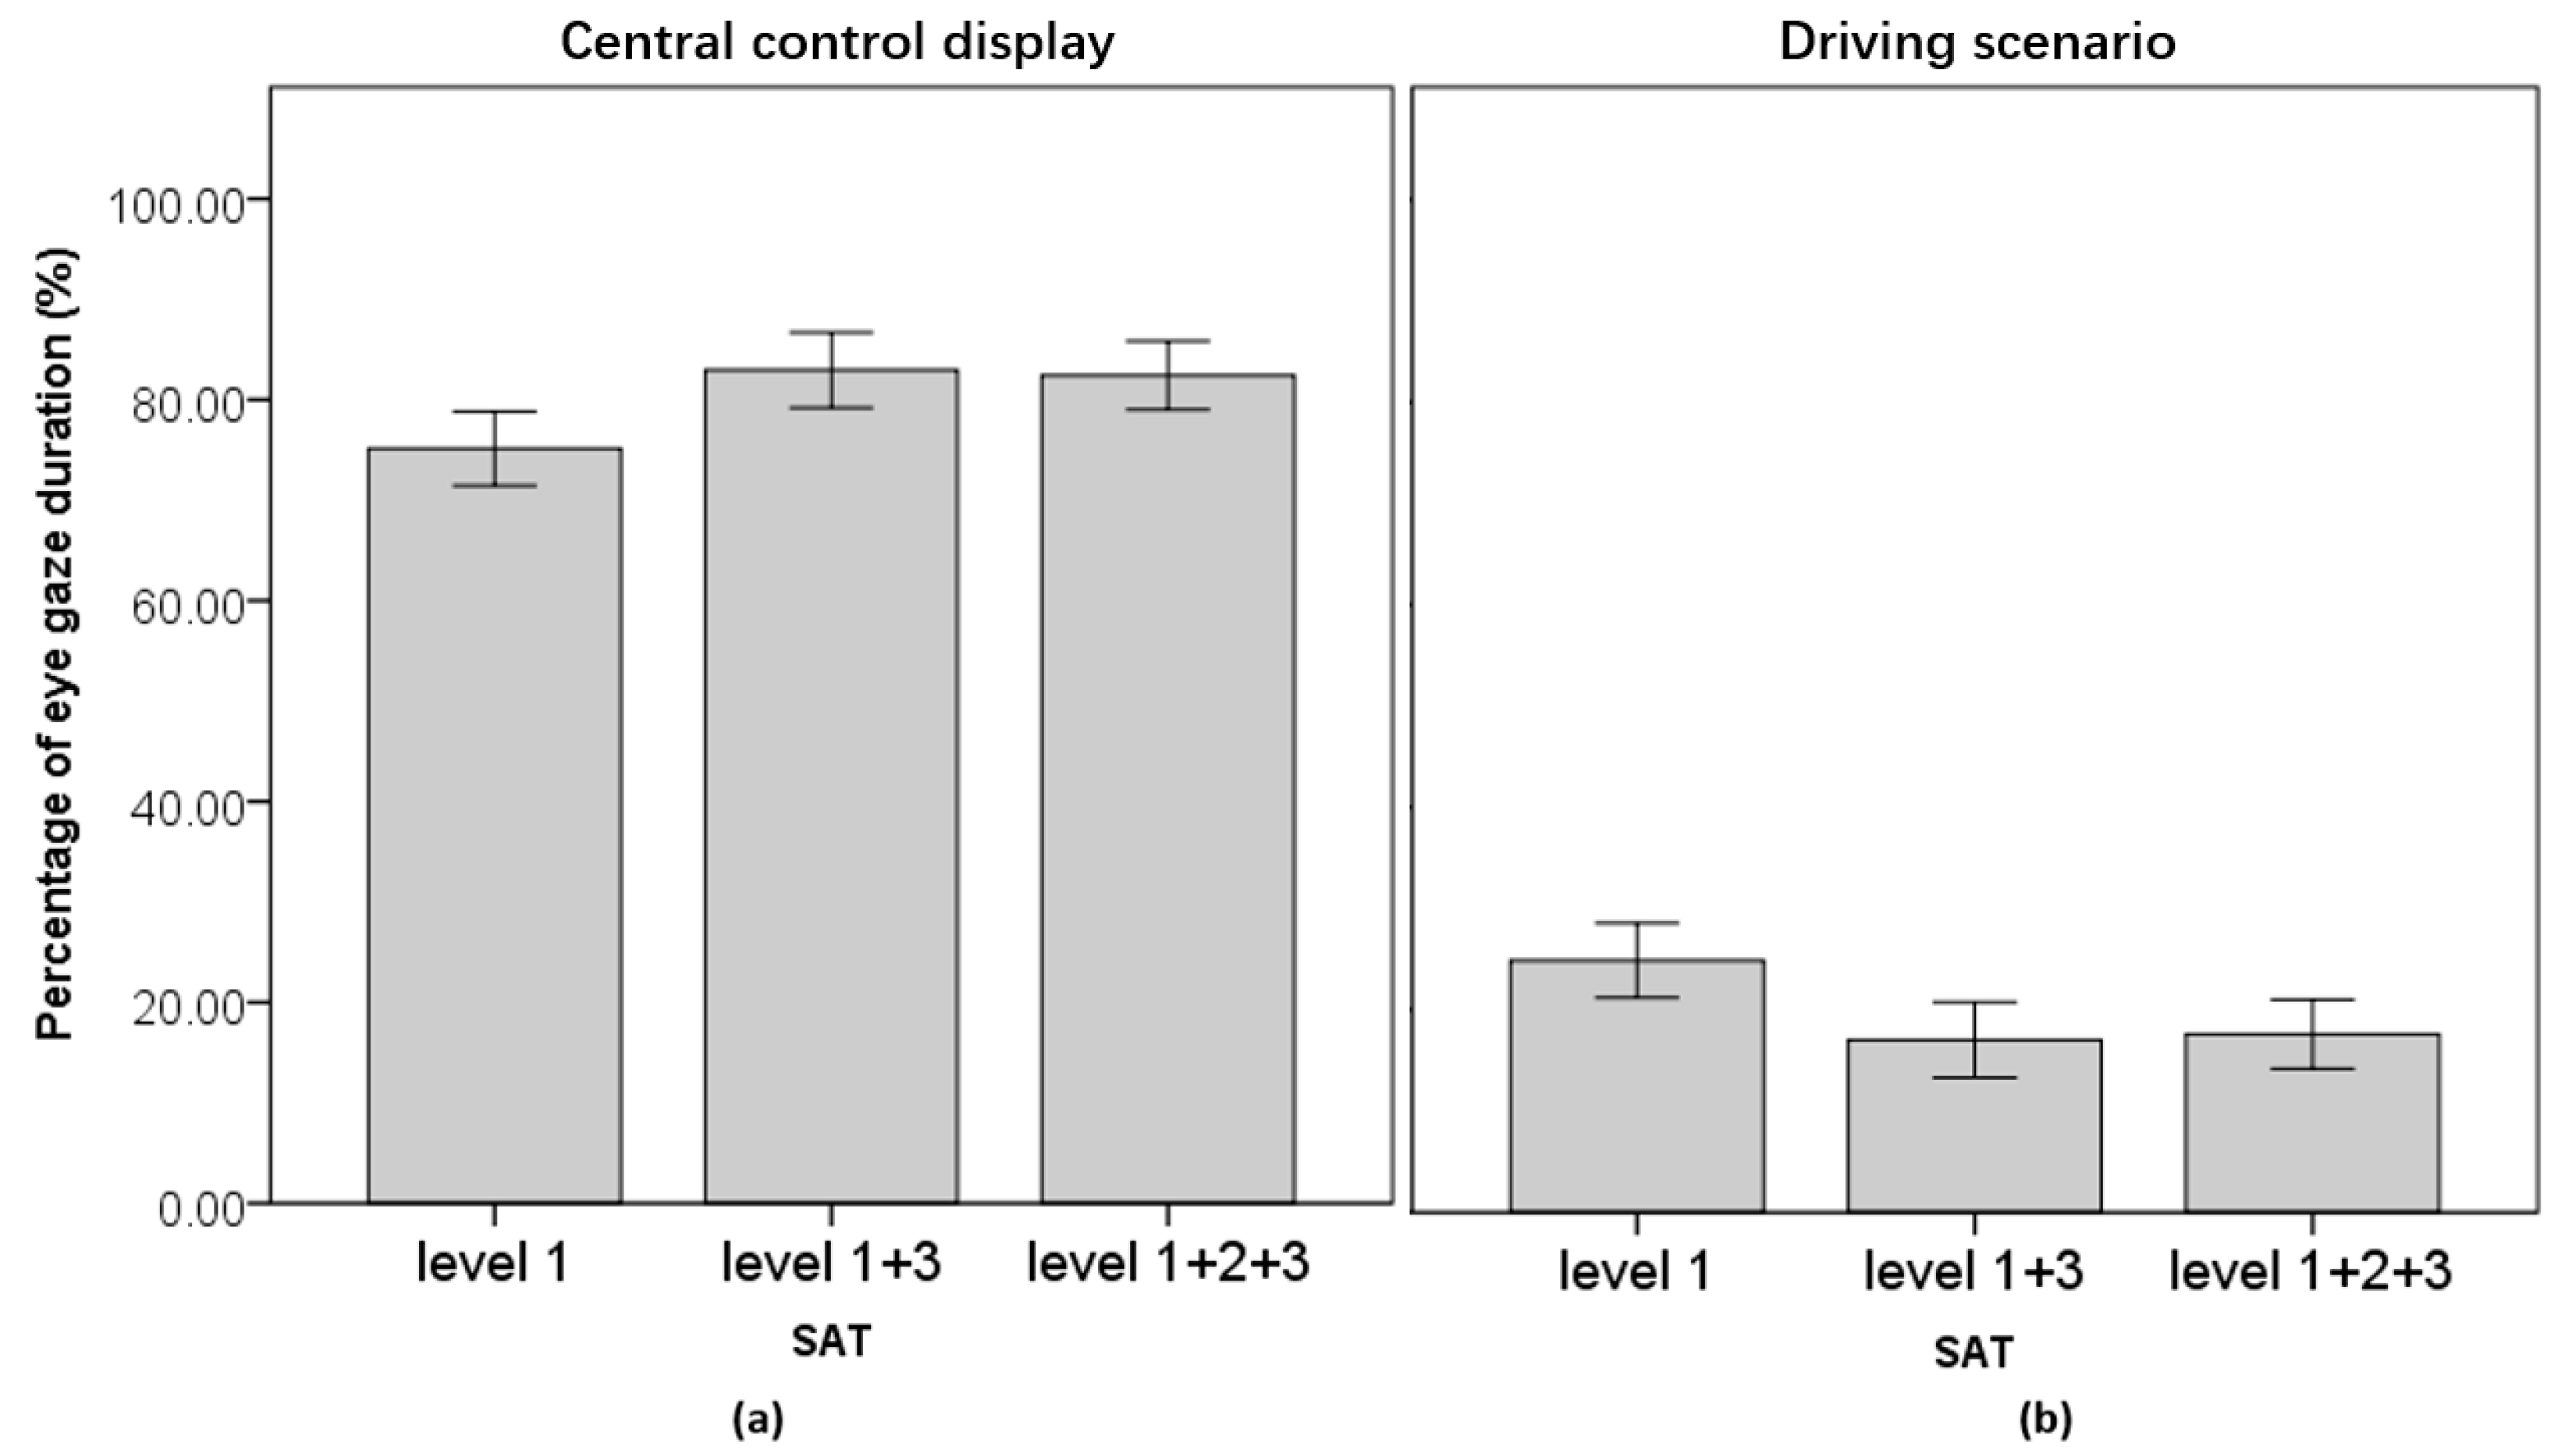
The eye gaze duration data were normally distributed (
p > 0.05). A three-way ANOVA revealed that the main effect of the SAT on the percentage of the duration of eye gaze on the central control display was significant, F(2, 124) = 5.797,
p < 0.05, η
2p = 0.086. Post hoc analysis revealed that the percentage of the duration of eye gaze on the central control display under the SAT level 1 + 3 condition and the SAT level 1 + 2 + 3 condition was significantly higher than that under the SAT level 1 condition (
p < 0.05), but the difference between the SAT level 1 + 3 condition and the SAT level 1 + 2 + 3 condition was not significant (
p > 0.05), as shown in
Figure 8a. Correspondingly, the main effect of the SAT on the percentage of eye gaze duration in the driving scenario was also significant, F(2, 124) = 5.831,
p < 0.05, η
2p = 0.086, and post hoc analysis yielded similar results (
Figure 8b). However, there were no statistically significant effects of scenario urgency and driving stage on the two percentages of eye gaze duration (
p > 0.05), and none of the interaction effects were statistically significant (
p > 0.05).
The descriptive statistics revealed that the percentage of eye gaze duration on the central control display was higher under the low-urgency condition (M = 80.75, SD = 12.436) than under the high-urgency condition (M = 79.29, SD = 12.751), and it was higher in stage 2 (M = 81.08, SD = 12.596) than in stage 1 (M = 78.96, SD = 12.546). The opposite was true for the attention on driving scenarios.
3.4. Trust
First, Cronbach’s alpha was used to determine the degree of consistency and reliability for the participants’ trust scores. The calculated value of Cronbach’s alpha for the six items was 0.914, indicating that all responses were consistent. Then, the trust data were obtained by averaging the scale scores (three items have been calculated in reverse).
The trust data were not normally distributed (
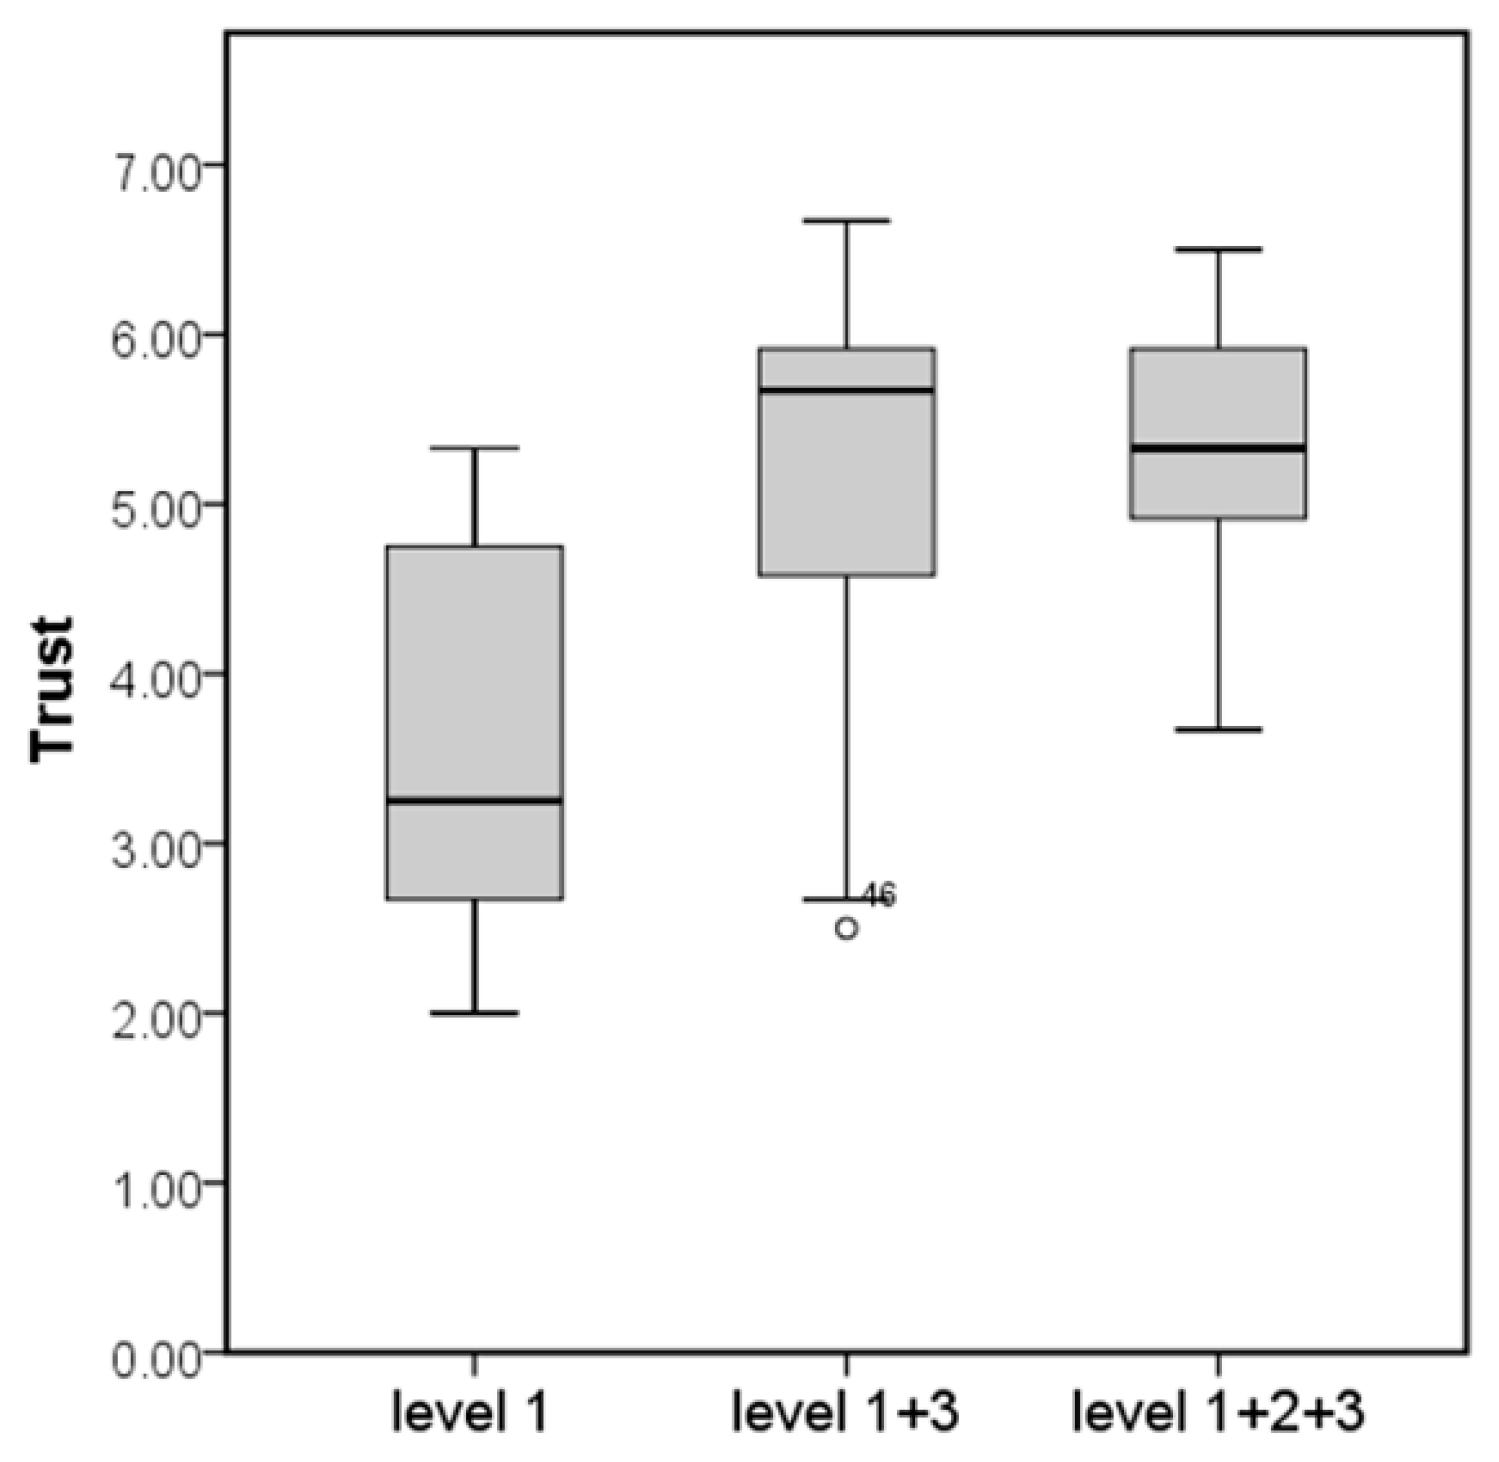
p < 0.05). Thus, non-parametric analyses were performed. Tests revealed that there was a significant effect of SAT on the participants’ trust, H(2) = 26.105,
p < 0.05, mean rank = 18.71, 45.21, and 45.58 respectively, for SAT level 1, SAT level 1 + 3, and SAT level 1 + 2 + 3 (
Figure 9). Tests revealed that there was no significant effect of scenario urgency on the participants’ trust,
p > 0.05. Descriptive statistics reveled a higher trust score under the low-urgency condition (M = 4.96, SD = 1.175) than under the high-urgency condition (M = 4.57, SD = 1.266).
3.5. Workload
The participants’ self-reported workload data were weighted and averaged, and then they were tested for normality, indicating that the workload data were not normally distributed (p < 0.05). Thus, non-parametric analyses were performed. Tests revealed that the main effect of SAT on the participants’ workload approached significance, H(2) = 5.220, p = 0.074. Tests also revealed there was no significant effect of scenario urgency on the participants’ workload, p > 0.05.
According to the descriptive statistics, the participants’ workloads were lower under the SAT level 1 + 3 (M = 78.22, SD = 39.811) and SAT level 1 conditions (M = 84.12, SD = 54.706) than under the SAT level 1 + 2 + 3 condition (M = 100.64, SD = 39.966). The participants’ workloads were numerically higher under the high-urgency condition (M = 92.52, SD = 48.436) than under the low-urgency condition (M = 82.81, SD = 42.993).
4. Discussion
In our study, even though the participants were told that they were riding in a highly automated vehicle and that automation could handle various risky events on the road, there were still a few (
n = 8) who took over the vehicle during the driving event due to fear that the automation would not handle the hazard well. The behavior of unanticipated takeover can be viewed as a form of non-reliance, by definition. And reliance was often correlated with trust [
17,
37,
38] or was even a result of trust in the automation [
43]. In this study, driver takeover was clearly an undesirable result of mistrust, albeit infrequent, and this behavior should be avoided. In comparison, the other dependent variables, even if they were skewed to the side of distrust, do not have much of a negative impact on human–vehicle collaboration. Moreover, in line with our expectations, the participants’ NDRT performance while driving was generally high, their attention was more focused on the center control display, and the trust scores after driving were relatively high. While participants’ attitudes and behaviors to the ADSs of this experiment generally tended to be on the side of trust and reliance, the effects of SAT, scenario urgency, and driving stage varied and were somewhat subtle.
In this study, the effects of the SAT on trust and reliance were generally consistent with our expectations, and these results partially supported H2, which was the focus of the study. For example, under the SAT level 1 + 3 and SAT level 1 + 2 + 3 conditions, participants paid more attention to the NDRT, exhibited a higher NDRT performance, and showed an increased trust in the ADS compared to the results for the SAT level 1 condition. This finding is consistent with the view of many previous studies that the transparency in terms of uncertain information (i.e., reasoning information for SAT level 2 and projection information for level 3) improved both trust and task performance [
20,
44,
45]. The effects also indicated the two high-level SAT conditions were not significantly different in regards to the dependent variables of takeover performance, NDRT performance, eye-tracking metrics, and subjective trust. These results are inconsistent with those obtained in some previous studies involving SAT, which found that the participants’ trust or performance increased as the level of transparency increased [
20,
24,
27,
28]. There may be several explanations for this difference. The most straightforward explanation is that the interface designs in the SAT level 1 + 3 and SAT level 1 + 2 + 3 conditions were quite similar because of the simplicity of the driving event employed in the experiment. As mentioned by several participants, for the two high-level SAT groups, to make a decision, they did not pay attention to what particular information the interface provided, but only to the driving scenarios. To speculate further on differences regarding scenario simplicity, follow-up efforts should conduct more targeted testing.
Another possible explanation for the results obtained in the current study is that previous experimental studies involving SAT model have focused only on the sequential stacking of transparency levels and not on the combination of SAT level 1 and level 3 conditions [
24,
28,
32]. Instead, this study investigated the role of SAT level 1 + 3 in supporting driver trust and reliance and proposed the hypothesis that SAT level 1 + 3 may be superior to other levels of transparency, especially in high-urgency scenarios, based on Chen’s statement that humans may only need to know the system’s actions and the projection to make a sufficiently informed decision in time-sensitive situations [
25]. In the experiment, the results regarding workload did not support H4, but the following insights may explain this result. The differences in participants’ workloads were small between the SAT level 1 and SAT level 1 + 3 conditions, and the participants showed the highest workload under the SAT level 1 + 2 + 3 condition, although the difference was not statistically significant. As Stowers et al. discovered, the users did not enjoy the increase in task workload, despite the utility of the added information [
27]. One participant in the SAT level 1 + 2 + 3 group also noted that the interface looked a little messy, so he preferred to look at the driving scenarios to determine whether the road was dangerous and if the vehicle needed to be taken over. From this evidence, we deduced that additional transparency information does enhance the interpretability or increase the user’s understanding of the system, but in a risky, time-critical task, such as driving, too much information may be detrimental to task performance and user experience. This interpretation is supported by the findings of Yeh and Wickens, who found a decrease in perceived usability with increased transparency information and workload, despite no difference in performance [
46]. Therefore, if the road condition and workload are the sources of driver reliance and trust, one solution may be to utilize in-vehicle interfaces to enhance trust and human–vehicle collaboration, based on road conditions and physiological indicators of workload.
To fully examine the effects of SAT on driver reliance on the ADS, this study also investigated participants’ visual attention and NDRT performance before and after viewing the SAT interface. The results indicated that the users did have a tendency to shift their attention from the driving scenario to the center control display after viewing the SAT interface, but this shift was not statistically significant in terms of eye movement metrics and NDRT performance. These results do not support H1, but still warrant further investigation in the future in regards to more realistic hazardous events, as well as to higher fidelity simulated driving.
In addition to the impact of the SAT on driver trust and reliance, this study also focused on differences in the SAT across various levels of driving scenario urgency. At the time of design, the two driving scenarios used in this study were manipulated according to the distance between the participant’s vehicle and the hazard at the beginning of the event, and the urgency of the two scenarios was progressive. However, the results indicated that the effects of scenario urgency on all dependent variables were not statistically significant, which did not support H3. One possible reason for this is that, as discussed above, the driving event was too simple, so participants were able to quickly understand the hazard in both the high- and low-urgency scenarios. Another possibility is that the experimental design did not sufficiently differentiate the level of urgency in the scenarios, or that the high-urgency scenarios were not designed to be adequately time-sensitive. As previously suggested, an acceptable TORlt was about 6 s when engaged in a NDRT [
35]; presenting the SAT interface 6 s earlier in the experiment did prompt the participants to feel adequate urgency. In their interviews, some of the participants also mentioned that there was little difference between the two driving trials. If the second statement is true, then it makes sense that the advantages of receiving SAT level 1 + 3 information under time-sensitive contexts were not fully realized under this study design.
Nonetheless, we were able to observe some differences among SAT conditions in scenarios with different levels of urgency. For example, the participants showed the highest correctness of NDRT and paid the most attention to the central control display in the combination of SAT level 1 + 3* condition, or low urgency*, stage 2. Although this data did not provide statistical evidence for the role of SAT 1 + 3 level information in regards to improving user trust and performance in ADS, it nevertheless provided a basis for the potential advantages of projection information in certain contexts. However, regardless of whether or not the advantages of SAT level 1 + 3 in high-urgency driving scenarios are significant, and if so, for what reasons, it seems safe to conclude that different scenarios may require alternative transparency information. The complex road conditions that automated driving must manage will present interaction designers with a series of new challenges.
Limitation and Future Work
In general, this study provides a solid framework for evaluating vehicle interfaces with SAT information to test trust behaviors in regards to ADS. However, as mentioned above, it is possible that this study failed to test one of the key hypotheses because some of the data were not significant due to the design of the variable of scenario urgency. From the experiment results, the advantage of the SAT level 1 + 3 interface was numerically more evident in high-urgency situations. Therefore, more reasonable experimental variables should be designed to test this hypothesis. Due to the inability of some participants to understand the differences between the scenarios, in future studies, scenario urgency could be used as a between-subject variable to delineate additional levels. Another limitation involving the experiment design was the inadequate amount of time during which the SAT information interface was presented to the participants. This may also account for some of the hypothesized effects not being statistically significant. As one participant stated, he would pay more attention to the road when the event occurred, and by the time he tried to evaluate the interface again, it was too late. Therefore, future research should design more hazardous events during one drive, which would allow participants to evaluate the SAT interface more accurately.
Future research should also attempt to present SAT information in more ways than in just a bird’s eye view, with the inclusion of some text on an additional screen. As previous studies have mentioned, “an invisible interface is also not usable” and “placing the screen closer to the instrument cluster“ was suggested [
47]. Also, several participants suggested various alternatives for the presentation of transparency, for example, striking light effects, voice prompts, and a heads-up display (HUD). The effectiveness of different methods of displaying SAT information in increasing user trust and reducing cognitive load is also worth investigating. After all, the ultimate goal of researching SAT is to enhance user trust in ADS and to promote human–vehicle collaboration. Researchers and designers should focus not only on what SAT information should be communicated in different scenarios, but also on how the information is communicated.
Finally, driving simulations in the lab do not provide participants with experience on real roads, especially in high-risk scenarios. We also recognized that a low number of participants in this research had previous autonomous driving experience, which may have resulted in users retaining supervisory habits from manual driving. Future studies could recruit more autonomous vehicle owners or make use of longitudinal methods to evaluate the evolution of user experience and trust in order to obtain more realistic and valid data regarding automated driving performance and user evaluation. And, it is widely accepted that users form and modify their judgments about automation over time [
48], so research concerning trust in automation should inlcude sufficient consideration regarding longitudinal study.
5. Conclusions
In this study, we designed three levels of transparency-interface for a specific hazardous event with different urgencies based on the SAT model, and we then evaluated user trust and reliance before and after viewing the interface via NDRT performance and eye gaze duration. Also, takeover performance during driving, as well as subjective trust and workload after driving in different transparency and scenario conditions, were also compared. The most significant finding of the experiment was that transparency has a significant effect on driver trust and reliance on ADS. Presenting SAT level 1 + 3 and level 1 + 2 + 3 information to drivers resulted in less attention being paid to the driving scenario, higher NDRT performance, and increased subjective trust than did the provision of baseline SAT level 1 information. Driver trust and reliance on ADS was higher in the low-urgency than in the high-urgency scenarios, and driver NDRT performance and attention improved after viewing the SAT information, but not statistically significantly. Thus, it can be concluded that providing drivers with SAT information can increase their trust in and reliance on the ADS, and vehicle’s actions and projection information may result in increased trust calibration without increasing the cost of the workload.
These findings highlight the positive role of the SAT model in human–vehicle interactions and present important implications for the design of automotive HMIs based on the SAT model. In order to achieve a safe and efficient employment of highly automated driving systems, the driver should be provided with transparency information regarding the uncertainty of the vehicle. Developers of ADS should also consider designing HMIs including different transparency and communication channels based on various driving scenarios to improve driver understanding of the vehicle conditions, while minimizing the workload.


