

Near-Infrared Spectroscopy Does Not Track Forearm Blood Flow during Venous Occlusion Plethysmography

 , ,
, , 
Abstract
Featured Application
Abstract
1. Introduction
2. Materials and Methods
3. Results
3.1. Participant Characteristics
3.2. Sex-Specific Hemodynamics
3.3. Relationships among Strain-Gauge and NIRS Parameters
3.4. Relationships among Resting VOP, NIRS Parameters and Ultrasound Measures
3.5. Consistency of Resting Parameters
4. Discussion
5. Conclusions
Author Contributions
Funding
Institutional Review Board Statement
Informed Consent Statement
Data Availability Statement
Acknowledgments
Conflicts of Interest
References
- Tsao, C.W.; Aday, A.W.; Almarzooq, Z.I.; Anderson, C.A.M.; Arora, P.; Avery, C.L.; Baker-Smith, C.M.; Beaton, A.Z.; Boehme, A.K.; Buxton, A.E.; et al. Heart Disease and Stroke Statistics—2023 Update: A Report from the American Heart Association. Circulation 2023, 147, e93–e621. [Google Scholar] [CrossRef] [PubMed]
- Anderson, T.J.; Charbonneau, F.; Lawrence, M.; Buithieu, J.; Rose, M.S.; Conradson, H.; Hildebrand, K.; Fung, M.; Verma, S.; Lonn, E.M. Microvascular Function Predicts Cardiovascular Events in Primary Prevention: Long-Term Results from the Firefighters and Their Endothelium (FATE) Study. Circulation 2011, 123, 163–169. [Google Scholar] [CrossRef] [PubMed]
- Gomez, M.; Montalvo, S.; Gurovich, A.N. Near Infrared Spectroscopy Is Not a Surrogate of Venous Occlusion Plethysmography to Assess Microvascular Resting Blood Flow and Function. Int. J. Exerc. Sci. 2022, 15, 1616–1626. [Google Scholar]
- Maltz, J.S.; Tison, G.H.; Alley, H.F.; Budinger, T.F.; Owens, C.D.; Olgin, J. Measurement of Brachial Artery Endothelial Function Using a Standard Blood Pressure Cuff. Physiol. Meas. 2015, 36, 2247. [Google Scholar] [CrossRef]
- Olamaei, N.; Dupuis, J.; Ngo, Q.; Finnerty, V.; Vo Thang, T.-T.; Authier, S.; Khairy, P.; Harel, F. Characterization and Reproducibility of Forearm Arterial Flow during Reactive Hyperemia. Physiol. Meas. 2010, 31, 763–773. [Google Scholar] [CrossRef] [PubMed]
- Ouyang, V.; Ma, B.; Pignatelli, N.; Sengupta, S.; Sengupta, P.; Mungulmare, K.; Fletcher, R.R. The Use of Multi-Site Photoplethysmography (PPG) as a Screening Tool for Coronary Arterial Disease and Atherosclerosis. Physiol. Meas. 2021, 42, 064006. [Google Scholar] [CrossRef] [PubMed]
- Rosenberry, R.; Nelson, M.D. Reactive Hyperemia: A Review of Methods, Mechanisms, and Considerations. Am. J. Physiol. Regul. Integr. Comp. Physiol. 2020, 318, R605–R618. [Google Scholar] [CrossRef]
- Troy, A.M.; Cheng, H.-L.M. Human Microvascular Reactivity: A Review of Vasomodulating Stimuli and Non-Invasive Imaging Assessment. Physiol. Meas. 2021, 42, 09TR01. [Google Scholar] [CrossRef] [PubMed]
- Crecelius, A.R.; Kirby, B.S.; Luckasen, G.J.; Larson, D.G.; Dinenno, F.A. ATP-Mediated Vasodilatation Occurs via Activation of Inwardly Rectifying Potassium Channels in Humans. J. Physiol. 2012, 590, 5349–5359. [Google Scholar] [CrossRef] [PubMed]
- Crecelius, A.R.; Richards, J.C.; Luckasen, G.J.; Larson, D.G.; Dinenno, F.A. Reactive Hyperemia Occurs via Activation of Inwardly-Rectifying Potassium Channels and Na+/K+-ATPase in Humans. Circ. Res. 2013, 113, 1023–1032. [Google Scholar] [CrossRef]
- Keller, J.L.; Traylor, M.K.; Gray, S.M.; Hill, E.C.; Weir, J.P. Sex Differences in NIRS-Derived Values of Reactive Hyperemia Persist after Experimentally Controlling for the Ischemic Vasodilatory Stimulus. J. Appl. Physiol. 2023, 135, 3–14. [Google Scholar] [CrossRef]
- Coccarelli, A.; Nelson, M.D. Modeling Reactive Hyperemia to Better Understand and Assess Microvascular Function: A Review of Techniques. Ann. Biomed. Eng. 2023, 51, 479–492. [Google Scholar] [CrossRef]
- De Blasi, R.A.; Ferrari, M.; Natali, A.; Conti, G.; Mega, A.; Gasparetto, A. Noninvasive Measurement of Forearm Blood Flow and Oxygen Consumption by Near-Infrared Spectroscopy. J. Appl. Physiol. 1994, 76, 1388–1393. [Google Scholar] [CrossRef]
- Jones, S.; Tillin, T.; Williams, S.; Rapala, A.; Chaturvedi, N.; Hughes, A.D. Skeletal Muscle Tissue Saturation Changes Measured Using Near Infrared Spectroscopy During Exercise Are Associated with Post-Occlusive Reactive Hyperaemia. Front. Physiol. 2022, 13, 919754. [Google Scholar] [CrossRef]
- Shoemaker, M.E.; Smith, C.M.; Gillen, Z.M.; Cramer, J.T. Sex Differences in Test-Retest Reliability of Near-Infrared Spectroscopy During Postocclusive Reactive Hyperemia of the Vastus Lateralis. J. Strength. Cond. Res. 2024, 38, e40–e48. [Google Scholar] [CrossRef]
- Traylor, M.K.; Bauman, A.J.; Saiyasit, N.; Frizell, C.A.; Hill, B.D.; Nelson, A.R.; Keller, J.L. An Examination of the Relationship among Plasma Brain Derived Neurotropic Factor, Peripheral Vascular Function, and Body Composition with Cognition in Midlife African Americans/Black Individuals. Front. Aging Neurosci. 2022, 14, 980561. [Google Scholar] [CrossRef]
- Hunter, S.K.; Griffith, E.E.; Schlachter, K.M.; Kufahl, T.D. Sex Differences in Time to Task Failure and Blood Flow for an Intermittent Isometric Fatiguing Contraction. Muscle Nerve 2009, 39, 42–53. [Google Scholar] [CrossRef]
- Joyner, M.J.; Dietz, N.M.; Shepherd, J.T. From Belfast to Mayo and beyond: The Use and Future of Plethysmography to Study Blood Flow in Human Limbs. J. Appl. Physiol. 2001, 91, 2431–2441. [Google Scholar] [CrossRef]
- Perrey, S.; Quaresima, V.; Ferrari, M. Muscle Oximetry in Sports Science: An Updated Systematic Review. Sports Med. 2024, 1–22. [Google Scholar] [CrossRef]
- Wilkinson, I.B.; Webb, D.J. Venous Occlusion Plethysmography in Cardiovascular Research: Methodology and Clinical Applications. Br. J. Clin. Pharmacol. 2001, 52, 631–646. [Google Scholar] [CrossRef]
- Wythe, S.; Davies, T.; Martin, D.; Feelisch, M.; Gilbert-Kawai, E. Getting the Most from Venous Occlusion Plethysmography: Proposed Methods for the Analysis of Data with a Rest/Exercise Protocol. Extrem. Physiol. Med. 2015, 4, 8. [Google Scholar] [CrossRef]
- Heitzer, T.; Baldus, S.; von Kodolitsch, Y.; Rudolph, V.; Meinertz, T. Systemic Endothelial Dysfunction as an Early Predictor of Adverse Outcome in Heart Failure. Arterioscler. Thromb. Vasc. Biol. 2005, 25, 1174–1179. [Google Scholar] [CrossRef]
- Barstow, T.J. Understanding near Infrared Spectroscopy and Its Application to Skeletal Muscle Research. J. Appl. Physiol. 2019, 126, 1360–1376. [Google Scholar] [CrossRef]
- Alvares, T.S.; de Oliveira, G.V.; Soares, R.; Murias, J.M. Near-Infrared Spectroscopy-Derived Total Haemoglobin as an Indicator of Changes in Muscle Blood Flow during Exercise-Induced Hyperaemia. J. Sports Sci. 2020, 38, 751–758. [Google Scholar] [CrossRef]
- Schank, B.J.; Acree, L.S.; Longfors, J.; Gardner, A.W. Differences in Vascular Reactivity between Men and Women. Angiology 2006, 57, 702–708. [Google Scholar] [CrossRef]
- Kneale, B.J.; Chowienczyk, P.J.; Brett, S.E.; Coltart, D.J.; Ritter, J.M. Gender Differences in Sensitivity to Adrenergic Agonists of Forearm Resistance Vasculature. J. Am. Coll. Cardiol. 2000, 36, 1233–1238. [Google Scholar] [CrossRef]
- Zaleski, K.; Matias, A.; Gyampo, A.; Giuriato, G.; Lynch, M.; Lora, B.; Tomasi, T.; Basso, E.; Finegan, E.; Schickler, J.; et al. Does Sex Influence Near-Infrared Spectroscopy-Derived Indicators of Microvascular Reactivity and the Response to Acute Dietary Capsaicin. Microvasc. Res. 2023, 145, 104436. [Google Scholar] [CrossRef]
- Vranish, J.R.; Young, B.E.; Kaur, J.; Patik, J.C.; Padilla, J.; Fadel, P.J. Influence of Sex on Microvascular and Macrovascular Responses to Prolonged Sitting. Am. J. Physiol.-Heart Circ. Physiol. 2017, 312, H800–H805. [Google Scholar] [CrossRef]
- Cardinale, D.A.; Larsen, F.J.; Schiffer, T.A.; Morales-Alamo, D.; Ekblom, B.; Calbet, J.A.L.; Holmberg, H.-C.; Boushel, R. Superior Intrinsic Mitochondrial Respiration in Women Than in Men. Front. Physiol. 2018, 9, 1133. [Google Scholar] [CrossRef]
- Cardinale, D.A.; Larsen, F.J.; Jensen-Urstad, M.; Rullman, E.; Søndergaard, H.; Morales-Alamo, D.; Ekblom, B.; Calbet, J.A.; Boushel, R. Muscle Mass and Inspired Oxygen Influence Oxygen Extraction at Maximal Exercise: Role of Mitochondrial Oxygen Affinity. Acta Physiol. 2019, 225, e13110. [Google Scholar] [CrossRef]
- Parker, B.A.; Smithmyer, S.L.; Pelberg, J.A.; Mishkin, A.D.; Herr, M.D.; Proctor, D.N. Sex Differences in Leg Vasodilation during Graded Knee Extensor Exercise in Young Adults. J. Appl. Physiol. 2007, 103, 1583–1591. [Google Scholar] [CrossRef]
- Van Beekvelt, M.C.; Colier, W.N.; Wevers, R.A.; Van Engelen, B.G. Performance of Near-Infrared Spectroscopy in Measuring Local O(2) Consumption and Blood Flow in Skeletal Muscle. J. Appl. Physiol. 2001, 90, 511–519. [Google Scholar] [CrossRef]
- McKay, A.K.A.; Stellingwerff, T.; Smith, E.S.; Martin, D.T.; Mujika, I.; Goosey-Tolfrey, V.L.; Sheppard, J.; Burke, L.M. Defining Training and Performance Caliber: A Participant Classification Framework. Int. J. Sports Physiol. Perform. 2021, 17, 317–331. [Google Scholar] [CrossRef]
- Mattu, A.T.; MacInnis, M.J.; Doyle-Baker, P.K.; Murias, J.M. Effects of the Menstrual and Oral Contraceptive Cycle Phases on Microvascular Reperfusion. Exp. Physiol. 2020, 105, 184–191. [Google Scholar] [CrossRef]
- Tinsley, G.M.; Moore, M.L.; Benavides, M.L.; Dellinger, J.R.; Adamson, B.T. 3-Dimensional Optical Scanning for Body Composition Assessment: A 4-Component Model Comparison of Four Commercially Available Scanners. Clin. Nutr. 2020, 39, 3160–3167. [Google Scholar] [CrossRef]
- Ade, C.J.; Broxterman, R.M.; Wong, B.J.; Barstow, T.J. Anterograde and Retrograde Blood Velocity Profiles in the Intact Human Cardiovascular System. Exp. Physiol. 2012, 97, 849–860. [Google Scholar] [CrossRef]
- Hammer, S.M.; Hammond, S.T.; Parr, S.K.; Alexander, A.M.; Turpin, V.-R.G.; White, Z.J.; Didier, K.D.; Smith, J.R.; Barstow, T.J.; Ade, C.J. Influence of Muscular Contraction on Vascular Conductance during Exercise above versus below Critical Power. Respir. Physiol. Neurobiol. 2021, 293, 103718. [Google Scholar] [CrossRef]
- Keller, J.L.; Anders, J.P.V.; Neltner, T.J.; Housh, T.J.; Schmidt, R.J.; Johnson, G.O. Sex Differences in Muscle Excitation and Oxygenation, but Not in Force Fluctuations or Active Hyperemia Resulting from a Fatiguing, Bilateral Isometric Task. Physiol. Meas. 2021, 42, 115004. [Google Scholar] [CrossRef]
- Tschakovsky, M.; Shoemaker, J.; Hughson, R. Beat-by-Beat Forearm Blood Flow with Doppler Ultrasound and Strain-Gauge Plethysmography. Available online: https://journals.physiology.org/doi/epdf/10.1152/jappl.1995.79.3.713 (accessed on 20 October 2023).
- Chan, Y.H. Biostatistics 104: Correlational Analysis. Singap. Med. J. 2003, 44, 614–619. [Google Scholar]
- Weir, J.P. Quantifying Test-Retest Reliability Using the Intraclass Correlation Coefficient and the SEM. J. Strength. Cond. Res. 2005, 19, 231–240. [Google Scholar] [CrossRef]
- Alam, T.A.; Seifalian, A.M.; Baker, D. A Review of Methods Currently Used for Assessment of in Vivo Endothelial Function. Eur. J. Vasc. Endovasc. Surg. 2005, 29, 269–276. [Google Scholar] [CrossRef]
- Huang, A.L.; Silver, A.E.; Shvenke, E.; Schopfer, D.W.; Jahangir, E.; Titas, M.A.; Shpilman, A.; Menzoian, J.O.; Watkins, M.T.; Raffetto, J.D.; et al. Predictive Value of Reactive Hyperemia for Cardiovascular Events in Patients With Peripheral Arterial Disease Undergoing Vascular Surgery. Arter. Thromb. Vasc. Biol. 2007, 27, 2113–2119. [Google Scholar] [CrossRef]
- Edwards, A.D.; Richardson, C.; van der Zee, P.; Elwell, C.; Wyatt, J.S.; Cope, M.; Delpy, D.T.; Reynolds, E.O. Measurement of Hemoglobin Flow and Blood Flow by Near-Infrared Spectroscopy. J. Appl. Physiol. 1993, 75, 1884–1889. [Google Scholar] [CrossRef]
- Van Beekvelt, M.C.P.; Colier, W.N.; van Engelen, B.G.M.; Hopman, M.T.E.; Wevers, R.A.; Oeseburg, B. Validation of Measurement Protocols to Assess Oxygen Consumption and Blood Flow in the Human Forearm by Near-Infrared Spectroscopy. Proc. SPIE 1998, 3194, 133–144. [Google Scholar] [CrossRef]
- Harel, F.; Olamaei, N.; Ngo, Q.; Dupuis, J.; Khairy, P. Arterial Flow Measurements during Reactive Hyperemia Using NIRS. Physiol. Meas. 2008, 29, 1033. [Google Scholar] [CrossRef]
- Wagner, P.D. Limitations of Oxygen Transport to the Cell. Intensive Care Med. 1995, 21, 391–398. [Google Scholar] [CrossRef]
- Pilotto, A.M.; Adami, A.; Mazzolari, R.; Brocca, L.; Crea, E.; Zuccarelli, L.; Pellegrino, M.A.; Bottinelli, R.; Grassi, B.; Rossiter, H.B.; et al. Near-Infrared Spectroscopy Estimation of Combined Skeletal Muscle Oxidative Capacity and O2 Diffusion Capacity in Humans. J. Physiol. 2022, 600, 4153–4168. [Google Scholar] [CrossRef]
- Poole, D.C.; Kano, Y.; Koga, S.; Musch, T.I. August Krogh: Muscle Capillary Function and Oxygen Delivery. Comp. Biochem. Physiol. A Mol. Integr. Physiol. 2021, 253, 110852. [Google Scholar] [CrossRef]
- Poole, D.C.; Musch, T.I.; Colburn, T.D. Oxygen Flux from Capillary to Mitochondria: Integration of Contemporary Discoveries. Eur. J. Appl. Physiol. 2022, 122, 7–28. [Google Scholar] [CrossRef]
- de Oliveira, G.V.; Volino-Souza, M.; Leitão, R.; Pinheiro, V.; Alvares, T.S. Is Flow-Mediated Dilatation Associated with near-Infrared Spectroscopy-Derived Magnitude of Muscle O2 Desaturation in Healthy Young and Individuals at Risk for Cardiovascular Disease? Microvasc. Res. 2020, 129, 103967. [Google Scholar] [CrossRef]
- Soares, R.N.; Murias, J.M. Near-Infrared Spectroscopy Assessment of Microvasculature Detects Difference in Lower Limb Vascular Responsiveness in Obese Compared to Lean Individuals. Microvasc. Res. 2018, 118, 31–35. [Google Scholar] [CrossRef]
- Horiuchi, M.; Okita, K. Microvascular Responses during Reactive Hyperemia Assessed by Near-Infrared Spectroscopy and Arterial Stiffness in Young, Middle-Aged, and Older Women. Microvasc. Res. 2020, 129, 103972. [Google Scholar] [CrossRef]
- Keller, J.; Kennedy, K. Men Exhibit Faster Skeletal Muscle Tissue Desaturation than Women before and after a Fatiguing Handgrip. Eur. J. Appl. Physiol. 2021, 121, 3473–3483. [Google Scholar] [CrossRef]
- Keller, J.L.; Kennedy, K.G.; Hill, E.C.; Fleming, S.R.; Colquhoun, R.J.; Schwarz, N.A. Handgrip Exercise Induces Sex-Specific Mean Arterial Pressure and Oxygenation Responses but Similar Performance Fatigability. Clin. Physiol. Funct. Imaging 2022, 42, 127–138. [Google Scholar] [CrossRef]
- Rogers, E.M.; Banks, N.F.; Jenkins, N.D.M. Metabolic and Microvascular Function Assessed Using Near-Infrared Spectroscopy with Vascular Occlusion in Women: Age Differences and Reliability. Exp. Physiol. 2023, 108, 123–134. [Google Scholar] [CrossRef]
- Rosenberry, R.; Munson, M.; Chung, S.; Samuel, J.; Patik, J.; Tucker, W.; Haykowsky, M.; Nelson, M.D. Age-Related Microvascular Dysfunction: Novel Insight from Near-Infrared Spectroscopy—Rosenberry—2018—Experimental Physiology—Wiley Online Library. Available online: https://physoc.onlinelibrary.wiley.com/doi/full/10.1113/EP086639 (accessed on 6 November 2023).
- Ives, S.J.; Fadel, P.J.; Brothers, R.M.; Sander, M.; Wray, D.W. Exploring the Vascular Smooth Muscle Receptor Landscape in Vivo: Ultrasound Doppler versus near-Infrared Spectroscopy Assessments. Am. J. Physiol.-Heart Circ. Physiol. 2014, 306, H771–H776. [Google Scholar] [CrossRef]
- McCully, K.K.; Landsberg, L.; Suarez, M.; Hofmann, M.; Posner, J.D. Identification of Peripheral Vascular Disease in Elderly Subjects Using Optical Spectroscopy. J. Gerontol. Ser. A Biol. Sci. Med. Sci. 1997, 52A, B159–B165. [Google Scholar] [CrossRef]
- Ryan, T.E.; Southern, W.M.; Reynolds, M.A.; McCully, K.K. A Cross-Validation of near-Infrared Spectroscopy Measurements of Skeletal Muscle Oxidative Capacity with Phosphorus Magnetic Resonance Spectroscopy. J. Appl. Physiol. 2013, 115, 1757–1766. [Google Scholar] [CrossRef]
- Barstow, T.J.; Wong, B.J. Commentary on Viewpoint: The Human Cutaneous Circulation as a Model of Generalized Microvascular Function. J. Appl. Physiol. 2008, 105, 376. [Google Scholar] [CrossRef]
- Pozo, M.O.; Kanoore Edul, V.S.; Ince, C.; Dubin, A. Comparison of Different Methods for the Calculation of the Microvascular Flow Index. Crit. Care Res. Pract. 2012, 2012, 102483. [Google Scholar] [CrossRef]
- Cross, T.J.; Sabapathy, S. The Impact of Venous Occlusion per Se on Forearm Muscle Blood Flow: Implications for the near-Infrared Spectroscopy Venous Occlusion Technique. Clin. Physiol. Funct. Imaging 2017, 37, 293–298. [Google Scholar] [CrossRef] [PubMed]


| Participant Characteristics | Men (n = 15) | Women (n = 14) | Lower-Upper CI95%; p |
|---|---|---|---|
| Age (yrs) | 21 ± 3 | 21 ± 2 | −2.3 to 1.8; 0.08 |
| Height (cm) | 174.7 ± 10.2 | 164.2 ± 11.2 | −18.7 to −2.4; 0.01 |
| Weight (kg) | 83.7 ± 12.0 | 65.0 ± 9.4 | −27.0 to −10.5; <0.001 |
| Step Count | 9031.7 ± 3433.1 | 7582.0 ± 2748.9 | −2880.0 to 1227.1; 0.42 |
| Body Composition | |||
| Body Mass Index (kg/m2) | 27.4 ± 2.6 | 24.5 ± 23.7 | −5.3 to −0.5; 0.02 |
| Body Fat (%) | 17.8 ± 3.5 | 24.6 ± 6.2 | 3.0 to 10.6; 0.001 |
| Fat Mass (kg) | 14.8 ± 3.8 | 15.9 ± 6.1 | −2.8 to 4.9; 0.584 |
| Lean Mass (kg) | 68.7 ± 10.5 | 48.8 ± 5.2 | −26.4 to −13.3; <0.001 |
| Ultrasound Measures | |||
| Brachial Artery Diameter (cm) | 0.36 ± 0.05 | 0.29 ± 0.05 | 0.03 to 0.11; 0.002 |
| Brachial Artery Velocity (cm/s) | 30.9 ± 14.3 | 24.2 ± 11.1 | −6.7 to 4.8; 0.17 |
| Forearm Adipose Tissue (cm) | 0.30 ± 0.06 | 0.22 ± 0.1 | −0.09 to −0.04; 0.02 |
| Variables | ANOVA | p Value | Effect | |
|---|---|---|---|---|
| Mean Arterial Pressure (mmHg) | Sex × Time | 0.352 | 0.032 | |
| Sex | 0.137 | 0.080 | ||
| Time | 0.047 | 0.138 | Resting > Peak Reactive Hyperemia | |
| Heart Rate (bpm) | Sex × Time | 0.287 | 0.042 | |
| Sex | 0.204 | 0.059 | ||
| Time | 0.007 | 0.240 | Resting < Peak Reactive Hyperemia |
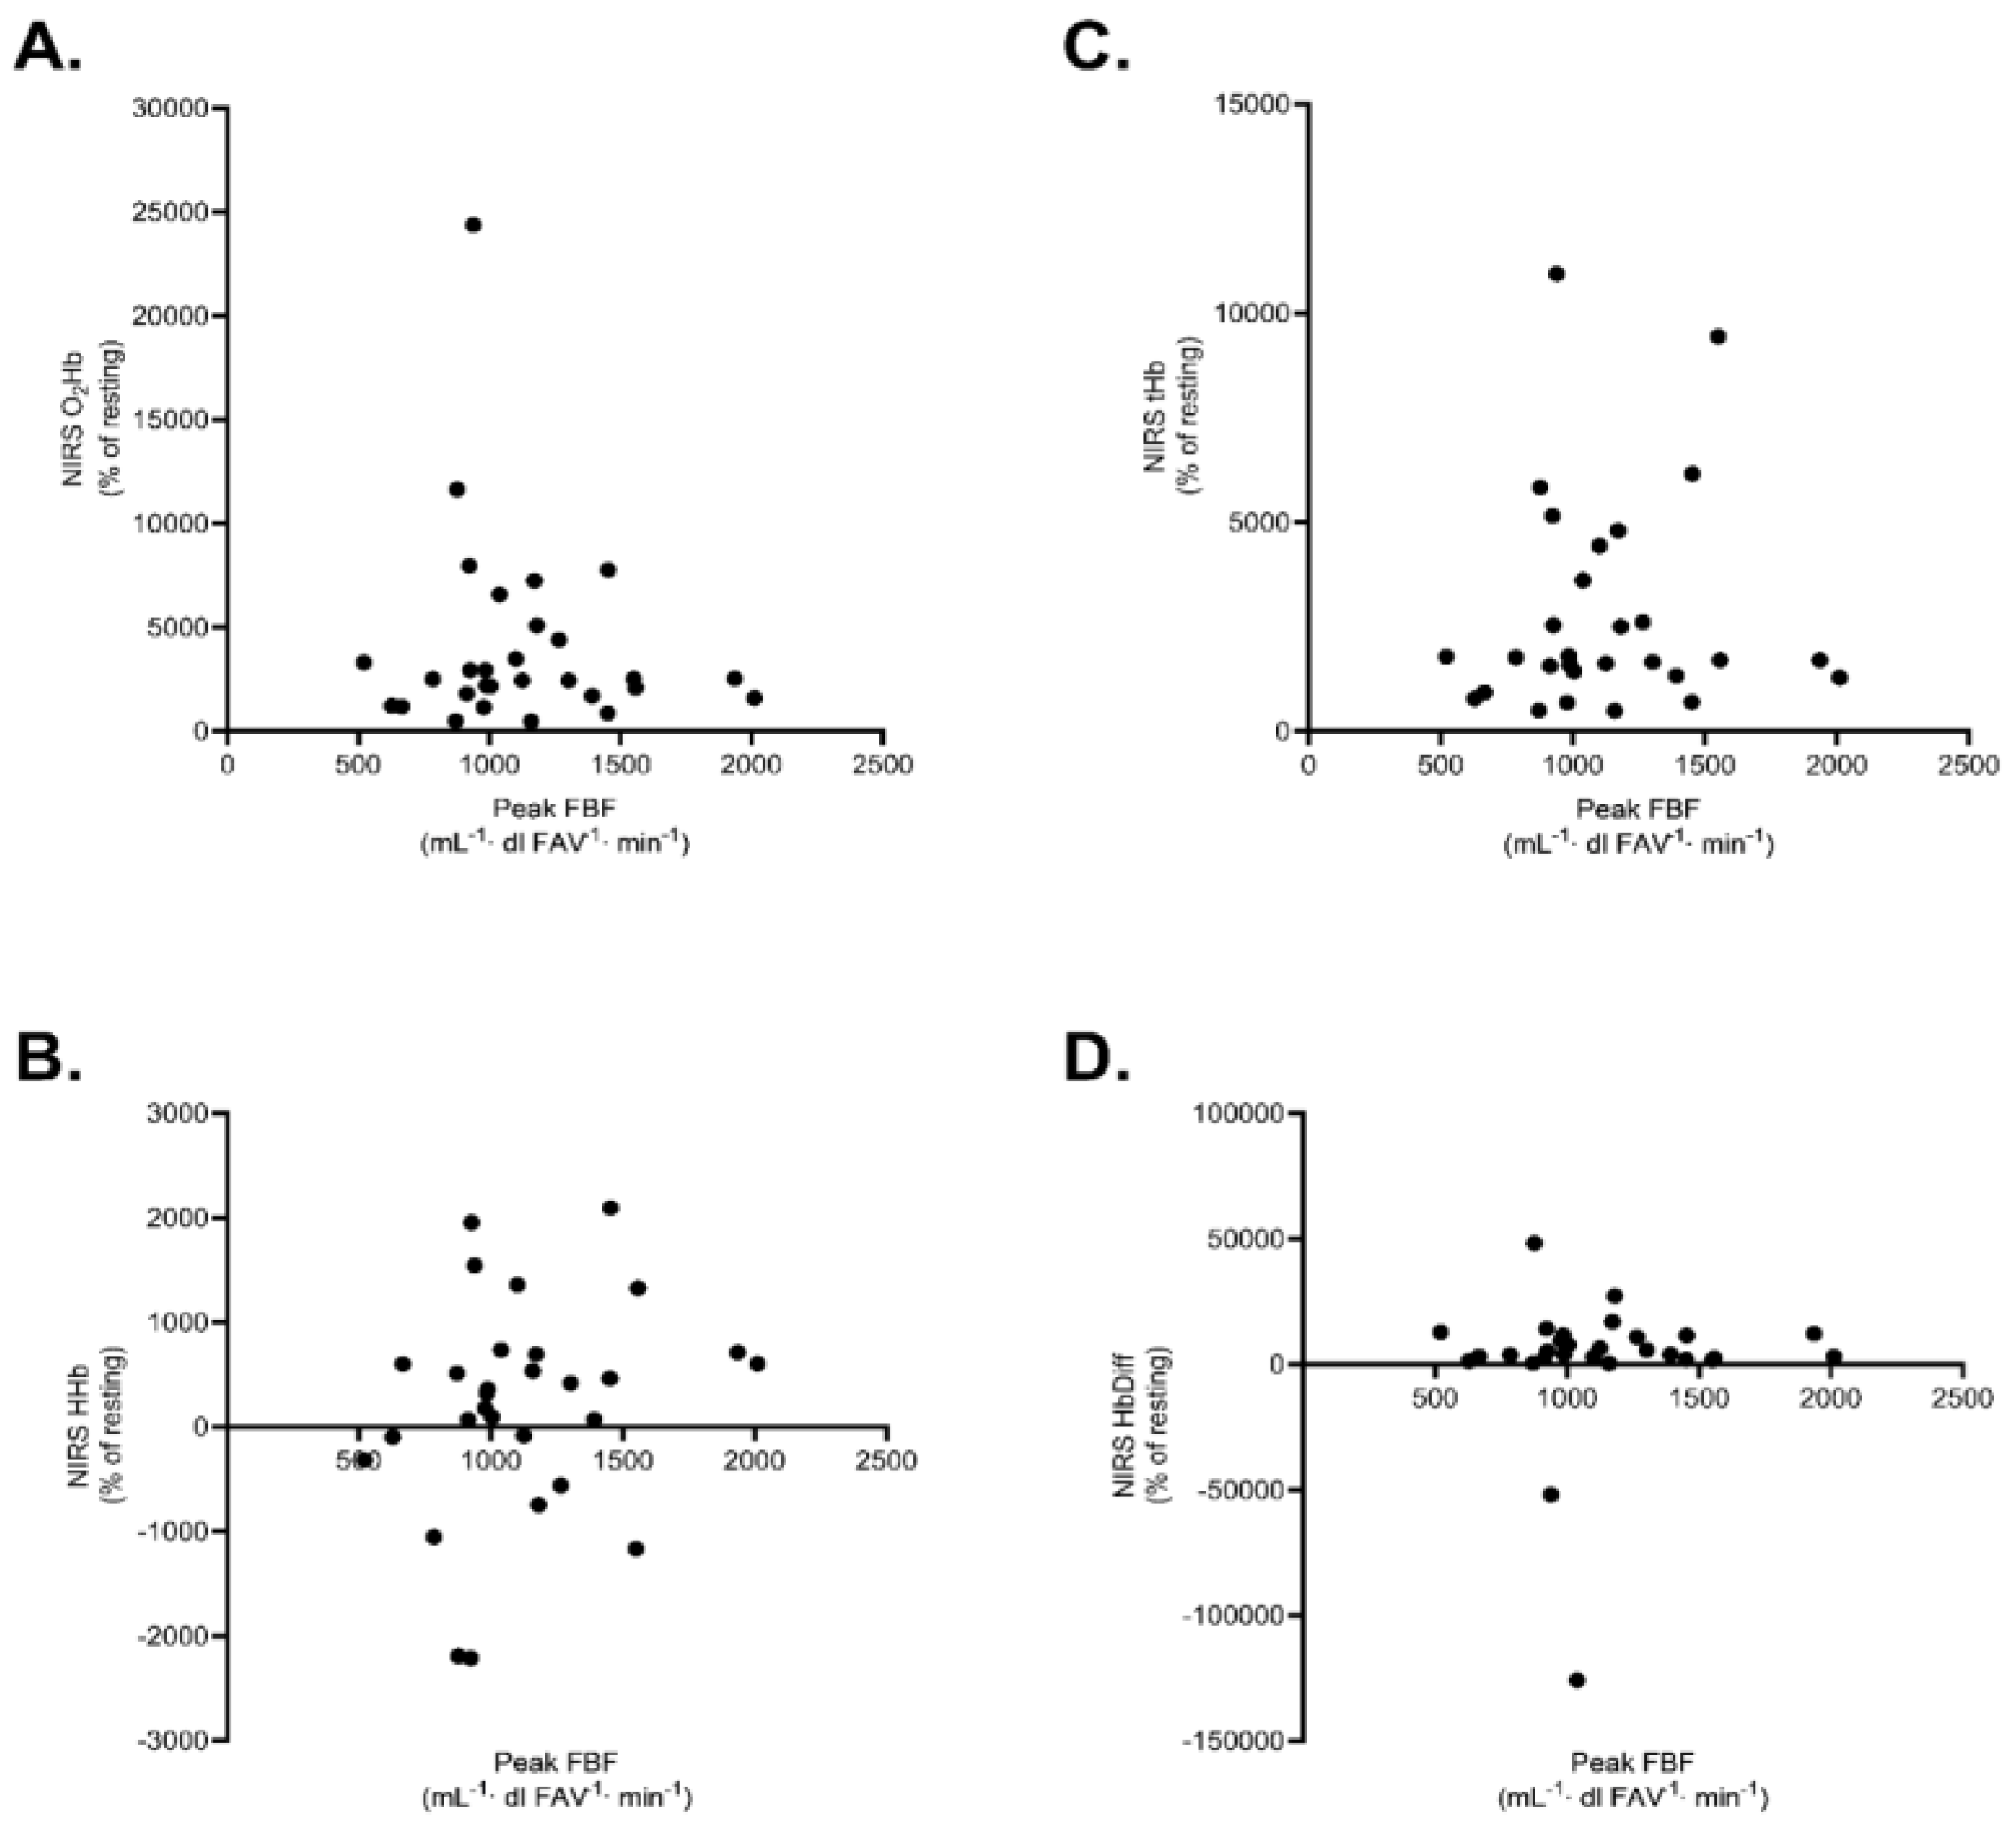
| Reactive Hyperemia Variables | r | Lower-Upper CI95%; p |
|---|---|---|
| Total (n = 29) | ||
| FBF and O2Hb | −0.126 | −0.47 to 0.25; 0.516 |
| FBF and HHb | 0.228 | −0.15 to 0.55; 0.235 |
| FBF and tHb | 0.061 | −0.31 to 0.42; 0.753 |
| FBF and HbDiff | 0.046 | −0.33 to 0.41; 0.811 |
| Men (n = 15) | ||
| FBF and O2Hb | −0.219 | −0.66 to 0.33; 0.433 |
| FBF and HHb | 0.217 | −0.33 to 0.66; 0.438 |
| FBF and tHb | 0.010 | −0.51 to 0.52; 0.972 |
| FBF and HbDiff | 0.237 | −0.31 to 0.67; 0.395 |
| Women (n = 14) | ||
| FBF and O2Hb | −0.150 | −0.63 to 0.41; 0.608 |
| FBF and HHb | 0.207 | −0.36 to 0.67; 0.477 |
| FBF and tHb | −0.128 | −0.62 to 0.43; 0.663 |
| FBF and HbDiff | −0.048 | −0.56 to 0.50; 0.871 |
| Resting Variables | r | Lower-Upper CI95%; p |
|---|---|---|
| Total (n = 29) | ||
| FBF and BABF | −0.043 | −0.40 to 0.33; 0.823 |
| O2Hb and BABF | 0.217 | −0.16 to 0.54; 0.259 |
| HHb and BABF | 0.187 | −0.19 to 0.52; 0.332 |
| tHb and BABF | 0.221 | −0.16 to 0.54; 0.249 |
| HbDiff and BABF | 0.219 | −0.16 to 0.54; 0.254 |
| Men (n = 15) | ||
| FBF and BABF | 0.393 | −0.15 to 0.75; 0.148 |
| O2Hb and BABF | 0.191 | −0.36 to 0.64; 0.495 |
| HHb and BABF | 0.303 | −0.25 to 0.71; 0.273 |
| tHb and BABF | 0.269 | −0.28 to 0.69; 0.332 |
| HbDiff and BABF | 0.004 | −0.51 to 0.52; 0.988 |
| Women (n = 14) | ||
| FBF and BABF | −0.196 | −0.66 to 0.37; 0.501 |
| O2Hb and BABF | 0.228 | −0.35 to 0.68; 0.432 |
| HHb and BABF | 0.069 | −0.48 to 0.58; 0.814 |
| tHb and BABF | 0.174 | −0.39 to 0.65; 0.552 |
| HbDiff and BABF | 0.303 | −0.27 to 0.72; 0.292 |
| Resting Variables | Baseline 1 | Baseline 2 | Baseline 3 | Baseline 4 | ICC2,1 | p | SEM |
|---|---|---|---|---|---|---|---|
| Total (n = 29) | |||||||
| FBF | 1.74 ± 0.65 | 1.73 ± 0.66 | 1.68 ± 0.62 | 1.75 ± 0.59 | 0.919 | 0.491 | 0.367 |
| O2Hb | 0.10 ± 0.08 | 0.10 ± 0.07 | 0.11 ± 0.10 | 0.09 ± 0.09 | 0.758 | 0.453 | 0.085 |
| HHb | 0.06 ± 0.06 | 0.06 ± 0.05 | 0.06 ± 0.06 | 0.05 ± 0.06 | 0.877 | 0.825 | 0.041 |
| tHb | 0.16 ± 0.14 | 0.15 ± 0.12 | 0.17 ± 0.15 | 0.14 ± 0.14 | 0.844 | 0.478 | 0.109 |
| HbDiff | 0.04 ± 0.05 | 0.040 ± 0.04 | 0.05 ± 0.06 | 0.04 ± 0.06 | 0.377 | 0.536 | 0.083 |
| Men (n = 15) | |||||||
| FBF | 1.85 ± 0.51 | 1.81 ± 0.42 | 1.74 ± 0.40 | 1.81 ± 0.51 | 0.836 | 0.483 | 0.377 |
| O2Hb | 0.10 ± 0.08 | 0.10 ± 0.07 | 0.10 ± 0.10 | 0.09 ± 0.09 | 0.732 | 0.743 | 0.117 |
| HHb | 0.06 ± 0.07 | 0.06 ± 0.06 | 0.05 ± 0.07 | 0.05 ± 0.07 | 0.873 | 0.597 | 0.048 |
| tHb | 0.16 ± 0.14 | 0.15 ± 0.13 | 0.15 ± 0.17 | 0.13 ± 0.14 | 0.853 | 0.474 | 0.113 |
| HbDiff | 0.04 ± 0.05 | 0.04 ± 0.03 | 0.05 ± 0.05 | 0.04 ± 0.06 | 0.115 | 0.971 | 0.092 |
| Women (n = 14) | |||||||
| FBF | 1.62 ± 0.77 | 1.64 ± 0.86 | 1.61 ± 0.81 | 1.68 ± 0.68 | 0.947 | 0.724 | 0.360 |
| O2Hb | 0.11 ± 0.09 | 0.09 ± 0.08 | 0.12 ± 0.10 | 0.10 ± 0.10 | 0.777 | 0.483 | 0.084 |
| HHb | 0.06 ± 0.05 | 0.06 ± 0.05 | 0.06 ± 0.06 | 0.06 ± 0.05 | 0.887 | 0.970 | 0.033 |
| tHb | 0.17 ± 0.13 | 0.15 ± 0.12 | 0.18 ± 0.15 | 0.16 ± 0.14 | 0.830 | 0.680 | 0.111 |
| HbDiff | 0.05 ± 0.05 | 0.03 ± 0.04 | 0.06 ± 0.08 | 0.04 ± 0.06 | 0.577 | 0.230 | 0.077 |
Disclaimer/Publisher’s Note: The statements, opinions and data contained in all publications are solely those of the individual author(s) and contributor(s) and not of MDPI and/or the editor(s). MDPI and/or the editor(s) disclaim responsibility for any injury to people or property resulting from any ideas, methods, instructions or products referred to in the content. |
© 2024 by the authors. Licensee MDPI, Basel, Switzerland. This article is an open access article distributed under the terms and conditions of the Creative Commons Attribution (CC BY) license (https://creativecommons.org/licenses/by/4.0/).
Share and Cite
Perlet, M.R.; Herren, J.T.; Traylor, M.K.; Bailey, M.D.; Keller, J.L. Near-Infrared Spectroscopy Does Not Track Forearm Blood Flow during Venous Occlusion Plethysmography. Appl. Sci. 2024, 14, 3205. https://doi.org/10.3390/app14083205
Perlet MR, Herren JT, Traylor MK, Bailey MD, Keller JL. Near-Infrared Spectroscopy Does Not Track Forearm Blood Flow during Venous Occlusion Plethysmography. Applied Sciences. 2024; 14(8):3205. https://doi.org/10.3390/app14083205
Chicago/Turabian StylePerlet, Michael R., Jeremy T. Herren, Miranda K. Traylor, Matthew D. Bailey, and Joshua L. Keller. 2024. "Near-Infrared Spectroscopy Does Not Track Forearm Blood Flow during Venous Occlusion Plethysmography" Applied Sciences 14, no. 8: 3205. https://doi.org/10.3390/app14083205
APA StylePerlet, M. R., Herren, J. T., Traylor, M. K., Bailey, M. D., & Keller, J. L. (2024). Near-Infrared Spectroscopy Does Not Track Forearm Blood Flow during Venous Occlusion Plethysmography. Applied Sciences, 14(8), 3205. https://doi.org/10.3390/app14083205