Abstract
Low-contrast oil reservoirs have a complicated origin story that frequently results from the interaction of several different factors. The low-contrast oil reservoirs in the Daqing Oilfield’s SaPu intercalation in the Longxi Region are the main subjects of this study. This work investigates the petrophysical origins of these low-resistivity oil reservoirs through a series of carefully planned petrophysical experiments. The results showed that the main determinants of the low-contrast oil reservoirs in the SaPu intercalation were the conductivity of clay minerals and a high irreducible water saturation. A low clay conductivity had a significant effect, resulting in a significant reduction in the formation resistivity, even in circumstances with a low porosity and a low formation-water salinity. Moreover, the results from the NMR tests revealed that the irreducible water saturation in the core samples primarily ranged from 0.6 to 0.8, suggesting a significant prevalence. This work provides strong petrophysical indices for evaluating low-resistivity oil reservoirs in the SaPu intercalation and useful information for the petrophysical evaluation of similar reservoirs.
1. Introduction
Understanding, locating, and evaluating low-contrast (low-resistivity) oil reserves is a complex and difficult task. The basic features of these reserves include a lower electrical resistivity in hydrocarbon-containing formations, particularly small resistivity differences between water- and oil-bearing formations [1], which makes it more difficult to identify and evaluate hydrocarbon-containing formations using well logging. Different forms of formation mechanisms appear in various low-contrast (low-resistivity) oil reservoirs, depending on the geology and reservoir properties. This adds a great deal of complexity to the quantitative evaluation and understanding of these reservoirs [2]. Therefore, it is essential to conduct a thorough petrophysical investigation of low-resistivity oil reservoirs in order to determine the most suitable reservoir-evaluation techniques.
The results show that a combination of geological, petrophysical, and technical factors makes it challenging to identify the formation of low-contrast oil reservoirs [3]. Due to the existence of low-amplitude structures characterized by a vast oil–water transition zone and a low oil saturation, a low-amplitude structure is an important geological origin. The thin interlayer of sand and mudstone causes a poor logging resolution and a large difference in the formation-water salinity. Regarding the petrophysical origin, a high immobile water saturation caused by fine lithology, a complex pore structure, and additional cationic conductivity in clay are important factors that make it difficult to identify the oil–water layer [4]. The intrusion of mud filtrate is an important factor. Numerous influencing elements frequently intersect with one another, and multi-factor superposition makes it difficult to identify well logging. However, more often than not, one or several factors are absolutely dominant. The petrophysical origin is an especially specific manifestation of the geological aspect to a certain extent, so in order to evaluate a low-contrast oil reservoir, it is particularly important to understand the petrophysical characteristics and their interrelations.
For a long time, due to the thin thickness of the SaPu formation and its location at the bottom of the Saertu formation’s hydrocarbon layer, it did not attract sufficient attention. In recent years, after fine research, old well review work has been carried out in the SaPu interlayer, and an industrial oil flow has been obtained from the exploration and evaluation of wells in the predicted, controlled, and proven reserve areas in the reorganization of the Longxi area. It has been proven that the layer has a certain production capacity, and good results have been achieved in the SaPu interlayer in the Longxi area of Daqing. At present, the main problems faced by the SaPu sandwich in the Longxi area are a thin reservoir and an insufficient response of the logging curve to oil and gas. The past plat is far from able to meet the needs of exploration and production. Many oil test results show that the resistivity of the oil layer is less than 10 ohm-meters, while some water layers reach more than 20 ohm-meters, and high-resistance water layers coexist with low-resistance oil layers. This results in problems of a low contrast between the oil layer and the water layer and difficulty in identifying the oil and water [5]. Therefore, this study used the Sapu interbedded low-resistance oil formation in the Longxi area as an example, and analyzed its main controlling factors and petrophysical characteristics based on a series of petrophysical experiments.
2. Geological Setting and Reservoir Characteristics
2.1. Geological Introduction
The Upper Cretaceous of the Songliao Basin was deposited by the strata of the Qingshankou Formation, Yaojia Formation, and Nenjiang Formation, and the contact relationship between the Yaojia Formation and the Qingshankou Formation is a parallel unconformity. The Qingshankou Formation and Nenjiang Formation underwent two large-scale lake invasions when they were deposited, and large and stably distributed oil shales were developed at the base of the Qingshankou Formation and the Nenjiang Formation, so that these two formations are good oil-generating rocks and regional capping layers in the basin, and also form the first-level stratigraphic comparative marker layer of the whole basin. The lithology of the Qingshankou Formation–Nenjiang Formation is dominated by sandstone–mudstone interbedding, and the formation shows a gradual thickening trend from west to east and from north to south. Three sets of oil-bearing combinations have developed in the Songliao Basin: the upper part is the oil-bearing combination of the Heidimiao Formation; the middle part is the oil-bearing combination of the Sa, Portugal, and Gao Formations; and the lower part is the oil-bearing combination of the Fuyang Formation. The oil-bearing assemblage in the center has three sets of oil layers, namely Sa, Portugal, and Gao, which were formed in the overall depression of the Songliao Basin during a period of significant return and filling, i.e., from the late stage of the Qingshankou Formation’s water recession to the early stage of the Yaojia Formation’s water-entry cyclone. The sedimentary phases of these three oil formations belong to the large river delta deposits in the northern part of the Songliao Basin from the middle Early Cretaceous period [6].
This research is focused on the SaPu intercalation, situated in the Longxi region within the Songliao Basin. The Longxi region is primarily situated on the central slope of the Longhupo–Da’an step, with the eastern and southern parts adjacent to the Qijia–Gulong depression and the western part adjacent to the Taikang uplift zone on the western slope. The SaPu intercalation constitutes a series of strata sandwiched between the Saertu and Putaohua oil-bearing formations. It presents a thickness ranging from 10 to 30 m and encompasses three sets of sand bodies, each approximately 10 m thick [7]. The depositional environment of this layer evolved gradually from north to south, from diversion plain–inner and outer fronts–front delta, and the western part is a gravity-flow depositional environment; from north to south, the color of the mudstone gradually becomes darker, the river channel changes gradually from a large diversion channel to a submerged diversion channel and from a mat sand to a black mudstone at the frontal margin, and the gravity-flow sand body is unstable.
2.2. Reservoir Characteristics
The SaPu interbedded reservoir has similar petrological characteristics to the adjacent Saertu and Putaohua formations, with a low rock maturity, a high clast and feldspar content, and a low quartz content, as shown in Figure 1. Most of the parent rock compositions of such reservoirs are close to volcanic sedimentary areas, so the plasticity of these minerals is high, while their physical properties are generally poor after transportation and deposition [8].
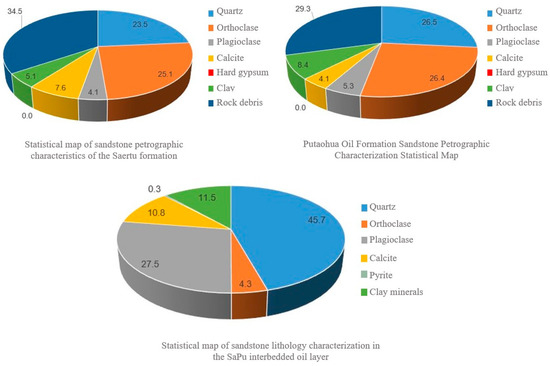
Figure 1.
Statistical chart of the characteristics of sandstone petrography.
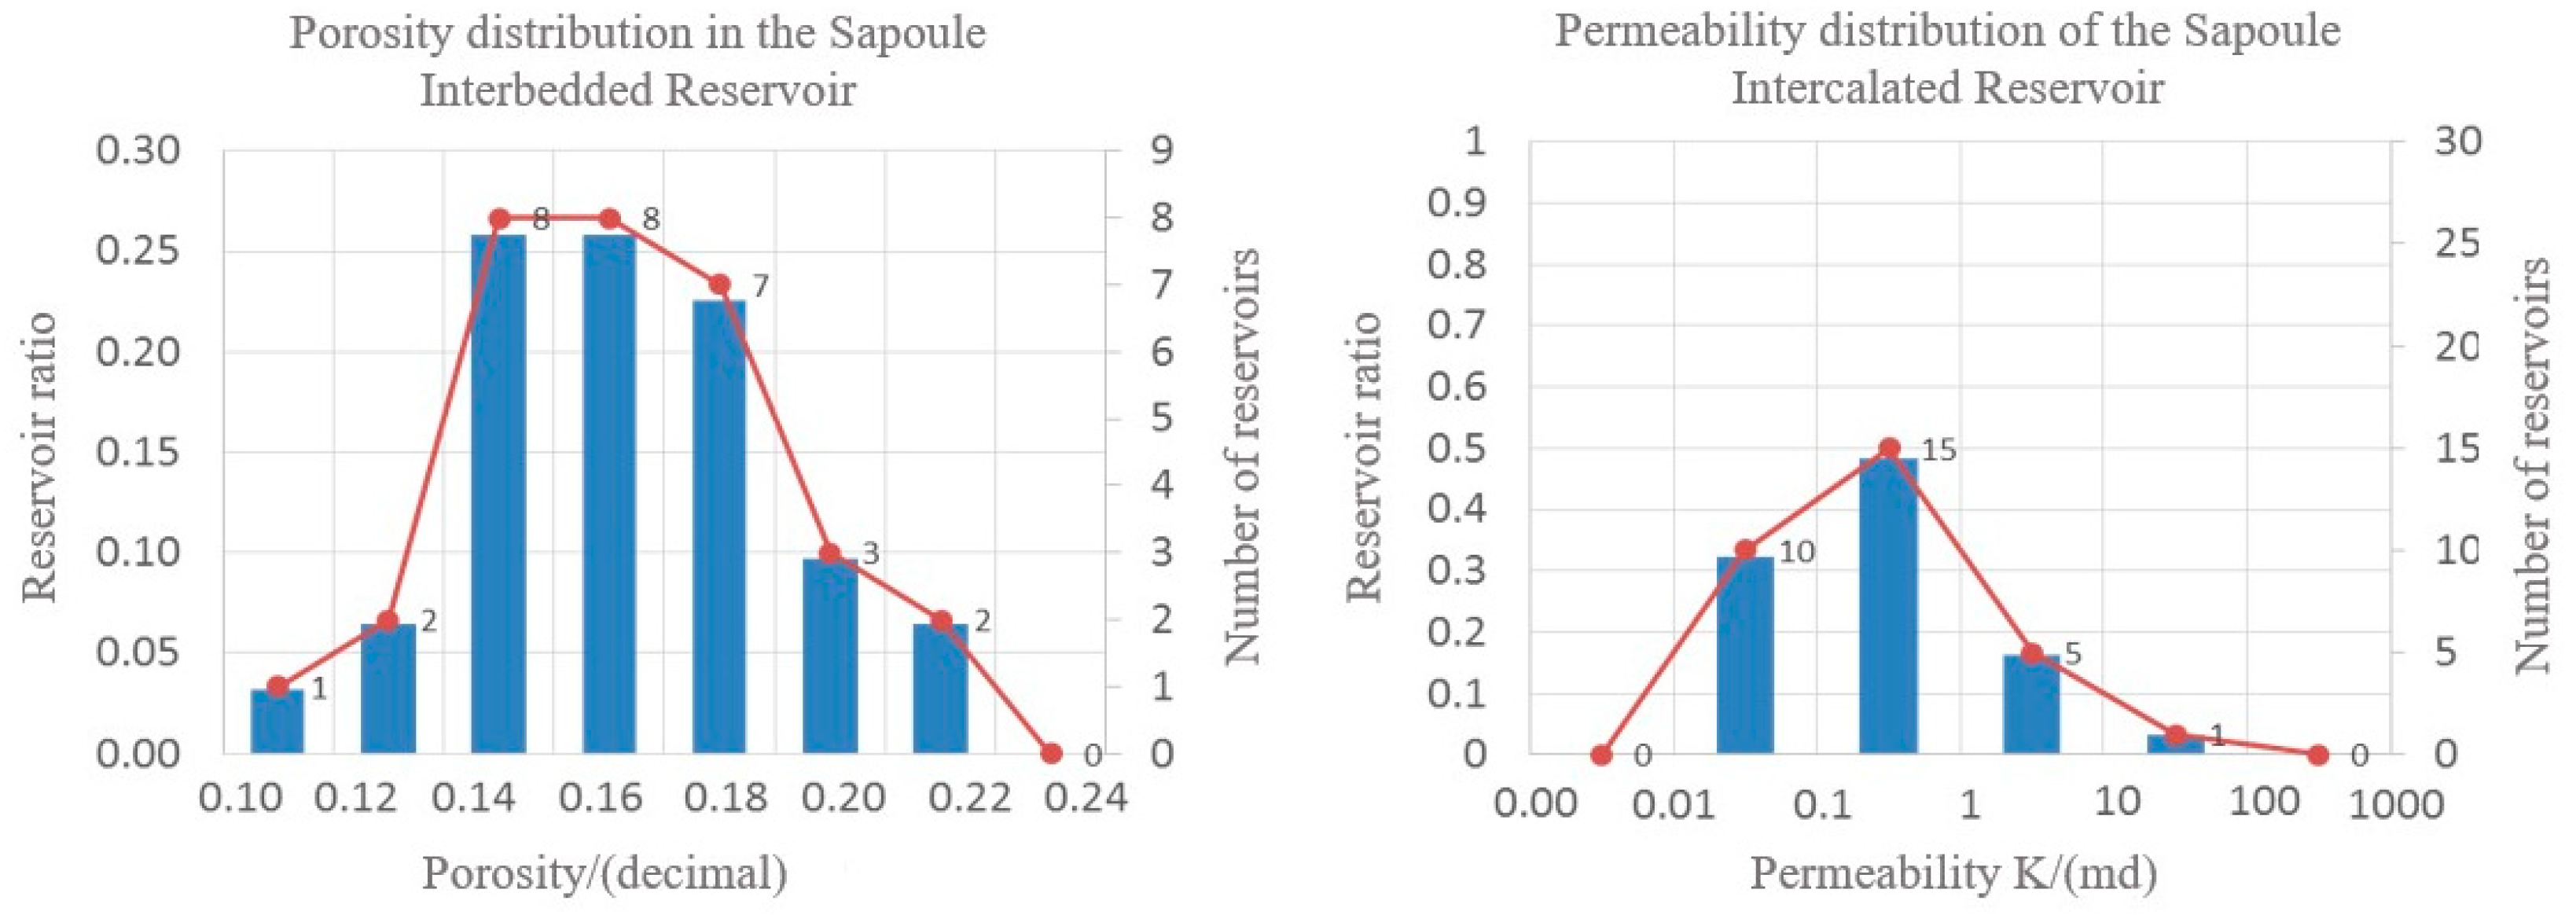
The core analysis data show that the porosity of the Saertu oil formation is generally between 9.0 and 23.0%, with an average of 17.2%; the air permeability is generally distributed between 0.1 and 100 mD, with an average of 0.5 mD; and it is a medium-porous and low-permeability reservoir, as shown in Figure 2.
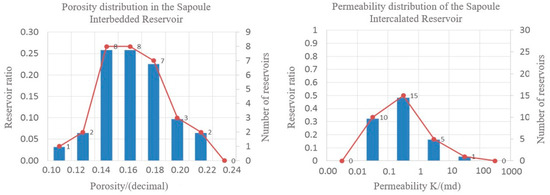
Figure 2.
Histogram of porosity and permeability distribution.
The SaPu intercalation elicits intricate well-logging responses. In comparison to the Sartu and Putaohua formations within the Saertu–Putaohua oil-bearing group, it has a smaller absolute value, but a larger relative value of natural gamma; a lower absolute value of spontaneous potential (SPmax-SP); a higher relative value; a sonic transit time ranging between 75 and 85 μs/ft; a compensated density between 2.2 and 2.5 g/cm3; and a compensated neutron porosity between 0.15 and 0.25. The deep and shallow lateral ratios are inferior to those of the adjacent Saertu–Putaohua reservoirs, and the oil layer resistivity is low (less than 10 ohm.m), with certain water layers demonstrating resistivity significantly surpassing that of the oil layer [9].
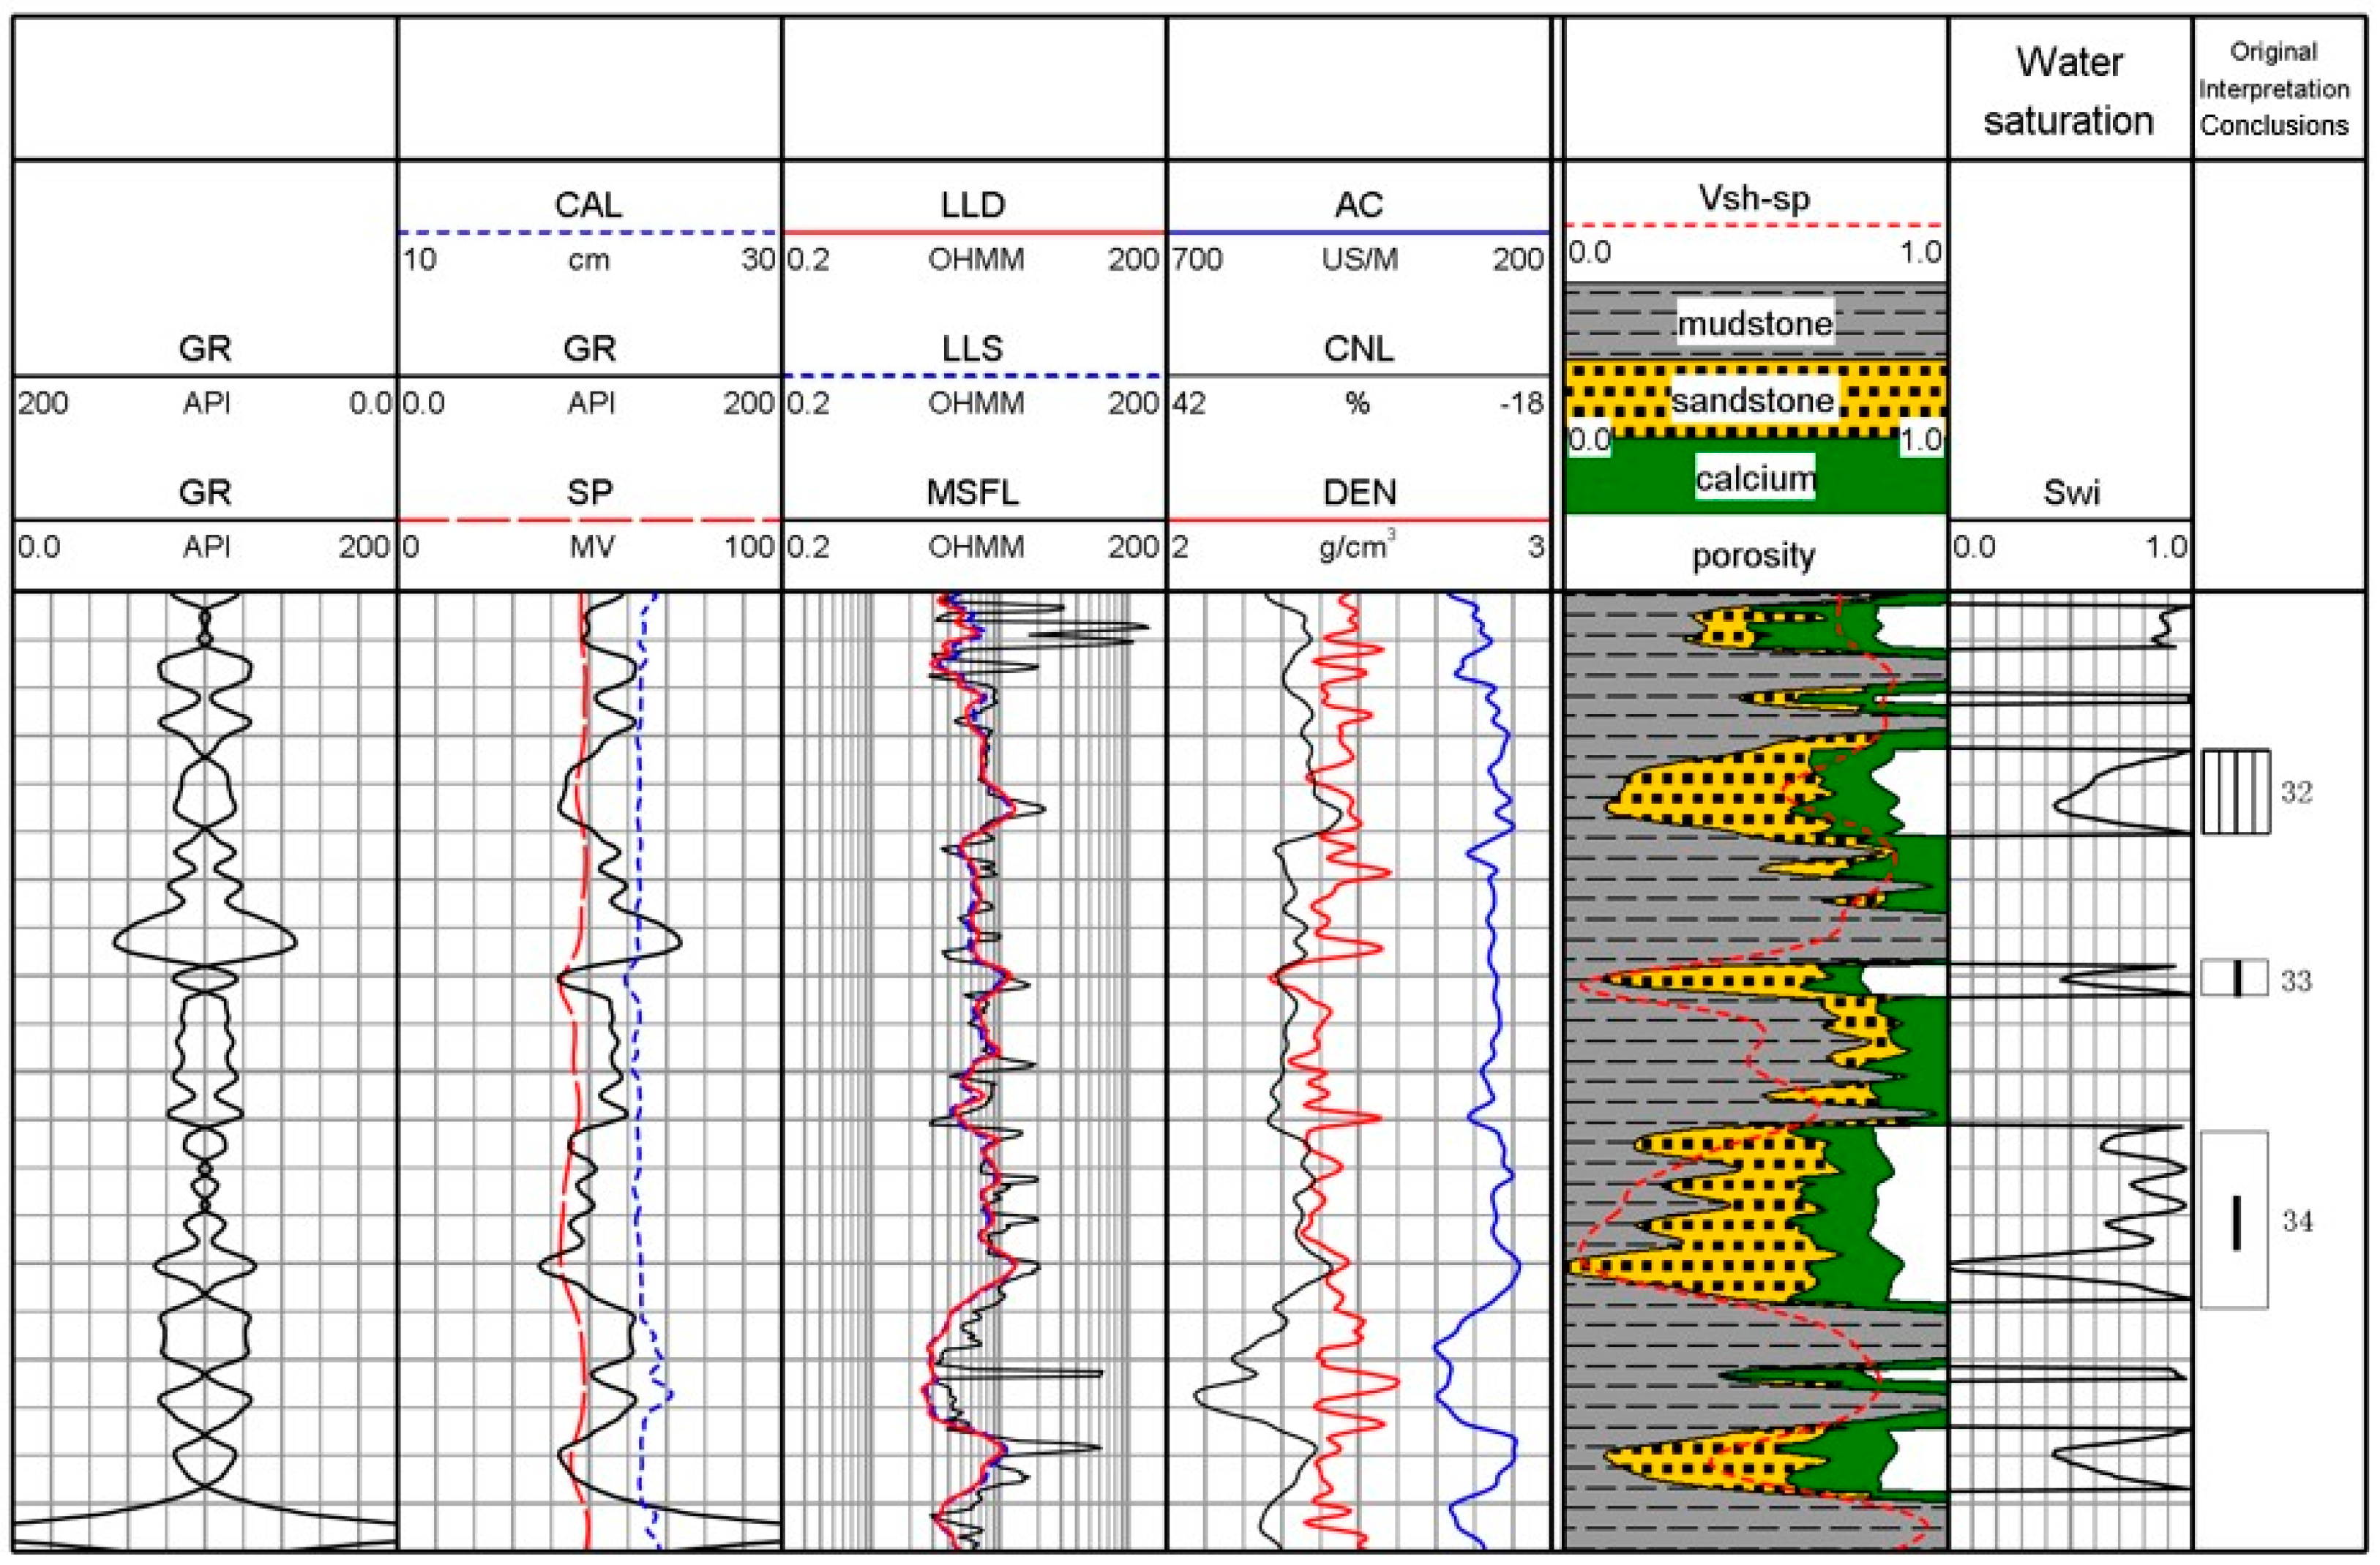
As illustrated in Figure 3, using T1702 as an exemplar, the natural gamma, one of the lithological curves, exhibits a sawtooth distribution, the spontaneous potential closely aligns with the mudstone baseline, the neutron porosity and density curves indicate a high clay content, and the resistivity is below 10 Ω·m, which indicates clear low-resistivity characteristics. Sedimentologically, rhythmic bedding is observable, denoting subaqueous distributary channel deposition. The upper mud content is substantial, and the bound water saturation is elevated, underscoring distinct sedimentary control. The testing results for Layers 33 and 34 indicate that they are industrial oil and gas reservoirs with a daily oil production of 10.1 t and a daily water production of 5.4 m3 [10].
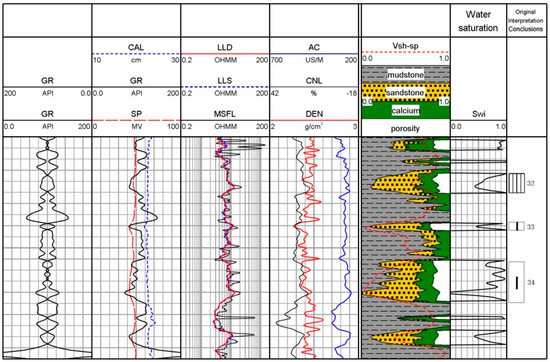
Figure 3.
Log review and preliminary interpretation of Well T1702.
3. Petrophysical Experiments
A total of 31 pieces of SaPu sandwich cores were obtained, and the cores were processed into plunger-type core samples measuring 2.5 cm in diameter and 4 cm in length using a core sampler. For research purposes, the processed cores were divided into two parts. One group underwent X-ray diffraction and cation exchange capacity (CEC) measurements to determine the clay mineral types, the content, and the additional conductive capability of the clays. The other group underwent basic core parameter measurements, a T2 spectrum of nuclear magnetic resonance (NMR) measurement, and resistivity experiments [11], as shown in Figure 4.
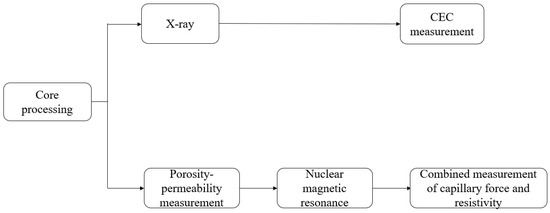
Figure 4.
Lab experimental work flow.
Utilizing the outcomes of the experimental measurements, Figure 5 displays the main core parameters. The experimentally measured core gasometric porosity generally ranged from 9.0% to 23.0%, with an average of 17.2%. The gas permeability was generally distributed between 0.1 and 100 mD, with an average of 0.5 mD, signifying a reservoir characterized by a medium-to-low porosity and permeability [12]. X-ray diffraction experiments conducted on the cores revealed predominant minerals, including quartz and feldspar, accompanied by calcite. The average clay content was determined to be 11.6%, and a relatively high proportion of mixed-layer illite was observed. The cation exchange capacity (CEC) values varied from 1 to 6 mmol/100 g, with 52% falling within the range of 4 to 6 mmol/100 g.
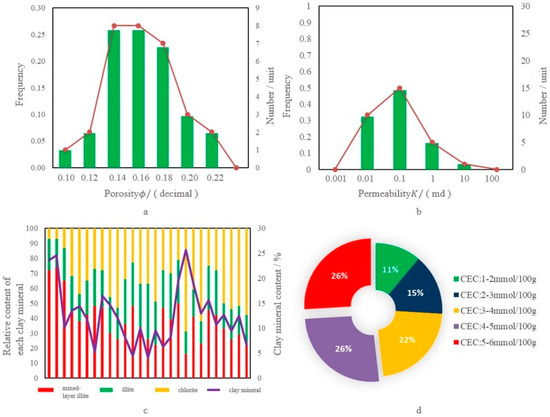
Figure 5.
Experiment results: (a) core porosity, (b) core permeability, (c) core clay content, and (d) overall CEC content of cores.
4. Analysis of the Origin of Low-Resistivity Oil Reservoirs
4.1. Theoretical Model Based on the Experimental Law of Additional Electrical Conductivity of Clay
It is well known that, for pure sandstones, the relationship between the rock resistivity and the porosity or oil saturation can be well described by the Archie formula [13]. However, the presence of clay minerals in the reservoir rock complicates the interpretation of logs based on physical measurements. On the basis of a large number of laboratory petrophysical–chemical measurements made by Hill and Milburn and by Waxman and Smits, Waxman and Thomas established the well-known model for evaluating the saturation of muddy sandstones, the Waxman–Smits model (abbreviated as the W-S model).
Initial establishment of the W-S model:
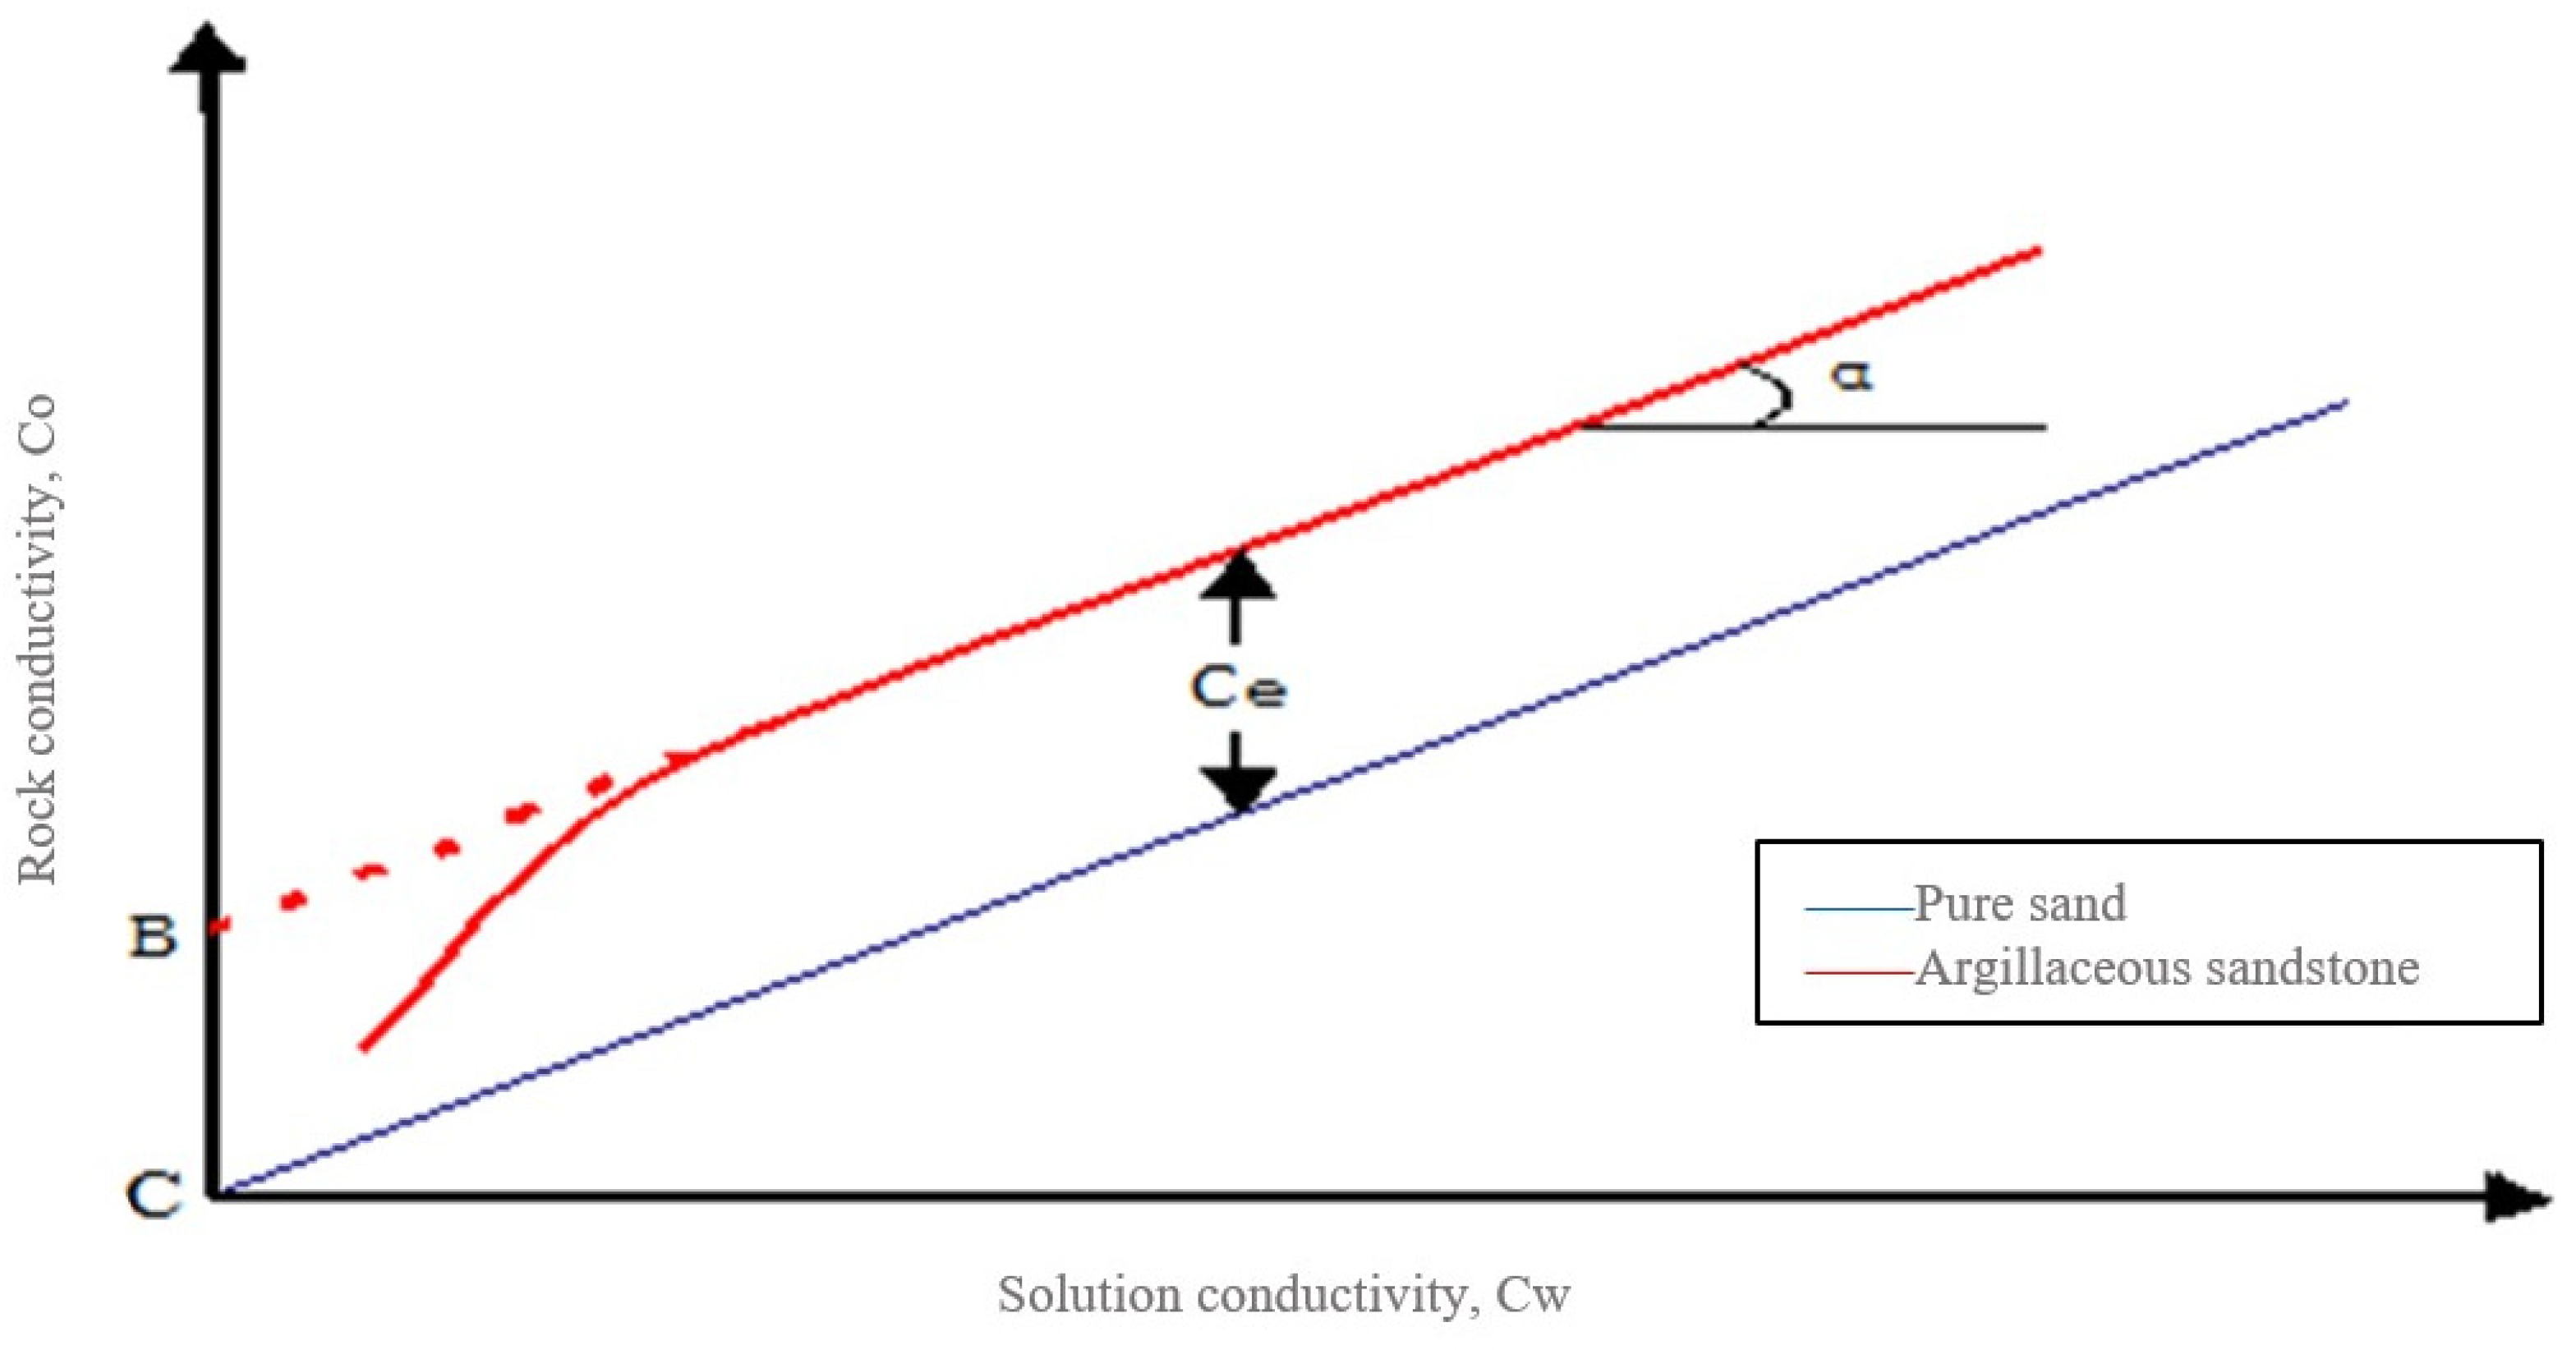
Through experimental measurements, Hill and Milburn found a nonlinear pattern of change in the rock conductivity () of argillaceous sandstones with an increasing solution conductivity ().
As shown in Figure 6, Waxman and Smits suggested that the sharp increase in the rock conductivity caused by the increase in the solution’s electrolyte concentration in the dilute solution range (the low section in Figure 6) was due to an increase in the mobility of the exchangeable cations on the surface of the clays in the rock. The conductivity induced by the exchangeable cations proceeds continuously with the help of the migration of cations in the electric field. The migration of cations can be either from one fixed exchange position of a clay particle to another, or from one clay cluster to another exchange position of a cluster via a free electrolyte [14].

Figure 6.
Nonlinear pattern of change between rock conductivity and solution conductivity in argillaceous sandstones.
When the clay content is increased, i.e., the number of cation exchange sites that can be used, in the presence of little or no free electrolytes, this will result in a decrease in the energy required for the cations to carry out the conductivity, and therefore cause an increase in the cation mobility. Subsequently, if the salt concentration in the solution is increased, the conductivity of the free ions in solution becomes easier and is accompanied by a significant increase in the mobility of the exchanged cations. After the equilibrium electrolyte solution reaches a certain higher concentration, a further increase in the concentration should result in no further change in the mobility of the exchanged cations; in other words, the mobility of the exchangeable cations should reach a certain constant or extreme value. With further increases in the electrolyte concentration, the sandstone conductivity will increase linearly with increasing solution conductivity [15].
On this basis, Waxman and Smits proposed a general equation for the conductivity of cemented sandstones:
4.2. Additional Conductivity of Clay Minerals
Clay minerals inherently bear unsaturated charges, and in accordance with the principle of electrical neutrality, an equivalent quantity of cations adheres to the surface of clay minerals to establish an electrical equilibrium [16]. The conductive impact of cations adsorbed on clay minerals is predominantly governed by three key factors [17]. Firstly, it is governed by the cation exchange capacity (CEC) of rocks, contingent upon the type and abundance of the clay minerals present. Distinct clay types exhibit varying CEC values, as delineated in Table 1, with montmorillonite registering the highest CEC value, succeeded by mixed-layer illite, illite, and kaolinite. Secondly, the salinity of the formation water within rock pores plays a crucial role. A reduced salinity enhances the proportion of cation adsorption conductivity in the overall rock conductivity network, encompassing free-water conductivity in the pores and cation-adsorption conductivity. Thirdly, the formation temperature contributes to this interplay; both experimental and theoretical investigations have affirmed that elevated temperatures diminish the activity of ions in water, consequently attenuating the influence of adsorbed cations on clay minerals. Simultaneously, the positive charge on clay minerals diminishes with temperature, resulting in a reduction in the conductivity effect. In the SaPu intercalation, the low contrast in the oil reservoir resistivity is intricately linked to the additional conductive impact of clay minerals.

Table 1.
Cation exchange capacity of different clays.
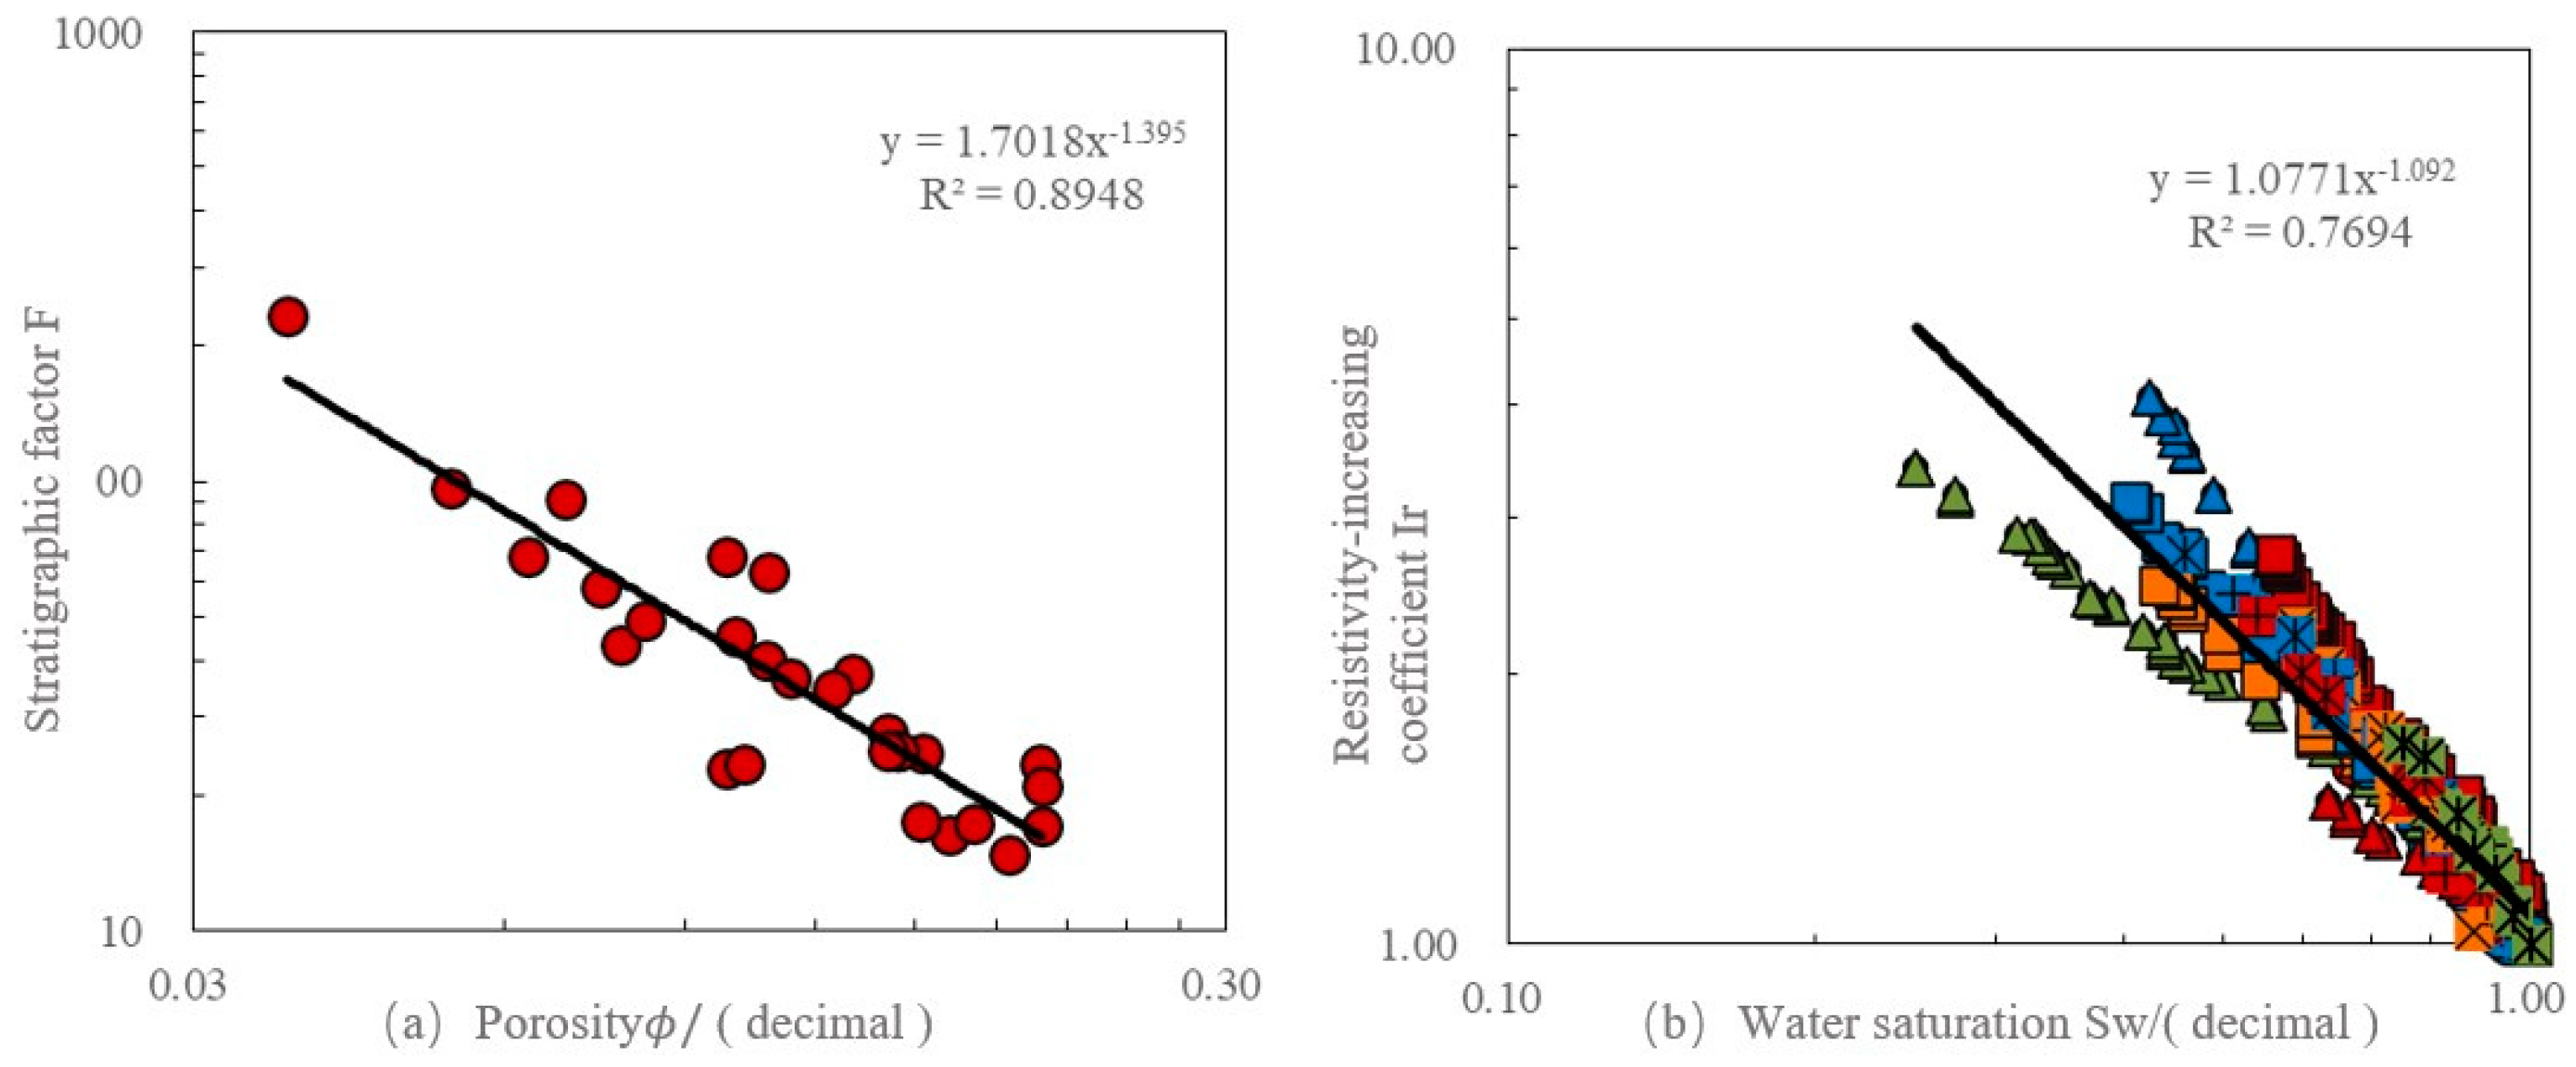
Following the experience gained from the early assessment of low-resistivity oil reservoirs in the Bohai Bay and Junggar Basin [18], the SaPu intercalation was found to exhibit a relatively low mud content and a low CEC value. Disregarding the additional conductivity impact of mud, the rock electrical experiment results were analyzed based on the Archie model, as illustrated in Figure 7.
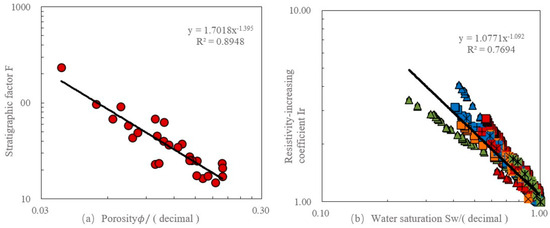
Figure 7.
Core resistivity measurement results fitted with the Archie equation: (a) formation factor versus core porosity, and (b) resistivity index versus water saturation. (In the figure, y denotes the expression of the fitted curve and R2 denotes the correlation coefficient).
Here, represents the geological factors, dimensionless; denotes the resistivity increase coefficient, dimensionless; is the resistivity of the rocks when fully saturated with water (in ohm.m); is the resistivity of the formation water (in ohm.m); is the porosity of the formation, dimensionless; is the water saturation, dimensionless; is the cementation exponent, dimensionless; and is the saturation exponent, dimensionless.
The experimental results revealed relatively low values for both m (1.395) and n (1.092). The correlation between the water saturation and the core resistivity exhibited a suboptimal fit according to the coefficient. This observation underscores that, even in the SaPu intercalation, which is characterized by a low mud content and a low porosity, the influence of its additional conductivity should not be disregarded.
The X-ray diffraction analysis of the core samples from the SaPu intercalation indicated the prevalence of the illite/smectite mixture as the primary clay mineral. Building upon the preceding examination of its impact on cation exchange, the cation exchange capacity (CEC) demonstrated a range between 1 and 6 mmol/100 g. Calculated using Formula (4), spanned from 0.33 to 2.25 meq/mL, with an average value of 0.92 meq/mL. While this magnitude might not appear substantial, in low-porosity formations, the associated assumes significance, exerting a direct influence on the rock conductivity.
wherein is the grain density, g/cm2; is the porosity, fraction; and is the effective concentration of clay-exchange cations (equiv/liter or meq/mL), and can be determined independently from the ratio of the cation exchange capacity (meq per 100 gm of rock) per unit pore volume of rock (mL per 100 gm of rock). is the cation exchange capacity, meq/100 g.
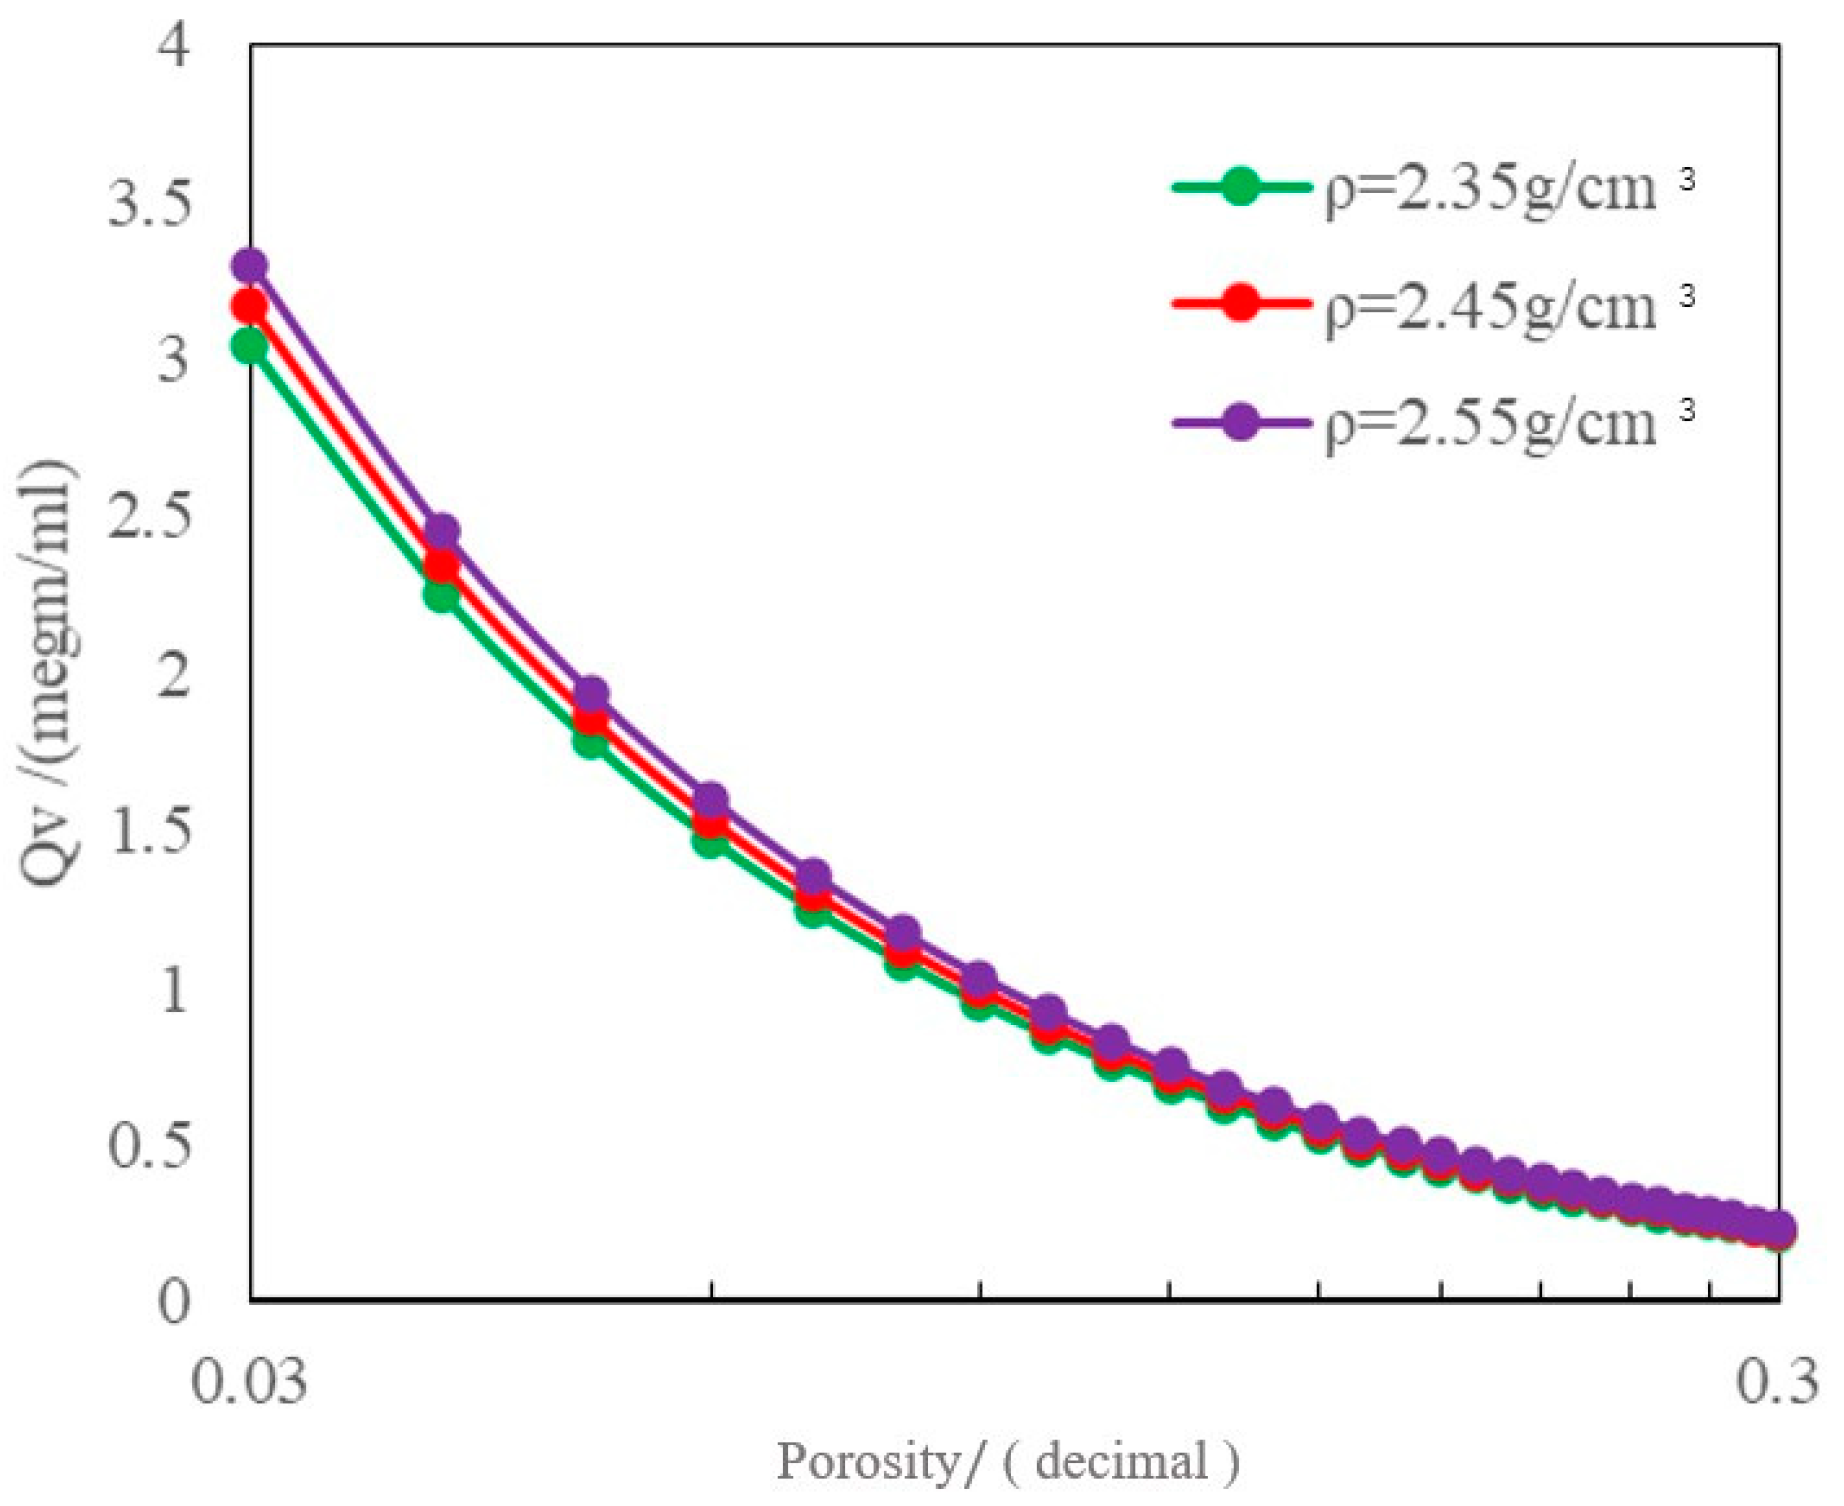
To assess the impact of porosity on [19], simulations were conducted for different rock densities using the Formula (4) and by setting the to 4 mmol/100 g, showing the variation in with the porosity. As depicted in Figure 8, with the same value, a lower porosity corresponded to a higher . At porosities of 20%, 15%, 10%, and 5%, was 0.392, 0.555, 0.882, and 1.862 meq/mL, respectively. A lower porosity emphasized the relevance of the cation exchange capacity.
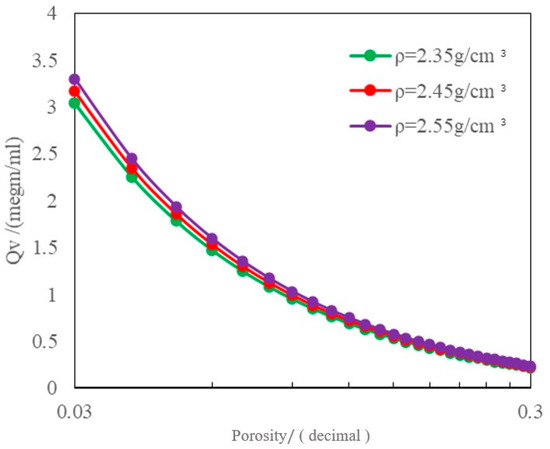
Figure 8.
The relationship between and the core porosity.
Based on the analysis above, the additional conductivity of mud for rock with low porosities cannot be overlooked. Consequently, the Waxman–Smits model was employed to fit the rock electrical experiment data, as shown in Figure 9. After the correction for the additional conductivity, the fitting was significantly improved, yielding a cementation exponent of 1.987 and a saturation exponent of 1.796.
wherein is the formation resistivity factor, dimensionless; is the resistivity index, dimensionless; is the electrochemical equivalent conductance of the equilibrium cation in the unit of (mho.cm2)/meq; is the cementation exponent, dimensionless; and is the water saturation exponent, dimensionless.
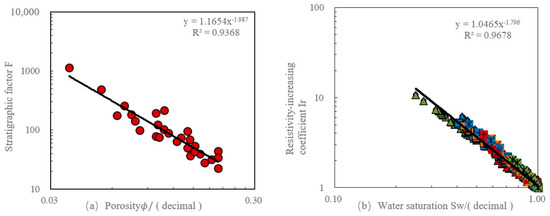
Figure 9.
The core resistivity measurement results fitted with the Waxman–Smits equation: (a) the formation factor versus the core porosity and (b) the resistivity index versus the water saturation. (In the figure, y denotes the expression of the fitted curve and R2 denotes the correlation coefficient).
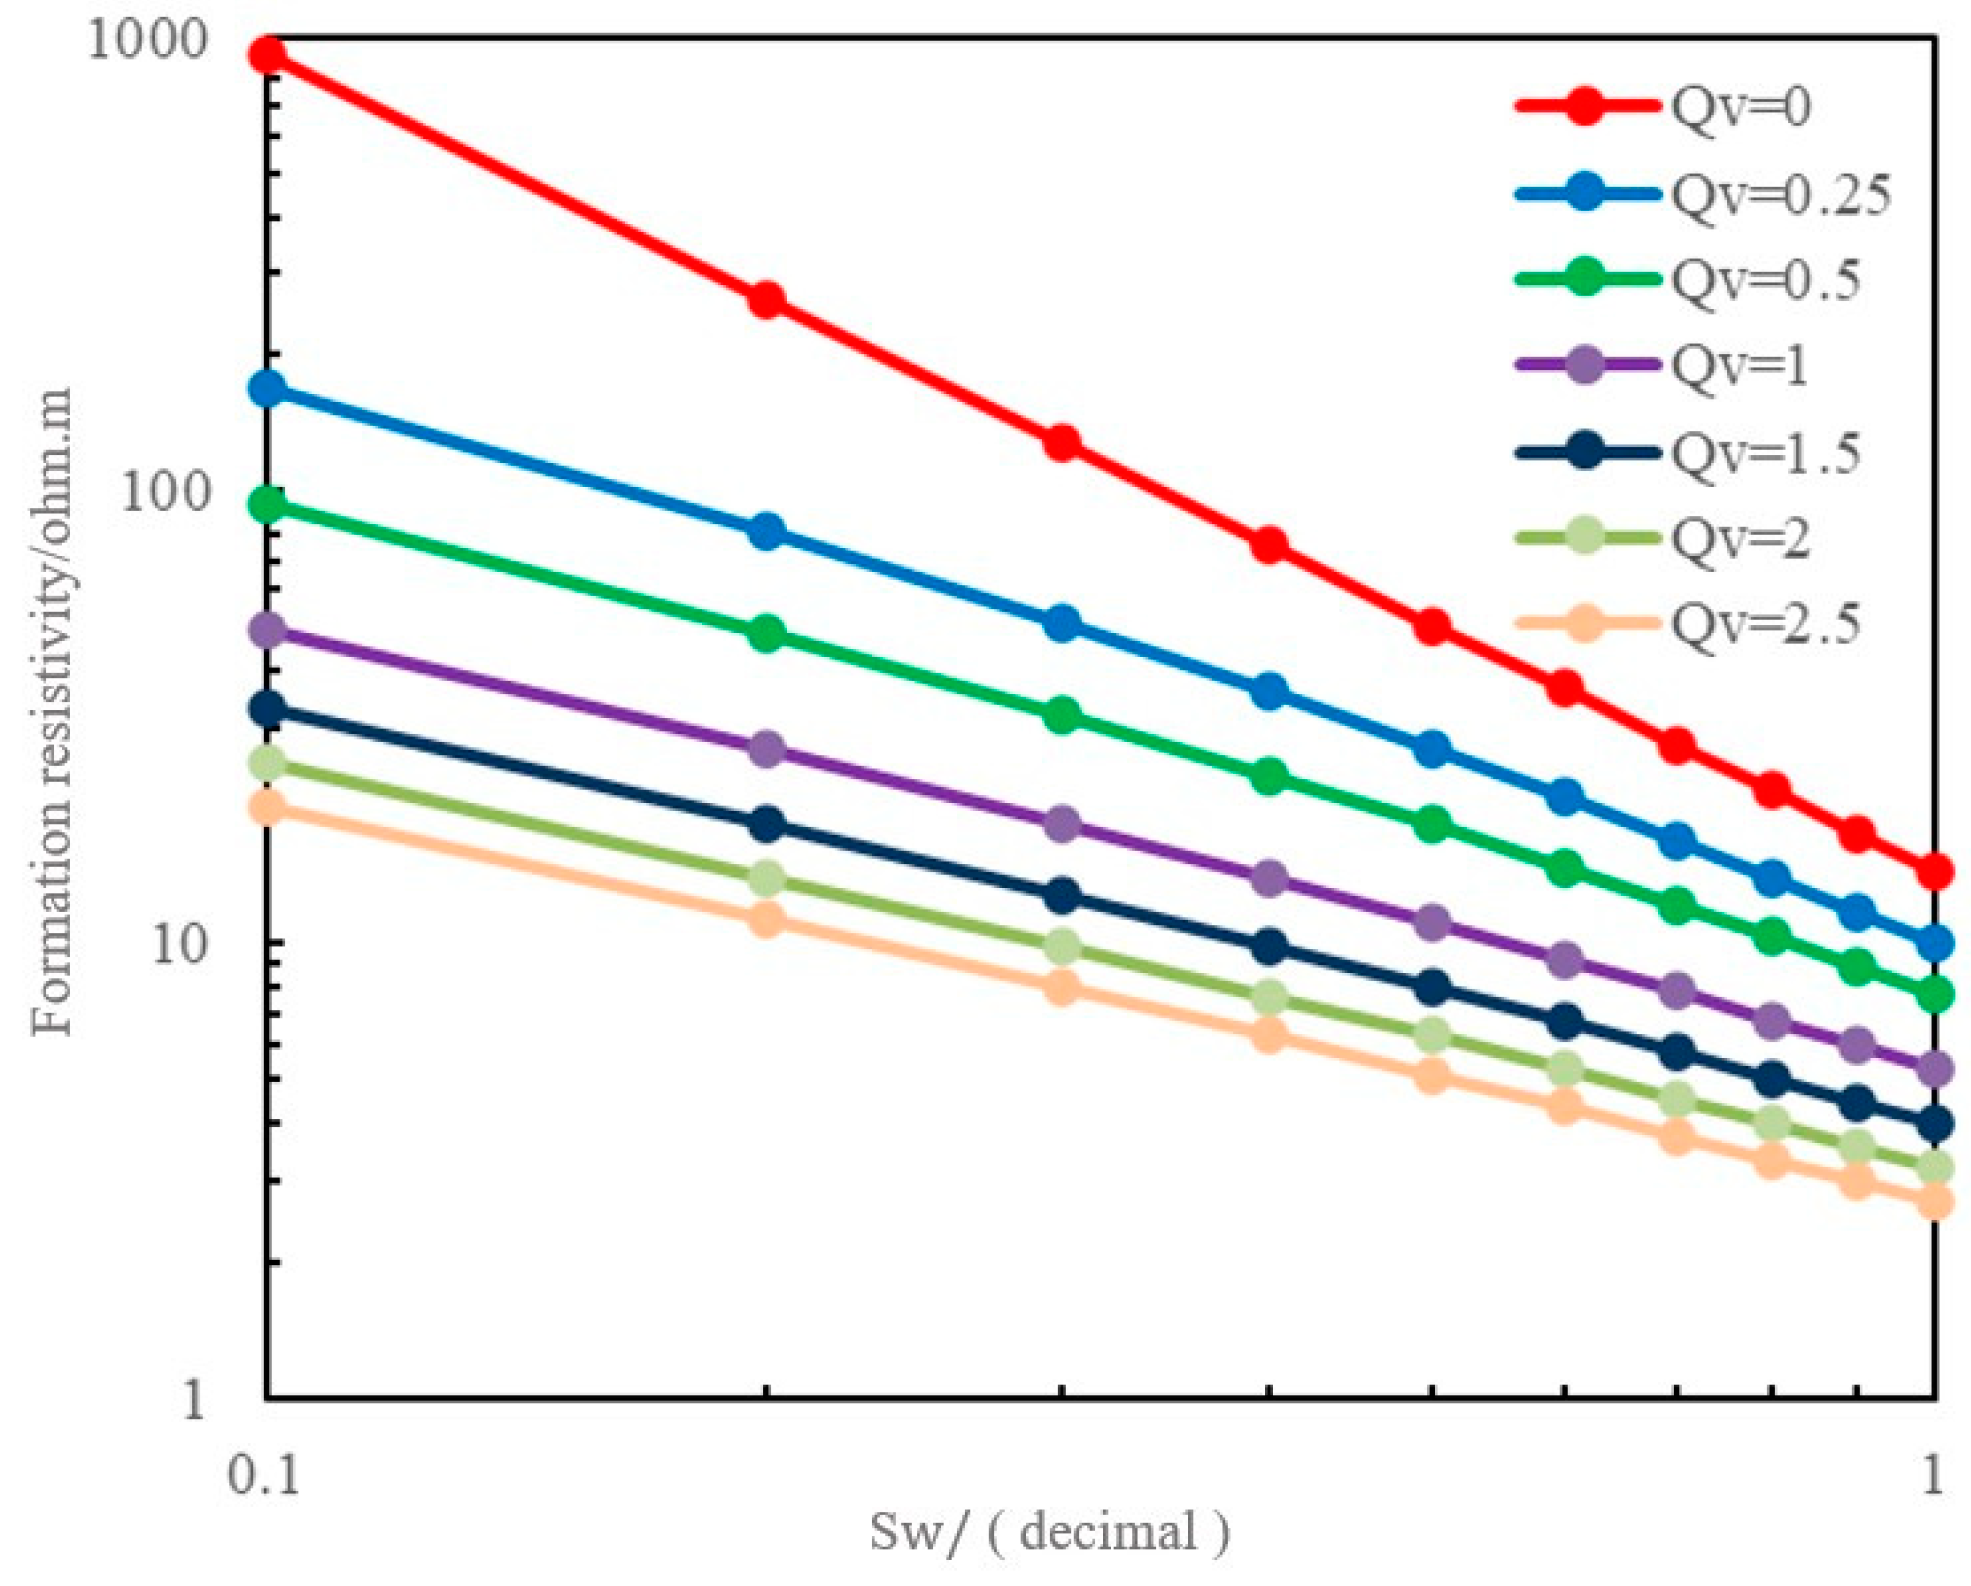
When the additional conductivity of mud in the formation cannot be ignored, the influence of the formation-water salinity on the formation resistivity must be considered [20]. By analyzing the SaPu intercalation formation-water data, as shown in Figure 10, the average total salinity was determined to be 7683.4 mg/L, indicating freshwater conditions. For formations rich in mud sandstone with freshwater, the increased additional conductivity of mud becomes the main factor causing a low resistivity due to the limited conductivity of water. When the mud content is sufficiently high and exhibits a continuous distribution in depositional settings, it undergoes a transformation into the first category of low-resistivity hydrocarbon-bearing formations, thereby forming a composite-genesis, low-resistivity hydrocarbon reservoir. The degree of resistivity reduction in such formations is contingent upon both the clay content and the cation exchange capacity.
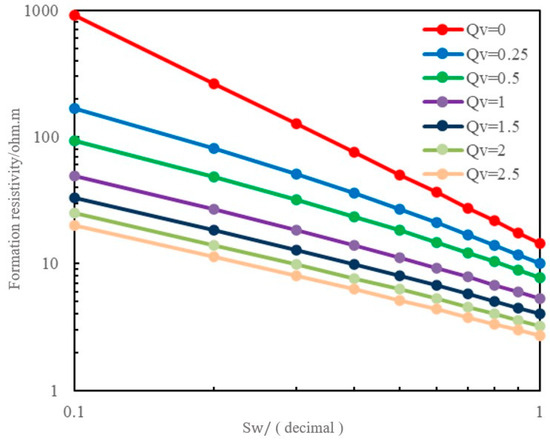
Figure 10.
The relationship for reservoir rocks with different .values (e.g., = 0.25); the impact of clay’s additional electrical conductivity is significant. At 50% water saturation, varied from 0 to 0.92 meq/mL, resulting in a resistivity decrease from 50.47 ohm.m to 11.9 ohm.m, marking a substantial 76% alteration. This underscores the significant impact of under conditions of a low porosity, a low salinity, and elevated bound water saturation. With increasing , the resistivity index of mud sandstone reservoirs experiences a continuous decline, albeit at a diminishing rate.
Using the Waxman–Smits model under the formation conditions, assuming a formation temperature of 80 °C and a NaCl solution resistivity of 0.44 ohm.m, with = 4 (mho.cm2)/meq, = 1.796, = 1.987, and an average porosity = 0.172 [21], the simulation results showed the relationship for reservoir rocks with different values of , as shown in Figure 10.
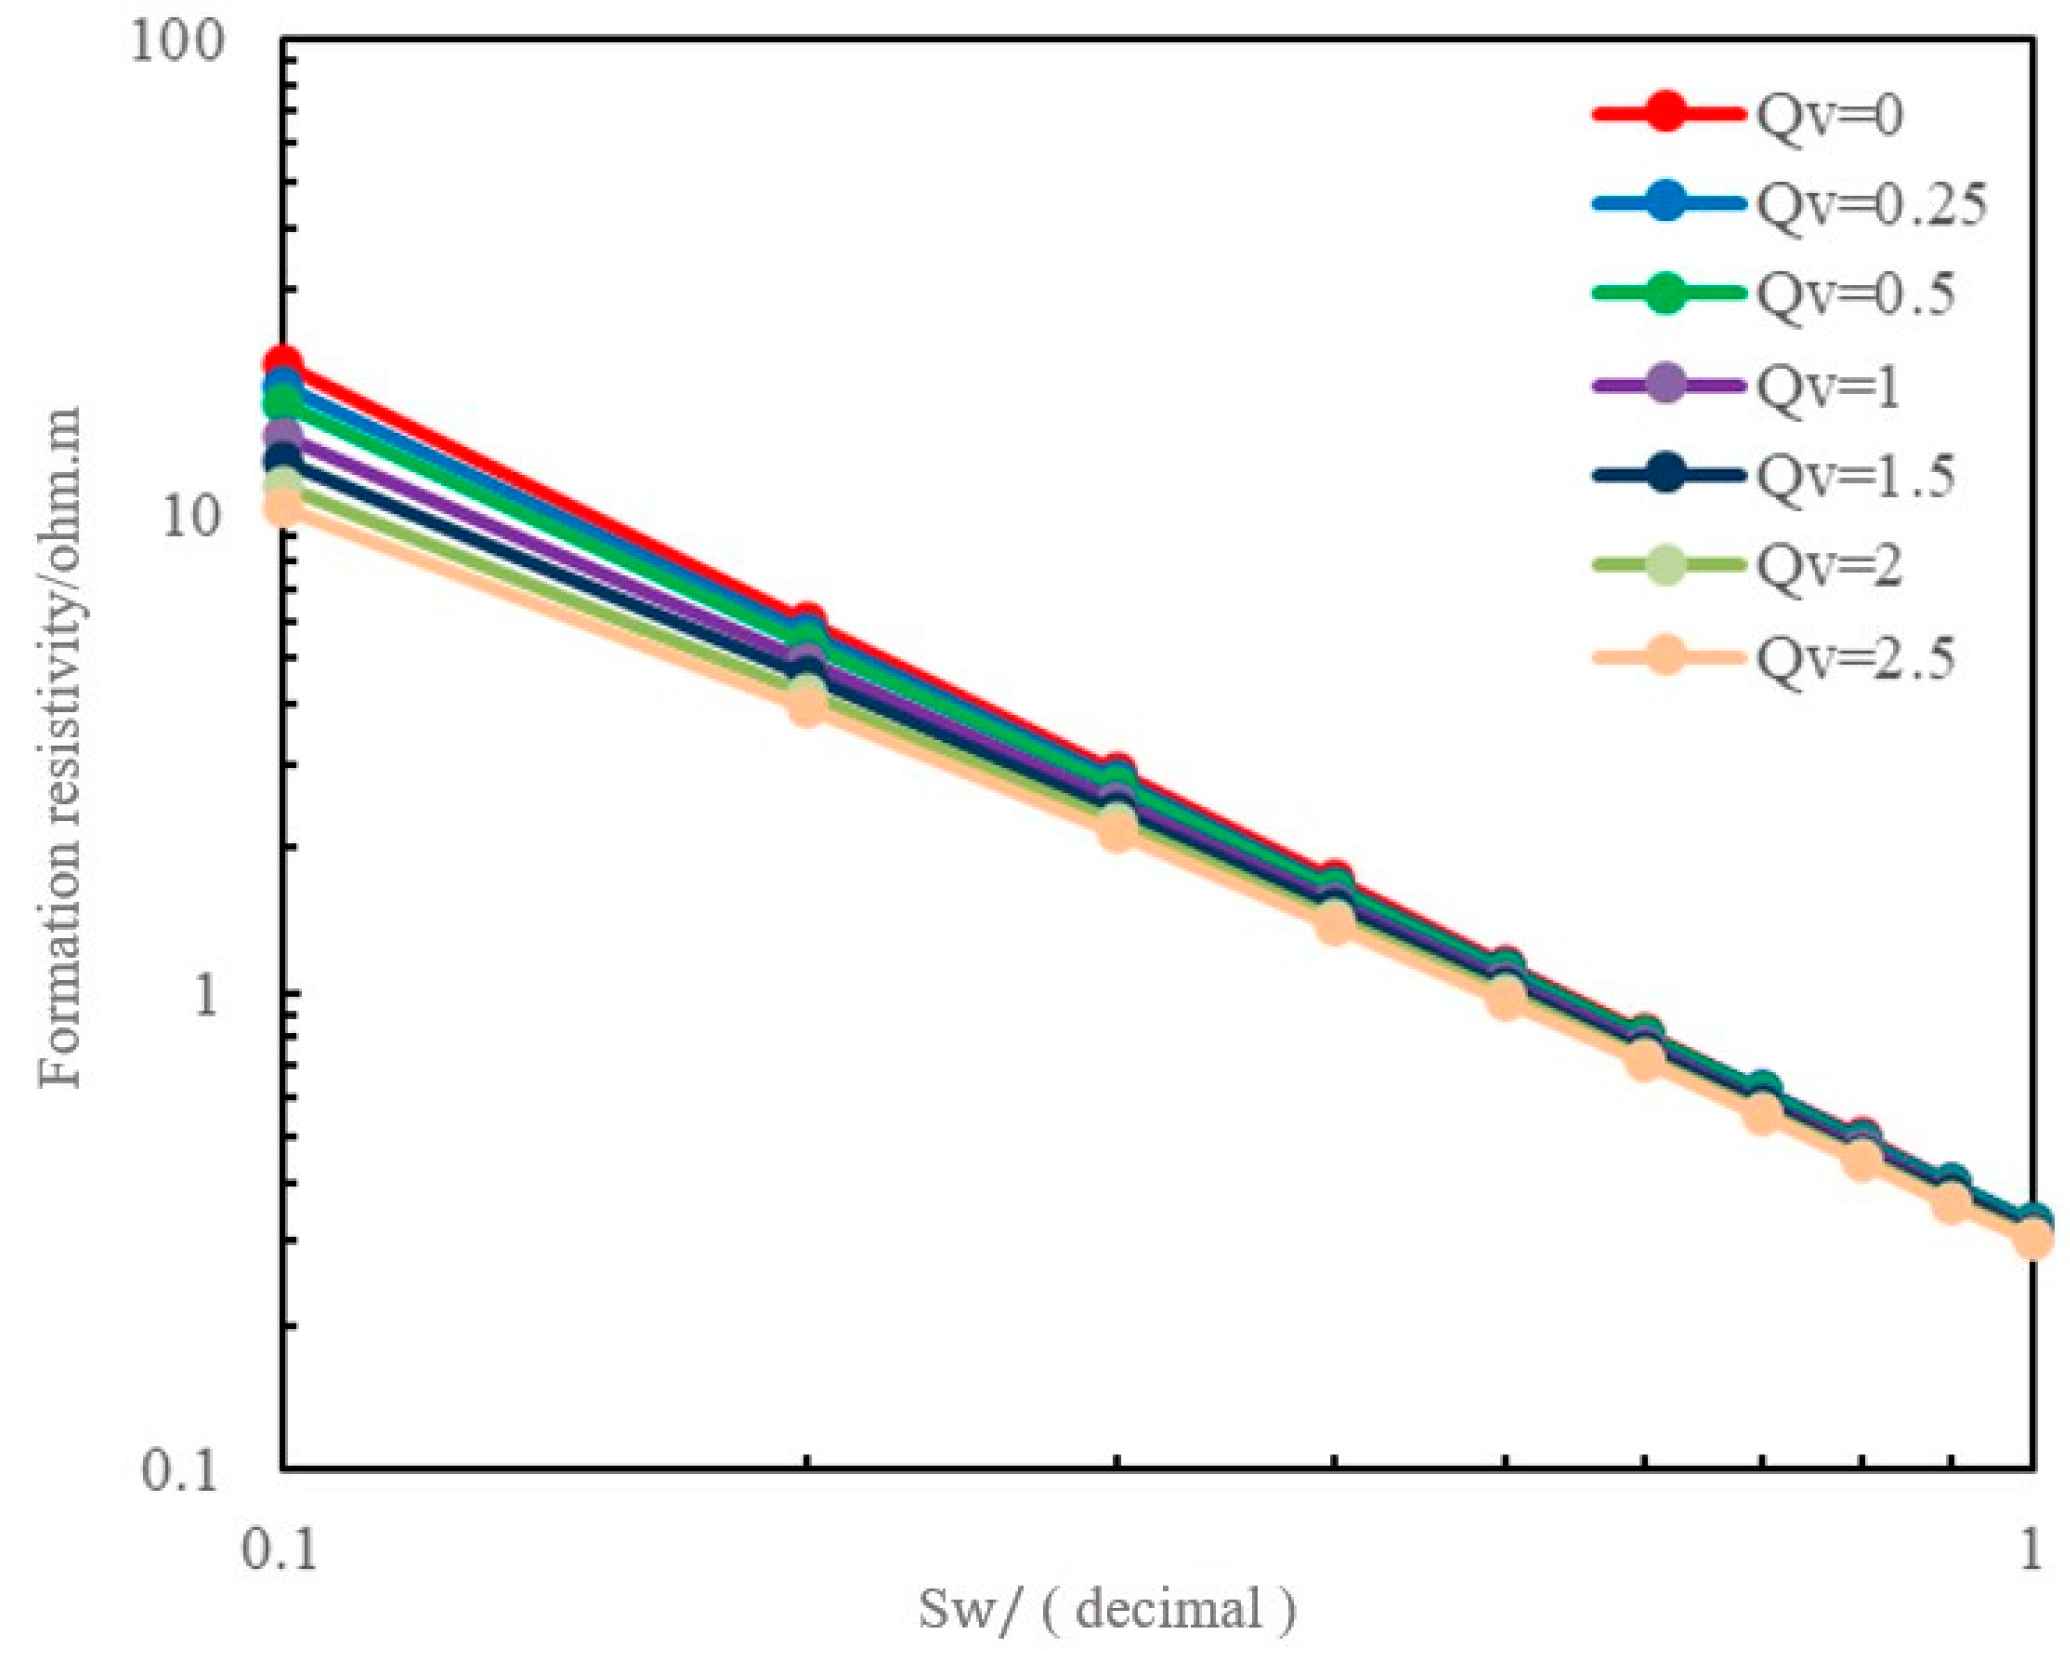
If the formation-water salinity was increased, assuming a formation-water resistivity value of 0.01 ohm.m and keeping other parameters constant, the results in Figure 11 show that, when , changes from 0 to 0.92 meq/mL at 50% water saturation, and the resistivity decreases from 1.15 ohm.m to 1.06 ohm.m, which is a minor change. This suggests that, under high-formation-water-salinity conditions, the impact of mud’s additional conductivity is less pronounced.
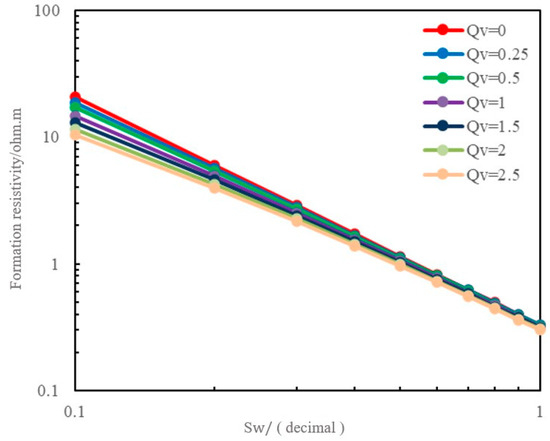
Figure 11.
Simulation results of the resistivity and water saturation for a formation with high-salinity water using the Waxman–Smits equation.
Therefore, under the conditions of a relatively low formation-water salinity, the significant additional conductivity of clay cannot be overlooked. If the reservoir exhibits lateral variations in lithology, it may lead to complex changes in the resistivity characteristics of the oil and water layers.
4.3. Irreducible Water Saturation
Irreducible water refers to the non-flowable water present in the reservoir pores under certain production pressure conditions. It is a relative concept and varies as production conditions and process improvements evolve. Typically, irreducible water consists of two components: film-stagnant water adhering to the surfaces of rock particles (including non-clay and clay particles) and capillary-stagnant water within the pores of capillaries. Once the external conditions change, the irreducible water formed by capillary stagnation may transform into mobile water, while the irreducible water resulting from film stagnation remains permanently non-flowable [22].
A reservoir’s immobile water content is controlled by many factors, such as the rock particle size, the amount of mud in the composition, and the complexity of the pore structure, and its value is often the result of several factors [23]. Generally, reservoir rocks with a fine lithology and a rich, argillaceous composition are usually developed towards microporosity, and the immobile water saturation in the reservoir increases obviously and coexists with the seepage pores, resulting in a conductive network “extending in all places”. This results in a significant decrease in the resistivity of the oil and gas reservoir. For a reservoir with a complex pore structure, the greater the proportion of capillary stagnant water, the higher the immobile water content will be [24].
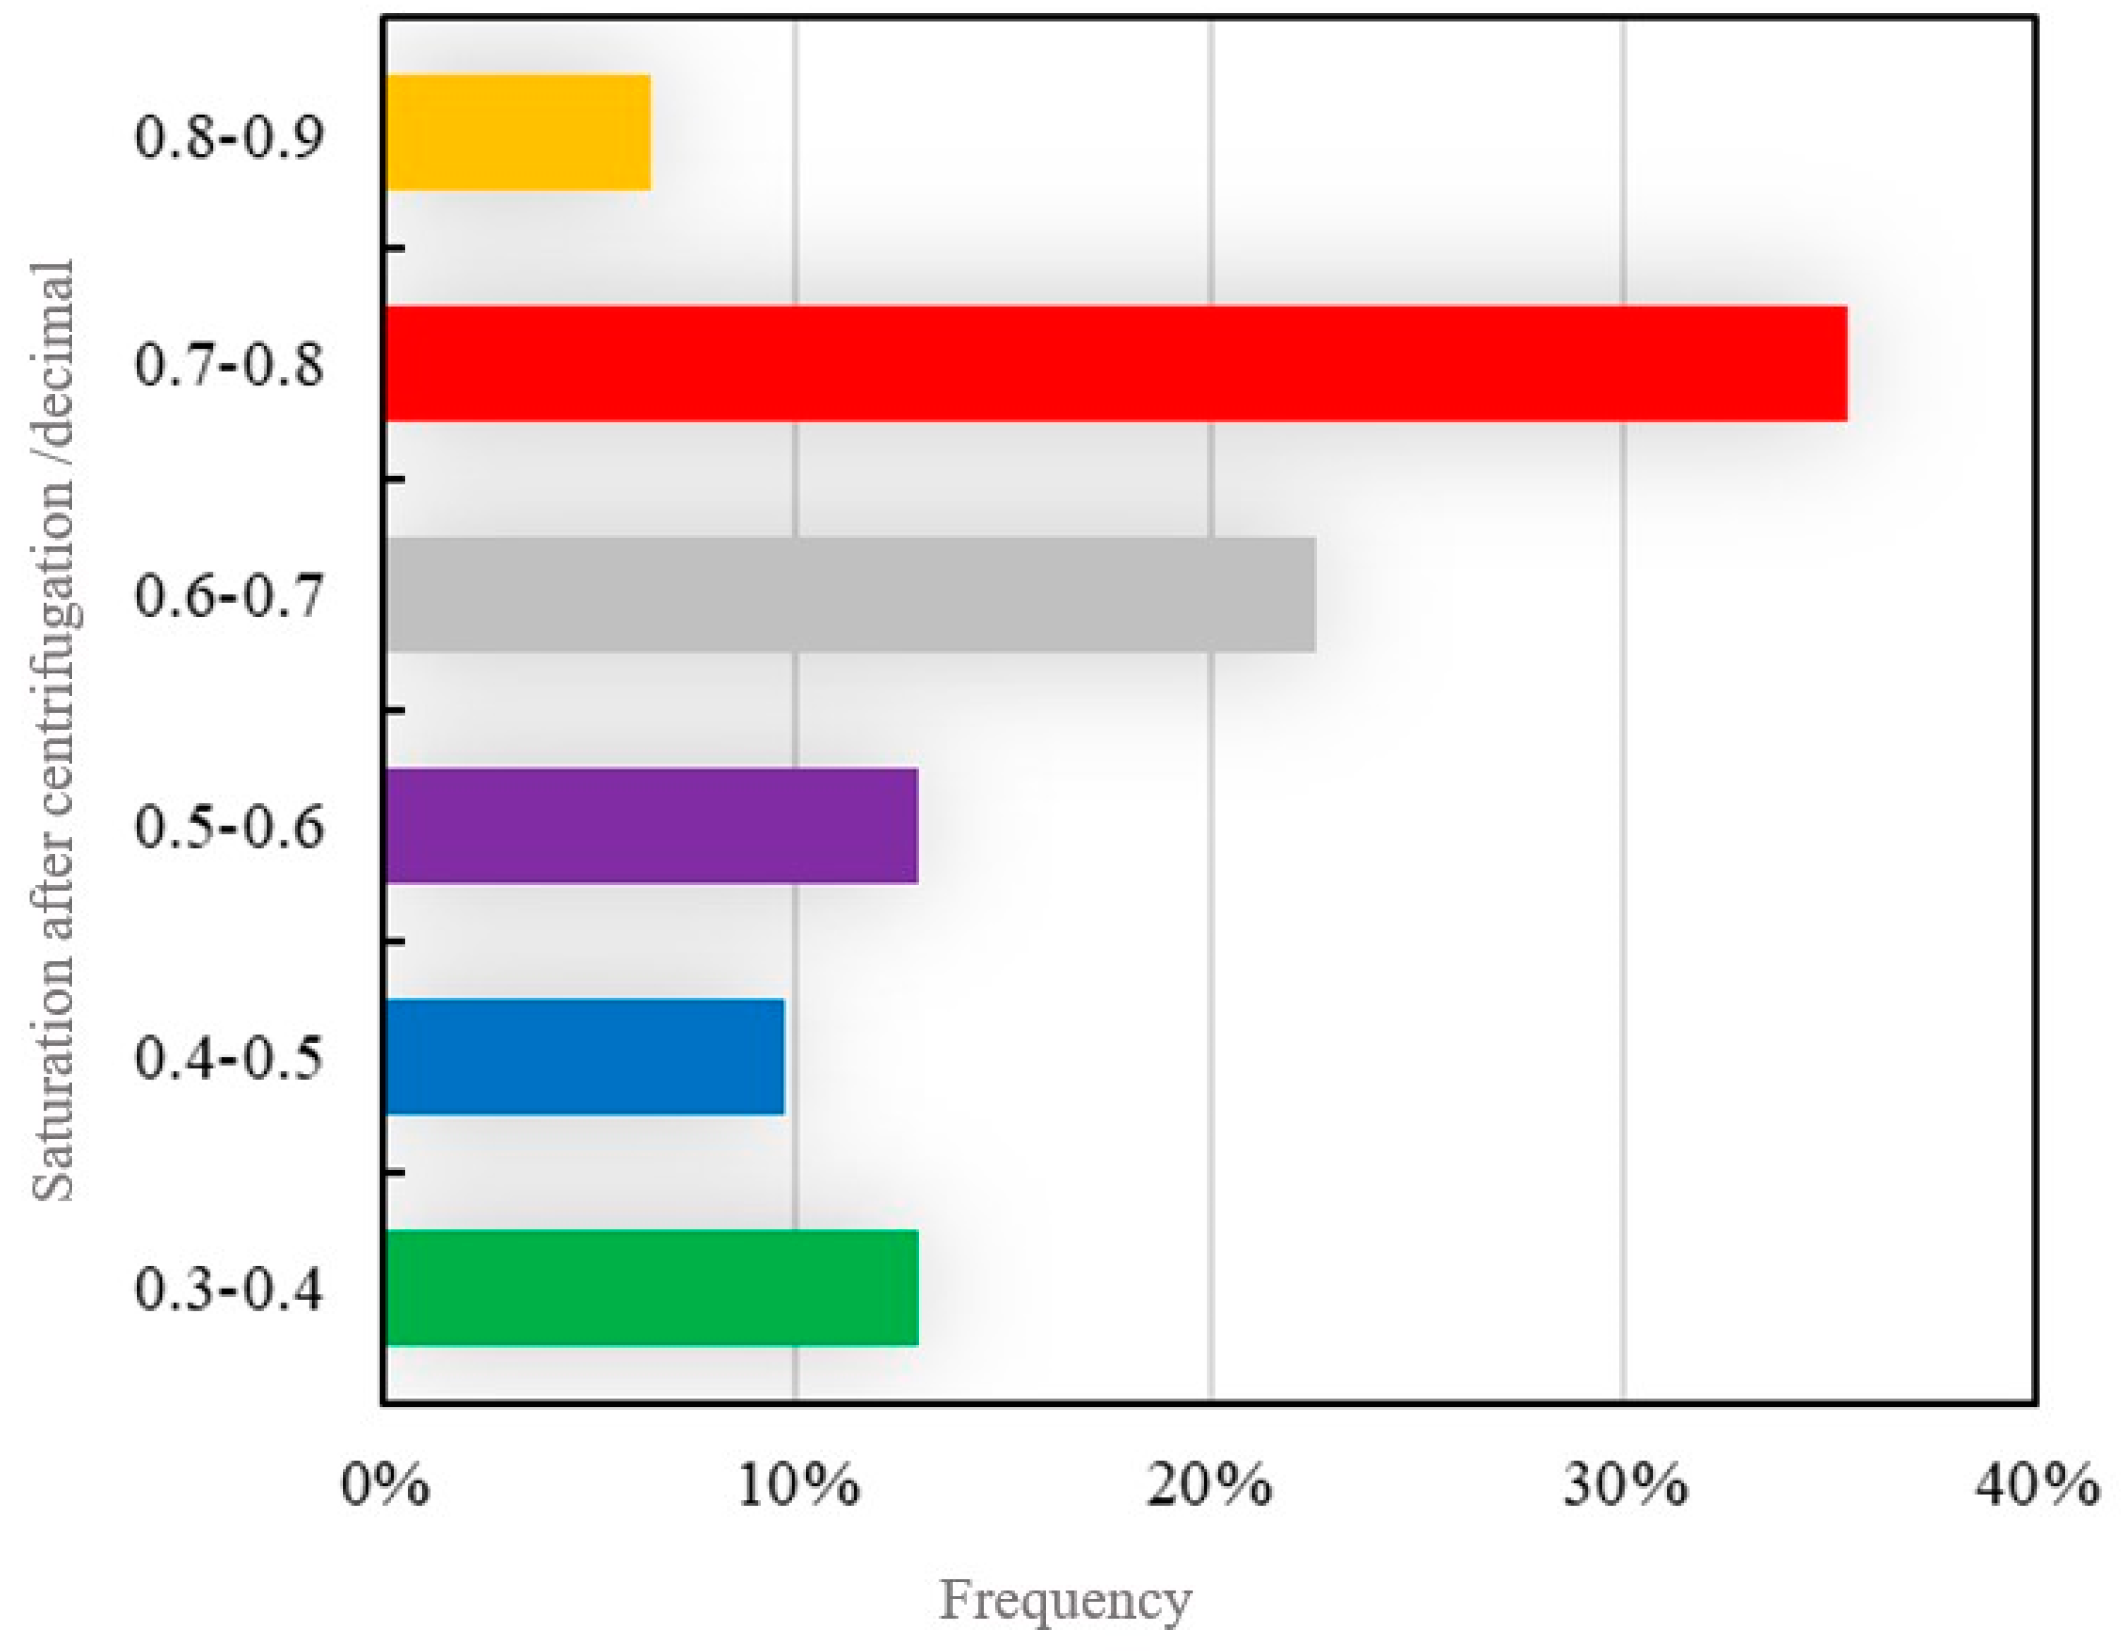
According to the NMR T2 spectrum measurements, the core water saturations after the centrifugation can be calculated, as depicted in Figure 12. It was evident that the post-centrifugation core saturations were predominantly in the range of 0.6 to 0.8, indicating a relatively high saturation of irreducible water in the cores.

Figure 12.
The core water saturations after the centrifugation.
As the saturation of irreducible water increases, the reservoir resistivity decreases. As observed in Figure 13, when the saturation of irreducible water exceeds 60%, the impact on the reservoir resistivity is relatively small. However, when the saturation of irreducible water is below 60%, the influence on reservoir resistivity becomes more significant, and an exponential decrease in the reservoir resistivity with increasing irreducible water saturation may occur. The experimental results indicated that the change in the resistivity index was substantial with the transition from a low to high irreducible water saturation, highlighting it as a crucial factor contributing to the low-contrast characteristics of the oil reservoir.
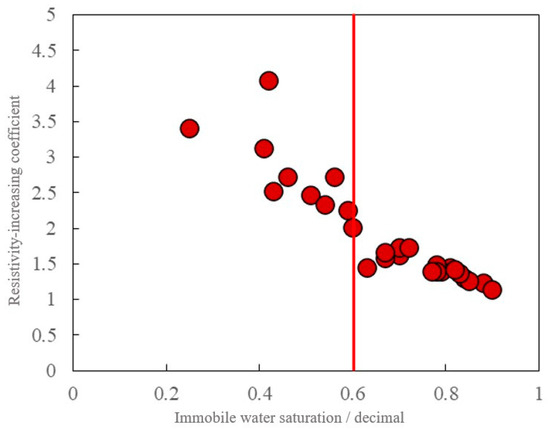
Figure 13.
The relationship between the resistivity index and the irreducible water saturation.
5. Verification
Based on the outcomes of the rock physics experiments, we employed the Waxman–Smits (W-S) model to compute the water saturation, incorporating the irreducible water saturation to assess the immobile fluids. This led to a reevaluation of the wells in the study area [25].
Due to the existence of a high immobile water saturation, the resistivity difference of the formation was small, but it had a great influence on the reservoir fluid production and its fluid evaluation, so carrying out the evaluation model of bound water saturation is of great significance for recognizing the reservoir and fluid identification.
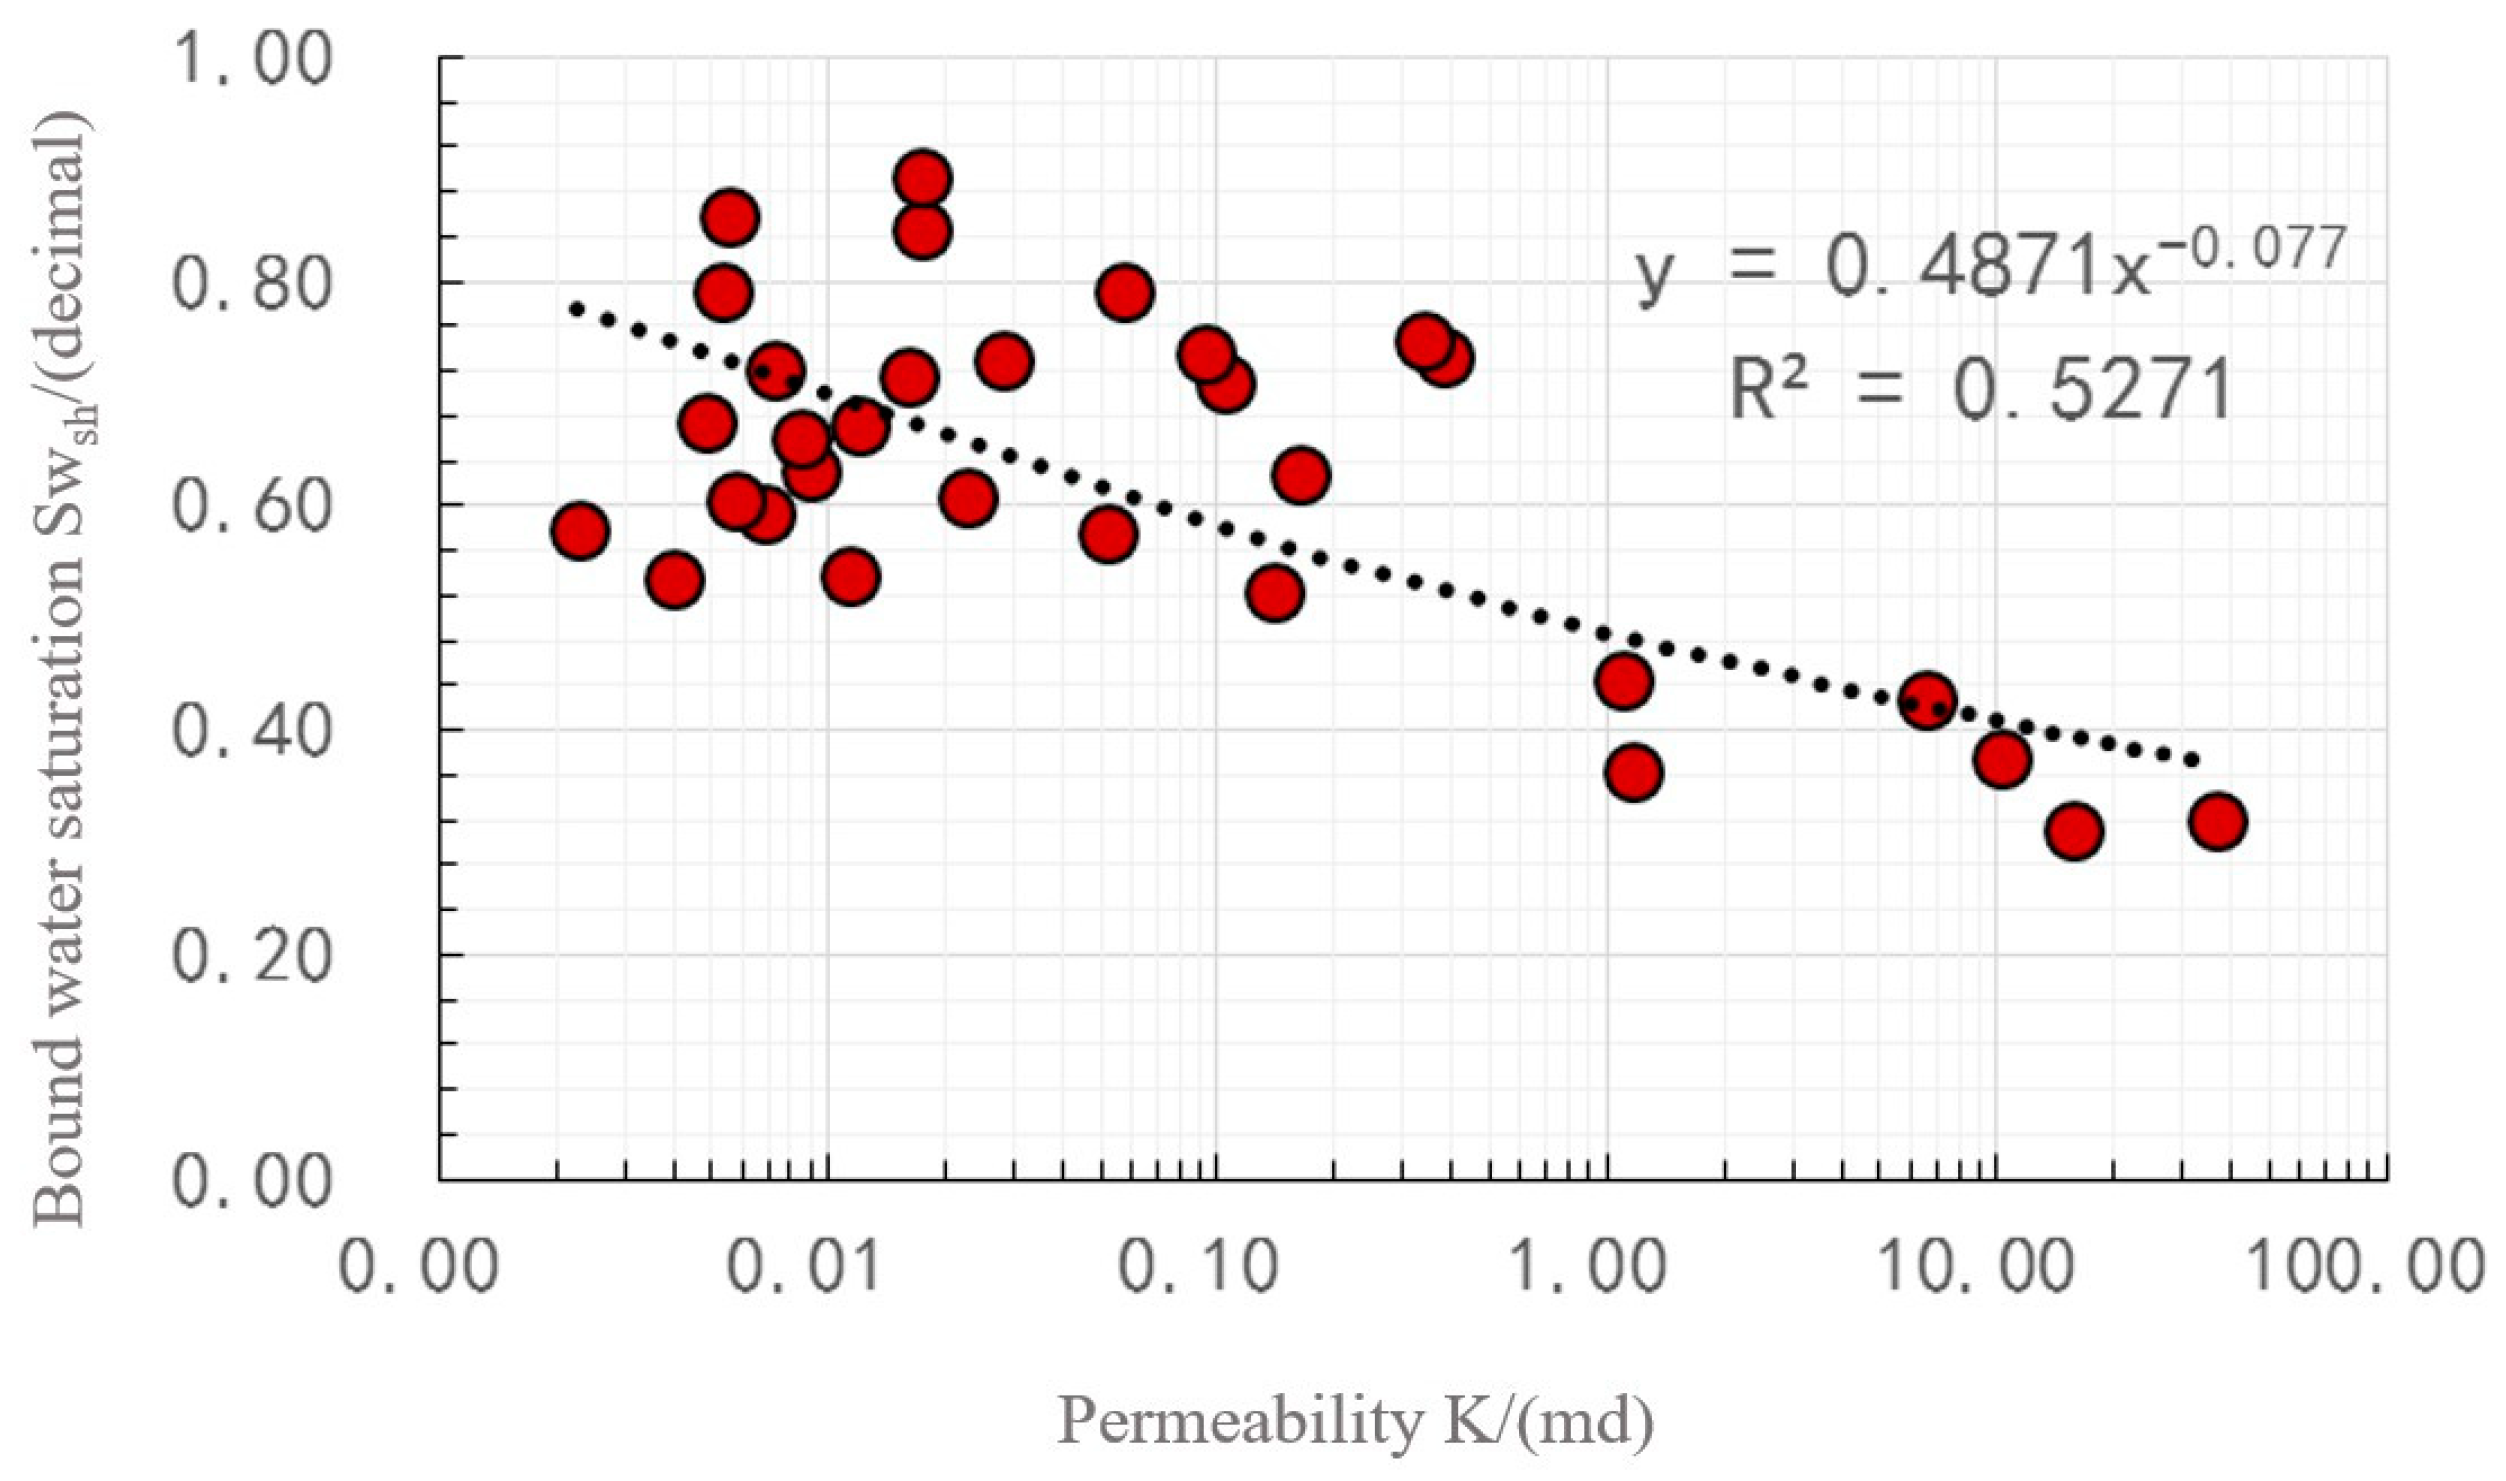
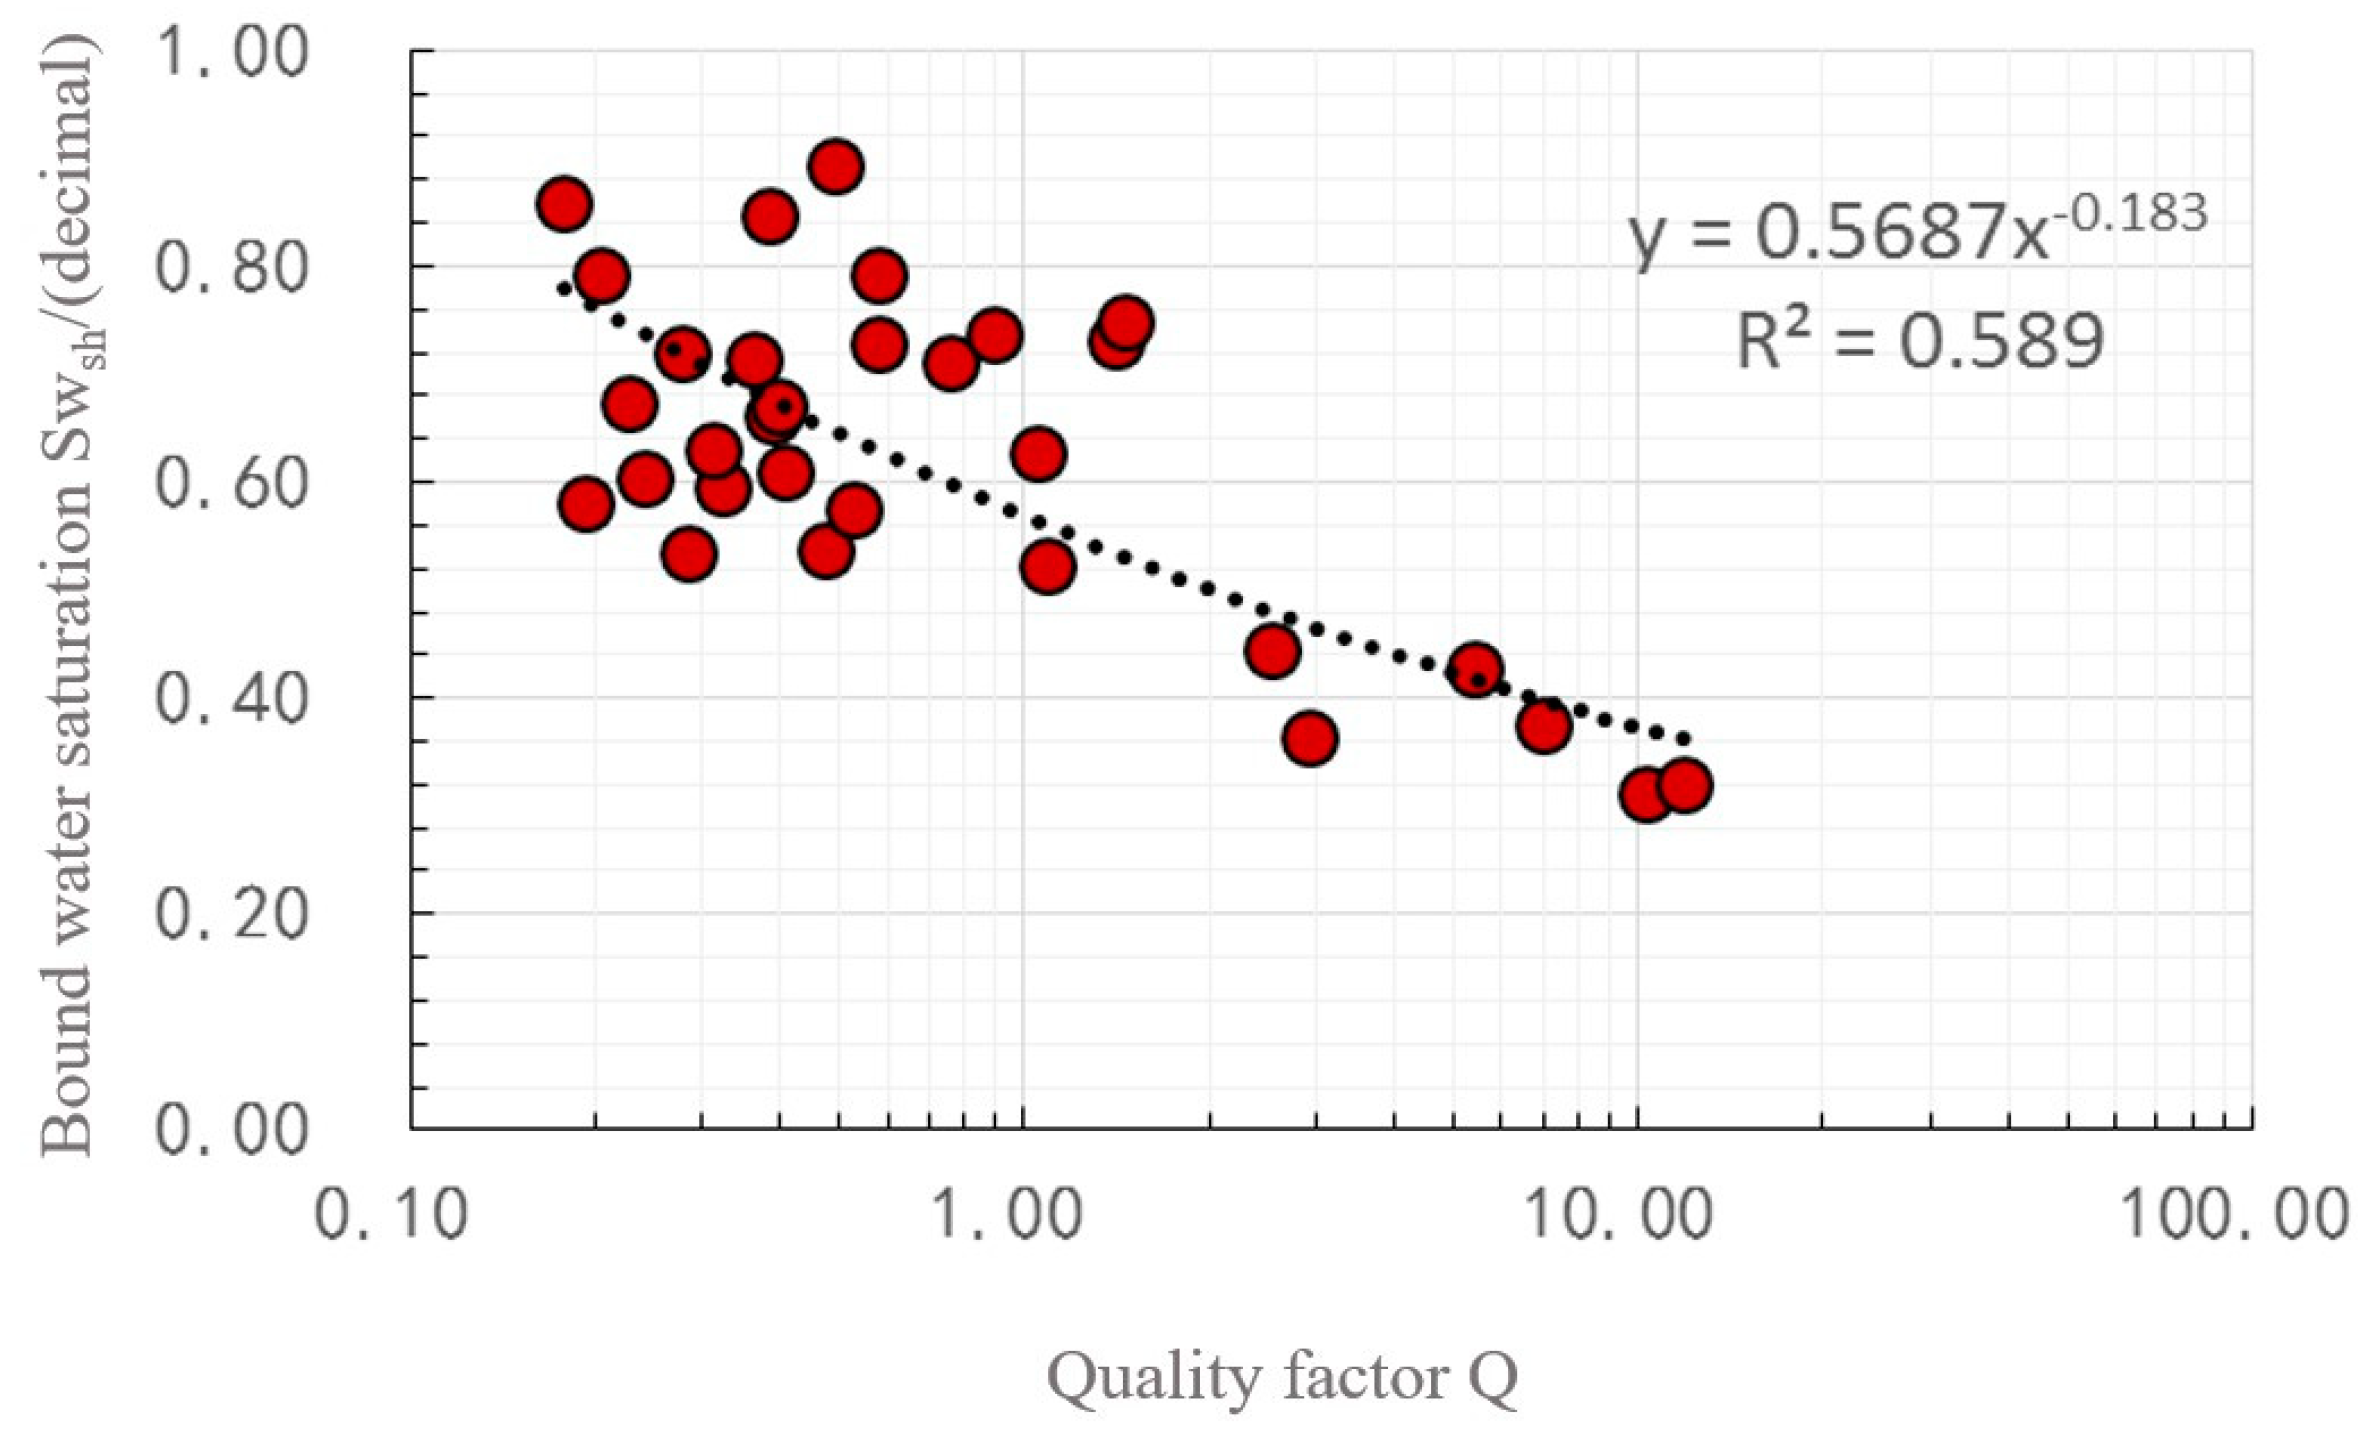
Bound water is mainly caused by fine lithology and a high mud content, which overall reflects the magnitude of permeability, so this study used a binary regression model with a single correlation analysis using the permeability (Figure 14) and quality factor (Figure 15) subsets, and a computational model.
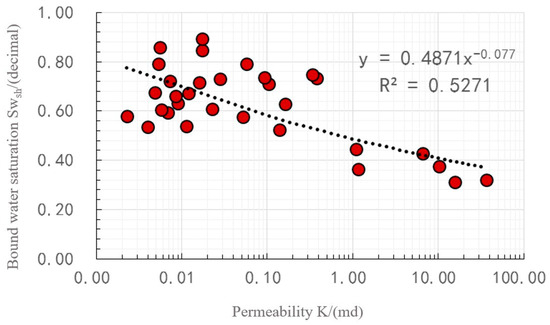
Figure 14.
Monocorrelation analysis of bound water saturation and permeability.

Figure 15.
Monocorrelation scores between bound water saturation and quality factors.
Using binary regression, the fitted bound water saturation was calculated as follows:
where is the bound water saturation; is the permeability in md; and is the quality factor, calculated as follows:
where is the porosity.
There is good agreement between the calculated and measured values of bound water saturation (Figure 16).
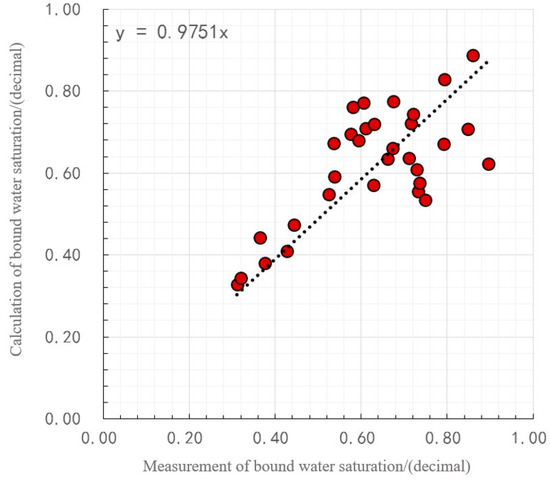
Figure 16.
Analysis of measured values of bound water saturation and relationship with calculated values.
For the fluid identification of effective reservoirs, several synthetic curves reflecting the reservoir quality and fluid saturation are first defined here (Table 2).
Table 2.
Defining parameters and calculating formulas.
Considering the influence of four factors, namely the reservoir thickness, reservoir water saturation, reservoir bound water saturation, and reservoir porosity, on the reservoir’s oil-production capacity, and using the reservoir fluid production coefficient and reservoir oil production coefficient to draw rendezvous diagrams and compare them with the test oil data (Table 3), the conformity rate of the interpreted results to the conclusions of the test oil reached 82.05%. Finally, a method of reservoir oil–water division with the output oil saturation as the standard was obtained [26].
Table 3.
Reservoir oil–water delineation criteria.
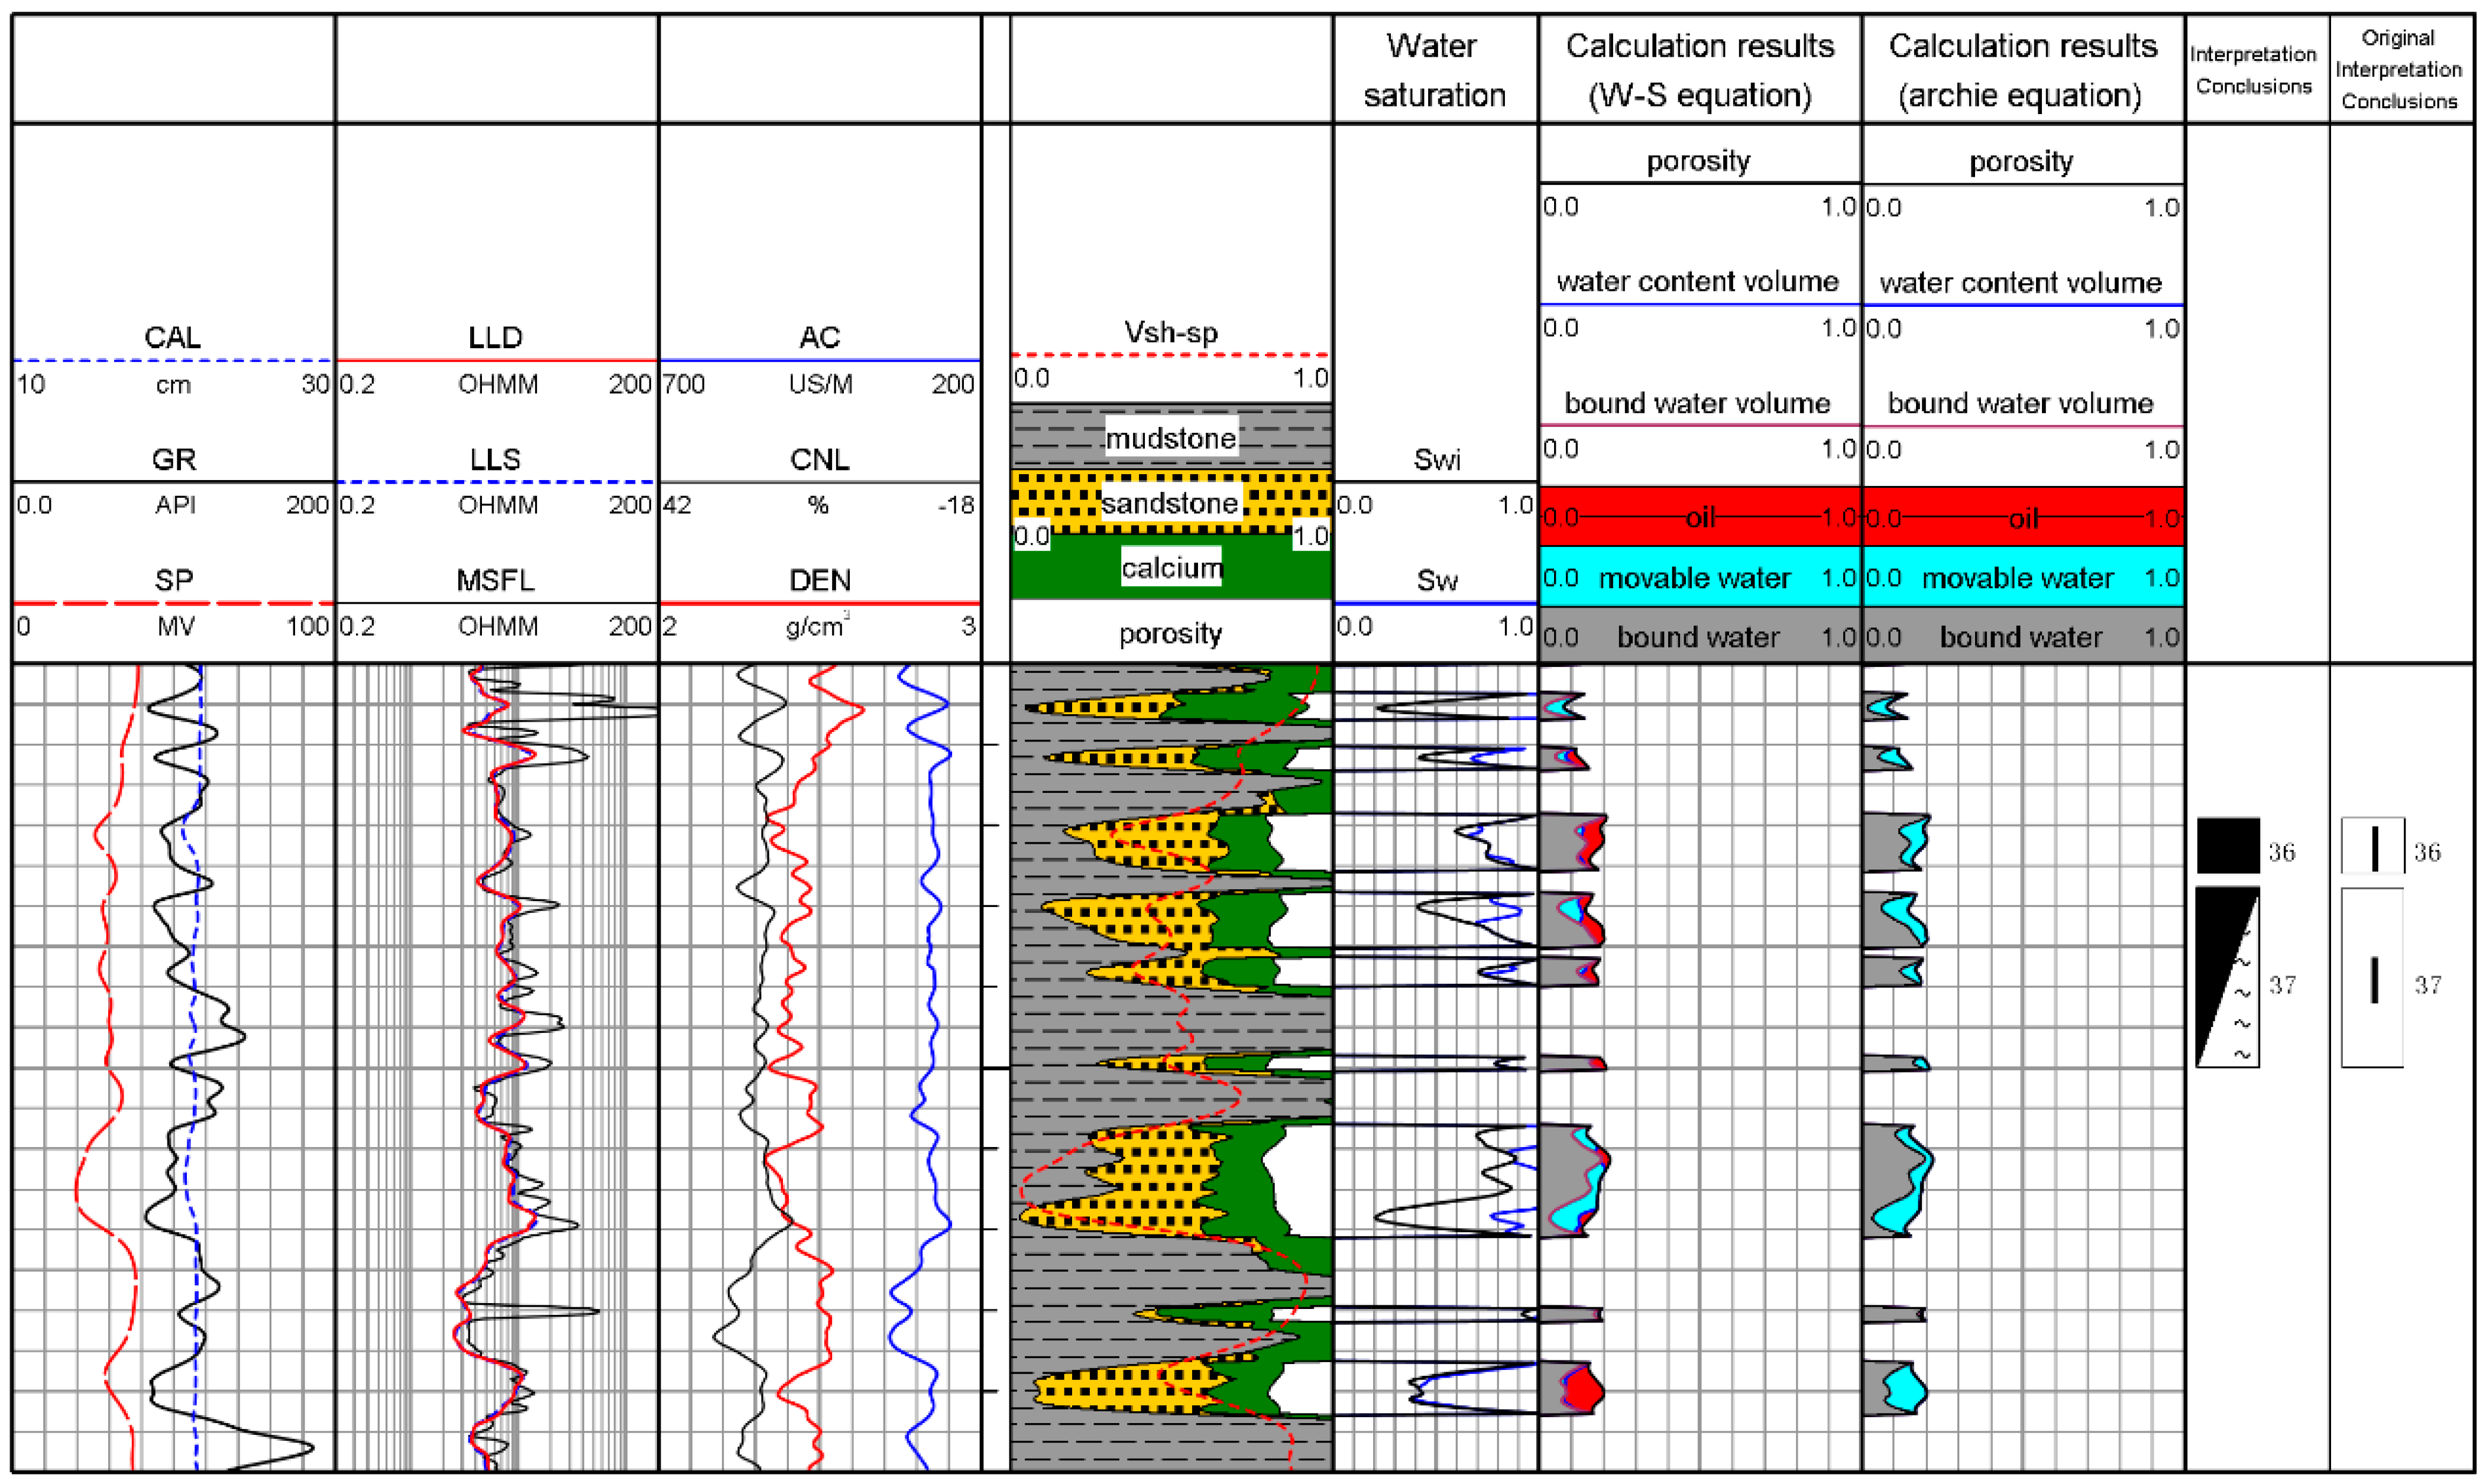
Using well XXXX03 as an illustration, Figure 17 depicts that the resistivity of reservoirs 36 and 37 was approximately 10 ohm.m. The well-testing data revealed a daily oil production of 3.638 t and a daily water production of 0.85 m3 for this well, leading to the conclusion of a low-water-producing industrial oil layer that exhibited low-resistivity characteristics. The initial interpretation categorized it as a water reservoir. The application of the W-S model in the computation produced the results presented in Table 4. In Reservoir 36, the water was predominantly irreducible water, interpreted as an oil layer. For Reservoir 37, movable water constituted 8%, and was interpreted as an oil–water coexisting layer. The interpretation findings align with the well-testing conclusion.

Figure 17.
Interpretation results of Well XXXX03.
Table 4.
Formation parameters of Well XXXX03.
6. Conclusions
The experimental results indicate that the high additional conductivity of clay and the elevated irreducible water saturation in the SaPu intercalation of the Longxi region are the two major controlling factors leading to the formation of low-resistivity oil reservoirs in the studied area. The type and quantity of clay remain the primary controlling factors for additional cationic conductivity. In rocks with a low porosity and low salinity, the additional conductivity of clay should be given special attention, as even a small amount of clay can significantly reduce the reservoir resistivity. The majority of the core’s irreducible water saturation is distributed between 0.6 and 0.8, indicating a relatively high saturation of bound water in the reservoir and creating multiple conductive pathways. Coupled with the influence of clay’s additional conductivity, this contributes to the formation of low-resistivity oil reservoirs.
Author Contributions
Investigation, Z.X.; writing—review and editing, J.F.; supervision, G.W. All authors have read and agreed to the published version of the manuscript.
Funding
This research received no external funding.
Institutional Review Board Statement
Not applicable.
Informed Consent Statement
Not applicable.
Data Availability Statement
The original contributions presented in the study are included in the article, further inquiries can be directed to the corresponding author.
Conflicts of Interest
The authors declare no conflict of interest.
References
- Zhao, Z.Z.; Ouyang, J.; Liu, D.L. Logging Technology and Interpretation Methods of Low Resistance Oil and Gas Formations in Bohai Bay Area; Petroleum Industry Press: Beijing, China, 2000; pp. 1–58. [Google Scholar]
- Mao, Z.Q.; Gong, F.H.; Liu, C.Y.; Zhu, D.Z.; Zuo, Z.G. Experimental study on low resistance genesis of oil and gas formations in the Tarim Basin (I). Logging Technol. 1999, 4, 3–8. [Google Scholar] [CrossRef]
- Kuang, L.C.; Mao, Z.Q.; Sun, Z.C.; Zhang, Y.P. Comprehensive evaluation of oil and gas reservoir logging based on new technology. Pet. Explor. Dev. 2003, 2, 58–60. [Google Scholar]
- PetroChina Exploration and Production Branch (Ed.) Proceedings of the China National Petroleum Corporation Exploration Engineering Technology Exchange Conference; Petroleum Industry Press: Beijing, China, 2000. [Google Scholar]
- Kuang, L.C. Logging Identification and Evaluation of Complex Oil and Gas Reservoirs in Junggar Basin. Ph.D. Thesis, China University of Petroleum, Beijing, China, 2002. [Google Scholar]
- Yao, G.Q.; Ma, Z.; Zhao, Y.C. Reservoir characteristics of sand bodies in shallow deltaic diversion channels. J. Pet. 1995, 16, 24–31. [Google Scholar]
- Yan, W.L.; Liu, C.P.; Li, Z.C.; Zhong, S.M. Identification method of complex oil and water layers in the Grape Flower oil formation in Longhu Bubble oilfield. Daqing Pet. Geol. Dev. 2018, 37, 133–139. [Google Scholar] [CrossRef]
- Ouyang, J. Petroleum Logging Interpretation and Reservoir Description; Petroleum Industry Press: Beijing, China, 1994; ISBN 7-5021-1038-0. [Google Scholar]
- Zhao, J.; Wang, M.; Yan, S.; Li, H.W. Application of natural potential logging in the identification of low-resistance oil and gas formations—An example of Triassic low-resistance oil and gas formations in Jilak area, Tarim Basin. Oil Gas Geol. 2011, 32, 245–250. [Google Scholar]
- Xiao, L.Z. Nuclear Magnetic Resonance Imaging Logging and Rock Nuclear Magnetic Resonance and Its Application; Science Press: Beijing, China, 1998; ISBN 7-03-006924-2. [Google Scholar]
- Hill, H.J.; Milburn, J.D. Effect of clay and water salinity on electrochemical behavior of reservoir rocks. Trans. AIME 1956, 207, 65–72. [Google Scholar] [CrossRef]
- Mao, Z.Q.; Zhu, W.H. Experimental study on low resistance genesis of oil and gas formations in the Tarim Basin (II). Logging Technol. 1999; 6, 404–410+479. [Google Scholar] [CrossRef]
- Waxman, M.H.; Smits, L.J.M. Electrical conductivities in oil-bearing shaly sands. Soc. Pet. Eng. J. 1968, 8, 107–122. [Google Scholar] [CrossRef]
- Hu, Y.J.; Xiao, C.W. Evaluation of cation exchange and oil saturation in low-resistance oil reservoirs in the Tarim Basin(III). Logging Technol. 2000; 6, 407–409+419. [Google Scholar] [CrossRef]
- Waxman, M.H.; Thomas, E.C. Electrical Conductivities in Shaly Sands-I. The Relation Between Hydrocarbon Saturation and Resistivity Index; II. The Temperature Coefficient of Electrical Conductivity. J. Pet. Technol. 1974, 26, 213–225. [Google Scholar] [CrossRef]
- Clavier, C.; Coates, G.; Dumanoir, J. Theoretical and experimental bases for the dual-water model for interpretation of shaly sands. Soc. Pet. Eng. J. 1984, 24, 153–168. [Google Scholar] [CrossRef]
- Kuang, L.C.; Mao, Z.Q. Study on the controlling factors of bound water saturation in low resistivity oil formation of Cretaceous in Lu9 well area of Junggar Basin. Logging Technol. 2002, 1, 14–17+89. [Google Scholar] [CrossRef]
- Schlumberger Limited. Schlumberger Log Interpretation Charts; Schlumberger: Houston, TX, USA, 1985. [Google Scholar]
- Zhai, Y.F. Seepage Mechanics, 3rd ed.; Petroleum Industry Press: Beijing, China, 2009; ISBN 9787502171780. [Google Scholar]
- Hill, H.J.; Klein, G.E.; Shirley, O.J.; Thomas, E.C.; Waxman, W.H. Bound water in shaly sands-it’s relation to Qv and other formation properties. Log Anal. 1979, 20, 3–19. [Google Scholar]
- Ouyang, J.; Mao, Z.; Xiu, L.J. Mechanism of Formation Genesis and Evaluation Method for Logging Low-Contrast Oil Formations; Petroleum Industry Press: Beijing, China, 2009; ISBN 9787502163884. [Google Scholar]
- Zhang, Y.Y. Clay Minerals and Clay Mineral Analysis; Ocean Press: Beijing, China, 1990; ISBN 7-5027-1192-9. [Google Scholar]
- PetroChina Exploration and Production Branch. Low-Resistance Reservoir Logging Evaluation Technology and Application; Petroleum Industry Press: Beijing, China, 2009; ISBN 9787502174033. [Google Scholar]
- Yong, S.H.; Zhang, C.M. Logging Data Processing and Comprehensive Interpretation; Petroleum University Press: Beijing, China, 1996; ISBN 7-5636-0886-9. [Google Scholar]
- Kuang, L.C. Application of cable stratigraphic testing technology in oil and gas exploration in Junggar Basin. Logging Technol. 2002, 3, 229–232+264. [Google Scholar] [CrossRef]
- Gao, L.; Xie, R.; Xiao, L.; Wang, S.; Xu, C.Y. Identification of low-resistivity-low-contrast pay zones in the feature space with a multi-layer perceptron based on conventional well log data. Pet. Sci. 2022, 19, 570–580. [Google Scholar] [CrossRef]


Disclaimer/Publisher’s Note: The statements, opinions and data contained in all publications are solely those of the individual author(s) and contributor(s) and not of MDPI and/or the editor(s). MDPI and/or the editor(s) disclaim responsibility for any injury to people or property resulting from any ideas, methods, instructions or products referred to in the content. |
© 2024 by the authors. Licensee MDPI, Basel, Switzerland. This article is an open access article distributed under the terms and conditions of the Creative Commons Attribution (CC BY) license (https://creativecommons.org/licenses/by/4.0/).