Article

Research on the Laws of Overlying Rock Fracture and Energy Release under Different Mining Speeds

1
School of Mines, China University of Mining and Technology, Xuzhou 221116, China
2
The State Key Laboratory of Coal Resources and Safe Mining, China University of Mining and Technology, Xuzhou 221116, China
3
School of Geology and Mining Engineering, Xinjiang University, Urumqi 830046, China
4
Planning and Development Department, Huating Coal Industry Group Co., Ltd., Pingliang 744000, China
*
Author to whom correspondence should be addressed.
Appl. Sci. 2024, 14(8), 3222; https://doi.org/10.3390/app14083222
Submission received: 10 February 2024 / Revised: 28 March 2024 / Accepted: 9 April 2024 / Published: 11 April 2024
(This article belongs to the Topic Complex Rock Mechanics Problems and Solutions)

Abstract

:
Mining activities are key triggers for strong mine earthquakes and even rock bursts in coal mines. This study explores the impact of mining speed on the overlying strata’s deformation and energy release through theoretical analysis, numerical simulation, and the digital speckle method. The temporal and spatial evolution characteristics of the impact energy during mining are simulated. The digital speckle method illustrates a positive correlation between rapid mining and increased fracture block degree of overburden rock and roof separation, confirming that accelerated mining speed extends the fracture distance of the stope. Furthermore, numerical simulations establish that both the energy associated with overlying rock breaking and the frequency of energy occurrence events are amplified during rapid mining, in contrast to slow mining. This observation corroborates that escalating mining speed augments the energy dispensed by the breaking of the upper rock. Consequently, this escalation induces a transformation in the energy levels of mine earthquakes, culminating in a heightened incidence of large-energy mine earthquakes.

1. Introduction

As deep resource extraction progressively expands, mines are being developed at increasingly greater depths, resulting in heightened stress effects that contribute to a rising accident rate of impact damage between working faces and tunnels [1,2,3]. In response to the growing frequency of these disasters and accidents, numerous scholars have suggested a variety of preventive strategies, such as zonal impact prevention support design [4], risk quantification assessments for mining schemes [5], the development of mine rock burst systems [6], and the creation of specific energy-absorbing and anti-erosion structures for tunnels [7,8]. However, challenges such as the high cost of support materials, the low accuracy of monitoring and early warning systems, and the intense workload for workers still persist [9]. Rock bursts are primarily induced by underground mining activities [10]. The strategic planning and regulation of mining intensity, along with minimizing the energy release from surrounding rocks during mining, are crucial for preventing rock burst disasters [11]. The control of mining intensity fundamentally involves managing the release of elastic energy from overlying strata per unit of time [12]. A significant relationship exists between the advancing speed of the working face and the energy release within the stope [13]. The unpredictability of the underground rock mass environment has led to a limited number of theoretical studies on the energy release of surrounding rock during coal mining [14,15,16,17,18]. At present, the connection between the advancing speed of the working face and energy release is predominantly investigated through microseismic energy monitoring [19]. Zhang Xinrong et al. [20] established a notable positive correlation between the mining speed of the working face and microseismic events, indicating that an optimal mining speed could reduce impact risks. In contrast, other researchers [21,22,23,24] contended that an increase in the advancing speed might convert low-energy microseismic events into high-energy ones, thereby increasing the risk of impacts. Lu Pengfei et al. [25] and Cui Feng et al. [26] pinpointed a sudden change in mining speed as a key trigger for mine earthquakes, recommending steady, slow mining as an effective strategy to significantly lower the incidence of impacts. Yang Shengli et al. [27] suggested maintaining a consistent optimal mining speed across different working faces to mitigate risks. Yan Xianlei et al. [28], through the use of the Seismological Observation System (SOS), identified an almost linear positive relationship between the frequency of low-energy mine earthquakes, their energy, and mining speed, alongside a nonlinear correlation with high-energy mine earthquakes. Given the complex nature of underground environments, relying solely on theoretical analysis to fully understand the dynamics of energy release in mining fields presents significant challenges. As a result, numerous researchers have adopted numerical simulation techniques to investigate the relationship between the advancing speed and the energy released from overlying rock [29,30,31,32,33]. While extensive research has been carried out on the evolution of stress within mining fields, studies specifically addressing the energy released from mining activities are comparatively scarce. Zhang Hongwei et al. [23] utilized numerical simulations to identify a critical advancing speed for the island working face that pertains to the release of elastic energy, a finding supported by microseismic field data. Jiang Yaodong et al. [34] found that an increased extraction rate accelerates the process of energy release and accumulation in rock strata. Wang Xuebin et al. [35] explored the energy distribution affected by geological faults, observing several large energy events occurring prior to rock failure. Cai Wu [36] applied numerical simulation to statistically analyze the energy released from rock fractures under loading conditions. Overall, current research mainly monitors energy released under different mining speeds through numerical simulations combined with microseismic monitoring data. This research focuses on the correspondence between mining speed and energy release without conducting in-depth research on the correspondence between the number and location of microseismic energy events and the law of overburden fracture. This will lead to inconsistent research conclusions when studying different coal and rock mining conditions. Li Yang et al. [37] proposed that as the advancing speed of the working face increases, the distribution range of microseismic events generated every day significantly decreases. Increasing the advancing speed to an appropriate degree can improve the conditions of the working face.
In summary, to examine the effects of varying mining speeds on the failure modes and fracture energy release of overlying rock blocks at the working face, the author conducted a comprehensive study. By means of theoretical analysis, similarity simulation experiment and numerical analysis, the movement of overlying rock and the size of fracture block under different mining speeds are analyzed, and the strain energy change of overlying rock under different mining speeds is calculated. Based on the laws of overlying rock movement, further research on the energy release in the mining area can more accurately elucidate the relationship between the mining speed of the working face and energy release in the mining area.

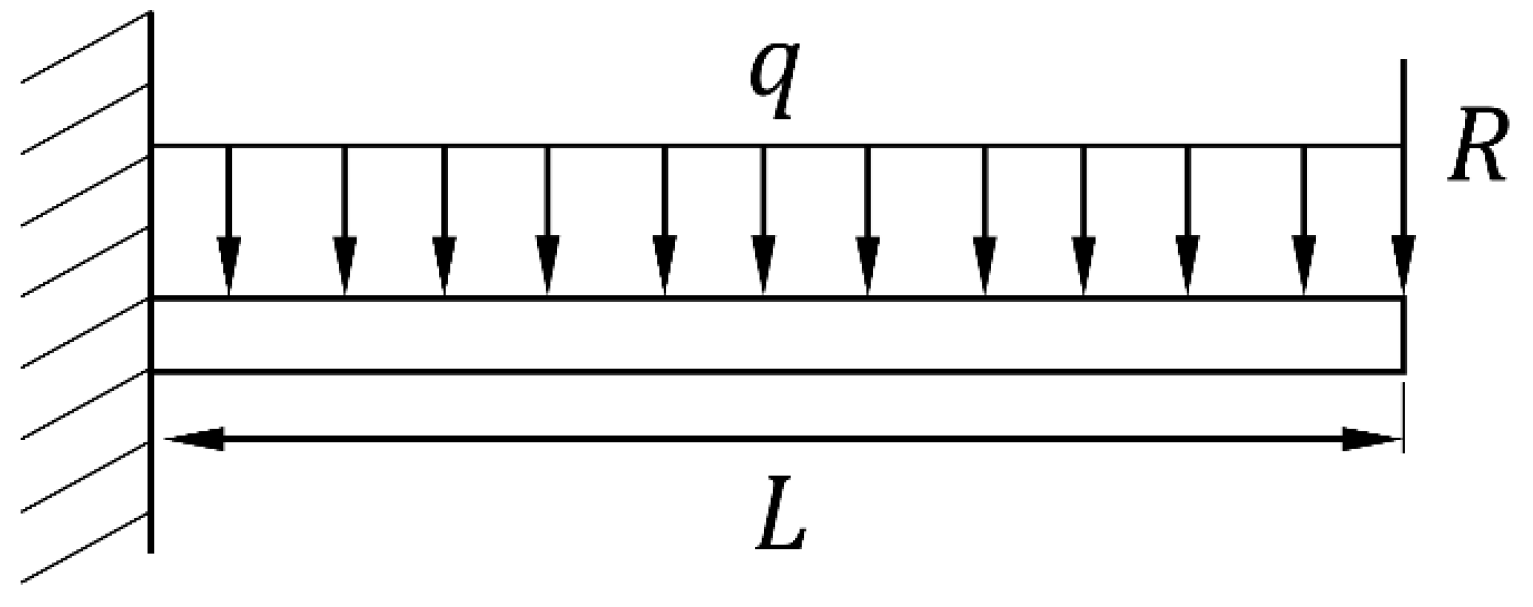
2. Influence of Working Face Advancing Speed on Energy Release of Overlying Strata

Observations and analyses of mine pressure indicate that a working face advancing at high speed tends to facilitate the breaking of the overlying rock structure in the higher rock strata, leading to the formation of a masonry beam structure [38]. The destruction of this stable masonry beam structure releases significant energy that is transmitted to the working face of the mining area. Consequently, investigating the breaking mechanism of mining speed on the rock mass masonry beam structure above the mining face is crucial for preventing rock burst disasters.
As the working face advances, the rotary subsidence of the masonry beam structure diminishes with the increased height of the overlying rock. Figure 1a illustrates the breaking form of the masonry beam in the key layer of the overlying rock at the working face. The rock block situated above the gangue that does not come into contact with the lower part is referred to as an untouched gangue fracture, depicted in Figure 1b. In contrast, a touching gangue fracture occurs when the rock block breaks upon touching the lower gangue, as shown in Figure 1c. Due to the proximity of the unfractured gangue in the low voussoir beam to the coal seam, studying the energy release law during a fracture is essential, given the significant impact of the disaster that can result from this.
To streamline the application of mechanical theory in calculations, rock block A is conceptualized as a simplified beam structure from which a mechanical model is derived, as shown below in Figure 2.
In accordance with the stability theory of broken overburden rock [39], the load R exerted by broken rock block B on unbroken rock block A is represented as follows:
R = 4 h 0 3 sin θ 2 2 h 0 sin θ q L
In Equation (1), h 0 = h L represents the ratio of the thickness to the length of the rock block, θ denotes the rotation angle of rock block B, c signifies the uniform distribution load, h represents the thickness of rock mass, and L denotes the length of the rock block.
Under the combined influence of the concentrated load R and uniform load q , the maximum deflection value of the structural beam is observed at the end structure position. The expression for deflection ω is given as follows:
ω = 22 h 0 15 sin θ 24 2 h 0 sin θ q L 4 E I
where I represents the moment of inertia of the rock section, and E denotes the elastic modulus of the rock mass.
The maximum stress value σ of the single-sided fixed beam structure is located at the fixed end, and its expression is provided as follows:
σ = 3 h 2 L sin θ 2 h L sin θ 6 q L 2 h 2 R t
where R t represents the tensile strength of the rock beam structure. The relationship between the rotation angle θ and the breaking interval of the low voussoir beam structure is expressed as follows:
sin θ = 2 R t h 3 18 h q L 2 R t h 2 L 12 q L 3
The relationship between the rotation angle and the released energy during fracture is as follows:
U = q 2 L 5 20 E I + 4 h 0 3 sin θ 2 h 0 sin θ q 2 L 5 8 E I + 4 h 0 3 sin θ 2 h 0 sin θ 2 q 2 L 5 12 E I
Formulas (4) and (5) clearly show that both the breaking distance and the energy released during the fracturing of the masonry beam structure depend on the rotation angle. With an increase in the rotation angle, there is a corresponding rise in both the breaking distance and the energy released. During fast mining operations at the working face, the insufficient collapse of the rock strata above the goaf results in a low degree of fill and a significant amount of free space. This condition, in turn, increases the vertical distance through which the broken rock mass falls, leading to an increase in both the breaking distance and the energy released during fracturing. This mechanism perpetuates, affecting the rock mass that follows, thereby extending the impact of rapid mining on the structural stability of the overlying strata.
In summary, an increase in the mining speed of the working face amplifies the breaking interval of the rock layer above the coal seam and the energy released during the breakage. This escalation, in turn, heightens the likelihood of impact disasters.

3. The Digital Speckle Model of the Influence of Mining Speed on the Rotation Deformation of Overlying Strata

The digital speckle correlation method is a full-field, non-contact, highly automated, and high-precision optical deformation measurement technique. It tracks the deformation process of the scatter pattern on an object’s surface and calculates the change in grey value within the scatter domain to determine the displacement and strain on the surface of the test object. By applying digital speckle to physical similarity simulation experiments, it is possible to analyze the changing trends of different rock formations and observe the overall deformation of rock formations. This application offers a novel observation methodology for conducting physical similarity simulation experiments.

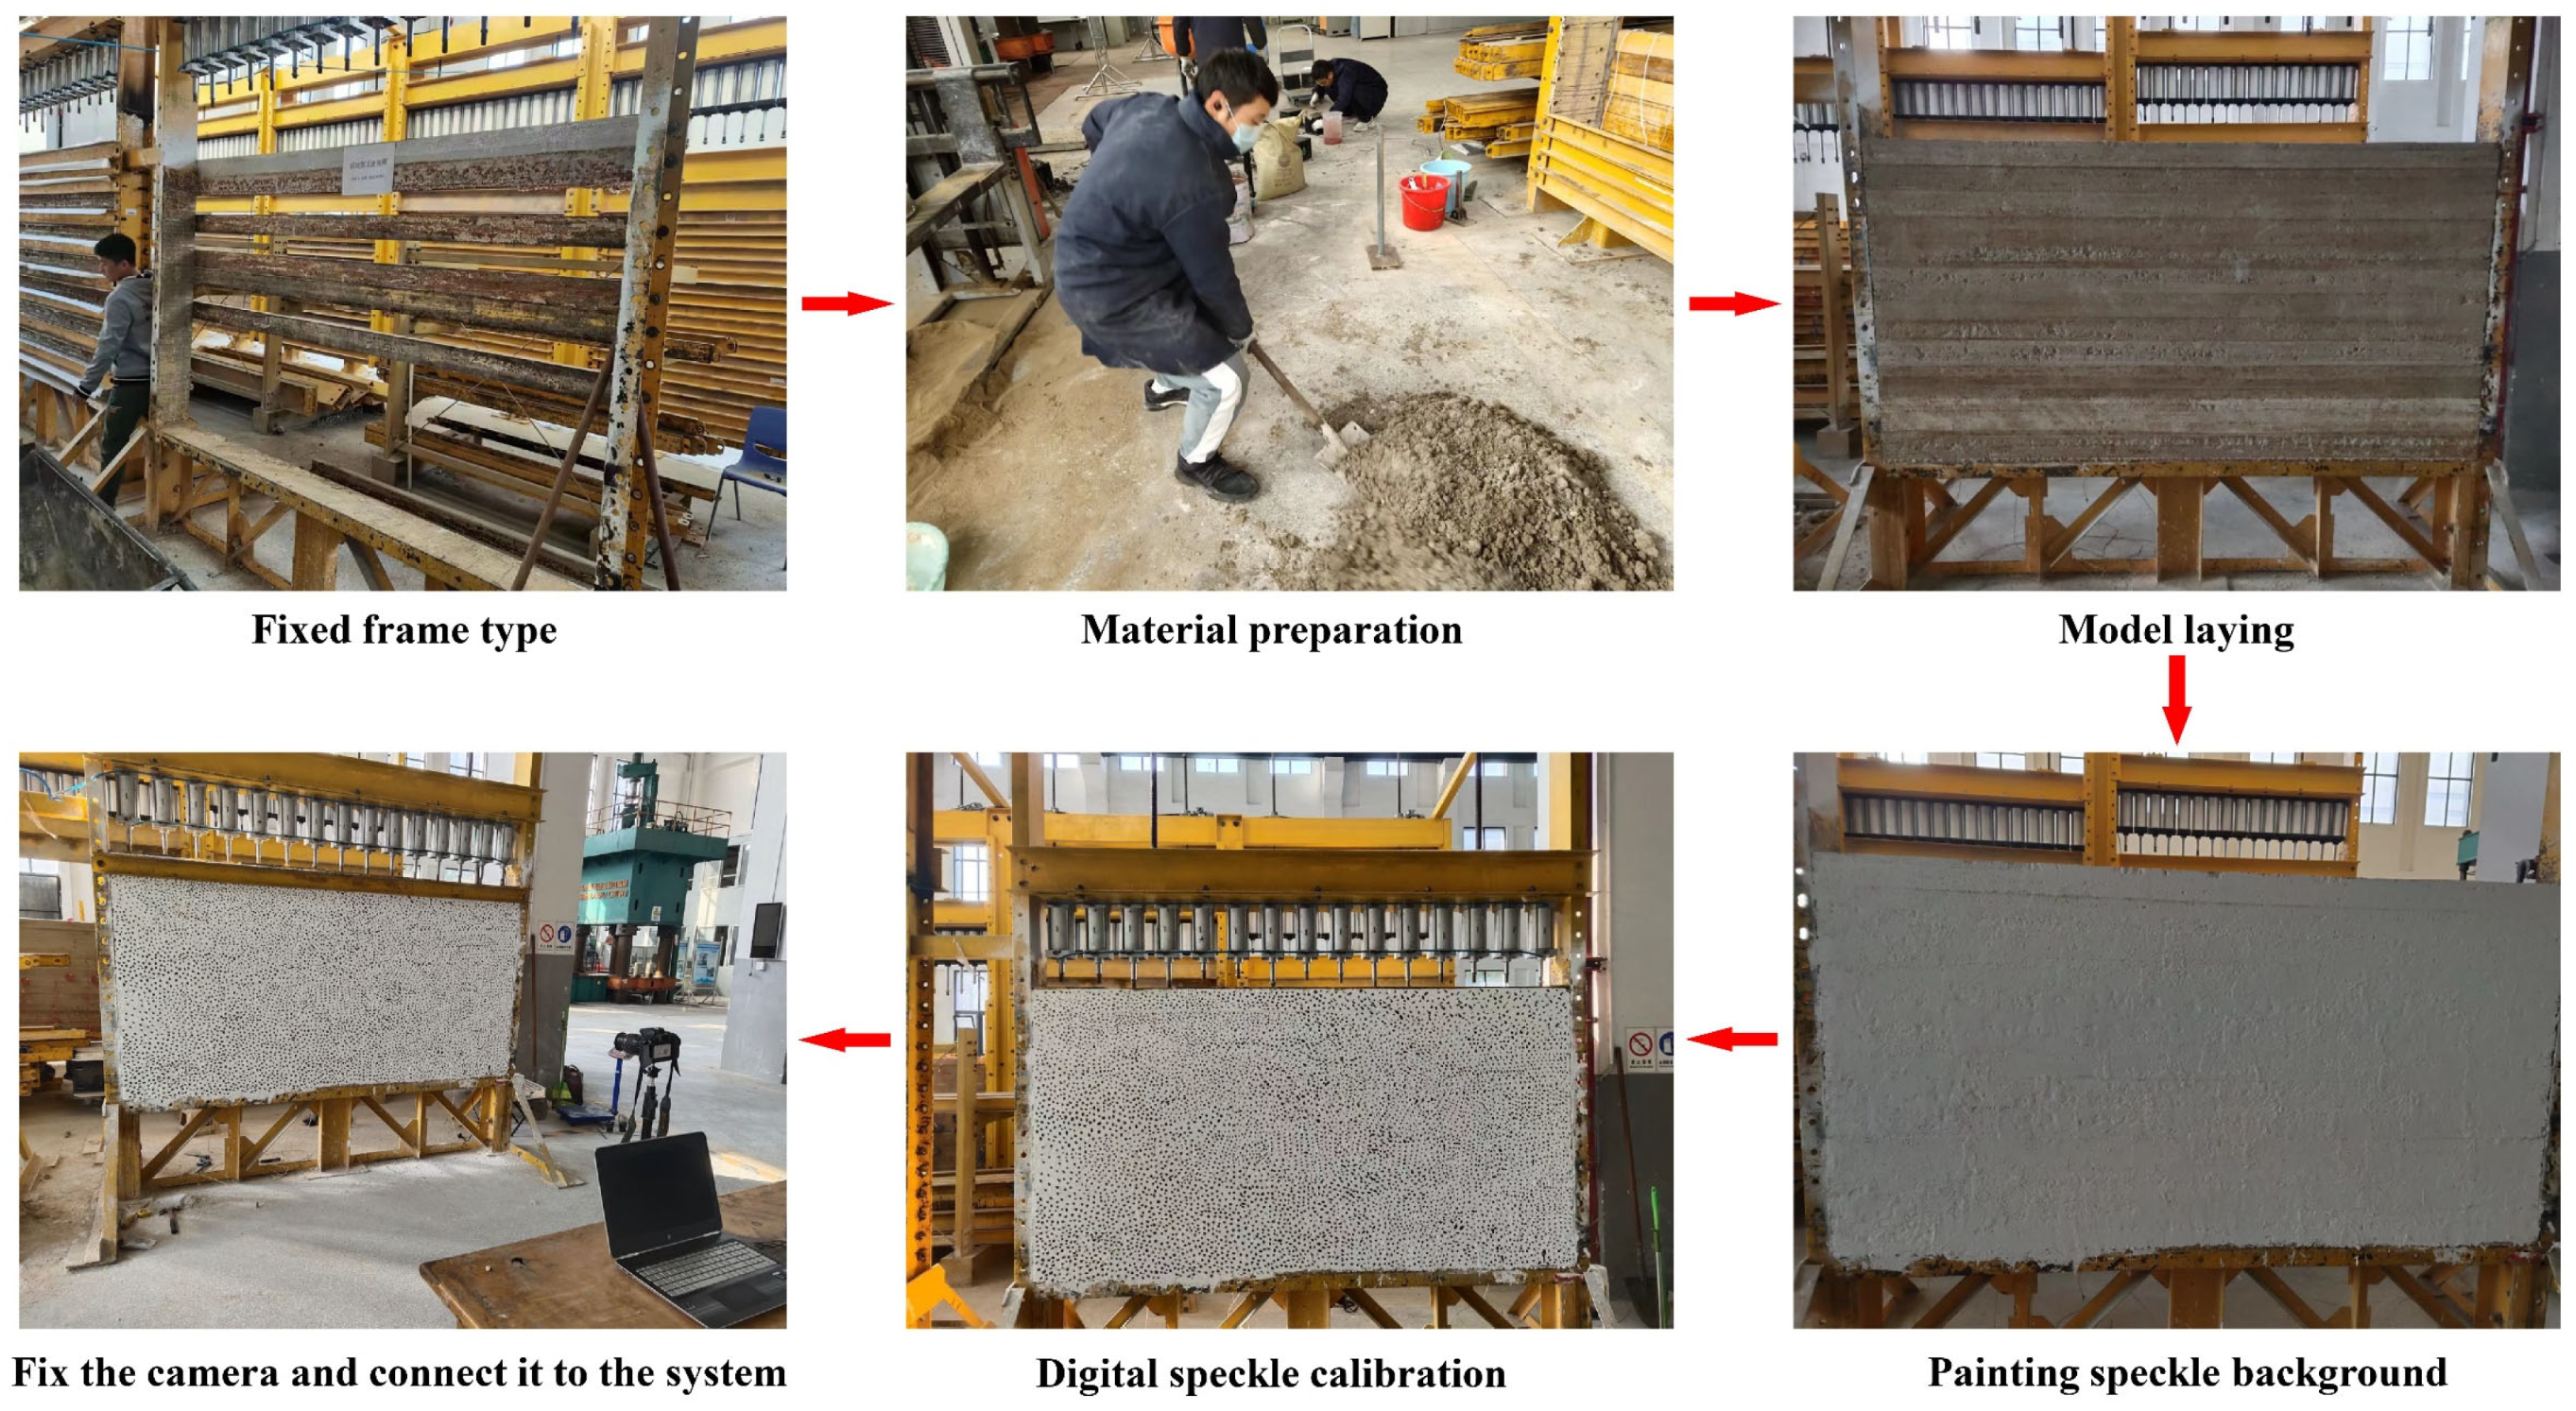
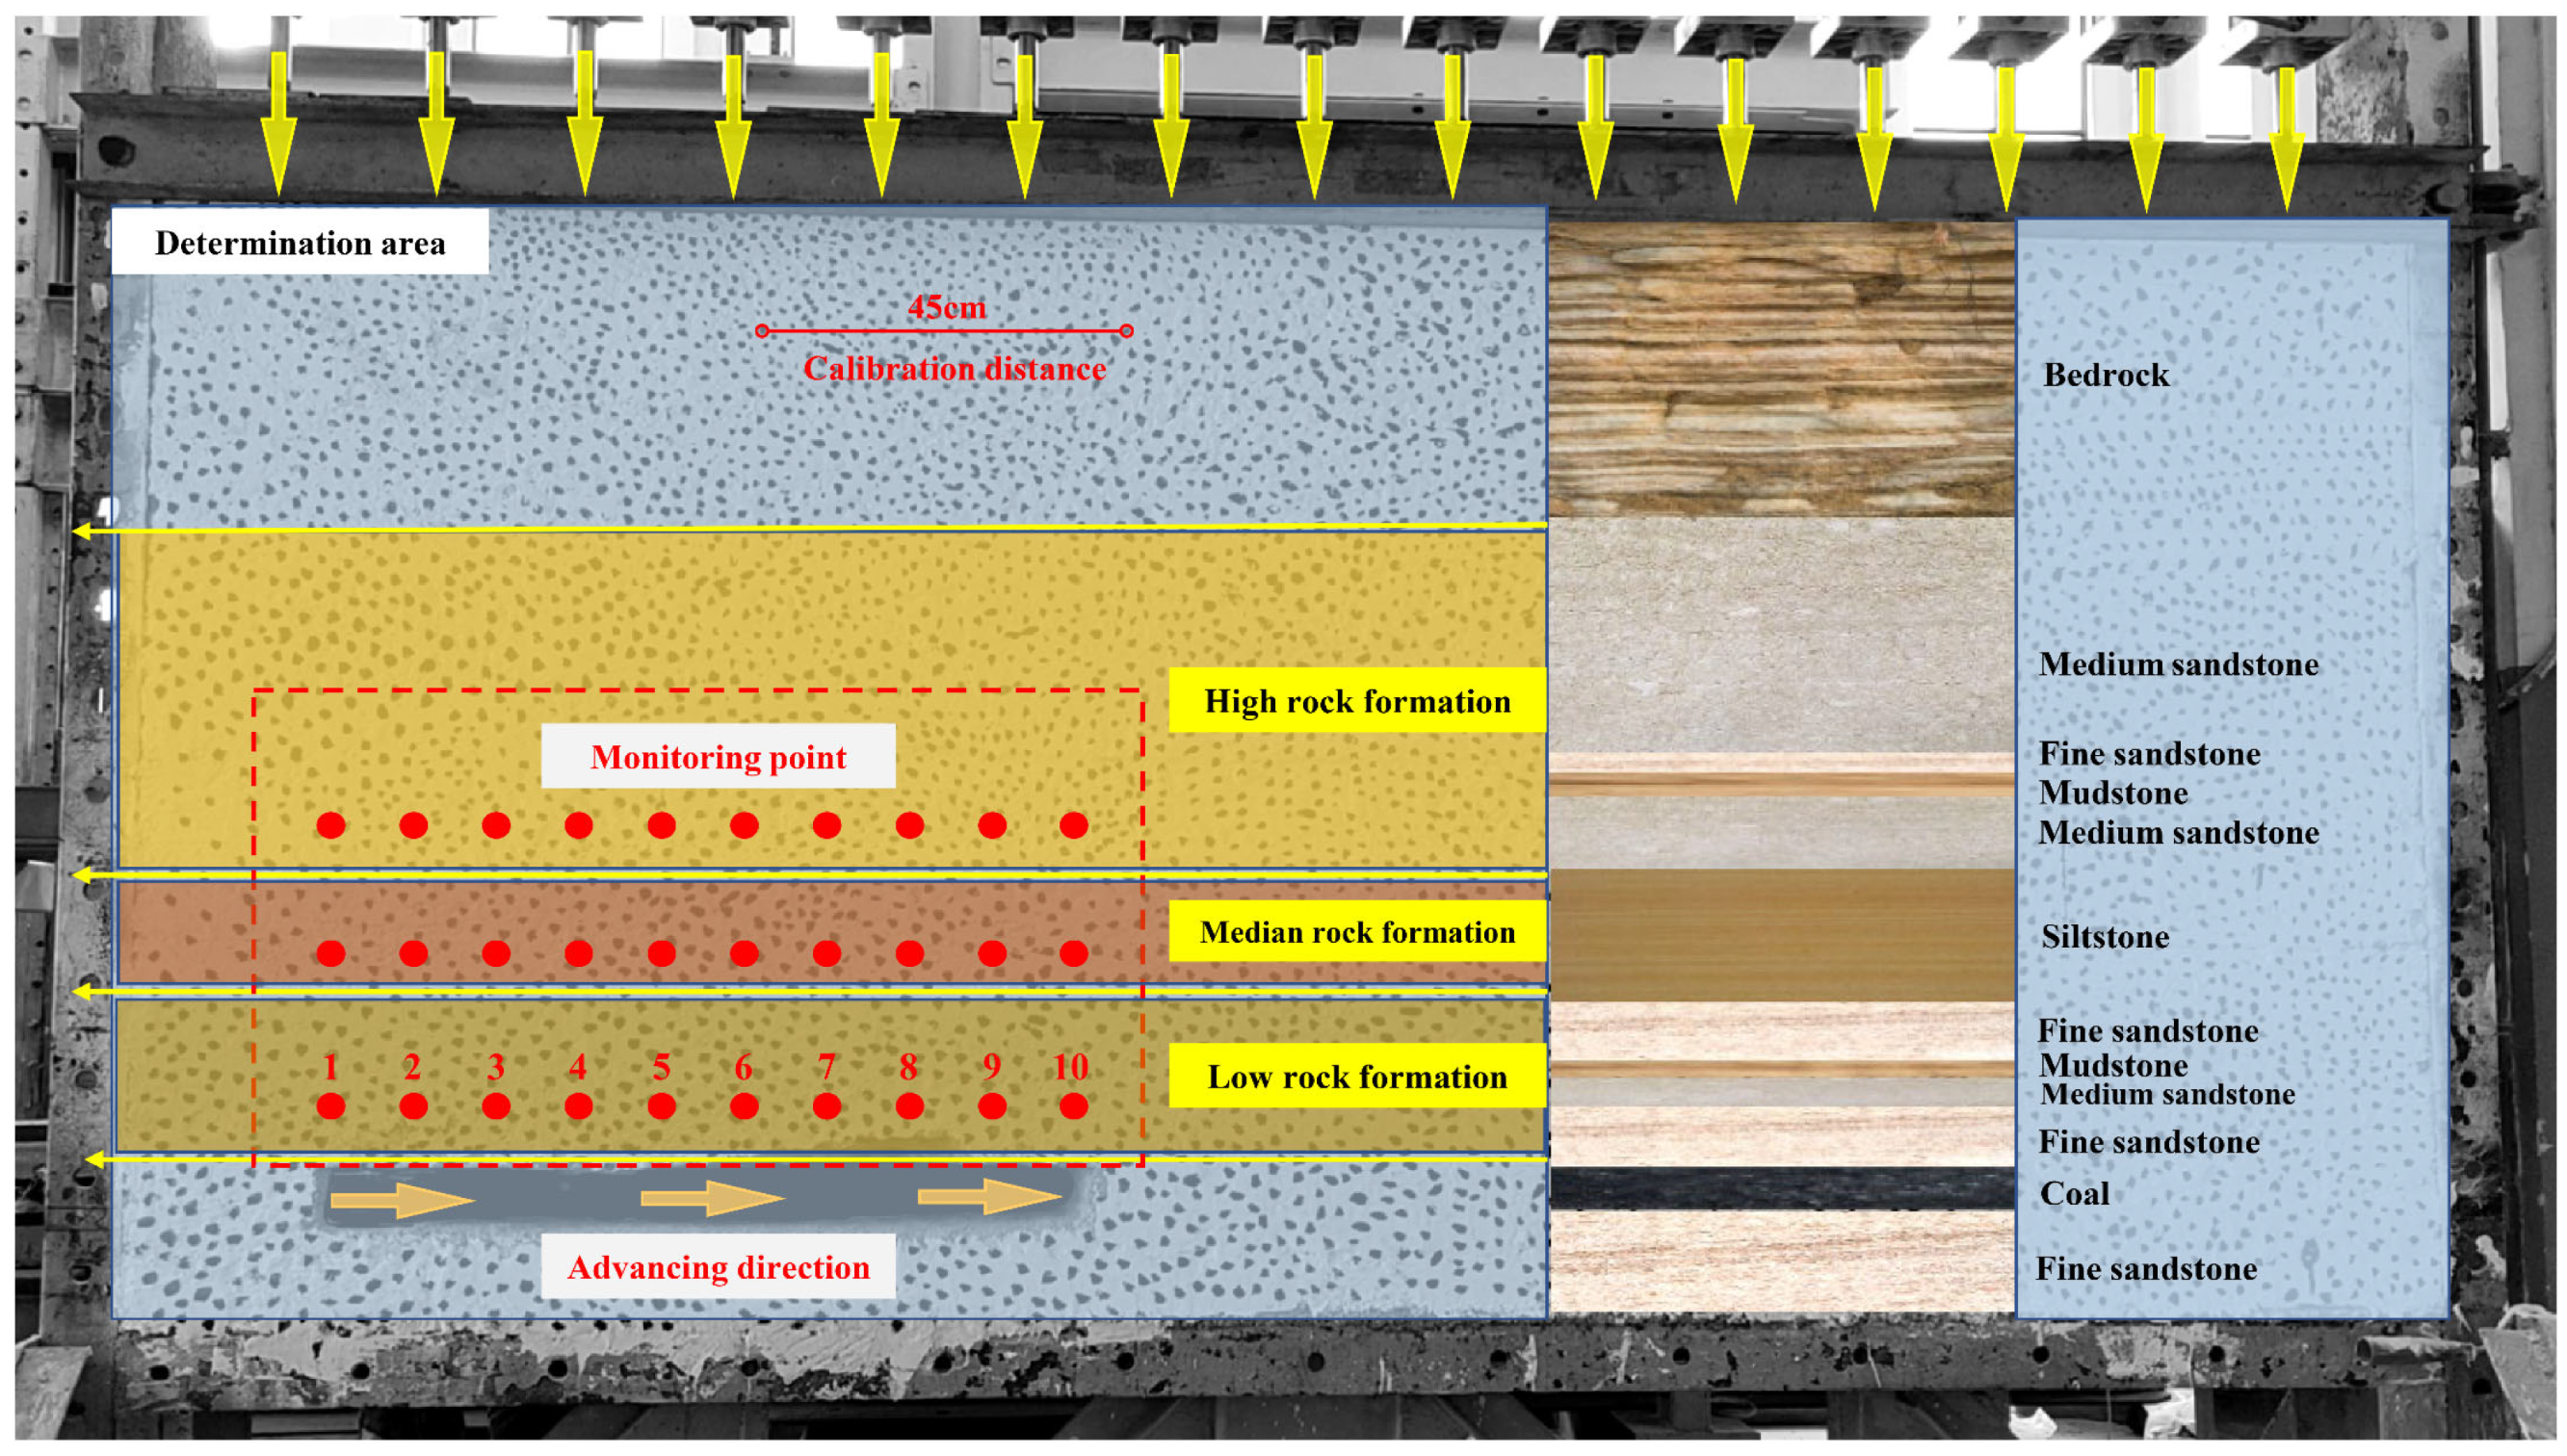
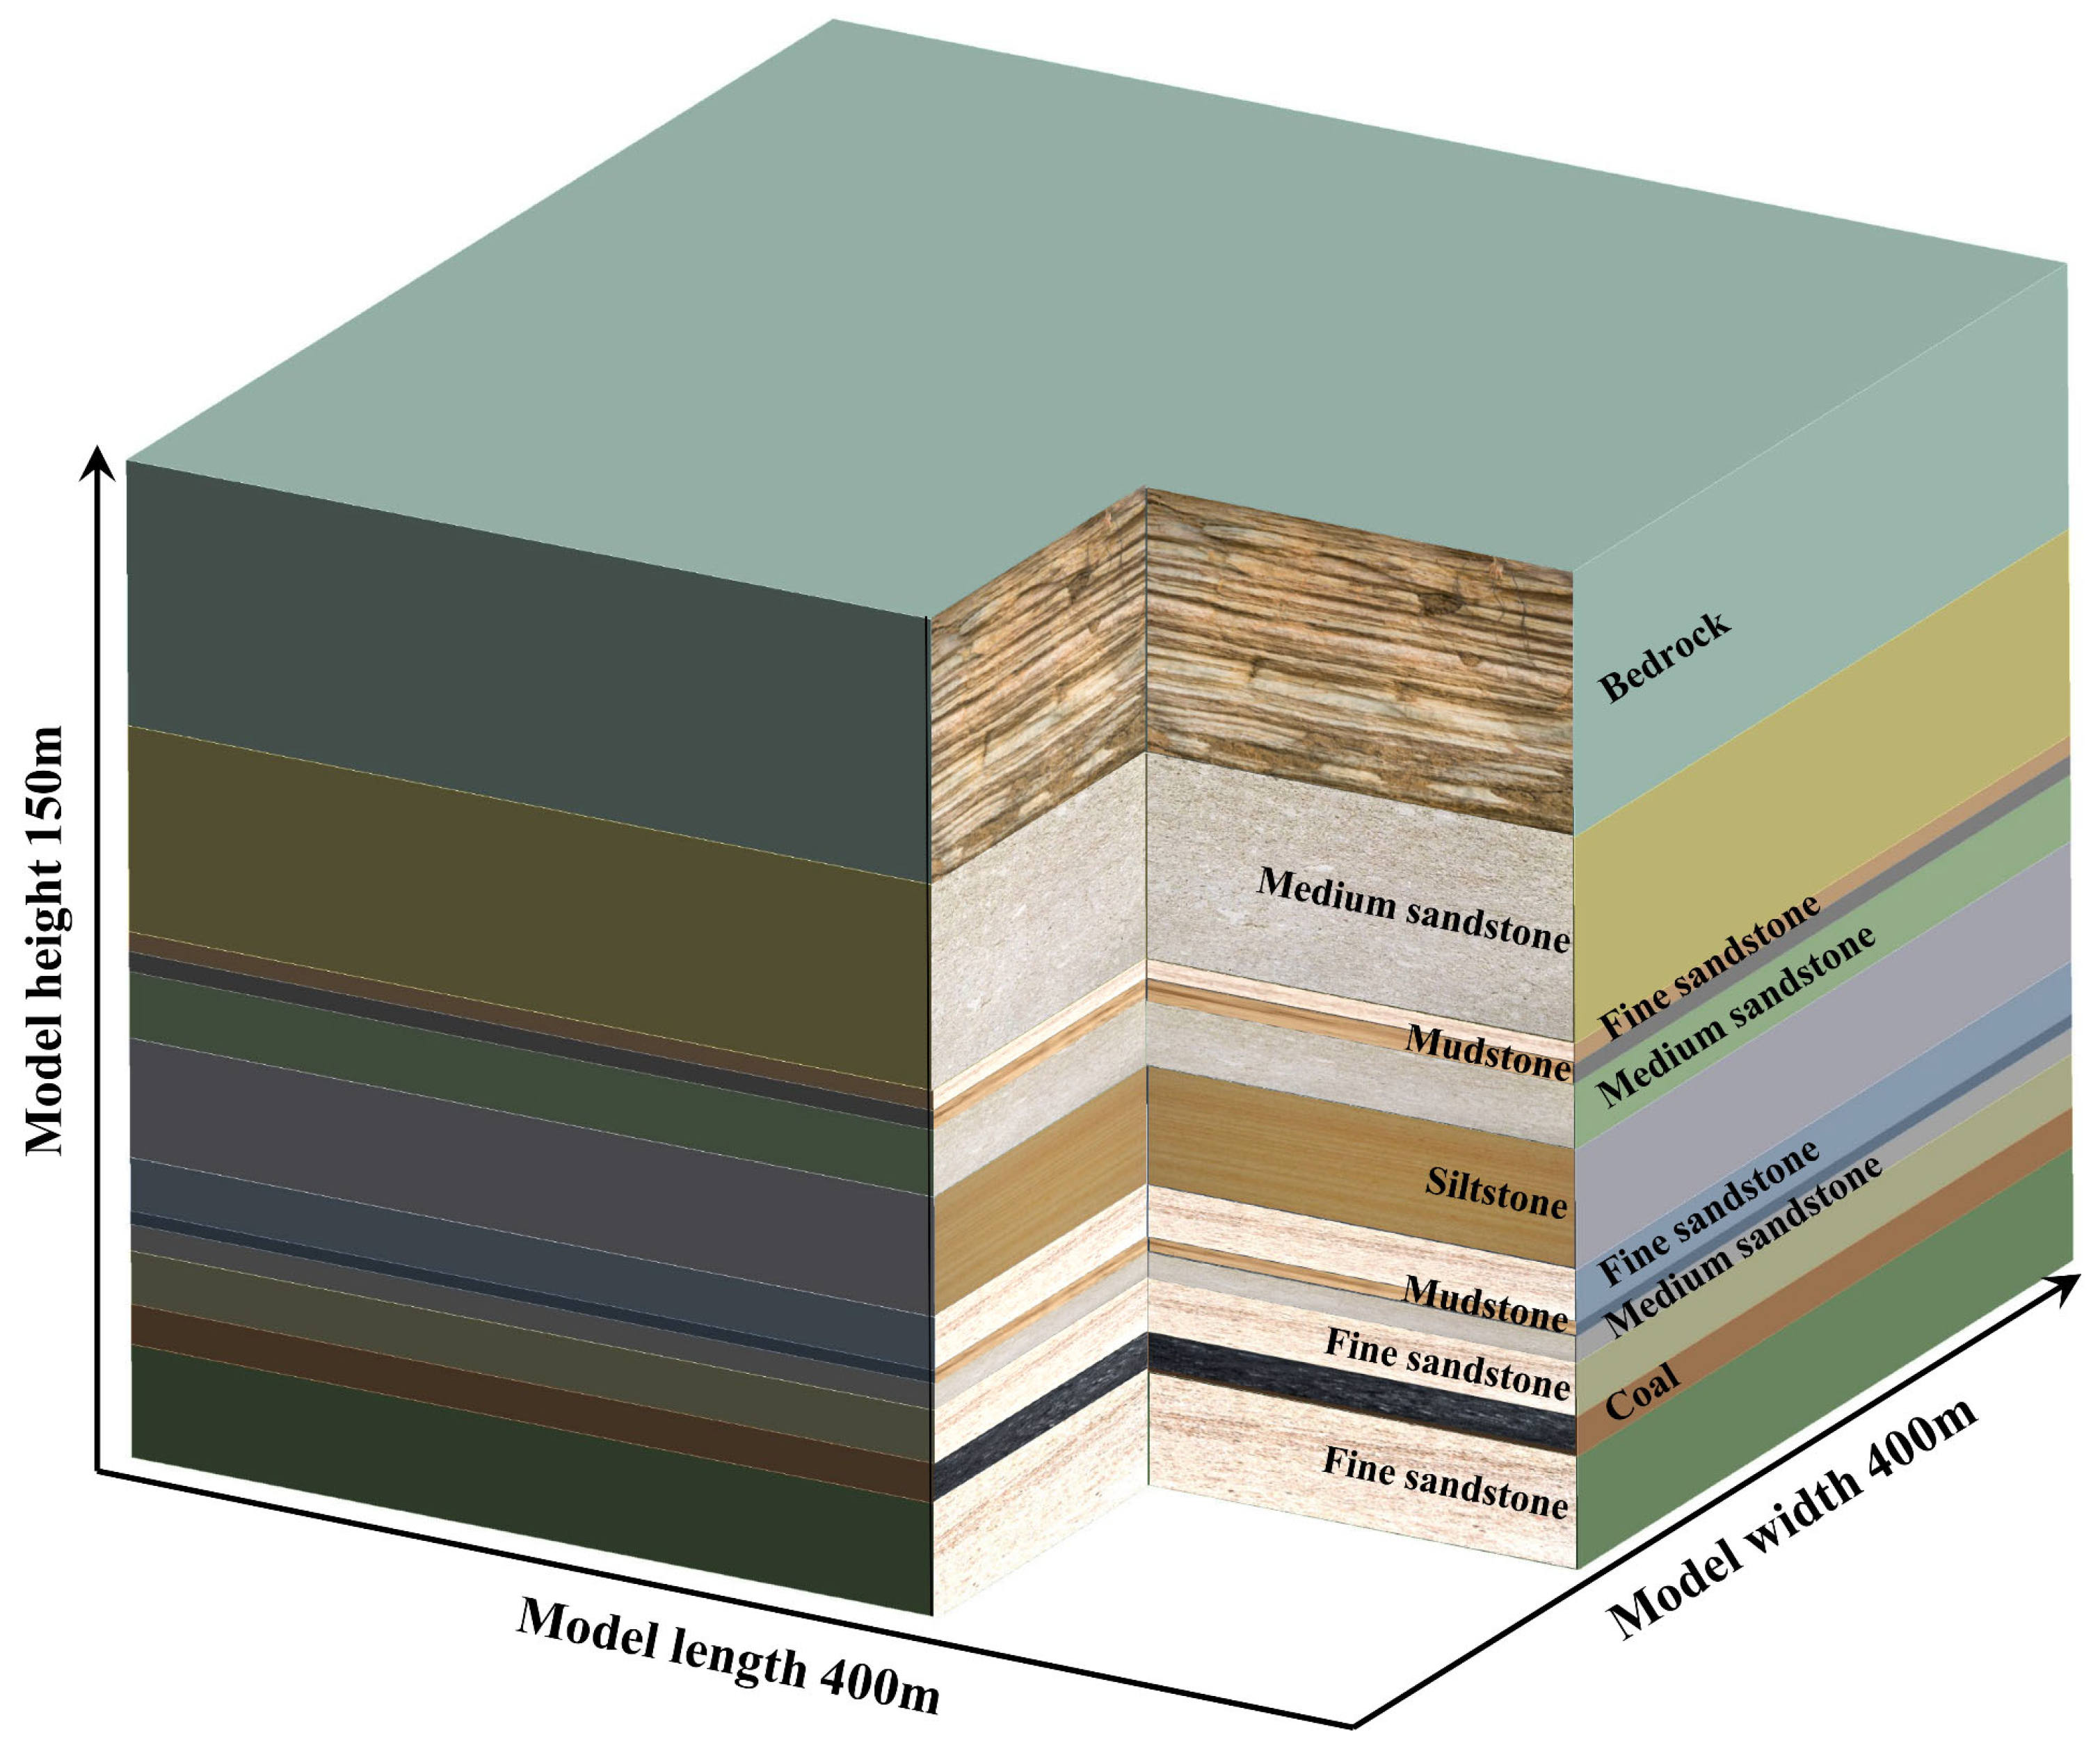
3.1. Physically Similar Simulations and Scenarios

The core of physically similar material simulation lies in utilizing materials that mimic the mechanical properties of the prototype to create a model in accordance with the geometric similarity constant. The process involves excavating the coal body in the physical model, reflective of the actual mining conditions, and observing the collapse of the surrounding rock of the coal body and the deformation of the overlying rock. Based on the geological data of the working face and the dimensions of the model experimental frame, the model dimensions are specified as width × height × thickness = 2.5 × 1.3 × 0.2 m. The model’s boundary conditions include horizontal displacement constraints at the left and right boundaries, displacement constraints at the lower boundary, and a simulated ground stress field introduced by heavy loading at the upper boundary.
The simulated rock mass dimensions are 500 × 260 m (width × height), while the model’s dimensions are 2.5 × 1.3 m. From the simulation experiment, the geometric similarity ratio is determined to be Cl = 200, the model density similarity ratio is Cρ = 1.5, and the stress similarity ratio is Cσ = Cl × Cρ = 200 × 1.5 = 300. The upper boundary of the rock layer is situated 72.13 m below the surface, and the two excavated working faces are located in the coal. Each working face is 1.0 m in length, with 10 cm coal pillars in the center and 20 cm boundary coal seams on both sides. The physical model rock stratum setting and similar material matching of the working face are shown in Table 1. Given that the original rock stress of this layer is 1.265 MPa, the vertical stress at the model’s upper boundary is 4.22 KPa. Figure 3 shows the laying process of the overall physical similarity model.
In order to simulate the energy release of overlying strata under different mining speeds, verify the energy release law of the mining field under numerical simulation, and control the same amount of single excavation of the two working faces, the single excavation is 10 cm, and the time of each excavation and waiting is 30 min and 90 min. Observe the collapse deformation of the upper rock stratum.
According to the buried depth of the coal seam and the properties of the rock strata, the overlying strata above the coal seam are divided into low overlying strata, middle overlying strata, and high overlying strata. Monitoring points are arranged at three overburden positions to observe the displacement deformation and caving velocity of overlying strata during coal seam mining. The entire experimental procedure is captured by the digital speckle monitoring system, with the setup used for monitoring detailed in Figure 4.

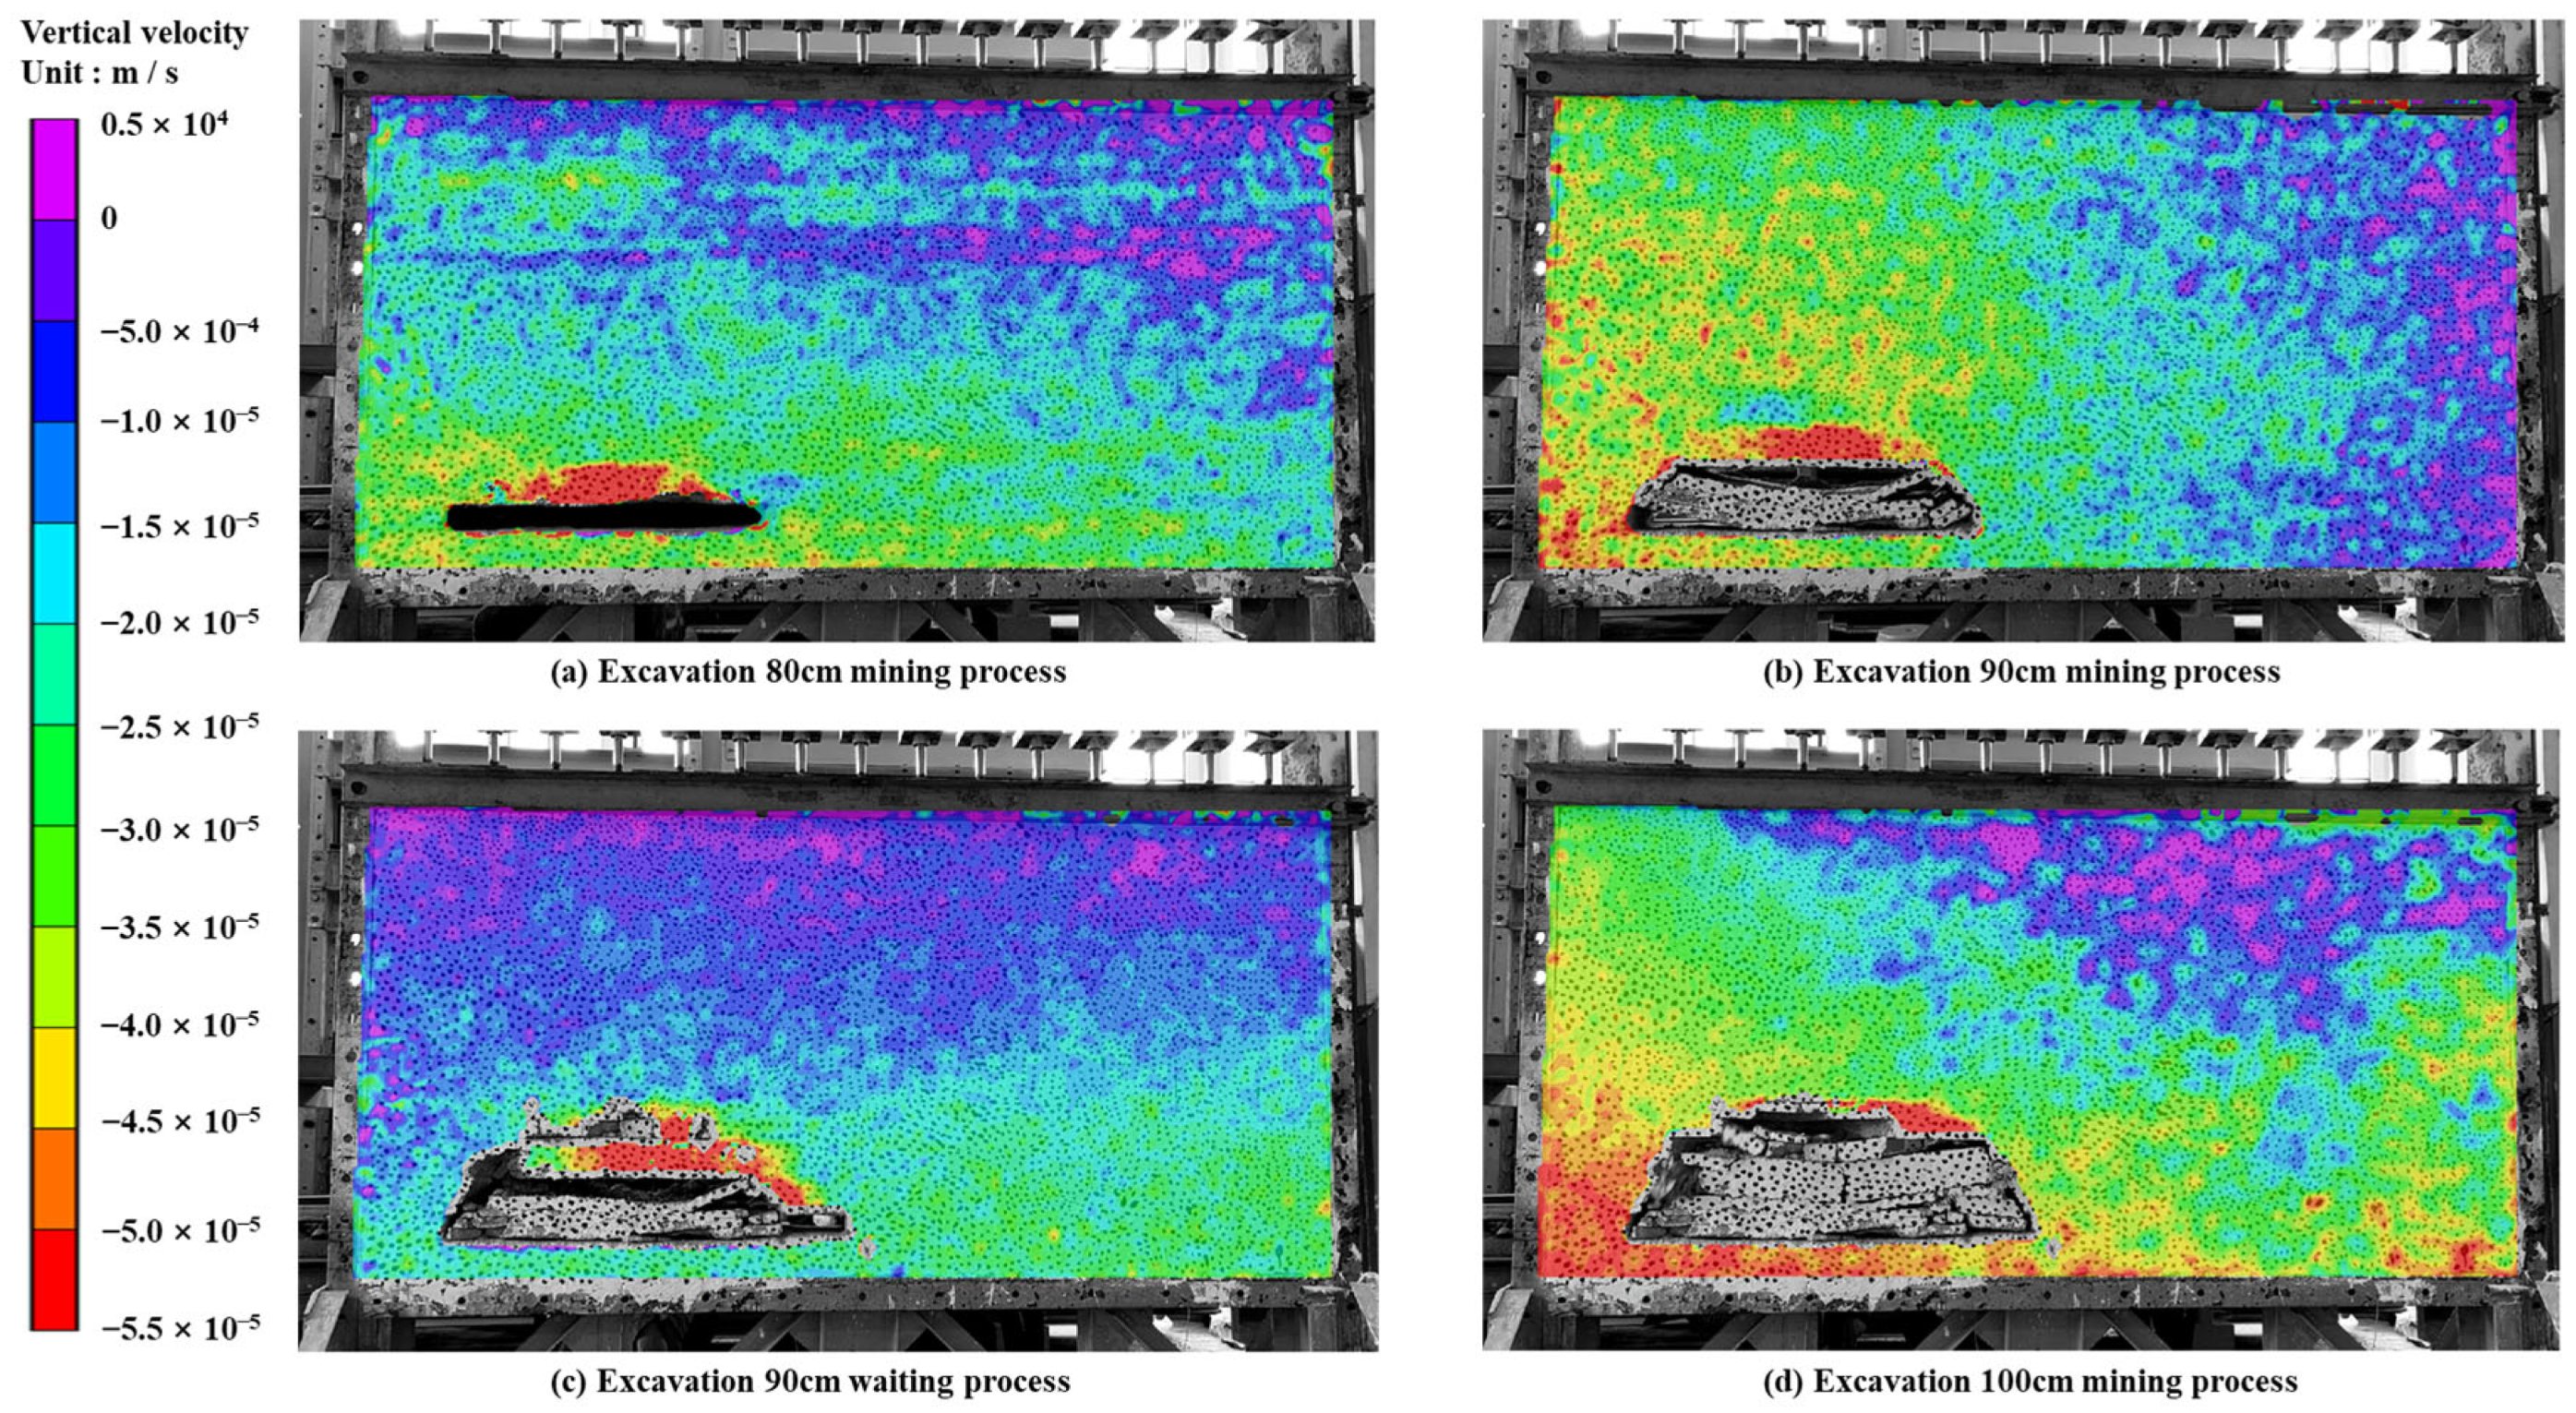
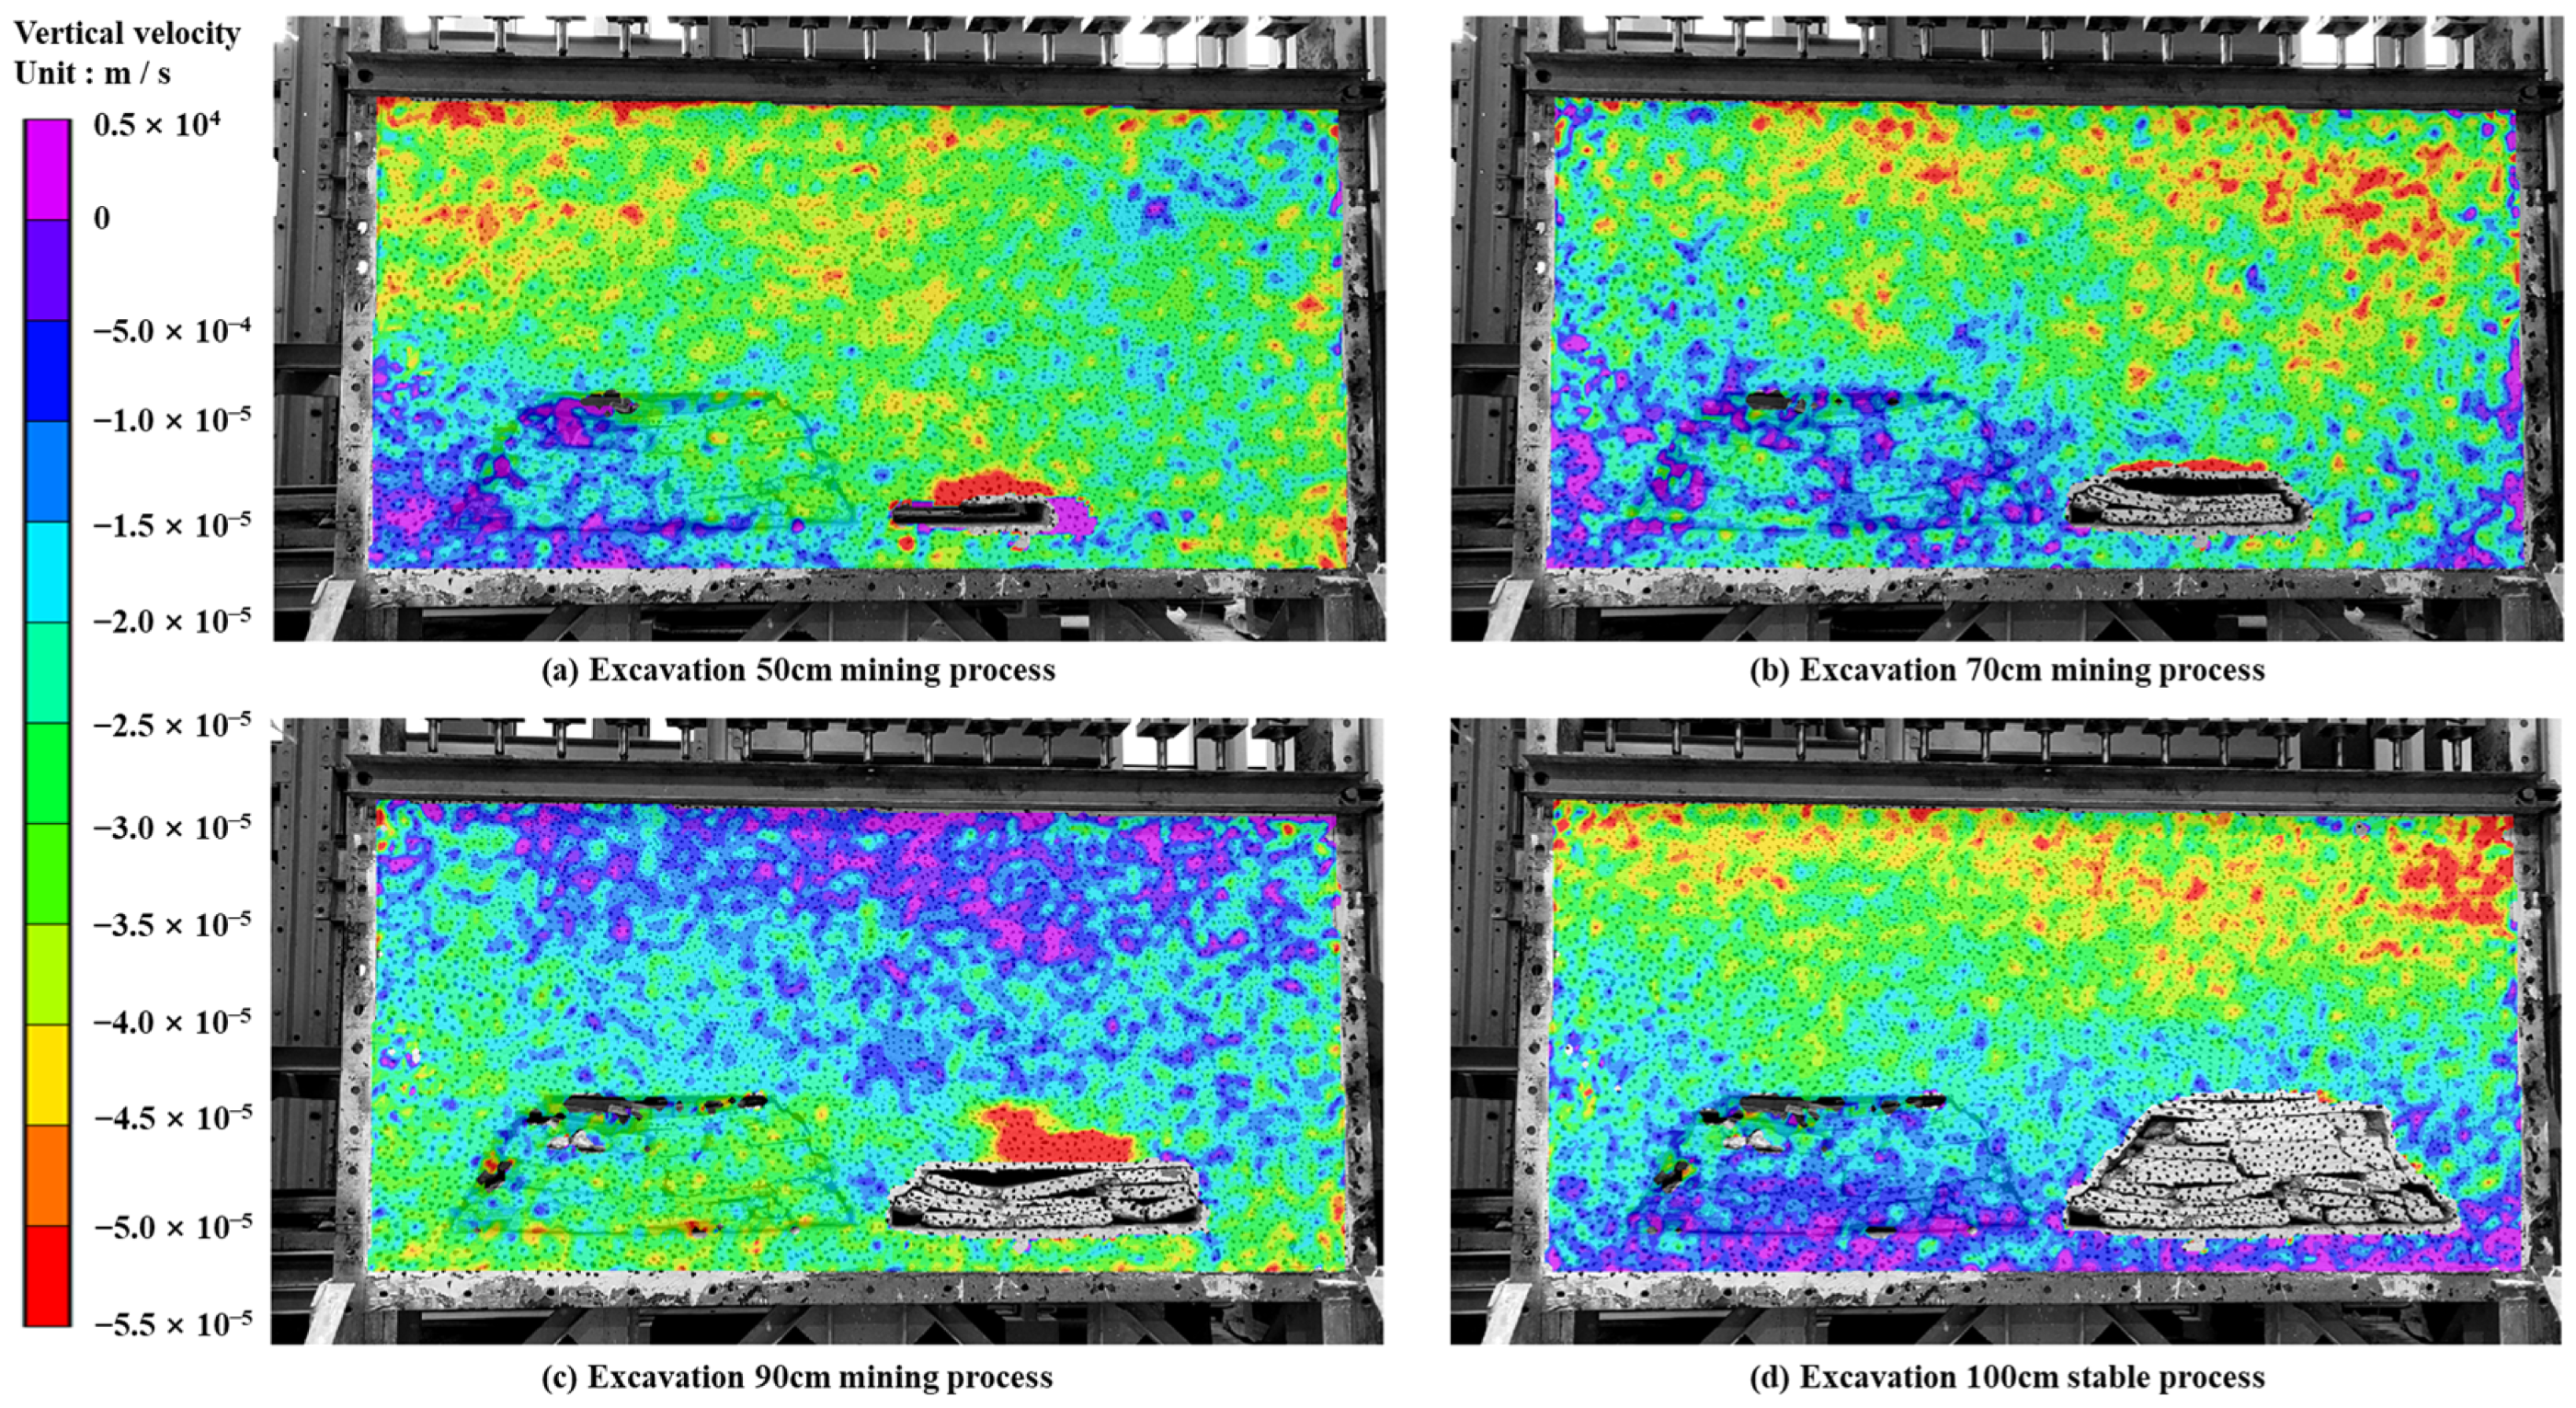
3.2. Analysis of Overburden Rock Caving Velocity under Different Mining Speed

By analyzing the initial coordinates of the designated points in the physical similarity model and the coordinates of the points in the mining process, combined with the time of each coordinate change recorded by the observation points, the measured displacement data are post-processed to generate the velocity changes of different strata above the coal seams in different mining processes. The magnitude of rock breaking velocity facilitates a quantitative analysis of rock energy release.
The analysis of the speed change at the monitoring point shows that during rapid mining processes, the speed of the lower rock stratum above the coal seam suddenly increases significantly in a wide area, resulting in considerable speed fluctuations. As shown in Figure 5a, at the 80 cm position of the coal seam recovery, the low-level rock stratum begins to collapse, and the collapse range includes the overall low-level rock stratum. After a 90 cm excavation, as shown in Figure 5b, the lower-level rock strata collapsed as a whole and formed large voids, causing the middle level rock strata to show more obvious signs of collapse, but the speed change was not as obvious as the lower-level rock strata. While waiting after the 90 cm excavation, the median rock layer began to collapse, as shown in Figure 5c, and stabilized in the mining area at 100 cm. At this time, voids appeared in the high-level and median rock layers, as shown in Figure 5d.
During the low-speed mining process, the low rock strata above the coal seam collapsed gradually with the continuous mining of the working face. As shown in Figure 6a,b, during the low-speed mining process, rock collapse begins to occur at a depth of 50 cm in the low-level rock layer, with a small collapse range and low collapse speed. The deformation number of monitoring points in the middle and high rock layers is further reduced, and the collapse of the rock layers is minimal or even non-existent, as shown in Figure 6c,d.

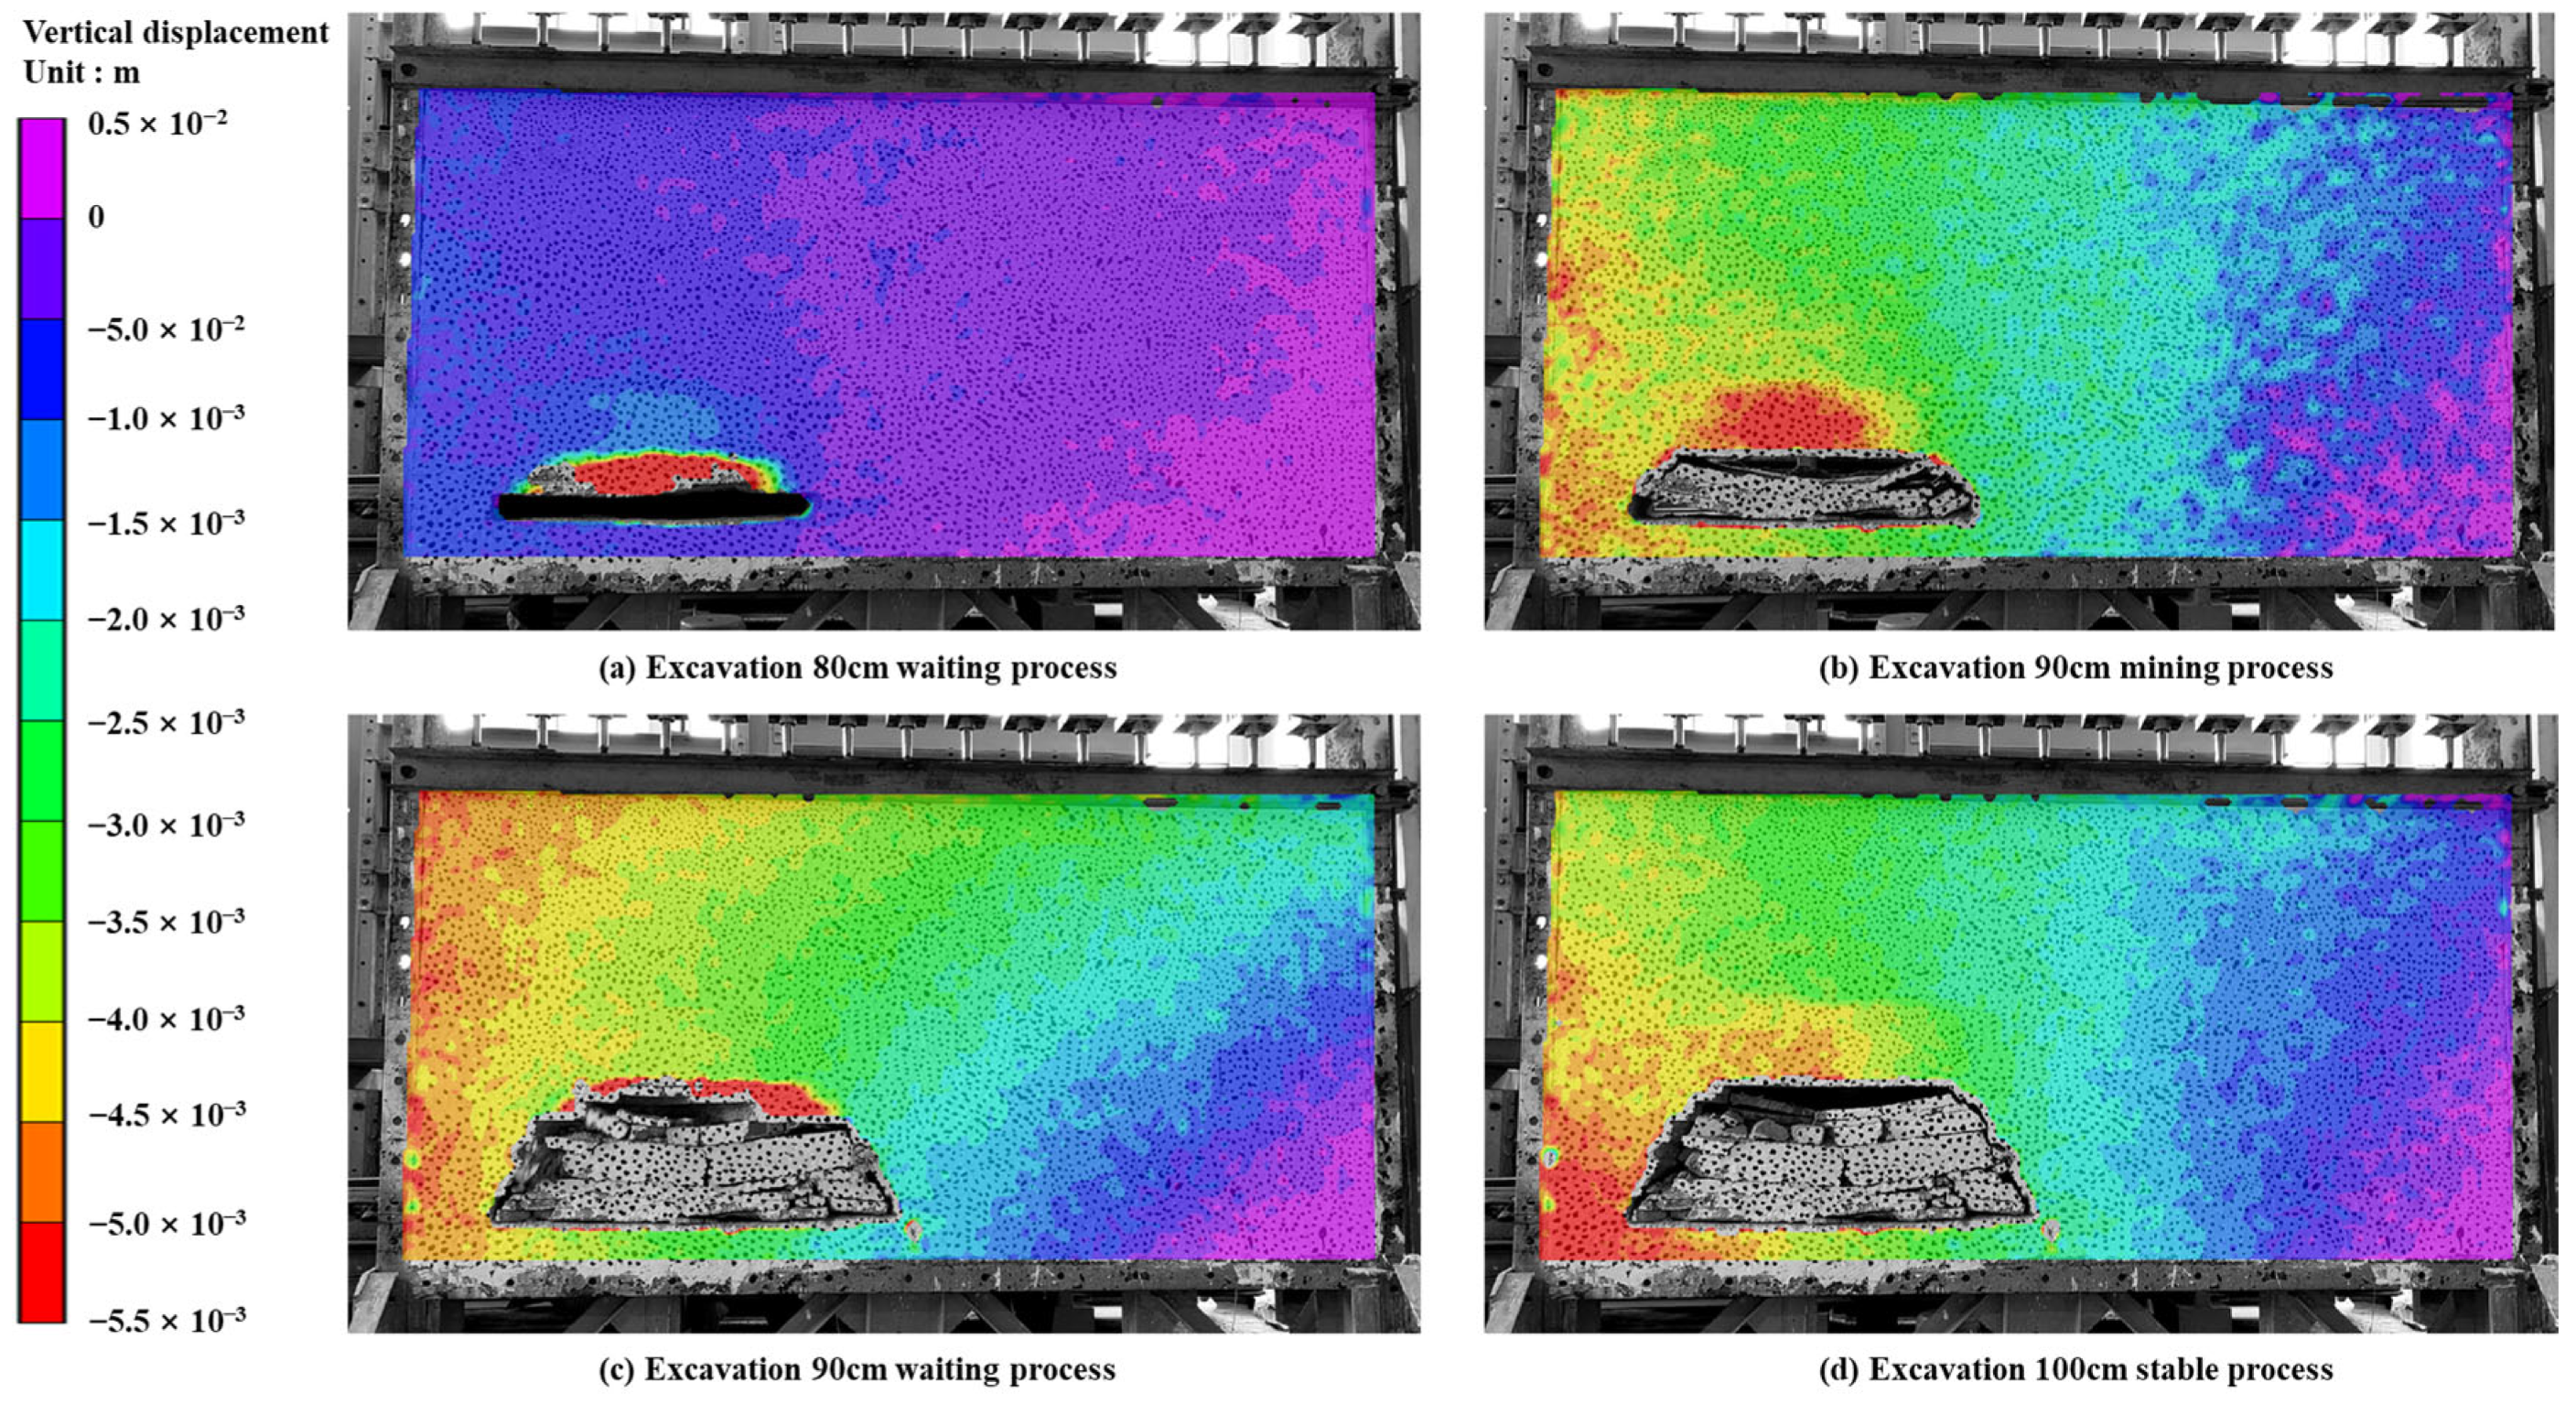
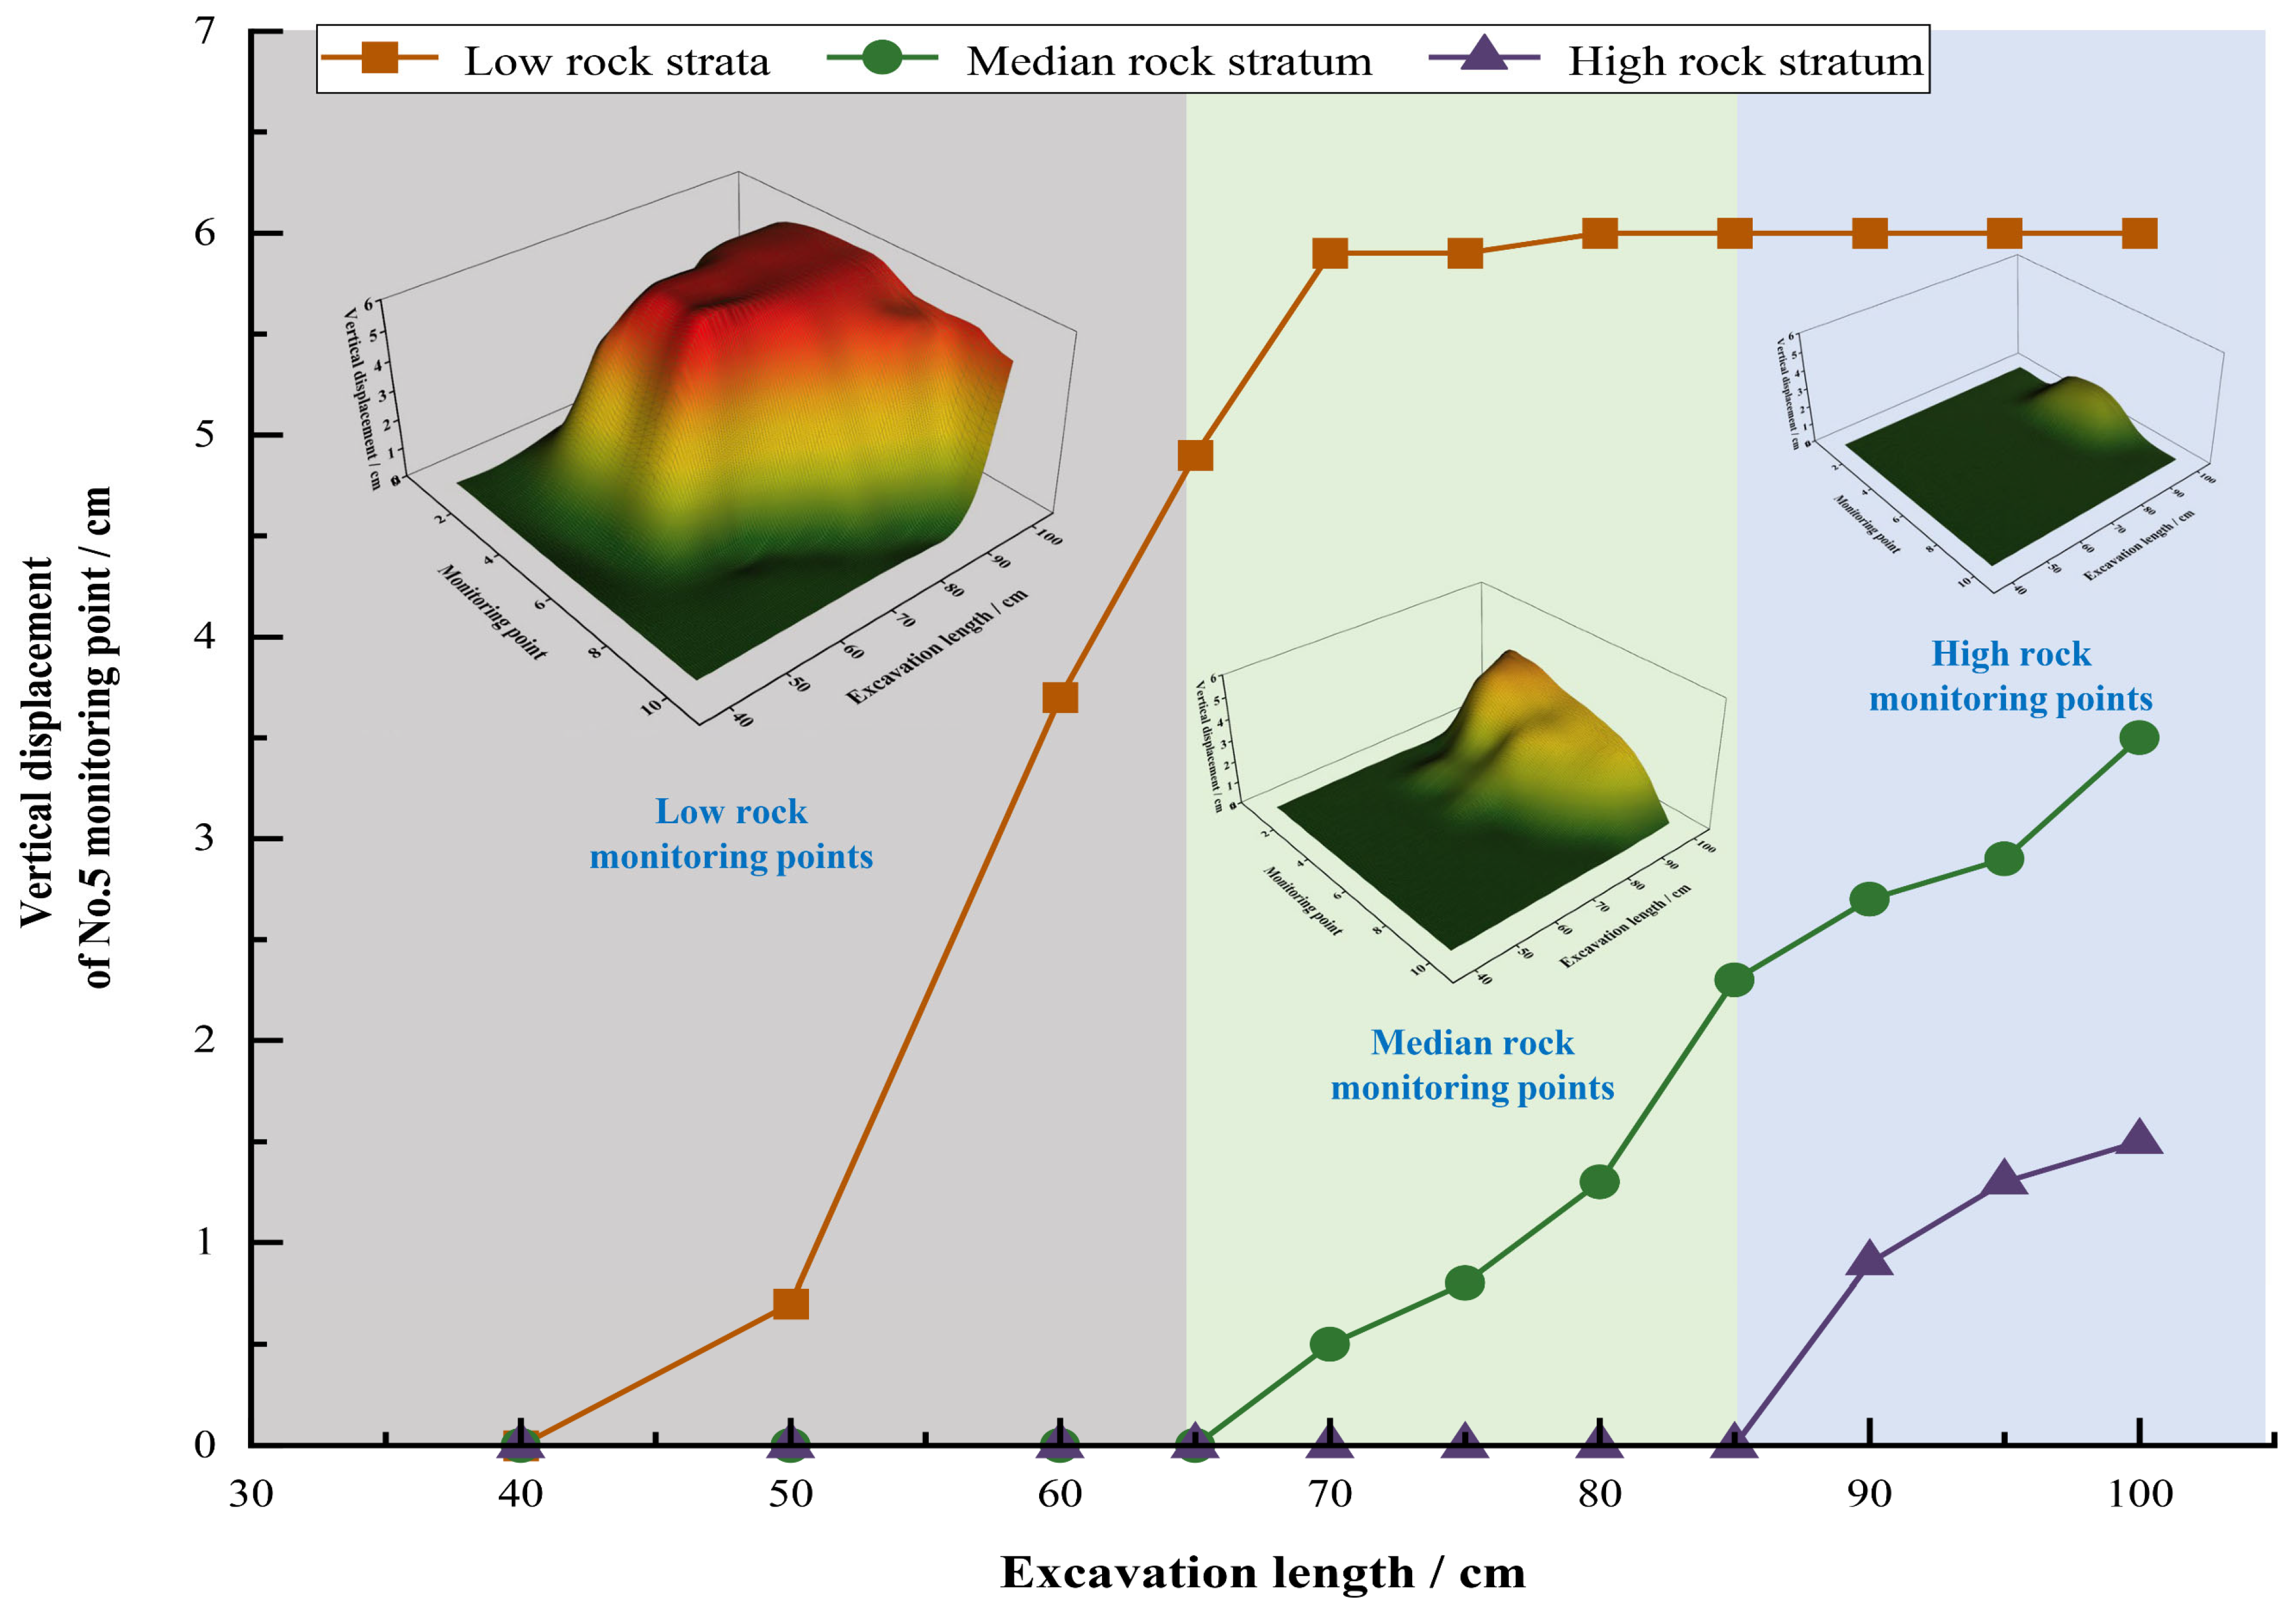
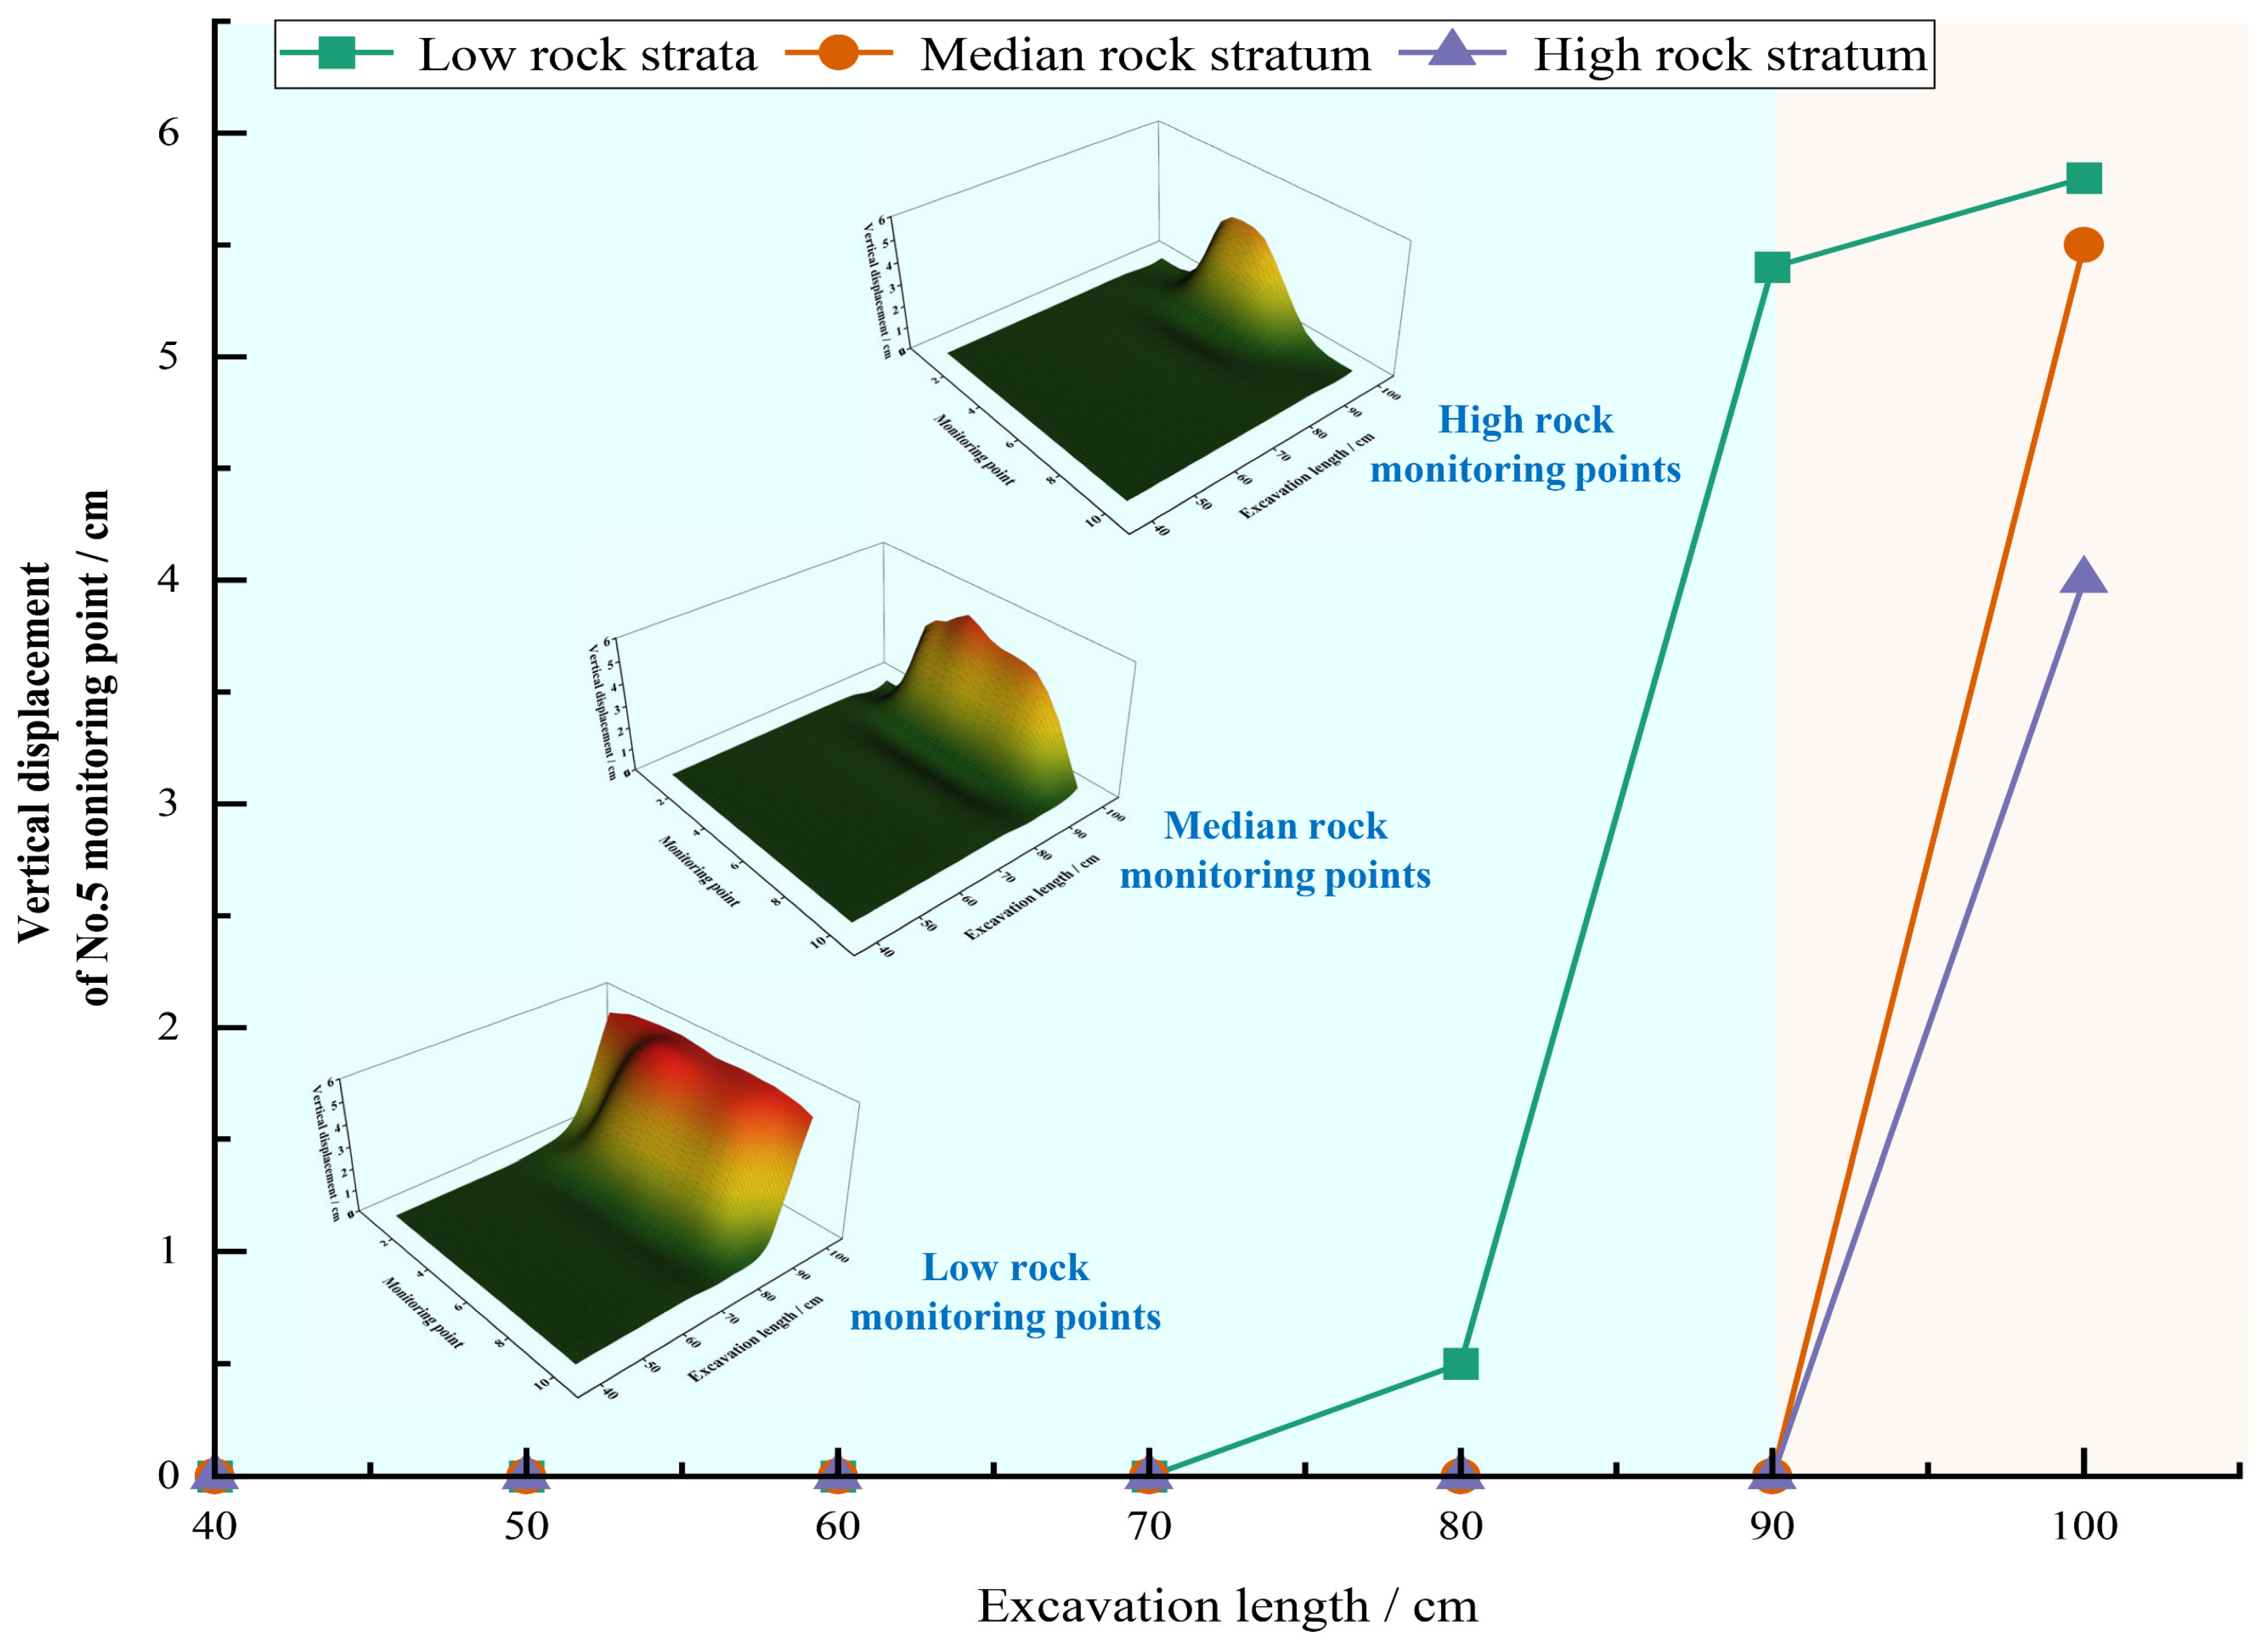
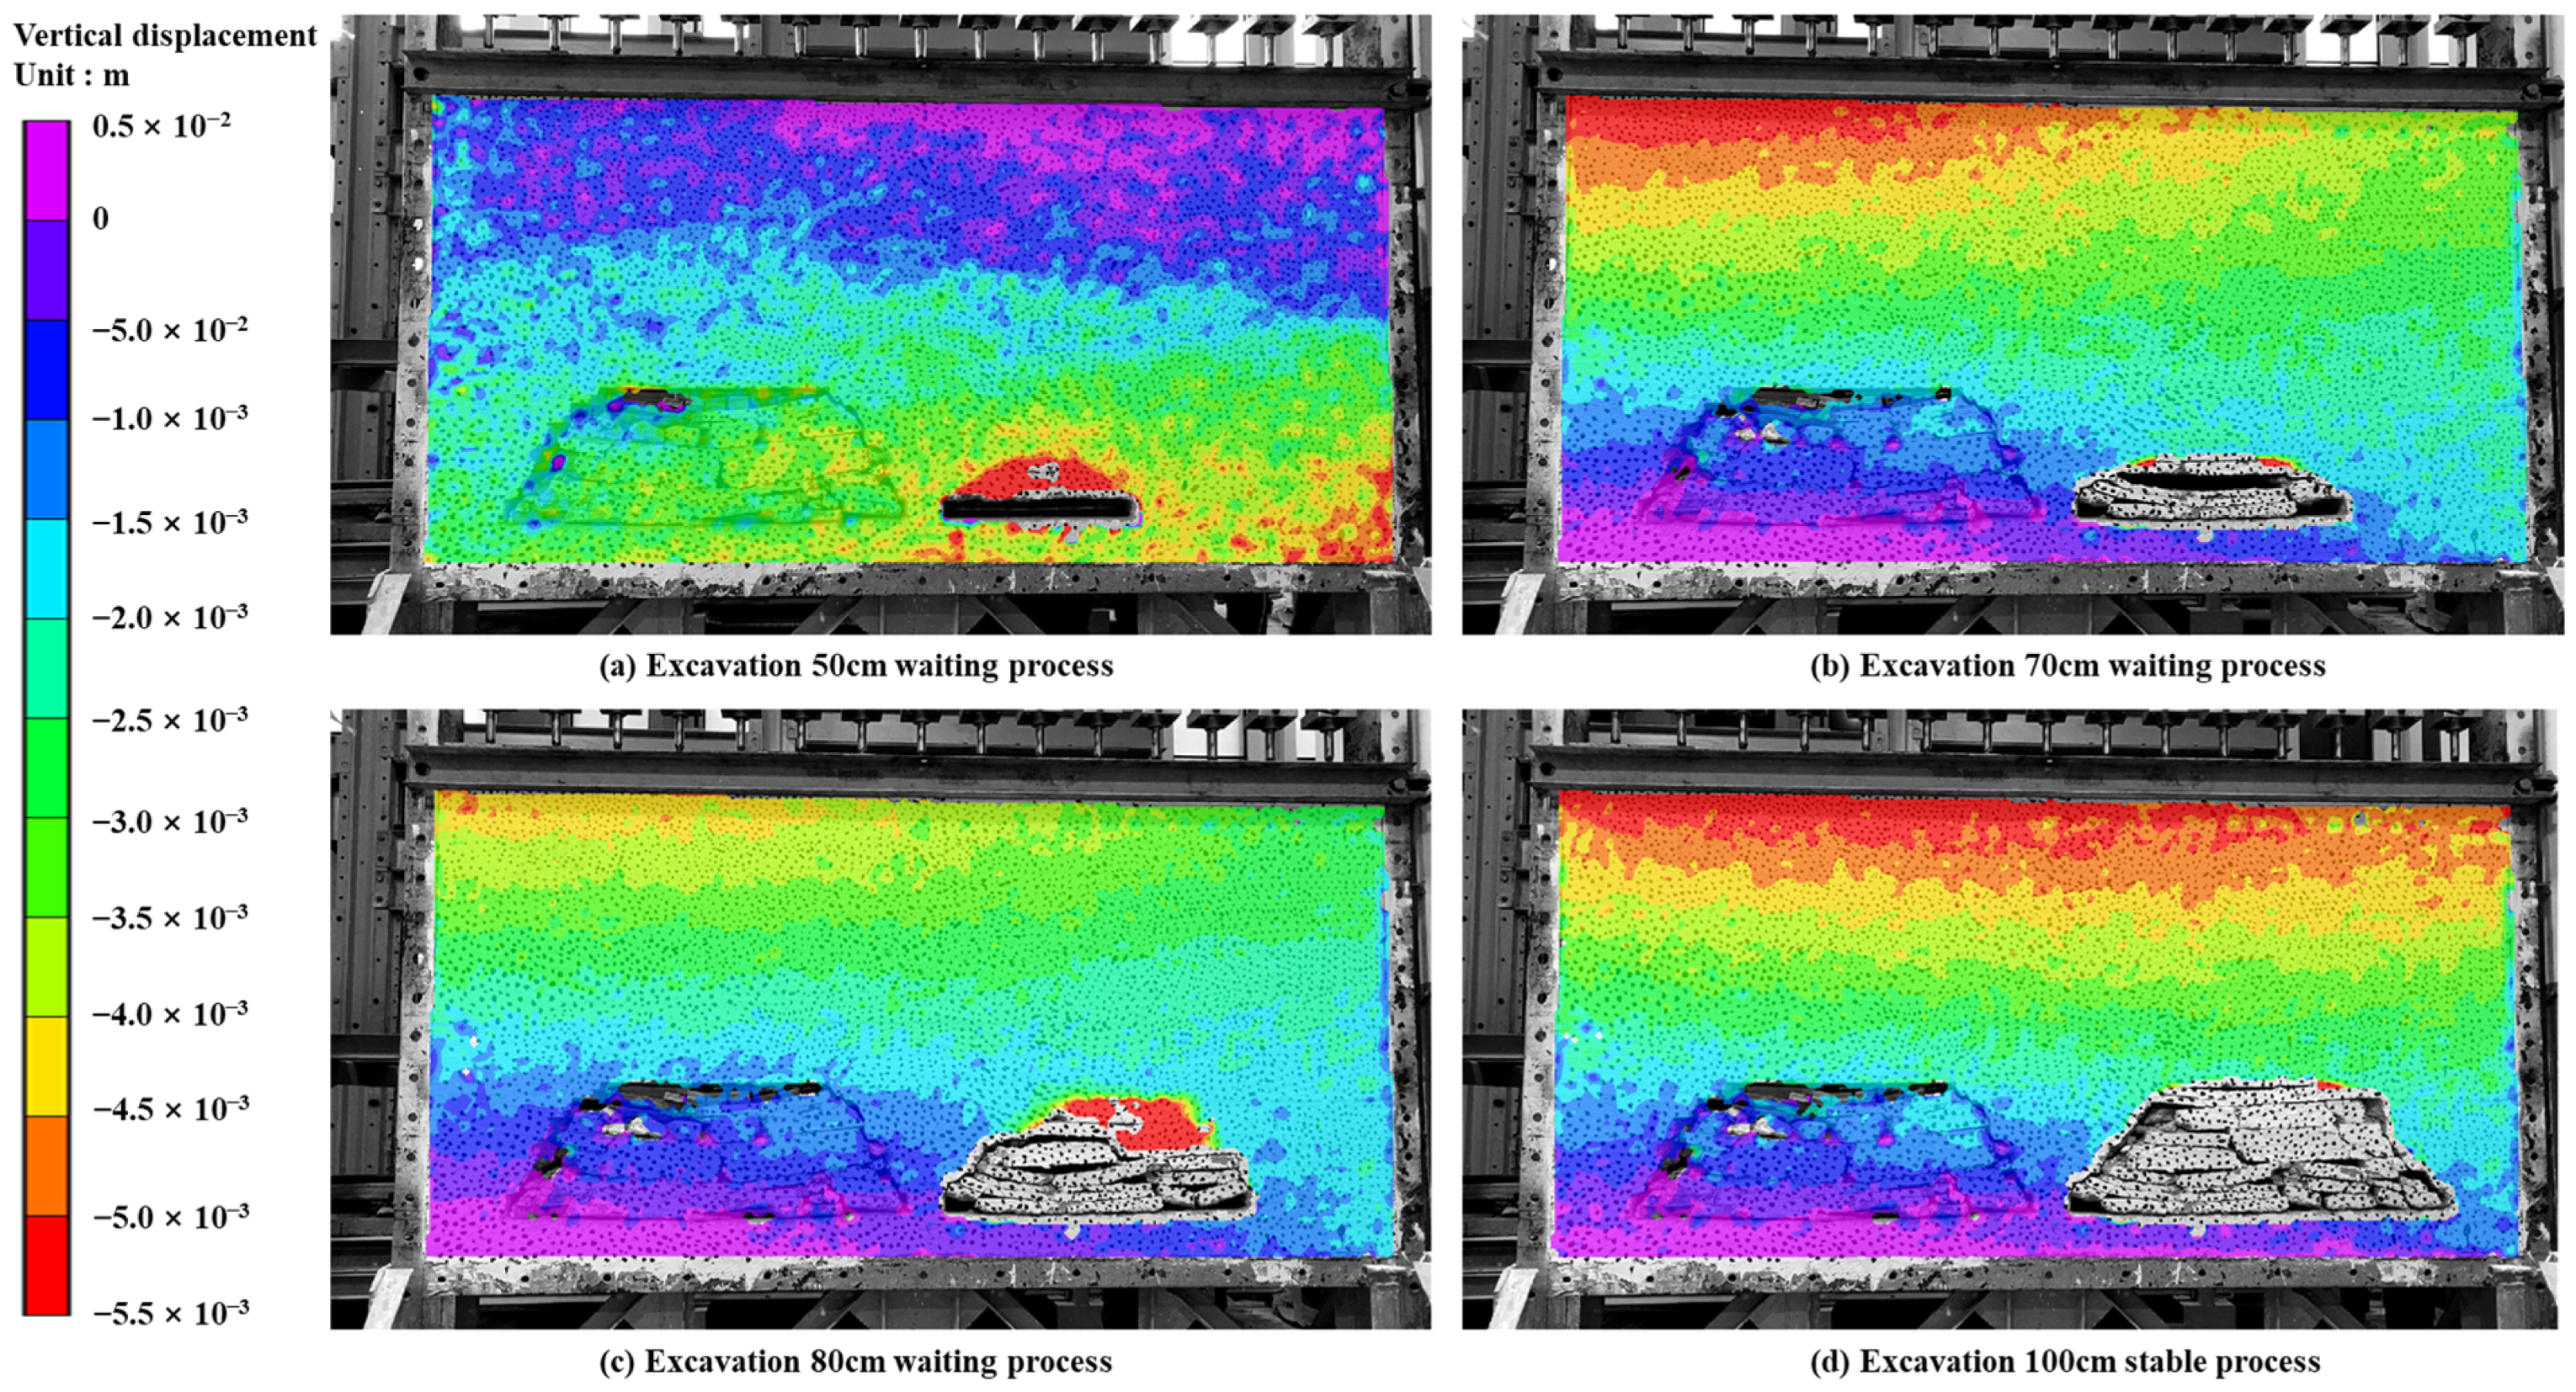
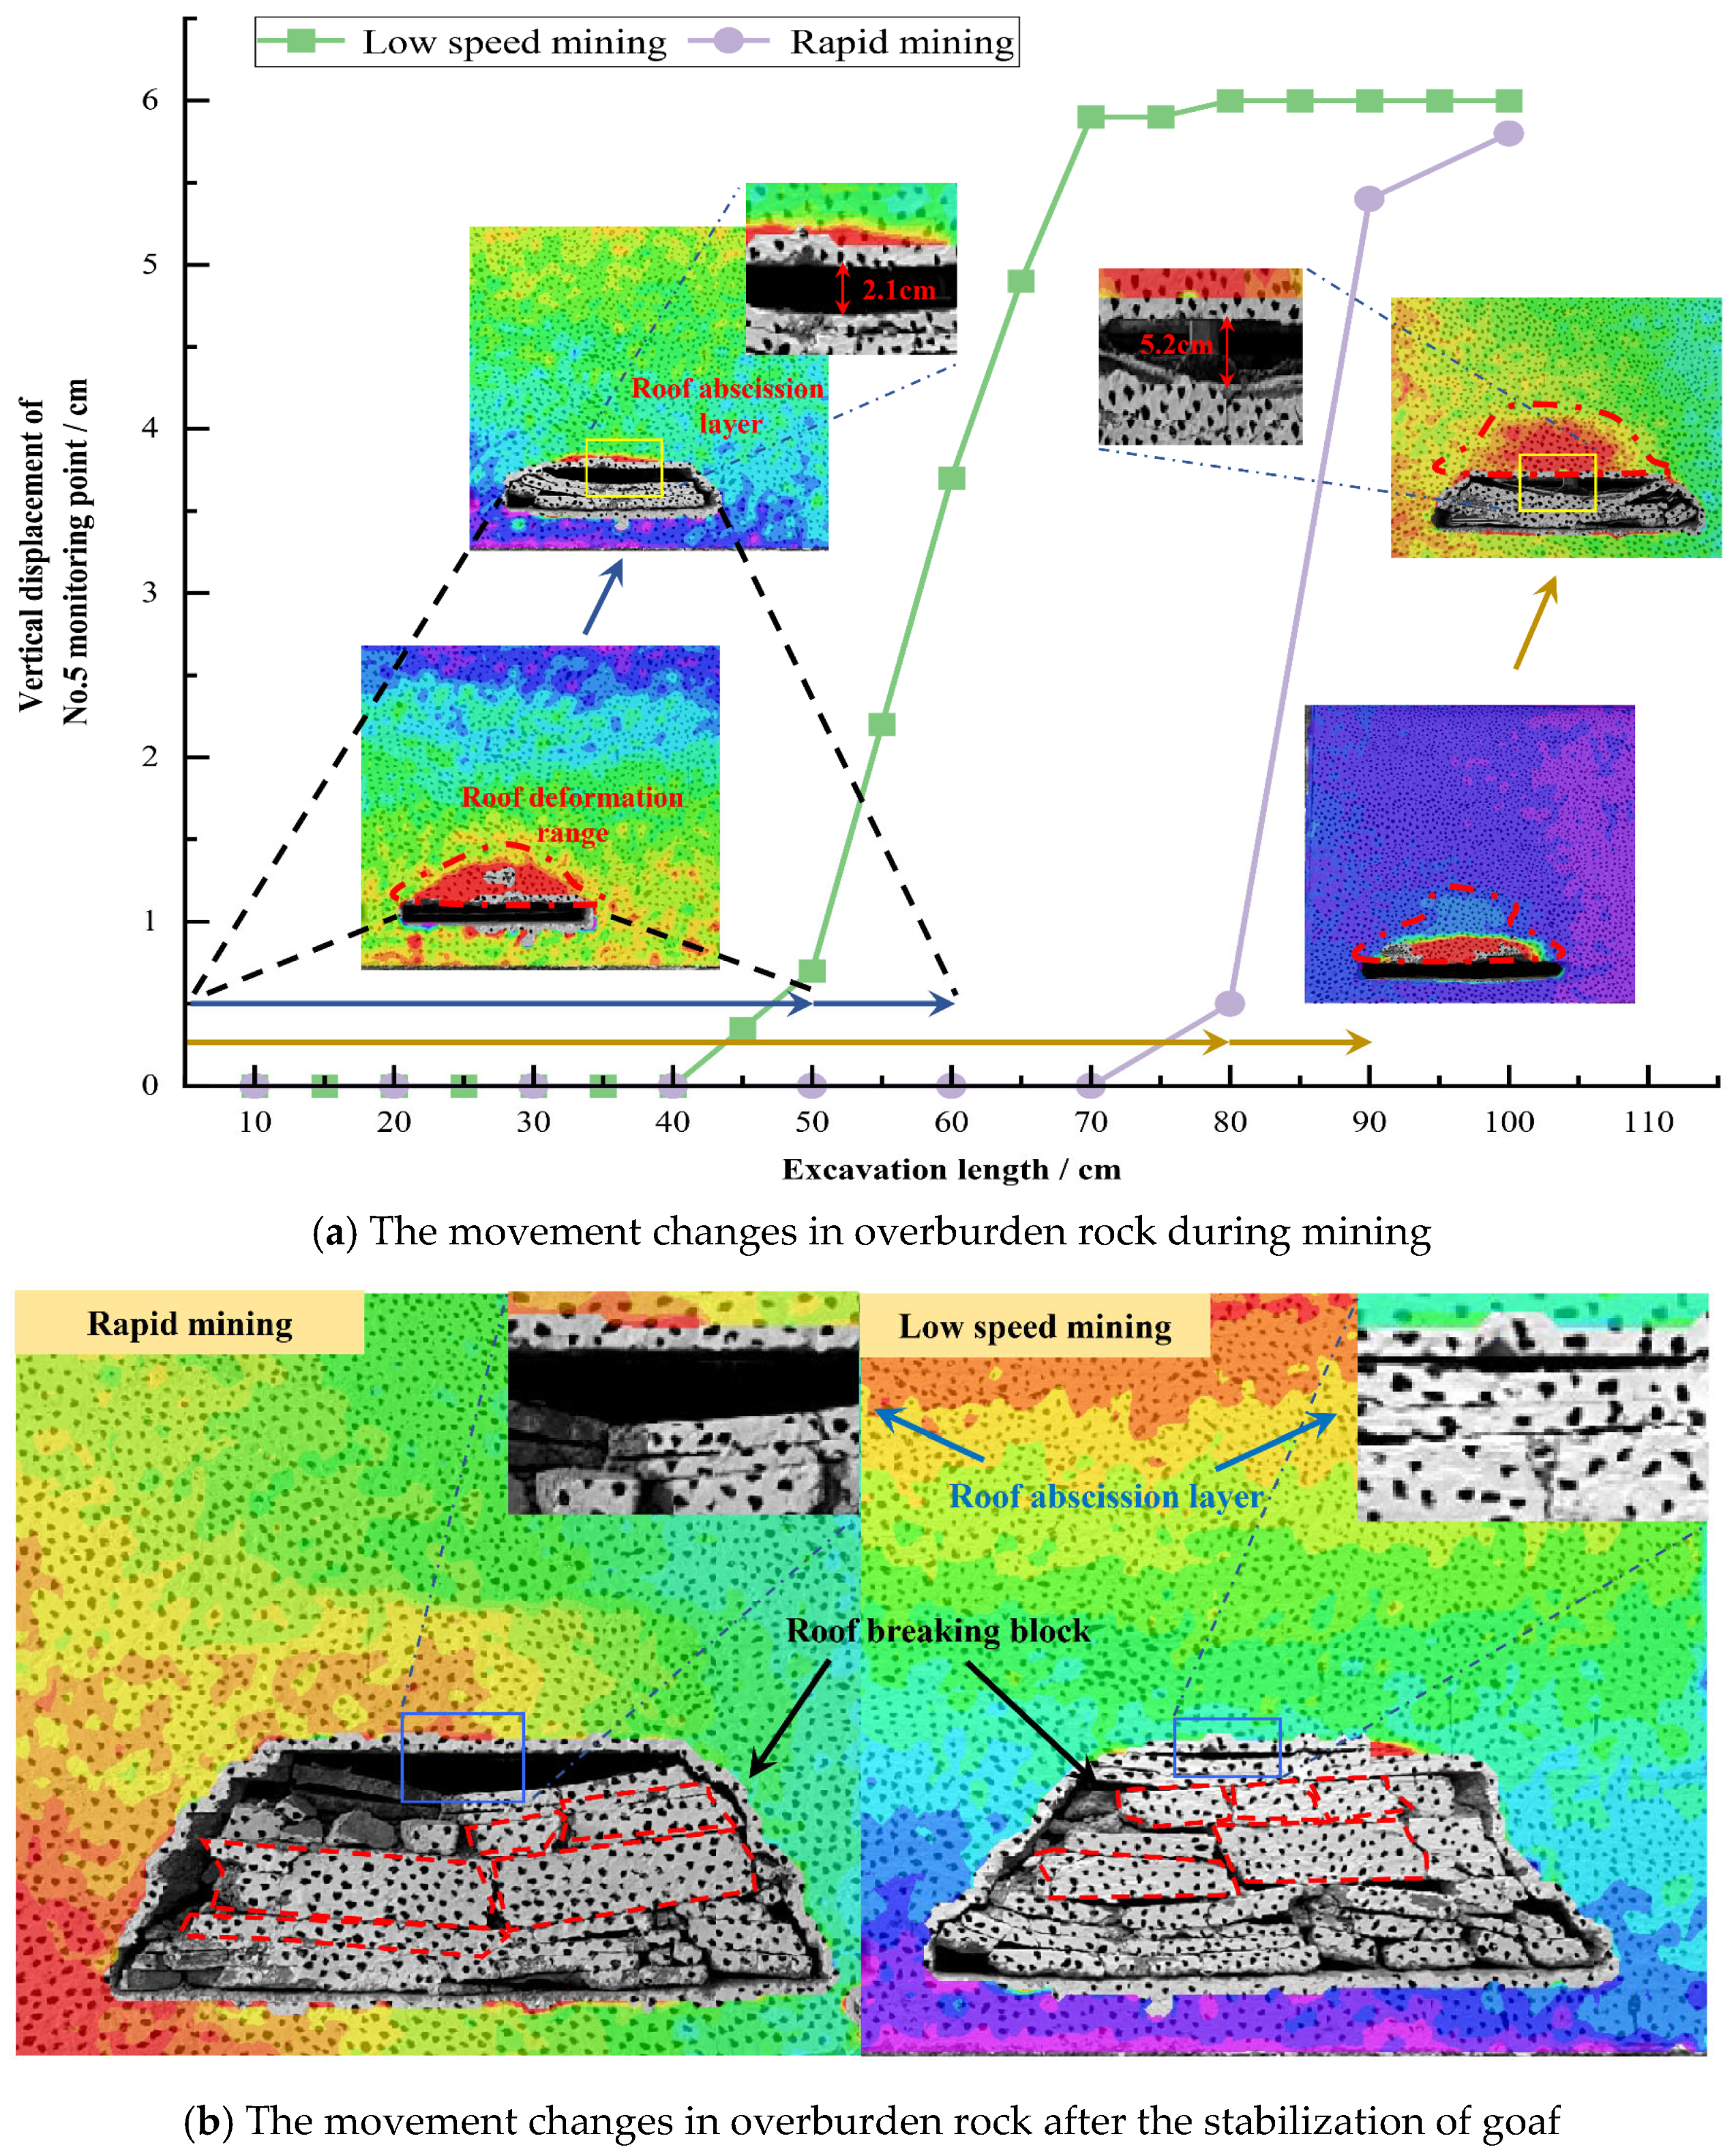
3.3. Analysis of Displacement Deformation of Overburden Rock under Different Mining Speed

The displacement observation results of the overlying strata on the third layer are shown in Figure 6. As shown in Figure 7a, when the rapid mining face is excavated to 80 cm, cracks and signs of collapse begin to appear at the top of the coal seam and reach 5.5 mm in the middle area of excavation up to 40 cm. In Figure 7b, as mining continues, the lower strata begin to collapse completely, and obvious separation areas appear between the middle and lower layers. When the excavation reaches the 90 cm median rock layer, collapse begins to occur, as shown in Figure 7c. According to Figure 7d, when the coal seam is fully excavated, the subsidence of the high-level rock layer is further reduced and no longer collapses, but obvious layering occurs.
This suggests that during the rapid mining of the working face, the overlying rock roof fractures in a timely manner, leading to a scenario where the upper strata can no longer support the weight of the rock layer, resulting in an overall collapse. The middle-level rock stratum starts to collapse into the space vacated by the low-level rock stratum and soon undergoes direct collapse as mining persists. The number of rock blocks is limited, and there is a significant separation from the upper rock stratum. In the case of the high-level strata, following the collapse of thin mudstone and fine sandstone layers, the primary strata remain unbroken.
Analysis of the displacement variation at monitoring points reveals that during rapid mining, the low rock strata above the coal seam experience a sudden, extensive concentration and significant roof subsidence, as shown in Figure 8. In contrast, the middle rock layer has fewer variations at its monitoring points, and and the numerical value of the displacement is relatively stable, aligning closely with the coal seam mining volume. For the high rock strata, the number of monitoring points is partially reduced, resulting in decreased rock strata subsidence.
The displacement observation of the overlying strata during low-speed mining is shown in Figure 9. As the low-speed mining face reaches 50 cm, cracks and signs of imminent collapse appear on the roof of the coal seam. As mining proceeds, the lower rock layers begin to descend in segments, and a small separation area appears between the middle and lower layers, as shown in Figure 9a,b. The number of collapsed rock blocks is quite considerable, indicating a pattern where the rock blocks gradually increase as the working face continues to be mined. This indicates that during the slow mining process of the working face, the roof of the overlying layer completely ruptured and sank by 5.4 cm, approaching the thickness of the coal seam. As illustrated in Figure 9c, when the coal seam was excavated to 80 cm, the middle layer of rock began to collapse. Due to the sufficient fragmentation and expansion of the rock layers, the subsidence of the middle rock layer is lower than that of the position rock layer, reaching 3 cm. After the coal seam was fully excavated, the high-level rock layer also began to sink, with a sinking amount of 1.1 cm, but only detachment occurred, and no overall rock block fracture occurred, as shown in Figure 9d.
During the low-speed mining process, the low rock strata above the coal seam change concurrently with the continuous mining of the working face, and the roof subsidence closely mirrors the mining height of the coal seam, as shown in Figure 10. The middle rock layer, however, has fewer monitoring points and exhibits a smaller numerical change compared to the low rock layer. In the case of the high rock strata, the number of monitoring points is reduced. The rock strata below them are fractured and expanded, resulting in minimal changes in the subsidence of the rock strata.
Comparing and analyzing the displacement changes at monitoring points during coal seam excavation at different mining speeds, as well as the deformation after the overburdened rock stabilizes at the end of mining, reveals distinct patterns. The vertical displacement changes in monitoring point 5 in the low-level rock layer were selected for analysis, as shown in Figure 11a. The initial caving step of the roof varies under different mining speeds. In low-speed mining, the roof began to show signs of sinking when excavated to 50 cm and broke when mined to 60 cm. While in rapid mining, the roof does not begin to sink until it reaches 80 cm and breaks at 90 cm. In the meantime, the impact range of roof subsidence during rapid mining is significantly larger than that of slow mining, and after the roof fractures and stabilizes, the separation amount between the low and medium rock layers during rapid mining is 5.2 cm, while the separation amount during slow mining is 2.1 cm. After the coal seam mining is completed and stabilized, the overlying rock morphology of the goaf varies at different mining speeds, as shown in Figure 11b. In rapid mining, the fragmentation of the overlying rock blocks results in a large block size, significant overall subsidence and, ultimately, a large separation space. When mining at a slow speed, the block size formed by the overlying rock is relatively small, and it is broken into blocks with little room for separation. This phenomenon can be attributed to the disruption of the stress balance of the roof during rapid mining of the working face. The deformation of the overlying strata is not adjusted in time, leading to an increase in the initial collapse step. Ultimately, the upper strata cannot bear the weight of the rock layers, leading to an overall collapse. This total collapse of the overlying rock means the deformation of the surrounding rock is not fully expanded, resulting in a large block of the collapsed rock mass and extensive separation of the roof of the high rock layer.
The digital speckle simulation analysis of the movement law of rock strata under different working face mining speeds reveals that as the mining speed increases, so too do the overburden caving speed, fracture block degree, and amount of roof separation. This observation confirms the assertion that the fracture distance of the stope increases in conjunction with the rise in mining speed.

4. Numerical Simulation of Influence of Mining Speed on Energy Release in Mining Field

4.1. Numerical Simulation and Scheme

The simulation employs borehole columnar data from the 2–2 coal seam in a mine located in Shaanxi Province. The 112201 fully mechanized mining face has a buried depth ranging from 313 to 400 m, and its overall trend aligns north–south. A numerical simulation model diagram is constructed based on these conditions. The working face extends 1047 m in strike and 200 m in dip, with a buried depth varying between 313 and 400 m. A three-dimensional model is established using Ansys, adhering to the geological conditions of the coal seam. The simulation encompasses a range of 400 m in length, 400 m in width, and 150 m in height. Figure 12 displays the model diagram, and Table 2 presents the mechanical parameters of the coal and rock mass.
In this calculation, the D–P yield criterion is employed to assess the failure of the rock mass [40,41,42]. Both sides and the bottom of the model are firmly constrained. The model’s bottom is restricted to vertical displacement, and a uniform load of 4.25 MPa, equivalent to the gravity of the overlying rock, is applied to the top of the model.
The model’s size and the node traversal unit program impose constraints; if the size division is overly dense, calculations can become exceedingly slow or even impractical. Given that the focus is on exploring the difference in elastic energy before and after each unit time step iteration, a differentiated approach to grid sizing is adopted. The coal seam unit close to the mining field employs a square grid with a 2 m edge length, while the rock layer situated farther from the coal seam uses a square grid with an 8 m edge length.
Utilizing the model’s equilibrium time step size for simulating the process of stress transfer and energy release can qualitatively delineate the temporal evolution of stress adjustment in actual mining activities [43,44,45,46]. This study examines the impact of mining speed on the elastic energy release in the mining field, considering two critical parameters: the single excavation amount and the balanced time step. The simulation scheme is articulated as follows: the single excavation amounts are designated as 5, 10, 15, and 20 m, respectively. Correspondingly, the single time steps are established at 300, 600, and 900 s, respectively. The total excavation amount is constrained to 40 m, resulting in continuous excavation times of 8, 4, and 2, respectively. The goaf size is maintained at 50 m in all scenarios.

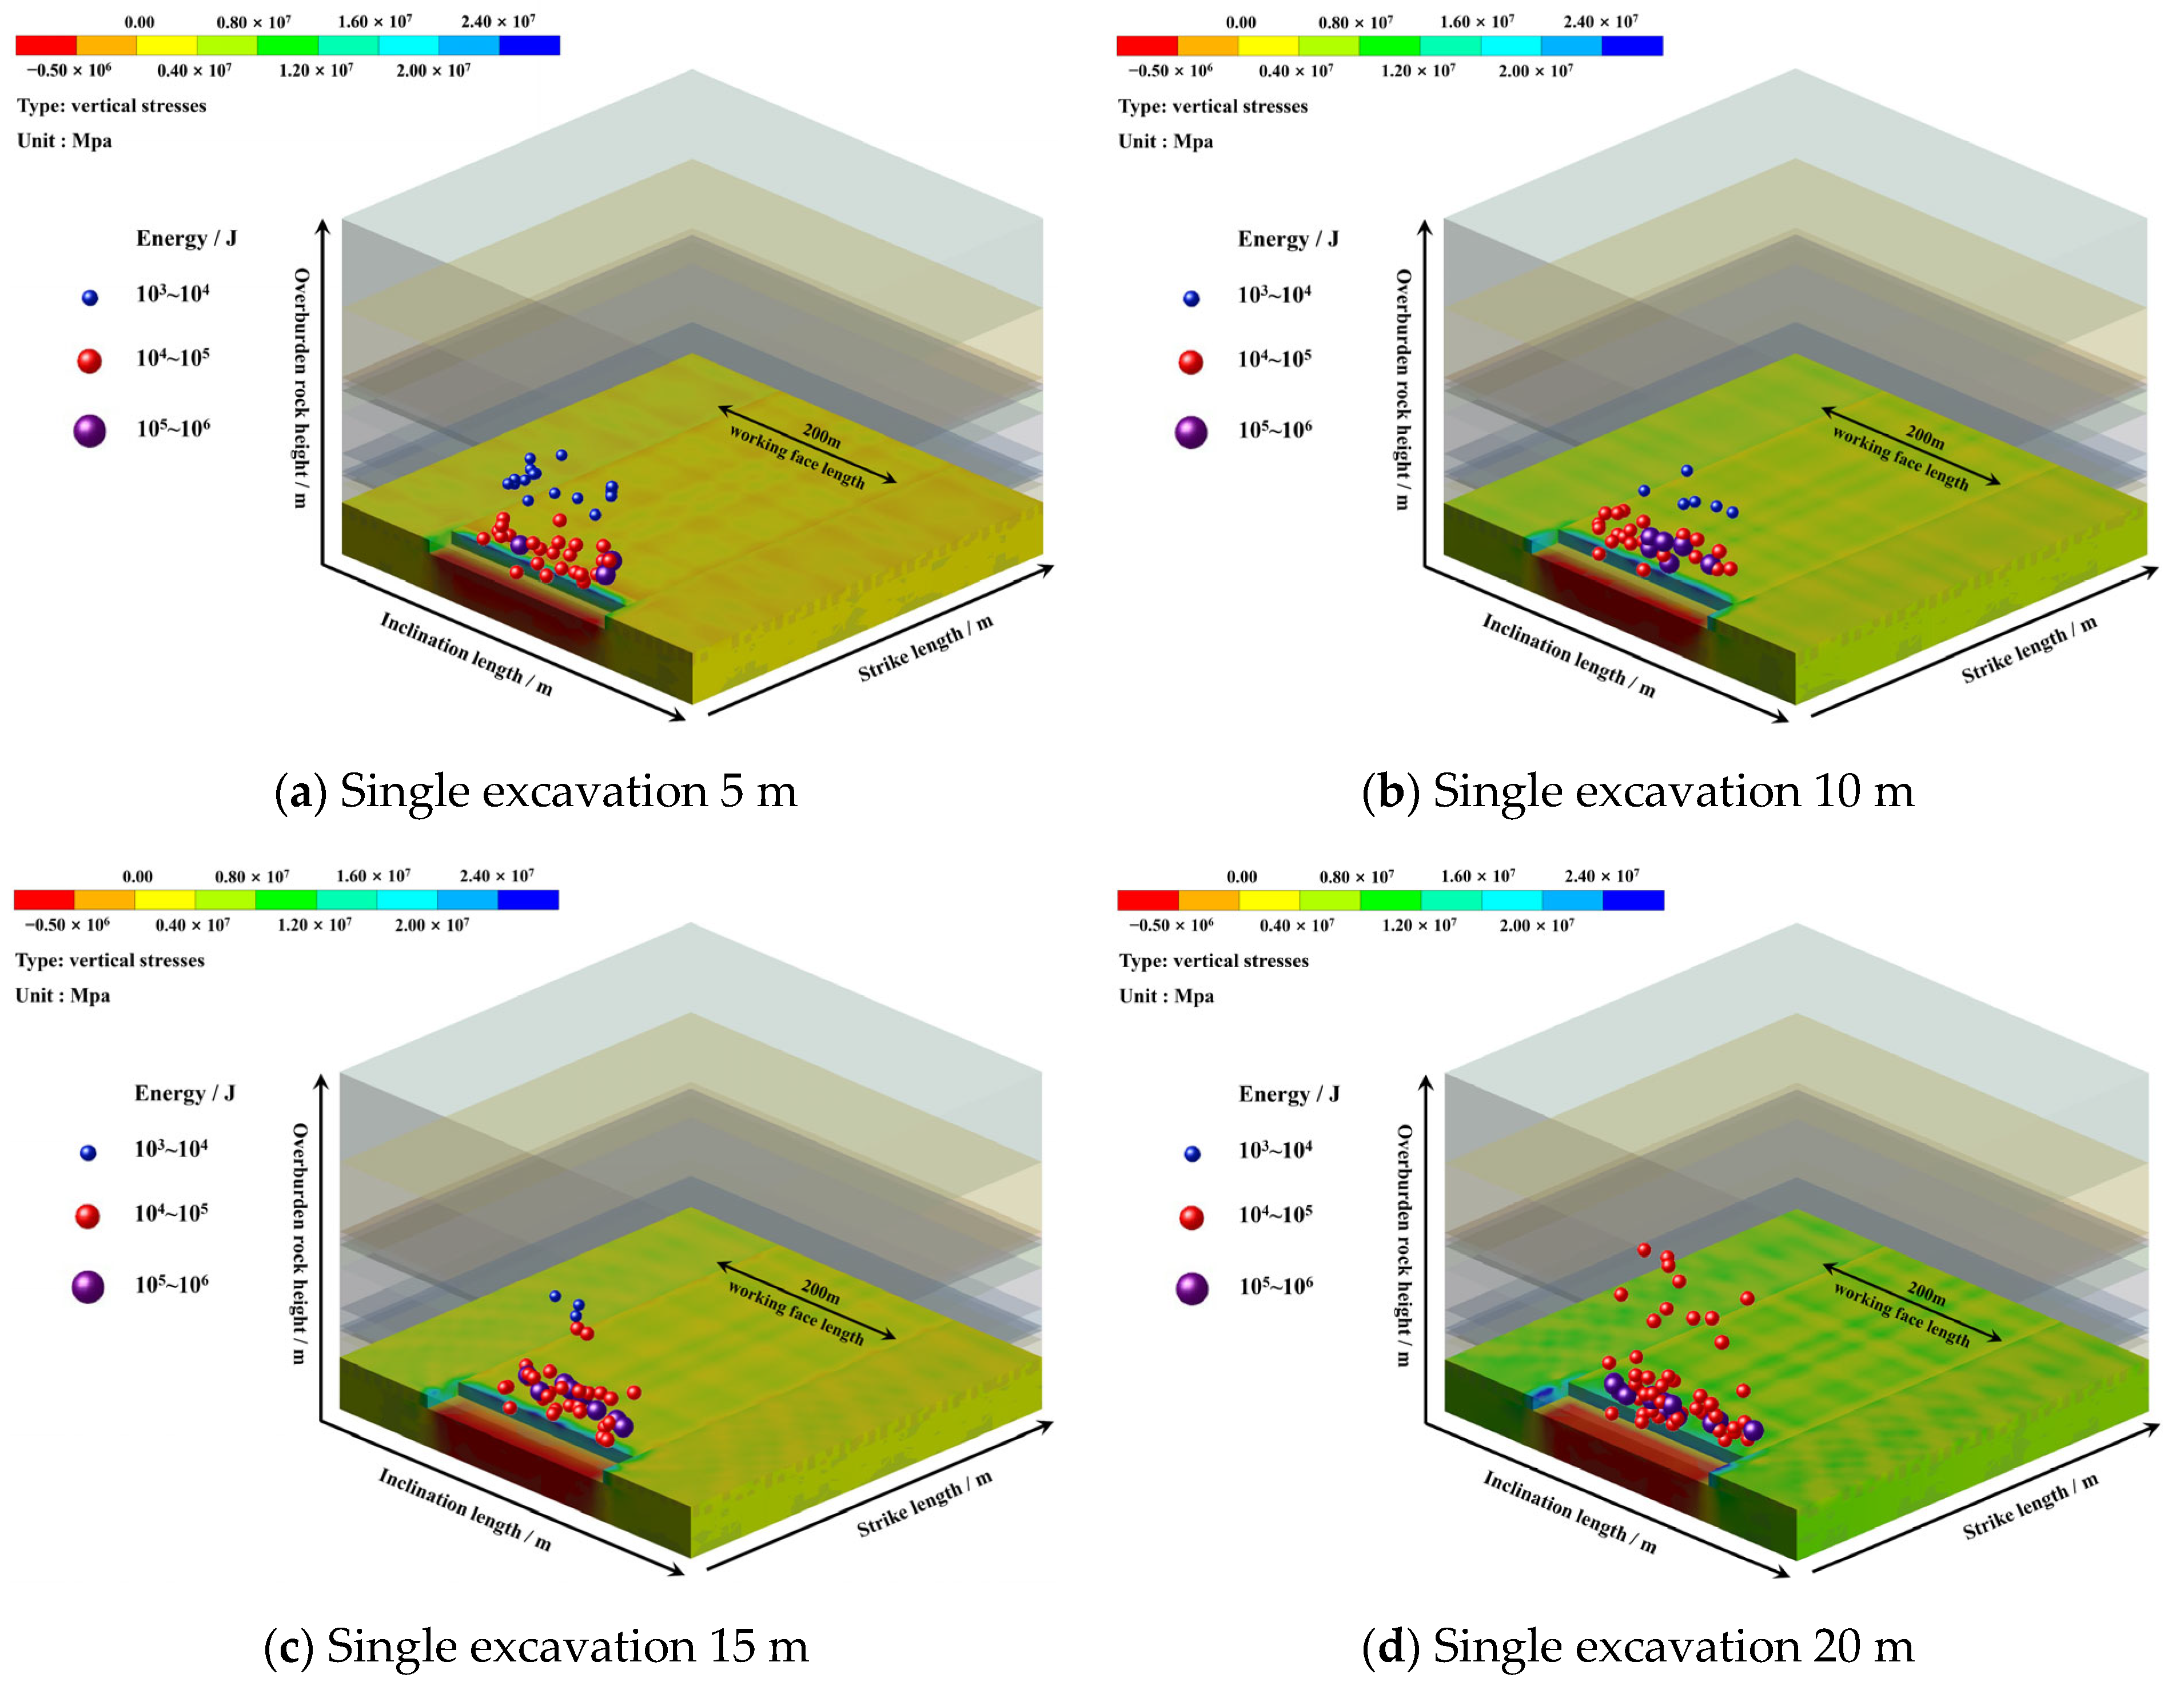
4.2. The Time Sequence Law of Different Energy Release at the Same Excavation Amount

Using a single excavation amount of 5 m and 600 time steps as an example, Figure 13 shows the relationship between the total energy and frequency with the equilibrium time step. The energy released by the overlying rock of the working face is greatest at the initial stage of the simulated excavation during a single equilibrium period. As excavation continues, this energy release first sharply increases and then gradually decreases. Similarly, the frequency of mine earthquakes initially rises and then falls, peaking around the 360 time step mark post-excavation. This pattern indicates the necessity for time adjustment to maintain the stability of the overlying rock of the working face. Energy is first monitored at the moment the overlying rock breaks, followed by continuous mine earthquake monitoring during the rock’s stable period.
Figure 14 illustrates the time series curves of the total energy and the total frequency of mine earthquakes during the process of continuous mining–balance–mining–balance with a single recovery of 5 m. The total energy and frequency released by the overlying strata of the working face exhibit a pattern of periodic fluctuations. In correlation with Figure 13, it is observable that for single time steps of 300 and 600, the total energy peak ascends in tandem with an increase in the recovery amount. Conversely, with a single time step of 900, the total energy peak diminishes as the recovery amount augments. Moreover, with a constant single recovery, a reduction in the single time step corresponds to a heightened total energy peak released by the stope.
Figure 15 depicts the distribution of the total energy and maximum energy released by the surrounding rock of the mining field, given a constant single time step. The curve representing the total energy of the model varies in response to different mining speeds. Specifically, the total energy peak value for a single excavation amount of 20 m is recorded at 9.8 × 10⁷ J. This value exceeds the energy releases measured at lower single excavation amounts: 9.6 × 10⁷ J for 15 m, 9.1 × 10⁷ J for 10 m, and 8.4 × 10⁷ J for 5 m. These observations indicate that, with a consistent time step, an increase in the single excavation amount results in a proportional augmentation of the total energy released per unit time step, with a particular emphasis on the peak value.
Figure 16 shows that the curve delineating the maximum energy of the model unit fluctuates in accordance with variations in mining speed. Under a constant single time step, the maximum elastic energy peak for a single excavation amount of 20 m is calculated to be 0.94 × 10⁶ J. This value surpasses the energy peaks associated with smaller excavation amounts: 0.7 × 10⁶ J at 15 m, 0.56 × 10⁶ J at 10 m, and 0.31 × 10⁶ J at 5 m. These data signify that curtailing the excavation amount per unit of time moderates the discharge of elastic energy from the surrounding rock, thereby mitigating the potential for impact disasters.
Figure 17 illustrates the evolution of elastic energy during the energy adjustment and balance process under various combinations of single excavation quantities and single time steps. Every five time steps, the figure records the maximum unit elastic energy event released post-energy adjustment, offering a representative view. The purple source ball indicates the highest energy level. Initially, the energy source is concentrated around the roof and floor of the mining area. As the single time step extends, the energy field transfers from near to far, and the elastic energy event progressively develops deeper into the roof. This pattern aligns with the energy transfer activity observed around the roof in actual mining fields.
The number of significant energy events increases with the size of the single excavation amount when the single time step remains constant. Conversely, with a fixed single excavation amount, a shorter single time step leads to more considerable energy events. This pattern indicates less extensive energy adjustment in the mining field from near to far, heightening the likelihood of energy accumulation or uneven release during continuous excavation.
An increase in mining speed correlates with a rise in the number of large-energy mine tremors released by the surrounding rock of the mining field. This increase propels a shift from low-energy mine tremors to high-energy ones, culminating in a higher proportion of large-energy mine tremors. Consequently, the energy accumulation area is positioned proximate to the mining field’s excavation area and faces challenges in transferring in-depth. In such instances where rapid, continuous excavation occurs, there is a heightened susceptibility for the concentrated release of energy within the mining field, engendering the onset of rock bursts.

5. Conclusions

Theoretical analysis of the masonry beam structure, created by the fracturing of overlying rock at the working face, has yielded an equation that delineates the influence of the rotation angle on both the fracture distance and the energy released. Accelerated mining operations cause a lack of sufficient subsidence in the overburdened rock, which in turn increases the rotation angle. This leads to the expansion of the fracture distance within the rock strata above the coal seam and an escalation in the energy discharged during fracturing. As a result, there is a heightened risk of impact-related disasters.
By employing the digital speckle method, a comparative study on the deformation and fracture speed of rock strata under different mining speeds was performed using a physical similarity model. The results show that during fast mining, the degree of fracture block formation in the overburdened rock and the extent of roof separation are significantly greater than those observed in slow mining scenarios. This empirical evidence solidifies the assertion that an increase in advancing speed leads to an expansion in the fracture distance of the stope, thereby establishing a positive correlation between mining speed and fracture distance.
Numerical simulation is utilized to compare the energy released from rock fracturing under various mining speeds. The findings demonstrate that the energy and the number of energy events associated with the breaking of overburdened rock during rapid mining surpass those recorded during slower mining operations. This supports the positive correlation between the advancing speed of the working face and the energy released. In particular, an increase in mining speed leads to a significant rise in the energy emitted by the fracturing of rock above the working face. This increase prompts a shift in the energy levels of mine earthquakes, resulting in an increased occurrence of high-energy mine earthquakes.

Author Contributions

Conceptualization, X.Y.; Methodology, X.Y.; Software, H.Z. (Hongchao Zhao) and S.Z.; Validation, X.Y.; Investigation, S.Z.; Resources, H.Z. (Huashan Zhao); Data curation, H.Z. (Huashan Zhao); Writing—original draft, X.Y.; Writing—review & editing, M.G. and H.Z. (Hongchao Zhao); Funding acquisition, X.Y. and M.G. All authors have read and agreed to the published version of the manuscript.

Funding

This research was funded by National Natural Science Foundation of China, grant number 51564044, and Ordinary University Graduate Student Scientific Research Innovation Projects of Jiangsu Province, grant number KYCX21_2364.

Institutional Review Board Statement

Not applicable.

Informed Consent Statement

Not applicable.

Data Availability Statement

The original contributions presented in the study are included in the article, further inquiries can be directed to the corresponding author.

Conflicts of Interest

Author Huashan Zhao was employed by the company Huating Coal Industry Group Co., Ltd. The remaining authors declare that the research was conducted in the absence of any commercial or financial relationships that could be construed as a potential conflict of interest.

References

  1. Yuan, L.; Jiang, Y.D.; He, X.Q.; Dou, L.M.; Zhao, Y.X.; Zhao, X.S.; Wang, K.; Yu, Q.; Lu, X.M.; Li, H.C. Research progress of precise risk accurate identification and monitoring early warning on typical dynamic disasters in coal mine society. J. China Coal Soc. 2018, 43, 306–318. [Google Scholar]
  2. Dou, L.M.; Bai, J.Z.; Li, X.W.; He, H. Study on prevention and control technology of rock burst disaster based on dynamic and static combined load. Coal Sci. Technol. 2018, 46, 1–8. [Google Scholar]
  3. Jiang, Y.D.; Zhao, Y.X. State of the art: Investigation on mechanism, forecast and control of coal bumps in China. Chin. J. Rock Mech. Eng. 2015, 31, 2188–2204. [Google Scholar]
  4. Zhang, Y. Design method for regional burst prevention in feasibility study stage of rock burst mines. Coal Eng. 2023, 55, 1–6. [Google Scholar]
  5. Zhou, T.; Zhang, G.N.; Zhou, G.F. Case study of extraction plan optimization based on quantitative rock burst risk assessment model. Coal Eng. 2023, 55, 8–13. [Google Scholar]
  6. Wu, X.S.; Cao, A.Y.; Mai, Q.L.; Xue, C.C.; Lu, Z.J. Research on Construction of Coal Mine Rock Burst Prevention System. Coal Technol. 2022, 41, 140–145. [Google Scholar]
  7. Wang, S.; Su, S.; Zhao, Q.; An, D.; Xiao, Y.; Xu, H. Study on the Support Effect of Energy-Absorbing Support Structure in the Coal Mine Roadway and the Synergic Effect with Wall Rock. Shock Vib. 2023, 2023, 13. [Google Scholar] [CrossRef]
  8. Song, Y.; Ren, H.; Xu, H.; Guo, X.; Chen, Z.; An, D. Study on Synergistic System of Energy-Absorbing Yielding Anti-Impact Supporting Structure and Surrounding Rock. Sci. Rep. 2022, 12, 594. [Google Scholar] [CrossRef]
  9. Ju, W.J.; Yang, H.Z.; Fu, Y.K.; Jiao, J.K.; Li, Z.W.; Sun, L.W. Development and prospect of supporting technology in coal mine rock burst roadway. Coal Eng. 2022, 54, 1–6. [Google Scholar]
  10. Xu, L.; Lu, K.; Pan, Y.; Qin, Z. Study on rock burst characteristics of coal mine roadway in China. Energy Sources Part A Recovery Util. Environ. Eff. 2022, 44, 3016–3035. [Google Scholar] [CrossRef]
  11. Faisal, W.M.; Guo, S.F.; Qi, S.W. A Comprehensive Review of Mechanisms, Predictive Techniques, and Control Strategies of Rock burst. Appl. Sci. 2023, 13, 3950. [Google Scholar] [CrossRef]
  12. Liu, H.; Yu, B.; Liu, J.; Wang, T. Investigation of impact rock burst induced by energy released from hard rock fractures. Arab. J. Geosci. 2019, 12, 381. [Google Scholar] [CrossRef]
  13. Li, J.; Zhou, W.; Chu, J.; Ren, W.; Dou, L.; Song, S. Energy Transfer and Destabilizing Impulse Inducing Mechanism of Coal–Rock System in Roadway through Coal Seam in Deep Zone. Fractal Fract. 2023, 7, 550. [Google Scholar] [CrossRef]
  14. Guo, W.; Li, Y.; Yin, D.; Zhang, S.; Sun, X. Mechanisms of rock burst in hard and thick upper strata and rock-burst controlling technology. Arab. J. Geosci. 2016, 9, 561. [Google Scholar] [CrossRef]
  15. Lyu, P.F.; Geng, Y.J. Unified Mechanism of Rock Burst Induced by Coal Mine Earthquake and Its Activity and Response Characteristics. Shock Vib. 2023, 2023, 2145765. [Google Scholar] [CrossRef]
  16. He, J.; Dou, L.M. Gradient principle of horizontal stress inducing rock burst in coal mine. J. Cent. South Univ. 2012, 19, 2926–2932. [Google Scholar] [CrossRef]
  17. Shi, J.J.; Meng, X.R.; Chen, Z.L.; Dong, Y. Study on occurrence mechanism and reinforcement technology of rock burst under super thick conglomerate. J. Saf. Sci. Technol. 2017, 13, 118–124. [Google Scholar]
  18. Wang, E.Y.; Feng, J.J.; Kong, X.G.; Liu, X.F.; Shen, R.X. A hard roof fracture source model and its far-field seismic impact by stress wave. J. Min. Saf. Eng. 2018, 35, 787–794. [Google Scholar]
  19. Ding, K.; Wang, L.; Yu, M.; Wang, W.; Ren, B. Study on Microseismic Monitoring, Early Warning, and Comprehensive Prevention of a Rock Burst under Complex Conditions. Shock Vib. 2020, 2020, 8863771. [Google Scholar] [CrossRef]
  20. Zhang, X.R.; He, G.Z.; Liu, J.G. Relationship Between Working Face Mining Speed and Microseismic Responsein Deep Well Structural Area of Shanxian Coalfield. Shandong Coal Sci. Technol. 2022, 40, 145–148. [Google Scholar]
  21. Zhao, B.H.; Li, B.; Li, Y.J.; He, H. Study on advancing speed of dangerous working face under coal pillar near fault. Energy Technol. Manag. 2022, 47, 1–3. [Google Scholar]
  22. Zhao, T.B.; Guo, W.Y.; Han, F.; Gu, S.T. Analysis on energy accumulation and release of roof under influence of mining speed. Coal Sci. Technol. 2018, 46, 37–44. [Google Scholar]
  23. Zhang, H.W.; Li, Y.P.; Chen, Y.; Zhu, F.; Shao, L.F. Study on safety pushing forward speed of island coal mining face under hard roof and hard seam and hard floor conditions. Coal Sci. Technol. 2017, 45, 6–11. [Google Scholar]
  24. Yang, J.H.; Sun, S.L.; Kong, D.Z. Effect of working face length and advancing speed on strata behaviors in high-intensity mining. Rock Soil Mech. 2015, 36, 333–339+350. [Google Scholar]
  25. Lyu, P.F.; Bao, X.Y.; Dong, H.J. Research on influence of microseismic activity by working face mining in coal mine. China Min. Mag. 2020, 29, 120–125. [Google Scholar]
  26. Cui, F.; Yang, Y.; Lai, X.; Jia, C.; Shan, P. Experimental Study on the Effect of Advancing Speed and Stoping Time on the Energy Release of Overburden in an Upward Mining Coal Working Face with a Hard Roof. Sustainability 2020, 12, 37. [Google Scholar] [CrossRef]
  27. Yang, S.L.; Wang, Z.H.; Jiang, W.; Yang, J.H. Advancing rate effect on rock and coal failure format in high intensity mining face. J. China Coal Soc. 2016, 41, 586–594. [Google Scholar]
  28. Yan, X.L. Study on the influence of mining speed on mine earthquake disaster in fully mechanized caving face of deep well. J. Saf. Environ. 2014, 14, 19–22. [Google Scholar]
  29. Xie, G.X.; Chang, J.C.; Hua, X.Z. Influence of mining velocity on mechanical characteristics of surrounding rock in fully mechanized top-coal caving face. Chin. J. Geotech. Eng. 2009, 29, 963–967. [Google Scholar]
  30. Jia, C.; Lai, X.; Cui, F.; Feng, G.; He, S.; Gao, Y.; Tian, M. Study on Multisize Effect of Mining Influence of Advance Speed in Steeply Inclined Extrathick Coal Seam. Lithosphere 2022, 2022, 9775460. [Google Scholar] [CrossRef]
  31. Tao, W.G.; Jiang, X.Y. Simulation Study on Stress Field Change of Island Working Face under Different Push Mining Velocity. Shandong Coal Sci. Technol. 2020, 2020, 156–158+163. [Google Scholar]
  32. Ren, S.Q. Influence of Mining Speed on Mine Pressure in Working Face and Stability of Mining Roadway. Saf. Coal Mines 2018, 49, 234–238. [Google Scholar]
  33. Gao, X.X.; Shi, X.Y.; Guo, W.B. Case Study on the Mechanism of Influence of Stoppage on Ground Pressure under Different Rates of Advance. Adv. Civ. Eng. 2021, 2021, 5574693. [Google Scholar] [CrossRef]
  34. Jiang, Y.D.; Li, H.T.; Zhao, Y.X.; Zhou, K. Effect of loading rate on energy accumulation and dissipation in rocks. J. China Univ. Min. Technol. 2014, 43, 369–373. [Google Scholar]
  35. Wang, X.B.; Gu, L.; Ma, B.; Lv, J.Q. A Frequency-energy method to determine the hazard faults among faults and numerical simulation. Prog. Geophys. 2013, 28, 2739–2747. [Google Scholar]
  36. Cai, W. Fault Rock Burst Induced by Static and Dynamic Loads Superposition and Its Monitoring and Warning. Ph.D. Thesis, China University of Mining and Technology, Xuzhou, China, 2015. [Google Scholar]
  37. Li, Y.; Yang, T.H.; Hao, N.; Song, W.D.; Fu, J.X.; Yu, L. Mining rate effect of high-intensity working face based on stress release rate and microseismic monitoring. J. Min. Saf. Eng. 2021, 38, 295–303. [Google Scholar]
  38. Wang, Q.; Ren, Z.; Bai, Q.; Li, Q. Characterizing the effect of longwall retreating speeds on overburden and surface synergistic subsidence behaviors with a thick coal seam: Intensive field measurements. J. Geophys. Eng. 2024, 21, 169–183. [Google Scholar] [CrossRef]
  39. Qian, M.G.; Shi, P.W.; Xu, J.L. Ground Pressure and Strata Control; China University of Mining and Technology: Xuzhou, China, 2010. [Google Scholar]
  40. Itasca Consulting Group Inc. FLAC3D Users’ Manual; Itasca Consulting Group Inc.: Minneapolis, MN, USA, 2005. [Google Scholar]
  41. Yin, Q.; Wu, J.; Zhu, C.; He, M.; Meng, Q.; Jing, H. Shear mechanical responses of sandstone exposed to high temperature under constant normal stiffness boundary conditions. Geomech. Geophys. Geoenergy Georesources 2021, 7, 1–17. [Google Scholar] [CrossRef]
  42. Zhu, C.; Karakus, M.; He, M.; Meng, Q.; Shang, J.; Wang, Y.; Yin, Q. Volumetric deformation and damage evolution of Tibet interbedded skarn under multistage constant-amplitude-cyclic loading. Int. J. Rock Mech. Min. Sci. 2022, 152, 105066. [Google Scholar] [CrossRef]
  43. Feng, L.F.; Dou, L.M.; Wang, X.D.; Jin, D.W.; Cai, W.; Xu, G.G.; Jiao, B. Mechanism of mining advance speed on energy release from hard roof movement. J. China Coal Soc. 2019, 44, 3329–3339. [Google Scholar]
  44. Zhang, Z.Z.; Gao, F. Experimental investigation on the energy evolution of dry and water-saturated red sandstones. Int. J. Min. Sci. Technol. 2015, 25, 383–388. [Google Scholar] [CrossRef]
  45. Ren, F.Q.; Zhu, C.; He, M.C. Moment tensor analysis of acoustic emissions for cracking mechanisms during schist strain burst. Rock Mech. Rock Eng. 2020, 53, 153–170. [Google Scholar] [CrossRef]
  46. Wang, S.W.; Ju, W.J.; Pan, J.F.; Lu, C. Mechanism of energy partition evolution of excavation roadway rock burst in coal seam under tectonic stress field. J. China Coal Soc. 2019, 44, 2000–2010. [Google Scholar]
Figure 1. The figure shows the fracture types of a voussoir beam.
Applsci 14 03222 g001
Figure 2. The figure shows a simplified mechanical model of rock block A.
Applsci 14 03222 g002
Figure 3. The figure shows the laying process for the physical similarity models.
Applsci 14 03222 g003
Figure 4. The figure shows speckle monitoring diagram of the physical similarity model.
Applsci 14 03222 g004
Figure 5. The figure shows the change in overburden breaking velocity under the conditions of rapid mining.
Applsci 14 03222 g005
Figure 6. The figure shows the changes in the fracture velocity of the overlying strata under low-speed mining conditions.
Applsci 14 03222 g006
Figure 7. The figure shows the deformation characteristics of the overlying strata under rapid mining conditions.
Applsci 14 03222 g007
Figure 8. The figure shows the vertical displacement changes in the rock strata under rapid mining conditions.
Applsci 14 03222 g008
Figure 9. The figure shows the deformation characteristics of the overlying strata under low-speed mining conditions.
Applsci 14 03222 g009
Figure 10. The figure shows the vertical displacement changes in the rock stratum under low-speed mining conditions.
Applsci 14 03222 g010
Figure 11. The figure shows a comparison of overlying strata movement changes under different mining speeds.
Applsci 14 03222 g011
Figure 12. The figure shows a three-dimensional geological model.
Applsci 14 03222 g012
Figure 13. The figure shows the changes in total energy and frequency with equilibrium time step.
Applsci 14 03222 g013
Figure 14. The figure shows the variation in total energy peak during continuous excavation.
Applsci 14 03222 g014
Figure 15. The figure shows the time series distributions of total energy under different excavation quantities.
Applsci 14 03222 g015
Figure 16. The figure shows the time series distributions of maximum energy under different excavation quantities.
Applsci 14 03222 g016
Figure 17. The figure shows the spatial distribution of maximum energy of element under different excavation quantities.
Applsci 14 03222 g017
Table 1. The table shows the working face physical model rock layer setting and similar material ratio scheme.
LevelRockThickness of Stratum/mModel/mmRatio Number
(Sand/Calcium Carbonate/Gypsum)
Water Distribution Ratio
17Water distribution ratio5267:6:41/9
16Mudstone241197:8:21/9
15Medium sandstone291456:7:31/7
14Mudstone391967:8:21/9
13Water distribution ratio341727:6:41/9
12Mudstone14727:8:21/9
11Medium sandstone311556:7:31/7
10Water distribution ratio3157:6:41/9
9Mudstone3137:8:21/9
8Medium sandstone10486:7:31/7
7Siltstone18908:3:71/7
6Water distribution ratio8407:6:41/9
5Mudstone2107:8:21/9
4Medium sandstone4206:7:31/7
3Water distribution ratio8417:6:41/9
2Coal6318:3:71/9
1Water distribution ratio17727:6:41/9
Table 2. The table shows the mechanical parameters of coal and rock mass.
RockThickness/mVolumetric Weight/
g/cm3
Elastic Modulus/
GPa
Poisson RatioCohesion
/MPa
Friction Angle/°Tensile Strength/MPa
Siltstone4.22.3627.020.192.938.651.44
Fine sandstone13.52.3616.530.232.530.561.2
Mudstone10.712.4223.160.22.8538.881.41
Medium sandstone35.292.2824.030.182.2635.141.22
Fine sandstone3.372.3819.180.212.2435.491.33
Coal61.339.520.210.9937.410.5
Fine sandstone52.3819.180.212.2435.491.33
Disclaimer/Publisher’s Note: The statements, opinions and data contained in all publications are solely those of the individual author(s) and contributor(s) and not of MDPI and/or the editor(s). MDPI and/or the editor(s) disclaim responsibility for any injury to people or property resulting from any ideas, methods, instructions or products referred to in the content.

