Abstract
This study investigates the structural performance of assembled rib-plate bridge abutments (ARBAs) with two different connection methods: bull leg bolt and flange connections. In addition, we explored the bending and shear performance of the connection parts and related areas to assess the damage characteristics and modes of these ARBAs. Utilizing model testing, a numerical analysis was conducted to define the force performance of the ARBA, with reference to a cast-in-place rib-plate abutment. The research results indicate that the bearing capacity and deformation capacity of the cap part of the assembled ribbed slab abutment model with cow leg connections are lower than those of the cast-in-place structure. When the structure fails, a 45° diagonal crack develops from the cross-section at the mid-span joint to the connection between the rib slab and the cap, until the concrete protective layer at the joint is crushed, exhibiting a shear failure mode. The bearing capacity of the assembly rib plate type abutment cap connected by the flange plate is basically the same as that of the cast-in-place structure, and the deformation capacity is weaker than that of the cast-in-place rib plate type abutment. The expansion of structural cracks is consistent with that of the rib plate type abutment connected by the cow leg. When the flange plate at the mid span is damaged, the contact surface between the flange plate and the concrete is pried off, resulting in the inability of the structure to continue bearing, exhibiting a shear failure mode. Through numerical simulation, taking the stress performance of the integral cast-in-place ribbed slab abutment as a reference, the assembled ribbed slab abutment connected by the flange plate is basically consistent with the integral cast-in-place ribbed slab abutment in terms of ultimate load, concrete damage, and steel reinforcement skeleton stress, and the connection device has not yet reached the yield state. The ultimate displacement is slightly weaker than that of the integral cast-in-place ribbed slab abutment. By comparison, it can be seen that the ultimate bearing capacity of the assembled ribbed slab abutment connected by the flange is basically the same as that of the cast-in-place ribbed slab abutment, and the stress performance can reach an “equivalent cast-in-place”, making it the preferred solution for the assembled abutment structure. The finite element parameter analysis of the flanged ARBA revealed that the thickness of the stiffening ribs, the number of bolts, and length of the flange plate anchoring steel plate were proportional to the ultimate load-bearing capacity of the prefabricated ARBA. In the case of no change in the structural damage mode, considering the economic benefits and load-bearing capacity of the structure, the following parameter combinations of the flanged ARBA are recommended: a thickness of 30 mm of the stiffening ribs, the number of bolts is 12, and a length of 50 cm of the length of flange plate anchoring steel plate.
1. Introduction
The prefabricated assembly technology for bridges represents a significant advancement in construction methodology. It involves the factory-based prefabrication of bridge components, which are subsequently transported to the construction site for assembly via appropriate transportation modes. This approach eliminates the need for on-site mold casting, minimizes traffic disruptions, reduces construction timelines, and curbs and reduces dust pollution [1,2,3,4]. Despite the long history of bridge prefabrication assembly technology development and its related research, it is evident that assembly bridges are still in the early stages of development, particularly in terms of the design, construction, and associated technologies of fully pre-fabricated assembly bridges. Current engineering practices regarding research and construction related to prefabricated assembled bridges have primarily focused on bridge superstructures and piers, with the prefabrication of abutments being comparatively less common. At present, the connection methods of prefabricated structures can be divided into three kinds: “dry connection”, “wet connection”, and “glue joint”. “Wet connection” is generally used to splice components by means of slurry anchor connection and grouting sleeve. This connection method has better structural durability and integrity, but it involves more wet construction and generally has a longer construction period. “Dry connection” is generally used to splice components with less wet work such as bolt connection and welding connection. This connection method has the advantages of a short construction period and high degree of component assembly. However, the gap between prefabricated components can easily cause the corrosion of connectors and poor structural durability. “Glue joints” are generally connected by coating epoxy resin on the contact surface of prefabricated components. Epoxy resin has a strong bonding ability with concrete, can effectively transfer the load, and has good toughness, fatigue resistance, and impact resistance. However, the construction technology is high, the bonding quality is unstable, and there are aging problems. Notably, according to the existing literature [5,6,7,8,9,10,11,12,13,14,15,16,17,18], as demonstrated in various examples, most of the connections of assembled bridge abutments are constructed by establishing grouted joints between each prefabricated component, a process that entails pouring the joints after positioning and installation (referred to as wet joints). Alternatively, connections may involve setting H-beam piles, welding components together (dry joints), or linking components using prestressing tendons after assembly. In some cases, joints are further secured with epoxy resin, followed by additional grouting at the joints (prestressing joints + adhesive joints + wet joints). Some scholars, drawing from these examples and employing experimental and numerical analysis methods, have proposed a prefabricated assembled bridge abutment connection method for conducting a preliminary study. Their results revealed that table cap H-type steel piles effectively reduced shear damage, while significantly improving the compressive performance of the bridge, but the H-shaped steel pile requires high precision for positioning, the quality of welding cannot be guaranteed, and the weld position is prone to rust [19,20,21,22]. Utilizing the prestressing tendon connections in assembled abutments provides an improved load-bearing capacity to meet the requirements of a seismic design, but the prestressed bar connection requires high precision and complicated process. The results show that this connection method is suitable for the longitudinal load distribution of prefabricated abutments, but it does not consider the weak position of the structure and has too many joints. However, in comparison to well-established prefabricated assembly technology for upper- and lower-bridge abutments, theoretical research on assembled bridge abutments, both domestically and internationally, lags considerably behind. It is necessary to study the mechanical performance of assembled abutment.
This study focuses on the assembled rib-plate bridge abutments (ARBAs) as its primary research subject. It involves the design of two ARBA variations: cow leg bolt connection and flange plate connection, the lower part of the assembled ribbed abutment is of a socketed design, while the upper part of the abutment is split for the location of the caps according to the number of ribs. Experimental investigations into the bending and shear performance of joint components and related areas was based on two types of splitting modes to assess the damage characteristics and modes of the ARBA. Subsequently, a non-linear finite element (FE) model was established using FE analysis software (ABAQUS 2022), aimed at devising a sound simulation method for the ARBA and evaluating the overall force performance of the ARBA. Furthermore, parametric analysis was employed to investigate the influence of factors such as the thickness of the flange stiffening ribs, the number of bolts, and length of the flange plate anchoring steel plateon, the structural stress performance of ARBA.
2. Static Load Test of Assembled Ribbed-Slab Abutment Model
2.1. Summary of Tests
Bridge abutments are critical structures located at both ends of a bridge, serving to connect to the roadbed, support the superstructure, and withstand the lateral pressure from the bridge deck. The abutment cap, in particular, plays a vital role in supporting the superstructure, distributing the upper load, and transferring it to the underlying foundation. The static load test employed herein aimed to assess the bending and shear performance of the assembled ribbed-plate bridge deck cap connection components and related areas. This approach was employed since the lower socket connection exerted less influence. Accordingly, the bending and shear tests did not consider the influence of the lower socket connection. Specifically, the bending test was designed to produce the three specimen models of ribbed-plate bridge deck splice caps. The cast-in-place bridge model (XJ1) was set as the control group, while the experimental groups comprised the ox-leg bolt rib-plate abutment model (NT2) and the flange connection rib-plate abutment model (FLP3). In addition, the longitudinal shear test was conducted based on the same specimen exchange encompassing different grades of bolts to investigate the shear performance of the structure. The models included the ordinary bolt flange connection rib-plate abutment shear model (FLP4-1), the flange connection rib-plate abutment shear model (FLP4-2), and high strength bolt variants.
2.2. Bending Test of Assembled Ribbed-Abutment
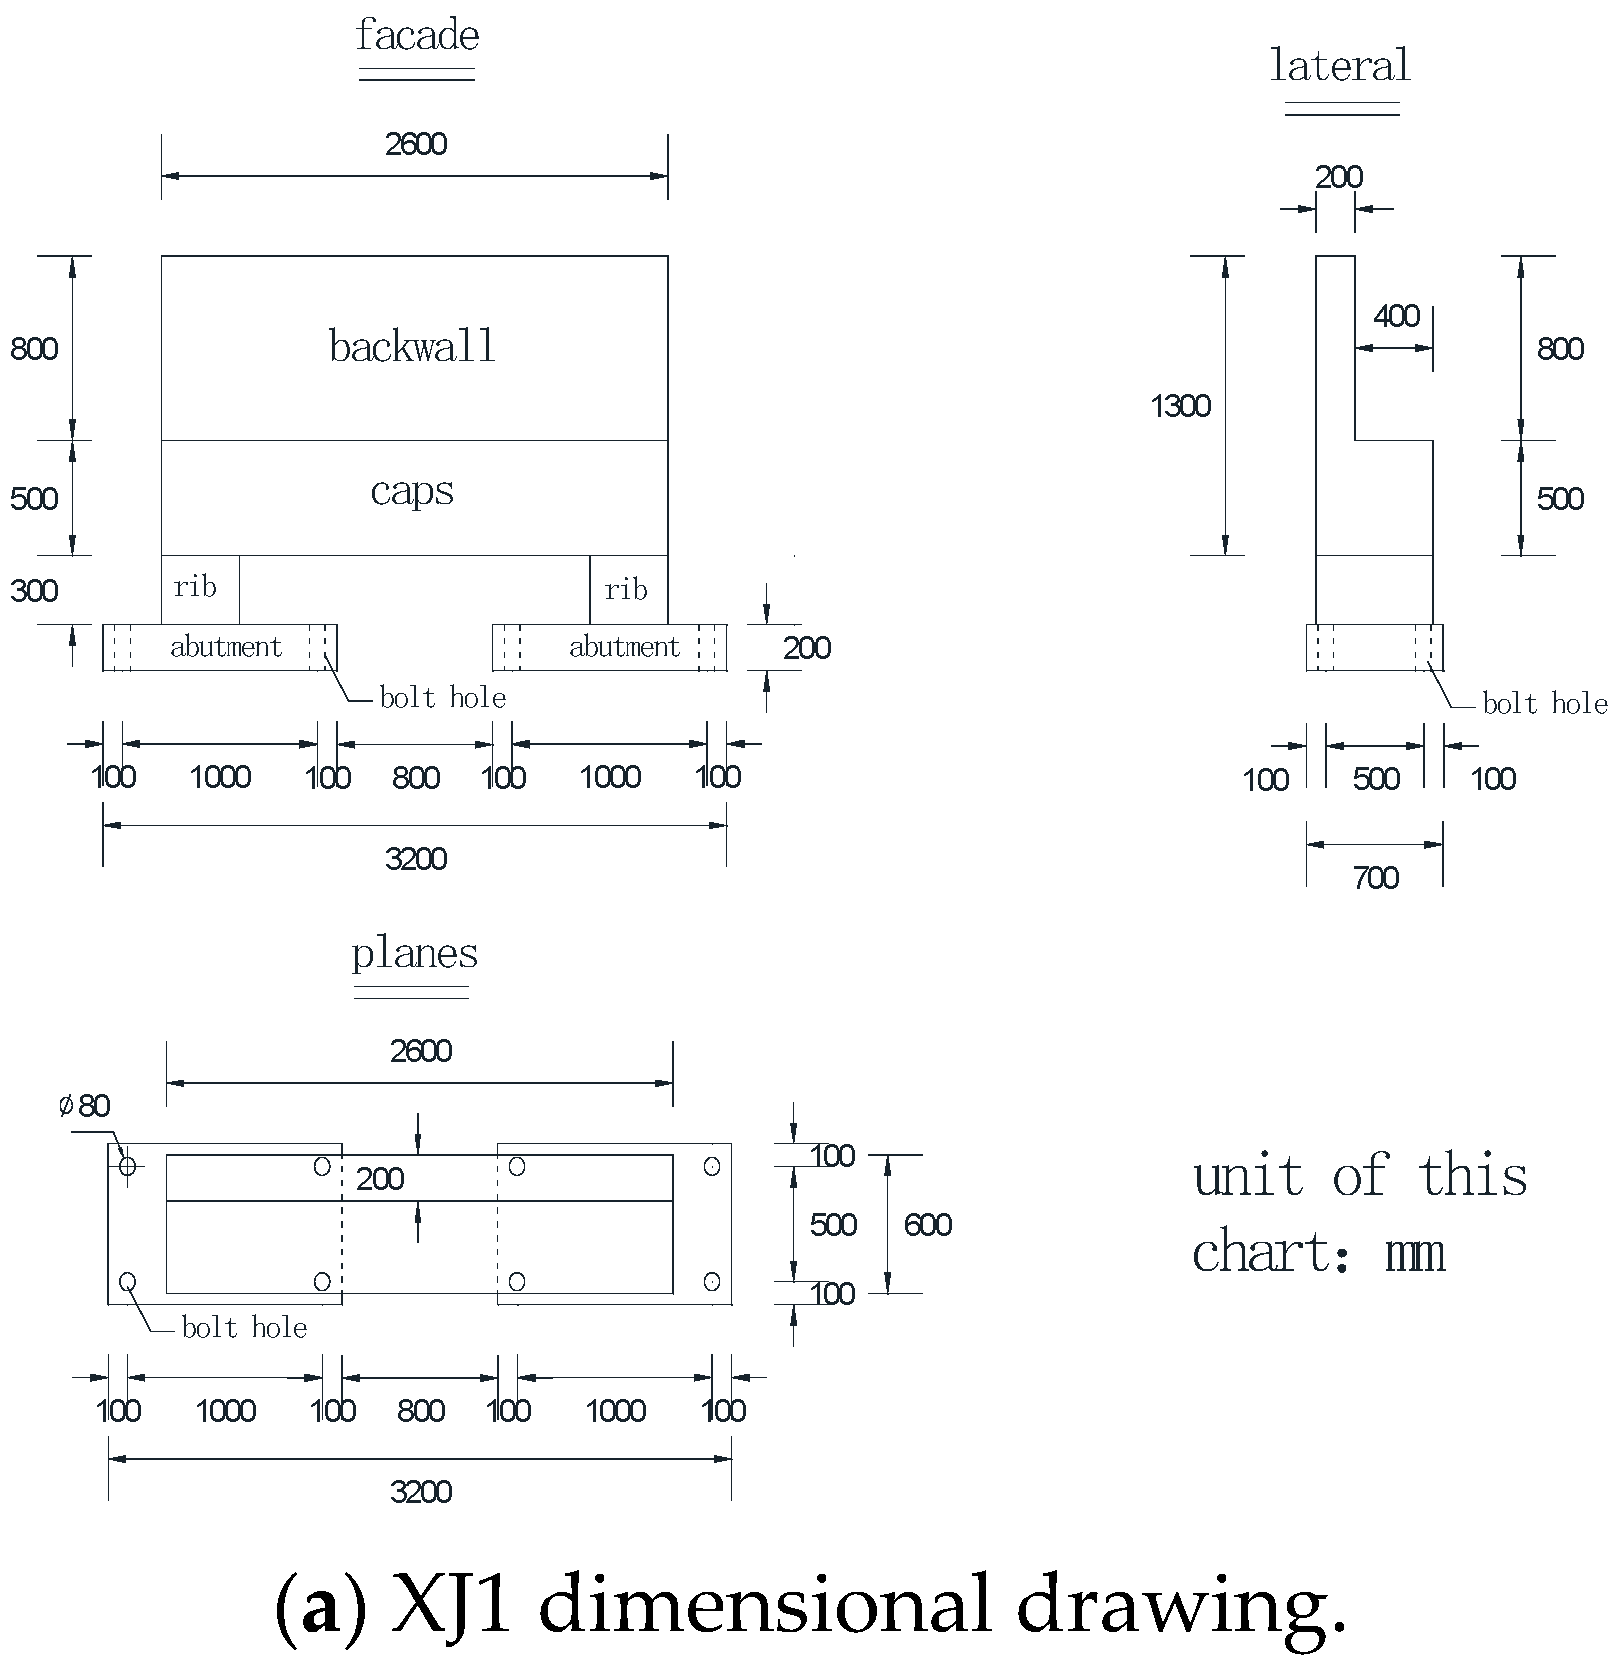
The information pertaining to the specimens for this flexural test is provided in Table 1. The overall dimensions of the test specimens adhered to the specified dimensions and disassembly method, as illustrated in Figure 1. The ARBA was manufactured at the prefabrication plant in various component parts, subsequently transported to the laboratory, and assembled as a whole.

Table 1.
Overall design of the local test model of prefabricated ribbed-slab abutment.
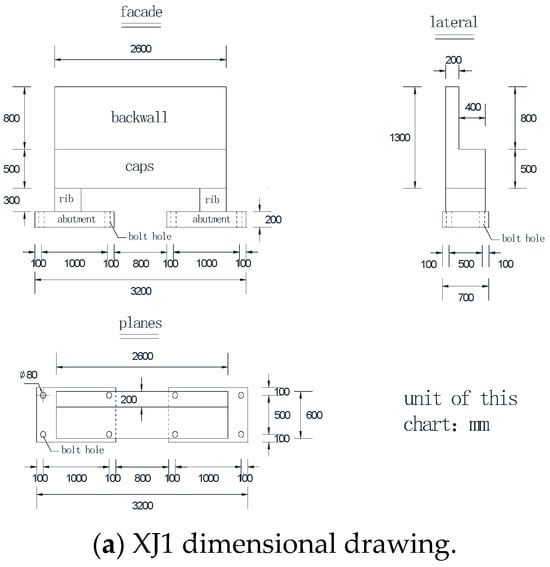
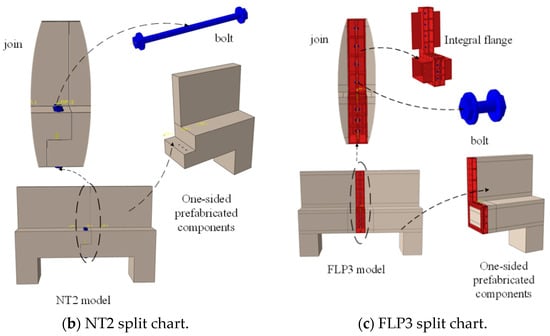
Figure 1.
Dimensions of the specimen for static load test of bridge abutment (unit: mm).
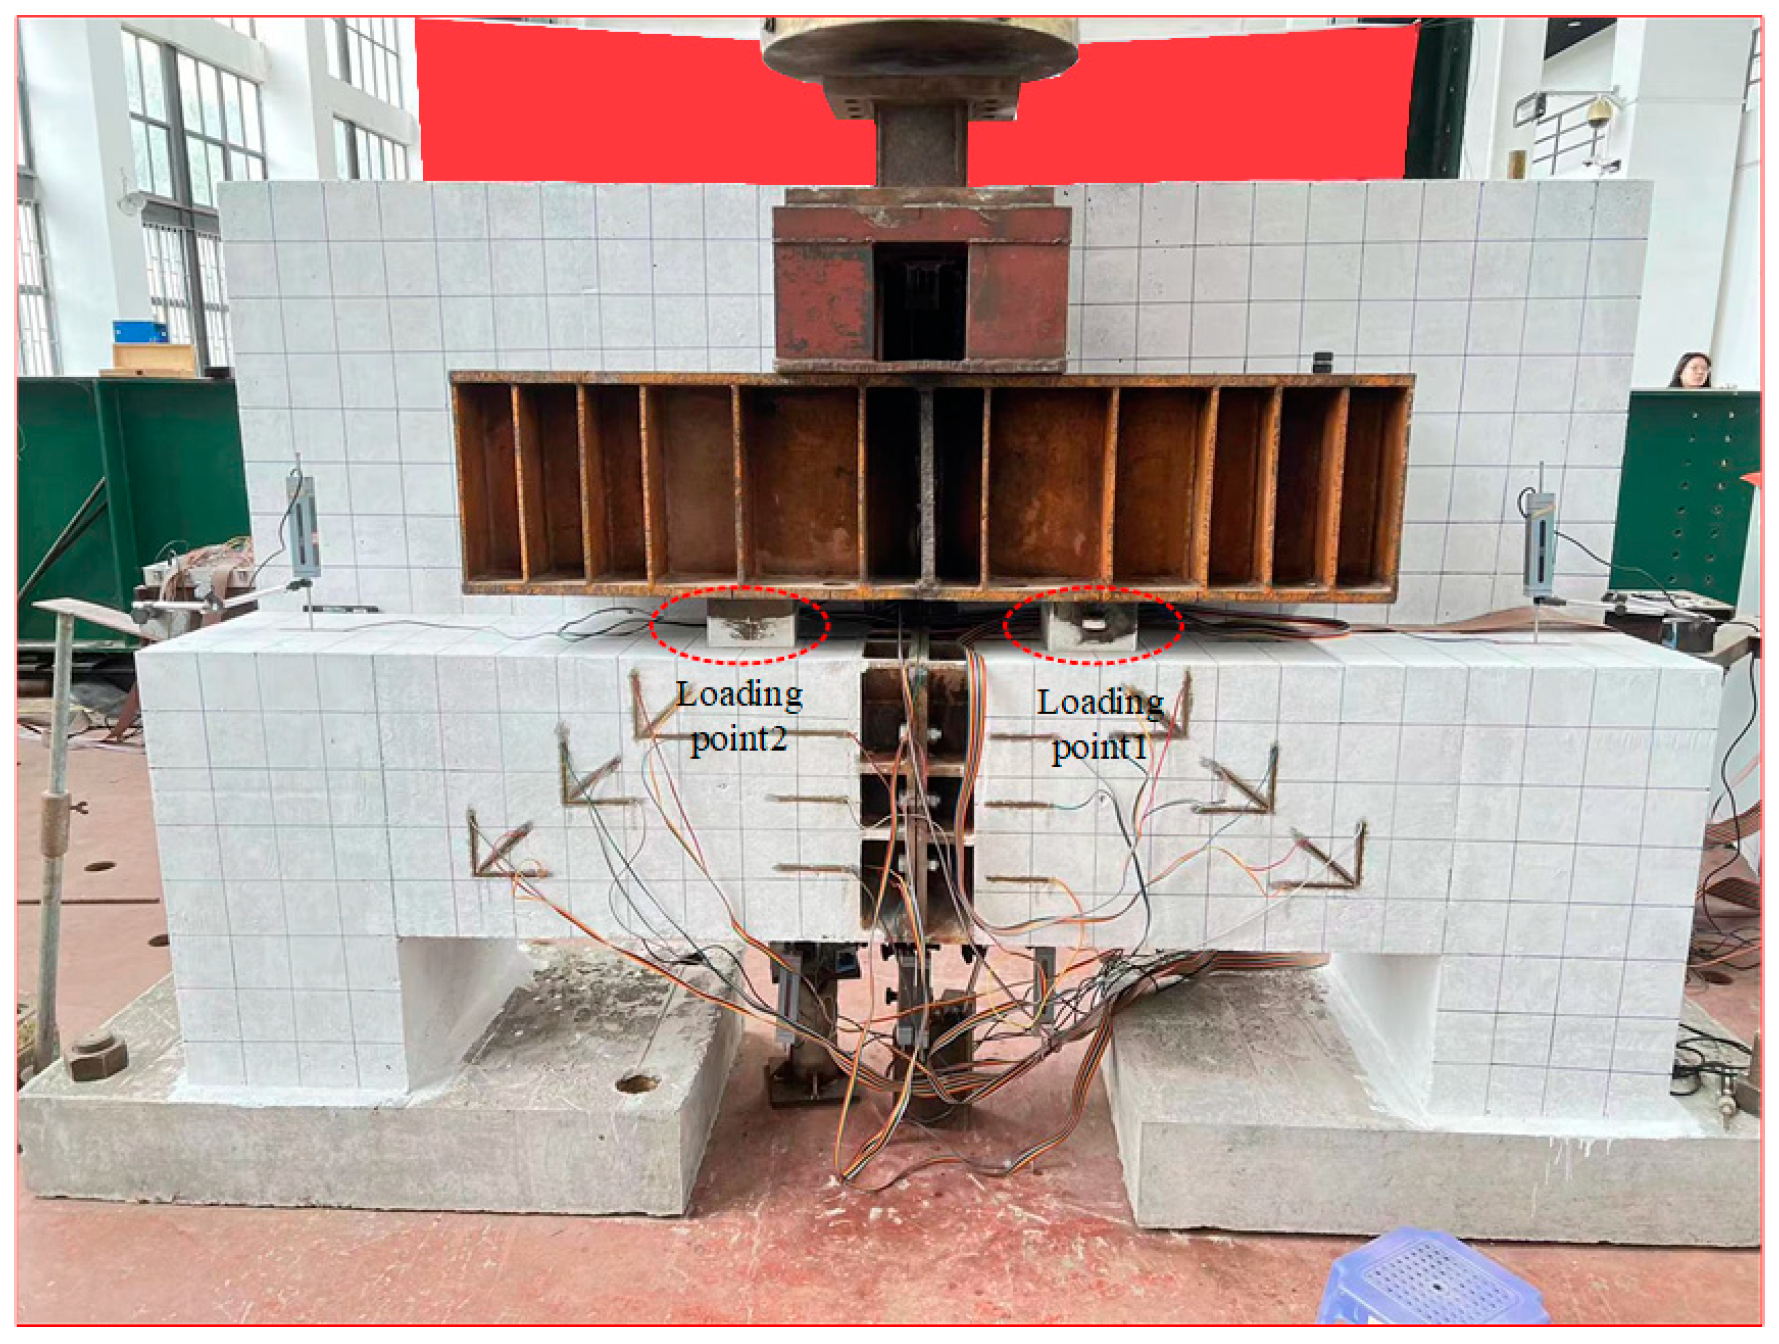
The model in this test was subjected to a two-point loading method using a 5000 kN jack. Prior to loading, the distribution beam and loading pad were pre-padded, and the strain magnitude was employed to control the actual load of the jack. The length of the bridge abutment was 2600 mm, with the loading points situated 600 mm from the inside of the rib plate to the center of the span (loading point 1 on the right side and loading point 2 on the left side). To prevent any rotation or deflection of the specimen during the test, anchoring apertures were provided at the lower part of the specimen, corresponding to the position of the laboratory ground anchor. The specimen was securely fastened to the laboratory ground using the ground anchor. The test loading device is depicted in Figure 2.

Figure 2.
Schematic diagram of the flexure test loader.
Moreover, the concrete and flange strain, deflection, and cracking were measured. Numerous typical cross-sections of the model were selected, such as the center span section, joint section, and top and bottom of the table cap. Multiple concrete strain gauges and displacement transducers were used to record the relevant data.
2.2.1. Experimental Phenomena
Figure 3 illustrates the crack distribution and damage morphology of the three ribbed-slab abutment models when they reached their critical limit state. Notably, the distribution of shear cracks in the three models was basically the same. For XJ1 and FLP3, the cap areas exhibited denser cracking when damaged. In contrast, while the NT2 model had a relatively sparse crack distribution, the widths of the cracks were larger. Compared with the fully cast-in-place abutment model, the maximum crack width of the structure increased significantly as the assembled abutment models underwent structural failure. For the XJ1 model, the damage pattern revealed a “bow-shaped” crack distribution. Under the influence of the upper load, the number of cracks increased and widened. One of the 45° diagonal cracks developed into the main diagonal crack, reached the critical value, and eventually led to structural failure. The NT2 model indicated that the protective layer of concrete at the joints was crushed, causing joint failure and damage to the structure. The FLP3 model highlighted that the structure no longer supported the load because the flange had separated from the concrete contact surface at the center of the span. All three models exhibited the destruction of the conventional concrete section.
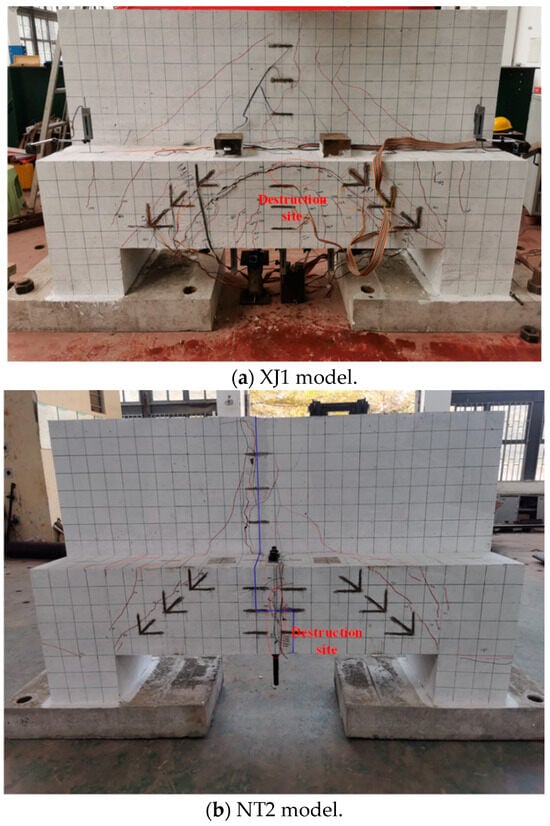
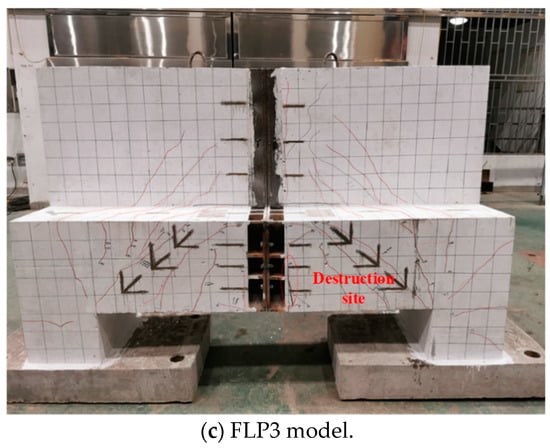
Figure 3.
Crack distribution and damage pattern of the test specimens.
Overall, models XJ1, NT2, and FLP3 displayed distinct shear damage patterns with wider cracks and more pronounced deformations in the span during damage.
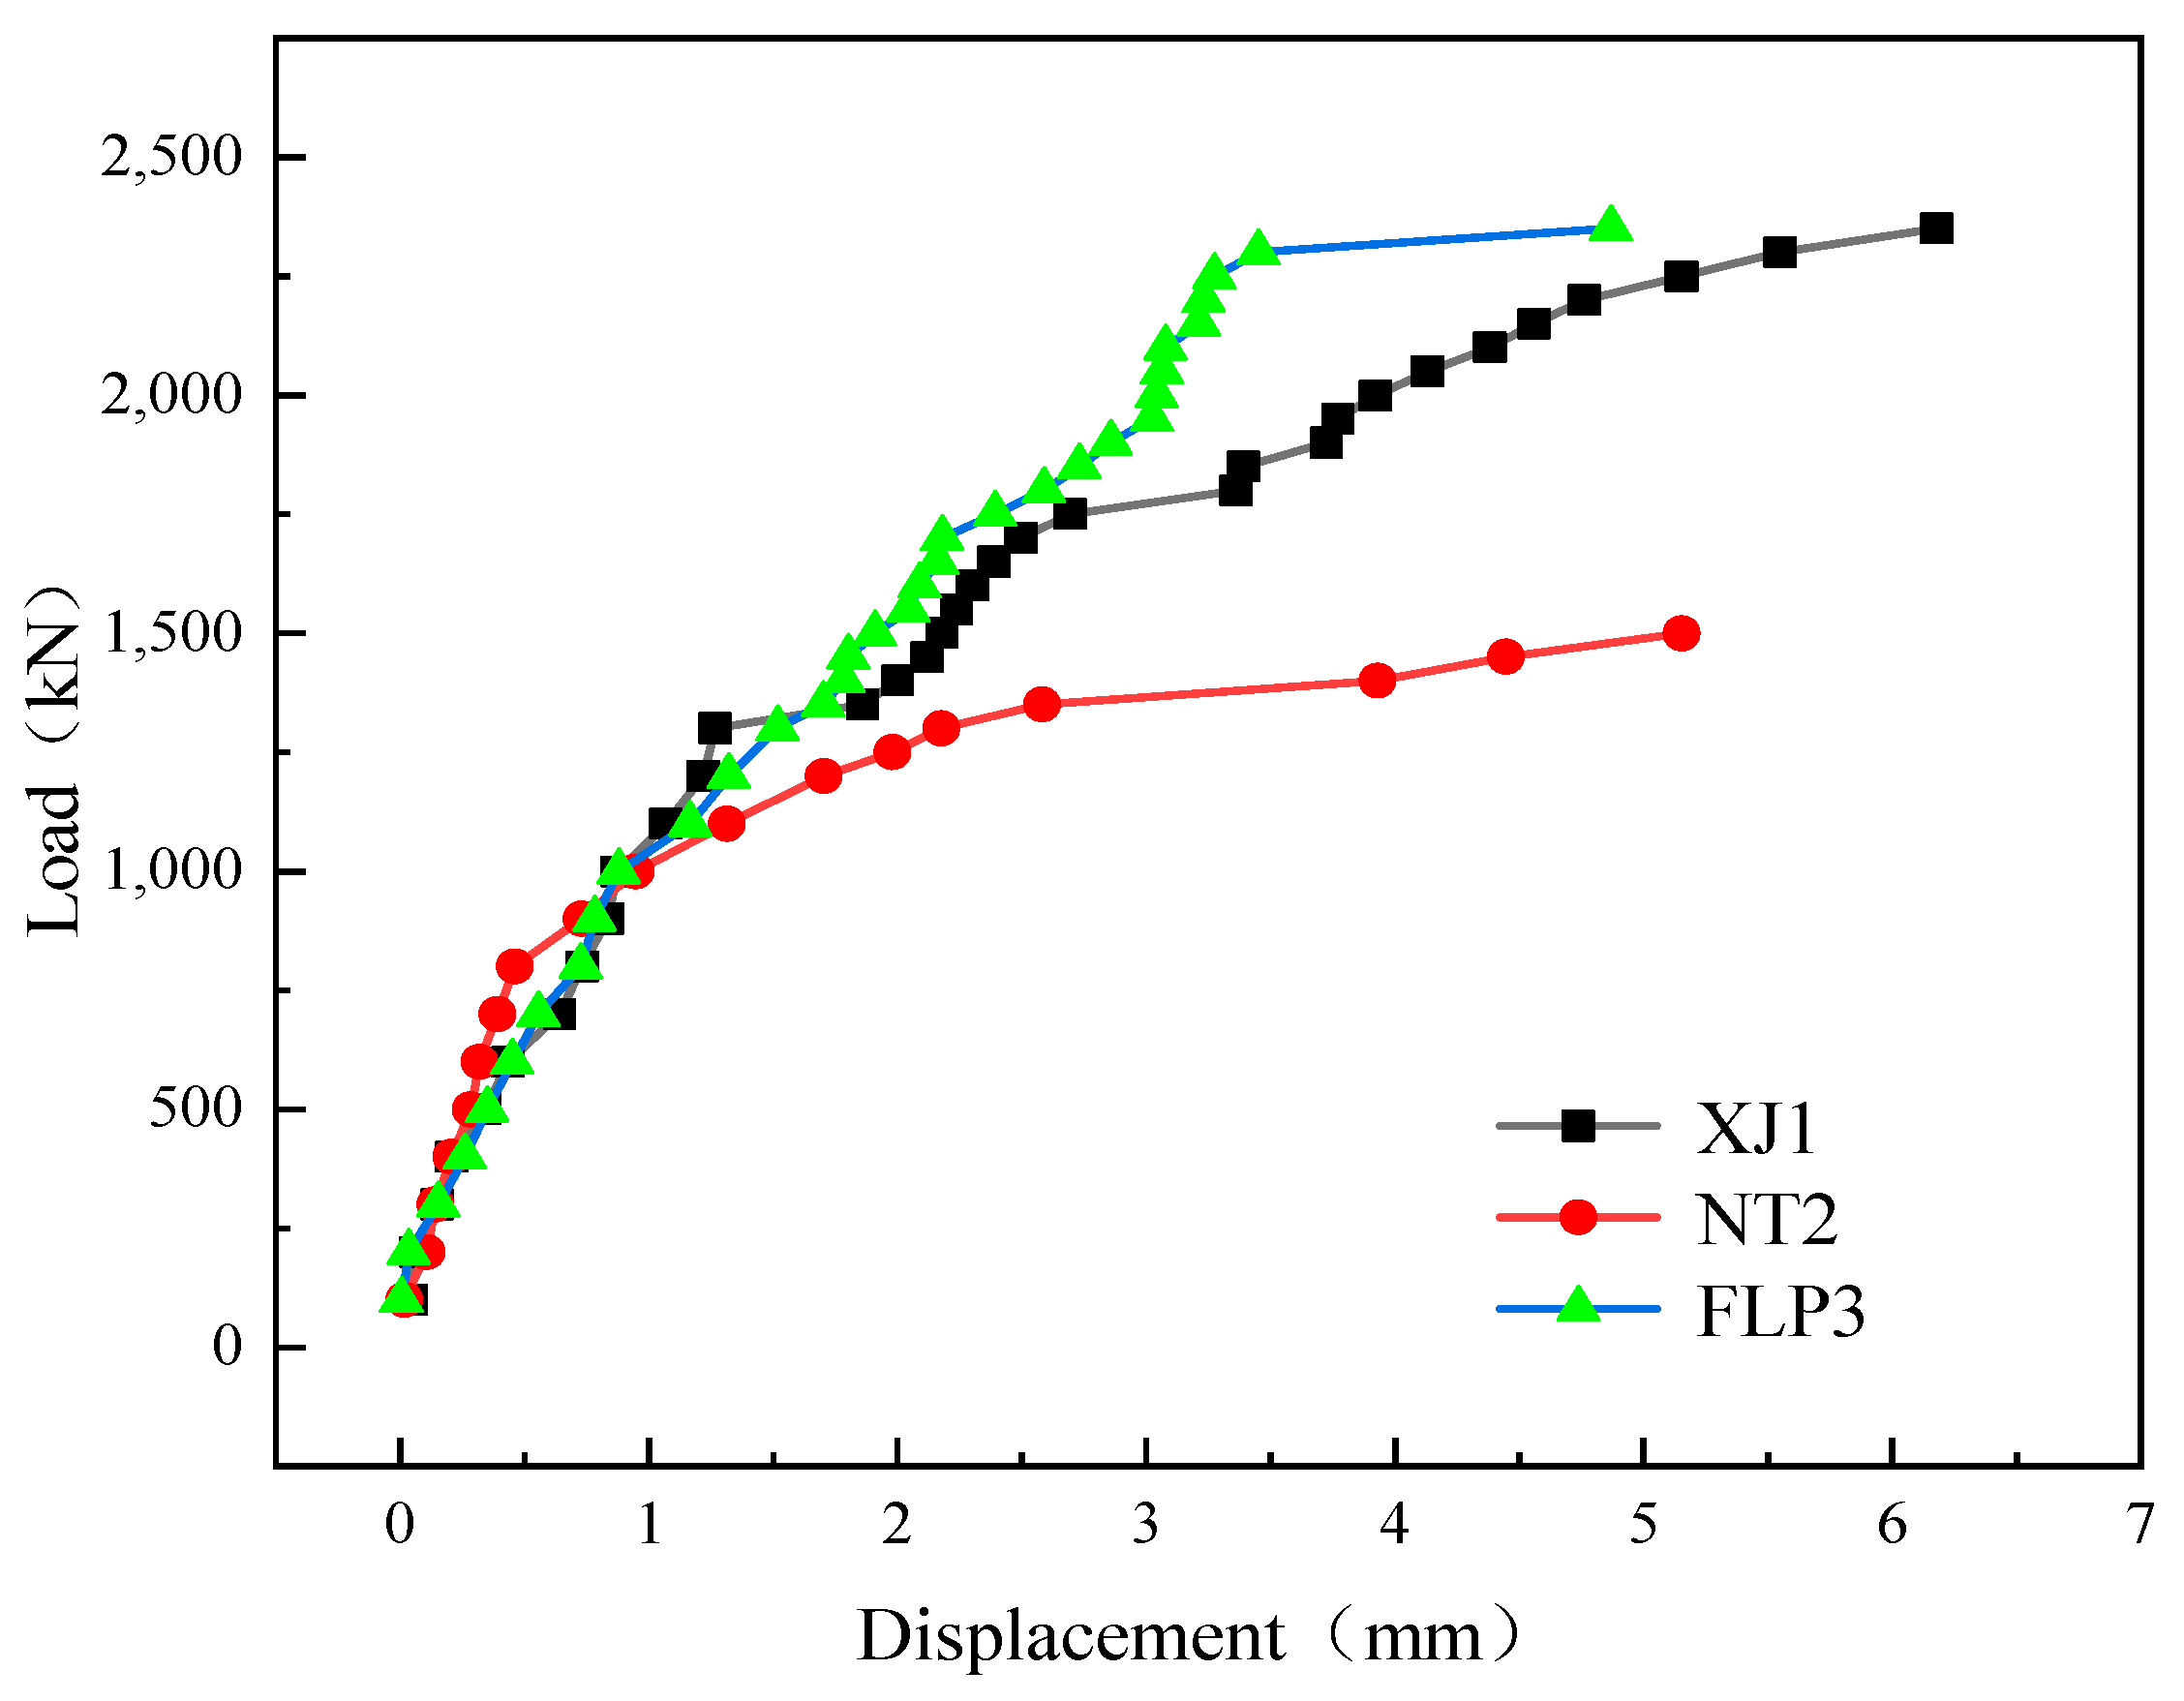
Figure 4 displays the measured load–deflection curves recorded at the loading points for the three abutment models. The curves for all three models exhibited distinct stages, which included enhanced elasticity, crack development, and damage stages: (1) In the initial pre-loading stage, when the beam was not cracked, each model was in the elastic stage, the deflection was approximately linearly proportional to the increase in the load, and the initial stiffness was basically the same. (2) After exceeding the cracking load, each model entered the crack development stage, and the slope of the curve decreased with an increase in the load, with evident nonlinear characteristics. In the crack development stage, with an increase in the load, the tangent stiffness of the ARBA model with different joint configurations and the cast-in-place abutment model started to change gradually. The NT2 model exhibited the lowest tangent stiffness, followed by the XJ1 model, and the tangent stiffness of the FLP3 abutment model was the largest. (3) After entering the damage stage, the slope of the curve approached zero, the beam deflection increased rapidly, and the models eventually reached failure due to the crushing of concrete in the compression zone.

Figure 4.
Comparison of load–deflection curves of test models.
2.2.2. Experimental Results
By summarizing and comparing the main performance indices of the two ARBA models with different joint configurations and the cast-in-place abutment model, appropriate joint configurations of the ARBA were explored through comparative analyses.
- (1)
- Crack load
The results obtained from the tests were used to determine the cracking loads of each abutment model, and the comparison results are listed in Table 2. The data reveal that the cracking load of the NT2 abutment model was only 58% of that of the XJ1 abutment model. The cracking load of the FLP3 abutment model was 67% of that of the XJ1 abutment model. These findings indicate that, in terms of cracking resistance, the ARBA with a flanged joint configuration exhibited a superior performance.
Table 2.
The stress performance and comparison of each abutment model.
- (2)
- Local ultimate load
Based on the measured results obtained from the tests, Table 2 lists the ultimate bearing capacity of each abutment model and comparison results. According to the data in the table, the ultimate load-carrying capacity of the NT2 bridge pier model was only 60% that of the XJ1 bridge pier model. Conversely, the ultimate load-carrying capacity of the FLP3 abutment model was 100% or equal to that of the XJ1 abutment model. This suggests that, in terms of bearing capacity, the ARBA model with a flanged joint structure can achieve a performance level “equivalent to cast-in-place”.
- (3)
- Local limit displacement
While testing the NT2 and FLP3 models, the structural joint position was damaged when the structure reached the ultimate state, which manifested as a transient state. In contrast, for the XJ1 model, once it reached the ultimate load, the load remained unchanged, and the displacement continued to increase as the loading proceeded. The displacement of the structural state at the time of reaching the ultimate load was used as basis for comparison data in this study. Table 2 lists the ultimate displacements of each bridge abutment model and the comparison results. Evidently, the ultimate displacements of the two ARBA models with different configurations were smaller than those of the cast-in-place abutment model (XJ1 abutment model). The ultimate displacement of the NT2 abutment model reached 84% of that of the XJ1 abutment model, while the ultimate displacement of the FLP3 abutment model reached 80%. Therefore, the deformation capacities of the two ARBA models were not significantly different and were weaker than those of the cast-in-place abutment model.
2.3. Shear Test of Assembled Ribbed-Slab Abutment
In the shear test, the loading point was located at the end of the cantilever, and the loading method used a loading device with a 5000 kN counterweight and 5000 kN jack, which was fixed with the same bending test, as shown in Figure 5.
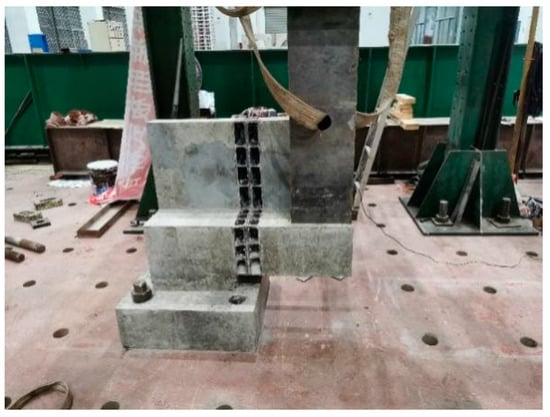
Figure 5.
Schematic diagram of the shear strength test loading device.
Experimental Phenomenon
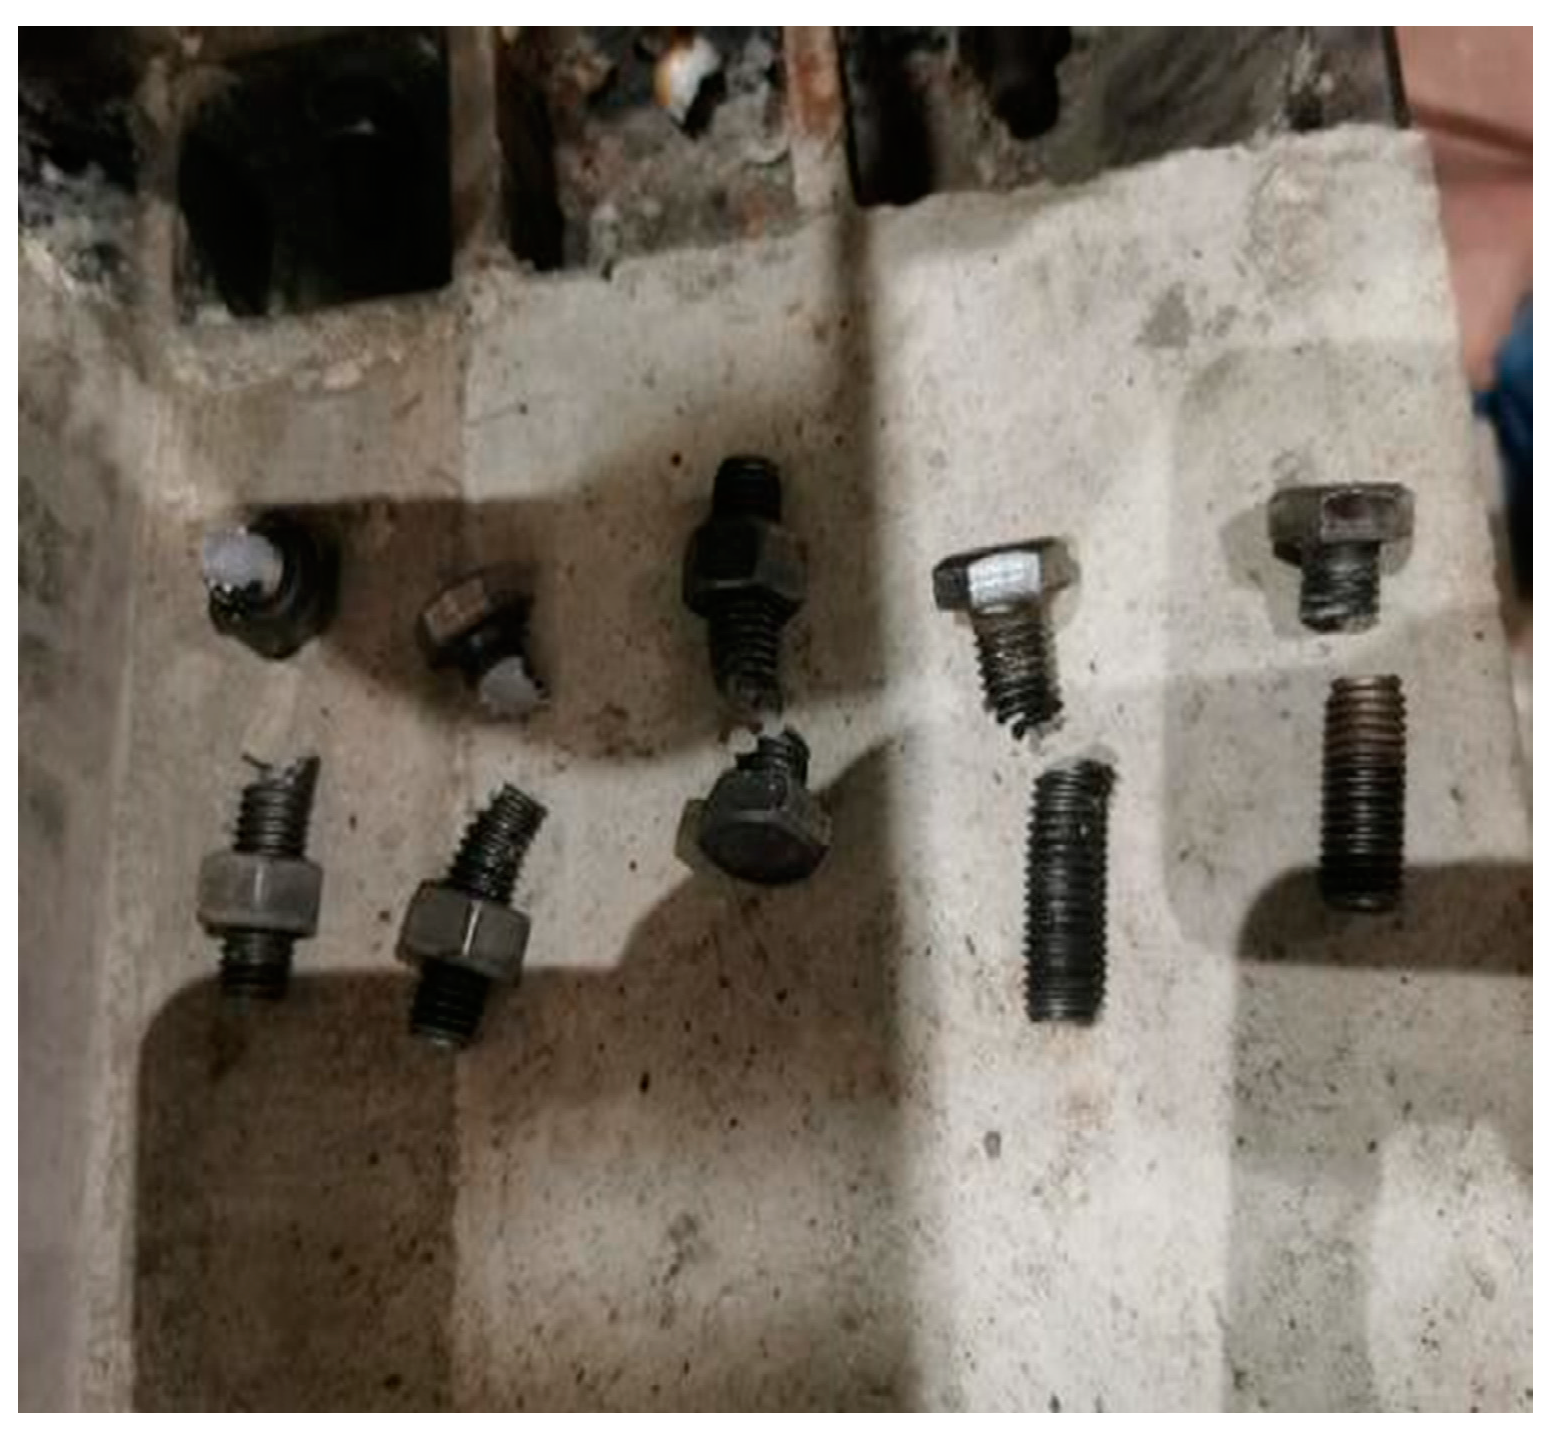
The FLP4-1 model initially utilized eight ordinary 4.8-grade M12 bolts (up to 18 were available), and there was no notable issues in the structure during the pre-load period. However, when the load was increased to 150 kN, a small crack appeared near the back wall of the flange. Subsequently, the structure emitted a loud noise, and simultaneously, the bolts were sheared off, which is characterized by brittle failure. The test was halted upon reaching a load of 300 kN. The primary damage sustained in this test was bolt damage, with five of them being broken, as illustrated in Figure 6. Remarkably, no damage was observed to the overall concrete structure or the flange itself upon closely examining the structure.

Figure 6.
Sheared bolt.
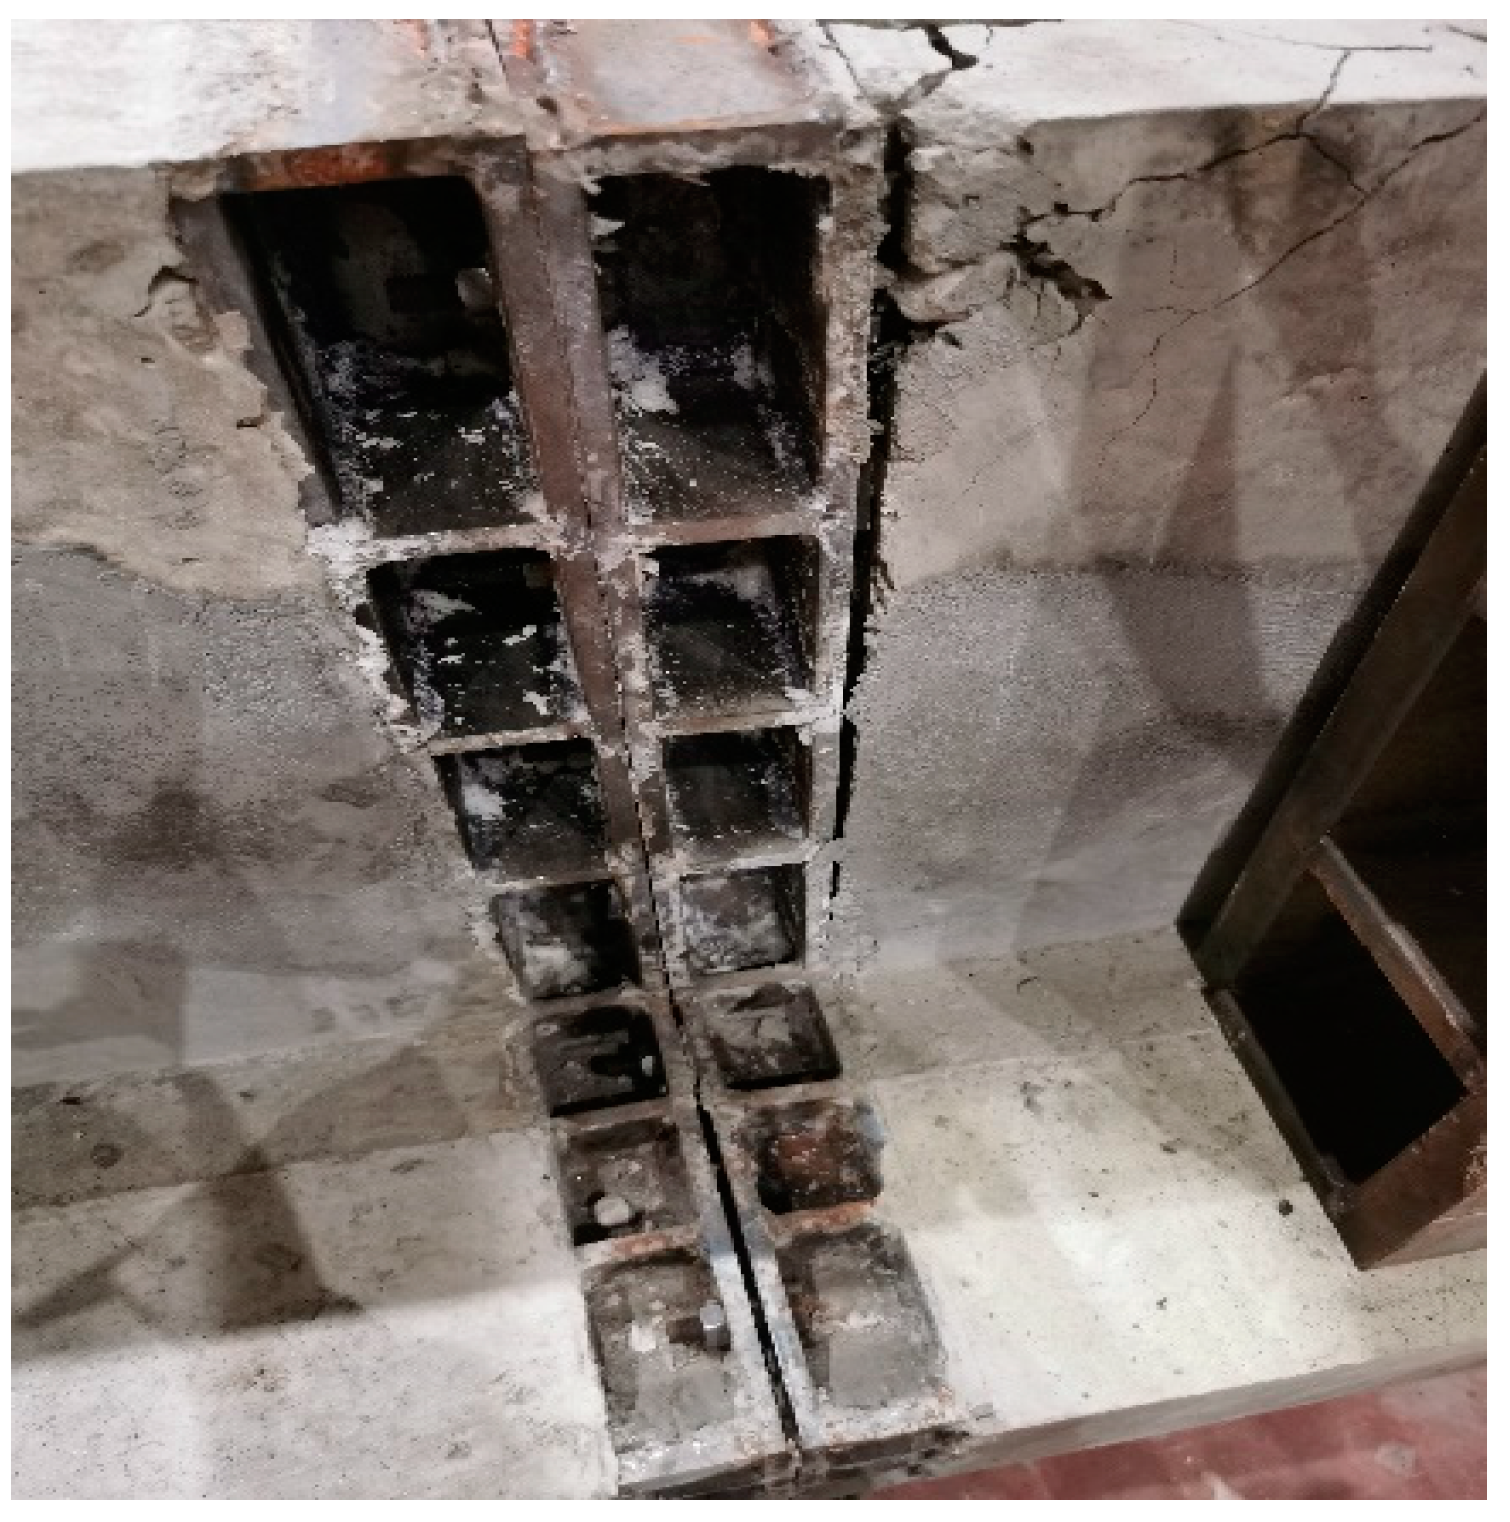
For the FLP4-2, all the bolts were removed, and they were replaced with eight M12 high-strength 8.8-graded bolts (positioned in the same locations) to restart the test. As the load increased to 200 kN, the cantilever end of the flange near the joints of the cracks exhibited gradually expanded and downward development. Upon reaching a load of 450 kN, the cantilever end of the flange above the joints of the concrete also cracked, leading to the detachment of the flange from the concrete connection. Consequently, the jack could no longer continue to apply load, and the test was terminated. At this point, the structure of the cantilever end of the flange and the concrete connection were detached, as shown in Figure 7, while the bolt in the flange remained damaged. The primary damage in this test was the failure of the connection between the flange and concrete.

Figure 7.
Flange connection failure diagram.
Longitudinal shear test studies have demonstrated that the shear capacity of the flanged ARBA depends primarily on the shear performance of the bolts.
When evaluating the performance of the ARBA with the two connection methods, it is evident that the ARBA with flange connection can easily attain performance “equivalent to that of cast-in-place.” In this case, the primary damage of the ARBA model with a flange connection comprised damage to the bolts and the cracking of the concrete at the joints. However, there was no major damage to the overall structure, providing more favorable conditions for subsequent repair. Therefore, the flange connection was selected for the subsequent optimization design.
3. Assembled Ribbed-Slab Abutment Model Validation and Foundation Model Analysis
Through experimental investigations of the ARBA using a flange as the connection method, the accuracy of the numerical analysis method was verified by establishing a FE model of the test specimens. Accordingly, an overall model of the whole cast-in-place and assembled structures was developed, and the force performance of the assembled structure was evaluated, employing the cast-in-place structure as a reference.
3.1. Development and Validation of Numerical Analysis Models
3.1.1. FE Simulation of Test Models
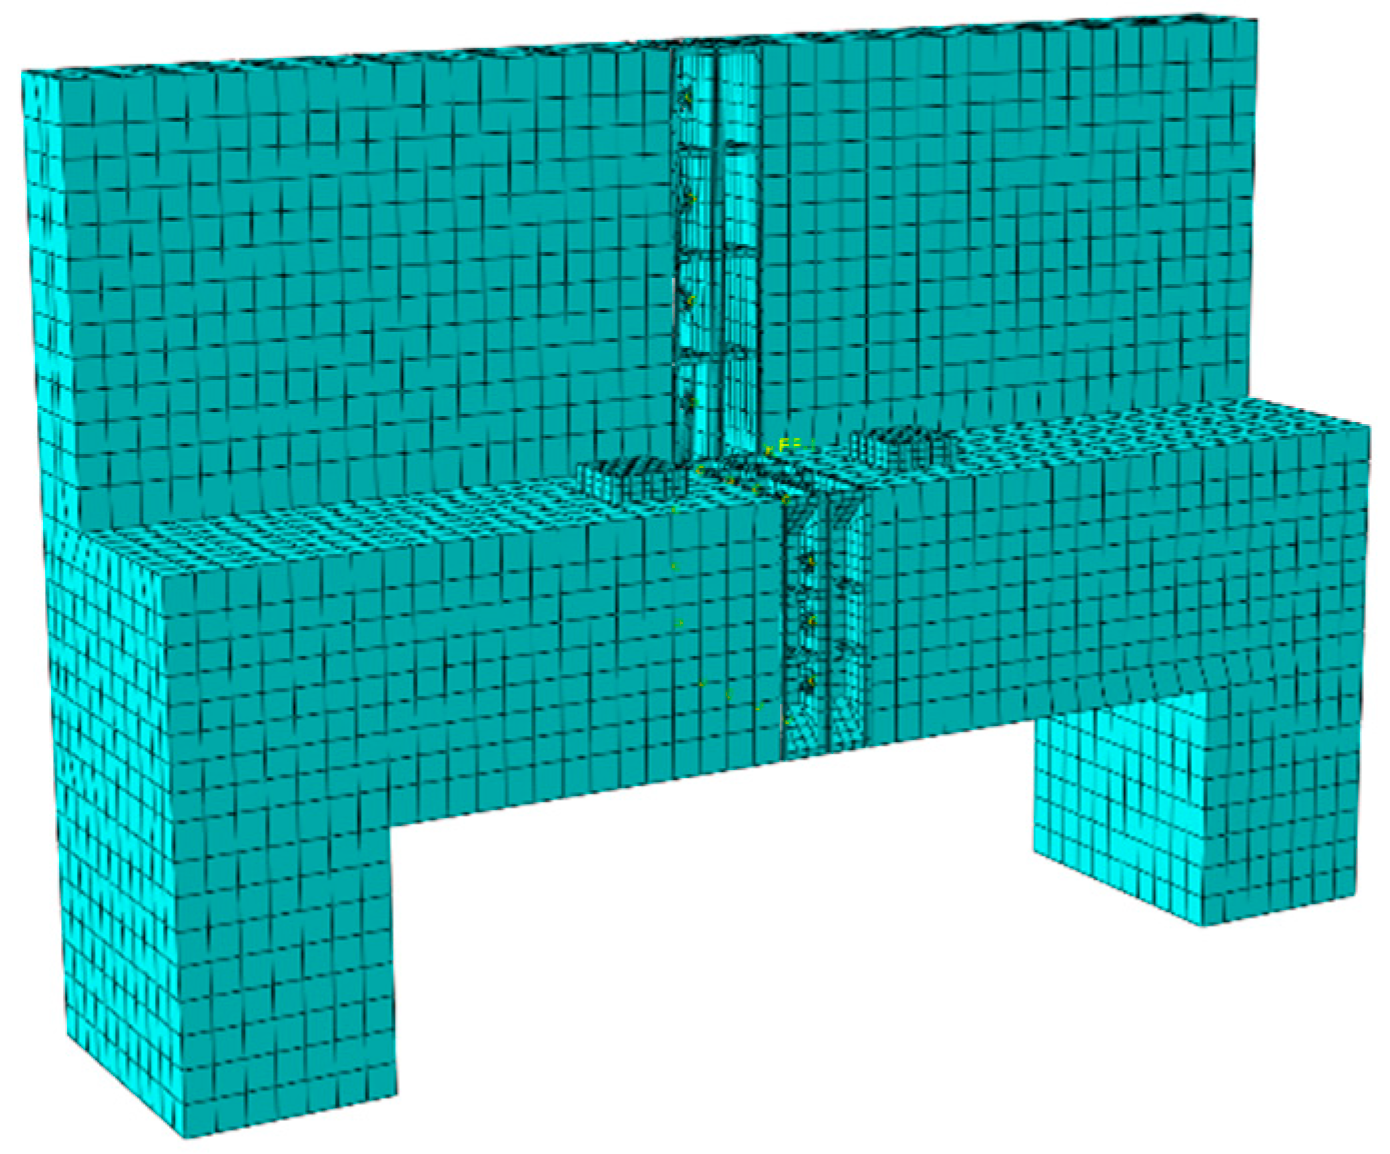
ABAQUS 2022 software was used to establish a refined FE model of the FLP3 model. Figure 8 showcases the FE model of each component established in this study: For the bridge abutment model as a whole, the cell mesh size was 50 mm, while the mesh division of steel reinforcement was set to 100 mm, which was 1–4 times the concrete mesh. The mesh length of the flange and the bolt was 40 and 10 mm, respectively.

Figure 8.
FE model diagram of the test specimen.
In the FE modeling process, the eight-node hexahedral linear reduced the integration unit (C3D8R) was used for representing ordinary concrete, flange, and bolt units, while the two-node truss unit (T3D2) was utilized for simulating the reinforcement bars. The concrete damage plasticity model was employed to establish the C50 constitutive relationship, and the reinforcement constitutive relationship was considered as a bifurcated model, detailed parameters are shown in Table 3 and Table 4. Assuming that the tensile damage is elastic and can simulate the compression of concrete, and assuming that the concrete will have two different damage modes due to stretching or compression, the characteristics of the concrete in the force and deformation can be simulated more realistically. Meanwhile, the relevant distribution of cracks can be simulated by inputting the damage factors in the model. Embedding constraints were adopted to ensure that the steel reinforcement skeleton was connected to the concrete entity. Additionally, in this setting, the FLP3 model set the contact between the concrete surface, flange surface, bolt surface, and flange surface as the surface-to-surface contact. The normal and tangential contacts assumed “hard contact” and friction, respectively, to simulate the bonding and sliding between different components. To simulate the bonding and sliding between different components, since the bonding quality of the structural joint cannot be determined, the friction coefficient is determined to be 0.4 through multiple validations; the structure boundary is set with fixed constraints at the bottom of the floor according to the test conditions.
Table 3.
Parameters related to plastic damage of concrete.
Table 4.
Steel material parameter.
3.1.2. Validation of FE Models
To verify the accuracy of the FE model, the computational results of the flanged ARBA model were compared with the experimental results.
- (1)
- Load and displacement conditions
Table 5 depicts the comparison between the relevant data from the FE model of the ARBA with a flange connection and the results from the tests.
Table 5.
Comparison of FLP3 test and FE model data.
The table highlights that the FE results were slightly better than the data measured in the tests. Its initial cracks appear at the joints of the structure. This can be attributed to the real-world construction of the structure in the actual project, which could not achieve the ideal conditions of numerical simulation. In particular, the results of the ultimate load and ultimate displacement were slightly larger than the data measured in the test. This was primarily due to the issues prevalent in construction process in practical applications, where the bonding quality between the flange and the concrete joints in the span of the test member was poor. This can lead to the sudden destruction of the flange and the concrete joints in the span in later stages of loading, accompanied by prying effects. In contrast, the numerical simulation assumes an ideal state, with excellent bonding quality between the flange and concrete, leading to the FE model yielding a higher ultimate load and the ultimate displacement values than the experimental model. Nevertheless, the final results of the FE model align well with the test results, only exhibiting an error of approximately 6%, which meets the necessary engineering accuracy requirements.
- (2)
- Distribution of cracks
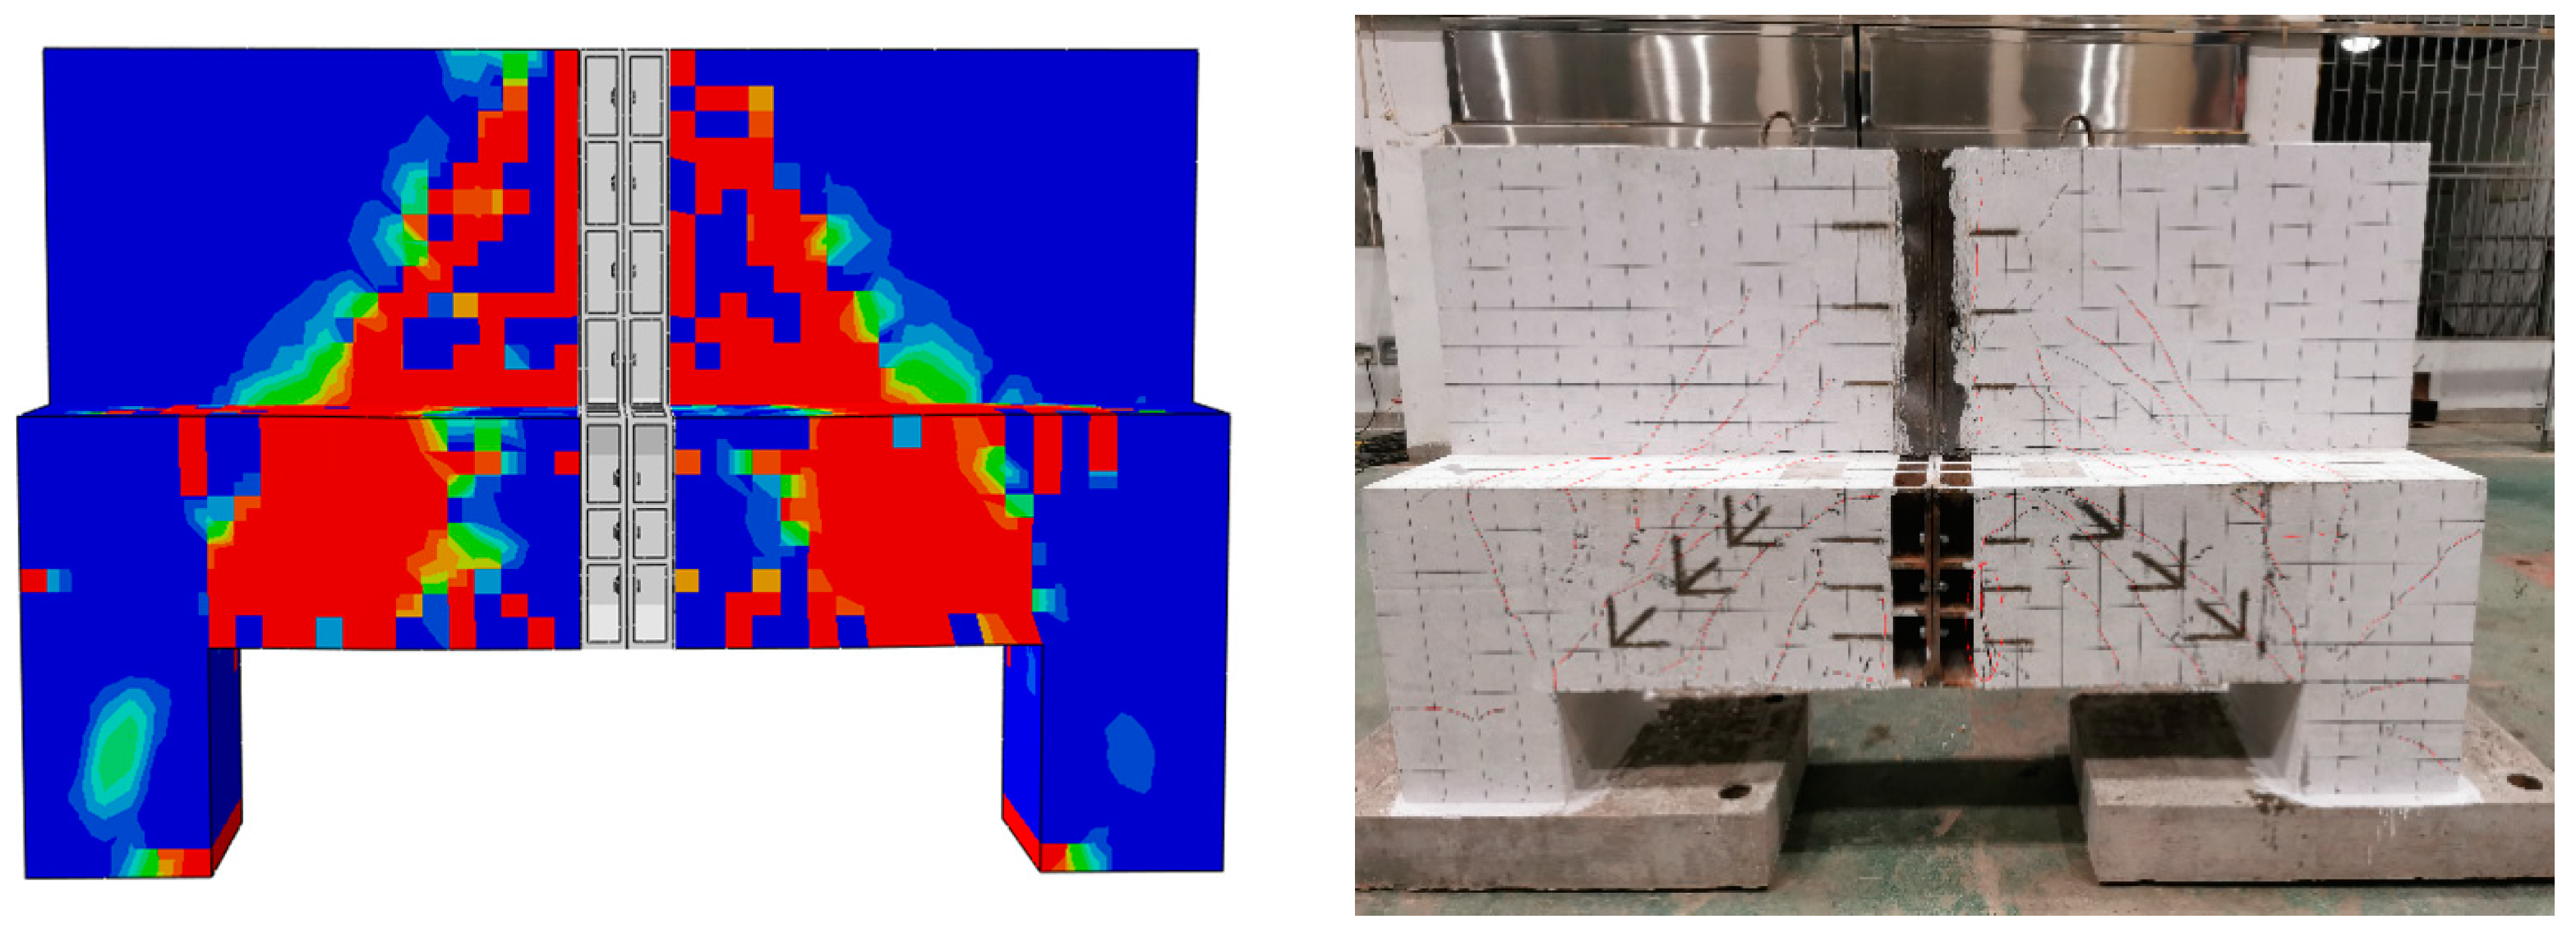
Figure 9 illustrates an overall crack comparison between the FLP3 abutment FE model and the test model. The damage mode and crack distribution of the FLP3 abutment FE model were more consistent with the actual test model. The primary damage mode of the FE model was diagonal crack damage, largely concentrated in the diagonal crack at the connection between the loading point of the platform cap and the ribbed-plate, as well as the back wall near the center of the span. The test model exhibited detachment at the contact between the flange and concrete in the middle of the span. It was hypothesized that this was largely due to the poor welding of the cage to the flange and the presence of a thick protective layer of concrete during construction, causing prying forces at the joints.
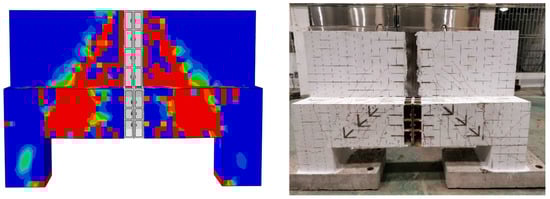
Figure 9.
Comparison of the total crack distribution.
3.2. FE Analysis of the Full Model of the Assembled Ribbed-Abutment
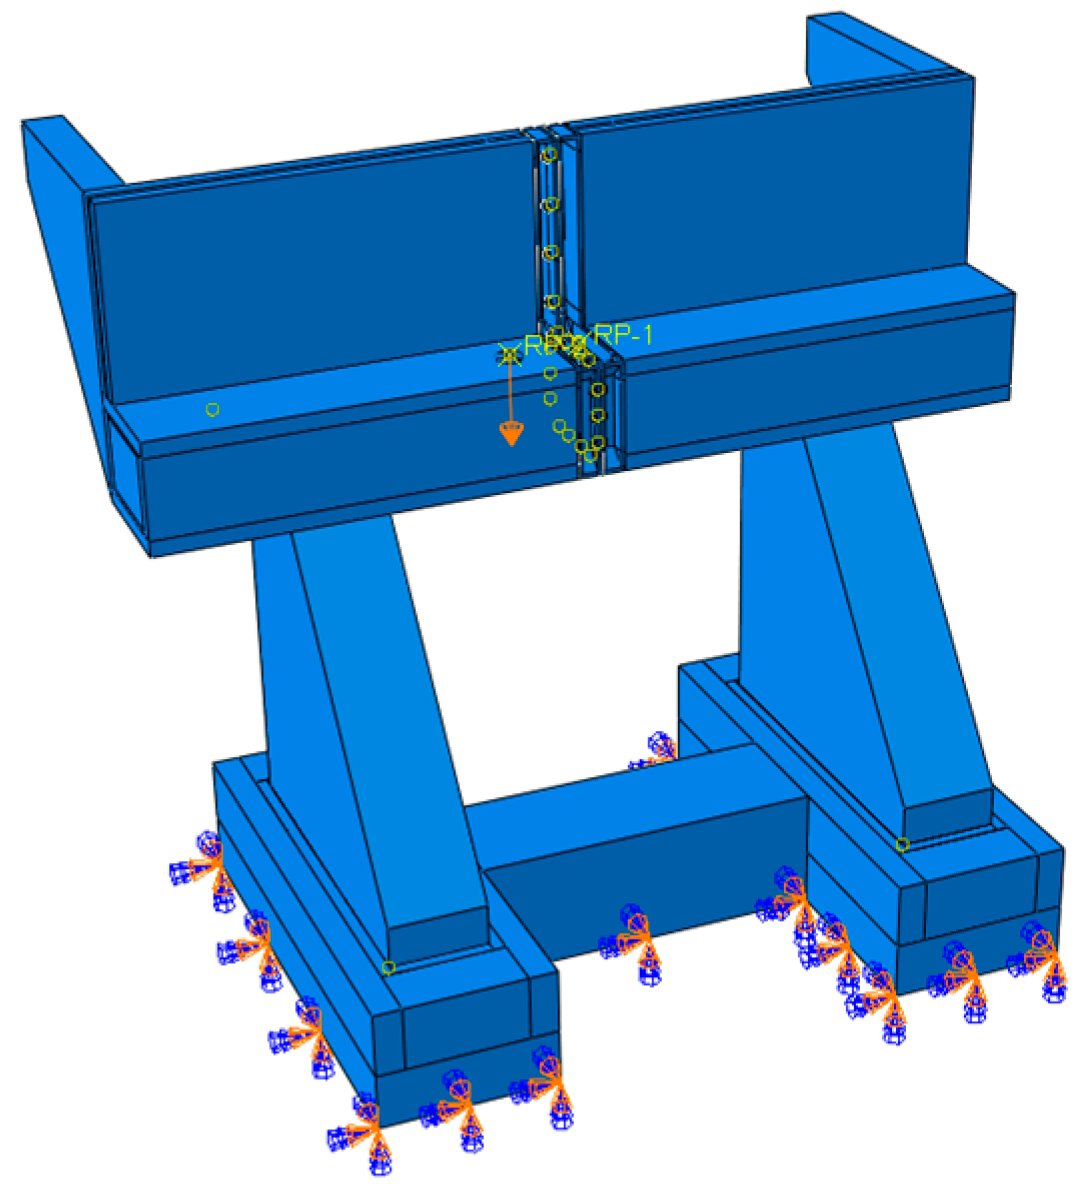
In this section, we focus on the structural performance of the overall ARBA structure, and a footbridge abutment model is set up for force analysis. Notably, this analysis excludes the considerations of soil pressure at the back of the abutment. The following is a comparative analysis of cast-in-place ribbed-slab abutments and flanged assembled ribbed-slab abutments.
- (1)
- Damage to concrete
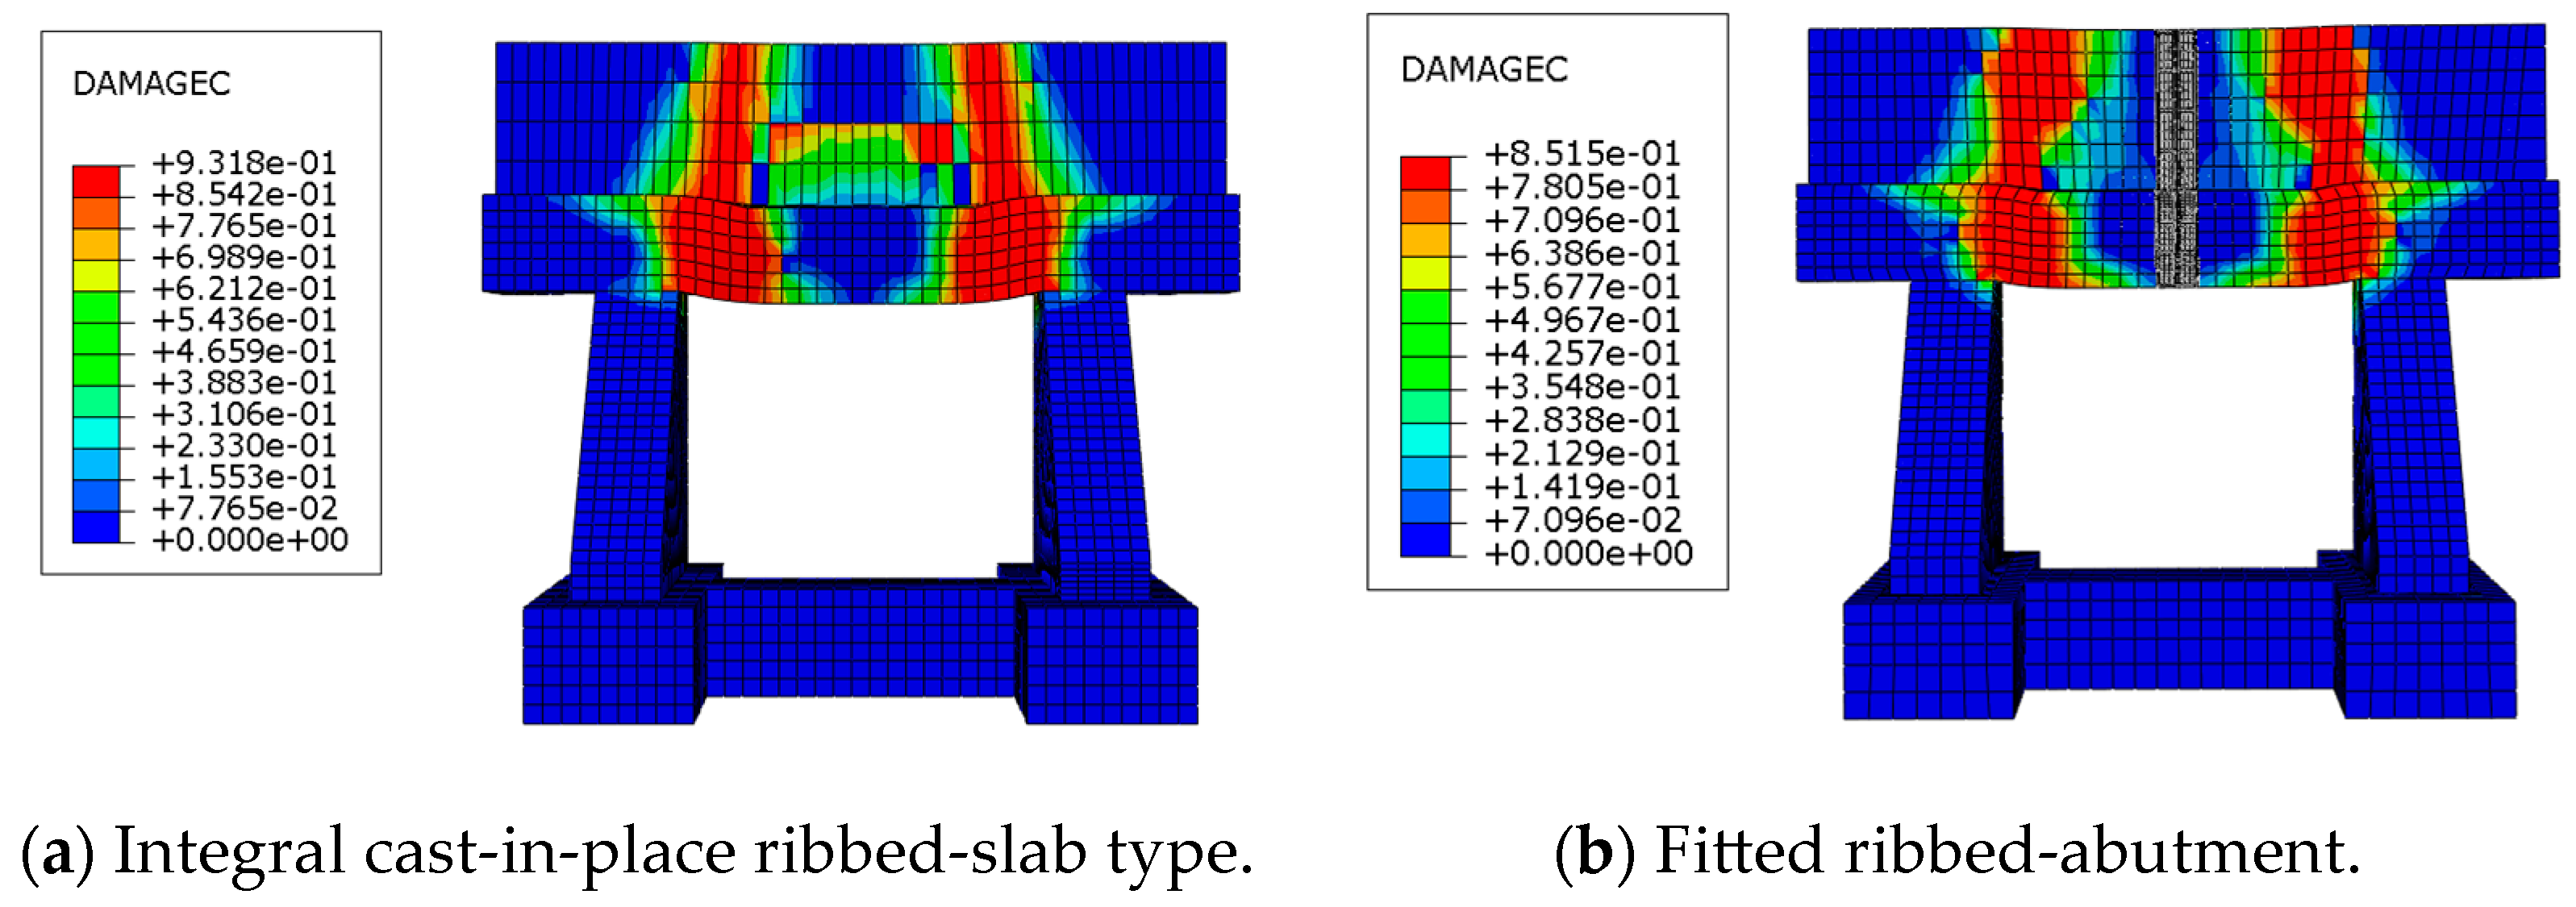
In the Abaqus FE simulation, two types of ribbed-plate bridge deck damage with concrete compression damage are evident, as depicted in Figure 10. For the two types of bridge deck compression damage, Figure 10 illustrates that the distribution area of the concrete compression damage was essentially the same, being largely distributed around the platform cap area near the rib plate. Among them, the concrete damage of the cast-in-place abutment exhibits an arch-shaped region, which corresponds to the distribution of crack development observed in the test. In contrast, for the ARBA model, where joint disconnection resulted in unconnected cracks, the concrete damage distribution aligns with the crack patterns observed during testing. The damage at the cap region in both structures was consistent with the mode of structural failure under compression bending actions.
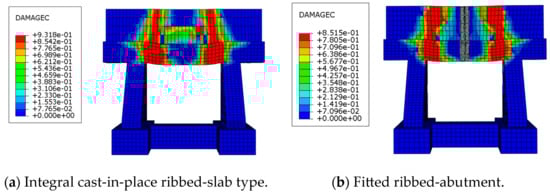
Figure 10.
Damage to concrete under compression.
- (2)
- Reinforcement Skeleton Equivalent Force Cloud
Figure 11 depicts the equivalent stress cloud diagrams of the reinforcement skeletons for both structures. From the figure, it could be found that the two structures are part of the tensile area of the rebar fracture in the specimen damage to the reinforcing steel skeleton were deformed, the deformation of the ARBA was relatively small, the two groups of specimens in the area of the cap close to the ribbed plate, and the stress concentration was more obvious. Owing to the continuity of the overall cast-in-place abutment, the stress maps of the reinforcement still exhibited an arch-shaped region, and yielding did not occur at the flange of the ARBA.
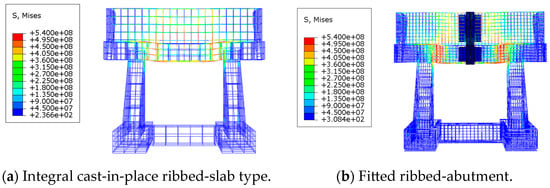
Figure 11.
Reinforcement cage equivalent force cloud during structural damage.
- (3)
- Stress map of the connector
Figure 12 presents the stress cloud diagram of the connection device of the assembled ribbed-slab abutment. Evidently, the flange in the ARBA structure, even at its ultimate bearing capacity, has not yielded. Moreover, its stress is largely concentrated in the L-type connection (table cap and back wall connection). This is because the flange is a steel structural member, and it experiences significant vertical loads in the discontinuous region due to its high stiffness, making the L-type connection a relatively weak point in the structure. In the assembly of the ribbed-plate bridge deck, the ultimate bearing capacity of the bolt group structure did not reach the yield state, and the stress was primarily concentrated in the lower bolt connection. This concentration of stress arises from the vertical load on the lower part of the cap, which induces tension. As a result, the bolts in the bolts in the lower joints bear relatively high stress.
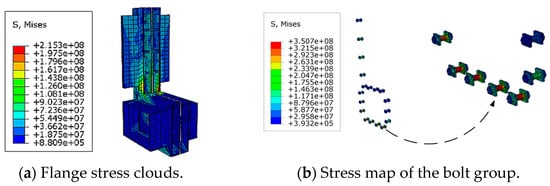
Figure 12.
Stress cloud of the connection device during structural damage.
- (4)
- Load–deflection curve for the midspan section
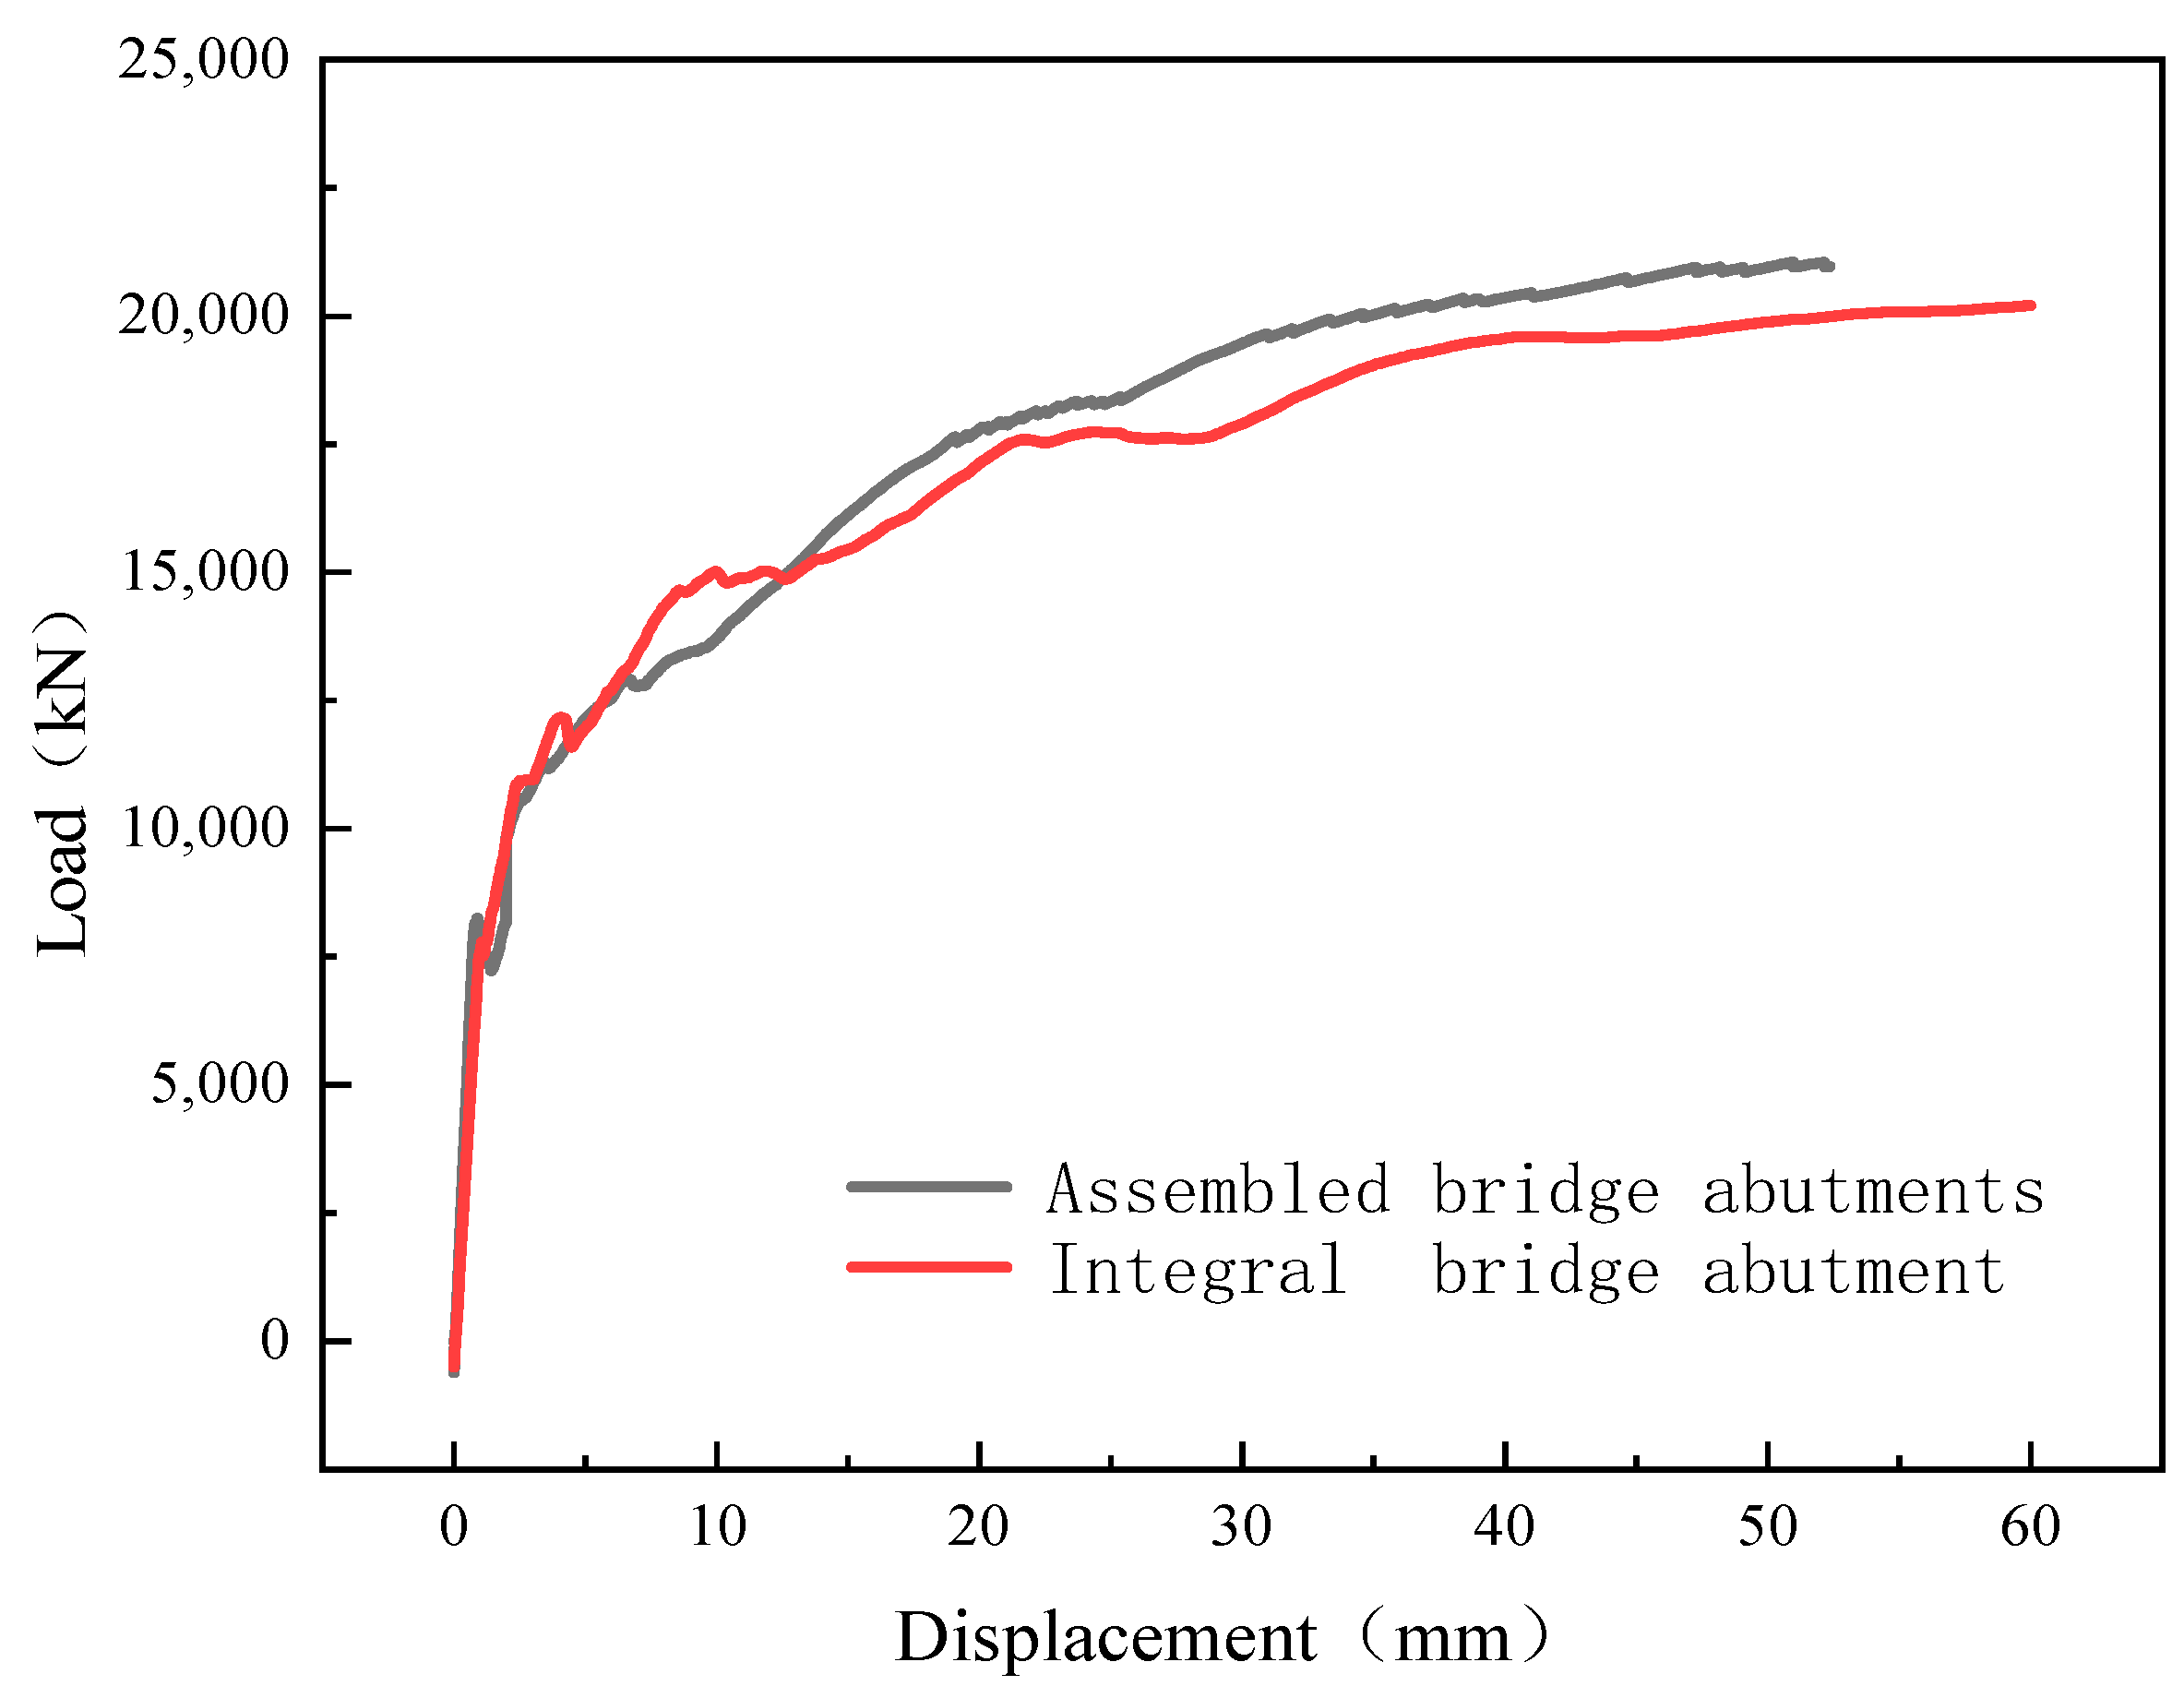
The load–deflection curves of the FE calculation of the cast-in-place and ARBA specimens are presented in Figure 13. The initial stiffnesses of the two structures were essentially the same at the beginning of the loading. After the initiation of cracking, both structures experienced a reduction in stiffnesses. Notably, the ARBA exhibited a considerably higher stiffness compared to the monolithic cast-in-place ribbed-slab abutment. The ultimate bearing capacity of the ARBA during the late structural loading stage was slightly larger than that of the overall cast-in-place ribbed-slab abutment. Nevertheless, the deformation capacity of the ARBA was inferior to that of the overall cast-in-place slab abutment, largely owing to the high structural stiffness of the steel structure at the intermediate joints of the ARBA and the high strength. However, this high stiffness makes the structure less deformable and more prone to shear damage.
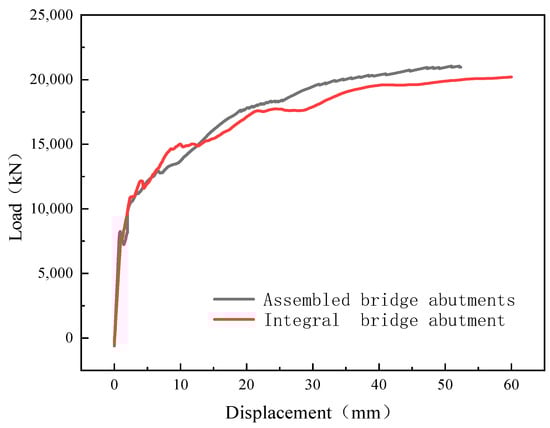
Figure 13.
Load–deflection curve of the mid-span section.
4. Parametric FE Analysis of Assembled Ribbed-Abutments
As the model tests conducted in the present study did not consider the influence of other relevant factors on the performance of the ARBA, the parameter expansion analysis was performed using the FE model to compensate for the lack of test numbers. The FE simulation results for the ARBA model demonstrated that the FE model better simulated the whole process of force on the ARBA under static load.
A parametric analysis of the FE model of an assembled ARBA with a flange connection was performed using proven modeling techniques. Since the structure was symmetrically loaded with two points, the middle position was a pure bending section, that is, the shear force at the joint position was zero, and the bending moment was constant. Therefore, in the parametric analysis in this subsection, single-point eccentric loading was used to investigate the effects of the stiffening rib thickness, number of bolts, and the thickness of the steel plate connected to the concrete on the structural performance. Figure 14 depicts a schematic of the loading position.
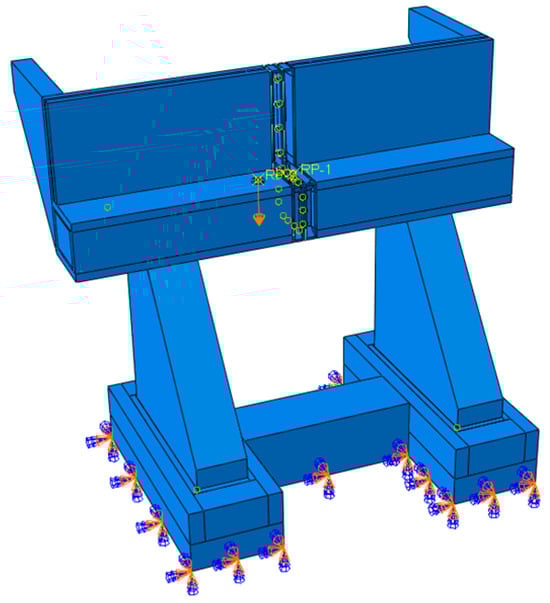
Figure 14.
Load Location Schematic.
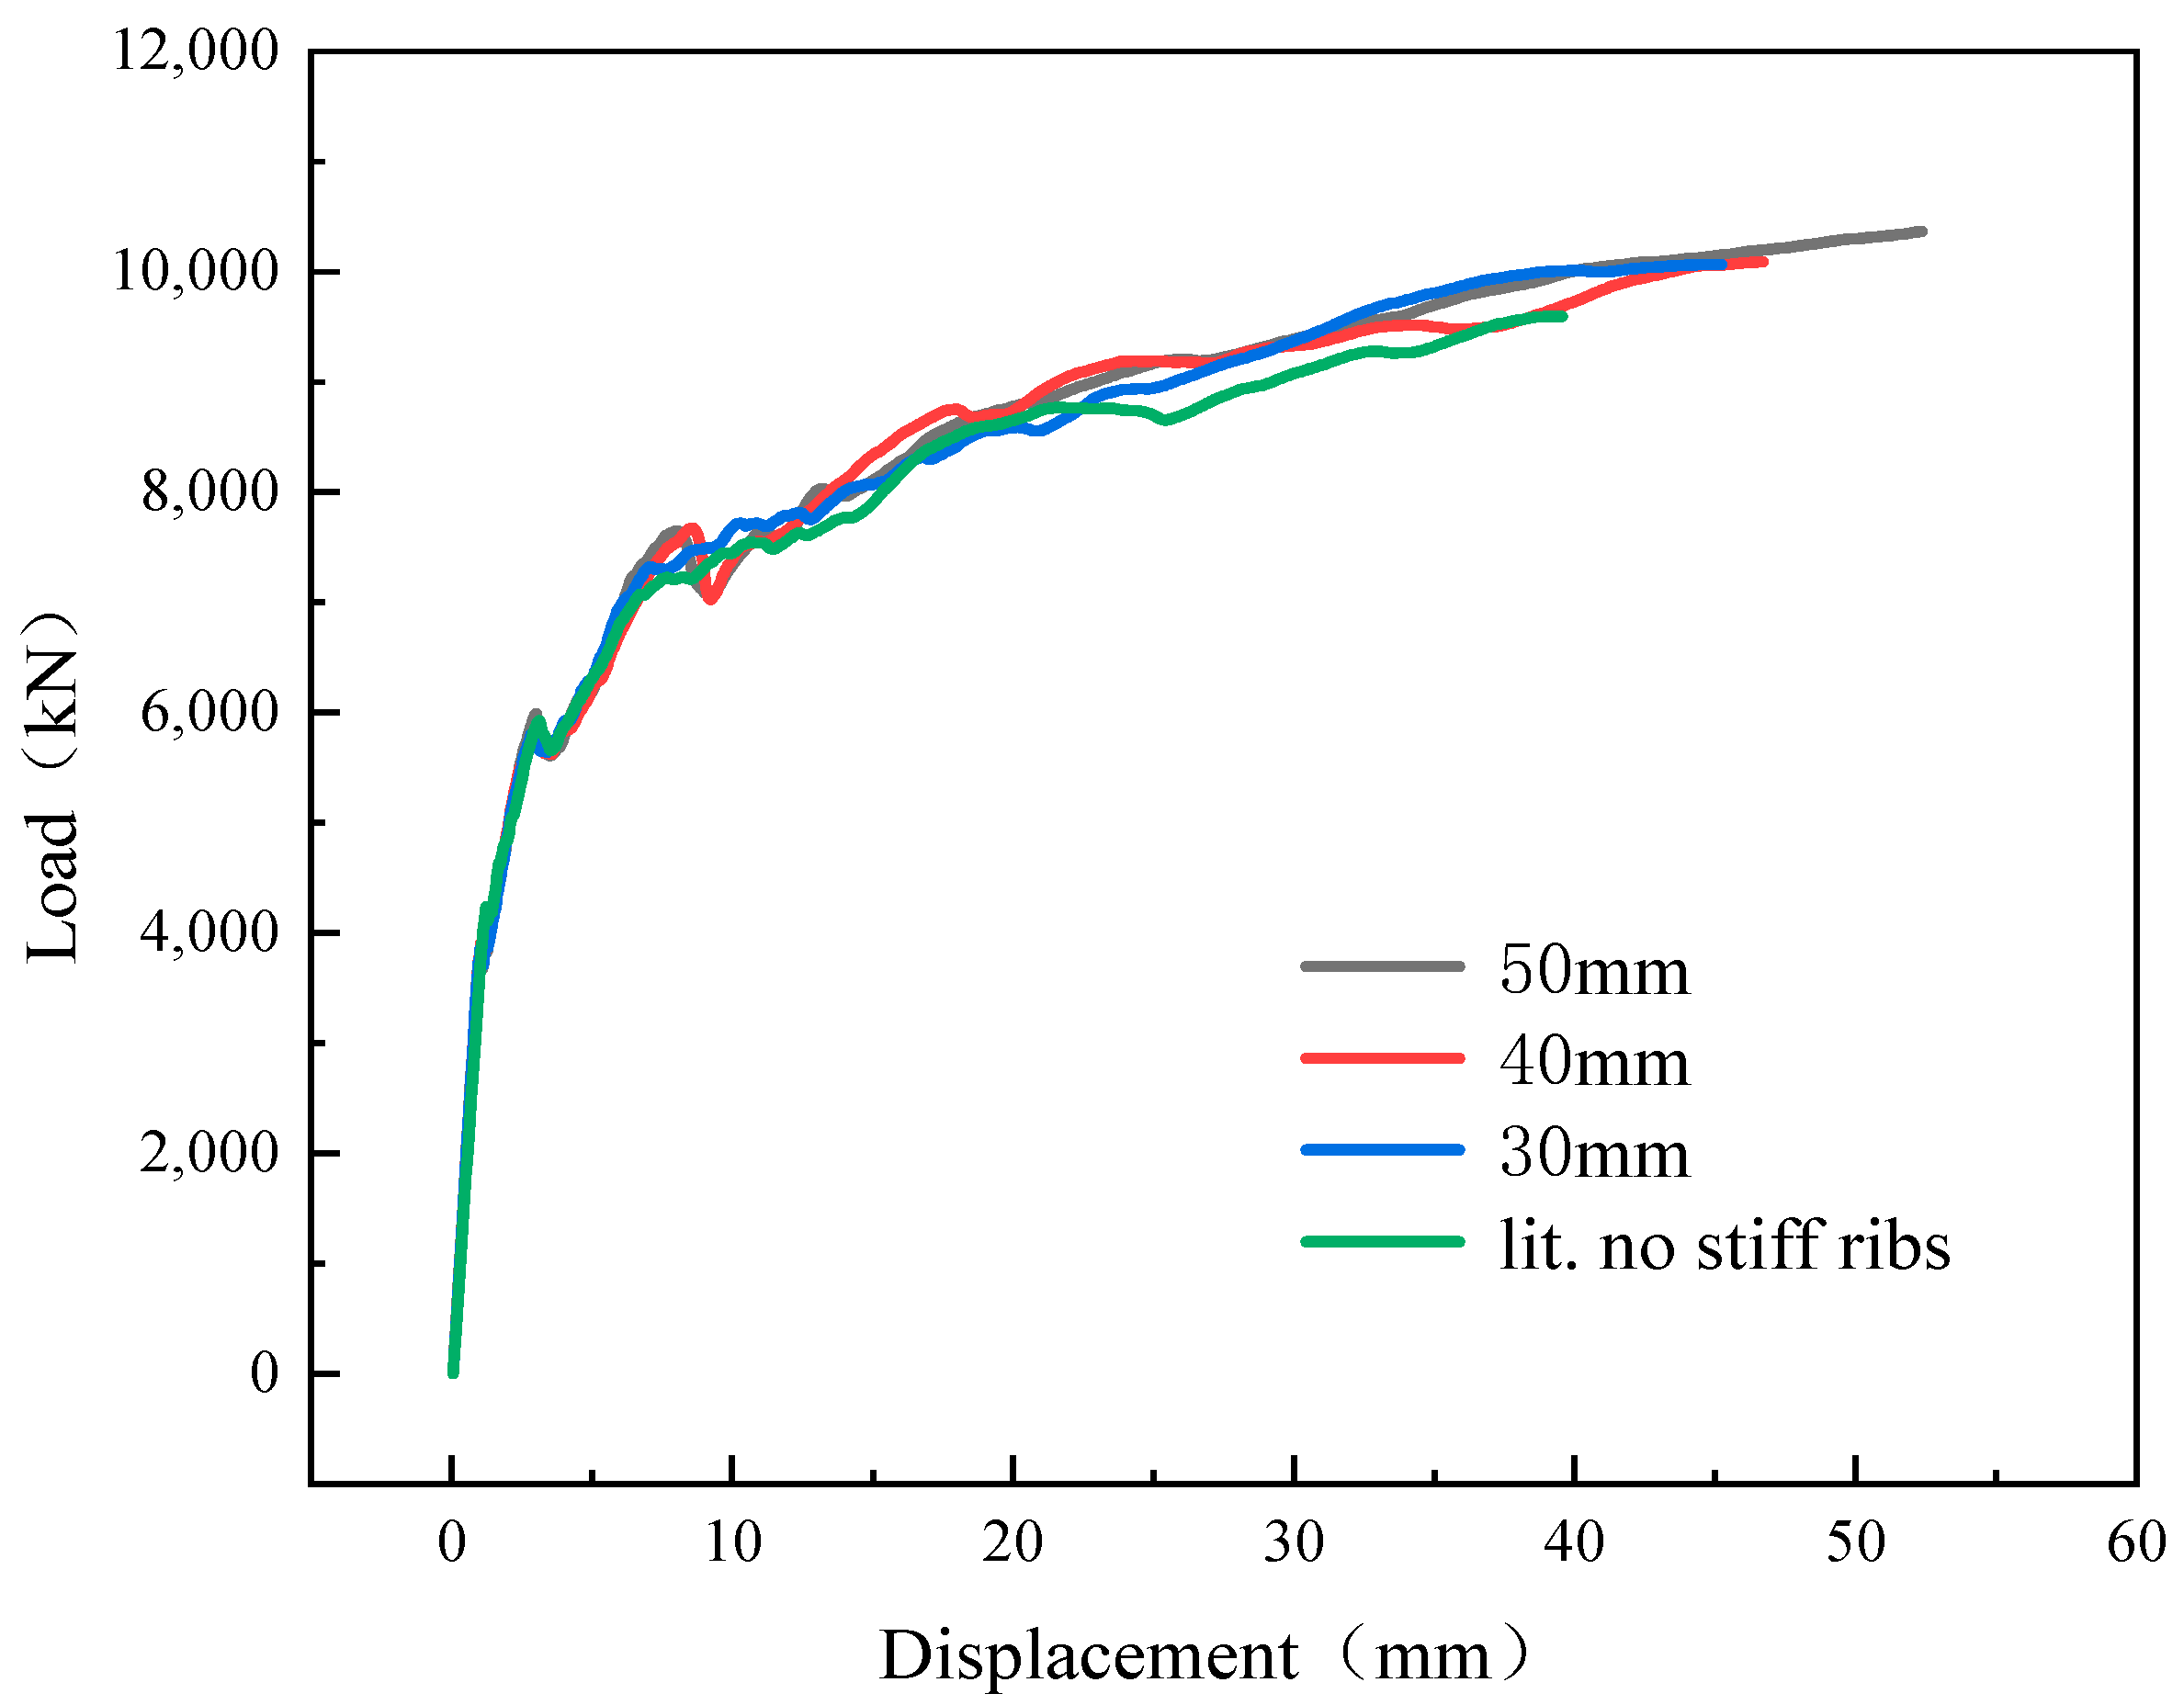
4.1. Analysis of the Effect of Stiffening Rib Thickness
The stiffening rib of the flange is key to ensuring the local stability of the ARBA and acts as a role transfer. To investigate the effect of the flange-stiffening rib thickness on the structure, we set the flange-stiffening rib thicknesses of 50 mm, 40 mm, and 30 mm with no analysis of the stiffening rib for the four working conditions, and the rest of the structural conditions remaining unchanged. The corresponding load–deflection curves are presented in Figure 15. The load–displacement curves of the flange models with different stiffening rib thicknesses exhibited the same trend. The ultimate displacements of the flange model with 50 mm stiffening ribs increased by 10.8, 13.6, and 21.5%, respectively, compared with those of the flange models with 40 mm, 30 mm, and no stiffening ribs, whereas the corresponding ultimate load capacities increased by 2.7, 2.9, and 7.4%, respectively.
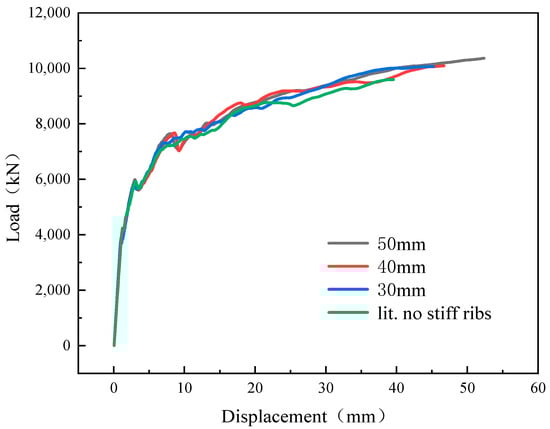
Figure 15.
Load–displacement curves for different stiffener rib thicknesses.
Stiffening ribs are strip-shaped stiffeners designed to ensure the local stability of the flange and transmit concentrated forces. The results in Figure 15 show that, increasing the thickness of the stiffeners during the construction process of bearing vertical loads can improve the stability of the structure, have a significant impact on the ultimate displacement of the structure, and slightly increase the ultimate bearing capacity of the structure, but with a small increase in amplitude.
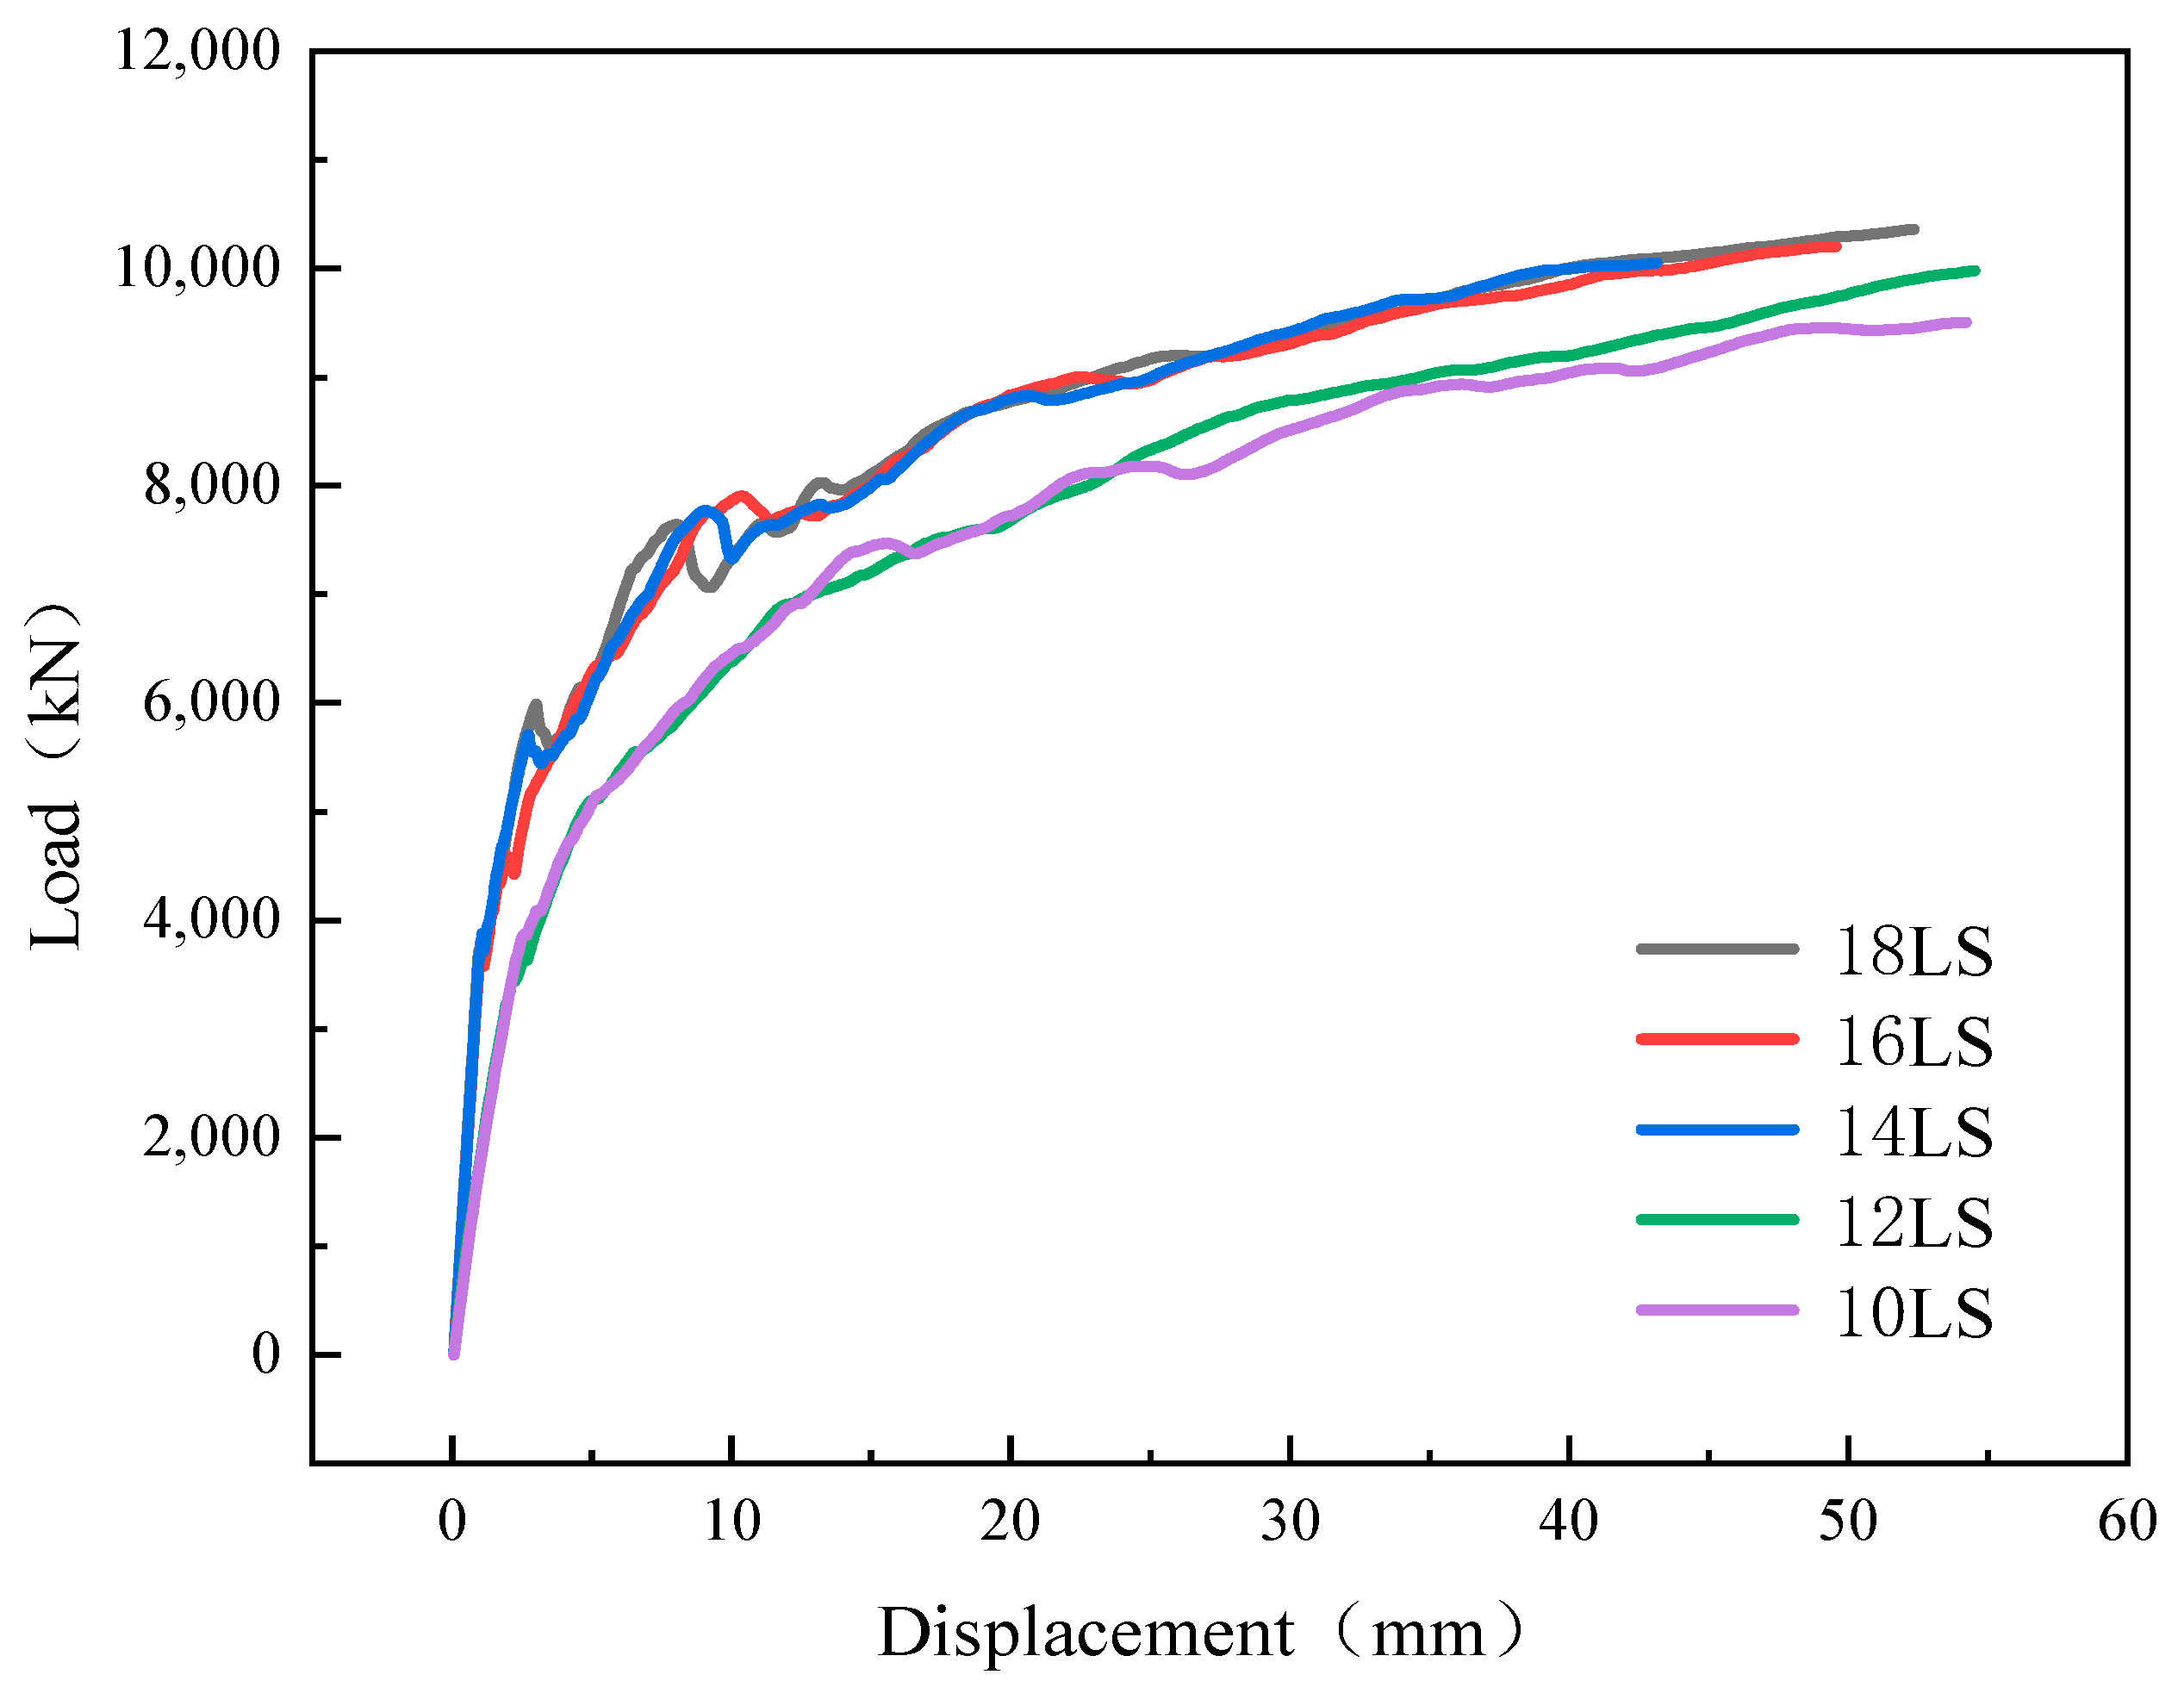
4.2. Analysis of the Impact of the Number of Screws
According to the results of the shear test, it can be concluded that the connection between the flanges primarily relies on bolting, with the number of bolts being an important factor affecting the structural load-carrying capacity. In this subsection, bolts with a diameter of 52 mm were used, and five working conditions were set for the parametric analysis: 18 bolts (18 LS), 16 bolts (16 LS), 14 bolts (14 LS), 12 bolts (12 LS), and 10 bolts (10 LS). According to the Bridge Regulation (JTG D62) [23], the shear capacity of the midspan section of the cast-in-place abutment model with the same reinforcement rate was calculated to be 6073.83 kN. The shear capacities with different numbers of bolts are listed in Table 6, and the corresponding load–deflection curves are shown in Figure 16. The trends of the load–displacement curves of the flange models with different numbers of bolts were the same. The load–displacement curves of the flange models with different numbers of bolts are shown in Figure 16. The load–displacement curves of the models with different numbers of flanges exhibited the same trend. The ultimate displacements of the ARBA with 18 LS flanges increased by 5.3 and 17.6% compared with those of the ARBA with 16 LS and 14 LS flanges, respectively, and decreased by 4.1 and 3.5% compared with those of the ARBA with 12 LS and 10 LS flanges, respectively. We hypothesized that, in case of fewer bolts in the flange, the stiffness of the structure decreased, leading to an increase in its ultimate displacement. The ultimate load–carrying capacity of the ARBA with 18 LS flanges increased by 1.5, 3, 3.7, and 8.3%, compared with the ARBA with 16 LS, 14 LS, 12 LS, and 10 LS flanges, respectively.
Table 6.
Bolt shear capacity.
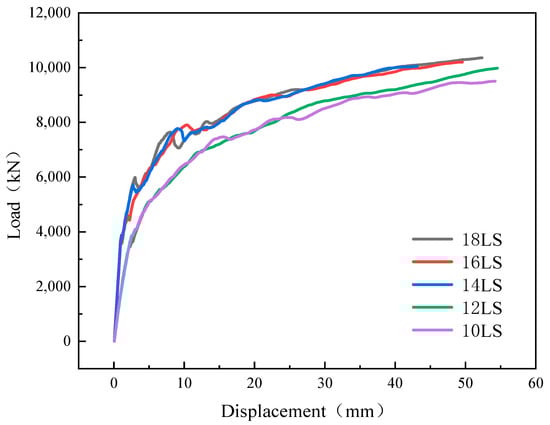
Figure 16.
Load–displacement curves of flanges with different numbers of bolts.
The strength of the flange plate is a very important parameter for the assembly of ribbed bridge abutments connected by the flange plate, which directly affects the stiffness of the flange nodes. If the strength of the flange is too small, it will cause the end plate to form plastic hinges in advance at the point of maximum stress, resulting in node failure. Excessive flange strength can waste material performance as well as increase the node brittleness. The results in Figure 16 show that, when 12 or more bolts were used in the flange, the rate of increase in the ultimate load-carrying capacity of the structure decreased; therefore, it is not recommended to use less than 12 bolts in the flange connection to avoid the excessive weakening of the load-carrying capacity of the structure. Moreover, when the number of bolts in the flange exceeded 12, the increase in the number of bolts versus the increase in the ultimate load-carrying capacity of the structure approached a linear relationship.
4.3. Analysis of the Length of Flange Anchoring Steel Plate
The connection between the flange and concrete structure was primarily related to the length of the steel plate inserted by the flange inside the concrete structure, and the length of the steel plate inside the concrete was an important factor affecting the stability of the joint between the back wall cap and flange. In this subsection, three types of flanges with different steel plate lengths (50 cm, 40 cm, and 30 cm) were set up for parametric analysis, and the corresponding load–deflection curves are shown in Figure 17. The load–displacement curves of the flange model with different steel plate lengths exhibited the same trend. The ultimate displacement of the ARBA with a 50 cm flange length increased by 24.6 and 29.2% compared to ARBA with 40 and 30 cm flanges, respectively. The ultimate load-carrying capacity increased by 3.2 and 6.2% compared to those of the prefabricated ARBA with 40 cm and 30 cm flanges, respectively.
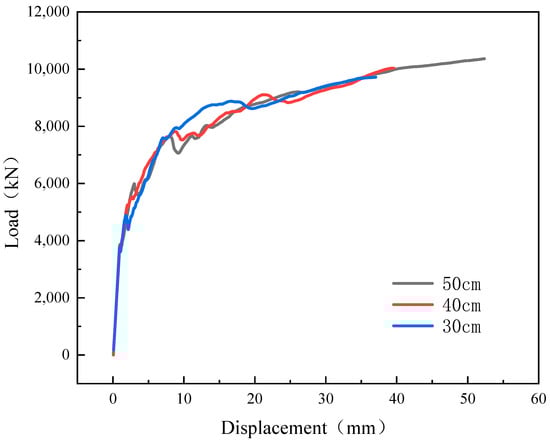
Figure 17.
Load–displacement curves of flanges with different plate lengths.
Figure 17 shows that extending the length of the flange anchoring steel plate effectively increased the stability of the force transmission of the structure by a large amount, and elevated the ultimate load capacity of the structure by a small amount.
In summary, we recommended the following parameter combinations to ensure that the structural damage mode remained unchanged and the economic and structural stress performance was maintained: the thickness of the stiffening ribs was 30 mm, the number of bolts was 12, and the length of the steel plate bonded to the concrete was 50 cm.
5. Conclusions
In this study, the force performance of an ARBA was compared with different structural connections, and the following theories were derived from the test and FE simulation results:
- (1)
- Compared with the cast-in-place bridge abutment model, the ultimate bearing capacity and ultimate deformation capacity of the two types of ARBA were significantly reduced, in which the bearing capacity of the flange-connected ARBA was significantly better than that of the ox-leg bolts, and the bearing capacity of the flange-connected ARBA reached that of the “cast-in-place equivalent.” However, the deformation capacity of the flange connection was slightly weaker than that of the clevis bolts, and the deformation capacity of the two types of ARBA was significantly weaker than that of the cast-in-place bridge abutment.
- (2)
- The flange joint structure is recommended to use the assembly of ribbed-plate bridge deck reasonable joint structure, due to which the performance of the assembly of ribbed-plate bridge deck in the force became “equivalent to that of the cast-in-place,” and later, maintenance was convenient.
- (3)
- Compared with the overall ARBA, under ideal conditions, the ultimate bearing capacity of the ribbed slab abutment could be better than that of the overall cast-in-place ribbed-slab abutment, whereas the ARBA deformation capacity of the structure was relatively weaker than that of the overall cast-in-place ribbed-slab abutment, and the damage to the two structures was the same. When the structure was damaged, the ARBA connection device of the ARBA did not reach the yield state.
- (4)
- Based on a comparative analysis of the ARBA connecting device, its stiffening rib thickness, the number of bolts, and the length of flange plate anchoring steel plate under different working conditions, the comprehensive consideration of the economy, structural stress performance, and other factors, the following combination of the parameters are recommended: the thickness of the stiffening rib is 30 mm, the number of bolts is 12, and a length of 50 cm of the length of flange plate anchoring steel plate.
Author Contributions
Conceptualization, Q.H. and T.W.; Method, Q.H.; Software, T.W. and Q.H.; Verification, Q.H., Y.S.; Data Management, Q.H.; Writing—Original manuscript preparation, Q.H.; Writing—Review and editing, Y.S. and Y.G. All authors have read and agreed to the published version of the manuscript.
Funding
This research was sponsored by the National Natural Science Foundation of China (No.52278159).
Institutional Review Board Statement
Not applicable.
Informed Consent Statement
Not applicable.
Data Availability Statement
All data, models, and codes generated or used in the study are found in published articles.
Conflicts of Interest
The authors declare no conflict of interest.
References
- Zhang, J.; Tao, F.; Su, T. Research on assembly building integration system based on BIM technology. Build. Sci. 2018, 34, 97–102+129. [Google Scholar]
- Xue, L. Research on the Key Technology of Manufacturing Green Composite Concrete Girder Bridge; Northeastern University: Boston, MA, USA, 2016. [Google Scholar]
- Khan, M.A. Accelerated Bridge Construction: Best Practices and Techniques; Butler Worth Heinemann: Oxford, UK, 2014. [Google Scholar]
- Xiang, Y.-Q.; Zhu, S.; Zhao, Y. Research progress of rapid construction bridge. China J. Highw. 2018, 31, 1–27. [Google Scholar]
- Scanlon, A.; Aswad, A.; Stellar, J. Precast Posttensioned Abutment System and Precast Superstructure for Rapid On-Site Construction. Transp. Res. Rec. 2002, 1814, 65–71. [Google Scholar] [CrossRef]
- Zhuo, W.D.; Li, C.C.; Sun, Z.X.; Xiao, Z.R.; Lin, Z.T.; Huang, X.Y. Static performance test of segmentally prefabricated prestressed concrete cover beam. J. Tongji Univ. (Nat. Sci. Ed.) 2022, 50, 1752–1760. [Google Scholar]
- Li, C.; Zhuo, W.; Lin, K.; Sun, Y.; Chen, M. Experimental study on flexural behavior of segmental precast large-cantilevered prestressed concrete cap beam. Structures 2023, 57, 105166. [Google Scholar] [CrossRef]
- Bridge Precast Substructure Units [Z]. 2004 NOVA Award Nomination 14. 2004.
- Stamnas, P.E.; Whittemore, M.D. All Precast Substructure Accelerates Construction of Prestressed Concrete Bridge in New Hampshire. PCI J. 2005, 50, 26–39. [Google Scholar] [CrossRef]
- Guidelines for Accelerated Bridge Construction Using Precast/Prestressed Concrete Components; PCI Northeast: Belmont, MA, USA, 2006.
- Palls, M.L.; Newman, P. Accelerated Bridge Design and Construction around the Country. In Proceedings of the 15th Annual Caltrans/PCMAC Bridge Seminar, Sacramento, CA, USA, 15 October 2008. [Google Scholar]
- Benoit, N.D.; Calderwood, E.T.; Frankhauser, W.L., Jr.; Hanson, D.R.; Heil, K.R.; Tweedie, J.J. Instant Bridge—Just Add Water; Palm Springs, CA, USA, 2005. [Google Scholar]
- Huh, B.P.; Low, J.P. Moose Creek Bridge, the First Field Application of Fully Prefabricated Bridges in Ontario; Atlanta, GA, USA, 2004. [Google Scholar]
- Wolfe, R.W.; Chung, P.; Dermegerdician, A. Accelerating Bridge Construction-Precast Abutment Solutions; Phoenix, AZ, USA, 2007. [Google Scholar]
- Yong, Z.; Rui, L.; Xiaofeng, W.; Chao, H. Experimental study on seismic performance of prefabricated columns with large-diameter high-strength steel bar grouted sleeve connection. China Civ. Eng. J. 2017, 50, 27–35+71. [Google Scholar]
- Crawford, G.A.; Parikh, H.; Thompson, J.A. Accelerated Replacement of a Three Span Bridge in Pennsylvania; Grapevine, TX, USA, 2006. [Google Scholar]
- Bu, Z.; Guo, J.; Zheng, R.; Song, J.; Lee, G.C. Cyclic performance and simplified pushover analyses of precast segmental concrete bridge columns with circular section. Earthq. Eng. Eng. Vib. 2016, 15, 297–312. [Google Scholar] [CrossRef]
- Chen, Y.J.; Ding, M.J.; Xu, W.B.; Wang, J.; Fang, R.; Du, X.L.; Han, Q. Research progress on prefabricated assembled pier system and its seismic performance. China J. Highw. Transp. 2022, 35, 56–76. [Google Scholar]
- Terry, J.; Wipf, F.; Klaiber, W.; Hockewman, S. Precast Concrete Elements for Accelerated Bridge Construction: Laboratory Testing of Precast Substructure Components; Bone Country Bridge [R]; Bridge Engineering Center: Ames, IA, USA, January 2009. [Google Scholar]
- Terry, J.; Wipf, F.; Klaiber, W.; Hockewman, S. Precast Concrete Elements for Accelerated Bridge Construction: Laboratory Testing, Field Testing, Evaluation of a Precast Country Bridge; [R]; Bridge Engineering Center: Ames, IA, USA, January 2009. [Google Scholar]
- He, D. Design Scheme and Finite Element Analysis of Cast-in-Place Assembled Bridge Abutment. Master’s Thesis, Wuhan University of Technology, Wuhan, China, 2011. [Google Scholar]
- Xia, L.; Hu, Z.; Shah, Y.I. Longitudinal load distribution of a weakly connected prefabricated bridge abutment. Arch. Appl. Mech. 2021, 91, 4121–4140. [Google Scholar] [CrossRef]
- JTG D62-2012; Design Specification for Reinforced and Prestressed Concrete Bridges and Culverts for Highways. China Communication Press: Beijing, China, 2012.


Disclaimer/Publisher’s Note: The statements, opinions and data contained in all publications are solely those of the individual author(s) and contributor(s) and not of MDPI and/or the editor(s). MDPI and/or the editor(s) disclaim responsibility for any injury to people or property resulting from any ideas, methods, instructions or products referred to in the content. |
© 2024 by the authors. Licensee MDPI, Basel, Switzerland. This article is an open access article distributed under the terms and conditions of the Creative Commons Attribution (CC BY) license (https://creativecommons.org/licenses/by/4.0/).