

A New Flexometric Method to Evaluate Range of Movement: A Validity and Reliability Study

 , , , and
Abstract
1. Introduction
2. Materials and Methods
2.1. Participants
2.2. Procedures
2.2.1. The Gold Standard
2.2.2. Field-Based Tests
2.2.3. Raters’ Training
2.2.4. Measuring Protocol
2.3. Data Analysis
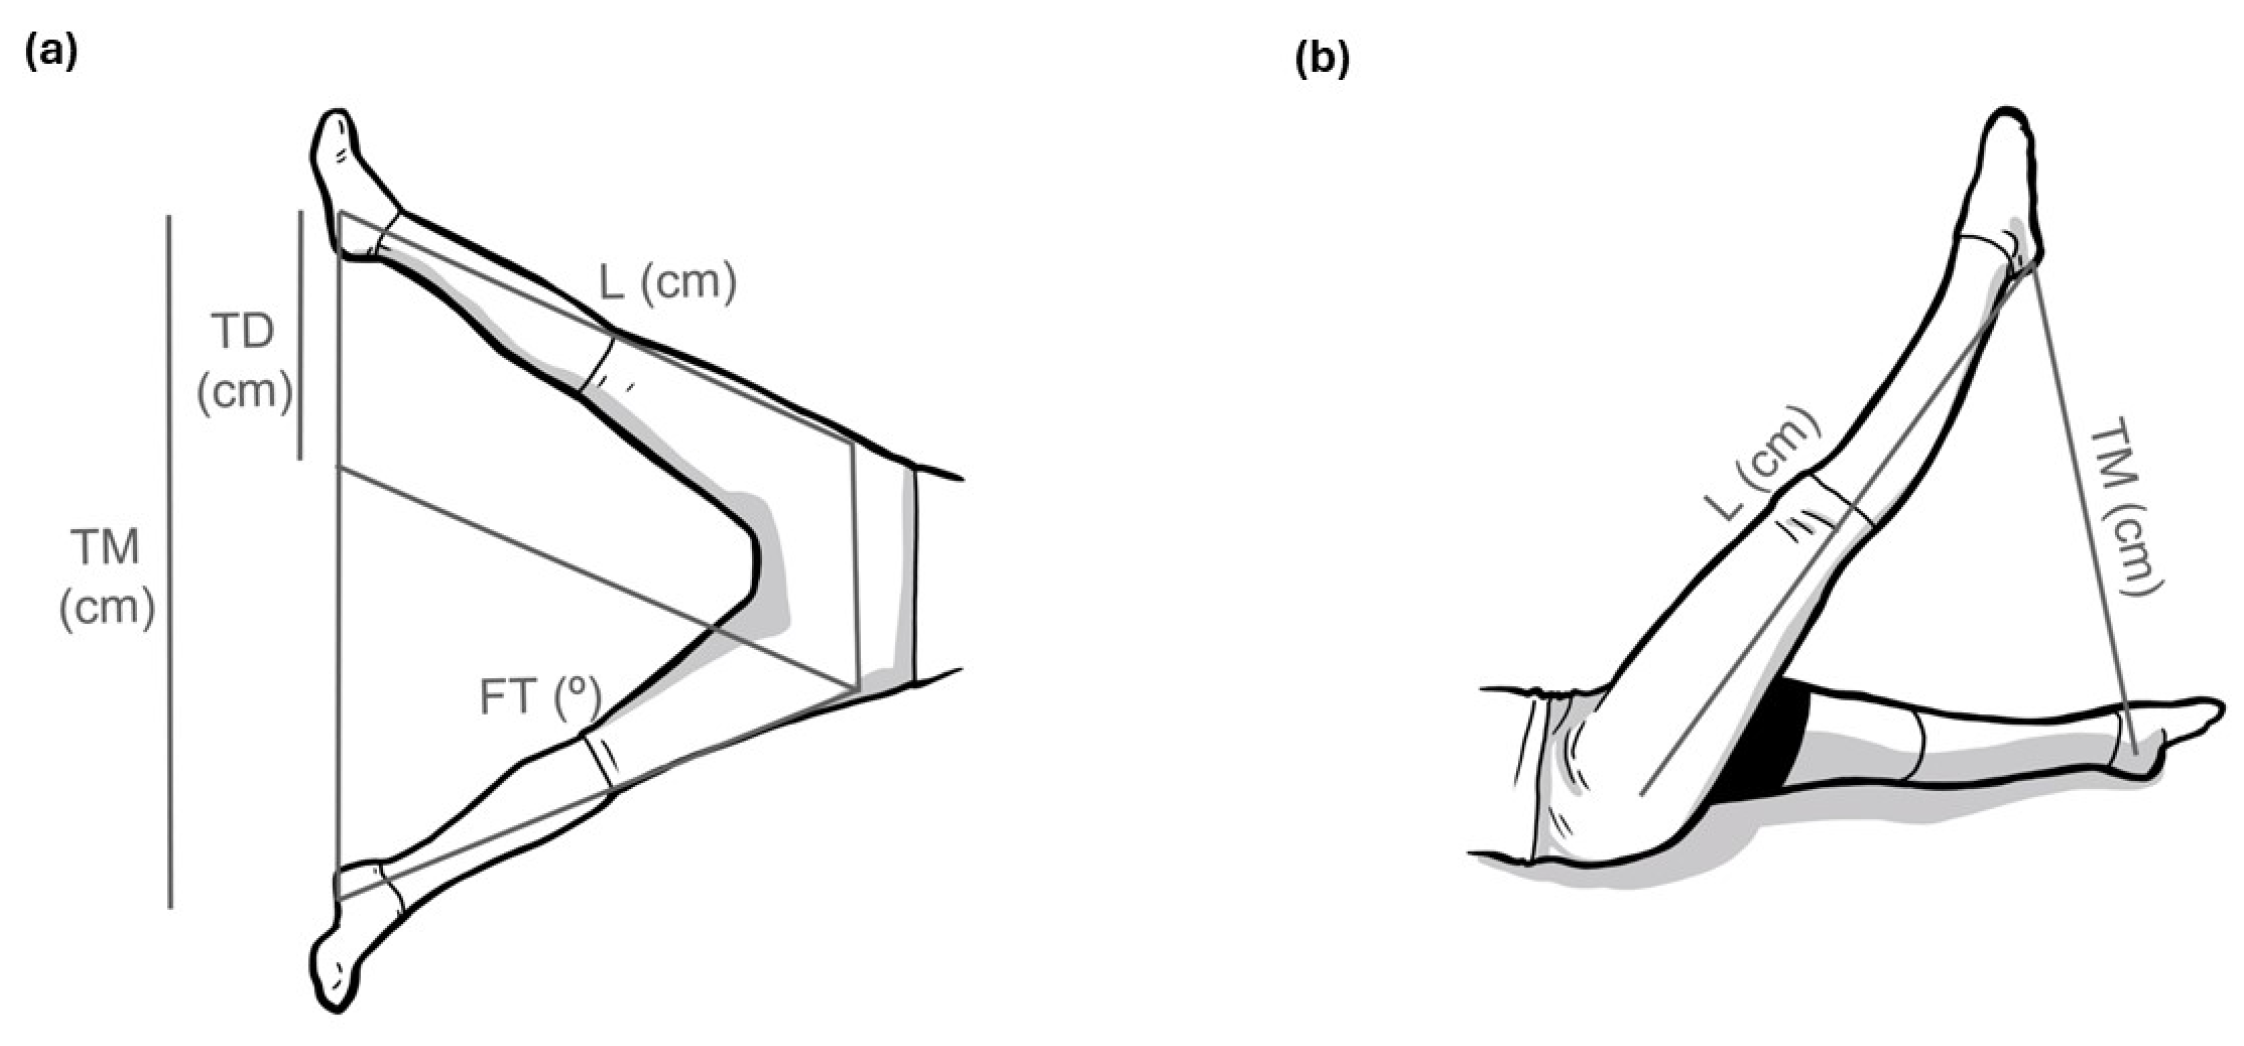
2.3.1. The Flexometric Method
- Length of the leg (Lc): It is the distance between the greater trochanter and the outer edge of the calcaneus.
- Bitrochanteric (Ac): Distance between both greater trochanters of each leg when the subject is standing and the lateral process of the tuberosity of the calcaneus.
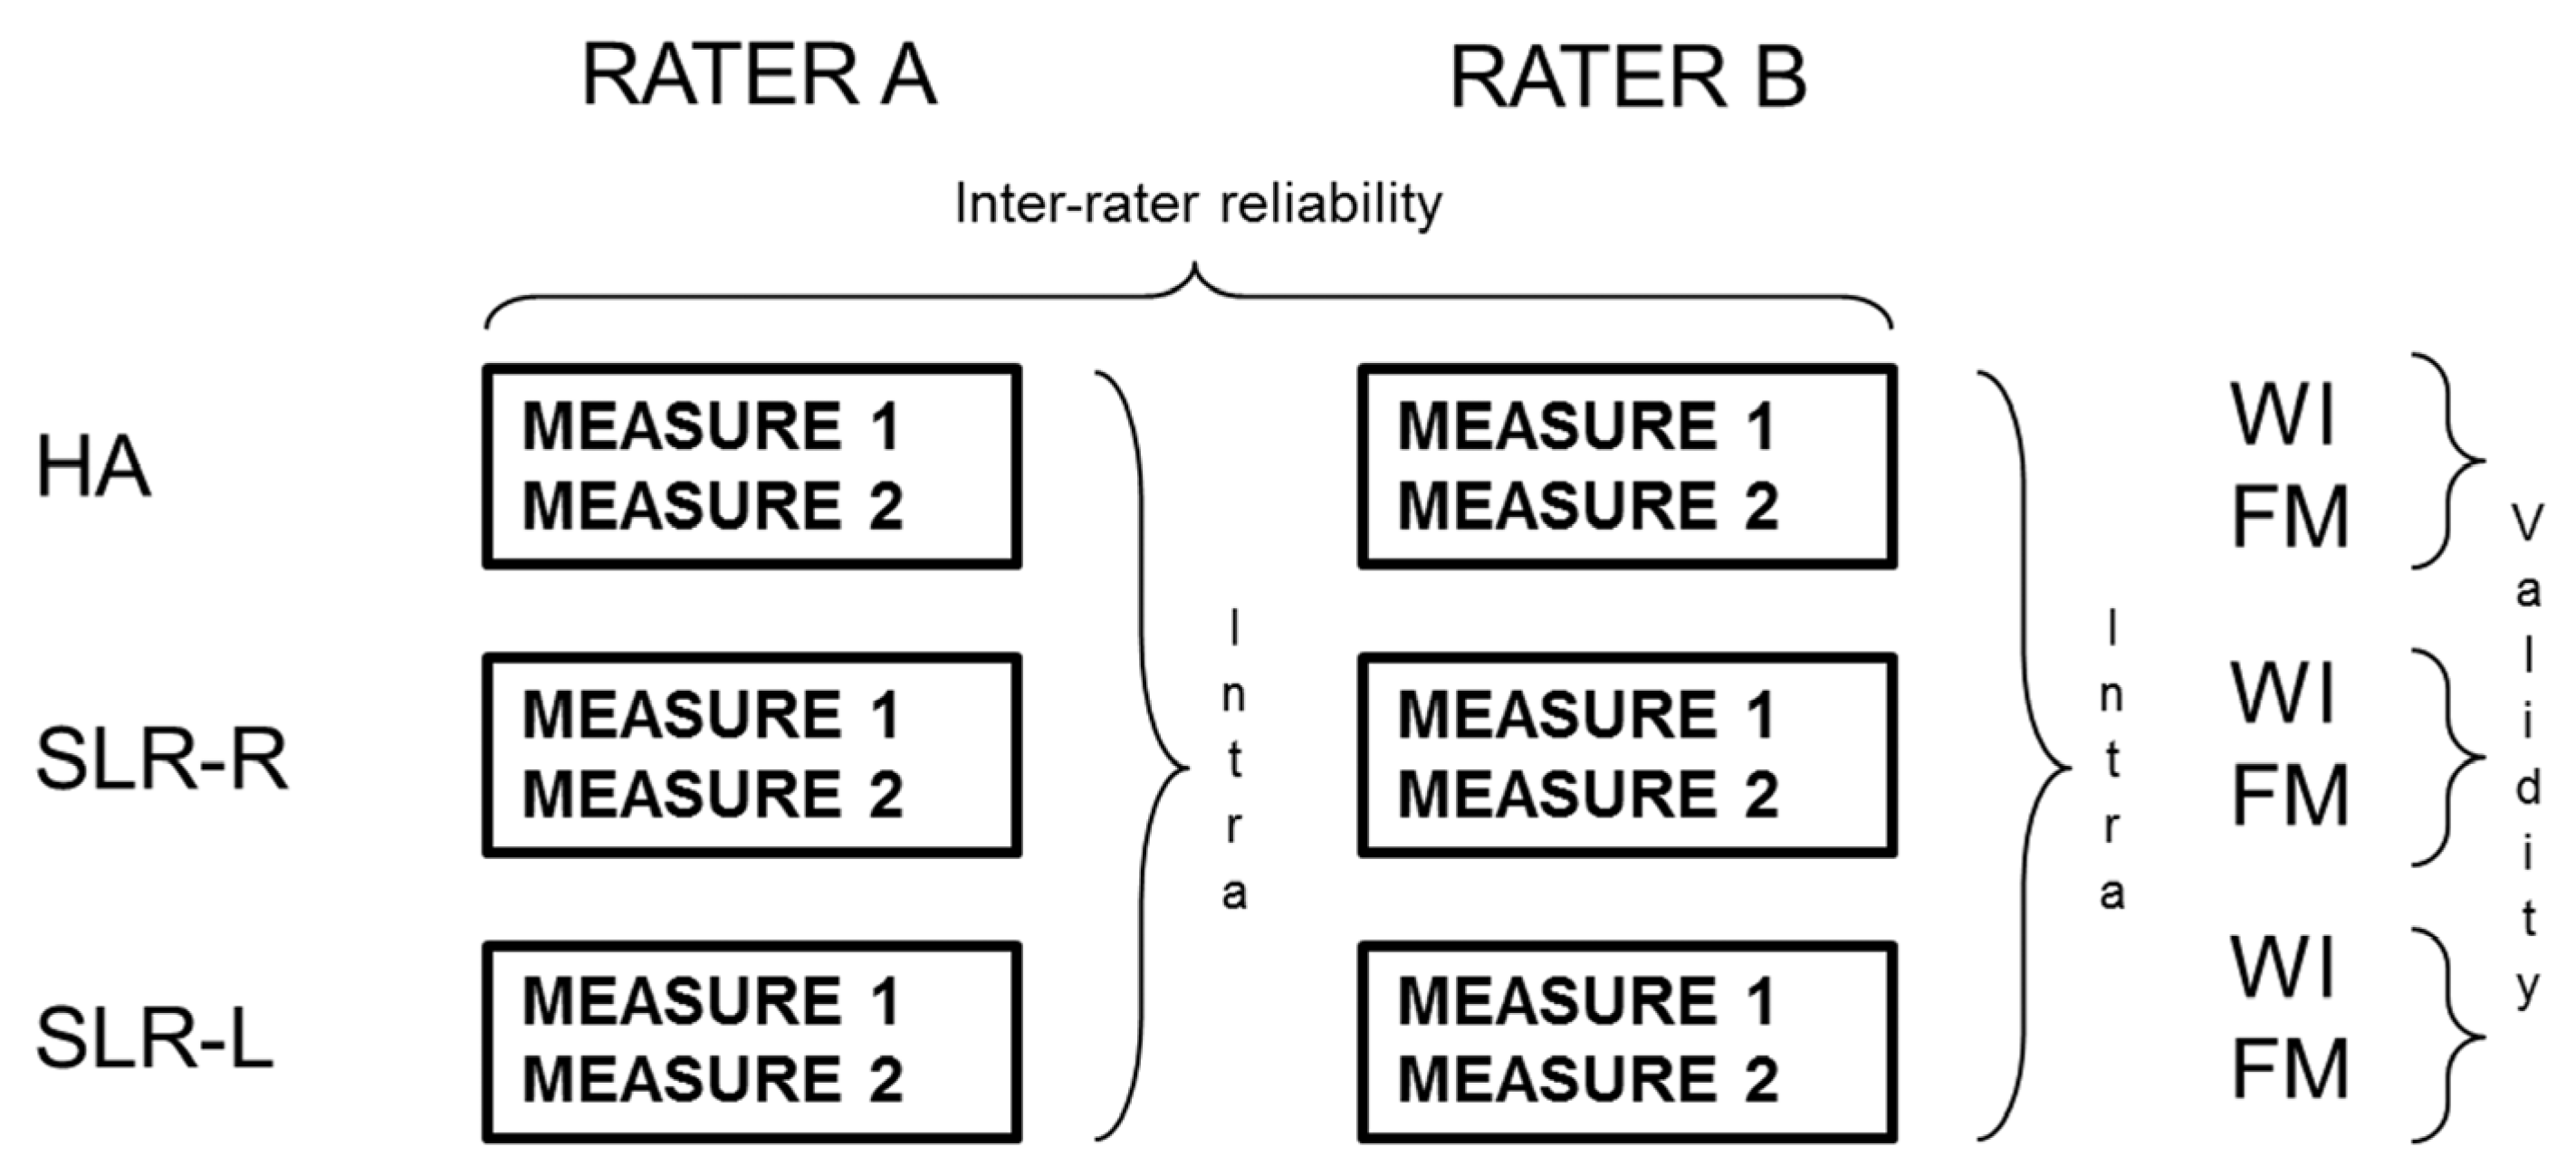
2.3.2. Statistical Analyses
3. Results
4. Discussion
5. Conclusions
Author Contributions
Funding
Institutional Review Board Statement
Informed Consent Statement
Data Availability Statement
Acknowledgments
Conflicts of Interest
References
- Davis Hammonds, A.L.; Laudner, K.G.; McCaw, S.; McLoda, T.A. Acute Lower Extremity Running Kinematics after a Hamstring Stretch. J. Athl. Train. 2012, 47, 5–14. [Google Scholar] [CrossRef]
- Muyor, J.M.; López-Miñarro, P.A.; Alacid, F. The Relationship between Hamstring Muscle Extensibility and Spinal Postures Varies with the Degree of Knee Extension. J. Appl. Biomech. 2013, 29, 678–686. [Google Scholar] [CrossRef] [PubMed]
- Tak, I.; Engelaar, L.; Gouttebarge, V.; Barendrecht, M.; Van Den Heuvel, S.; Kerkhoffs, G.; Langhout, R.; Stubbe, J.; Weir, A. Is Lower Hip Range of Motion a Risk Factor for Groin Pain in Athletes? A Systematic Review with Clinical Applications. Br. J. Sports Med. 2017, 51, 1611–1621. [Google Scholar] [CrossRef] [PubMed]
- Radwan, A.; Bigney, K.A.; Buonomo, H.N.; Jarmak, M.W.; Moats, S.M.; Ross, J.K.; Tatarevic, E.; Tomko, M.A. Evaluation of Intra-Subject Difference in Hamstring Flexibility in Patients with Low Back Pain: An Exploratory Study. J. Back. Musculoskelet. Rehabil. 2015, 28, 61–66. [Google Scholar] [CrossRef] [PubMed]
- Esola, M.A.; McClure, P.W.; Fitzgerald, G.K.; Siegler, S. Analysis of Lumbar Spine and Hip Motion during Forward Bending in Subjects with and without a History of Low Back Pain. Spine 1996, 21, 71–78. [Google Scholar] [CrossRef]
- Scattone Silva, R.; Nakagawa, T.H.; Ferreira, A.L.G.; Garcia, L.C.; Santos, J.E.M.; Serrão, F. V Lower Limb Strength and Flexibility in Athletes with and without Patellar Tendinopathy. Phys. Ther. Sport 2016, 20, 19–25. [Google Scholar] [CrossRef] [PubMed]
- Piva, S.R.; Goodnite, E.A.; Childs, J.D. Strength around the Hip and Flexibility of Soft Tissues in Individuals with and without Patellofemoral Pain Syndrome. J. Orthop. Sports Phys. Ther. 2005, 35, 793–801. [Google Scholar] [CrossRef] [PubMed]
- Dallinga, J.M.; Benjaminse, A.; Lemmink, K.A.P.M. Which Screening Tools Can Predict Injury of the Lower Extremeties in Team Sports? Sports Med. 2012, 42, 791–815. [Google Scholar] [CrossRef] [PubMed]
- Kolber, M.J.; Vega, F., Jr.; Widmayer, K.; Cheng, M.-S.S. The Reliability and Minimal Detectable Change of Shoulder Mobility Measurements Using a Digital Inclinometer. Physiother. Theory Pract. 2011, 27, 176–184. [Google Scholar] [CrossRef]
- Paul, D.J.; Nassis, G.P.; Whiteley, R.; Marques, J.B.; Kenneally, D.; Chalabi, H. Acute Responses of Soccer Match Play on Hip Strength and Flexibility Measures: Potential Measure of Injury Risk. J. Sports Sci. 2014, 32, 1318–1323. [Google Scholar] [CrossRef]
- Ng, J.K.F.; Kippers, V.; Richardson, C.A.; Parnianpour, M. Range of Motion and Lordosis of the Lumbar Spine: Reliability of Measurement and Normative Values. Spine 2001, 26, 53–60. [Google Scholar] [CrossRef] [PubMed]
- Van Herp, G.; Rowe, P.; Salter, P.; Paul, J.P. Three-dimensional Lumbar Spinal Kinematics: A Study of Range of Movement in 100 Healthy Subjects Aged 20 to 60+ Years. Rheumatology 2000, 39, 1337–1340. [Google Scholar] [CrossRef] [PubMed]
- Pazira, P.; Rostami Haji-Abadi, M.; Zolaktaf, V.; Sabahi, M.; Pazira, T. The Better Way to Determine the Validity, Reliability, Objectivity and Accuracy of Measuring Devices. Work. 2016, 54, 495–505. [Google Scholar] [CrossRef] [PubMed]
- Ensink, F.-B.M.; Saur, P.M.M.; Frese, K.; Seeger, D.; Hildebrandt, J. Lumbar Range of Motion: Influence of Time of Day and Individual Factors on Measurements. Spine 1996, 21, 1339–1343. [Google Scholar] [CrossRef] [PubMed]
- Lee, S.-W.; Wong, K.W.N.; Chan, M.-K.; Yeung, H.-M.; Chiu, J.L.F.; Leong, J.C.Y. Development and Validation of a New Technique for Assessing Lumbar Spine Motion. Spine 2002, 27, E215–E220. [Google Scholar] [CrossRef]
- Mayer, T.G.; Kondraske, G.; Beals, S.B.; Gatchel, R.J. Spinal Range of Motion: Accuracy and Sources of Error with Inclinometric Measurement. Spine 1997, 22, 1976–1984. [Google Scholar] [CrossRef]
- Perret, C.; Poiraudeau, S.; Fermanian, J.; Revel, M. Pelvic Mobility When Bending Forward in Standing Position: Validity and Reliability of 2 Motion Analysis Devices. Arch. Phys. Med. Rehabil. 2001, 82, 221–226. [Google Scholar] [CrossRef] [PubMed]
- Balsalobre-Fernández, C.; Romero-Franco, N.; Jiménez-Reyes, P. Concurrent Validity and Reliability of an IPhone App for the Measurement of Ankle Dorsiflexion and Inter-Limb Asymmetries. J. Sports Sci. 2018, 37, 249–253. [Google Scholar] [CrossRef]
- Muyor, J.M. Validity and Reliability of a New Device (WIMU®) for Measuring Hamstring Muscle Extensibility. Int. J. Sports Med. 2017, 38, 691–695. [Google Scholar] [CrossRef] [PubMed]
- Norkin, C.C.; White, D.J. Measurement of Joint Motion: A Guide to Goniometry; F. A. Davis: Philadelphia, PA, USA, 2016; ISBN 0803658478. [Google Scholar]
- Bandy, W.D.; Reese, N.B. Joint Range of Motion and Muscle Length Testing; Elsevier: Amsterdam, The Netherlands, 2009. [Google Scholar]
- Lea, R.D.; Gerhardt, J.J. Range-of-Motion Measurements. JBJS 1995, 77, 784–798. [Google Scholar] [CrossRef]
- van Trijffel, E.; van de Pol, R.J.; Oostendorp, R.A.B.; Lucas, C. Inter-Rater Reliability for Measurement of Passive Physiological Movements in Lower Extremity Joints Is Generally Low: A Systematic Review. J. Physiother. 2010, 56, 223–235. [Google Scholar] [CrossRef]
- van der Wurff, P.; Hagmeijer, R.H.M.; Meyne, W. Clinical Tests of the Sacroiliac Joint: A Systematic Methodological Review. Part 1: Reliability. Man. Ther. 2000, 5, 30–36. [Google Scholar] [CrossRef]
- Kirby, R.F. Kirby’s Guide to Fitness and Motor Performance Tests; BenOak Pub. Co.: Cape Girardeau, MO, USA, 1991; ISBN 9780962909832. [Google Scholar]
- Moras, G. Amplitud de Moviment Articular i La Seva Valoració: El Test Flexomètric. Ph.D. Thesis, University of Barcelona, Barcelona, Spain, 2002. [Google Scholar]
- MacDougall, J.D.; Wenger, H.A.; Green, H.J. Physiological Testing of the High-Performance Athlete; Human Kinetics Books: Champaign, IL, USA, 1991; ISBN 0873223004. [Google Scholar]
- Tanigawa, M.C. Comparison of the Hold-Relax Procedure and Passive Mobilization on Increasing Muscle Length. Phys. Ther. 1972, 52, 725–735. [Google Scholar] [CrossRef]
- Frost, M.; Stuckey, S.; Smalley, L.A.; Dorman, G. Reliability of Measuring Trunk Motions in Centimeters. Phys. Ther. 1982, 62, 1431–1437. [Google Scholar] [CrossRef]
- Hsieh, C.-Y.; Walker, J.M.; Gillis, K. Straight-Leg-Raising Test: Comparison of Three Instruments. Phys. Ther. 1983, 63, 1429–1433. [Google Scholar] [CrossRef] [PubMed]
- Wakefield, C.B.; Halls, A.; Difilippo, N.; Cottrell, G.T. Reliability of Goniometric and Trigonometric Techniques for Measuring Hip-Extension Range of Motion Using the Modified Thomas Test. J. Athl. Train. 2015, 50, 460–466. [Google Scholar] [CrossRef] [PubMed]
- Oliva-Lozano, J.M.; Martín-Fuentes, I.; Muyor, J.M. Validity and Reliability of a New Inertial Device for Monitoring Range of Motion at the Pelvis during Sexual Intercourse. Int. J. Environ. Res. Public Health 2020, 17, 2884. [Google Scholar] [CrossRef] [PubMed]
- Oliva-Lozano, J.M.; Martín-Fuentes, I.; Muyor, J.M. Validity and Reliability of an Inertial Device for Measuring Dynamic Weight-Bearing Ankle Dorsiflexion. Sensors 2020, 20, 399. [Google Scholar] [CrossRef] [PubMed]
- García-Rubio, J.; Pino, J.; Olivares, P.R.; Ibáñez, S.J. Validity and Reliability of the WIMUTM Inertial Device for the Assessment of Joint Angulations. Int. J. Environ. Res. Public Health 2020, 17, 193. [Google Scholar] [CrossRef]
- Portney, L.G.; Watkins, M.P. Foundations of Clinical Research: Applications to Practice, 3rd ed.; Prentice Hall: Upper Saddle River, NJ, USA, 2009; ISBN 1540-580X. [Google Scholar]
- Burdock, E.I.; Fleiss, J.L.; Hardesty, A.S. A New View of Inter-Observer Agreement. Pers. Psychol. 1963, 16, 373–384. [Google Scholar] [CrossRef]
- de Winter, A.F.; Heemskerk, M.A.M.B.; Terwee, C.B.; Jans, M.P.; Devillé, W.; Van Schaardenburg, D.-J.; Scholten, R.J.P.M.; Bouter, L.M. Inter-Observer Reproducibility of Measurements of Range of Motion in Patients with Shoulder Pain Using a Digital Inclinometer. BMC Musculoskelet. Disord. 2004, 5, 18. [Google Scholar] [CrossRef] [PubMed]
- Aaronson, N.; Alonso, J.; Burman, A.; Lohr, K.N.; Patrick, D.L.; Perrin, E.; Stein, R.E. Assessing Health Status and Quality-of-Life Instruments: Attributes and Review Criteria. Qual. Life Res. 2002, 11, 193–205. [Google Scholar] [PubMed]
- Hinderer, K.A.; Richardson, P.K.; Atwater, S.W. Clinical Implication of the Peabody Developmental Motor Scales: A Constructive Review. Phys. Occup. Ther. Pediatr. 1989, 9, 81–106. [Google Scholar] [CrossRef] [PubMed]
- Haley, S.M.; Fragala-Pinkham, M.A. Interpreting Change Scores of Tests and Measures Used in Physical Therapy. Phys. Ther. 2006, 86, 735–743. [Google Scholar] [CrossRef] [PubMed]
- Fowler, J.; Jarvis, P.; Chevannes, M. Practical Statistics for Nursing and Health Care; John Wiley & Sons: Hoboken, NJ, USA, 2013; ISBN 111868561X. [Google Scholar]
- Streiner, D.L.; Norman, G.R.; Cairney, J. Health Measurement Scales: A Practical Guide to Their Development and Use; Oxford University Press: Oxford, UK, 2015; ISBN 0199685215. [Google Scholar]
- Hoeger, W.W.K.; Hopkins, D.R. A Comparison of the Sit and Reach and the Modified Sit and Reach in the Measurement of Flexibility in Women. Res. Q. Exerc. Sport 1992, 63, 191–195. [Google Scholar] [CrossRef]
- Minkler, S.; Patterson, P. The Validity of the Modified Sit-and-Reach Test in College-Age Students. Res. Q. Exerc. Sport 1994, 65, 189–192. [Google Scholar] [CrossRef]
- Patterson, P.; Wiksten, D.L.; Ray, L.; Flanders, C.; Sanphy, D. The Validity and Reliability of the Back Saver Sit-and-Reach Test in Middle School Girls and Boys. Res. Q. Exerc. Sport 1996, 67, 448–451. [Google Scholar] [CrossRef] [PubMed]
- Allander, E.; Björnsson, O.J.; Olafsson, O.; Sigfusson, N.; Thorsteinsson, J. Normal Range of Joint Movements in Shoulder, Hip, Wrist and Thumb with Special Reference to Side: A Comparison between Two Populations. Int. J. Epidemiol. 1974, 3, 253–261. [Google Scholar] [CrossRef] [PubMed]
- Armstrong, A.D.; MacDermid, J.C.; Chinchalkar, S.; Stevens, R.S.; King, G.J.W. Reliability of Range-of-Motion Measurement in the Elbow and Forearm. J. Shoulder Elb. Surg. 1998, 7, 573–580. [Google Scholar] [CrossRef]
- Darcus, H.D.; Salter, N. The Amplitude of Pronation and Supination with the Elbow Flexed to a Right Angle. J. Anat. 1953, 87, 169–184. [Google Scholar]
- Ellis, B.; Bruton, A.; Goddard, J.R. Joint Angle Measurement: A Comparative Study of the Reliability of Goniometry and Wire Tracing for the Hand. Clin. Rehabil. 1997, 11, 314–320. [Google Scholar] [CrossRef] [PubMed]
- Hamilton, G.F.; Lachenbruch, P.A. Reliability of Goniometers in Assessing Finger Joint Angle. Phys. Ther. 1969, 49, 465–469. [Google Scholar] [CrossRef] [PubMed]
- Fairbank, J.C.; Pynsent, P.B.; Phillips, H. Quantitative Measurements of Joint Mobility in Adolescents. Ann. Rheum. Dis. 1984, 43, 288–294. [Google Scholar] [CrossRef] [PubMed]
- Åström, M.; Arvidson, T. Alignment and Joint Motion in the Normal Foot. J. Orthop. Sports Phys. Ther. 1995, 22, 216–222. [Google Scholar] [CrossRef]
- Rome, K. Ankle Joint Dorsiflexion Measurement Studies. A Review of the Literature. J. Am. Podiatr. Med. Assoc. 1996, 86, 205–211. [Google Scholar] [CrossRef] [PubMed]
- Williams, R.M.; Goldsmith, C.; Minuk, T. Validity of the Double Inclinometer Method for Measuring Lumbar Flexion. Physiother. Can. 1998, 50, 147–152. [Google Scholar]
- Chinn, S. Statistics in Respiratory Medicine. 2. Repeatability and Method Comparison. Thorax 1991, 46, 454. [Google Scholar] [CrossRef] [PubMed]
- Ware Jr, J.E.; Brook, R.H.; Davies, A.R.; Lohr, K.N. Choosing Measures of Health Status for Individuals in General Populations. Am. J. Public Health 1981, 71, 620–625. [Google Scholar] [CrossRef] [PubMed]
- Ahlbäck, S.-O.; Lindahl, O. Sagittal Mobility of the Hip-Joint. Acta Orthop. Scand. 1964, 34, 310–322. [Google Scholar] [CrossRef]
- Clapper, M.P.; Wolf, S.L. Comparison of the Reliability of the Orthoranger and the Standard Goniometer for Assessing Active Lower Extremity Range of Motion. Phys. Ther. 1988, 68, 214–218. [Google Scholar] [CrossRef]
- Lima, T.; Alves, C.; Funayama, C.A.R. Proposal for a Trigonometric Method to Evaluate the Abduction Angle of the Lower Limbs in Neonates. J. Child. Neurol. 2008, 23, 1451–1454. [Google Scholar] [CrossRef] [PubMed]


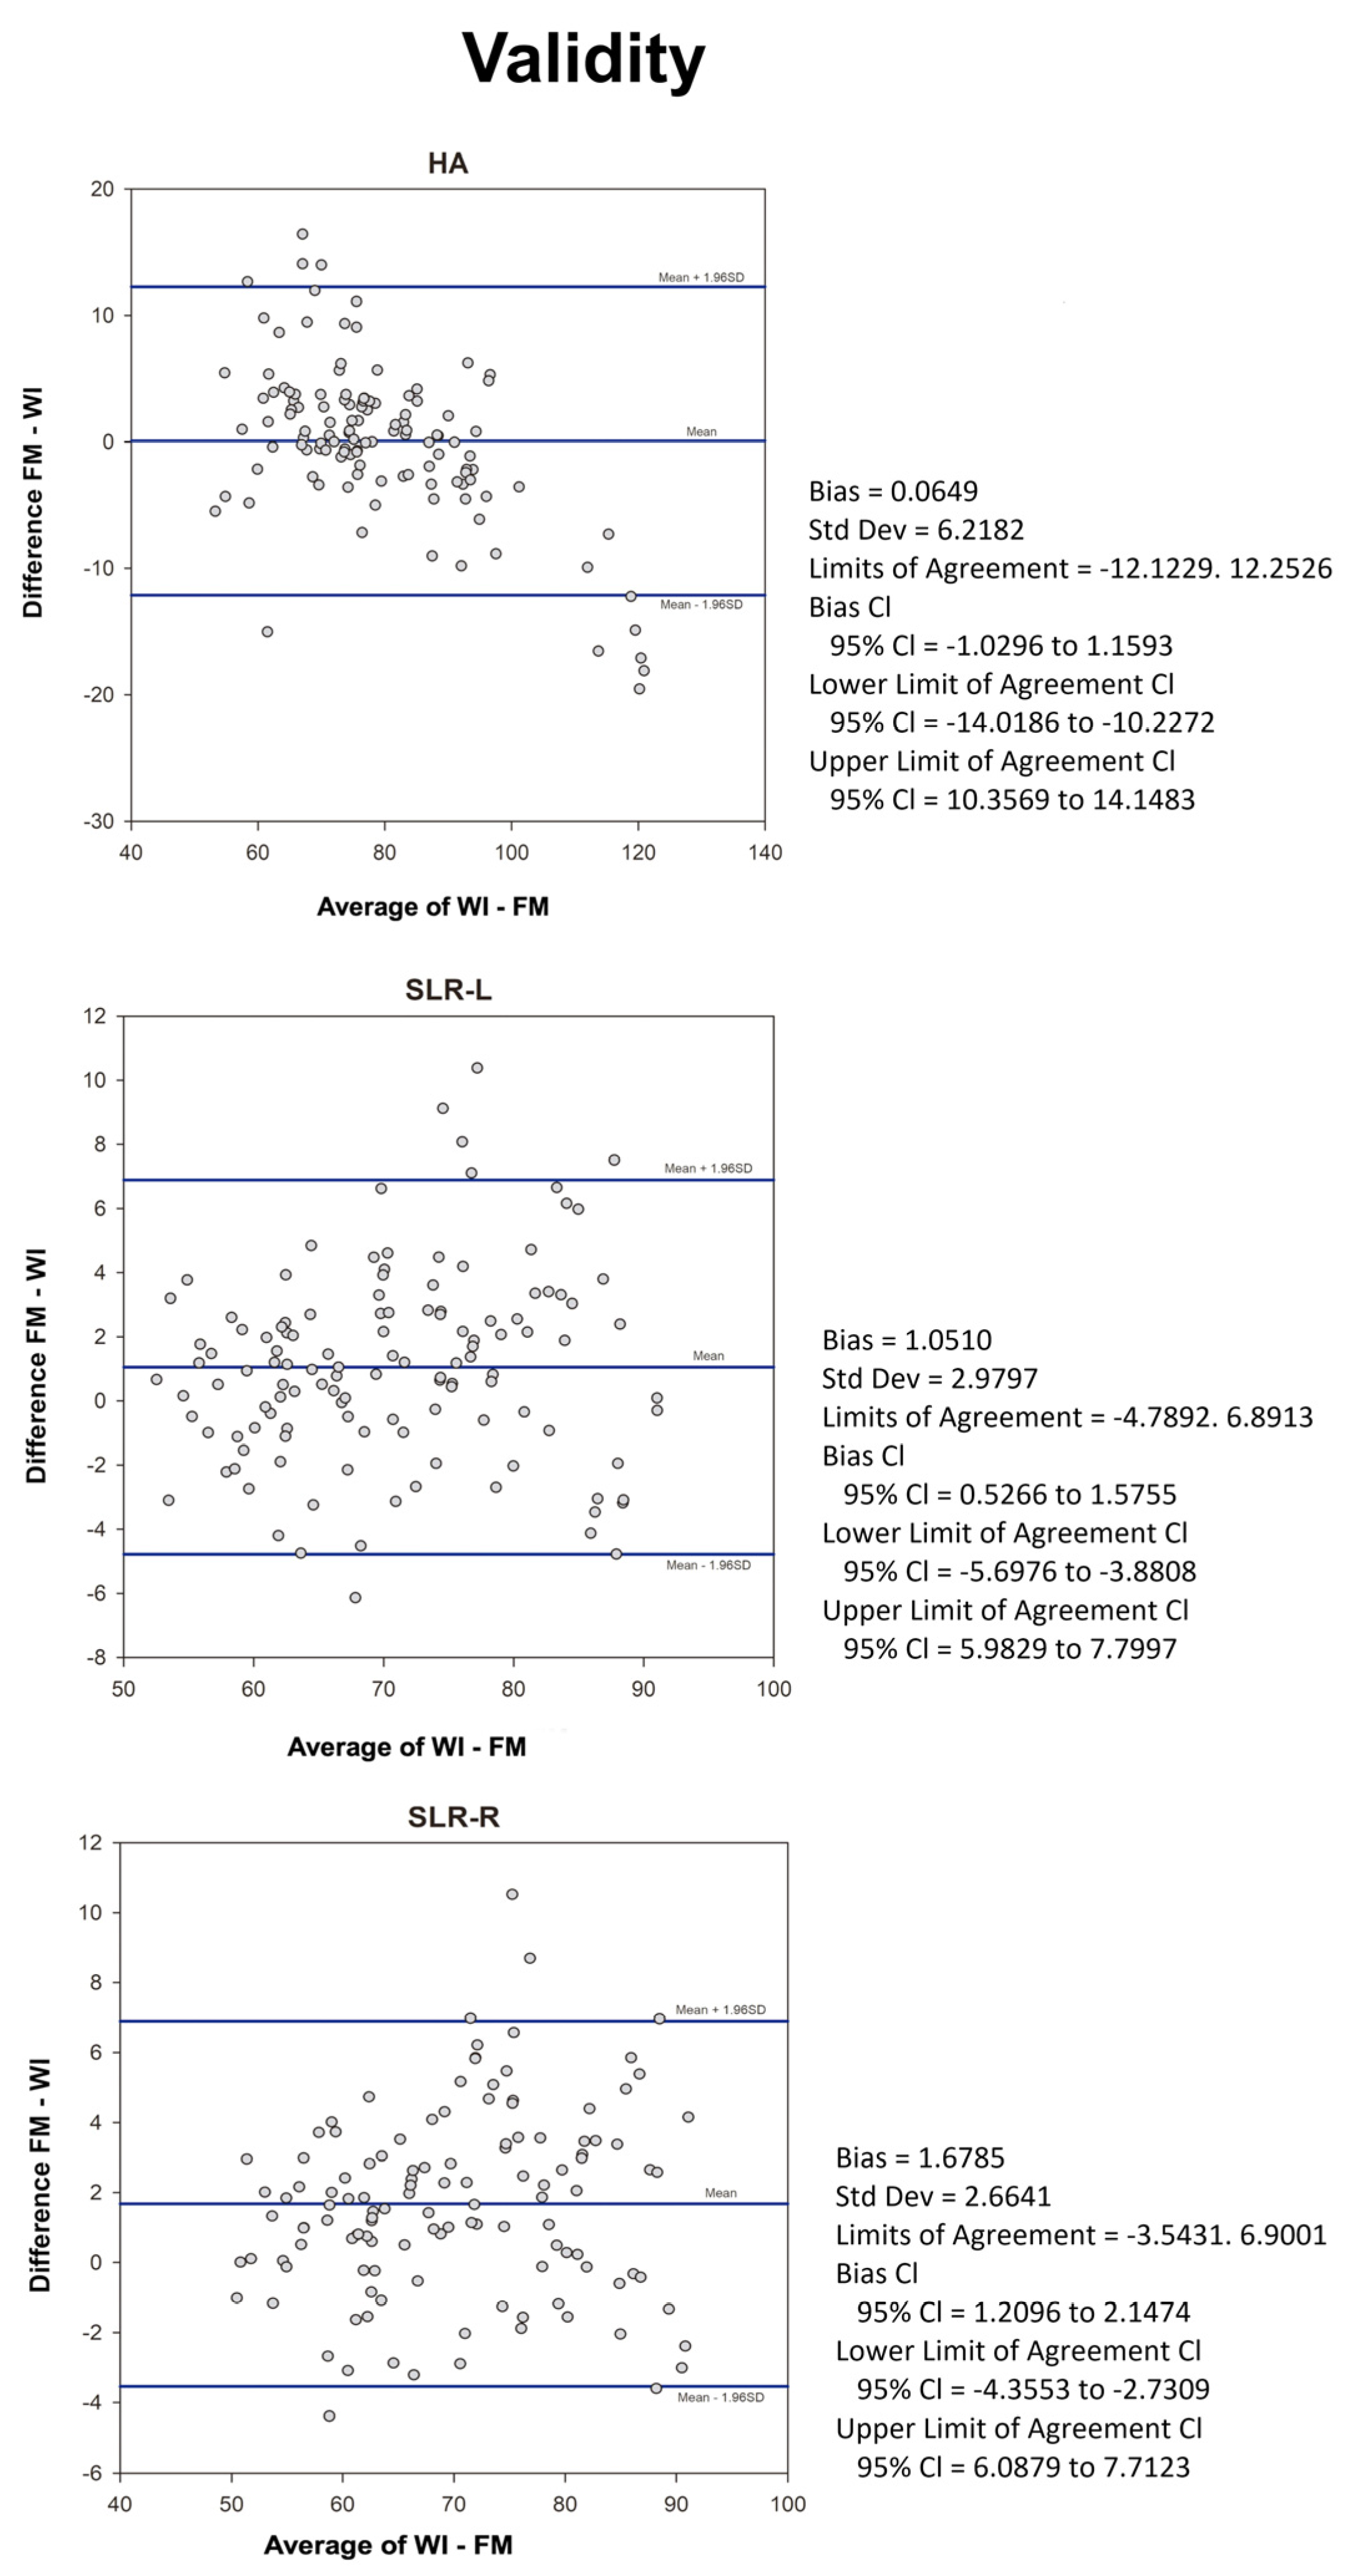
| ROM Mean Angle ° (SD) | Correlations | |||||
|---|---|---|---|---|---|---|
| Modality | Movement | FM | WI | PCC | ICC | 95% CI |
| FM/WI | SLR-R | 70.9 (10.8) | 69.2 (10.5) | 0.97 ** | 0.99 | 0.98–0.99 |
| SLR-L | 71.2 (10.3) | 70.2 (9.9) | 0.96 ** | 0.99 | 0.98–0.99 | |
| HA | 79.1 (13.3) | 79.1 (17.0) | 0.95 ** | 0.99 | 0.98–0.99 | |
| ROM Mean Angle ° (SD) | |||||||
|---|---|---|---|---|---|---|---|
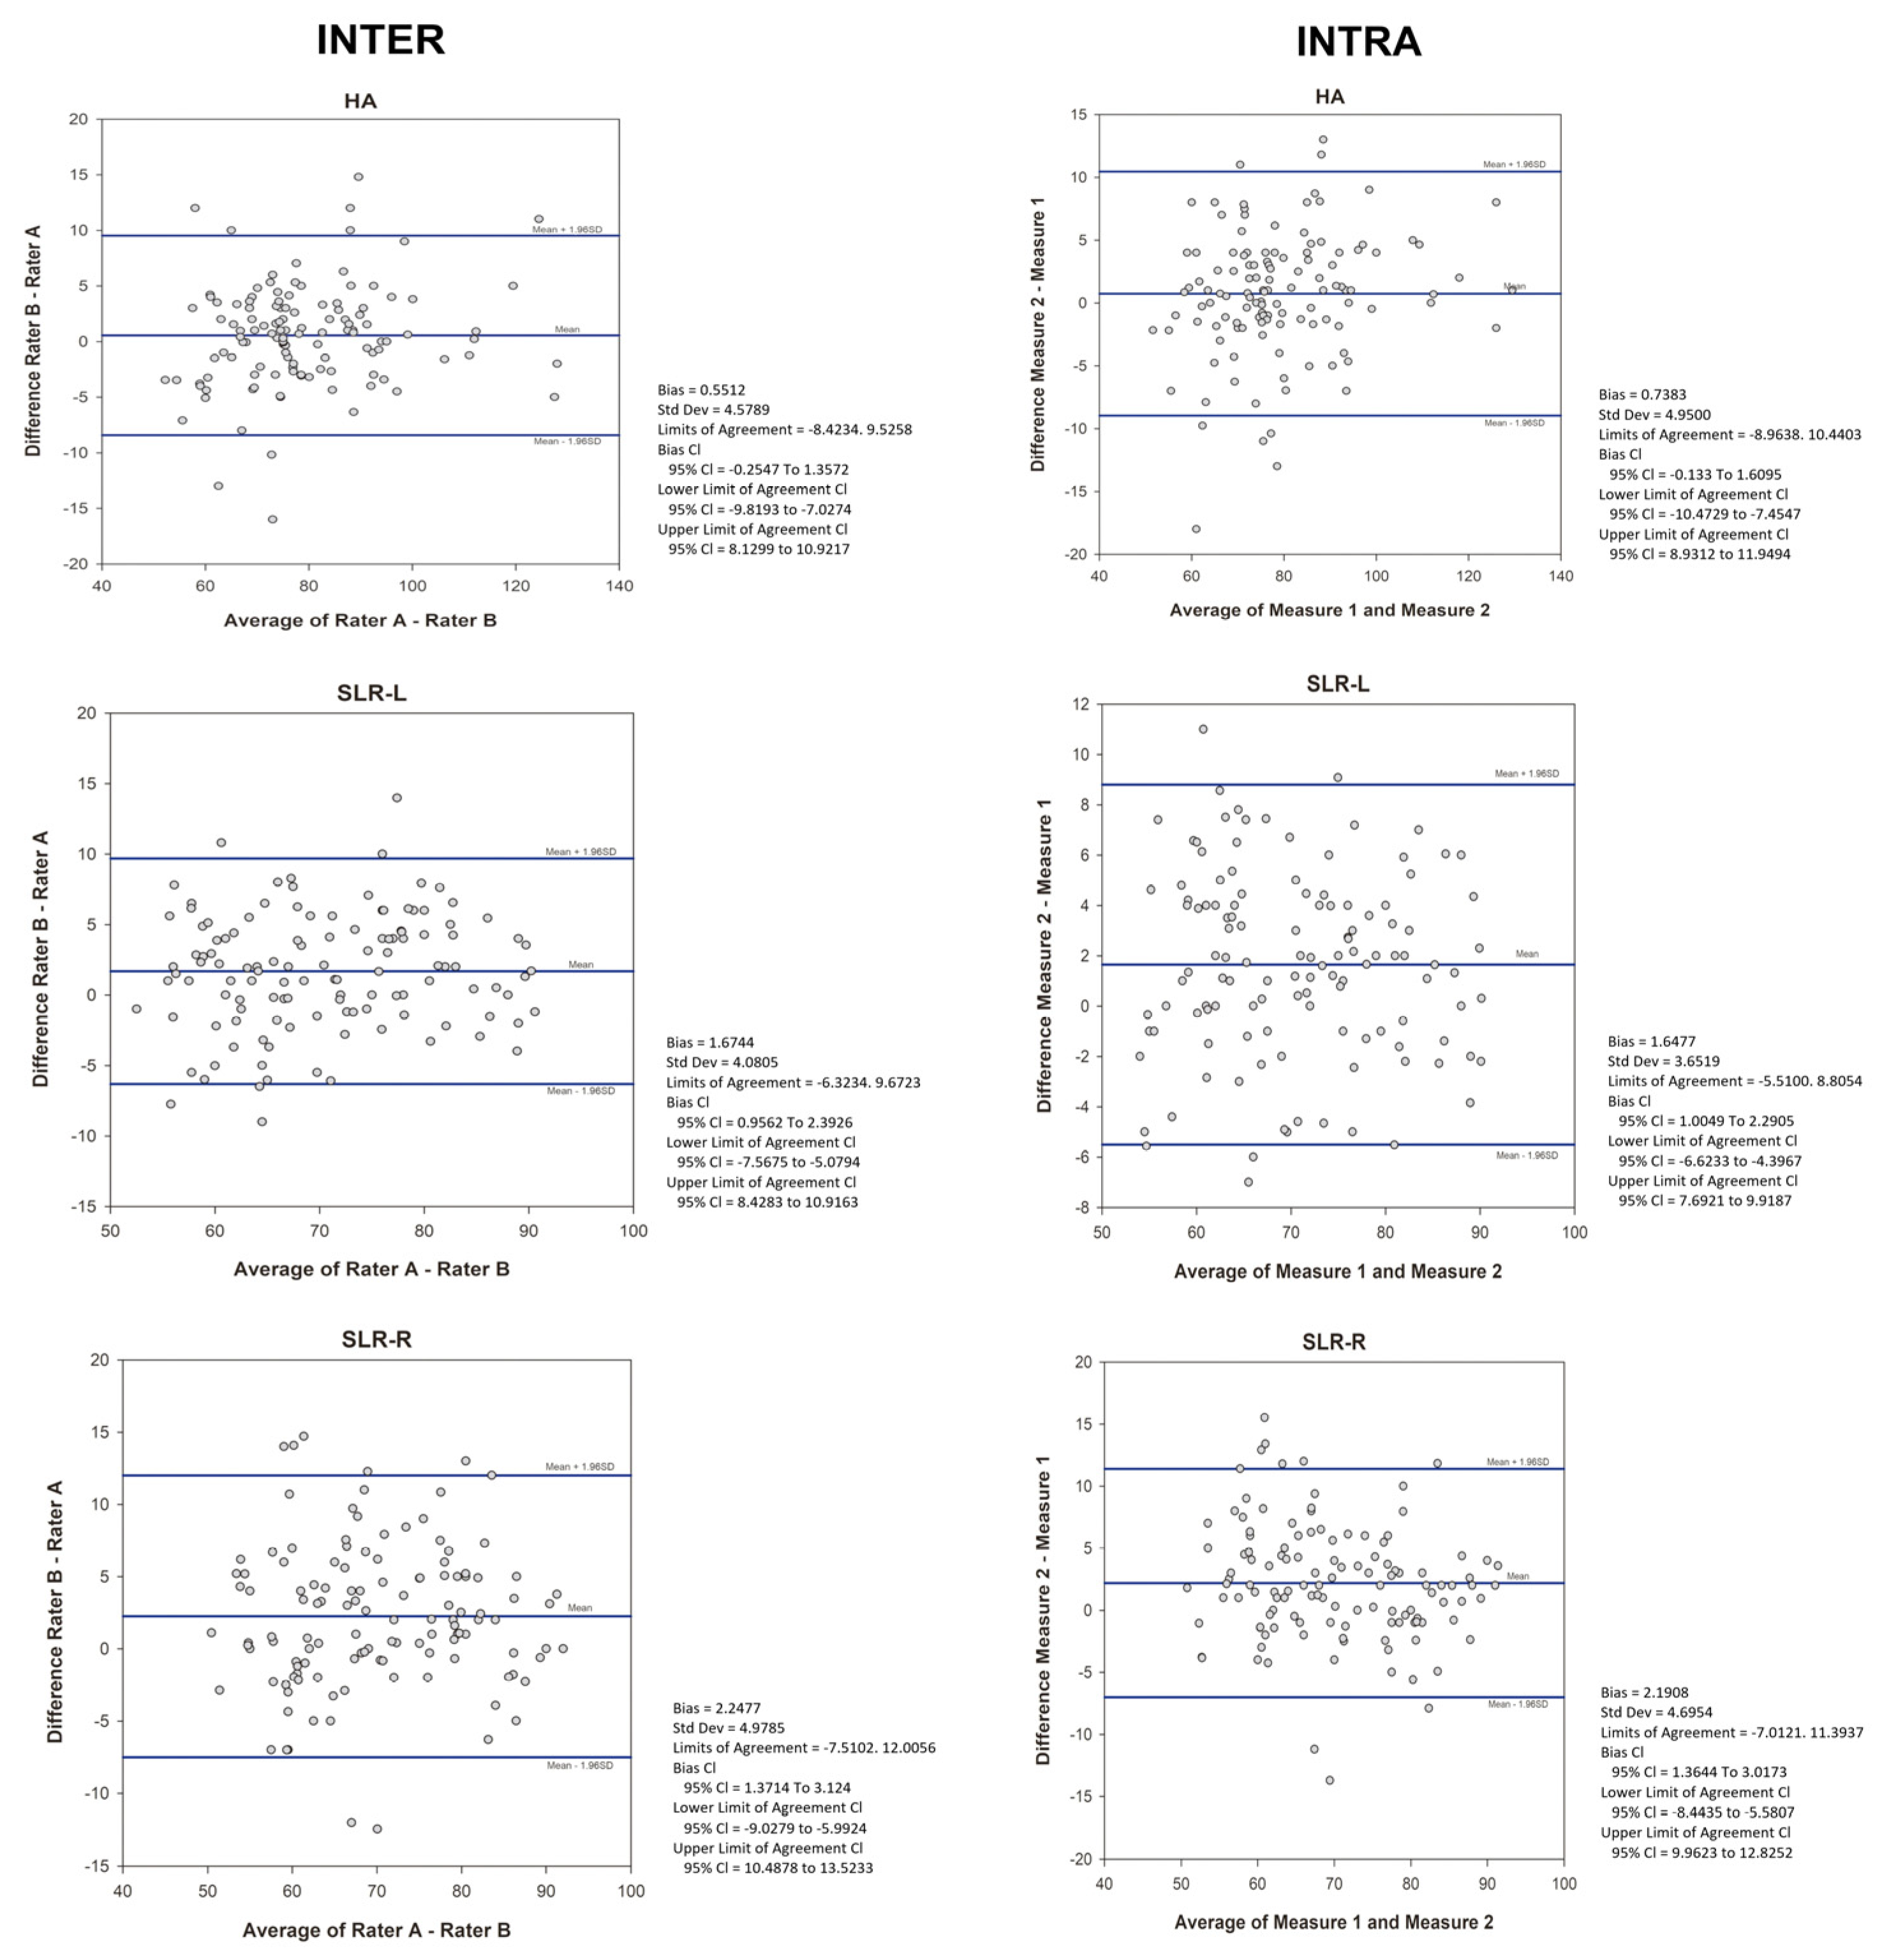
| Modality | Movement | Rater A | Rater B | SEM | MCD 90% | ICC | 95% CI |
| FM | SLR-R | 70.9 (10.4) | 71.2 (11.4) | 2.4 | 5.7 | 0.97 | 0.95–0.98 |
| SLR-L | 71.2 (9.5) | 71.7 (10.2) | 2.4 | 5.6 | 0.98 | 0.96–0.99 | |
| HA | 79.1 (12.6) | 78.7 (13) | 2.2 | 5.1 | 0.99 | 0.98–0.99 | |
| WI | SLR-R | 69.3 (10.1) | 69.2 (11) | 2.4 | 5.5 | 0.97 | 0.95–0.99 |
| SLR-L | 70.7 (9.1) | 70.3 (9.7) | 2.3 | 5.4 | 0.98 | 0.96–0.99 | |
| HA | 79.2 (17.1) | 79.2 (17.3) | 3.4 | 8 | 0.99 | 0.98–0.99 | |
| ROM Mean Angle ° (SD) | |||||||
|---|---|---|---|---|---|---|---|
| Modality | Movement | Measure 1 | Measure 2 | SEM | MCD 90% | ICC | 95% CI |
| FM | SLR-R | 71.2 (11.3) | 73.3 (10.5) | 2.7 | 6.3 | 0.97 | 0.93–0.99 |
| SLR-L | 71.7 (10.2) | 72.9 (10.9) | 2.1 | 4.9 | 0.98 | 0.95–0.99 | |
| HA | 78.7 (13) | 79.5 (13.9) | 2.3 | 5.4 | 0.98 | 0.96–0.99 | |
| WI | SLR-R | 69.2 (11) | 71.1 (10.1) | 2.6 | 6 | 0.97 | 0.93–0.98 |
| SLR-L | 70.3 (9.7) | 71.3 (10.4) | 2.3 | 5.3 | 0.98 | 0.95–0.99 | |
| HA | 79.2 (17.3) | 80 (17.7) | 3.9 | 9.1 | 0.97 | 0.95–0.99 | |
Disclaimer/Publisher’s Note: The statements, opinions and data contained in all publications are solely those of the individual author(s) and contributor(s) and not of MDPI and/or the editor(s). MDPI and/or the editor(s) disclaim responsibility for any injury to people or property resulting from any ideas, methods, instructions or products referred to in the content. |
© 2024 by the authors. Licensee MDPI, Basel, Switzerland. This article is an open access article distributed under the terms and conditions of the Creative Commons Attribution (CC BY) license (https://creativecommons.org/licenses/by/4.0/).
Share and Cite
Moras Feliu, G.; Gisbert-Orozco, J.; González, J.; Vazquez-Guerrero, J.; Rodríguez-Jiménez, S.; González-Millan, S.; Fernández-Valdés, B. A New Flexometric Method to Evaluate Range of Movement: A Validity and Reliability Study. Appl. Sci. 2024, 14, 3226. https://doi.org/10.3390/app14083226
Moras Feliu G, Gisbert-Orozco J, González J, Vazquez-Guerrero J, Rodríguez-Jiménez S, González-Millan S, Fernández-Valdés B. A New Flexometric Method to Evaluate Range of Movement: A Validity and Reliability Study. Applied Sciences. 2024; 14(8):3226. https://doi.org/10.3390/app14083226
Chicago/Turabian StyleMoras Feliu, Gerard, Jose Gisbert-Orozco, Jacob González, Jairo Vazquez-Guerrero, Sergio Rodríguez-Jiménez, Sara González-Millan, and Bruno Fernández-Valdés. 2024. "A New Flexometric Method to Evaluate Range of Movement: A Validity and Reliability Study" Applied Sciences 14, no. 8: 3226. https://doi.org/10.3390/app14083226
APA StyleMoras Feliu, G., Gisbert-Orozco, J., González, J., Vazquez-Guerrero, J., Rodríguez-Jiménez, S., González-Millan, S., & Fernández-Valdés, B. (2024). A New Flexometric Method to Evaluate Range of Movement: A Validity and Reliability Study. Applied Sciences, 14(8), 3226. https://doi.org/10.3390/app14083226