Abstract
This study exhibits the possibility of using an artificial neural network (ANN) to model the mechanical behavior of wire arc additive manufacturing (WAAM) for Inconel 625. For this reason, tensile tests of Inconel 625 superalloy as-built (AB) samples and samples after heat treatment at 1200 °C (HT-1200) by WAAM were performed. For the HT-1200 samples, the yield stress decreased, and the elongation increased significantly due to grain refinement and the formation of annealed twins. A new hybrid model combining a swarm intelligence optimization algorithm with a back propagation neural network (BPNN) was developed to simulate the flow behavior of the superalloy. Compared with other hybrid BPNN models that have been reported, the proposed BPNN model is in better agreement with the experimental data and provides a better description of the flow stress of the Inconel 625 superalloy. The excellent predictive ability of the model may be attributed to the optimization of the weights and thresholds of the BPNN, which obtains the optimal global solution in the search space more efficiently.
1. Introduction
Inconel 625 is a nickel-based superalloy that is widely used in aerospace, petroleum, chemical, and marine industries [1,2,3]. However, machining Inconel 625 parts into fine shapes by conventional subtractive manufacturing methods is extremely difficult and expensive, attributed to the high hardness and high-temperature strength of this alloy.
Wire arc additive manufacturing (WAAM) has been used to fabricate various metals and alloys, such as titanium alloys [4], aluminum alloys [5], and superalloys [6], due to its high deposition rate (5–8 kg/h), fewer metallurgical defects (lack of fusion, porosity, cracks, etc.), and high material utilization. In view of the above advantages, WAAM is also widely used in the manufacture of the Inconel 625 alloy [7]. However, compared to traditional casting or forging, WAAM results in coarse columnar grains and a stronger <100> texture along the build direction, which leads to mechanical anisotropy of the material. The mechanical properties of Inconel 625 are usually improved by annealing. Recrystallization usually occurs in the metal after cold deformation annealing, which can refine the deformed grains and thus improve the mechanical properties of the metals [8]. For the Inconel 625 superalloy manufactured by WAAM, when heat treated at 1200 °C, the size and number of Laves phases and carbides are significantly reduced [9], accompanied by a complete recrystallisation of the sample, which leads to a significant increase in the strength and elongation of Inconel 625 [10,11].
The constitutive model describes the law of macroscopic stress variation with strain during the deformation of a material. The constitutive model is not only the theoretical basis of metal forming problems, but also the key factor for numerical analysis. In the past, for the mechanical problems of engineering structures, traditional theoretical research methods were usually used. For example, Peron et al. [12] employed the strain energy density (SED) approach to predict the tensile strength of polyetheretherketone in corrosive environments. Subsequently, they studied the fracture of notched Ti-6Al-4V via the SED approach and the theory of critical distance (TCD) method [13]. Other similar studies can be found in the literature [14,15,16,17,18]. In particular, the empirical constitutive relationship has been considered an effective method for predicting plastic deformation in metals [19,20], but the high complexity of mathematical modeling has limited its wide application. With the application of artificial intelligence in the field of materials, machine learning has been utilized to construct constitutive models and has gained wide application in recent years [21,22]. For example, artificial neural networks (ANNs) have been widely used to accurately predict the hot deformation behaviors of nickel-based superalloys [23,24,25,26,27,28,29].
A BPNN is a kind of artificial neural network which uses a backpropagation algorithm to automatically update internal random parameters in the process of training and can realize the random nonlinear mapping of input and output, which has great advantages in solving nonlinear problems. At present, this method has been applied to the fields of material performance prediction, complex structural performance prediction, and structural optimization. However, the initial weights and thresholds of the original BPNN model are randomly set, which makes it easy to obtain local optimal solutions, leading to the problem of slow convergence speed. More importantly, when the amount of data is large and the training time is long, the training mode of the BPNN may have a problem overfitting. Therefore, it is of great significance to use optimization algorithms to optimize the initial parameters of the BPNN to avoid getting local optimal solutions. For example, Liu et al. [30] proposed a hybrid algorithm combining a BPNN and simulated annealing. The experimental results showed that the proposed mixed model had good prediction accuracy in predicting the mechanical properties of rocks. Chen et al. [31] constructed a hybrid model combining an adaptive evolutionary artificial bee colony algorithm and a BPNN. The experimental results showed that under the guidance of historical error data, the prediction accuracy of the proposed hybrid model was still better than other algorithms. Ban et al. [32] combined the improved gravity search algorithm and particle swarm optimization algorithm to optimize a BPNN and successfully applied it to the fault diagnosis of motor drive systems. Sun et al. [33] combined the harmonic search algorithm and a BPNN to form a new hybrid model and applied it to the inverse analysis of rockfill parameters. The example study shows that compared with the original BPNN algorithm, the hybrid model has the advantages of high convergence accuracy, fast convergence speed, and strong stability.
The dung beetle optimization (DBO) algorithm [34] is a global optimization algorithm with search information as its objective function. The natural behaviors exhibited by dung beetles, such as rolling, dancing, foraging, breeding, and stealing, are the basis of the DBO algorithm. The design of these different update strategies shows good competitiveness in convergence speed, scalability, optimization accuracy, and elasticity; the DBO algorithm divides the initial population into four subpopulations and searches for the optimal location, respectively. By comparing each subpopulation, the global optimal position is obtained. The weights and thresholds of the BPNN are used to solve the optimal position of the dung beetles. By using DBO to optimize the BPNN’s weights and thresholds, the convergence speed of the BPNN is improved, the training time is reduced, and the optimal global solution is obtained in the global search. Since the DBO algorithm has a good balance between global search and local development, it has significant advantages in optimizing the BPNN. The existing research shows that using DBO to optimize the initial parameters of the BPNN can improve the convergence speed of the BPNN, reduce the training time, and obtain the optimal global solution [35,36]. Although the DBO-BPNN has been applied in engineering, there is still room for improvement in this method. Therefore, this paper will improve the existing DBO algorithm and combine the enhanced DBO (EDBO) algorithm [37] with a BPNN to obtain the so called EDBO-BPNN model. The model will optimize the initial parameters of the BPNN and update the weights and thresholds of the BPNN iteratively to find the optimal solution in the range of solutions. In the present study, the stress–strain curves of the Inconel 625 superalloy AB samples and HT-1200 samples fabricated by WAAM were measured experimentally. On the basis of the experimental data, the constitutive equation was established using the established EDBO-BPNN model. Finally, the prediction results of the EDBO-BPNN model established in this study are compared with the experimental results and some existing BPNN models in the literature.
2. Material and Methods
2.1. Material and Process Parameters
The Inconel 625 superalloy is prepared by WAAM from ERNiCrMo-3 wire with a diameter of 1.2 mm. Chen et al. [38] studied the optimal deposition parameters to produce the Inconel 625 superalloy by WAAM; here, the same parameters are used, i.e., current (125 A), travel speed (0.3 m/min), voltage (12.8 V), and wire feed speed (5.5 m/min). The as-built (AB) sample was heat treated in a vacuum at 1200 °C (HT-1200) for 1.5 h and then water quenched. The target samples were extracted from the middle stable region of the AB thin wall via electric discharge machining for metallographic preparation. To reveal the microstructural features, the polished samples were etched in solution (90 mL H2O and 10 g CrO3) for 20 s. The microstructure was characterized using electron backscatter diffraction (EBSD) with a step size of 4 μm and scanning electron microscopy (SEM). The tensile sample was selected in the vertical building direction and the tensile test was carried out on an Instron-5982 tensile tester with a strain rate of 0.5 mm/min at room temperature. All the tensile tests were tested three times to ensure repeatability of results. The difference between the three tests in the experiment was not significant, (yield strength, tensile strength, and elongation maximum error were all within 6%), so we randomly selected a set of experimental data for the study.
2.2. Dung Beetle Optimization (DBO) Algorithm
Recently, researchers have proposed a newer population intelligence optimization algorithm to deal with two kinds of problems: optimization with constraints and optimization without constraints, called the dung beetle optimization (DBO) algorithm. The prototype for designing the DBO algorithm includes certain habits in the activities of dung beetles, i.e., reproduction, dancing, ball-rolling, stealing, and foraging. The DBO algorithm divides the initial large population of dung beetles into four smaller populations for the optimization processes of reproduction, ball-rolling, stealing, and foraging, respectively. The principle of DBO is described below.
- (1)
- Mathematical modeling of rolling ball behavior
Equation (1) shows the specific location update mode of each individual.
where g represents the latest iteration number, represents the position of the ith dung beetle in the whole population during the gth iteration, a denotes a real number that takes 1 or −1 when different situations are encountered during the rolling process, with 1 denoting no deviation from the original route and −1 denoting a deviation from the original orientation, denotes a constant deflection coefficient in the range of (0, 0.2], and denotes a fixed value. denotes the worst position of all ranges produced by the algorithm during the current iteration, and is used to model changes in light intensity and denotes the difference between the ith dung beetle and the worst positioned dung beetle in all ranges.
Equation (2) calculates the new position of each individual after the update.
where denotes the distance between two neighboring dung beetles, i.e., the ith individual and the (i − 1)th individual. Note that the position of the dung beetle is not updated when the .
- (2)
- Mathematical modeling of reproductive behavior
The strategy is represented by the following equation:
where X* denotes the optimal position of the latest small range, the region of spawning contains the upper and lower boundaries, denoted by and , respectively, and represent the maximum and minimum ranges of the problem to be optimized, respectively, , and denotes the set iteration threshold.
The updating of the individual position during the breeding behavior is represented by the following equation:
where denotes the position of the ith brood ball during the gth iteration, and and are two random and independent vectors, both of size , where denotes the dimension of the variable in the actual optimization problem. In addition, the optimization process must ensure that the positions of the brood balls are strictly confined within the specified upper and lower bound regions.
- (3)
- Mathematical modeling of foraging behavior
When the iterative process continues and the number of iterations increases, the optimal range of foraging area at this time will also keep adjusting dynamically, and the process is represented by the following equation:
where, unlike the parameters of the above sub-processes, is the optimal position in the full range, denotes the lower boundary of the optimal foraging area, and represents the upper boundary of the optimal foraging area. Based on the above conditions, the following formula updates the position of the new individual:
where denotes the position of the ith small individual in the population during the gth iteration, represents a random value that follows a normal distribution, and represents a random vector of size with the range .
- (4)
- Mathematical modeling of theft
The following equation updates the thief’s location:
where denotes the position of the ith thief in the overall population during the gth iteration, represents a random vector that follows a normal distribution with a size of , and is a fixed value. Figure 1 illustrates the flow of the original DBO algorithm.
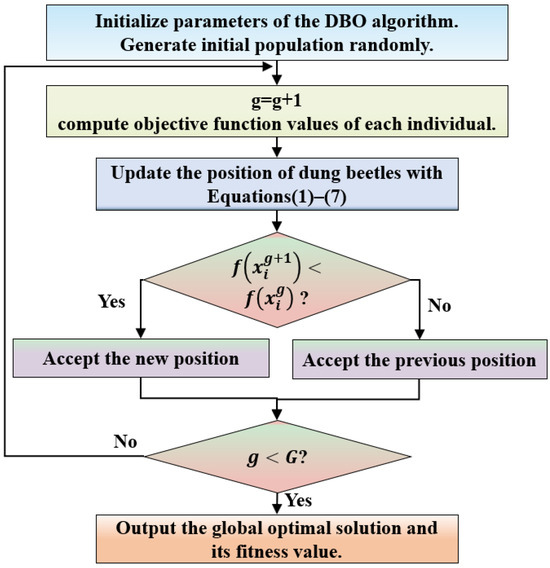
Figure 1.
Step-by-step diagram of dung beetle optimization.
2.3. Backpropagation Neural Network (BPNN)
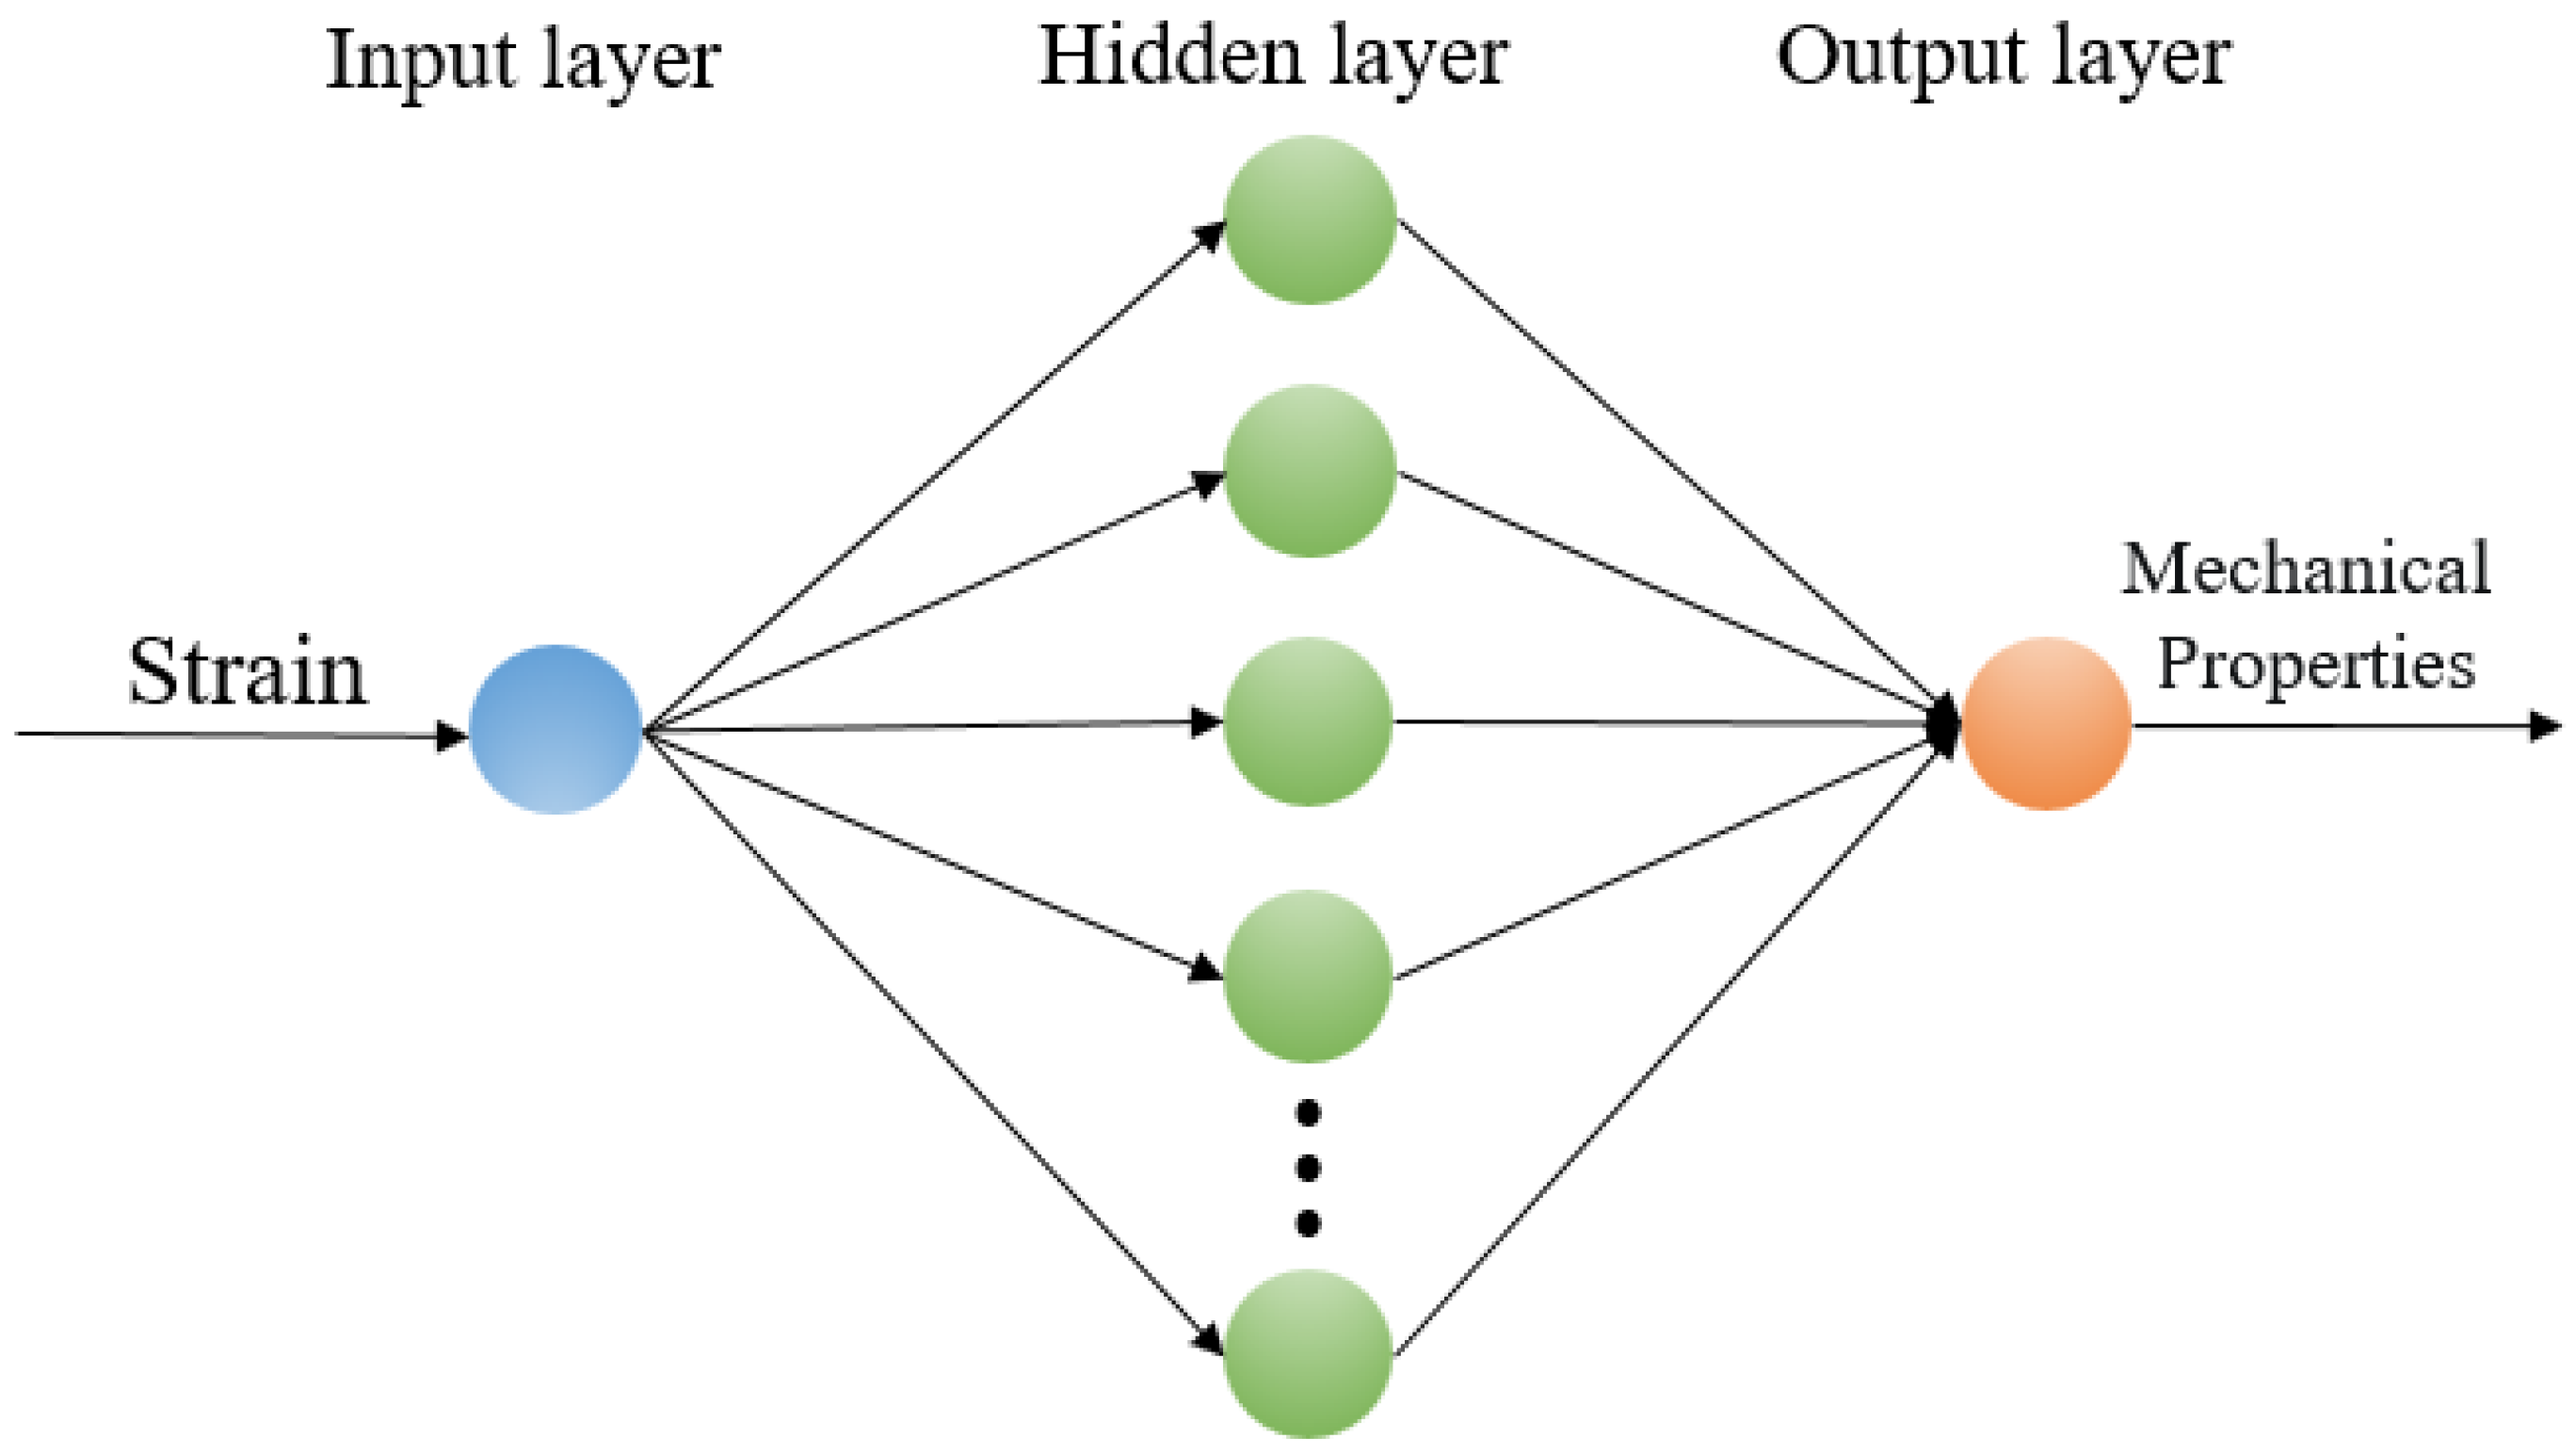
In this study, we first perform stretching performance prediction by constructing a BPNN model and further optimize the BPNN model using the EDBO algorithm (EDBO-BPNN). Figure 2 shows the generic structure of the ANN. In order to simulate the constitutive relationships of Inconel 625, the tensile strains were set as input and the tensile stresses as output. The ANN training process uses root mean square error (RMSE) as the evaluation index for stretching performance prediction with the following equation:
where denotes the experimental value and denotes the predicted value.
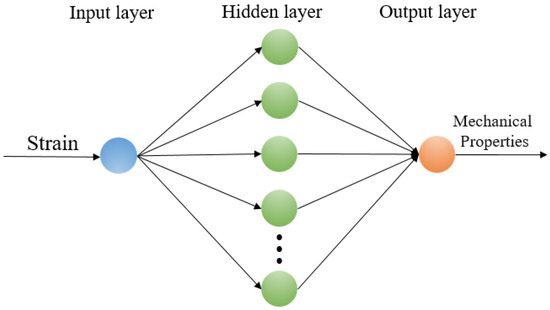
Figure 2.
Structure diagram of artificial neural network.
2.4. The Proposed Hybrid EDBO-BPNN
The initial parameters of the BPNN are randomly assigned, so the numerous parameters lead to unstable model calculation. Optimizing the BPNN using EDBO can improve the prediction performance of the model. The main idea of an EDBO-BPNN is to update the BPNN’s weights and thresholds by constantly updating the location of the dung beetle population until a global minimum is found that represents the optimal solution to the initial weights and thresholds. The flow of an EDBO-BPNN is shown in Figure 3. Firstly, the parameters of the BPNN are determined, including the hidden layer, number of hidden nodes, training cycle, model learning rate, and activation function. Secondly, the optimized BPNN prediction model is trained using the training set. The optimization methods used are EDBO-BPNN, BDB-BPNN, JAYA-BPNN, PSO-BPNN, GWO-BPNN, and WOA-BPNN. Finally, we studied the training model using a test set and evaluated the predictive power of the four models based on statistical parameters such as coefficient of determination (R2), RMSE, mean absolute error (MAE), and mean absolute percentage error (MAPE). The predicted values of six kinds of neural network models are compared with experimental values and the predictive ability of the models is analyzed.
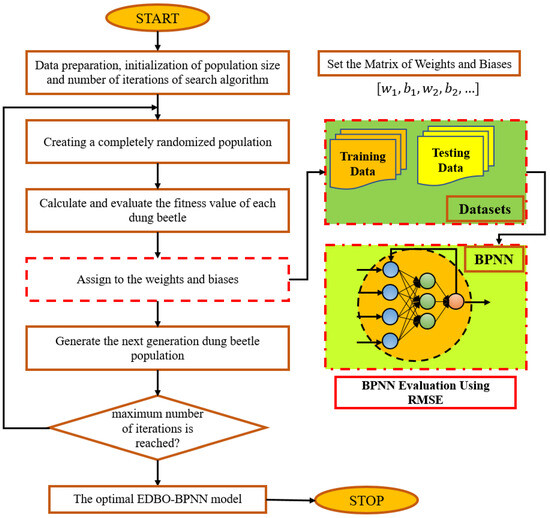
Figure 3.
Hybridization of EDBO and BPNN.
In this paper, six optimization algorithms are used to compare the optimization of the BPNN model, which are EDBO, DBO, JAYA [39], Particle Swarm Optimization (PSO) [40], Gray Wolf Optimization (GWO) [41], and the Whale Optimization Algorithm (WOA) [42].
3. Results and Discussions
3.1. Model Evaluation Index
To evaluate the deflection prediction model under different machine learning models (MLs) from multiple perspectives, four evaluation indexes were selected to quantify the prediction performance of the model, namely, R2, RMSE, MAE, and MAPE [43]. The more R2 is equal to 1, the closer the predicted value is to the measured value, and the more accurate the model’s prediction result is. RMSE is used to assess the deviation between the predicted value and the measured value. The more the RMSE value approaches 0, the better the prediction performance of the model. Both MAE and MAPE represent the mean deviation between predicted and measured values. The closer the MAE and MAPE values are to 0, the more accurate the model’s predictions are. For a perfect prediction model, the values of these metrics should equal their ideal optimal values. The calculation methods of various evaluation indexes are shown below:
where is the average of the actual values, is the actual value of the sample tensile stress, is the predicted value, and n is the number of tensile stress samples.
3.2. Analysis of Prediction Results
3.2.1. Microstructure
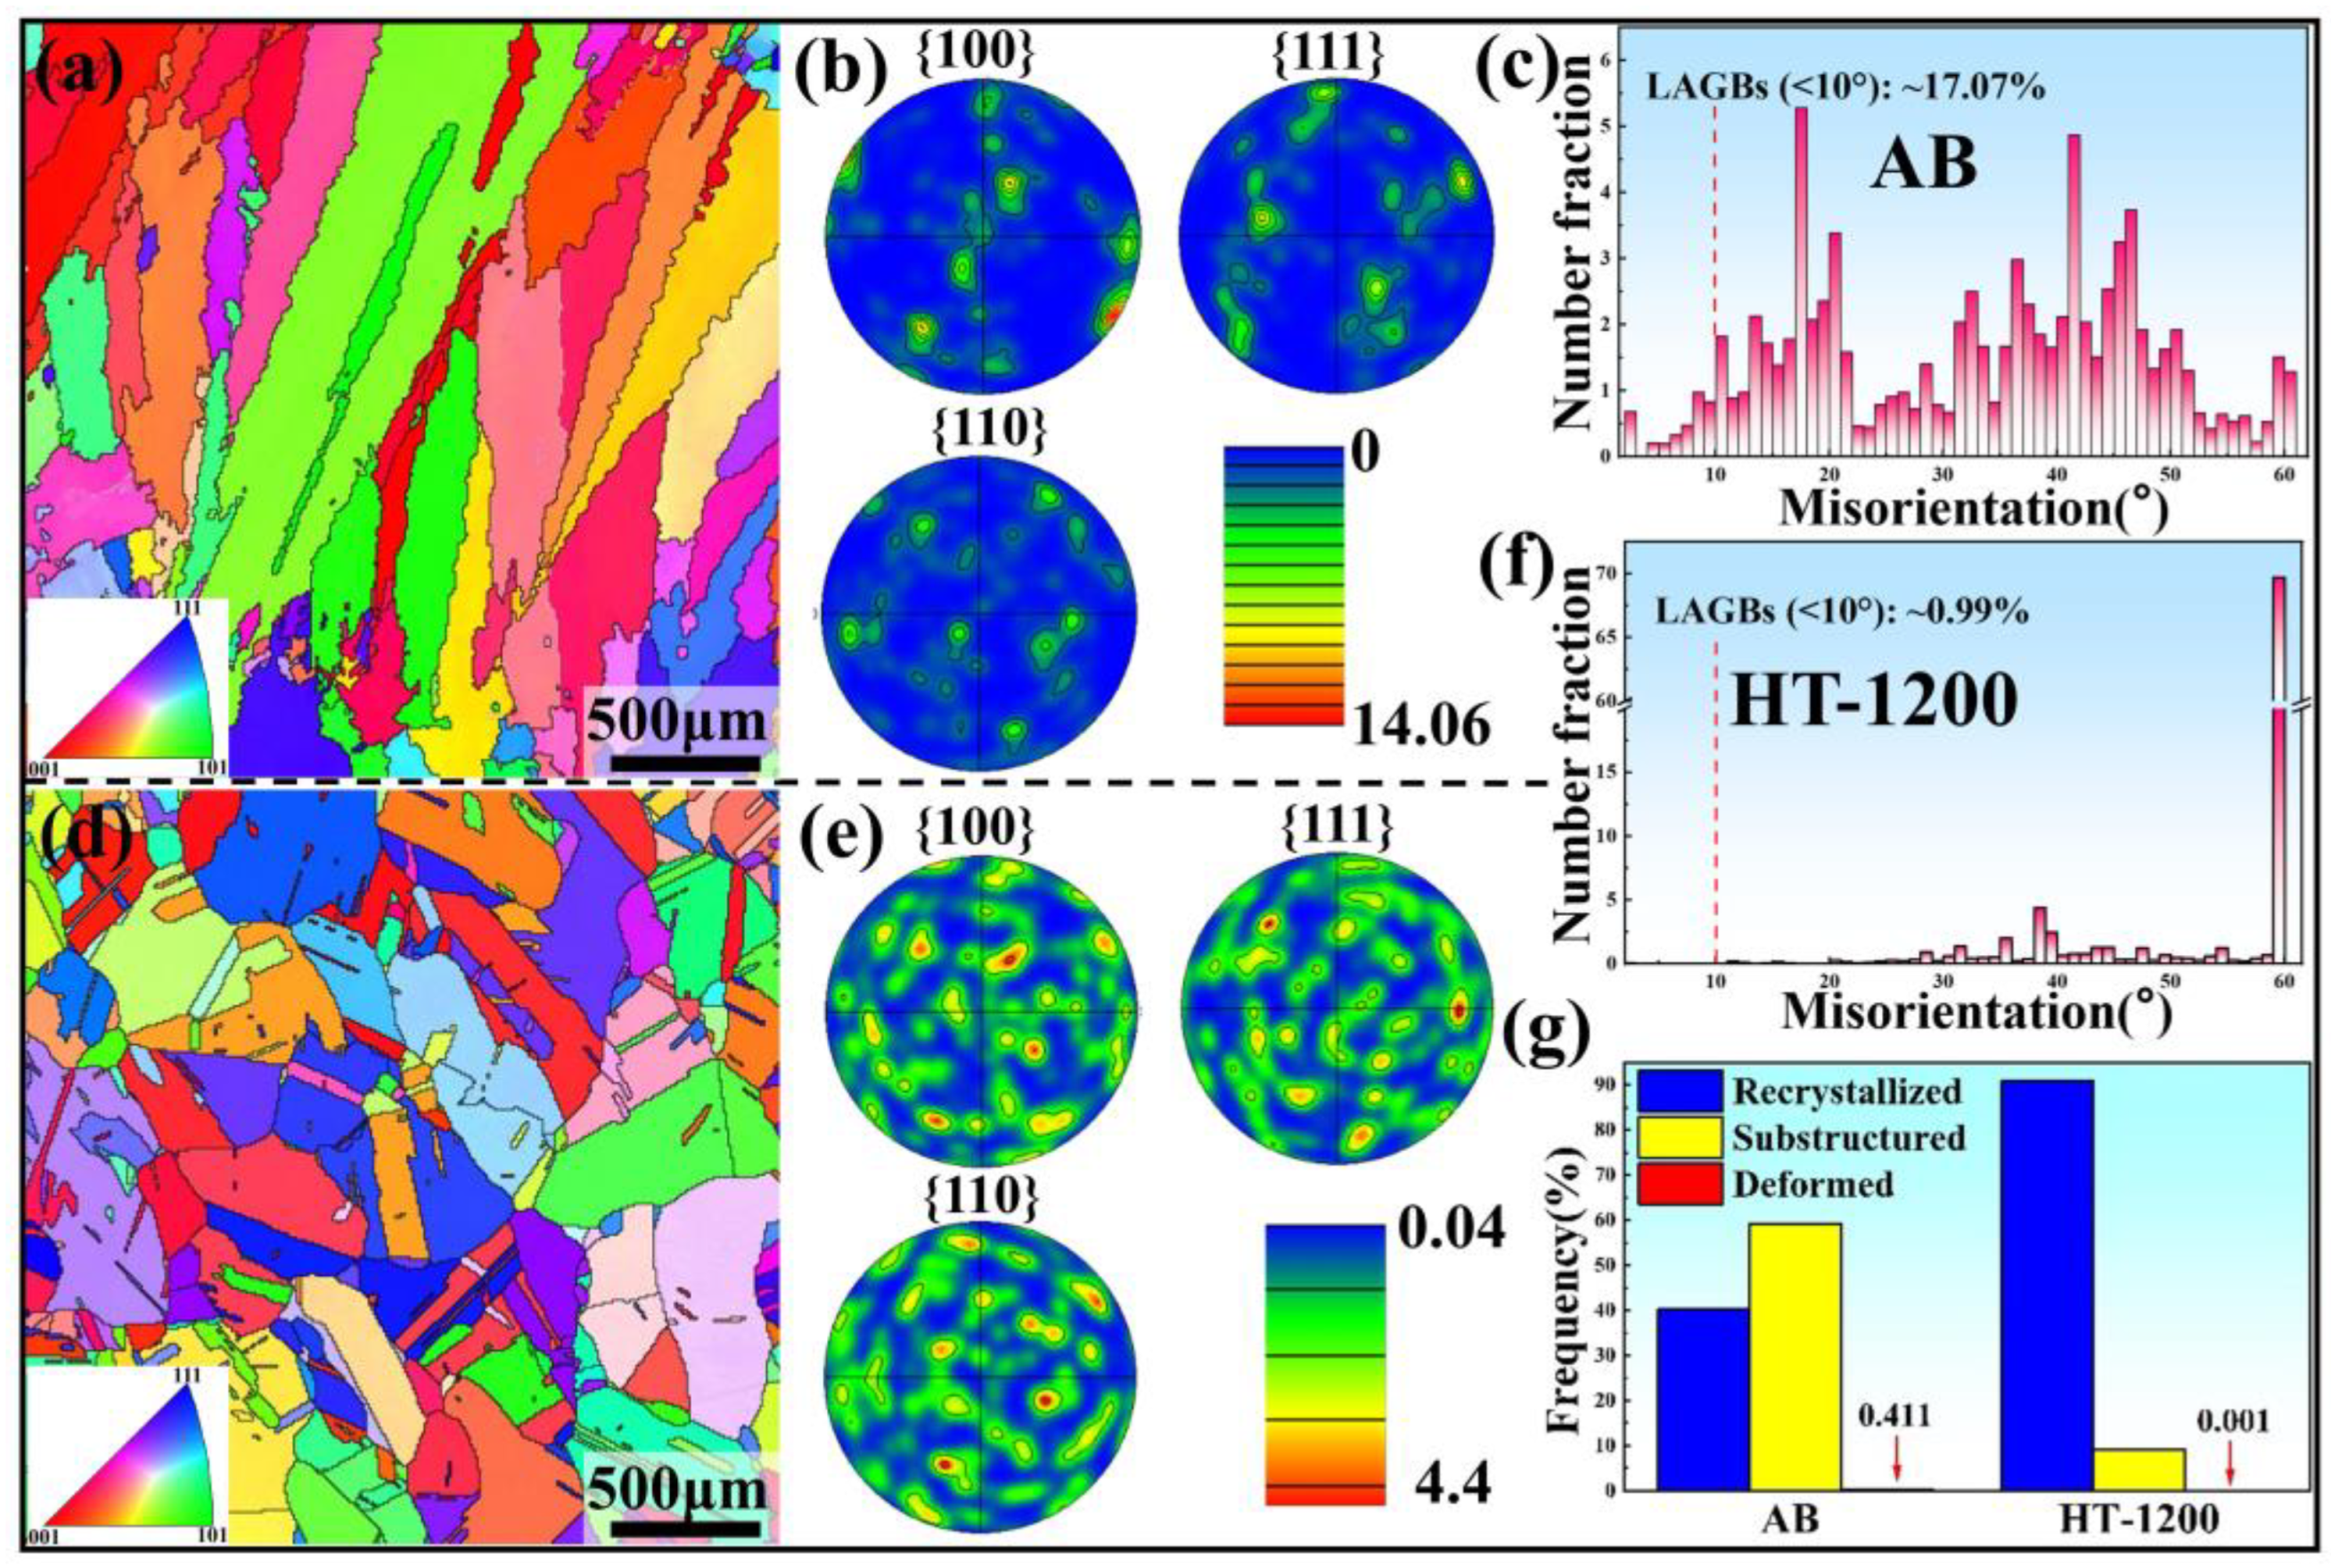
Figure 4a,d show the EBSD observations of the two grain morphologies, indicating that they show significant changes in grain size and preferred crystal orientation. The microstructure of the AB sample consists mainly of columnar grains with a strong <100> texture and a maximum multiples of uniform density (MUD) value of 14.06, as shown in Figure 4b. Figure 4e displays that complete recrystallisation occurs in the microstructure of the HT-1200 sample, which consists mainly of equiaxed grains with relatively random grain orientation and a weak texture (max MUD = 4.40). The percentage of low angle grain boundaries (LAGBs) in AB specimens was 17.07%, as shown in Figure 4c. After heat treatment, the percentage of LAGBs in the HT-1200 sample decreased due to the occurrence of recrystallization, and a large number of TGBs appeared at the 60° position, as shown in Figure 4f. In addition, compared with the AB sample, the proportion of recrystallized grains in the microstructure of the HT-1200 specimen increased dramatically, whereas the deformed grains almost completely disappeared, as shown in Figure 4g.
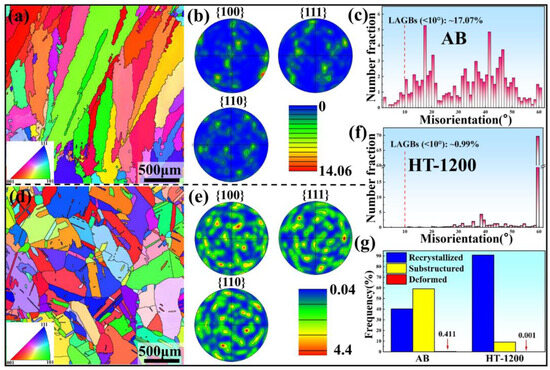
Figure 4.
Crystallographic orientation profiles of (a) AB sample and (d) HT-1200 sample; EBSD inverse pole figures (IPFs) of (b) AB sample and (e) HT-1200 sample; misorientation distribution of (c) AB sample and (f) HT-1200 sample; (g) proportion of deformed grains, substructured grains, and recrystallized grains for different samples.
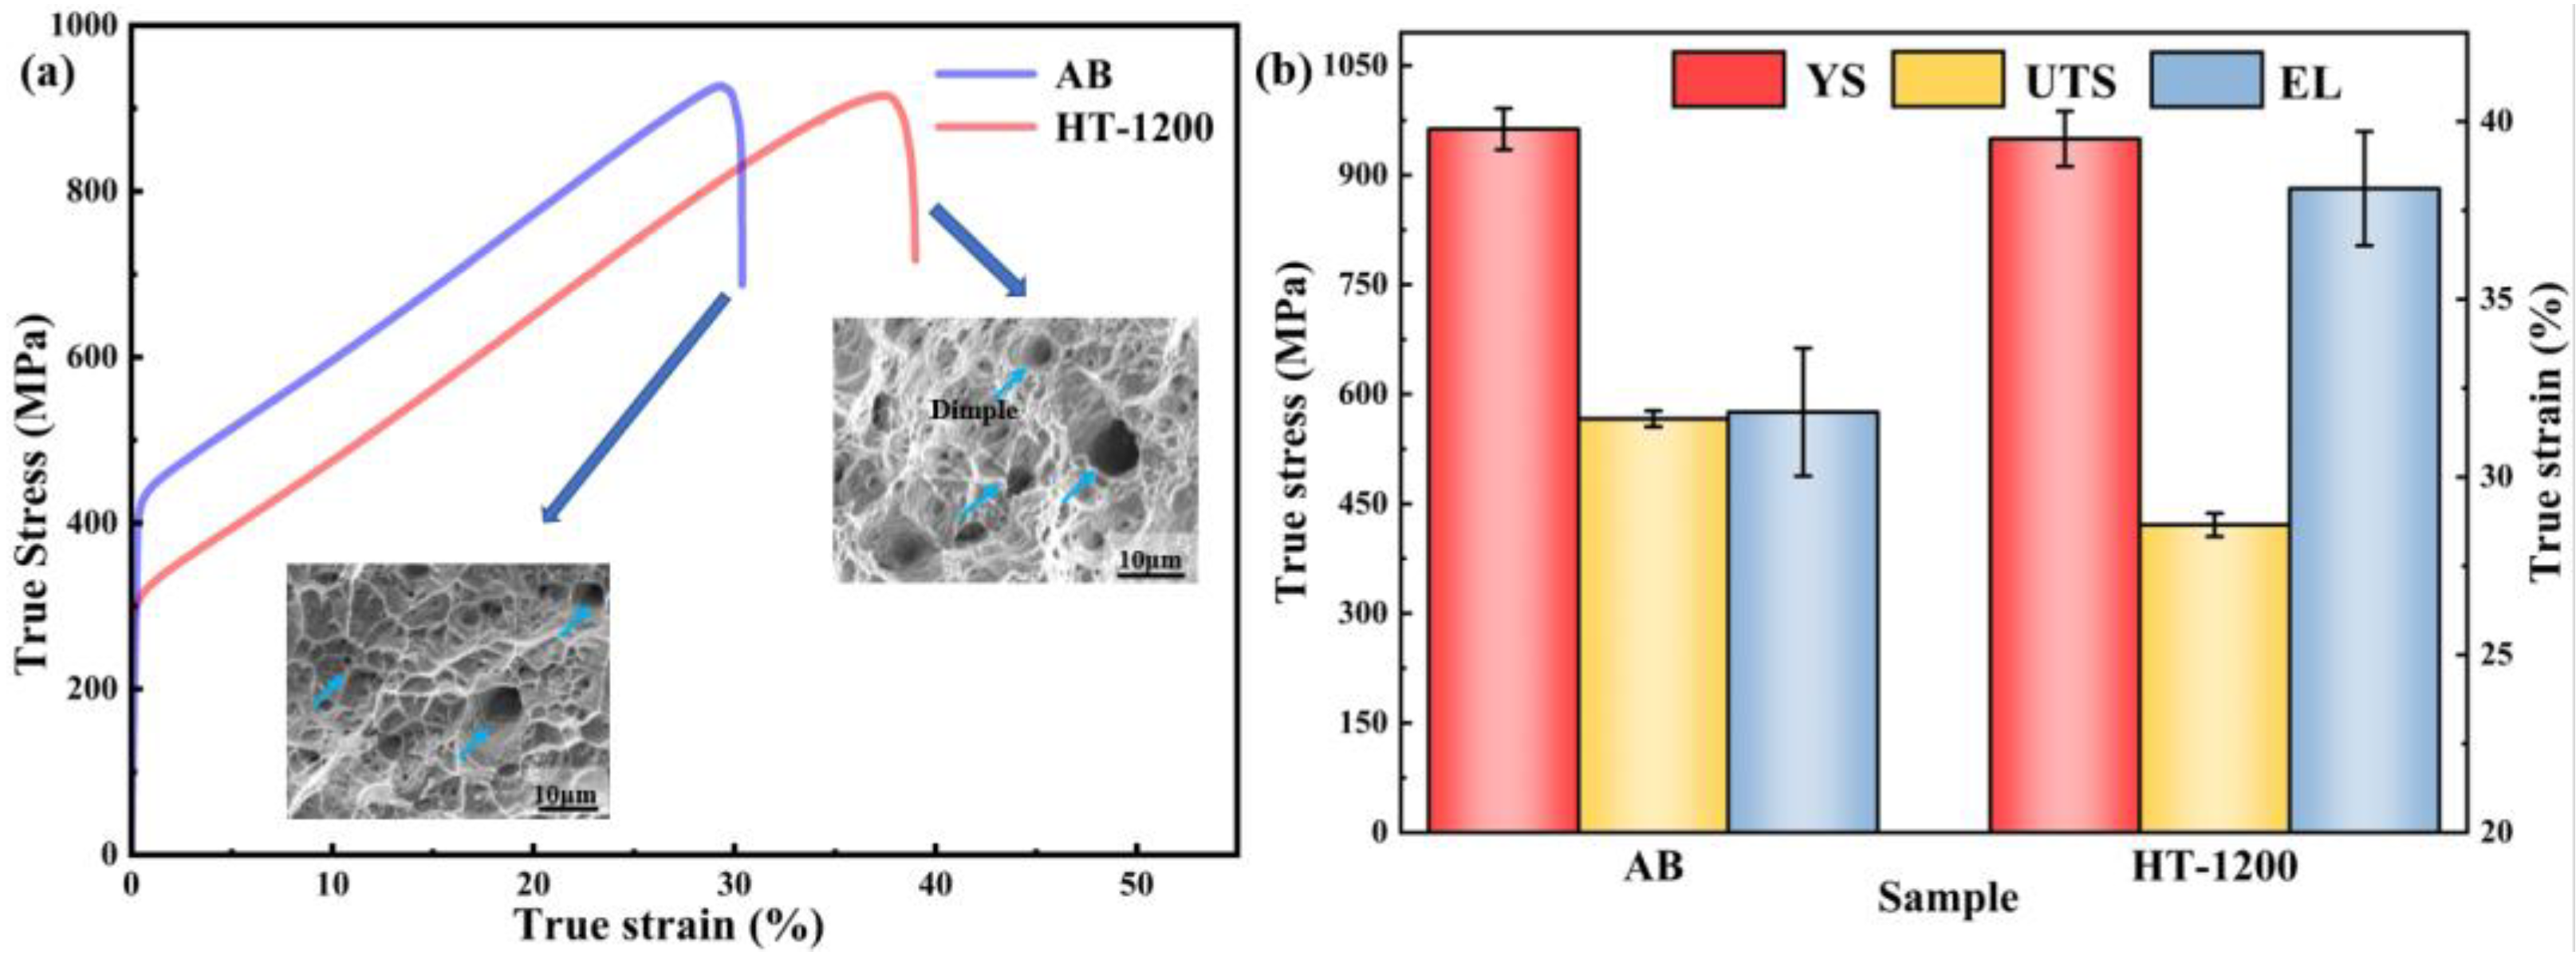
The mechanical properties of the AB and HT-1200 samples are shown in Figure 5a. The yield strength (YS) of the specimens decreased after heat treatment at 1200 °C, but the elongation increased significantly. The decrease in YS may be attributed to the dissolution of Laves and carbides. The inset shows the fracture surfaces of both samples. A high number of dimples and tear ridges are observed on the fracture of both samples, indicating that both samples are ductile fractures. The HT-1200 sample has a larger dimple size and a deeper tear ridge, which has a better plastic deformation capacity than the AB sample. Figure 5b presents the statistical histogram of tensile test results.

Figure 5.
(a) True stress-true strain curves. The arrows in the inset indicate dimples. (b) comparison of the associated yield strength (YS), ultimate tensile strength (UTS), and elongation (EL).
3.2.2. Flow Behavior Analysis
The number of hidden layers of the BPNN is one, and the number of neurons in the hidden layer is twelve. The population size is 30 and the maximum number of iterations is 200. To study the ANN for modeling the constitutive relations of Inconel 625, 220 experimental points in our experimentally obtained stress–strain curves were selected as the original data set (the training set selects 200 points and the test set selects 20 points) for the HT-1200 samples. The data points were selected based on the criterion that they should cover the complete stress-strain curve, including elastic, yield, reinforcement, and neck segments, so that the entire process of material tensile deformation can be completely simulated. In particular, the elastic limit, yield stress, and ultimate stress, which are key points that reflect the mechanical properties of the material, need to be included in the data set.
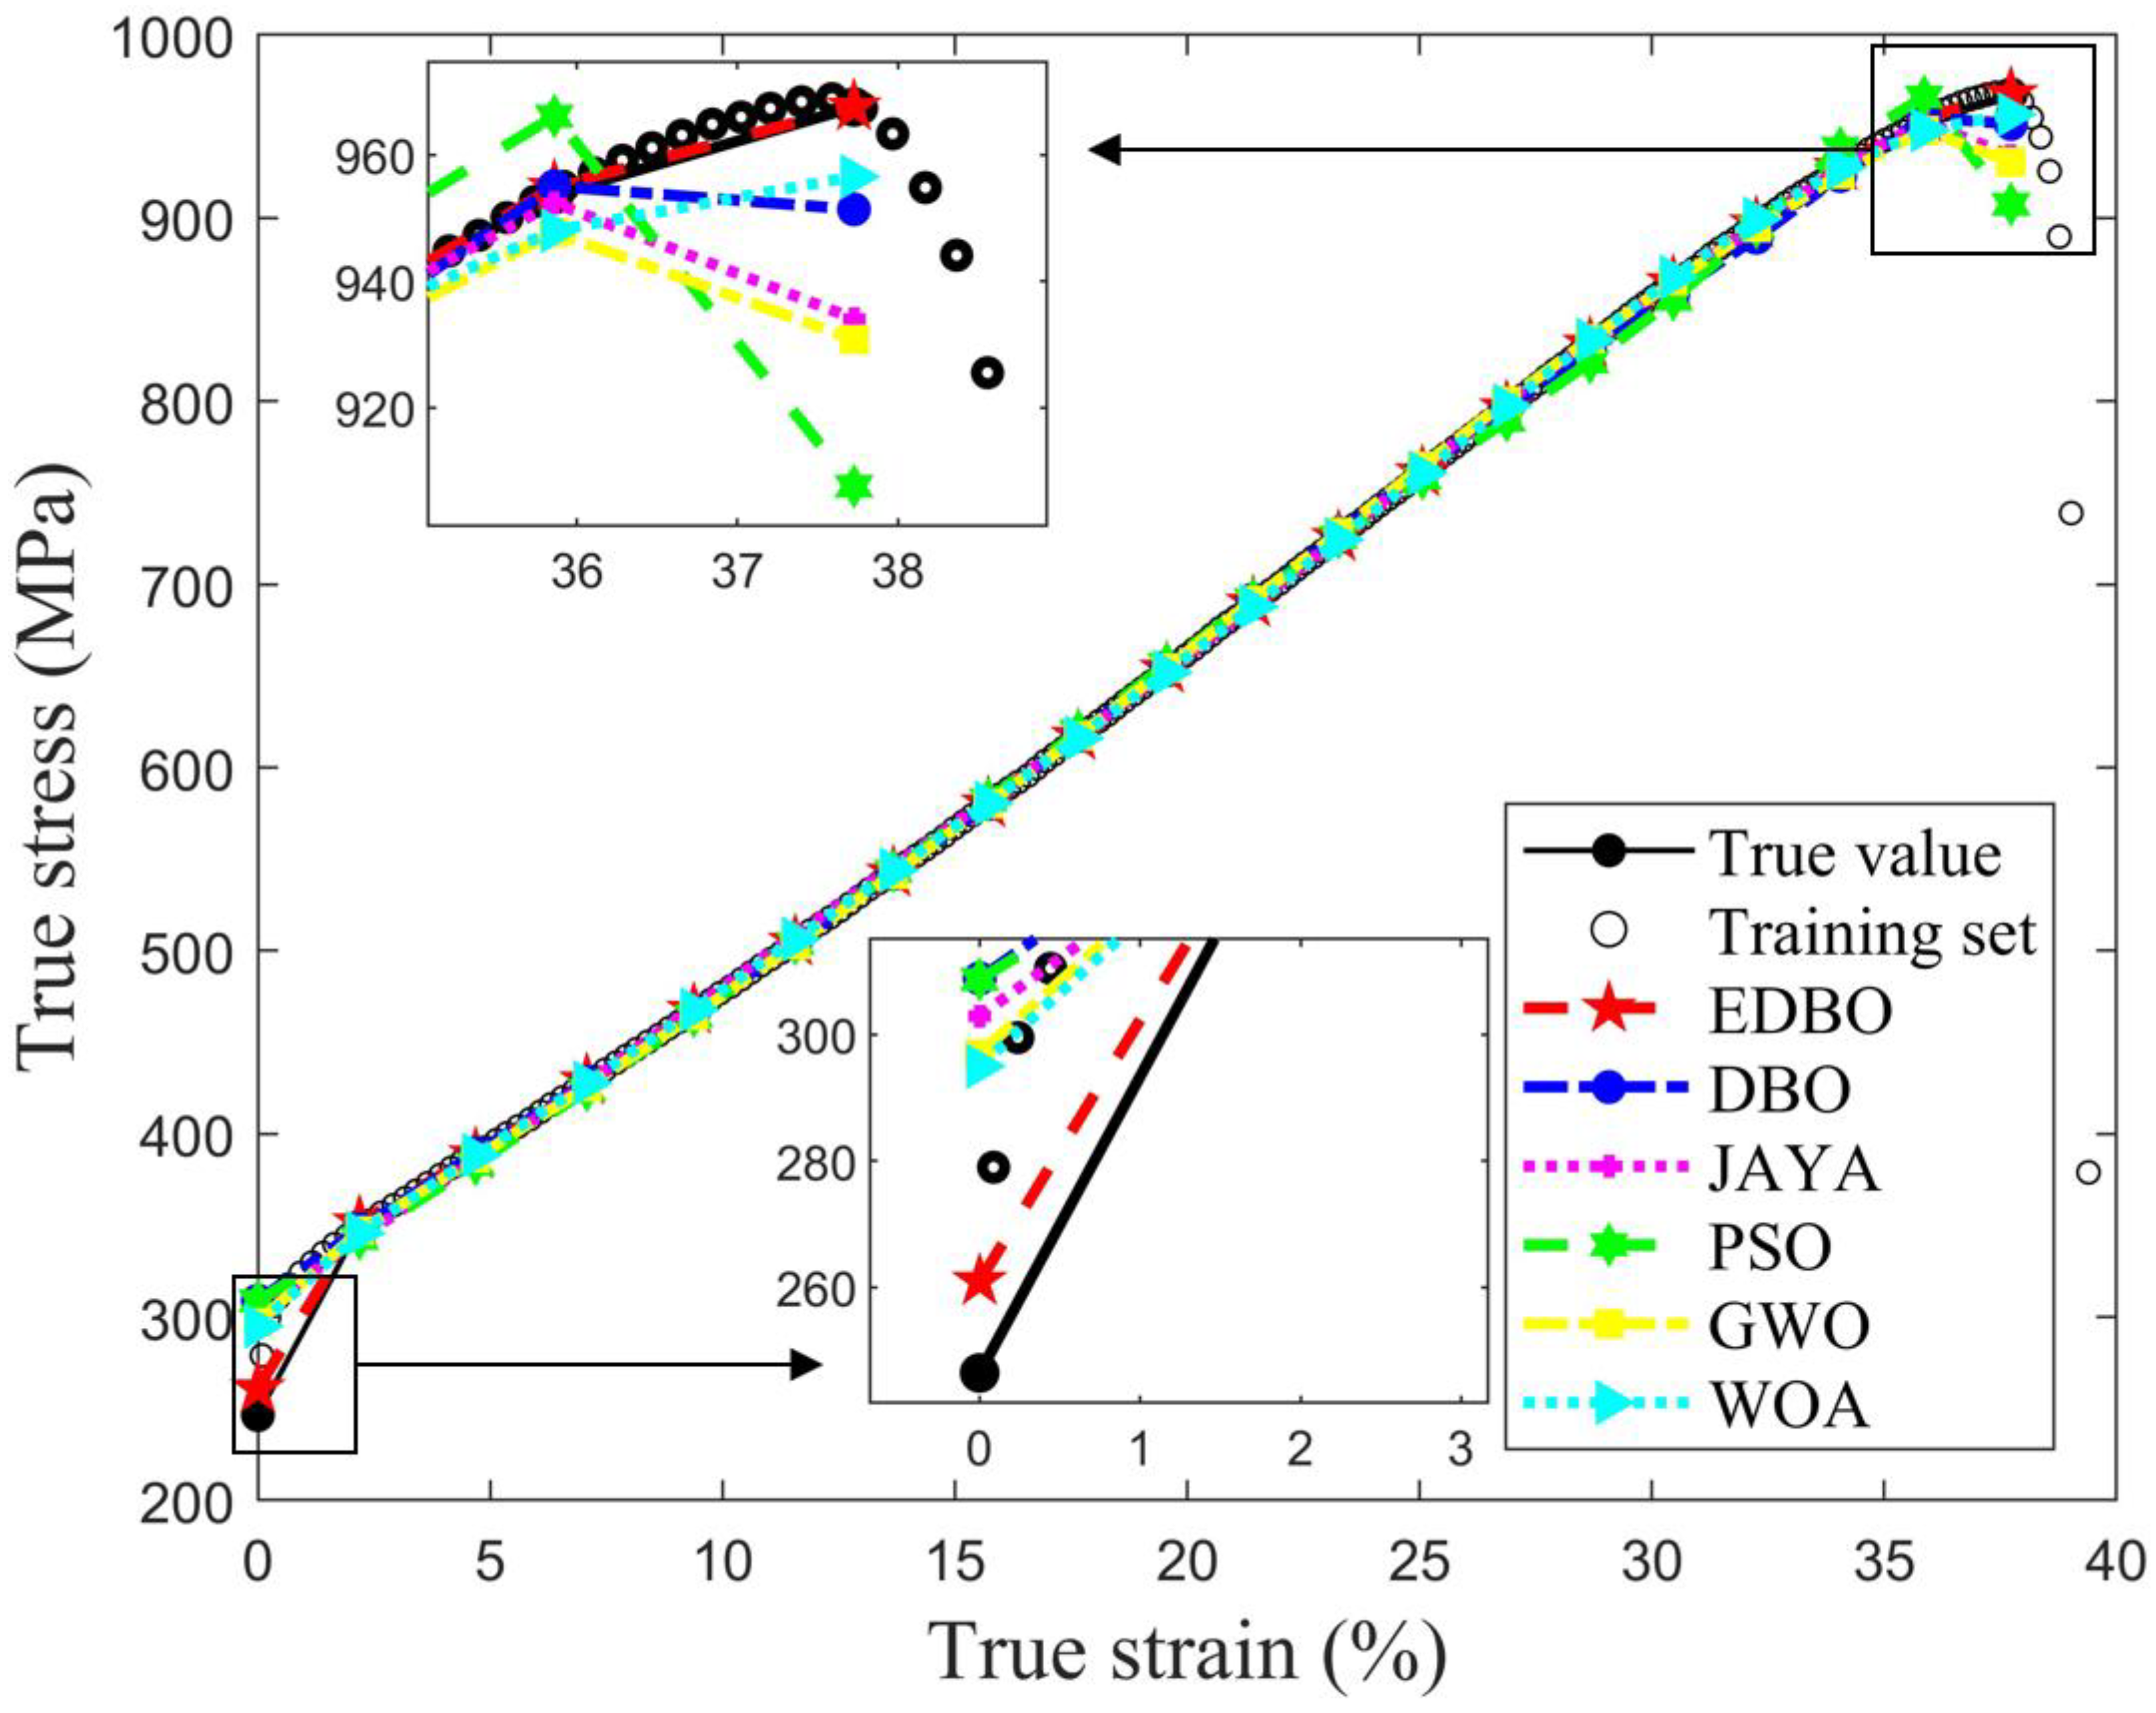
Figure 6 shows the comparison between the prediction results of different hybrid models and the actual data. For HT-1200, the prediction results of the EDBO-BPNN model are closer to the actual values in the initial region and the peak region of the stress–strain curve, indicating that the EDBP-BPNN model is superior to other comparison models in terms of prediction accuracy and can predict the actual experimental data more accurately. In the data of the later stage of the test, the stress of the fracture part has a sudden change, so the stress prediction of this part is the most difficult, yet the model proposed in this paper can still predict almost the same results as the test. In summary, among all the compared algorithms, the model proposed in this paper shows the best prediction performance in both the initial region of stretching and the region where the stress changes abruptly.
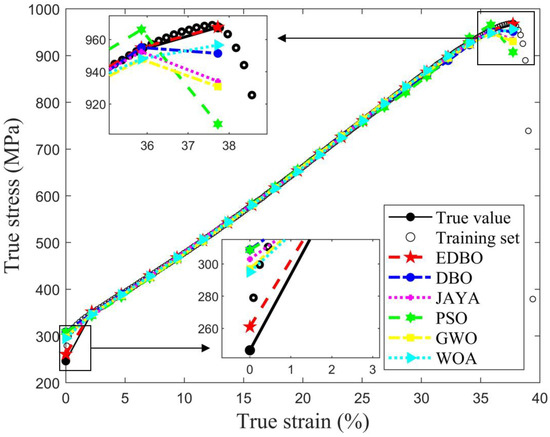
Figure 6.
Comparison of the experimental versus different hybrid models’ predicted values.
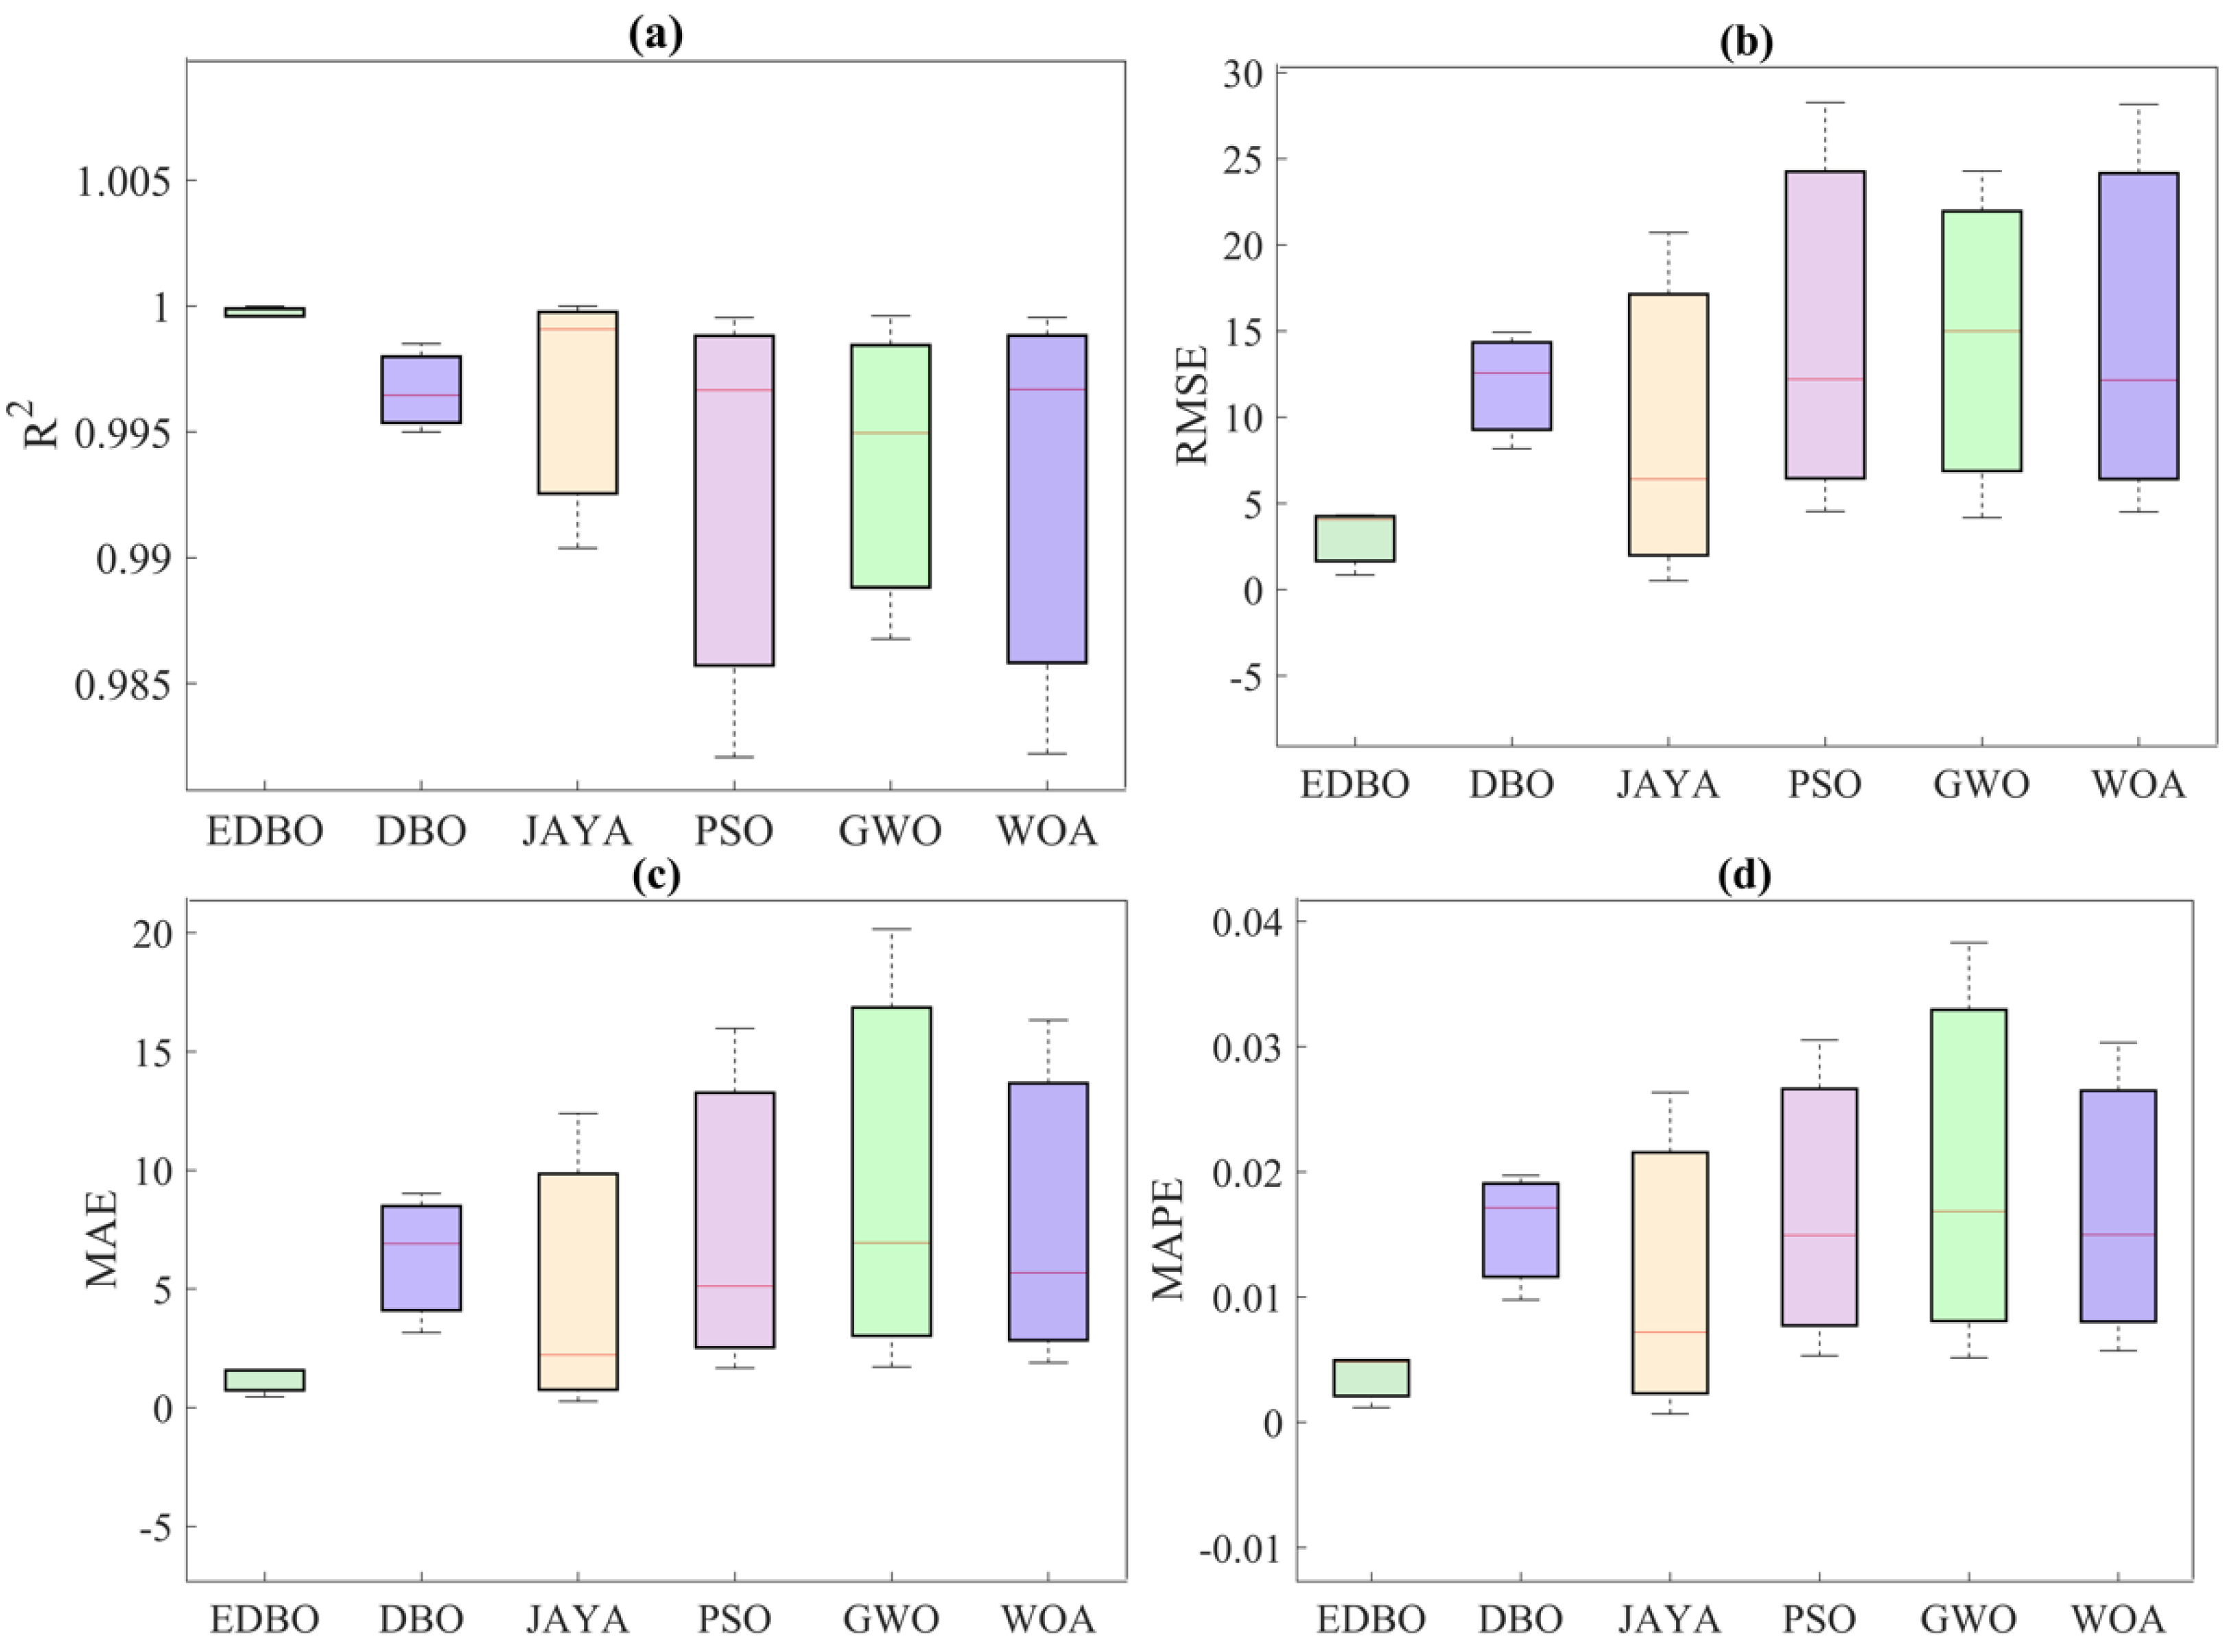
Figure 7 visualizes the prediction evaluation metrics of all the hybrid models in the form of box-line plots to highlight the differences in the comparison of prediction performance. Among them, the EDBO-BPNN model outperforms the other models compared in all prediction evaluation metrics. The R2 is 0.999964, RMSE is 1.1180, MAE is 0.5534, and MAPE is 0.1502% for the evaluated index of HT-1200. Table 1 presents the detailed data. With the same number of iterations, the EDBO-BPNN model can obtain better model parameters and thus achieve higher prediction accuracy.
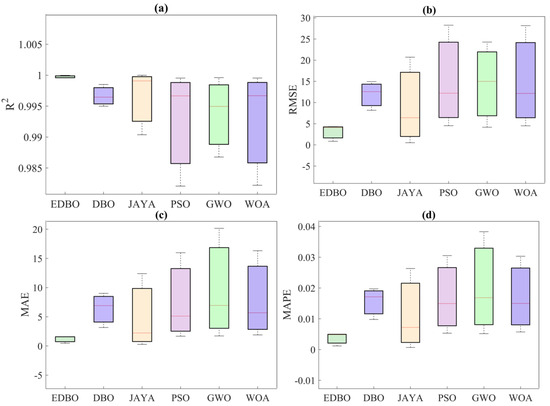
Figure 7.
Evaluation index comparison between experimental values and predicted values of HT-1200: (a) R2; (b) RMSE; (c) MAE; (d) MAPE.

Table 1.
Means of evaluation metrics for the results of training data and testing data.
In general, the predicted results of the EDBO-BPNN agree best with the experimental results and can well predict the tensile stress of the Inconel 625 superalloy manufactured by WAAM. It should be noted that although all the hybrid BPNN models improve the prediction accuracy of the BPNN model by optimizing the initial parameters of the BPNN, the EDBO-BPNN proposed in this study achieves a better balance between local and global search, and thus has a significant advantage in optimizing the BPNN model.
4. Conclusions
The microstructure and mechanical properties of the Inconel 625 superalloy AB samples and HT-1200 samples fabricated by WAAM were studied experimentally. To predict the mechanical behavior of Inconel 625, a new hybrid model combining a swarm intelligence optimization algorithm with a BPNN, named EDBO-BPNN, was proposed. On the basis of experiment data, the constitutive equation of the Inconel 625 superalloy was established using the proposed EDBO-BPNN model in this paper. The prediction results of the EDBO-BPNN are compared with the experimental results and some existing BPNN models in the literature. The main conclusions are drawn below. The microstructure of the AB sample was dominated by columnar grains, and the grains grew epitaxially along the direction of heat flow, while the microstructure of the HT-1200 sample was completely recrystallized. For the HT-1200 sample, the grains were refined, annealing twins were formed, and the texture was weakened. Compared with the AB sample, the yield strength of the HT-1200 sample is reduced, but the elongation is significantly improved. Compared with other hybrid BPNN models, the proposed EDBO-BPNN model agrees best with the experimental results and can well describe the flow stress of the Inconel 625 superalloy. The excellent predictive ability of the model may be attributed to the optimization to the weights and thresholds of the BPNN, which obtains the optimal global solution in the search space more efficiently. The EDBO-BPNN was used to simulate the tensile stress of the Inconel 625 superalloy under static load at room temperature. The establishment of a material constitutive model based on an EDBO-BPNN at high temperature and different strain rates and the verification of its predictive ability still need further study.
Author Contributions
Methodology, visualization, investigation, writing—original draft, data curation, formal analysis, D.X.; visualization, Z.L.; supervision, project administration, conceptualization, methodology, visualization, writing—review and editing, L.C.; supervision, conceptualization, methodology, writing—review and editing, funding acquisition, J.Z. All authors have read and agreed to the published version of the manuscript.
Funding
This research was funded by the National Natural Science Foundation of China (Grant No. 11872190).
Institutional Review Board Statement
Not applicable.
Informed Consent Statement
Not applicable.
Data Availability Statement
The raw data supporting the conclusions of this article will be made available by the authors on request.
Conflicts of Interest
The authors declare no conflicts of interest.
References
- Hu, Y.L.; Lin, X.; Li, Y.L.; Zhang, S.Y.; Gao, X.H.; Liu, F.G.; Li, X.; Huang, W.D. Plastic deformation behavior and dynamic recrystallization of Inconel 625 superalloy fabricated by directed energy deposition. Mater. Des. 2020, 186, 108359. [Google Scholar] [CrossRef]
- Wu, K.Q.; Sun, W.; Tan, A.W.Y.; Marinescu, I.; Liu, E.J.; Zhou, W. An investigation into microstructure, tribological and mechanical properties of cold sprayed Inconel 625 coatings. Surf. Coat. Technol. 2021, 424, 127660. [Google Scholar] [CrossRef]
- Lourenço, J.C.; Souza, L.P.; Faria, M.I.S.T.; Nunes, C.A.; Tomachuk, C.R.; Baker, M.A. Influence of the iron content on the microstructure and electrochemical behavior of as-cast modified Inconel 625. Corros. Sci. 2021, 193, 109892. [Google Scholar] [CrossRef]
- Lin, Z.D.; Song, K.J.; Yu, X.H. A review on wire and arc additive manufacturing of titanium alloy. J. Manuf. Process. 2021, 70, 24–45. [Google Scholar] [CrossRef]
- Li, Y.J.; Yu, S.F.; Chen, Y.; Yu, R.Z.; Shi, Y.S. Wire and arc additive manufacturing of aluminum alloy lattice structure. J. Manuf. Process. 2020, 50, 510–519. [Google Scholar] [CrossRef]
- Wang, Y.F.; Chen, X.Z.; Su, C.C. Microstructure and mechanical properties of Inconel 625 fabricated by wire-arc additive manufacturing. Surf. Coat. Technol. 2019, 374, 116–123. [Google Scholar]
- Wang, Y.F.; Chen, X.Z.; Shen, Q.K.; Su, C.C.; Zhang, Y.P.; Jayalakshmi, S.; Singh, A. Effect of magnetic Field on the microstructure and mechanical properties of Inconel 625 superalloy fabricated by wire arc additive manufacturing. J. Mater. Process. Technol. 2021, 64, 10–19. [Google Scholar] [CrossRef]
- Sakai, T.; Belyakov, A.; Kaibyshev, R.; Miura, H.; Jonas, J.J. Dynamic and post-dynamic recrystallization under hot, cold and severe plastic deformation conditions. Prog. Mater. Sci. 2014, 60, 130–207. [Google Scholar] [CrossRef]
- Hu, Y.L.; Lin, X.; Zhang, S.Y.; Jiang, Y.M.; Lu, X.F.; Yang, H.O.; Huang, W.D. Effect of solution heat treatment on the microstructure and mechanical properties of Inconel 625 superalloy fabricated by laser solid forming. J. Alloys Compd. 2018, 767, 330–344. [Google Scholar] [CrossRef]
- Chen, L.; Sun, Y.Z.; Li, L.; Ren, X.D. Effect of heat treatment on the microstructure and high temperature oxidation behavior of TiC/Inconel 625 nanocomposites fabricated by selective laser melting. Corros. Sci. 2020, 169, 108606. [Google Scholar] [CrossRef]
- Gao, Y.B.; Ding, Y.T.; Chen, J.J.; Xu, J.Y.; Ma, Y.J.; Wang, X.M. Effect of twin boundaries on the microstructure and mechanical properties of Inconel 625 alloy. Mater. Sci. Eng. A 2019, 767, 138361. [Google Scholar] [CrossRef]
- Peron, M.; Razavi, N.; Torgersen, J.; Berto, F. Fracture assessment of PEEK under static loading by means of the local strain energy density. Materials 2017, 10, 1423. [Google Scholar] [CrossRef]
- Peron, M.; Torgersen, J.; Berto, F. Rupture predictions of notched Ti-6Al-4V using local approaches. Materials 2018, 11, 663. [Google Scholar] [CrossRef] [PubMed]
- Gómez, F.J.; Elices, M.; Berto, F.; Lazzarin, P. Local strain energy to assess the static failure of U-notches in plates under mixed mode loading. Int. J. Fract. 2007, 145, 29–45. [Google Scholar] [CrossRef]
- Berto, F.; Lazzarin, P. A review of the volume-based strain energy density approach applied to V-notches and welded structures. Theor. Appl. Fract. Mech. 2007, 52, 183–194. [Google Scholar] [CrossRef]
- Lazzarin, P.; Berto, F.; Zappalorto, M. Rapid calculations of notch stress intensity factors based on averaged strain energy density from coarse meshes: Theoretical bases and applications. Int. J. Fatigue 2010, 32, 1559–1567. [Google Scholar] [CrossRef]
- Berto, F.; Lazzarin, P. Recent developments in brittle and quasi-brittle failure assessment of engineering materials by means of local approaches. Mat. Sci. Eng. R Rep. 2014, 75, 1–48. [Google Scholar] [CrossRef]
- Albinmousa, J.; Peron, M.; Jose, J.; Abdelaal, A.F.; Berto, F. Fatigue of V-notched ZK60 magnesium samples: X-ray damage evolution characterization and failure prediction. Int. J. Fatigue 2020, 139, 105734. [Google Scholar] [CrossRef]
- Hu, W.; Lin, Y.; Yuan, S.; He, Z. Constitutive models for regression of various experimental stress–strain relations. Int. J. Mech. Sci. 2015, 101, 1–9. [Google Scholar] [CrossRef]
- Chinh, N.Q.; Horváth, G.; Horita, Z.; Langdon, T.G. A new constitutive relationship for the homogeneous deformation of metals over a wide range of strain. Acta Mater. 2004, 52, 3555–3563. [Google Scholar] [CrossRef]
- Mozaffar, M.; Bostanabad, R.; Chen, W.; Ehmann, K.; Cao, J.; Bessa, M.A. Deep learning predicts path-dependent plasticity. Proc. Natl. Acad. Sci. USA 2019, 116, 26414–26420. [Google Scholar] [CrossRef] [PubMed]
- Deb, S.; Muraleedharan, A.; Immanuel, R.J.; Panigrahi, S.K.; Racineux, G.; Marya, S. Establishing flow stress behaiour of Ti-6Al-4V alloy and development of constitutive models using Johnson-Cook method and Artificial Neural Network for quasi-static and dynamic loading. Theor. Appl. Fract. Mech. 2022, 119, 103338. [Google Scholar] [CrossRef]
- Lin, Y.C.; Nong, F.Q.; Chen, X.M.; Chen, D.D.; Chen, M.S. Microstructural evolution and constitutive models to predict hot deformation behaviors of a nickel-based superalloy. Vacuum 2017, 137, 104–114. [Google Scholar] [CrossRef]
- Roy, U.; Majumder, M. Evaluating heat transfer analysis in heat exchanger using NN with IGWO algorithm. Vacuum 2019, 161, 186–193. [Google Scholar] [CrossRef]
- Qiao, L.; Zhu, J.C. Constitutive modeling of hot deformation behavior of AlCrFeNi multi-component alloy. Vacuum 2022, 201, 111059. [Google Scholar] [CrossRef]
- Rawa, M.J.H.; Dehkordi, M.H.R.; Kholoud, M.J.; Hamdeh, N.H.A.; Azimy, H. Using the numerical simulation and artificial neural network (ANN) to evaluate temperature distribution in pulsed laser welding of different alloys. Eng. Appl. Artif. Intell. 2023, 126, 107025. [Google Scholar] [CrossRef]
- Wu, Z.L.; Liu, Z.Q.; Li, L.Z.; Lu, Z.D. Experimental and neural networks analysis on elevated-temperature mechanical properties of structural steels. Mater. Today Commun. 2022, 32, 104092. [Google Scholar] [CrossRef]
- Uz, M.M.; Yoruç, A.B.H.; Cokgunlu, O.; Aydoğan, C.S.; Yapici, G.G. A comparative study on phenomenological and artificial neural network models for high temperature flow behavior prediction in Ti6Al4V alloy. Mater. Today Commun. 2022, 33, 104933. [Google Scholar] [CrossRef]
- Ji, C.M.; Hu, J.Q.; Wang, B.; Zou, Y.J.; Yang, Y.S.; Sun, Y.G. Mechanical behavior prediction of CF/PEEK-titanium hybrid laminates considering temperature effect by artificial neural network. Compos. Struct. 2021, 262, 113367. [Google Scholar] [CrossRef]
- Liu, B.; Wang, R.; Zhao, G.; Guo, X.; Wang, Y.; Li, J.; Wang, S. Prediction of rock mass parameters in the TBM tunnel based on BP neural network integrated simulated annealing algorithm. Tunn. Undergr. Space Technol. 2020, 95, 103103. [Google Scholar] [CrossRef]
- Chen, L.; Wu, T.; Wang, Z.; Lin, X.; Cai, Y. A novel hybrid BPNN model based on adaptive evolutionary Artificial Bee Colony Algorithm for water quality index prediction. Ecol. Indic. 2023, 146, 109882. [Google Scholar] [CrossRef]
- Ban, W.C.; Shen, L.D.; Chen, L.; Xu, C.T. Monthly runoff prediction based on variational modal decomposition combined with the dung beetle optimization algorithm for gated recurrent unit model. Environ. Monit. Assess. 2023, 195, 1538. [Google Scholar]
- Sun, P.M.; Bao, T.F.; Gu, C.S.; Jiang, M.; Wang, T.; Shi, Z.W. Parameter sensitivity and inversion analysis of a concrete faced rock-fill dam based on HS-BPNN algorithm. Sci. China Technol. Sci. 2016, 59, 1442–1451. [Google Scholar] [CrossRef]
- Xue, J.K.; Shen, B. Dung beetle optimizer: A new meta-heuristic algorithm for global optimization. J. Supercomput. 2023, 79, 7305–7336. [Google Scholar] [CrossRef]
- Zhao, K.; Guo, D.D.; Sun, M. Short-Term Traffic Flow Prediction Based on VMD and IDBO-LSTM. IEEE Access 2023, 11, 97072–97088. [Google Scholar] [CrossRef]
- Zhang, H.; Liu, Y.L.; Chao, H. Density peak clustering based on improved dung beetle optimization and mahalanobis metric. J. Intell. Fuzzy. Syst. 2023, 45, 6179–6191. [Google Scholar] [CrossRef]
- Lu, Z.H.; Zhang, J. An Enhanced Dung Beetle Optimization Algorithm for Global Optimization. Curr. J. Appl. Sci. Technol. 2023, 42, 9–22. [Google Scholar] [CrossRef]
- Chen, Y.H.; Xu, M.F.; Zhang, T.M.; Xie, J.L.; Wei, K.; Wang, S.L.; Yin, L.M.; He, P. Grain refinement and mechanical properties improvement of Inconel 625 alloy fabricated by ultrasonic-assisted wire and arc additive manufacturing. J. Alloys Compd. 2022, 910, 164957. [Google Scholar] [CrossRef]
- Rao, R. Jaya: A simple and new optimization algorithm for solving constrained and unconstrained optimization problems. Int. J. Ind. Eng. Comput. 2016, 7, 19–34. [Google Scholar]
- van den Bergh, F.; Engelbrecht, A.P. A study of particle swarm optimization particle trajectories. Inf. Sci. 2006, 176, 937–971. [Google Scholar] [CrossRef]
- Mirjalili, S.; Mirjalili, S.M.; Lewis, A. Grey wolf optimizer. Adv. Eng. Softw. 2014, 69, 46–61. [Google Scholar] [CrossRef]
- Gharehchopogh, F.S.; Gholizadeh, H. A comprehensive survey: Whale Optimization Algorithm and its applications. Swarm Evol. Comput. 2019, 48, 1–24. [Google Scholar] [CrossRef]
- Li, G.; Shi, J. On comparing three artificial neural networks for wind speed forecasting. Appl. Energy 2010, 87, 2313–2320. [Google Scholar] [CrossRef]


Disclaimer/Publisher’s Note: The statements, opinions and data contained in all publications are solely those of the individual author(s) and contributor(s) and not of MDPI and/or the editor(s). MDPI and/or the editor(s) disclaim responsibility for any injury to people or property resulting from any ideas, methods, instructions or products referred to in the content. |
© 2024 by the authors. Licensee MDPI, Basel, Switzerland. This article is an open access article distributed under the terms and conditions of the Creative Commons Attribution (CC BY) license (https://creativecommons.org/licenses/by/4.0/).