Article

Influence of Monolith Length on Temperature Field of Concrete Gravity Dams

by
Uroš Mirković
1,*,
Vladan Kuzmanović
2 and
Goran Todorović
2
1
Jaroslav Černi Water Institute, 11226 Belgrade, Serbia
2
Faculty of Civil Engineering, University of Belgrade, 11120 Belgrade, Serbia
*
Author to whom correspondence should be addressed.
Appl. Sci. 2024, 14(8), 3248; https://doi.org/10.3390/app14083248
Submission received: 10 March 2024 / Revised: 5 April 2024 / Accepted: 8 April 2024 / Published: 12 April 2024
(This article belongs to the Section Civil Engineering)

Abstract

:
This paper examines the influence of monolith length on the temperature field of concrete gravity dams built using the block method. The developed 3D model is capable of conducting a thermal analysis of a 95.0 m high concrete gravity dam built using the block method, where each newly cast block represents a new analysis phase. The calculation accounts for the period of construction, the filling of the reservoir, and the service for a total duration of about 5 years. The thermal properties of the material, the influence of cement hydration heat, the temperature of the surrounding rock mass, the temperature of the fresh concrete mixture, and the corresponding boundary conditions defining a heat transfer were taken into account. The height and width of the blocks, as well as the sequence of concreting, were considered invariable, while the length of the blocks (dimension in the direction of the dam’s axis equal to the monolith length) varied, with values of 10.0, 12.5, 15.0, and 20.0 m. The obtained calculation results for the control nodes showed that the maximum reduction in the monolith length (from 20.0 m to 10.0 m) caused a decrease in the maximum temperature values of the concrete (from 1.6 to 3.4 °C, depending on the control node). Also, the results showed that, by reducing the length of the monolith, there was a delay in the moment at which the maximum temperature values of the concrete appeared in the selected control node. The delay in reaching the maximum, in relation to the 10.0 m long monolith, was from 7 days (for points on the crest dam) to 49 days (for points in the central zone of the monolith) for the other considered monolith lengths. The above indicates the importance of concrete temperature control for longer monoliths, especially during construction in extreme air temperatures. The main contribution of the conducted analysis is the development of insight into temperature field changes depending on monolith length, which can help engineers during the design and construction of new, as well as the maintenance of existing, dams.

1. Introduction

After embedding concrete in the body of a dam, a cooling process begins. The process of cooling can be sudden (the result of a change in the daily or seasonal air temperature) or gradual (the result of a natural process by which the temperature of the concrete tends to equalize with the average air temperature over many years).
As a result of the mentioned processes, thermal expansion of the concrete occurs, which can cause the formation of cracks. The mentioned processes can lead to a decrease in the durability and safety of these massive concrete structures [1].
The appearance of cracks in concrete gravity dams (CGDs) can be avoided or reduced by the application of various measures, one of which is construction in separate monoliths. The appropriate length of a monolith can be determined using a thermal stress analysis, which is influenced by a large number of factors.
Numerous researchers have investigated the thermal analysis (TA) of CGDs made from conventional concrete (CVC), roller-compacted concrete (RCC), and rock-filled concrete (RFC).
In the field of CGDs made from CVC, Ishikawa [2] conducted numerical simulations for the adopted material parameters and concrete-pouring schedule with the aim of determining the thermal and stress states in the structure. The results of a temperature field (TF) calculation were compared against the results of measurements on the dam, and a good agreement was obtained. Leger et al. [3,4] presented a procedure for modelling the thermal stress behavior under conditions of extremely low temperatures. The effect of solar radiation was taken into account by increasing the mean annual temperature at the point of contact of the concrete and air. Extensive parametric analyses were performed and the thermal conditions were determined for the critical stresses in the structure. Daoud et al. [5] carried out a two-dimensional phased TA of a dam with the surrounding rock mass using the geometry extracted from papers [3,4]. Special attention was paid to the formulation of the boundary conditions on the surface of the reservoir, which takes into account the formation and melting of ice as well as the interaction between the dam and the rock mass. The paper did not consider the heat of cement hydration, assuming that this process was completed after several years of service. Ganelli et al. [6] conducted an analysis on the influence of external factors on the horizontal displacements of a structure. This research, which also included a statistical prediction model, showed that the influence of seasonal changes of the external temperatures extended to a depth of 8.0 m, while the influence of daily temperatures extended to a depth of 0.6 m inside the structure. Embaby et al. [7] conducted a thermal stress analysis to determine the influence of variations in the considered parameters (construction dynamics, cement content in concrete mixture, and ambient temperature) on the thermal and stress responses of the structure during construction. Similar research was conducted by Sayed-Ahmed et al. [8] with the aim of determining the impact of changing the time intervals for casting blocks on the structural behavior. For the purposes of model verification within this research, the author’s experimental and analytical models given in [9] were used. The presented results indicate the importance of an adequate sequence and time interval for casting blocks.
On the subject of CGDs made of RCC, Cervera et al. [10,11] as well as Luna and Wu [12] presented thermal stress analyses of construction processes in separate studies. In [10,11], a parametric analysis was carried out in order to determine the effects of the temperature of the fresh concrete mixture, the start date, and the speed of concreting on the TF. As a part of his research, Amberg [13] presented the thermal behavior during construction with the aim of optimizing the cooling process of a dam. Waleed et al. [14] conducted an analysis on the influence of the start of concreting on the thermal stresses of a CGD made of RCC. Solar radiation was taken into account by increasing the ambient temperature by 1.0 °C. The results showed that the start of concreting during warm periods of the year can cause thermal cracks that can spread through the body of the dam, especially in the area of the foundation of the dam. Malkawi et al. [15] performed thermal stress tests for different monolith lengths (15.0, 30.0, and 45.0 m). Zhang et al. [16] conducted a thermal stress analysis during construction with and without the influence of surface thermal insulation during the winter. Kurian et al. [17] performed a thermal parametric analysis by varying the material thermal parameters, the pouring height of the concrete layers, and the initial temperature of the concrete mixture. Kuzmanović et al. presented a spatial numerical model for a phased calculation of the TF as a part of the research in [18,19], where verification of the model was performed based on the results of measuring the concrete temperatures in the dam’s body. Mirković et al. [20] carried out a thermal stress analysis for two monolith lengths (15.0 m and 20.0 m) and presented a methodology for optimizing the monolith length by controlling the thermal tensile stresses during the construction and service of a CGD.
Zhang et al. [21] conducted an analysis of the influence of extremely low temperatures on the behavior of rock-filled concrete (RFC) dams located in cold regions. The TF was calculated during the construction and exploitation process. The presented results showed that the use of RFC gives lower temperatures and thermal stresses than CVC, and the installation of an insulation layer on the surface of the dam body can significantly reduce the thermal tensile stresses. As part of the research in [22], the application of modern types of cements in the area of concrete dams was considered.
The aim of the research conducted in this paper was to show the influence of monolith length on the temperature field of CGDs built using the block method over a period of about five years.
In the numerical models, a phased TA was performed for four different monolith lengths (20.0 m, 15.0 m, 12.5 m, and 10.0 m), taking into account the corresponding initial and boundary conditions that define heat transfer. Model verification was carried out by controlling the amplitudes in characteristic nodes with the help of a simplified calculation method, which is presented in [4,23].
As a result of the calculation, the TF, the temperatures in characteristic nodes, and their variations with changes in the monolith length during the construction and service phases are shown. The presented results show a significant sensitivity to changes in the monolith length.

2. Theoretical Framework

2.1. Concrete Hydration Process

Heat development in a concrete specimen [24,25,26,27,28] hardening under adiabatic conditions (no heat transfer with the environment) can be determined as follows [25]:
d T d t = Q H ρ · c p = d H d t 1 ρ · c p  
where T is the temperature of the concrete [°C], ρ   is the concrete density [kg/m3], C p is the specific heat capacity of the concrete [J/kg/°C], Q H is the heat-generation rate [W/m3], and H is the heat of hydration of the concrete [J/m3].
The degree of hydration is a measure of the extent of reactions between cementitious materials and water, and it is defined as follows [25]:
α t = H t H T  
where α t is the degree of hydration at time t, H t   is the cumulative heat of hydration released at time t [J/m3], and H T is the total ultimate heat of hydration of the concrete [J/m3].
The exponential formulation shown in Equation (3) has been demonstrated to accurately represent the development of hydration [25].
α t e = α u · e x p τ t e β
where α t e   is the degree of hydration at the equivalent age t e , τ   is the hydration time parameter [h], β is the hydration shape parameter, and α u is the ultimate degree of hydration, which is given by the following equation:
α u = 1.031 · w / c 0.194 + w / c + 0.50 · p F A + 0.30 · p s l a g
where w/c is the water–cementitious ratio, p F A   is the fly ash weight ratio in terms of the total cementitious content, and p s l a g is the slag weight ratio in terms of the total cementitious content.
The total ultimate heat of hydration of the concrete can be calculated as follows [25]:
H T = H u · C c
where H T is the total ultimate heat of hydration of the concrete [J/m3], C c is the cementitious material content [g/m3], and H u is the total heat of hydration of the cementitious materials at complete hydration [J/g].

2.2. Heat Transfer on Surfaces of Concrete Blocks

Heat transfer between the structure and the external environment occurs due to a difference in the temperature of the concrete blocks’ surfaces and the ambient temperature. Temperature differences can result from fluctuations in the temperature of the air or the water in the reservoir; solar radiation; and the heat generated from cement hydration.
Fluctuations in the ambient temperature can be daily, due to sudden weather changes, or yearly. Diurnal temperature variations have little effect on the CGD temperature field due to their small penetration into a dam. Sudden weather changes are a rare phenomenon and are not strictly periodic, while annual temperature variations are the most relevant for calculations and are obtained from the mean monthly temperature fluctuations [26].
In deep reservoirs, the water temperature can be represented by the model defined in [29], if there are relevant measurements of the air and water temperatures through the depth. An example of the application of this model to a deep reservoir is given in [30].
The influence of solar radiation was not considered in this research. In these types of analyses, solar radiation can be indirectly taken into account by increasing the combined convective coefficient or mean surface temperature of the blocks.

2.3. Temperature of Fresh Concrete Mixture

One very important influence on the temperature field in a dam is the temperature of the fresh concrete mixture. Therefore, lowering this temperature is one of the most effective ways to limit the temperature increase in massive concrete dams [31].
To this end, slow-setting cements are used, the concrete is made with a smaller amount of cement, retarders are used to slow down the cement-setting process, and ice is used when making the mixture.
As for concrete-casting technology, the following steps are applied: the storage of water in underground tanks, the thermal insulation of cement silos, the protection of aggregates from direct sunlight, phased concreting, concreting at night, the cooling and curing of concrete surfaces, the installation of cooling pipes for the cooling of concrete from the inside, and the installation of prefabricated concrete elements where the hydration process has been completed.

2.4. Temperature of the Surrounding Rock Mass

The temperature of the surrounding rock practically does not depend on seasonal changes in the air temperature and, with the exception of the surface layer, can be assumed to have a constant value [31].
Figure 1 shows all the heat-transfer processes presented in this paper.

3. Numerical Models for Thermal Analysis

3.1. Model Description

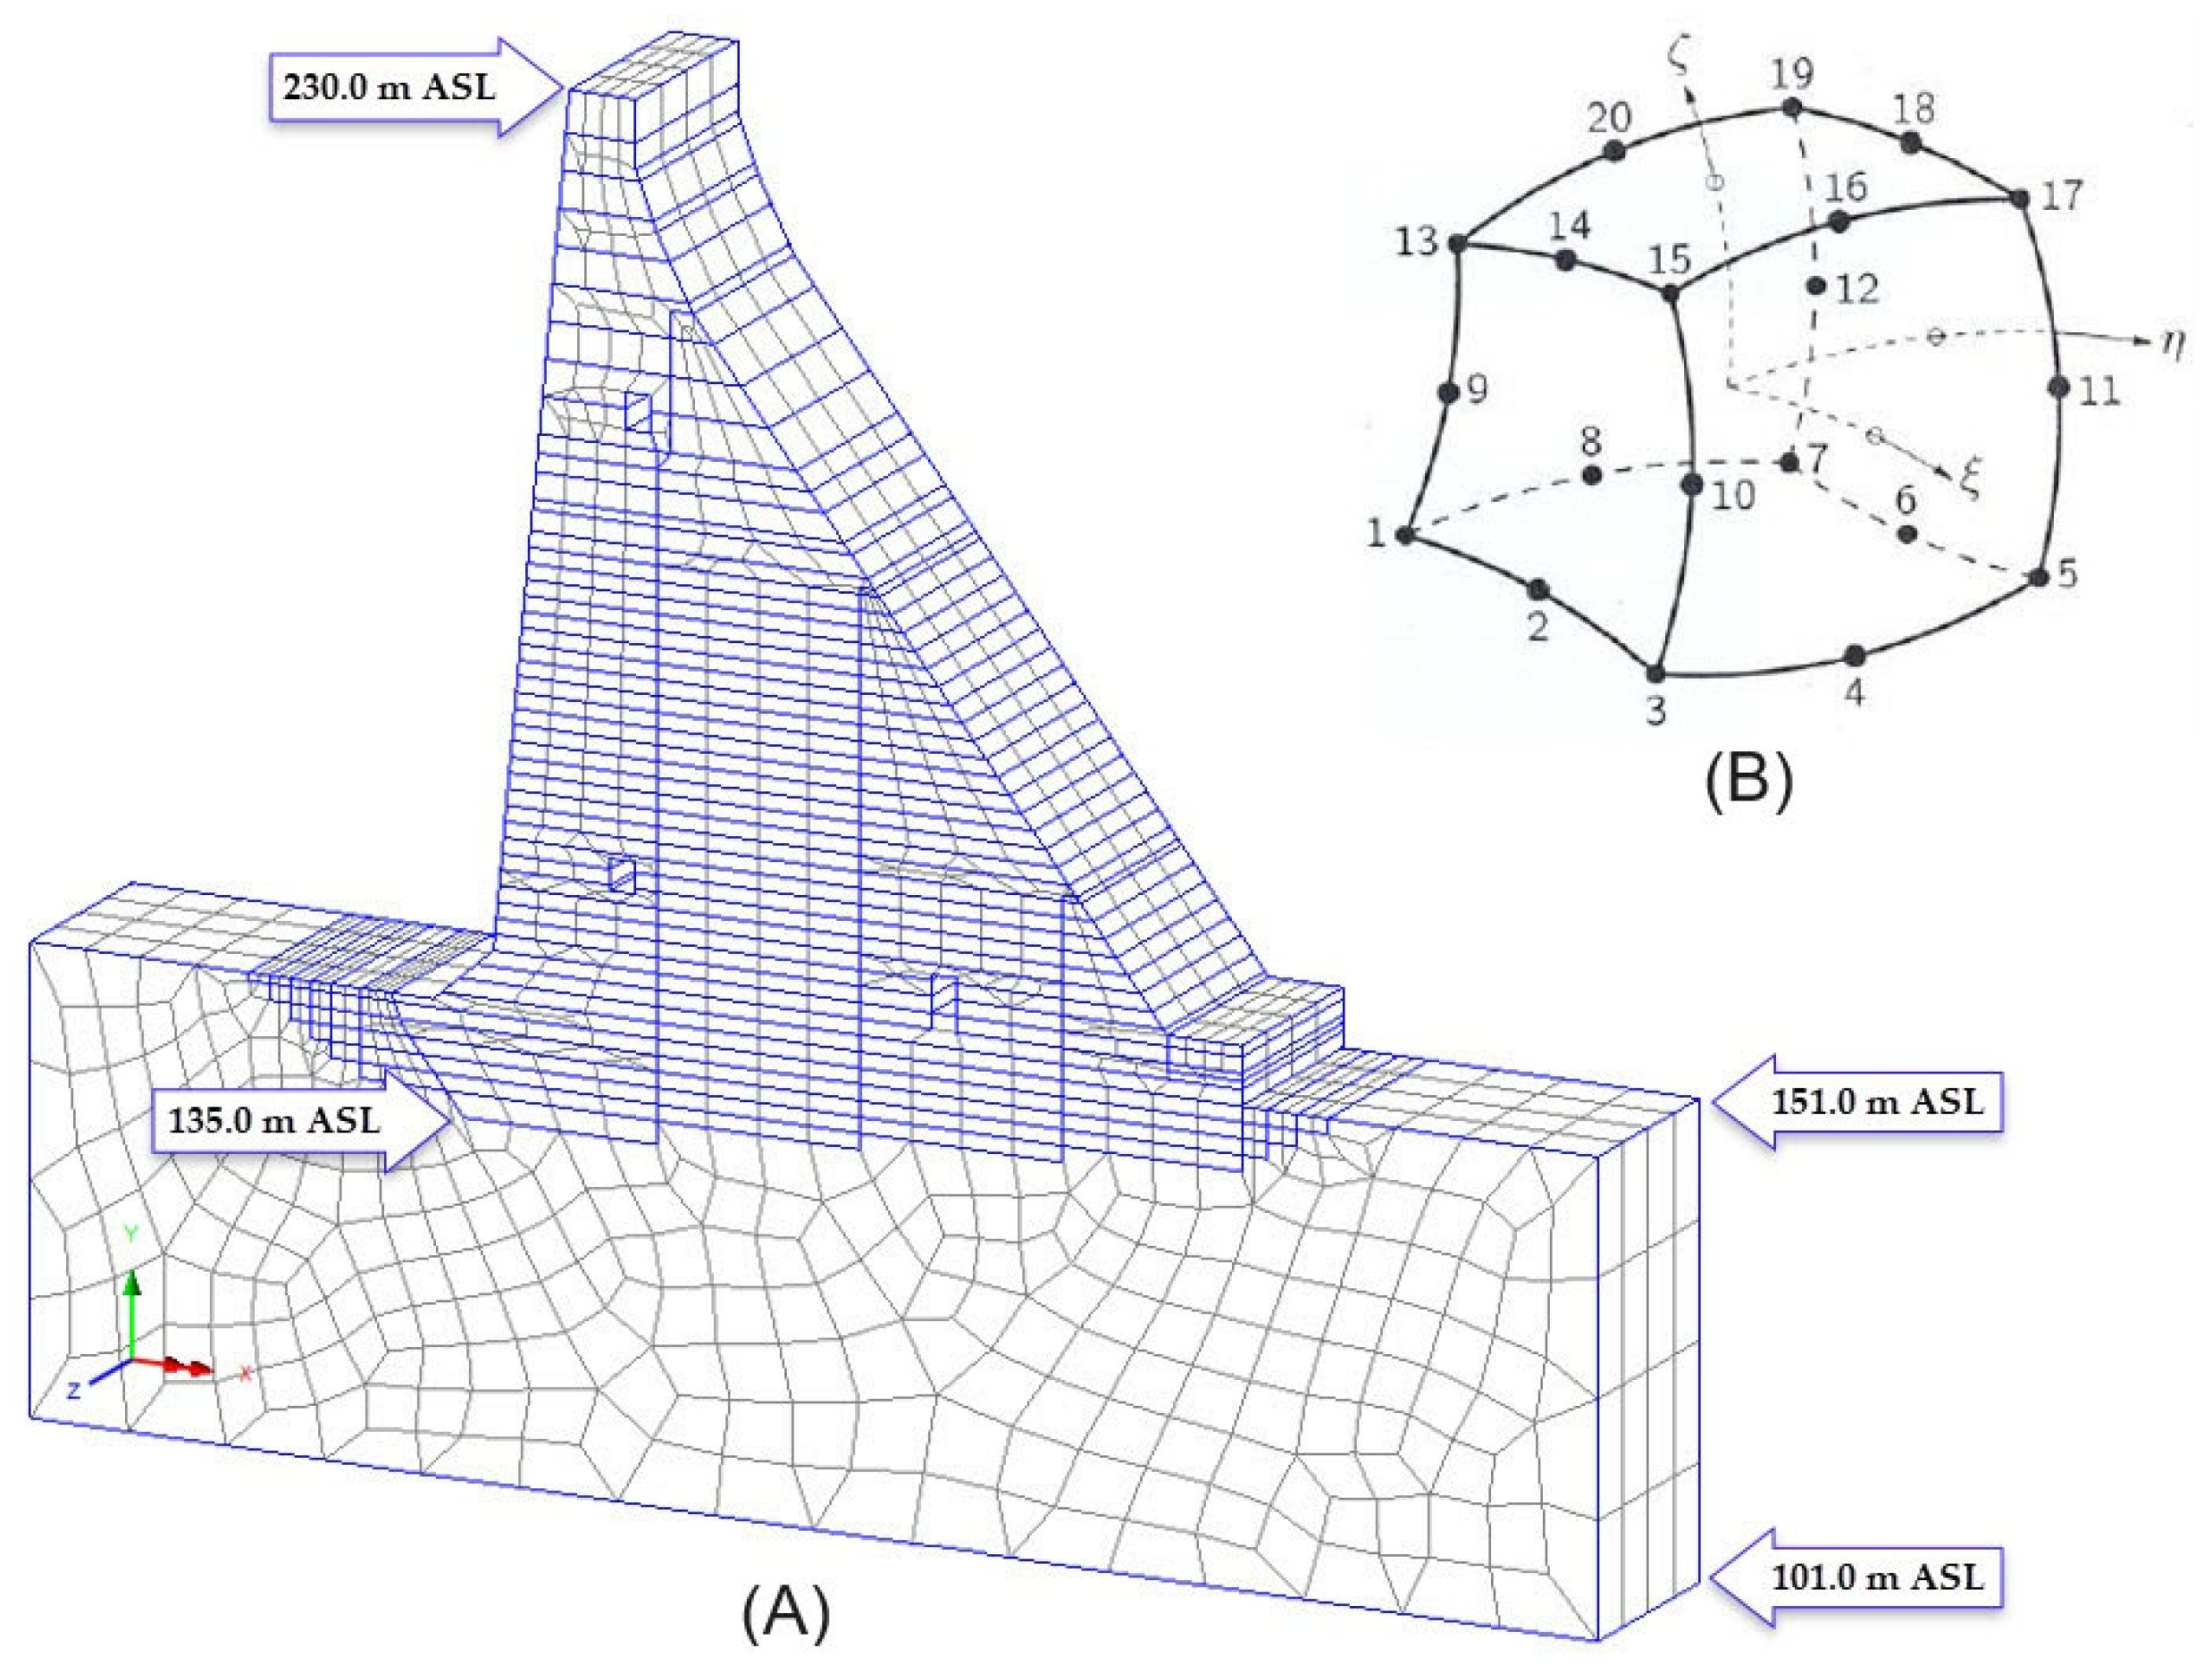
In this research, a cross-section of a 95.0 m high monolith (Figure 2A) with 78 blocks (Figure 3) and its material parameters were extracted from [20,32]. The FEM model was created in the Lusas Academic software https://www.lusas.com [33]. The mesh was created using hexahedral finite elements (Figure 2B).
The blocks were arranged by combining long blocks and vertical joints (Figure 3). The length of the blocks was equal to the length of the monolith, the average width of the blocks was 20.0 m, and the height varied from 3.0 m to 4.0 m.

3.2. Thermal Material Parameters

For the TF analysis of the dam, the adopted thermal parameters and concrete hydration parameters are presented in Table 1 and Table 2, respectively. The thermal parameters of the rock mass are given in Table 3 [20].

3.3. Boundary Conditions for Thermal Analysis

In the TF analysis, the following boundary conditions were considered:
  • The interface between the blocks and the rock mass;
  • The interface between the old and fresh concrete blocks;
  • The contact of the block’s surface with air;
  • The contact of the block’s surface with water;
  • The temperature of the fresh concrete mixture (the initial condition).
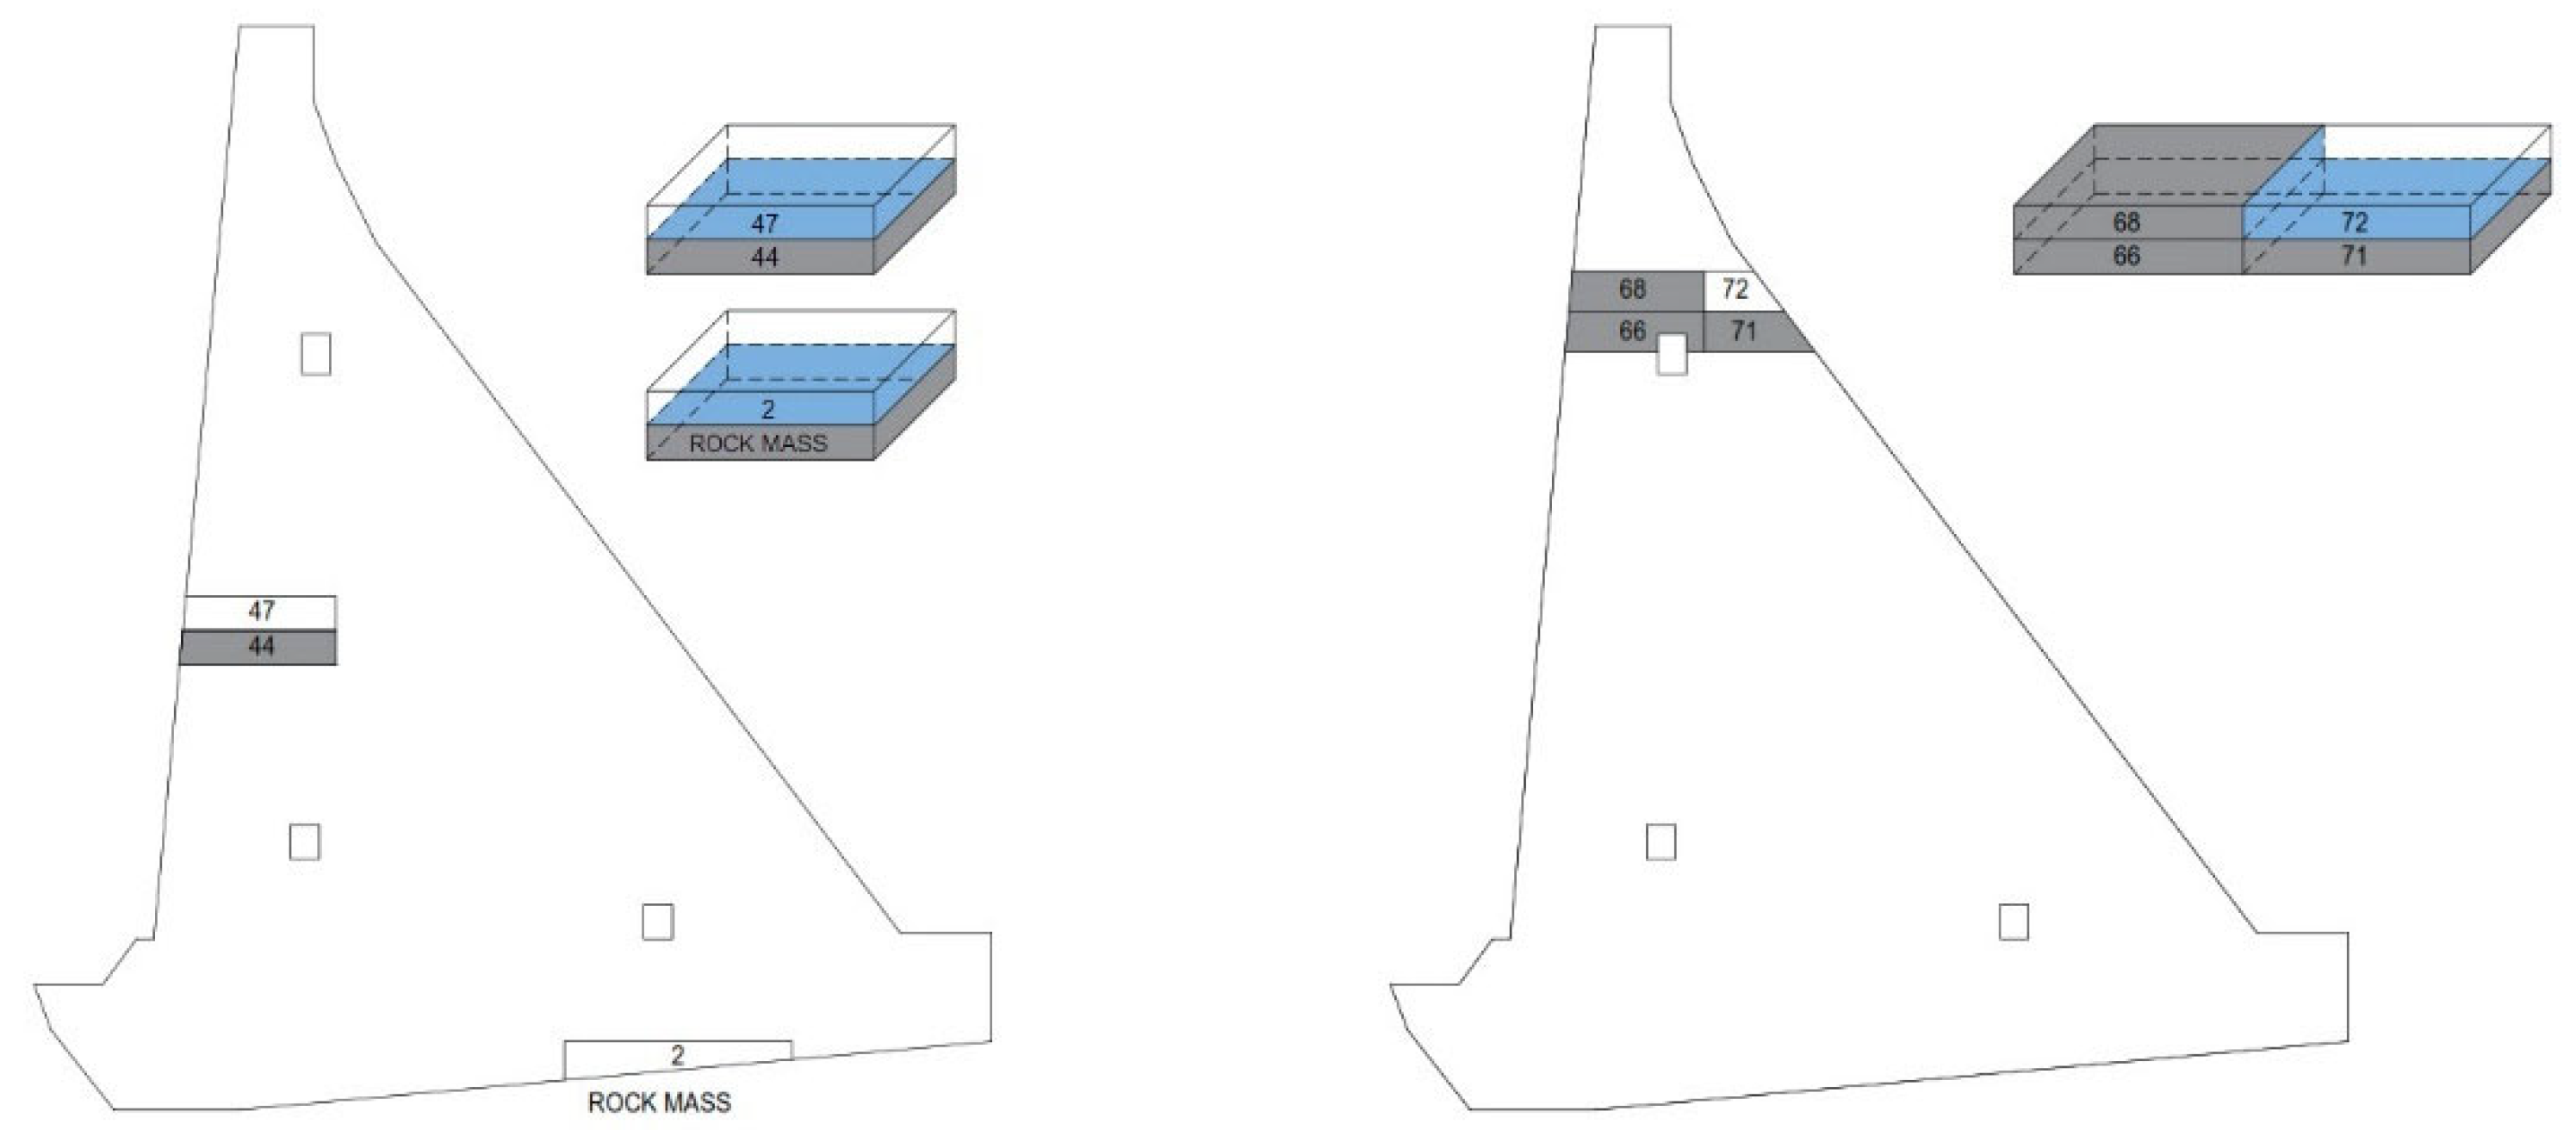
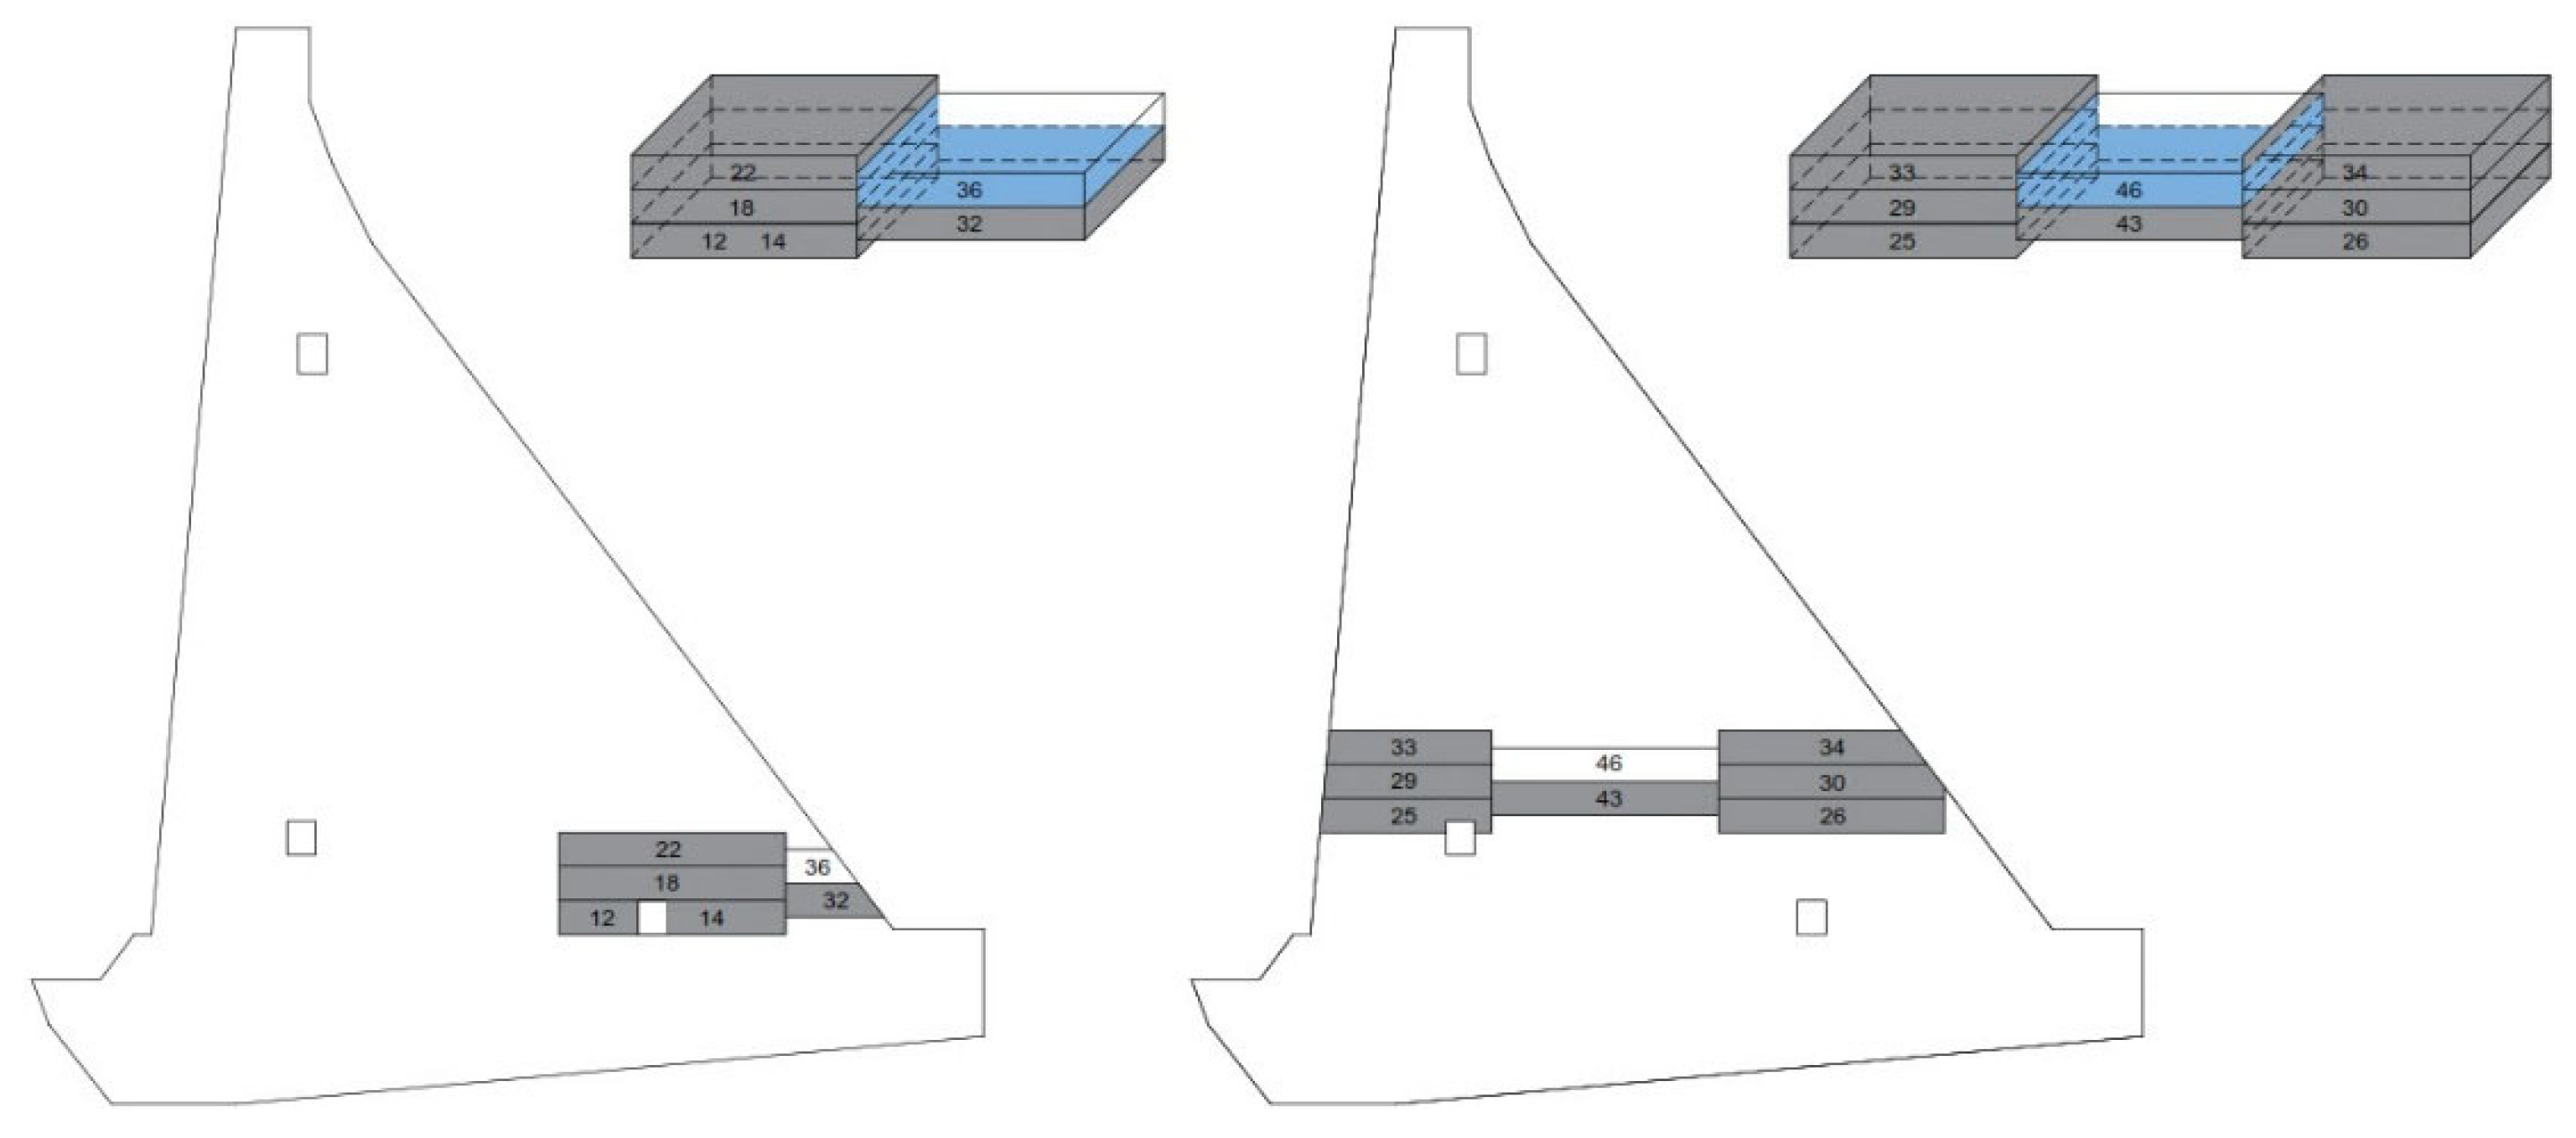
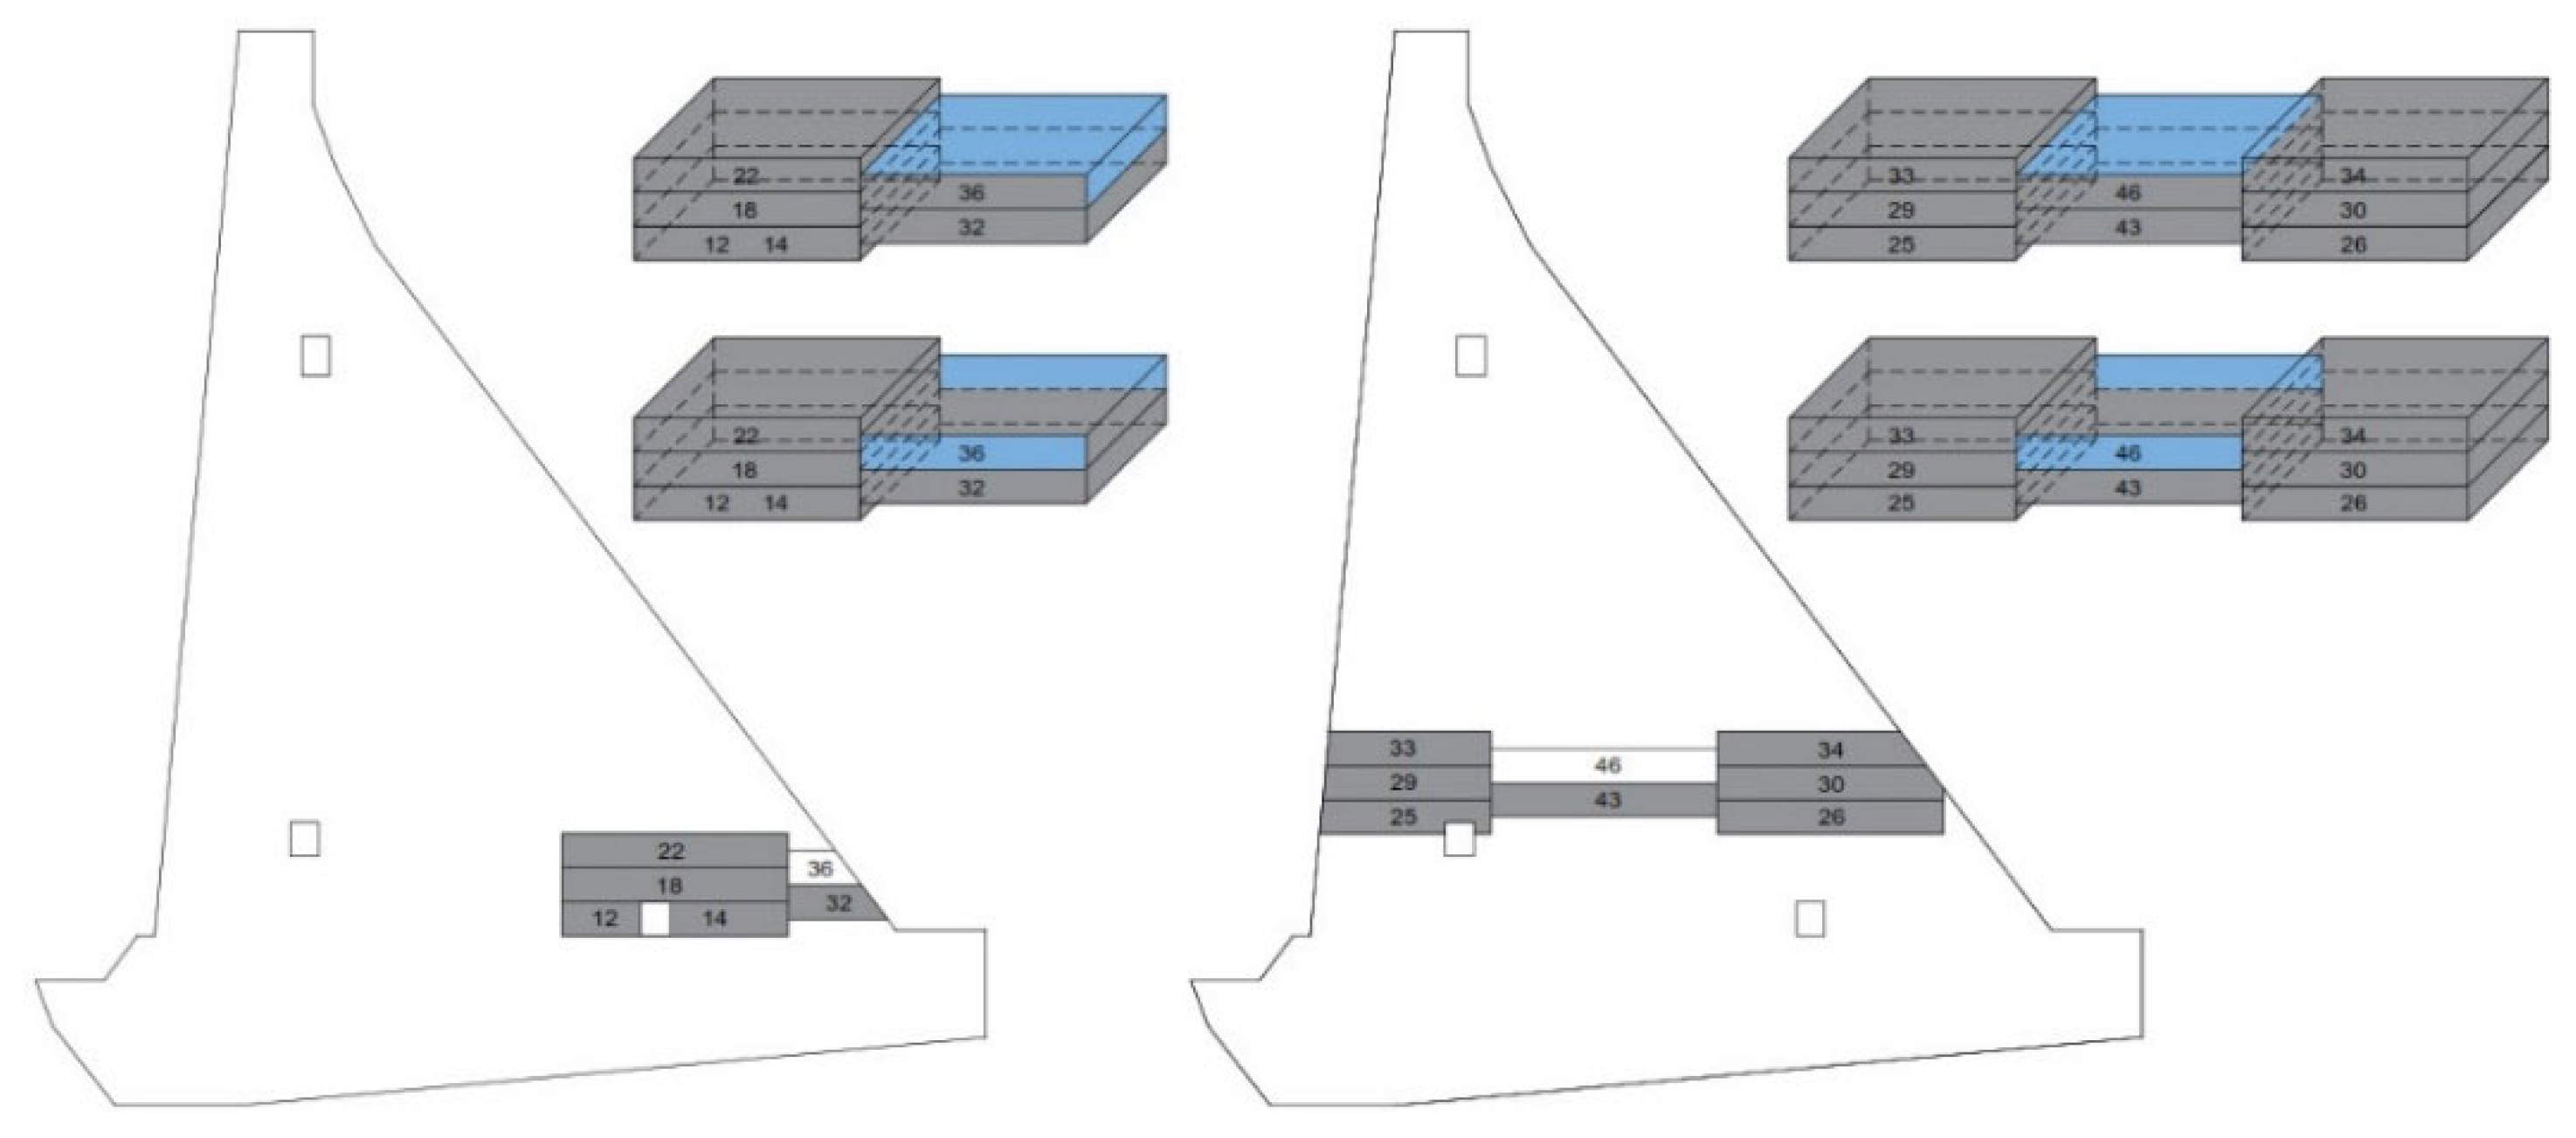
The concrete monolith was assigned a thermal boundary condition that allowed for free heat transfer between the blocks and the rock mass, as well as among all the adjacent blocks of the observed monolith at the points of contact surfaces (blue, Figure 4 and Figure 5).
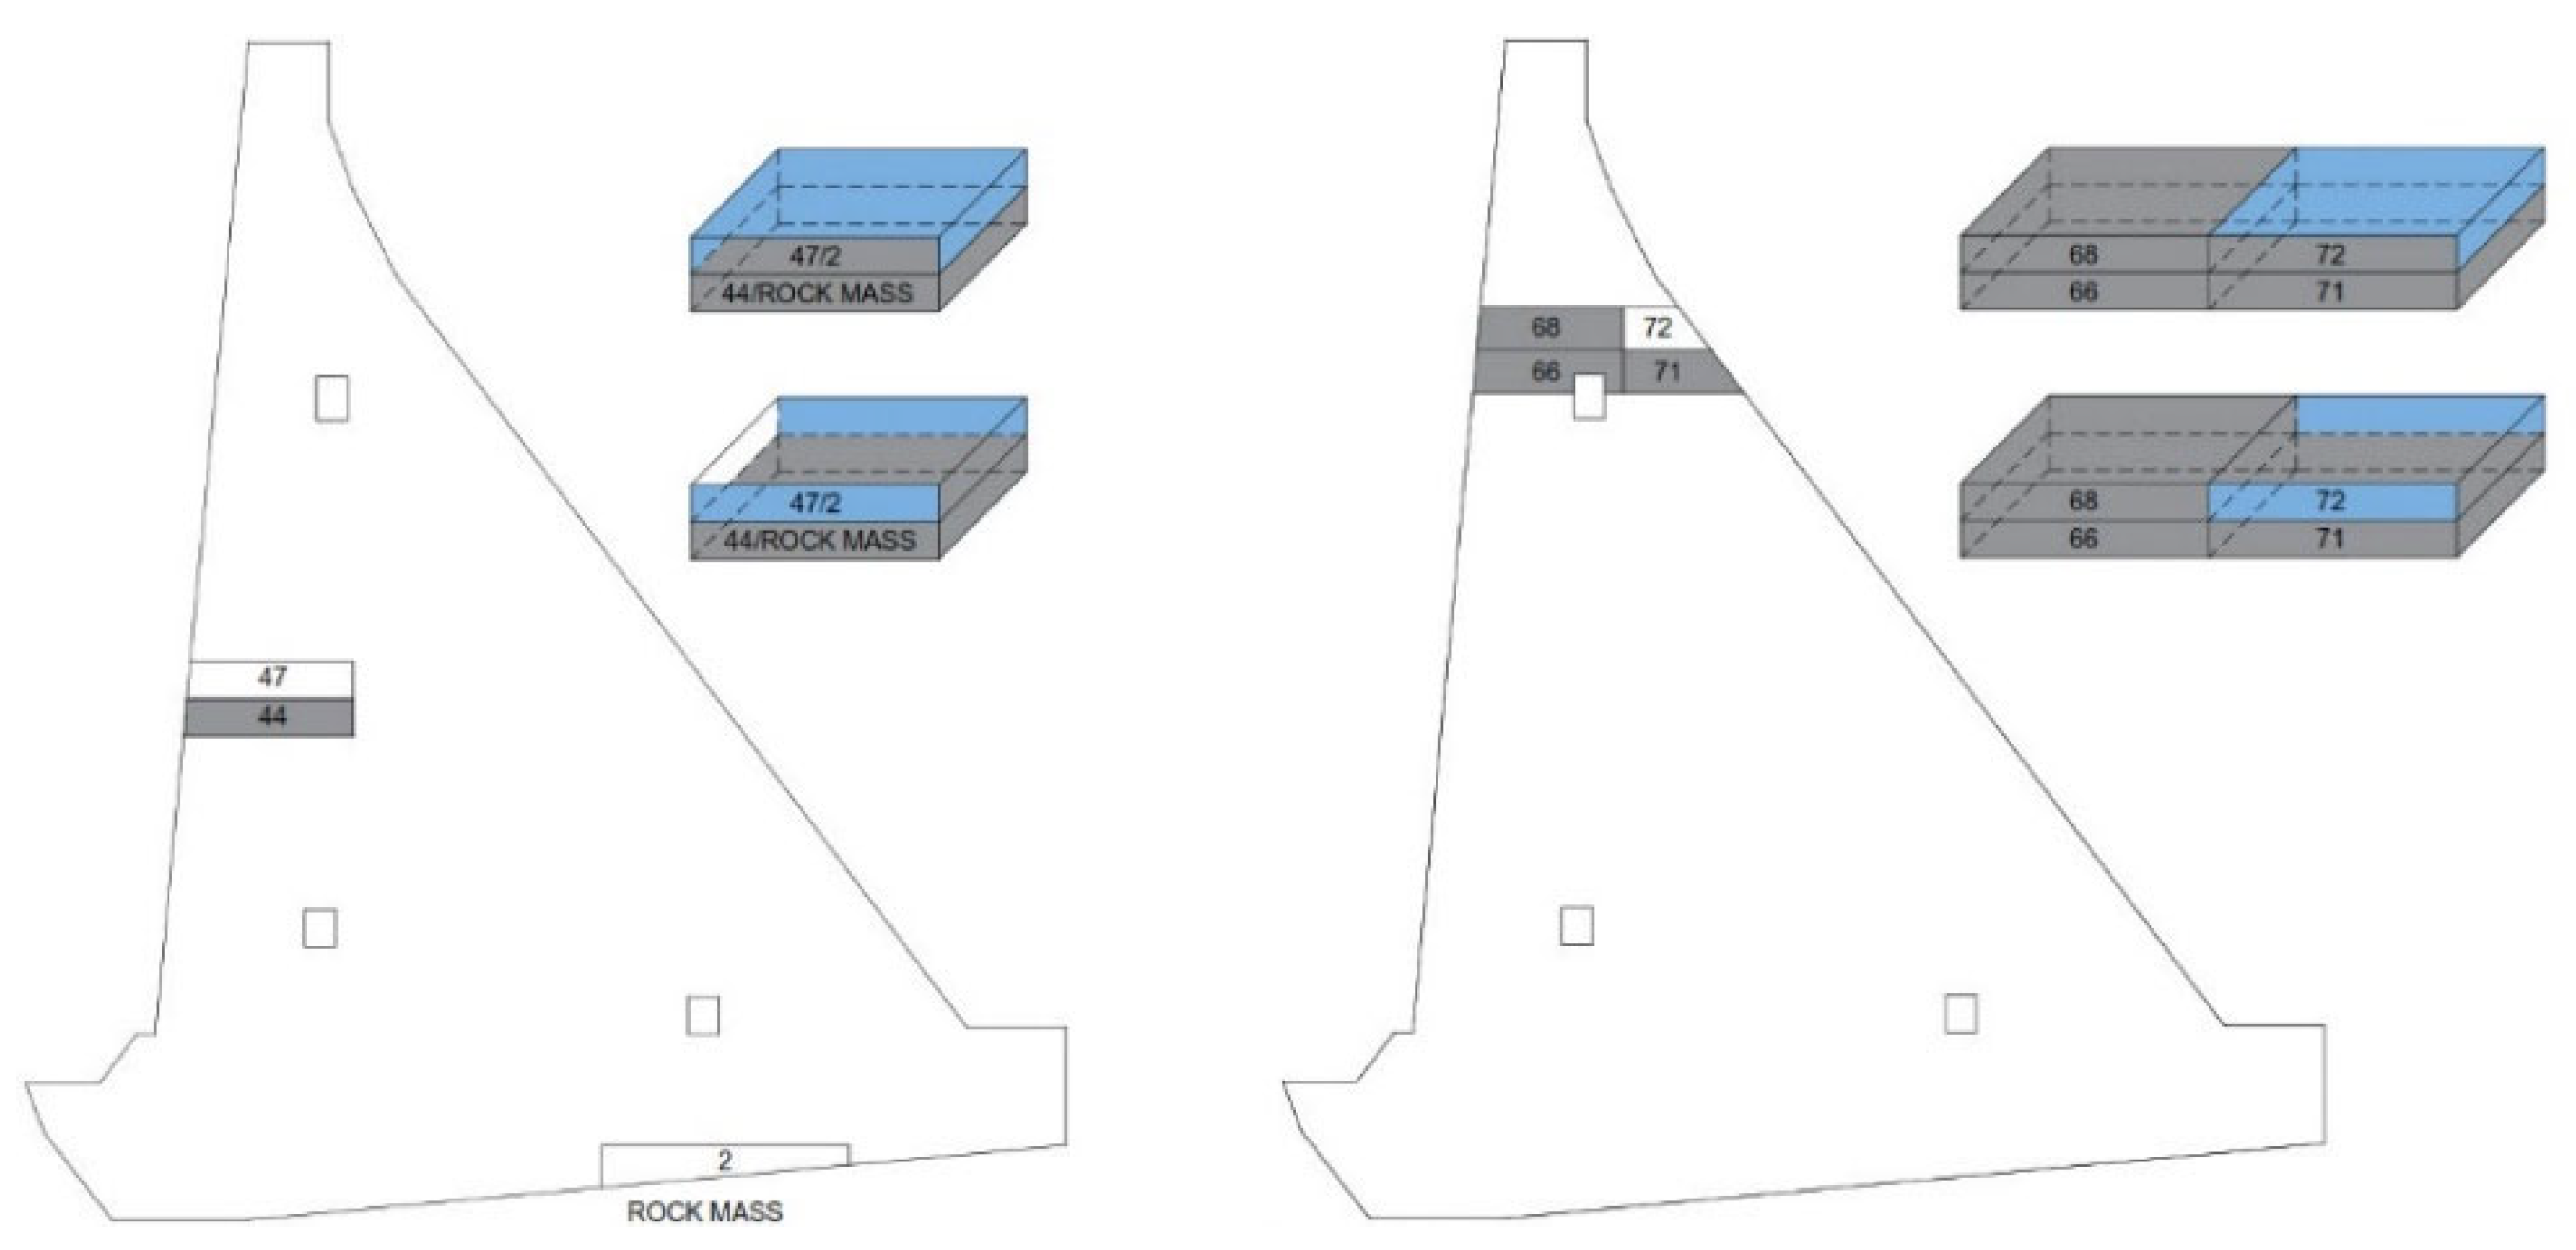
On the surfaces of the blocks that were in contact with air (blue; Figure 6 and Figure 7), the measured ambient temperatures were inserted (Table 4) [20,34].
At the same time, the temporal and spatial “shifted” concreting of the blocks of neighboring monoliths was taken into account, which ensured the proper cooling of the freshly cast block of the considered monolith from all sides [20].
For all the concrete surfaces in the galleries, the average monthly air temperatures are given in Table 5 [20,34].
The reservoir was filled to a level 225.0 m above sea level (ASL) in three steps. The water temperature is assumed to be constant in the amount of 9.0 °C throughout the entire depth [20,34].
The temperature of the surrounding rock mass was assumed to have a constant mean multiannual value of 13.0 °C [20].
The values of the input temperatures of the fresh concrete mixture for the analysis are given in Table 6 [20,34].
The analysis was conducted over a period of about 5 years, and it covered the construction, reservoir filling, and service life of the structure. The construction period covered the first 512 days. The period from construction completion to the beginning of reservoir filling lasted from day 512 to day 1080, while the period of reservoir filling and the service life period comprised the remaining analyzed time until day 1804 [20]. Additionally, two winter New Year’s breaks (with a duration of 12 days) as well as one summer break (with a duration of 135 days) were taken into account during construction. Construction began on 18 October of the first year.

4. Analysis Results

4.1. Verification of the Model

For the purposes of model verification, characteristic nodes (Figure 8) were selected that the authors regarded as the best-suited nodes to represent the development of the heat of hydration of the concrete and the influence of the boundary conditions used. In these nodes, the results of the temperature field over time for the considered monolith lengths were observed, as well as the temperature variations depending on the monolith lengths (Figure 9, Figure 10, Figure 11, Figure 12, Figure 13, Figure 14, Figure 15 and Figure 16).
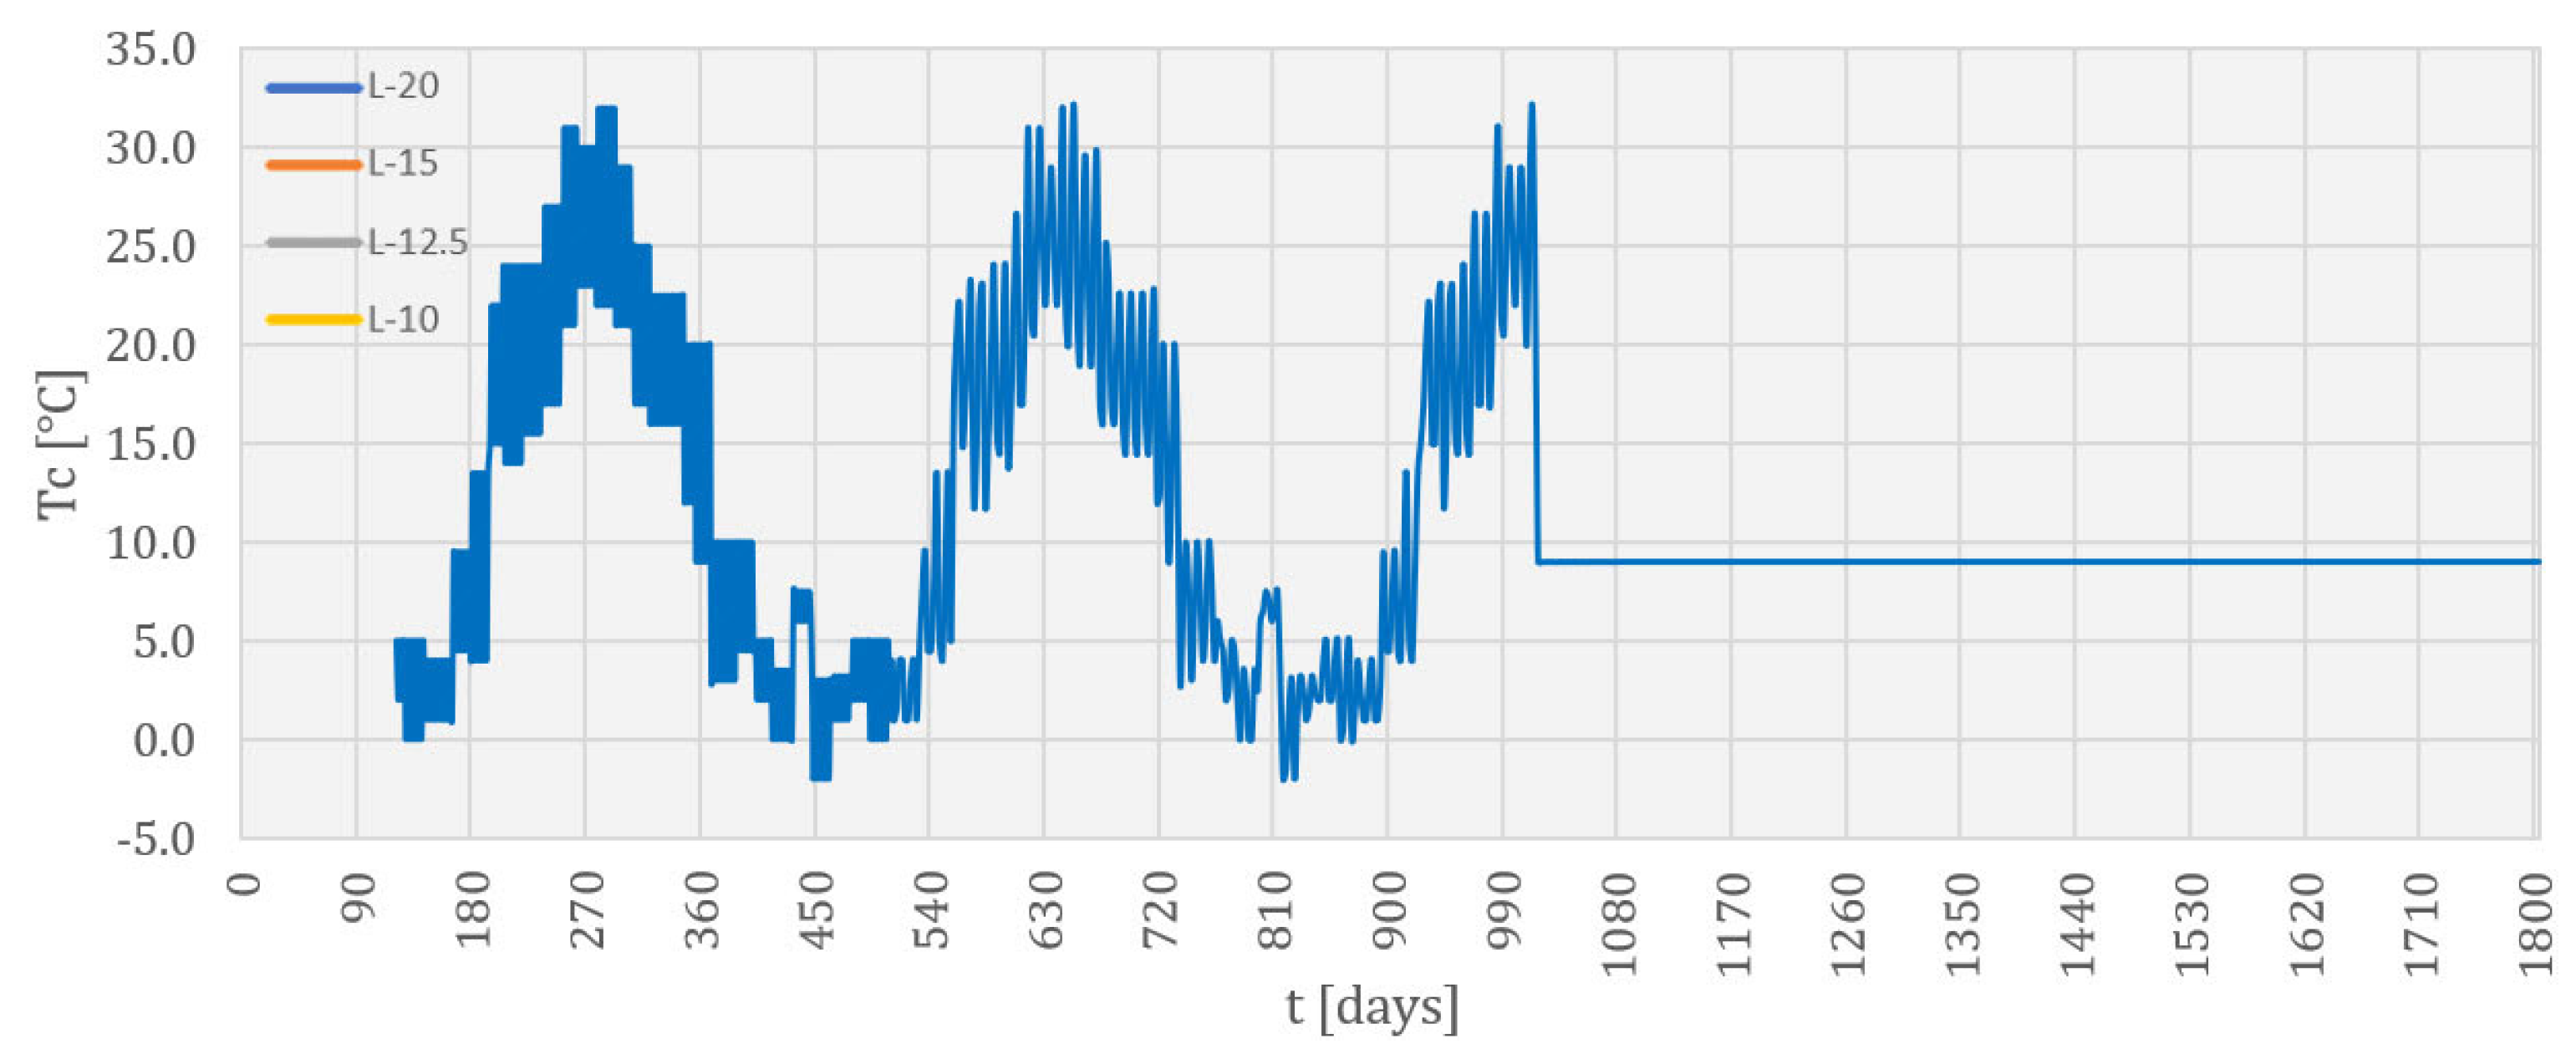
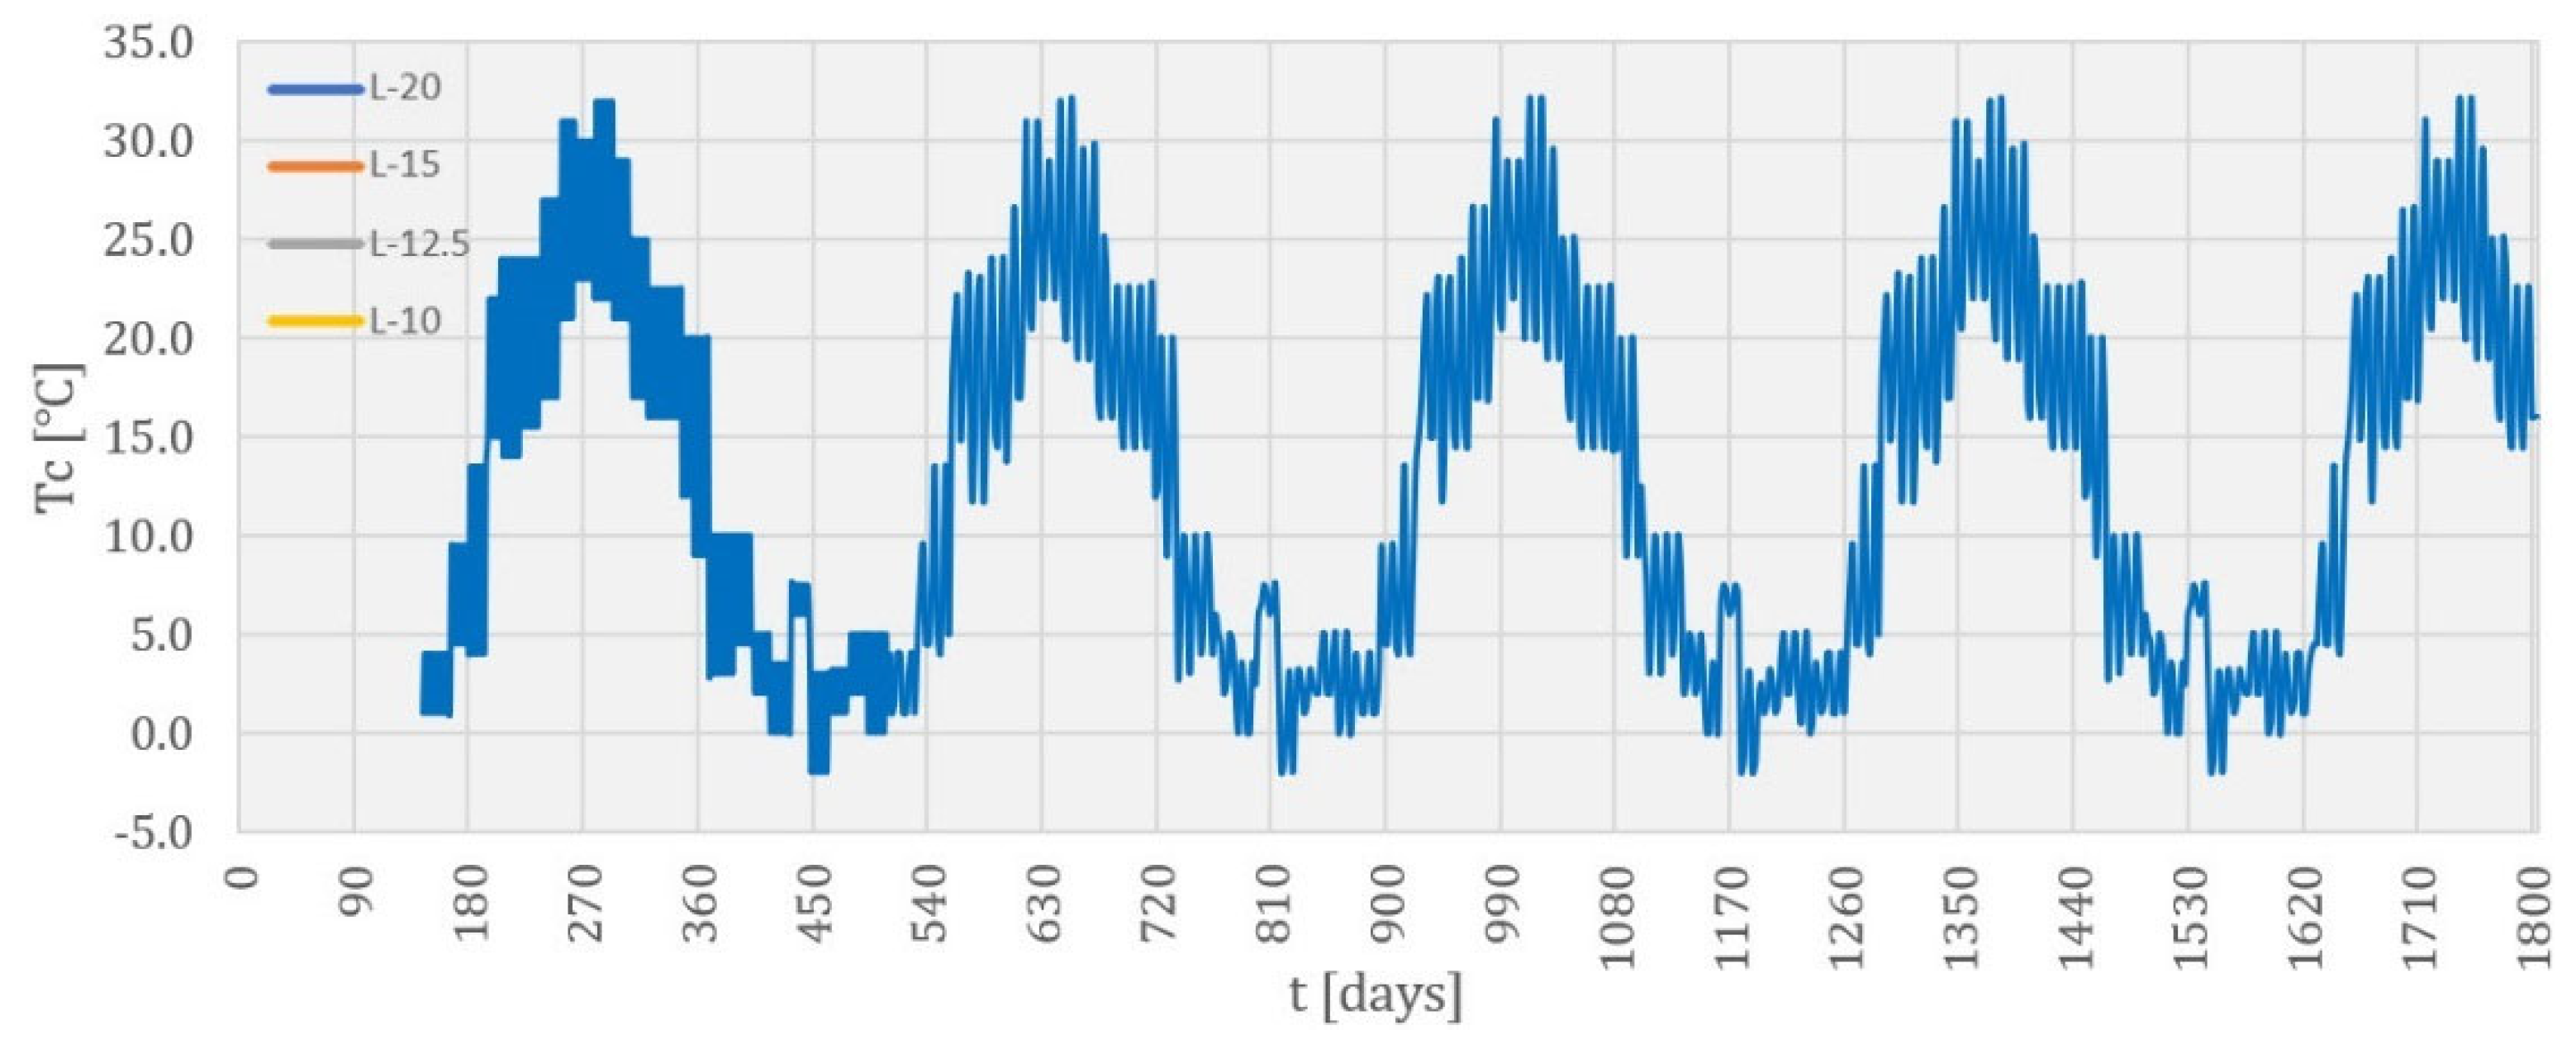
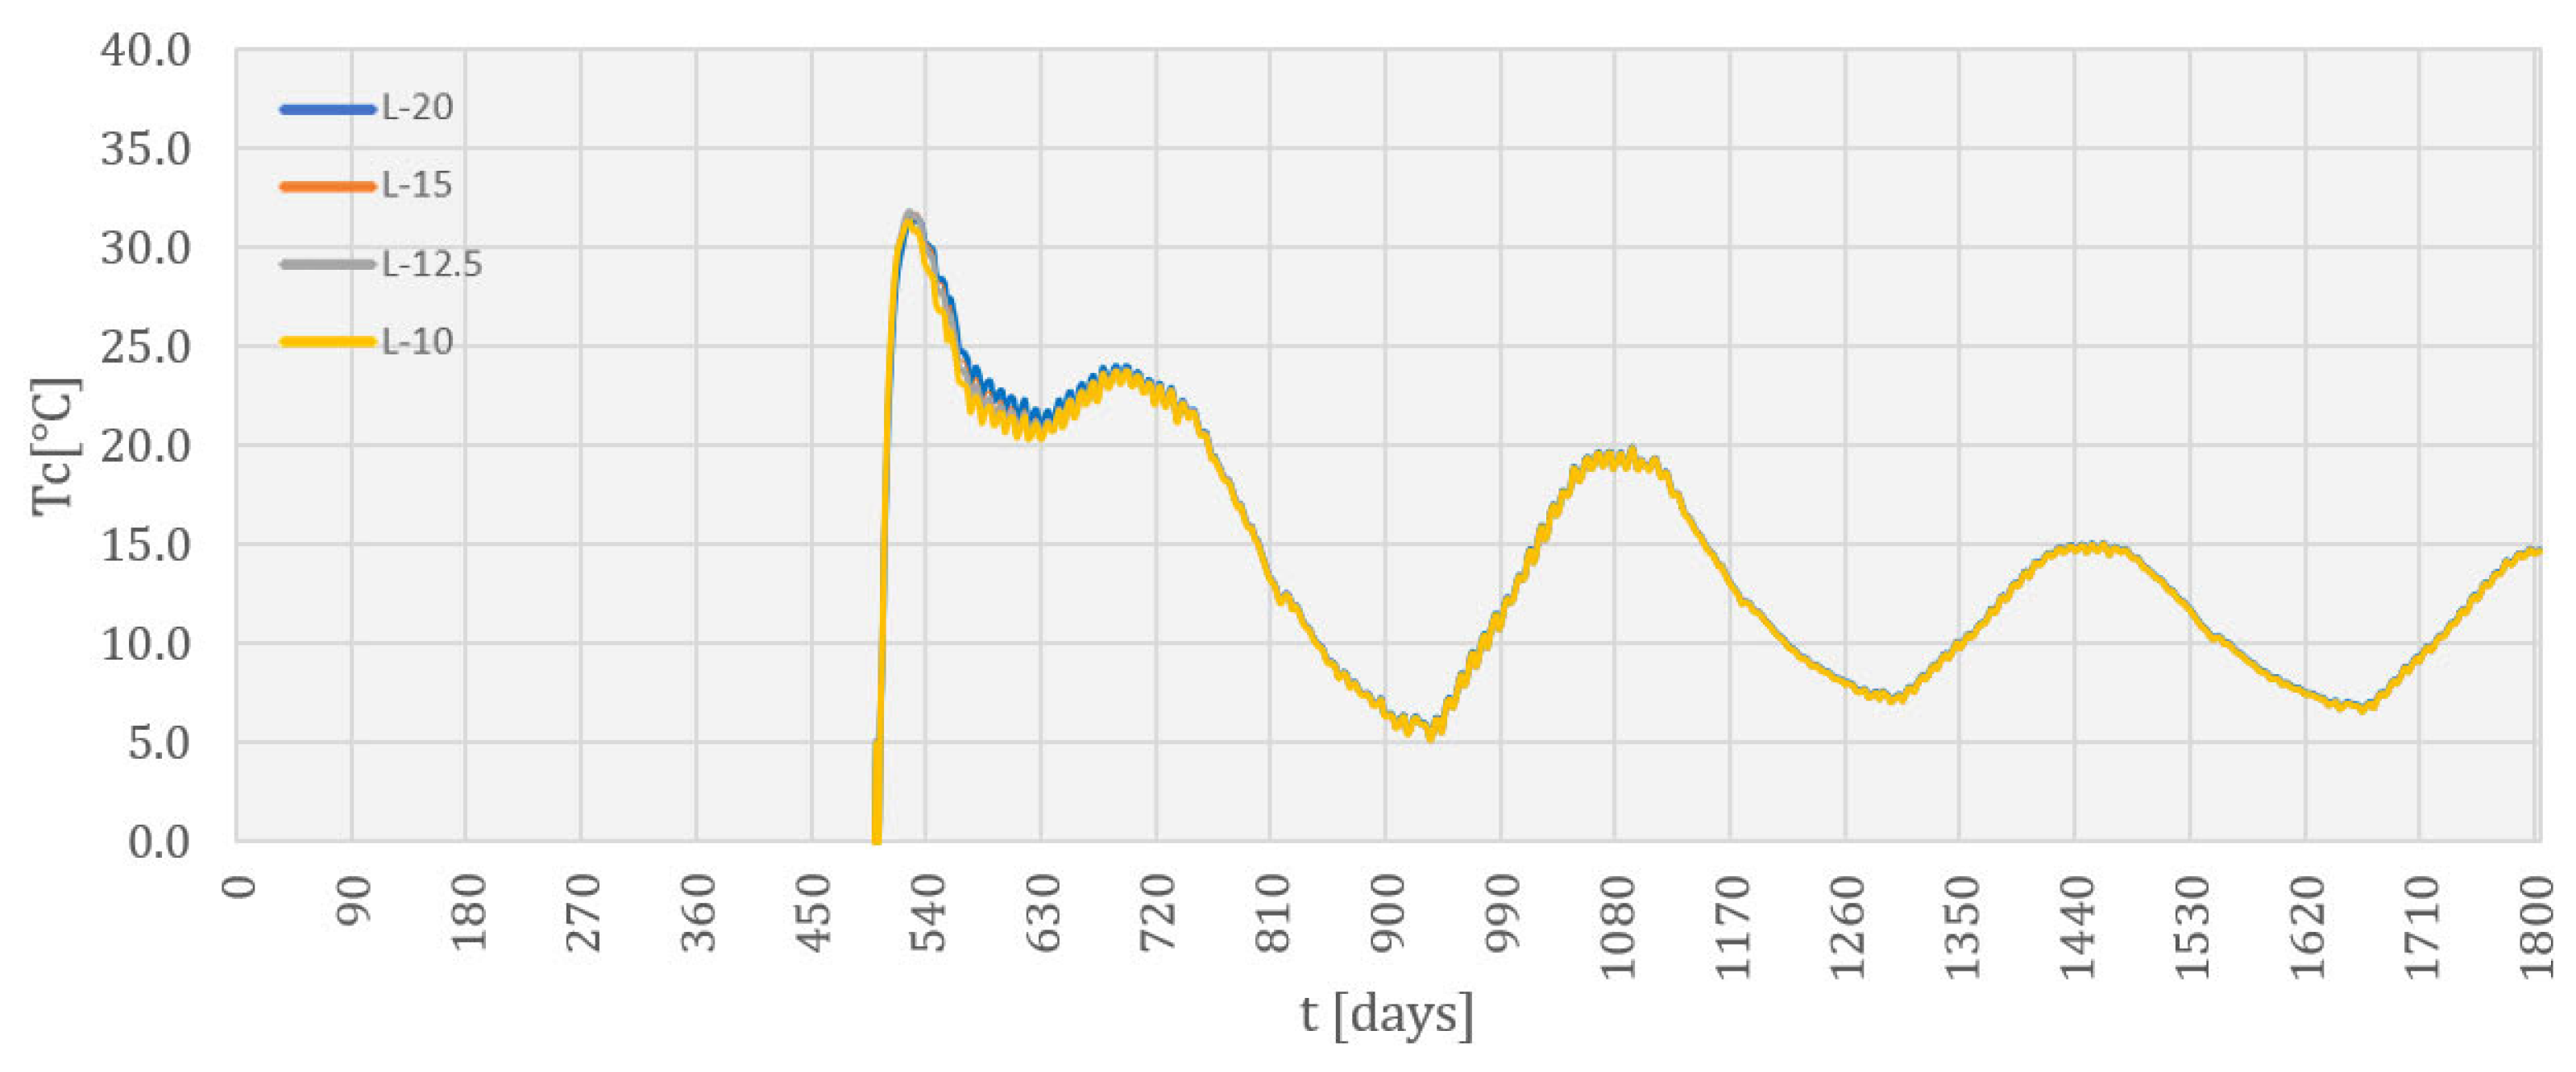
Figure 9 and Figure 10 show the concrete temperature as a function of the construction and service life duration for nodes on the upstream (node 2787) and downstream (node 2853) faces of the structure. In these figures, it is possible to see changes in the node temperatures during annual and daily oscillations. The node on the upstream face was in contact with water from the reservoir, so the diagram shows a sudden change in temperature after the water level reached the z coordinate of this node. The displayed temperatures were the same for all the considered monolith lengths, so the diagrams of these temperatures overlap.
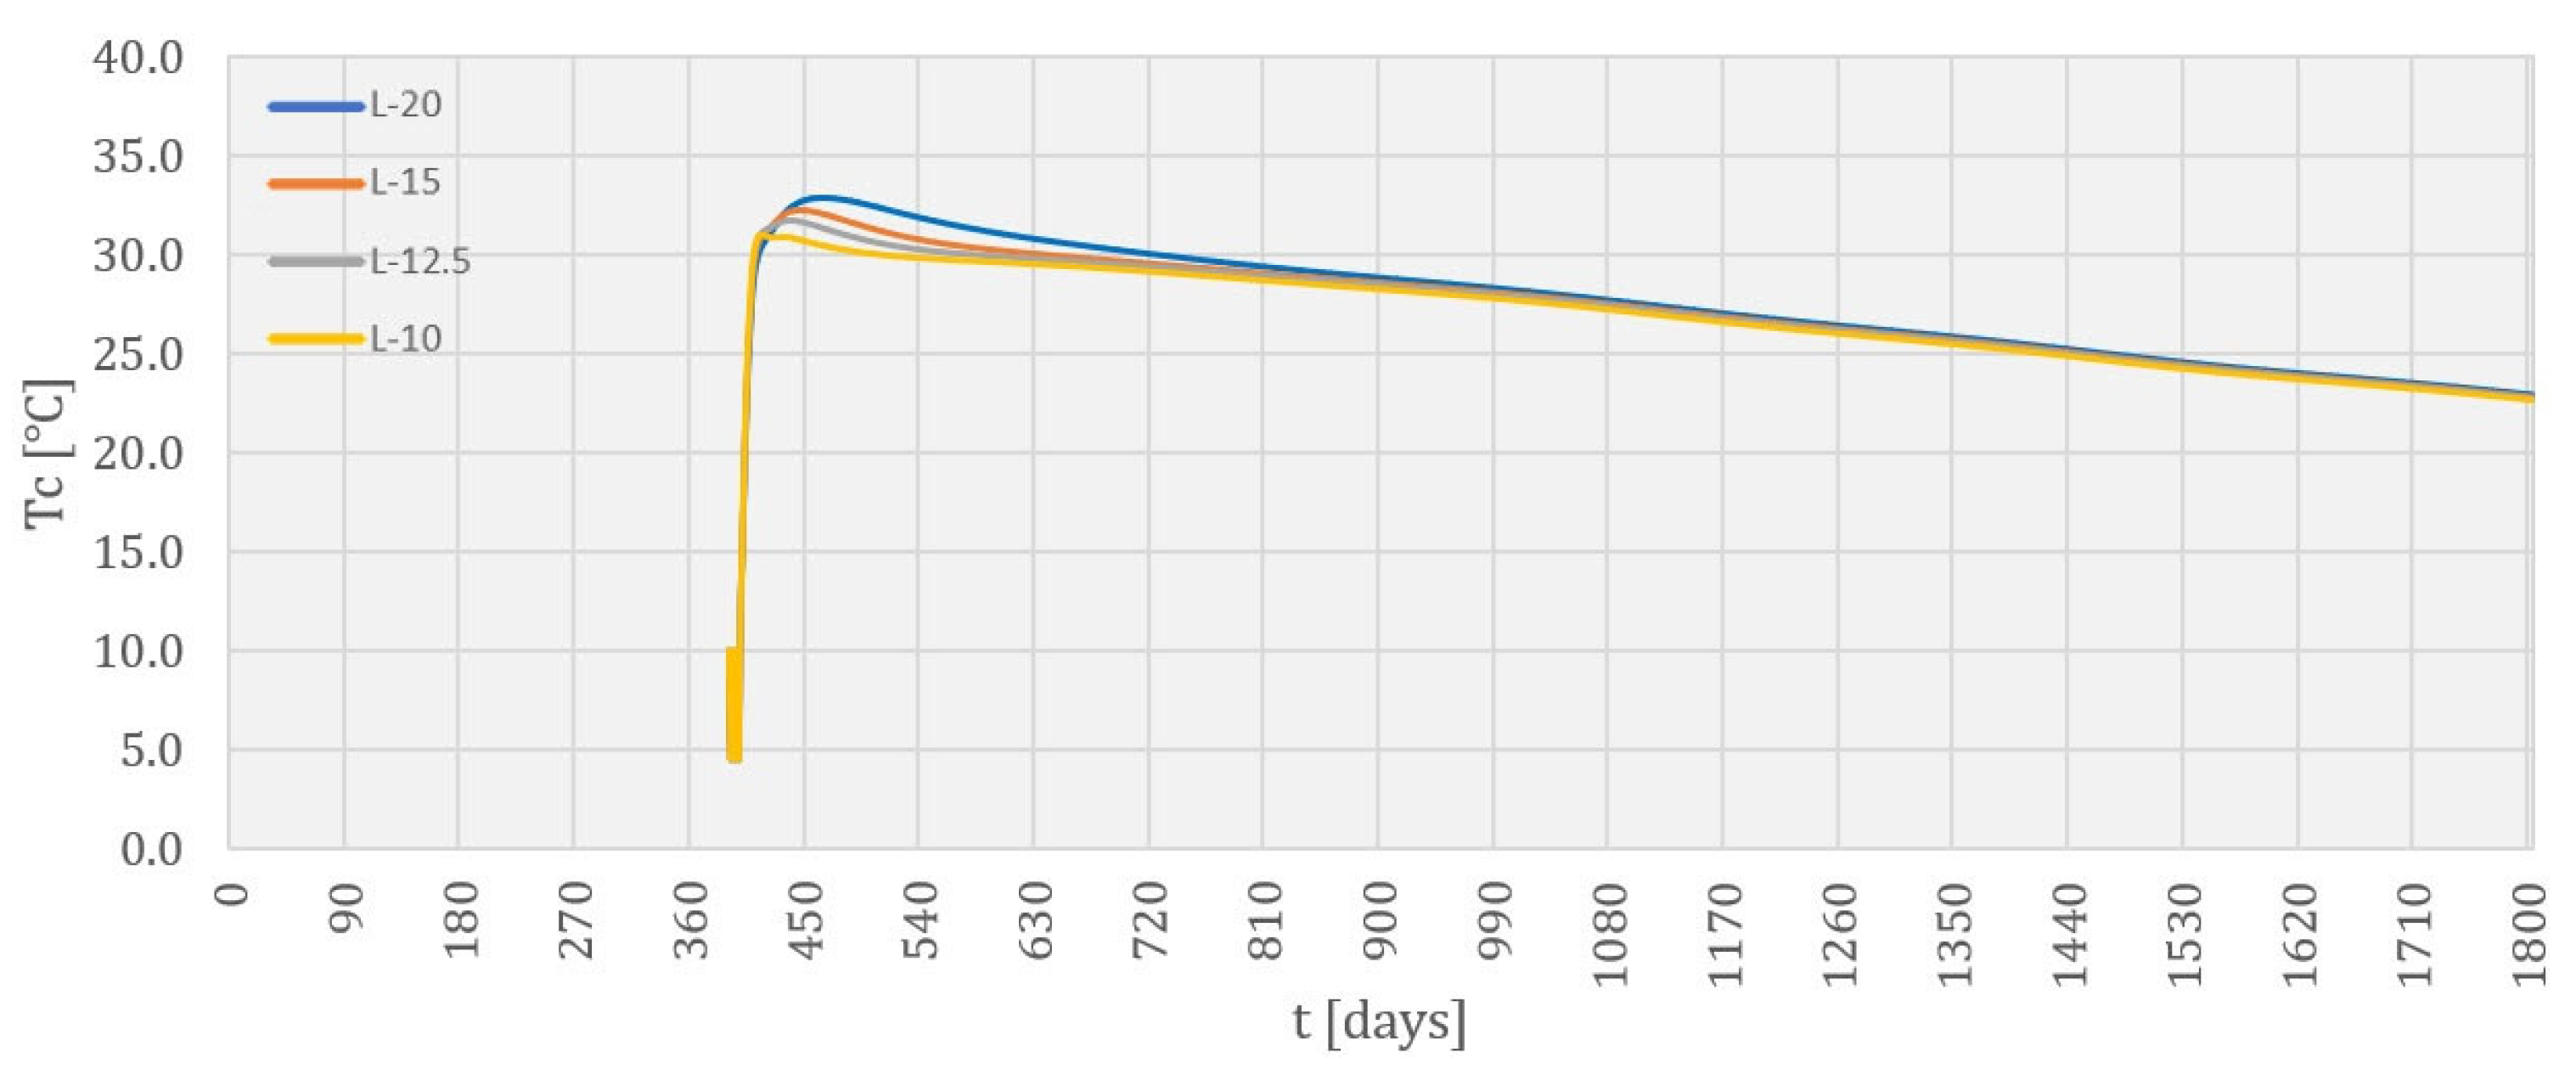
The concrete temperatures in node 2938 (Figure 11), located in the monolith’s central zone, as well as the concrete temperatures in node 3016 (Figure 13), located above the monolith’s central zone, but closer to the downstream face, showed a sudden increase due to the release of heat from cement hydration. After reaching the maximum value, the concrete-cooling process was evident.
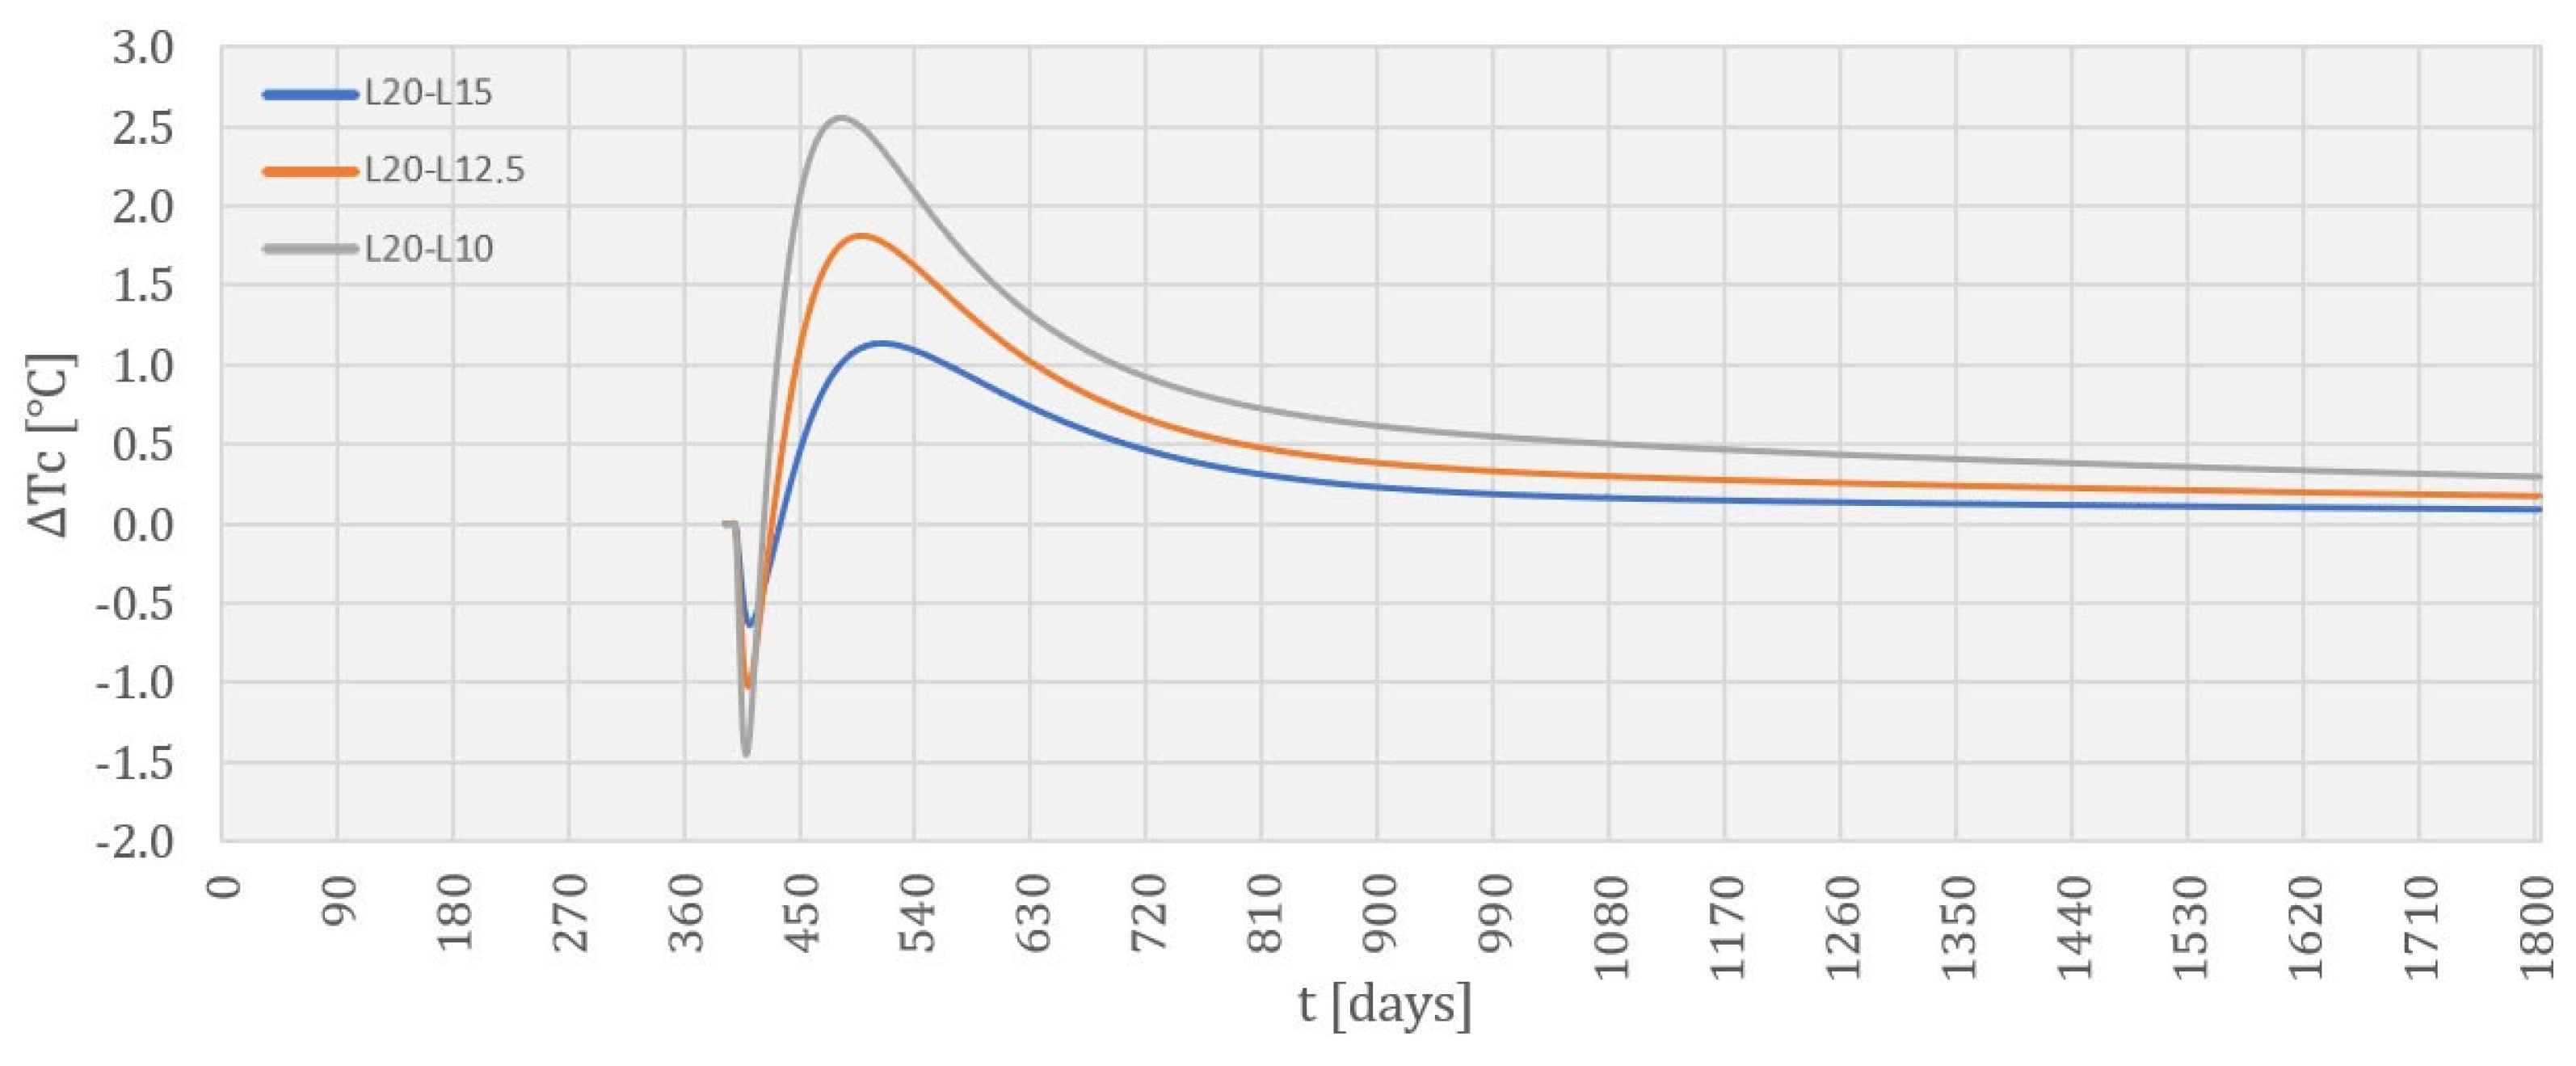
The concrete temperature at node 2938 reached the following maximum values, depending on the considered monolith length: 32.9 °C (L-20), 32.3 °C (L-15), 31.7 °C (L-12.5), and 31.0 °C (L-10). The maximum values of the concrete temperatures occurred at different times, depending on the considered monolith length: after 74 days (L-20), after 55 days (L-15), after 48 days (L-12.5), and after 25 days (L-10). In the final analysis step, the concrete temperatures had the following values: 22.9 °C (L-20), 22.9 °C (L-15), 22.8 °C (L-12.5), and 22.6 °C (L-10). Figure 12 shows the changes in the calculated temperatures in node 2938 that occurred with a monolith length change, and in relation to the temperature values obtained in the thermal analysis for a monolith length of 20.0 m. It can be seen that the most extreme values of temperature changes in node 2938 were as follows: 1.1 °C for a reduction of 5.0 m, 1.8 °C for a reduction of 7.50 m, and 2.6 °C for a reduction of 10.0 m.
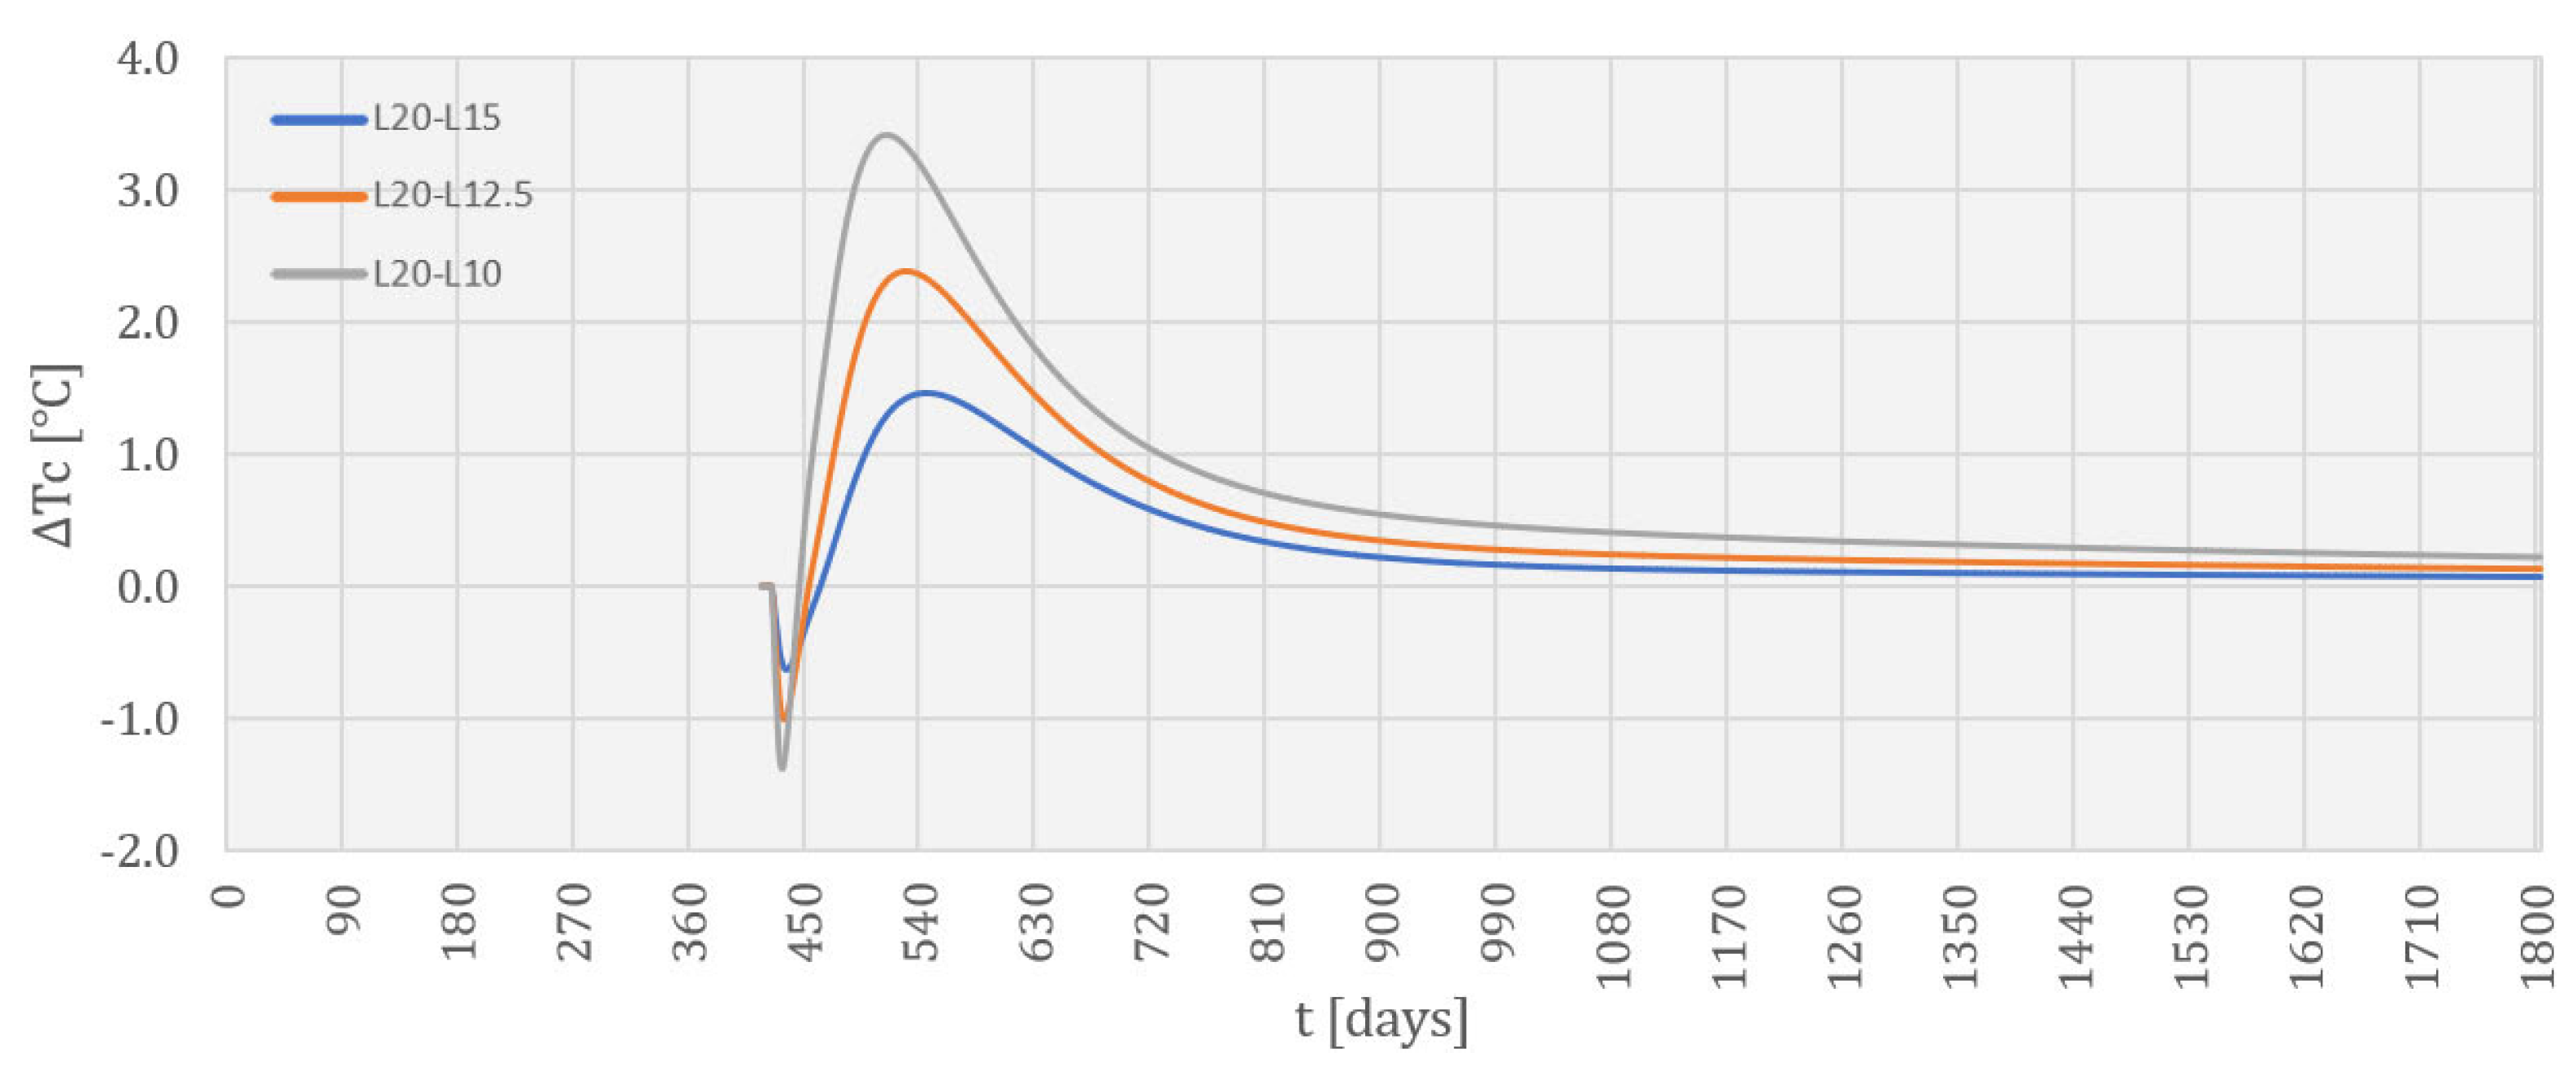
The concrete temperature in node 3016, located above the monolith’s central zone, closer to the downstream face, reached the following maximum values, depending on the considered monolith length: 35.1 °C (L-20), 34.3 °C (L-15), 33.5 °C (L-12.5), and 32.3 °C (L-10). As in the case of node 2938, the maximum values of the concrete temperatures occurred at different times, depending on the considered monolith length: after 83 days (L-20), after 66 days (L-15), after 60 days (L-12.5), and after 56 days (L-10). In the final analysis step, the concrete temperatures had the following values: 19.8 °C (L-20), 19.7 °C (L-15), 19.7 °C (L-12.5), and 19.6 °C (L-10). Figure 14 shows the changes in the calculated temperatures in node 3016 that occurred with a monolith length change, and in relation to the temperature values obtained in the thermal analysis for the monolith length of 20.0 m. It can be seen that the most extreme values of temperature changes in this node were as follows: 1.5 °C for a reduction of 5.0 m, 2.4 °C for a reduction of 7.50 m, and 3.4 °C for a reduction of 10.0 m.
The concrete temperatures in node 3184, which was located in the zone of the dam’s crest, indicated a significant influence of seasonal changes on the air temperature. It can also be seen that the concrete temperatures in the node were closer to the average annual air temperature.
The concrete temperature at node 3184 reached the following maximum values, depending on the considered monolith length: 31.5 °C (L-20), 31.8 °C (L-15), 31.8 °C (L-12.5), and 31.3 °C (L-10). The maximum values of the concrete temperatures occurred at different times, depending on the considered monolith length: after 32 days (L-20), after 27 days (L-15 and L-12.5), and after 25 days (L-10). In the final analysis step, the concrete temperatures had a value of 14.7 °C for all the considered monolith lengths. Figure 16 shows the changes in the calculated temperatures of node 3184 that occurred with a change in the monolith length, and in relation to the temperature values obtained in the thermal analysis for a monolith length of 20.0 m. It can be seen that the most extreme values of temperature changes in this node were as follows: 0.5 °C for a reduction of 5.0 m, 0.9 °C for a reduction of 7.50 m, and 1.6 °C for a reduction of 10.0 m.
Many empirical formulae have been developed to obtain the temperature variations in concrete dams. One such equation, which was developed for thick concrete sections and assumes a sinusoidal representation for the air temperature, is given in [23].
In the control nodes 3016 and 3184, where the influence of the ambient temperature penetration can be seen in the previously shown images, verification of the amplitude of the concrete temperature oscillations was carried out using the aforementioned calculation method proposed in [4,23], which was suitable for this dam.
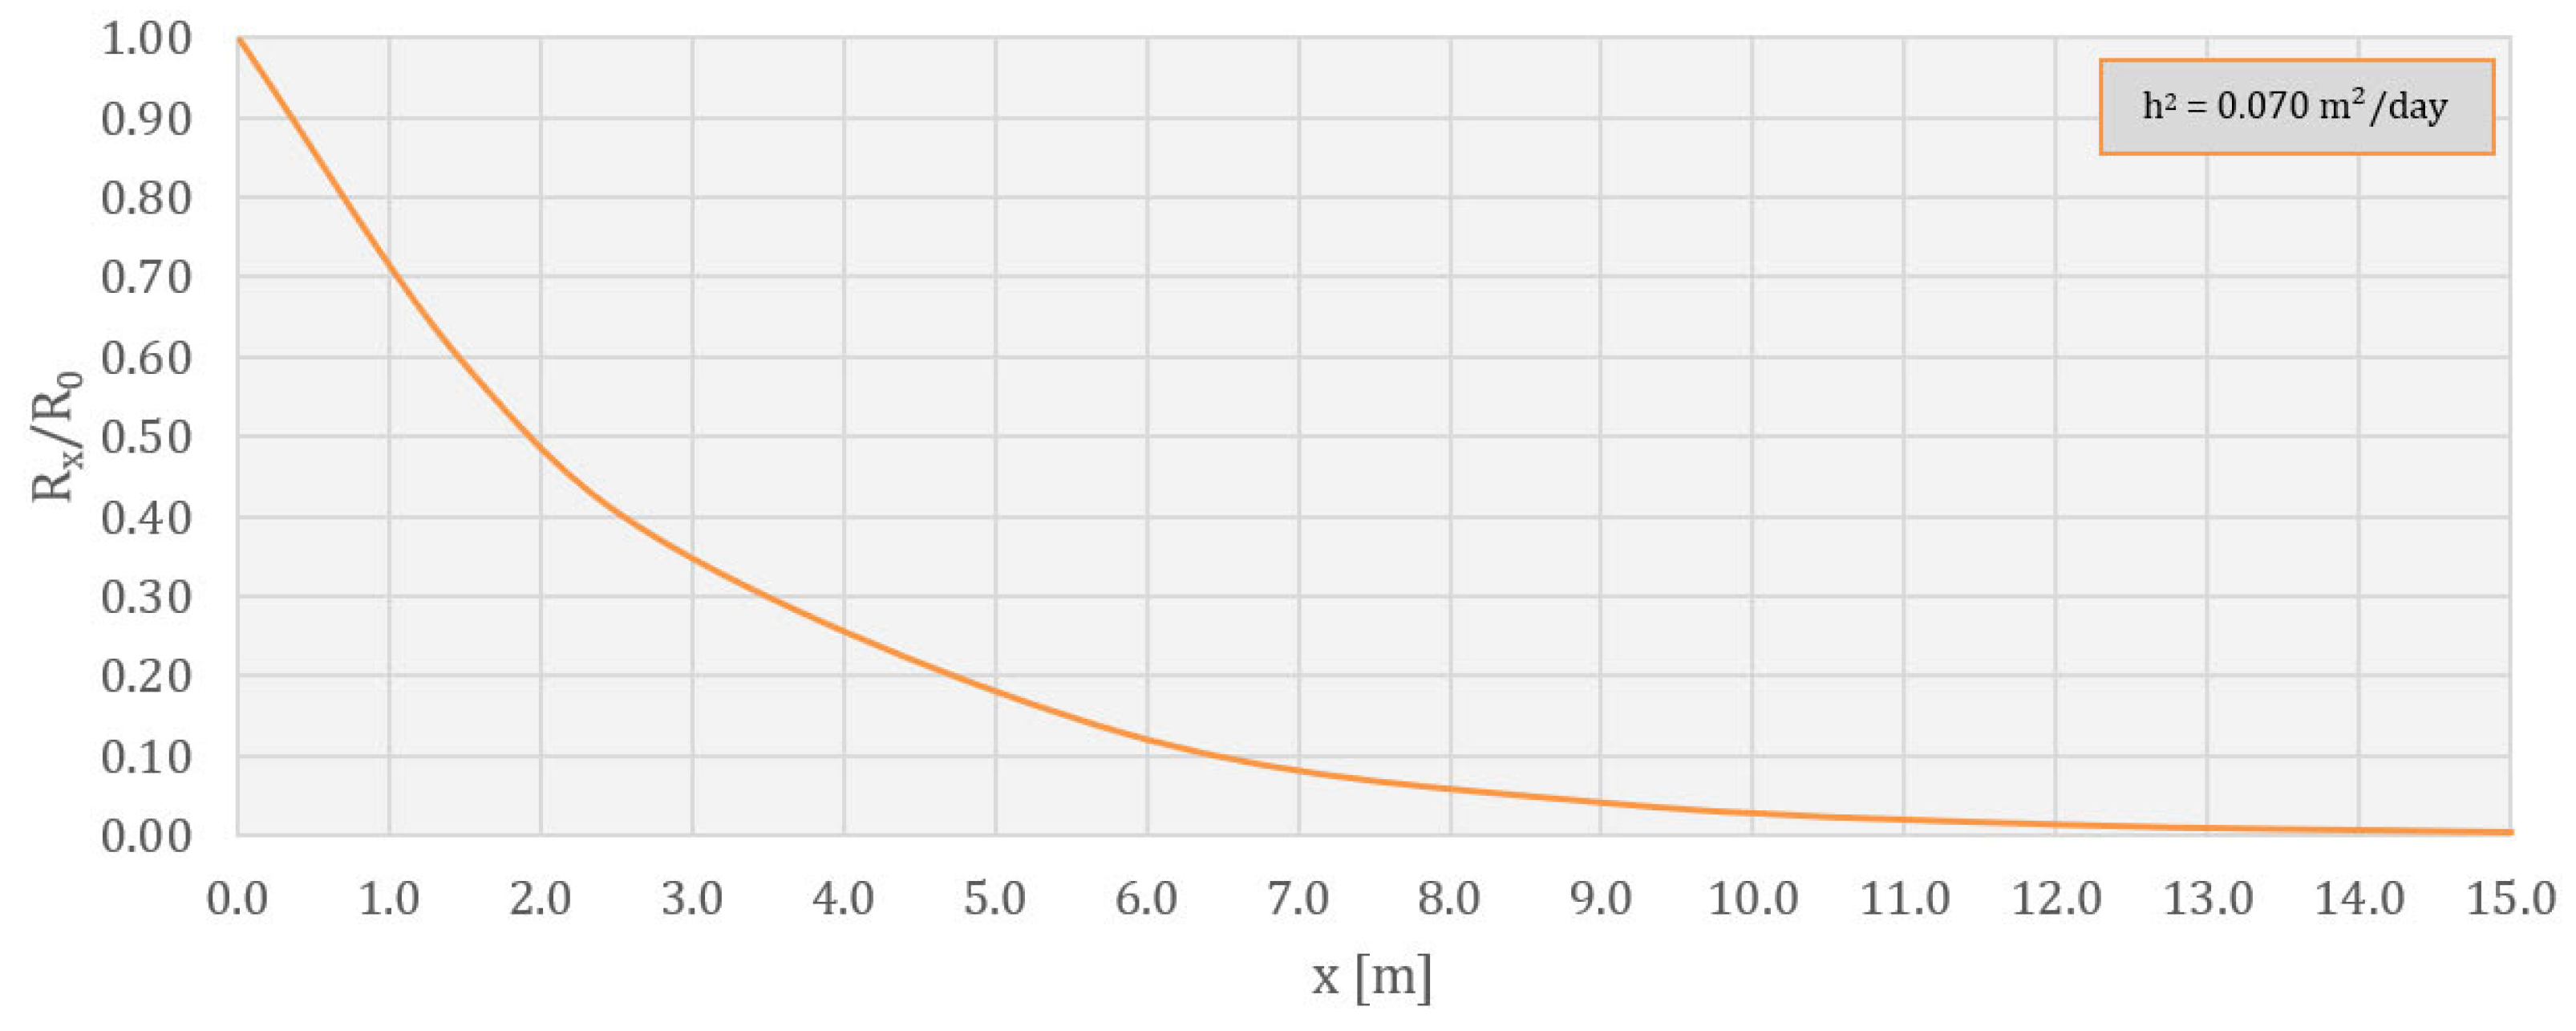
R x R 0 = exp x · π h 2 · θ ,  
where:
h 2 = k c · ρ ,  
where:
  • R x is the value of the concrete temperature oscillation amplitude at the selected point inside the structure [°C];
  • R 0 is the value of the concrete temperature oscillation amplitude at a point on the surface of the structure [°C];
  • x is the distance of the observed point from the outer surface of the concrete structure [m];
  • h 2 is the diffusivity of the concrete [m2/day];
  • θ is the air temperature oscillation period (365 days);
  • k is the thermal conductivity coefficient [J/day m K];
  • c is the specific heat capacity of the concrete [J/kg/K];
  • ρ is the concrete density [kg/m3].
The verification was carried out for the last 12 months of the service life of the structure for node 3016 and for the last 16 months of the service life of the structure for node 3184, because, over the specified period, the concrete inside the structure was in the cooling process, was not influenced by the hydration process, and was in the zone of influence of the ambient temperature.
The value of the analytical oscillation amplitude for node 3016 (which was 11.25 m from the nearest outer surface) was 0.38 °C, while the value of the amplitude obtained by the model was 0.41 °C.
Also, the value of the analytical oscillation amplitude for node 3184 (which was 3.80 m from the nearest outer surface) was 5.29 °C, while the value obtained by the model was 4.43 °C.
When calculating the analytical amplitude values, R 0 was adopted as 20.18 °C (based on the presented temperature values on the structure’s surface).
A diagram of the dependence of the amplitude ratio on the node distance from the external surface of the analyzed CGD is presented in Figure 17.
  • Based on the results presented for the control nodes and the performed verification, it can be concluded that the numerical model simulated the thermal behavior of the analyzed CGD well.
  • The results of the temperature field calculation in the dam’s body are presented in selected characteristic time sections. As the rock mass was not the subject of this work, this part of the model has been omitted from the following results. The selected characteristic time sections were as follows: the 84th day (10 January of the second year), the 283rd day (27 July of the second year), the 512th day (13 March of the third year), the 1080th day (2 October of the fourth year), the 1505th day (1 December of the fifth year), and the 1804th day (25 September of the sixth year). The first three sections show the period of construction, while the remaining three show the period of the service life.

4.2. Temperature Field during Construction

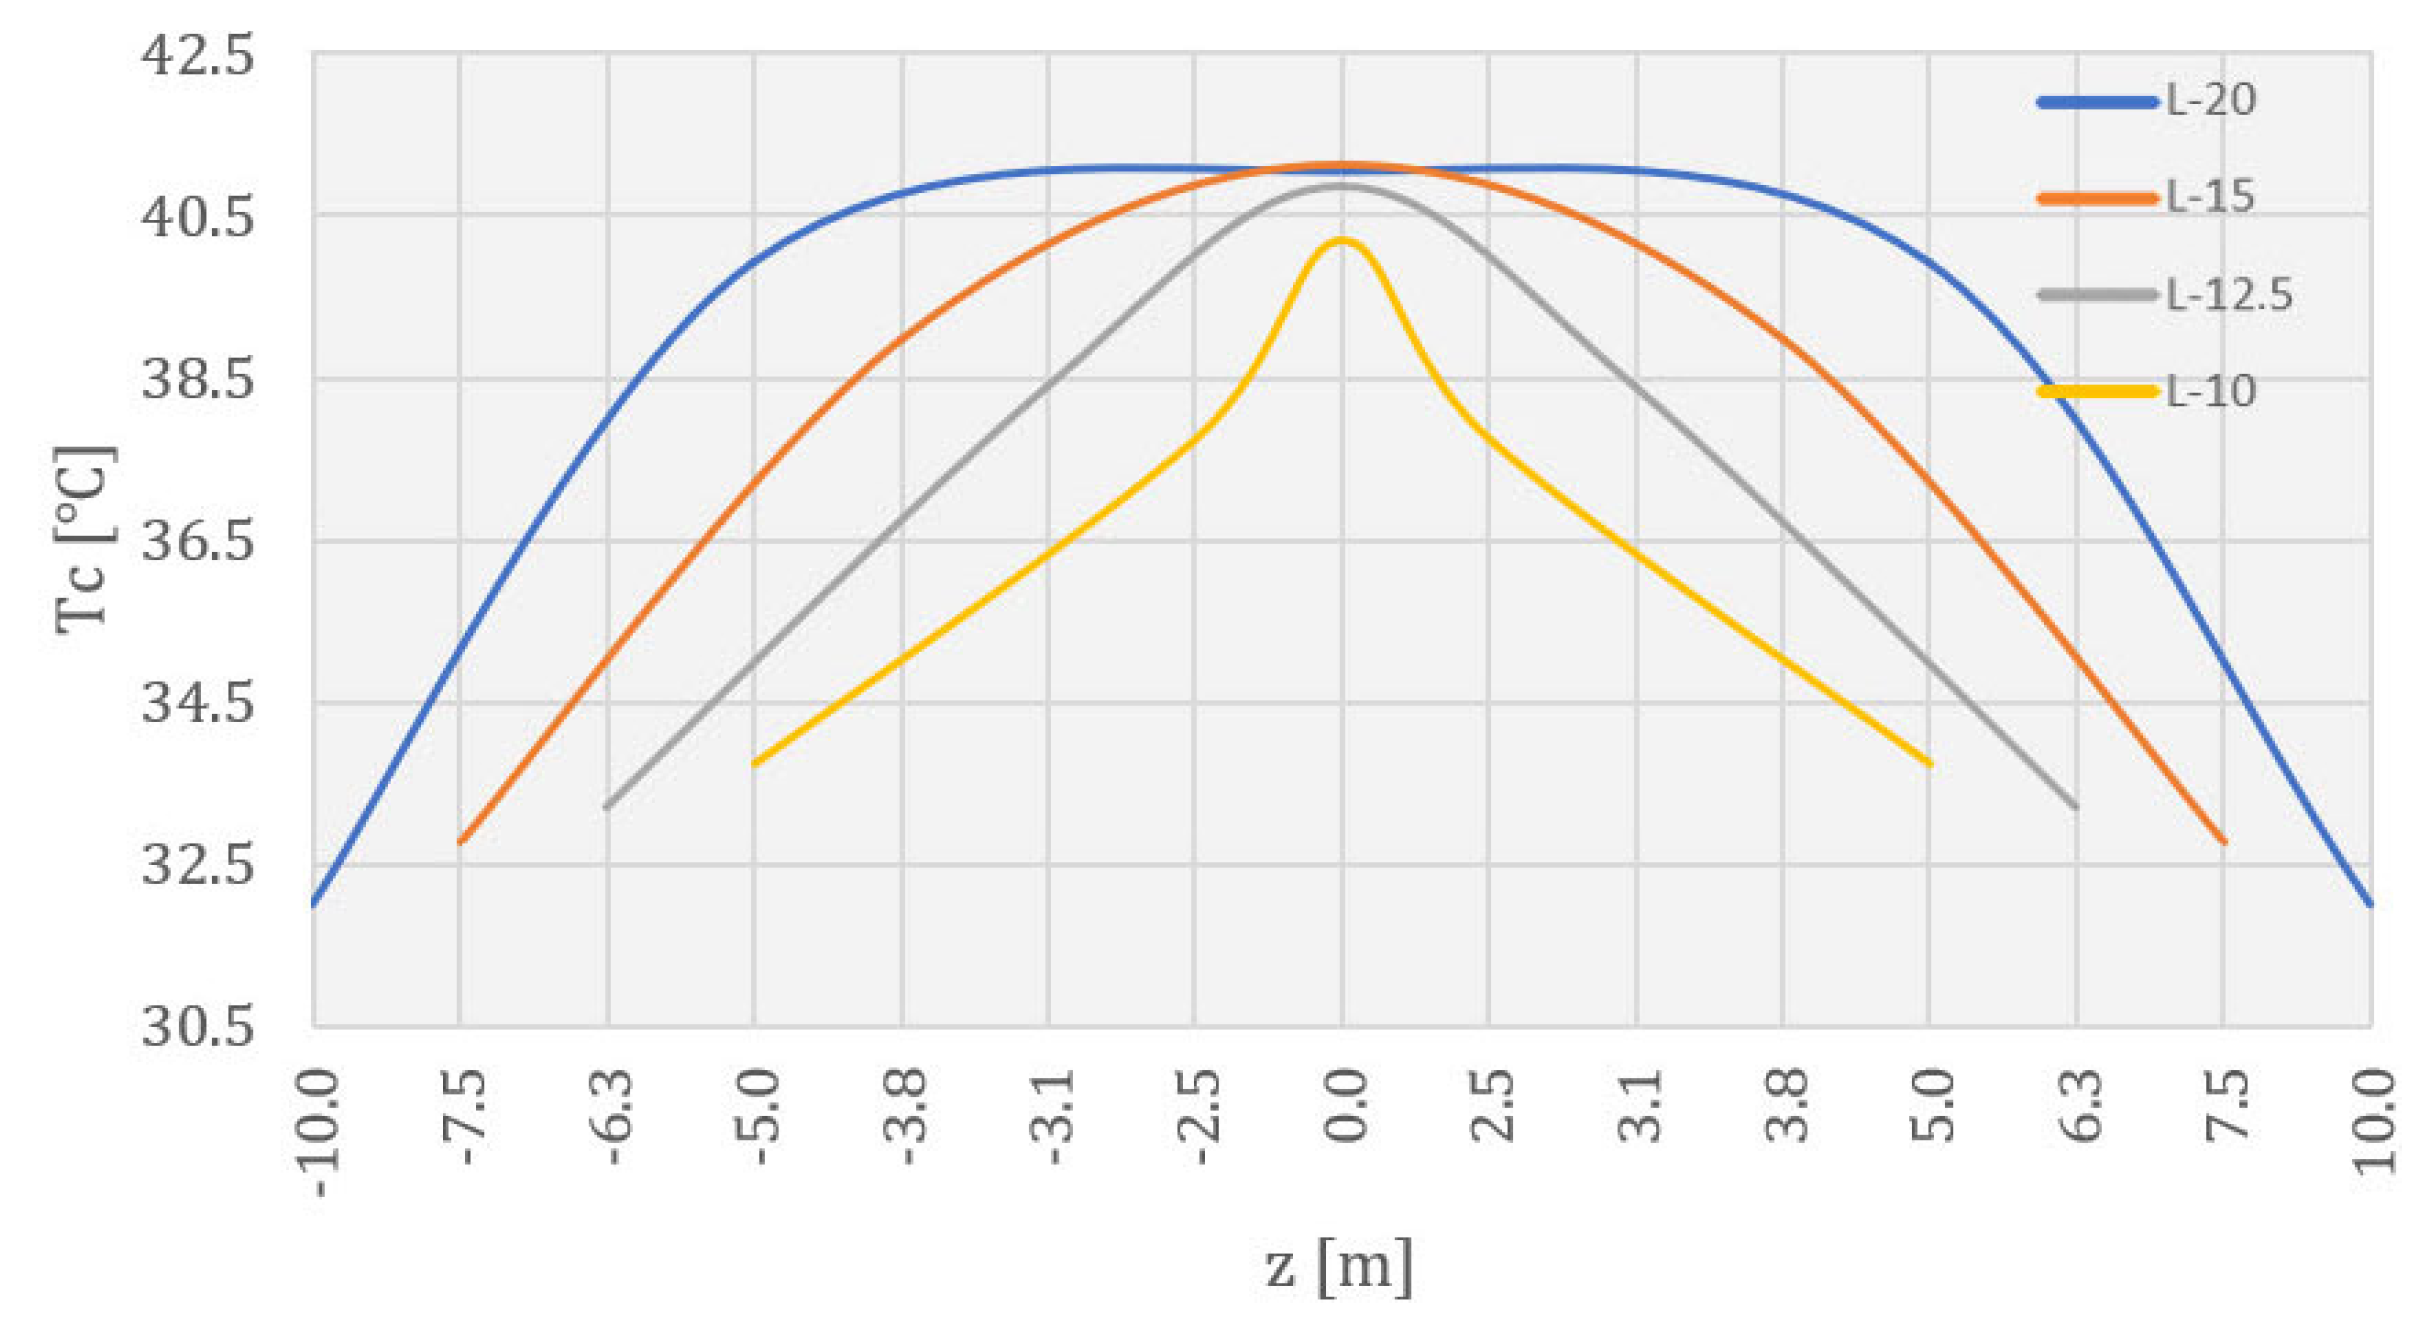
The increase in the temperature due to hydration heat can be seen in Figure 18 and Figure 19 (for the construction period), as well as in Figure 20 (for the period immediately after the completion of construction) for all the analyzed monolith lengths. These parts of the structure were recognized as zones with concrete temperatures in the range of 35.2–41.4 °C.
The influence of winter air temperatures on the near-surface zones of the monoliths is evident in Figure 18, as well as in Figure 20 for all the analyzed monolith lengths.
In Figure 19, which shows the temperature field at the time of the summer break from concreting, which lasted 135 days—from June 20th to November 2nd of the second year—the influence of the summer temperatures on the surfaces in contact with the air can be seen. Such extreme conditions, in combination with an increase in the temperature due to hydration, caused increases in the temperature of the cross-sections of the monoliths of the considered lengths (up to 41.0 °C). The influence of high air temperatures during the summer break was also reflected in the temperature field at the time of the completion of the monolith’s construction (Figure 20). It can be seen that the concrete temperatures in the central cross-section area still significantly increased. It is emphasized that summer breaks during concreting as well as the proper curing of concrete during breaks (the use of covers, wetting the concrete) are extremely important in order to prevent excessive heating of the structure [35,36,37]. The concrete-curing process during the summer break was not considered in this research.
In Figure 20, it can be seen that the cooling process can also be influenced by the galleries in the dam’s body. As stated in [31], this boundary condition is set around the perimeter of all galleries. Therefore, its influence on the temperature field should be taken with reservations due to a lack of complete measurements, which is why the stated values were determined based on the mean monthly ambient temperatures.
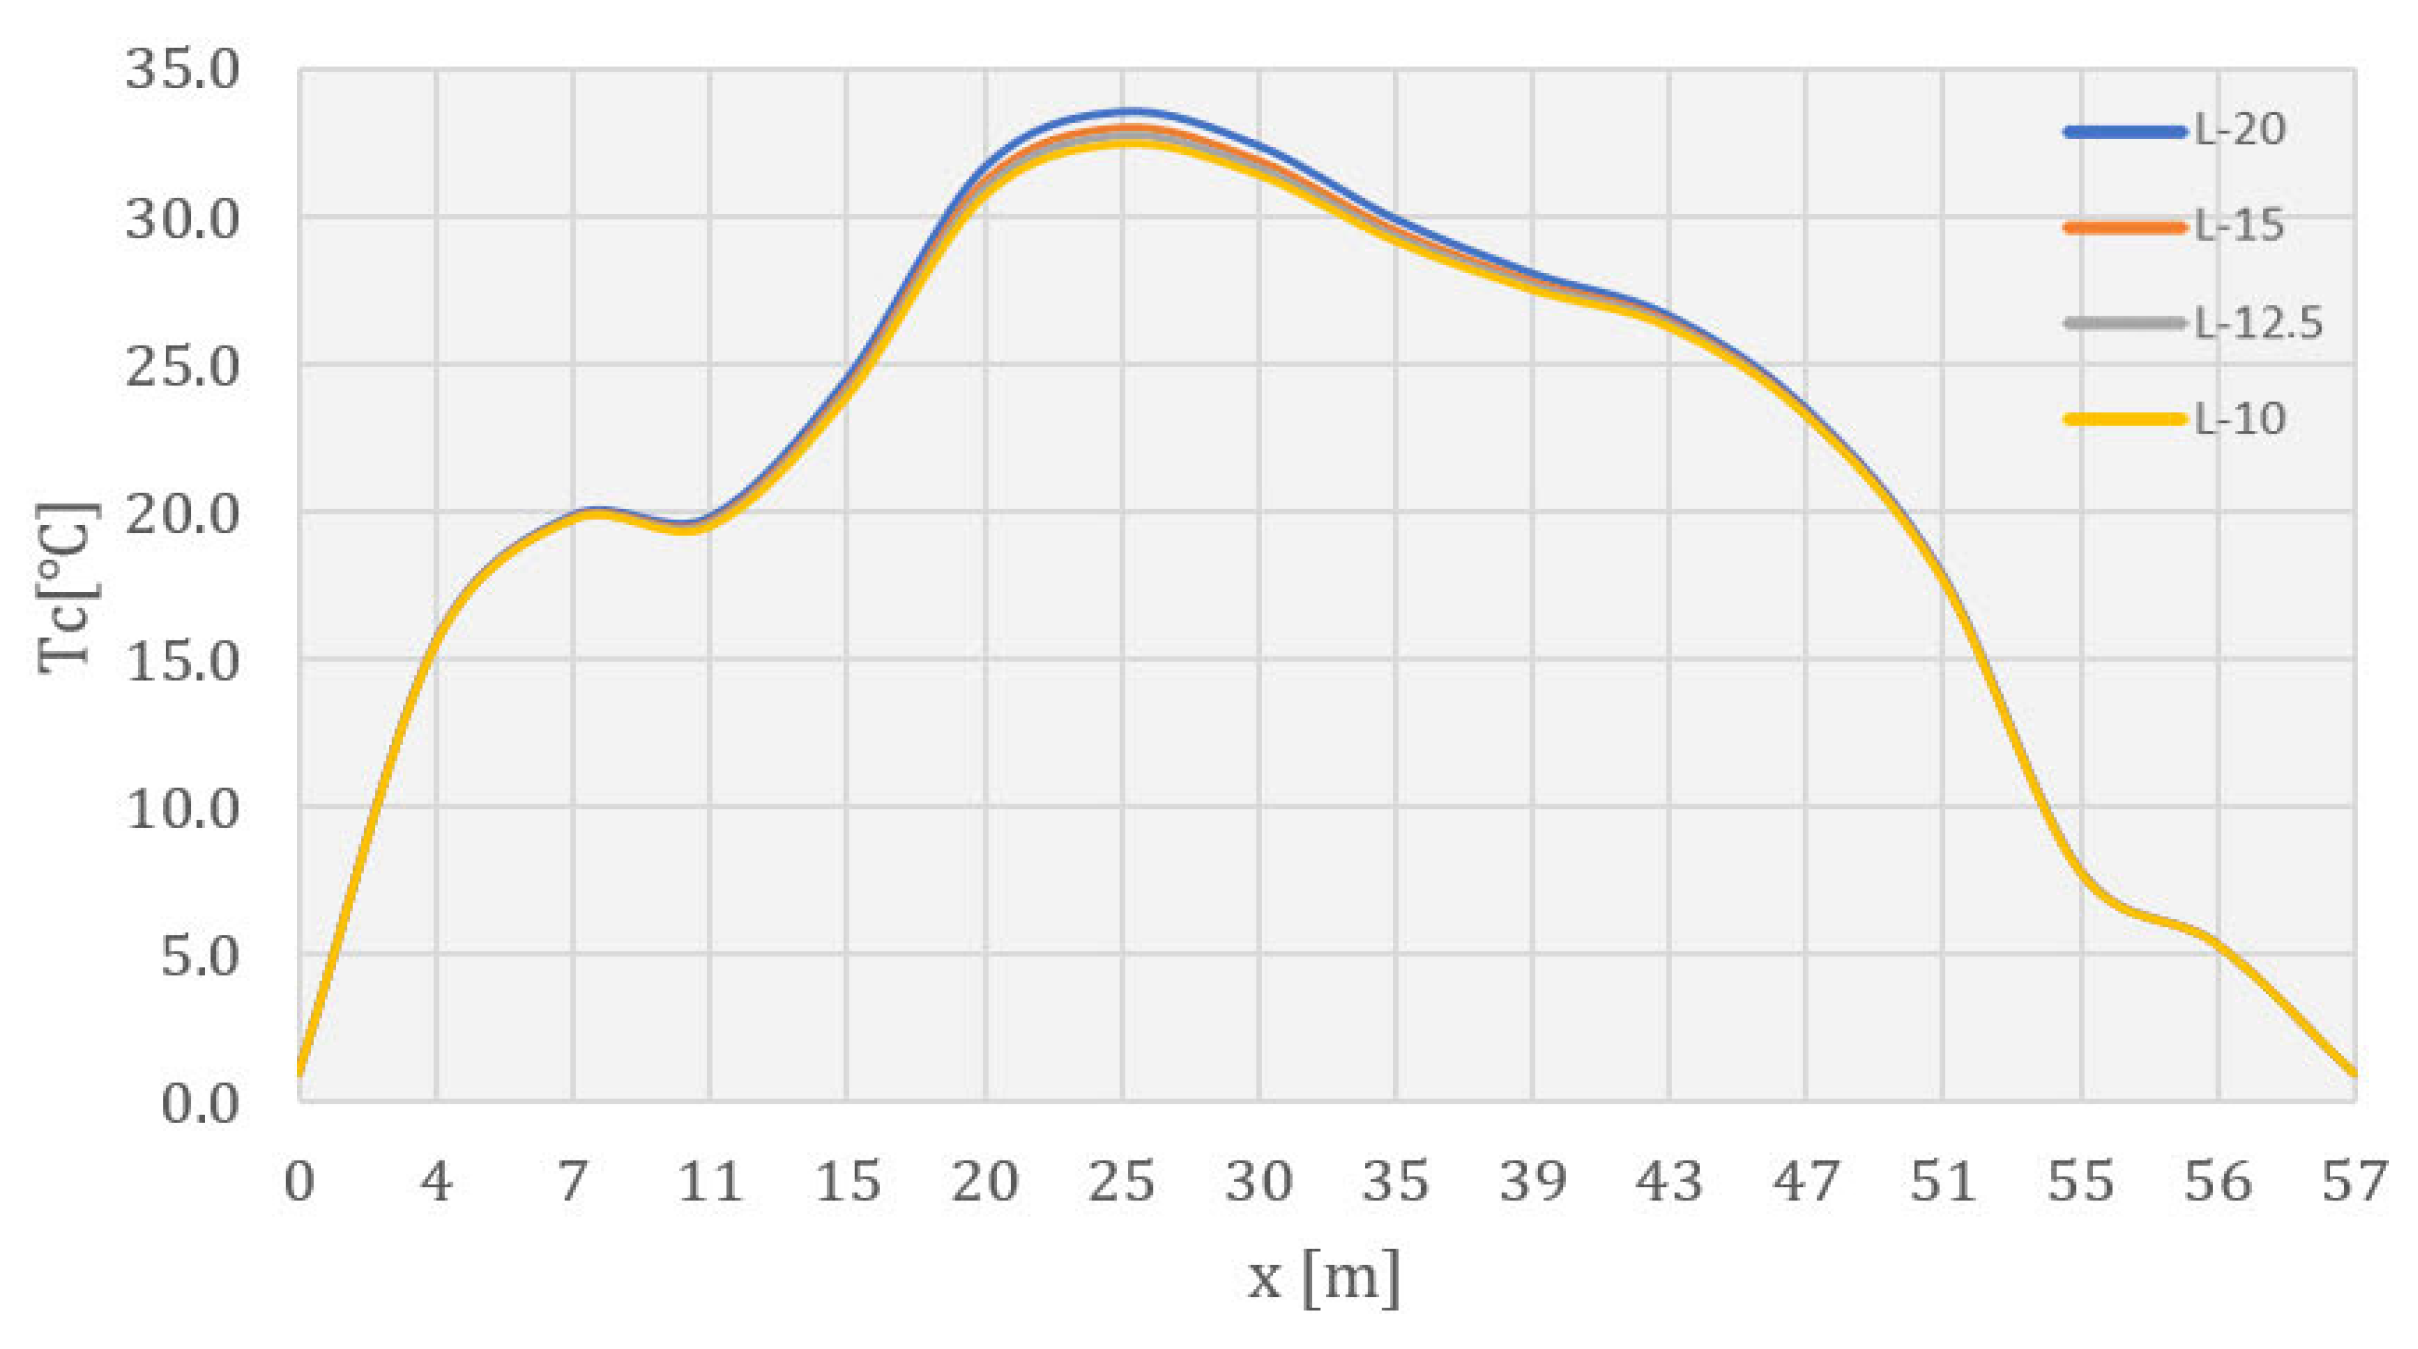
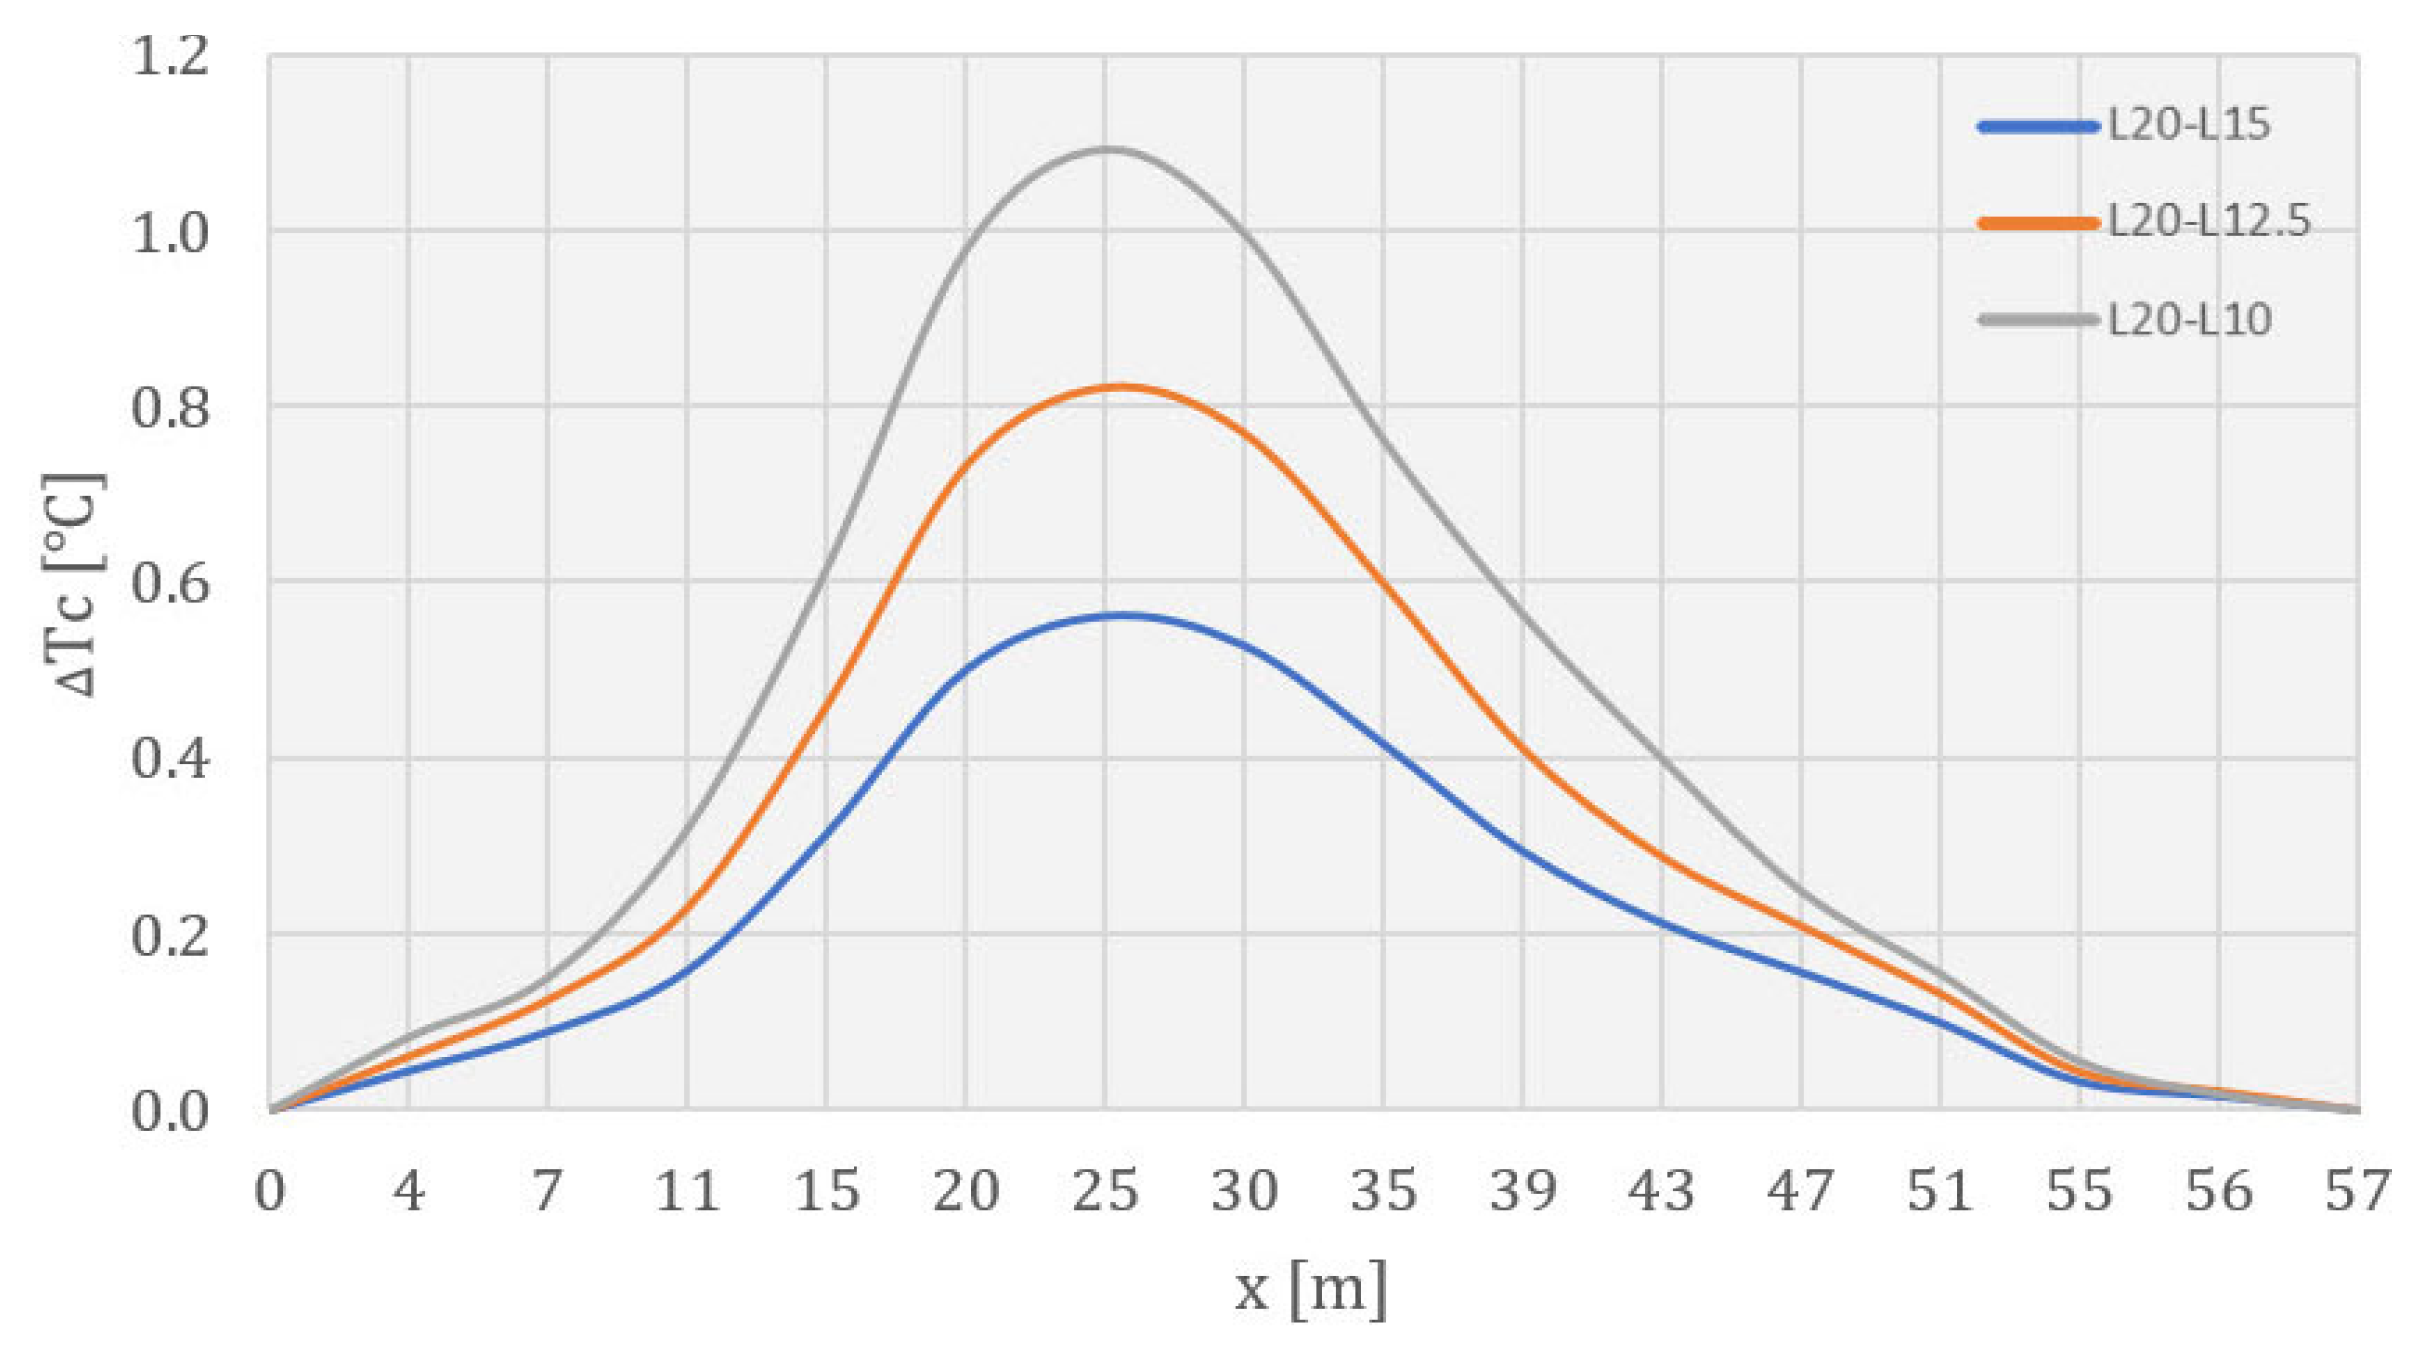
Figure 21, Figure 22 and Figure 23 show the TF in selected horizontal cross-sections during construction for all the considered monolith lengths: at 146.50 m ASL for the 84th day, at 169.0 m ASL for the 283rd day, and at 162.75 m ASL for the 512th day. The position of these horizontal cross-sections was chosen so that they represent the zones with increased values of concrete temperatures, as well as changes in these temperatures with monolith length variations. Additionally, the positions of the transverse and longitudinal sections (upstream–downstream and towards the river banks, respectively) of the horizontal planes are marked with dashed black lines, in which temperature changes with monolith length variations are shown.
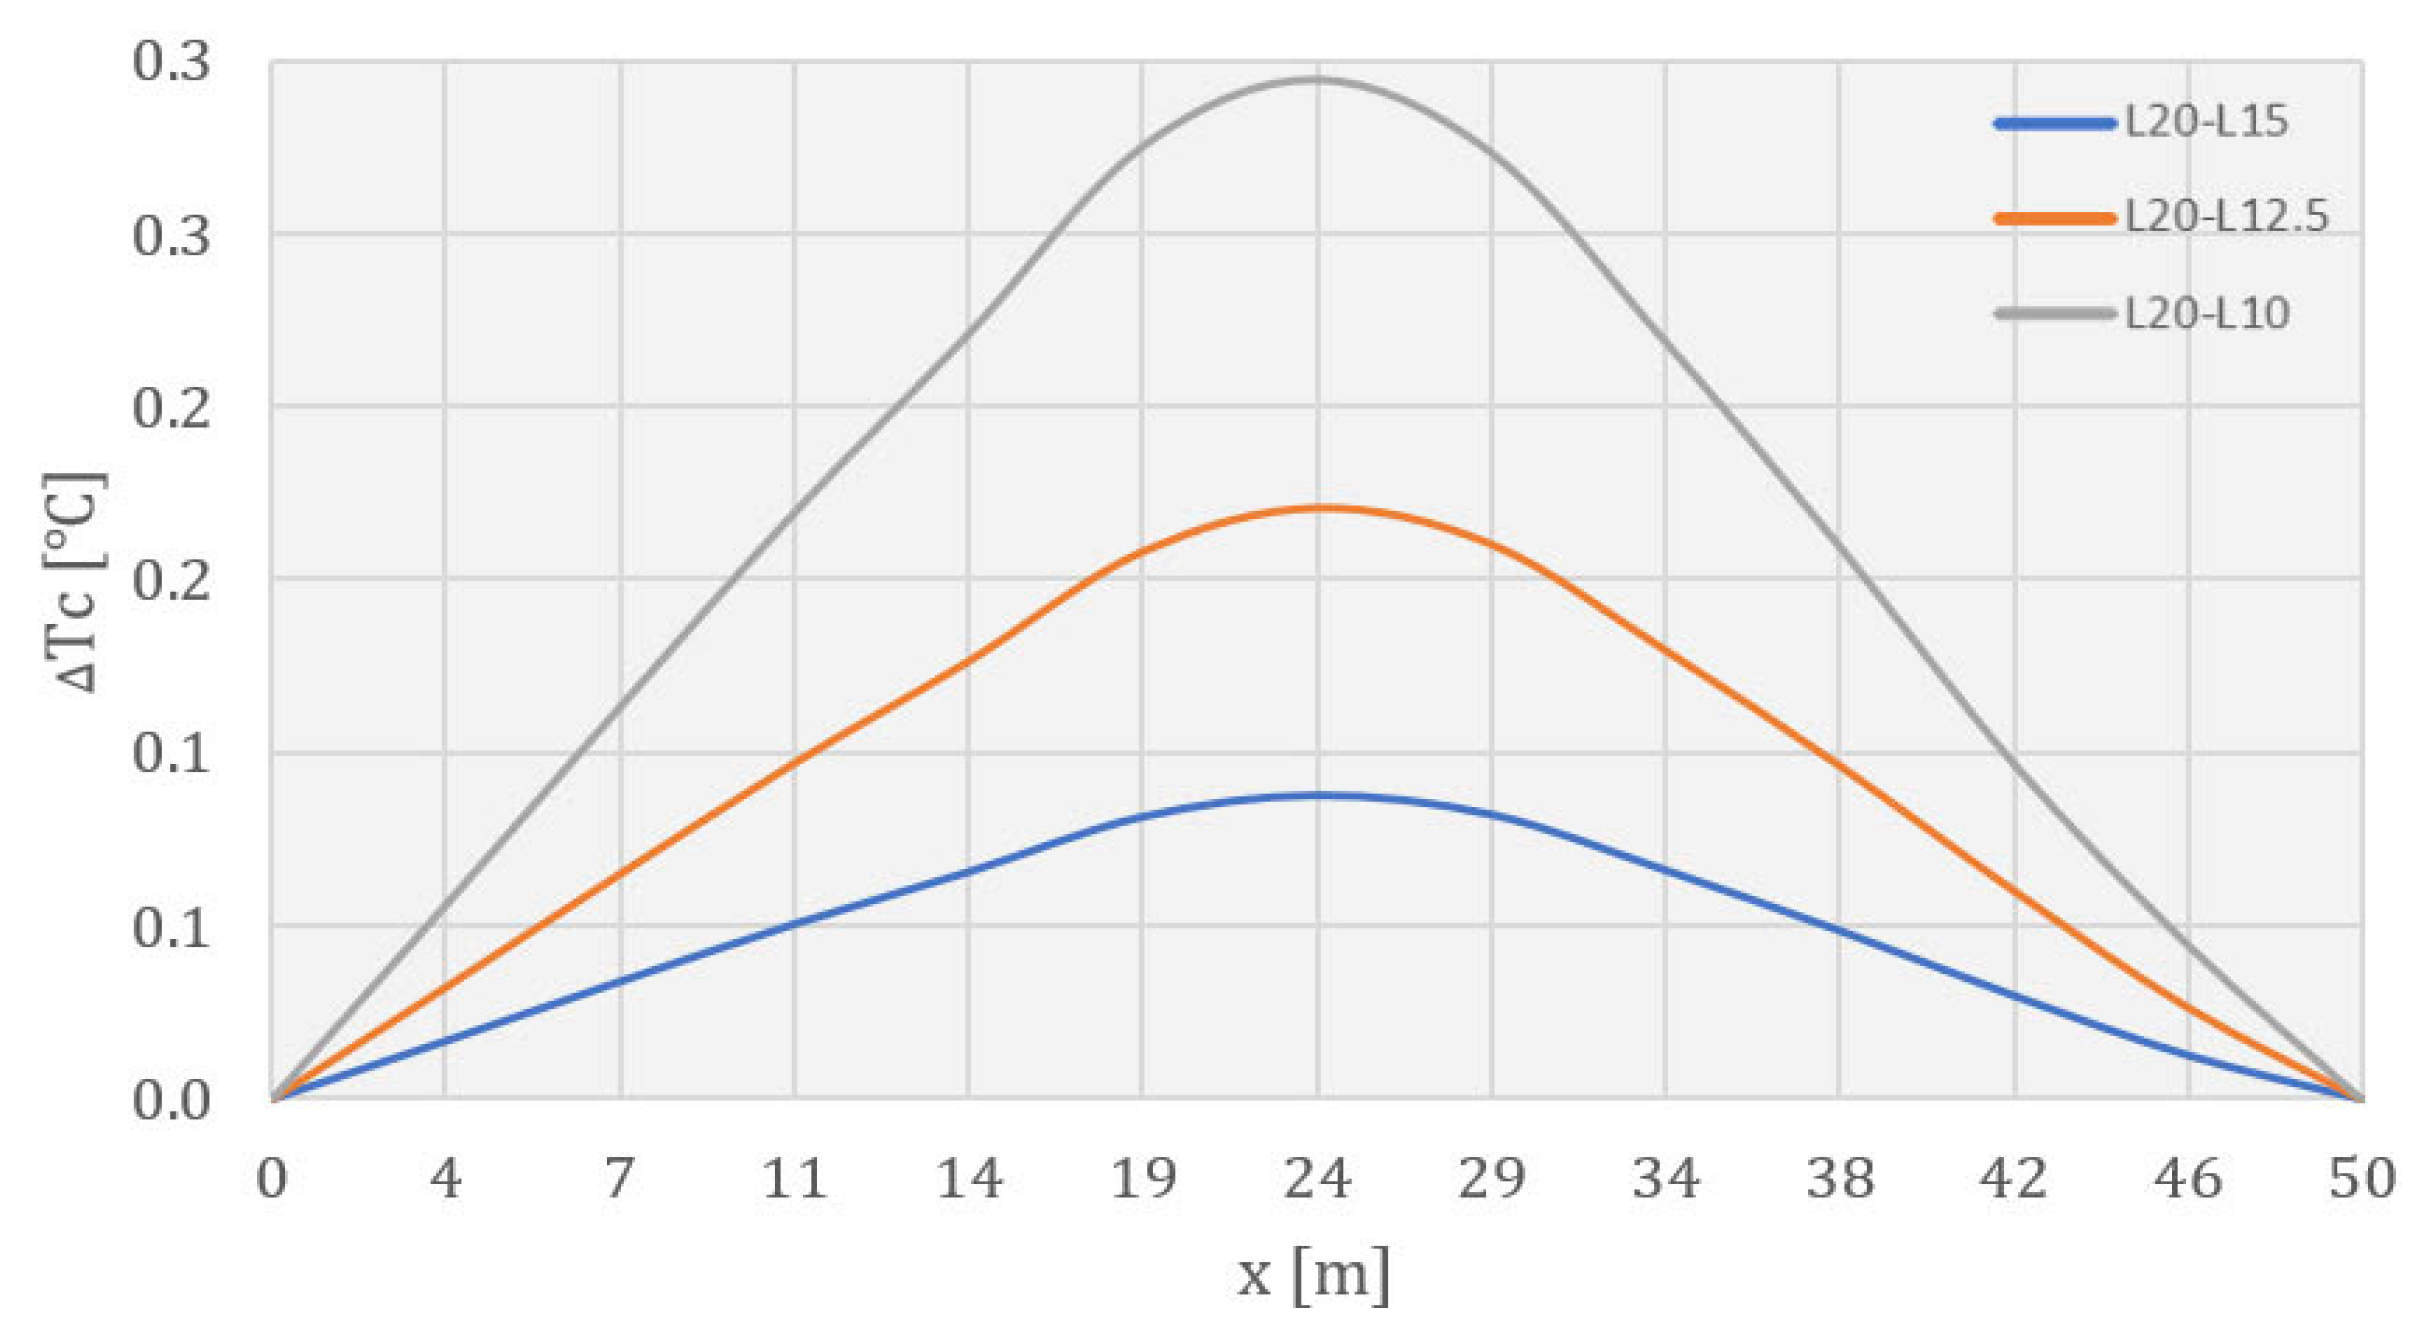
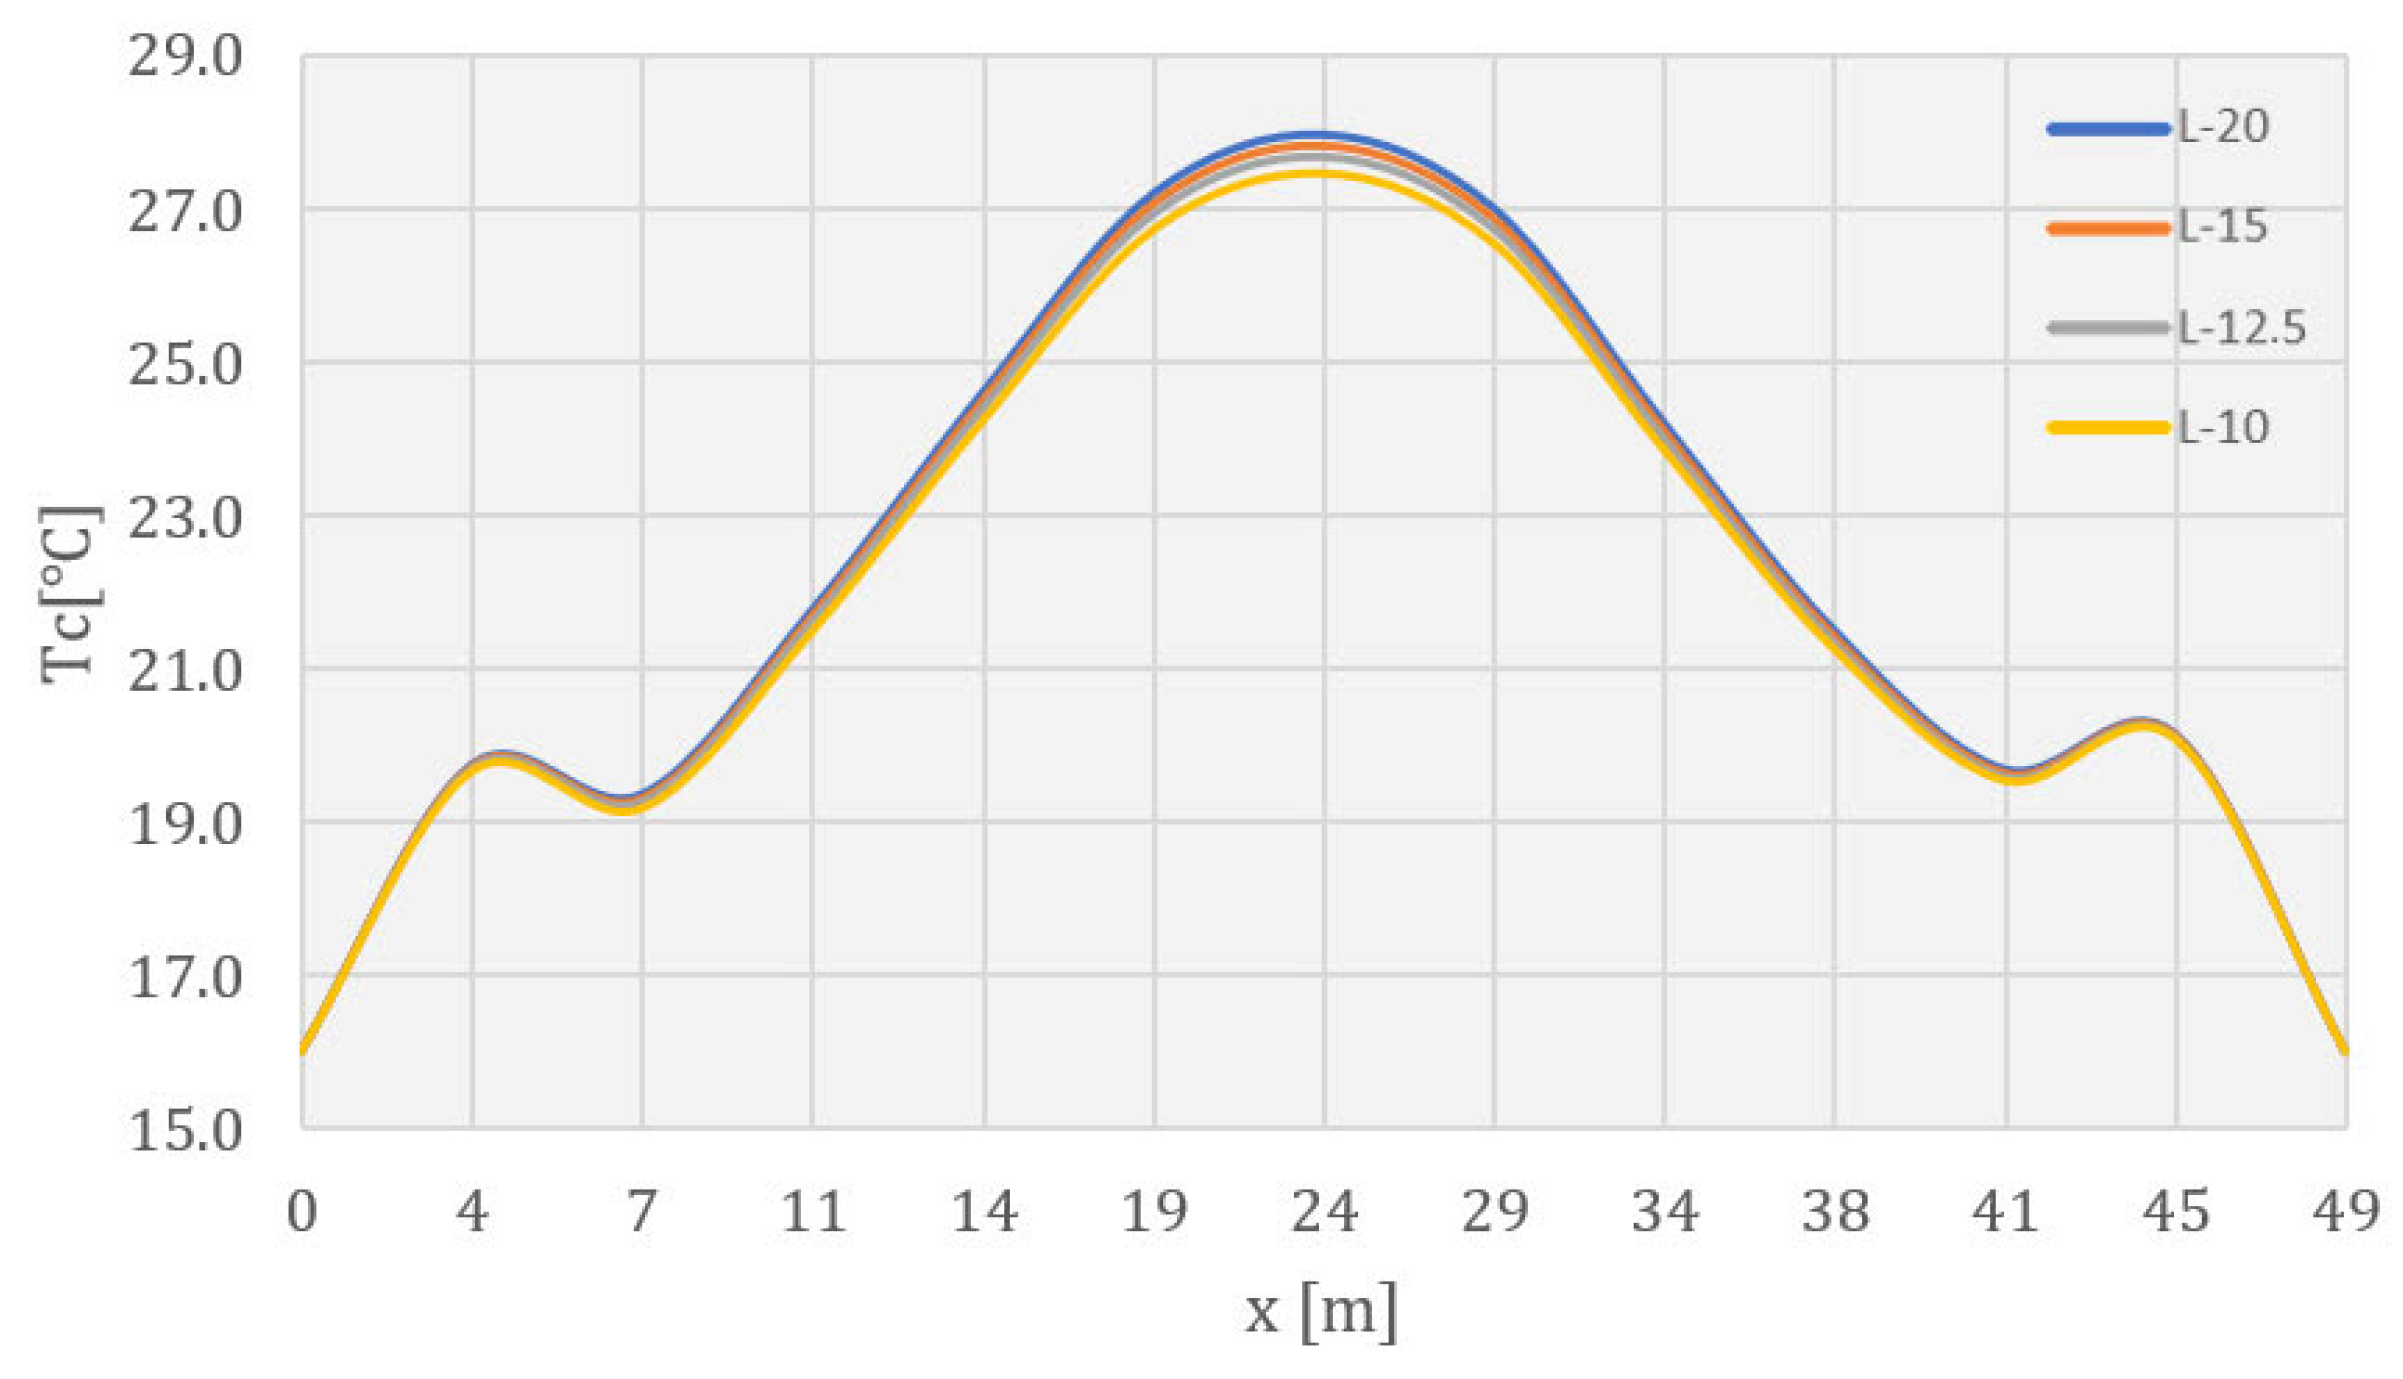
Figure 24, Figure 25 and Figure 26 show diagrams of the concrete temperatures in a horizontal cross-section at 146.50 m ASL for the considered monolith lengths for the 84th day from the beginning of construction. Based on the diagram, it can be concluded that the displayed temperatures decreased with a reduction in the monolith length, by a maximum of 0.4 °C when changing the monolith length from 20.0 m to 15.0 m, 1.1 °C when changing the monolith length from 20.0 m to 12.5 m, and 2.3 °C when changing the monolith length from 20.0 m to 10.0 m. The specified extreme values of the changes were not located at the points of maximum temperature values in the considered cross-section.
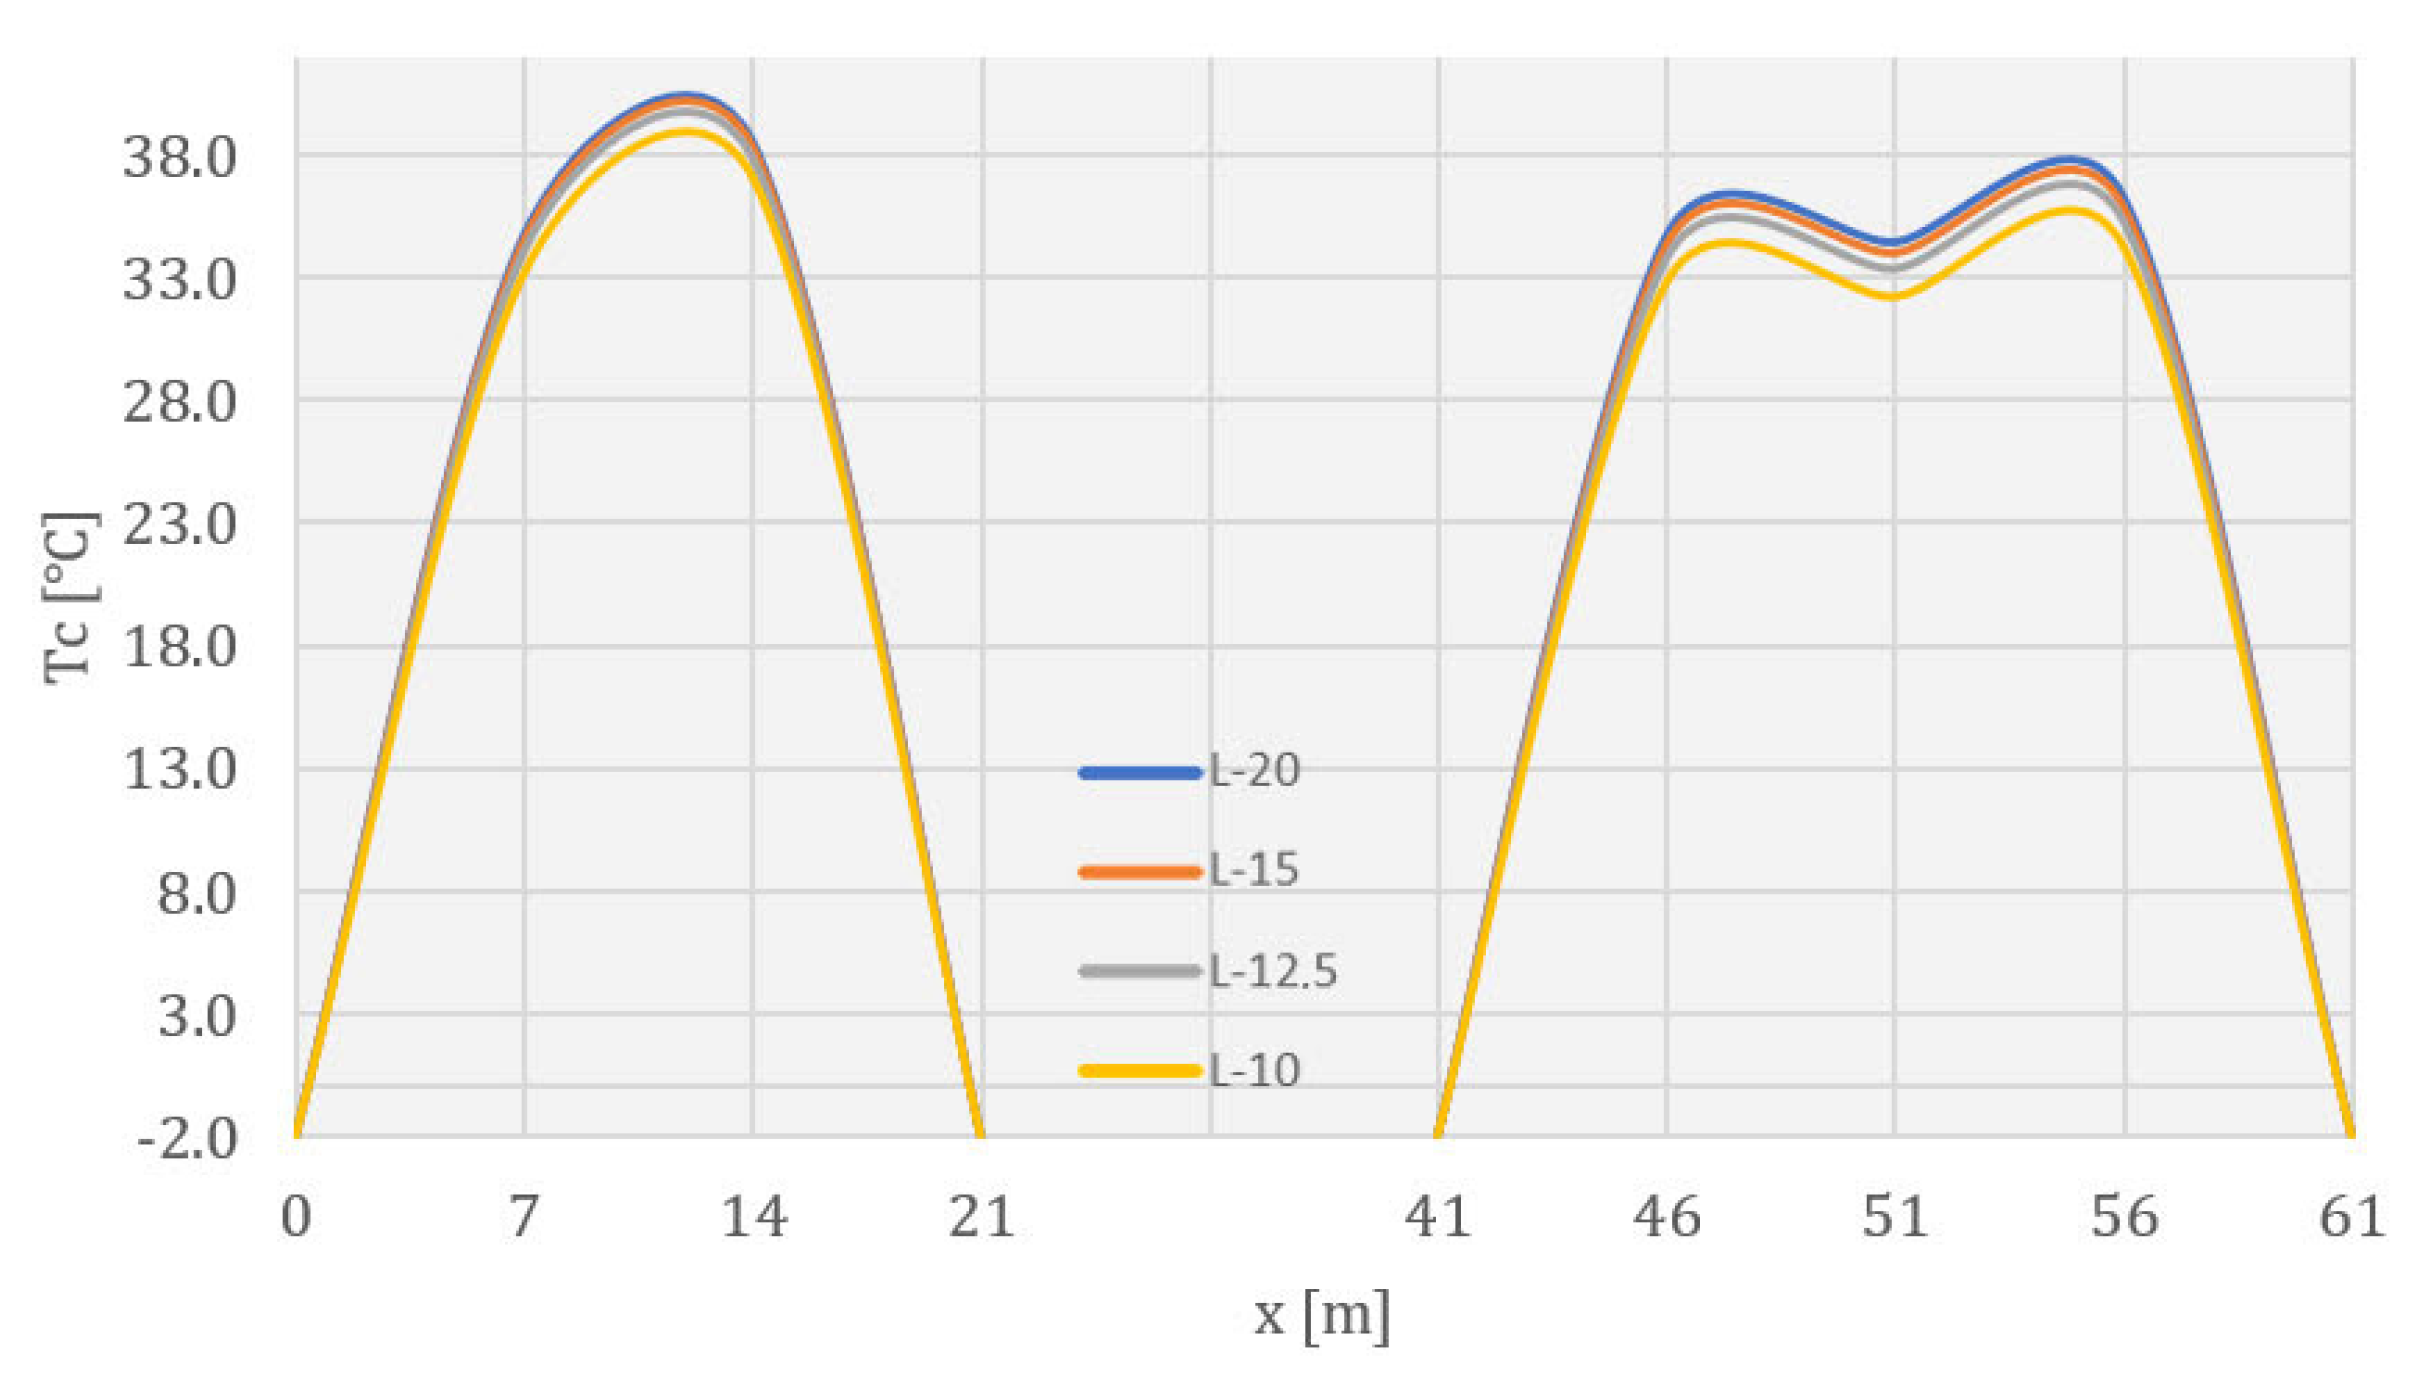
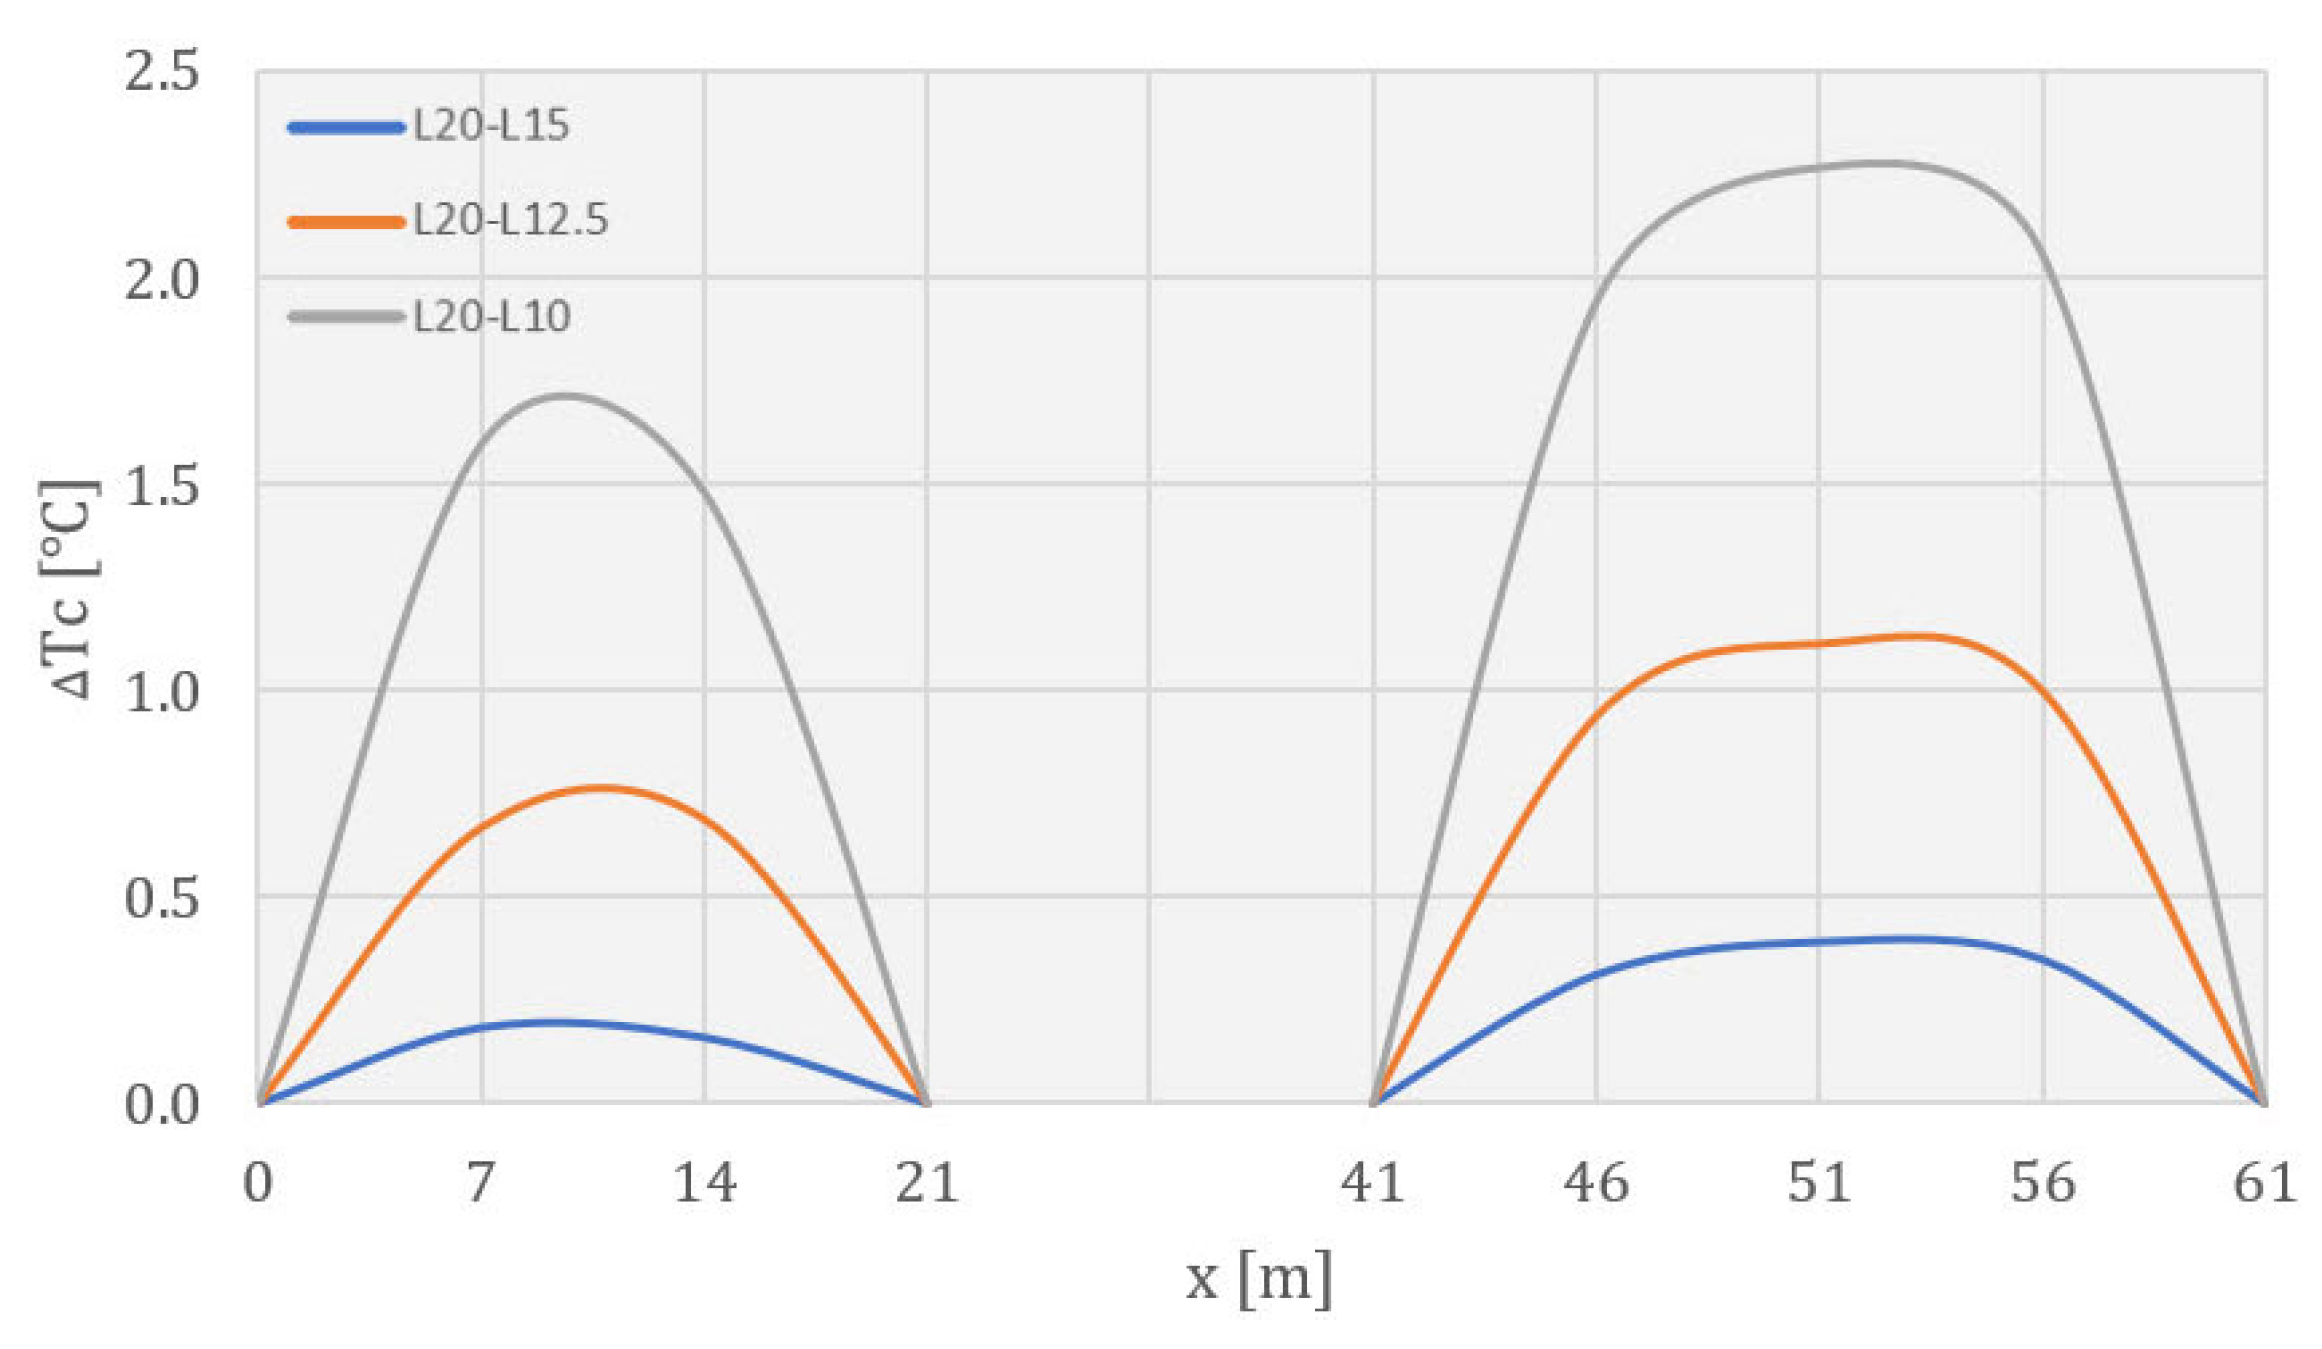
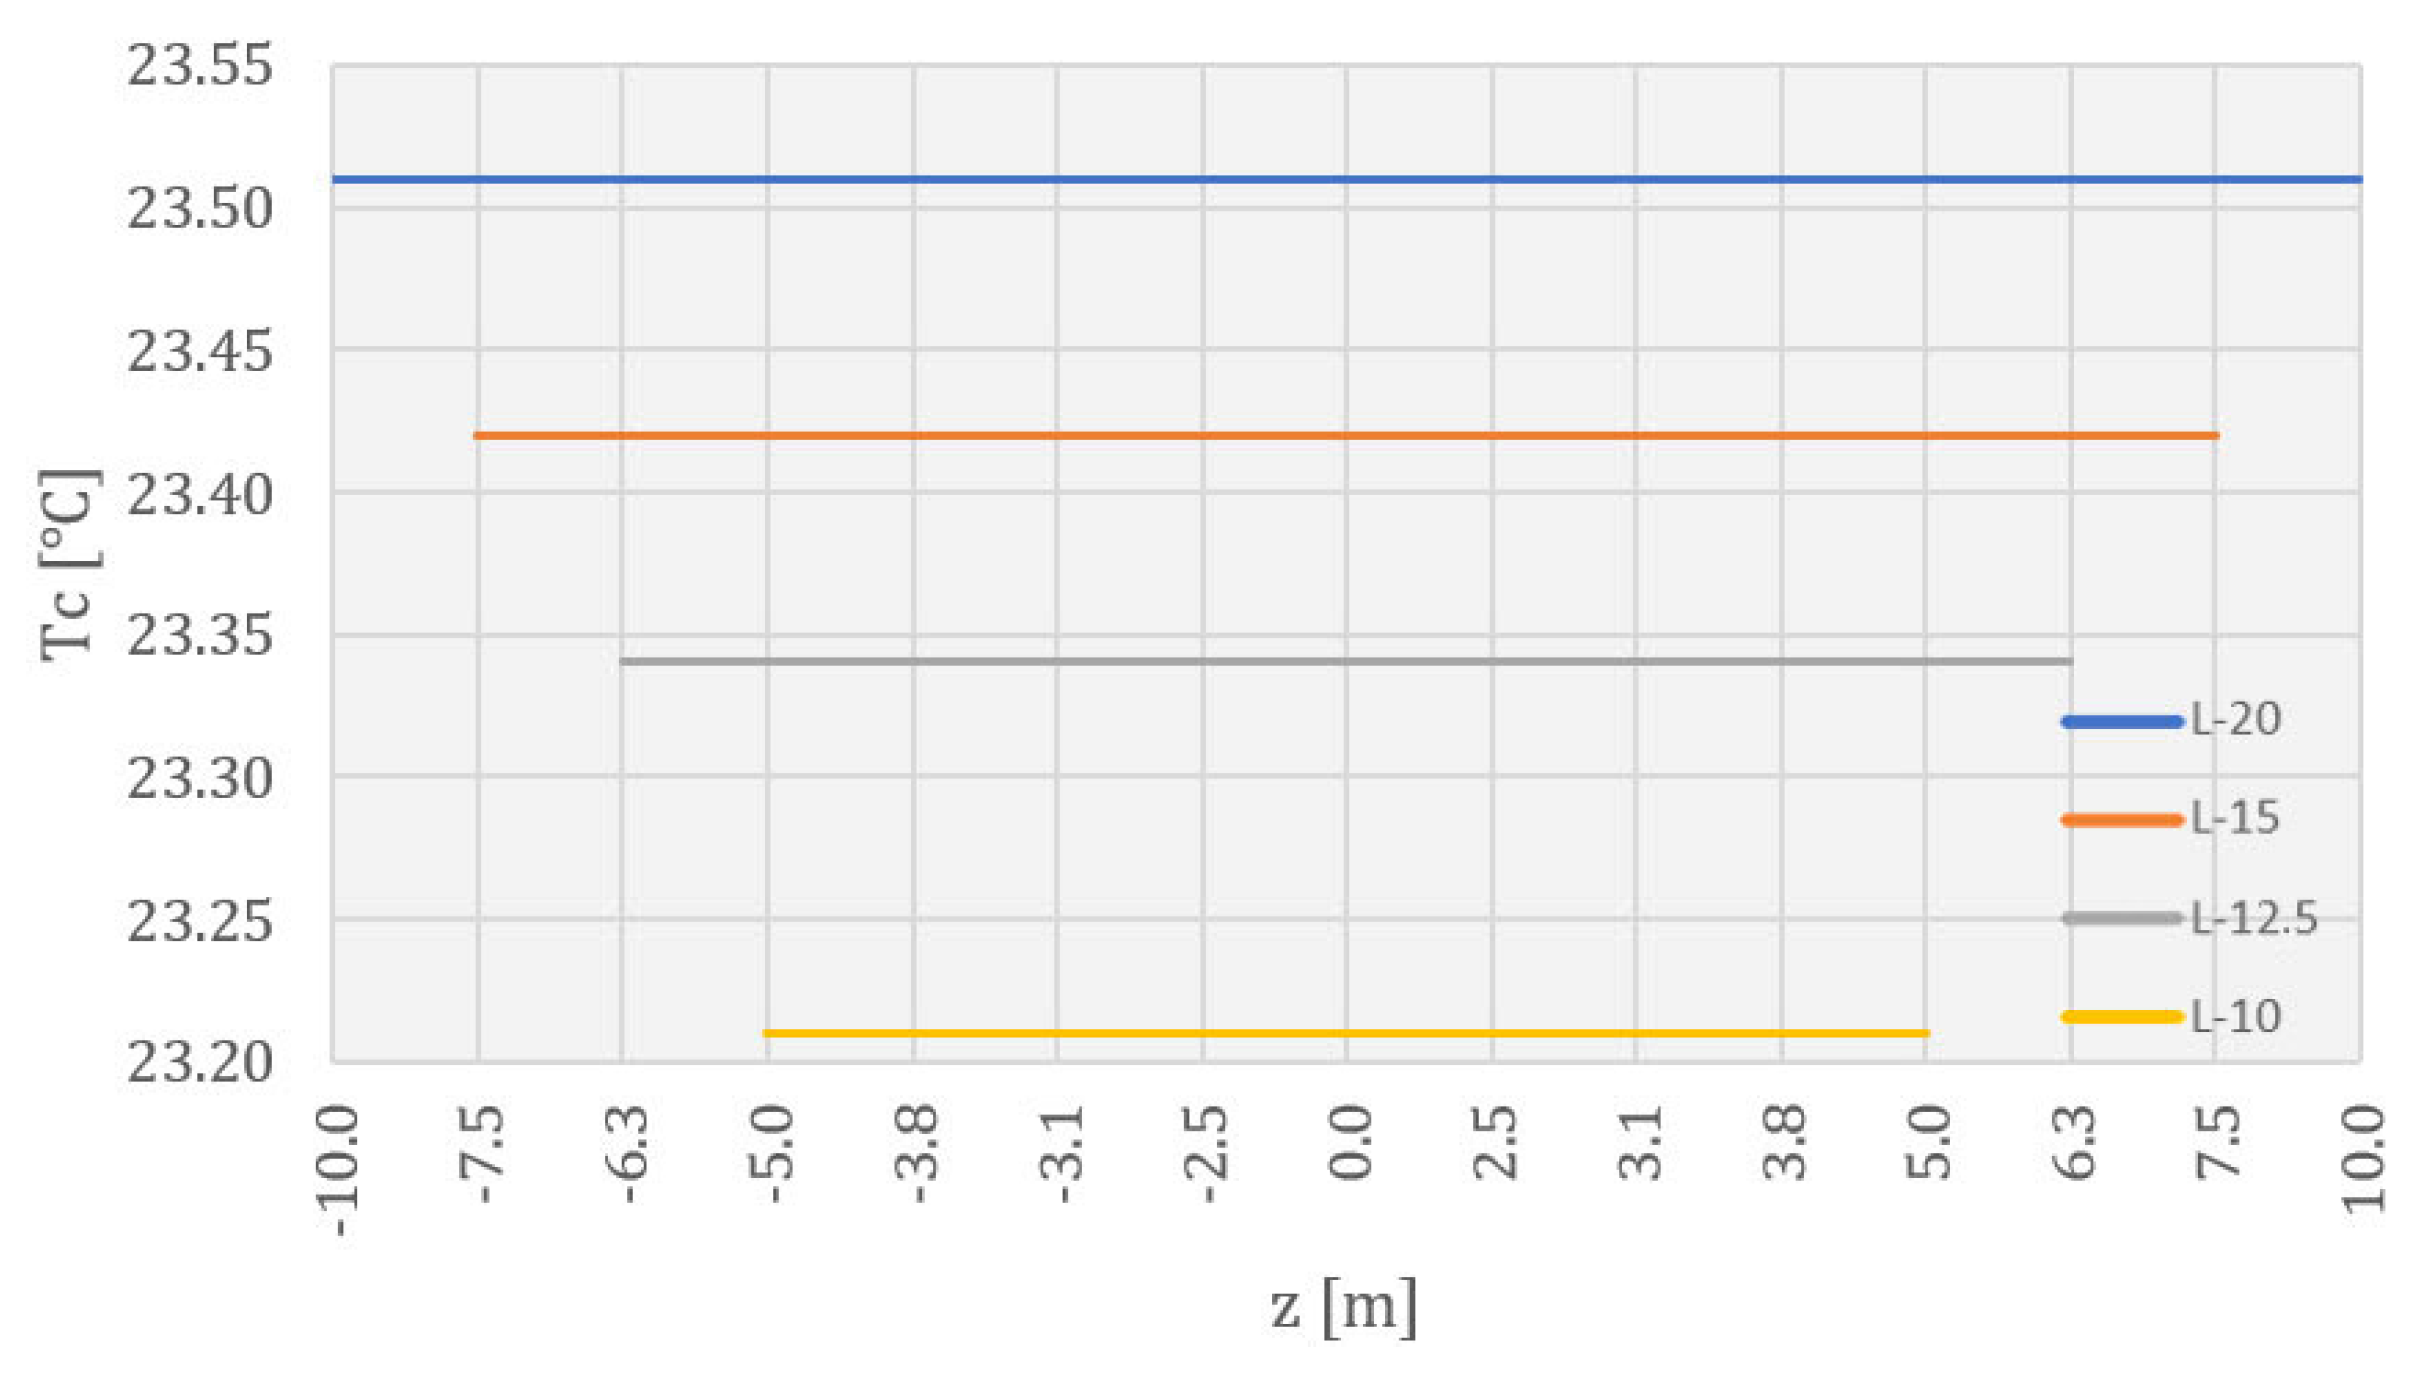
Figure 27, Figure 28 and Figure 29 show diagrams of the concrete temperatures in a horizontal cross-section at 169.0 m ASL for the considered monolith lengths for the 283rd day from the beginning of construction. Based on the diagram, it can be concluded that the displayed temperatures decreased with a reduction in the monolith length, by a maximum of 0.9 °C when changing the monolith length from 20.0 m to 15.0 m, 1.4 °C when changing the monolith length from 20.0 m to 12.5 m, and 1.6 °C when changing the monolith length from 20.0 m to 10.0 m. As with the previous diagrams (for the 84th day), the extreme values of the changes were not located at the points of maximum temperatures in the considered cross-section.
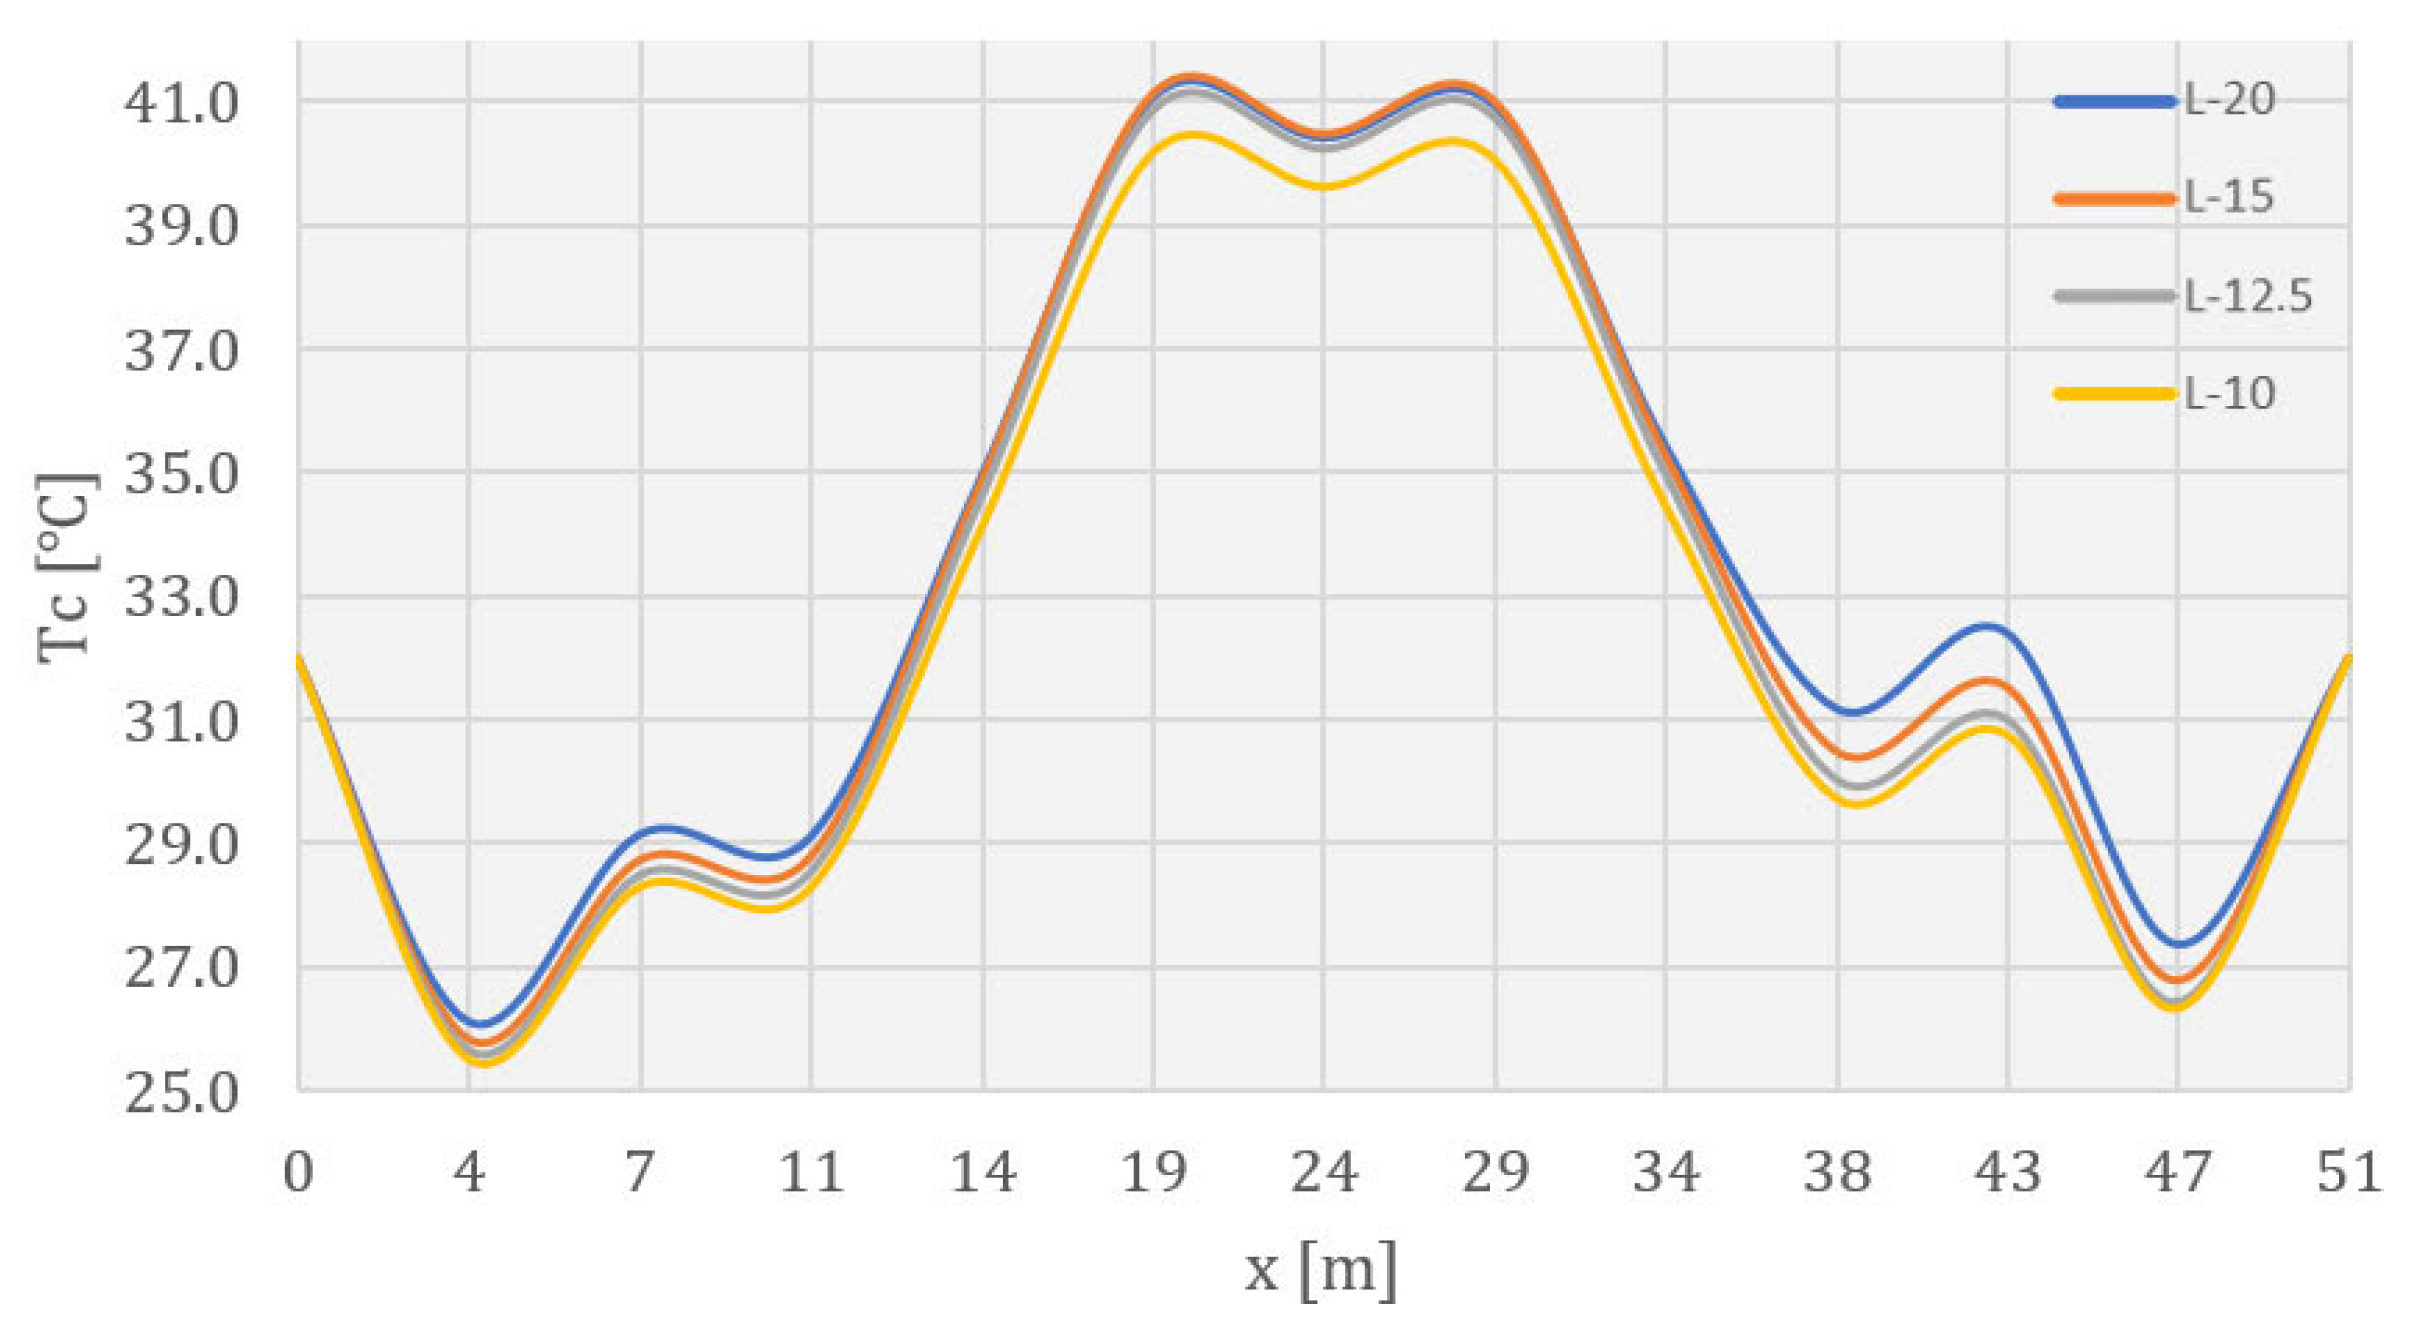
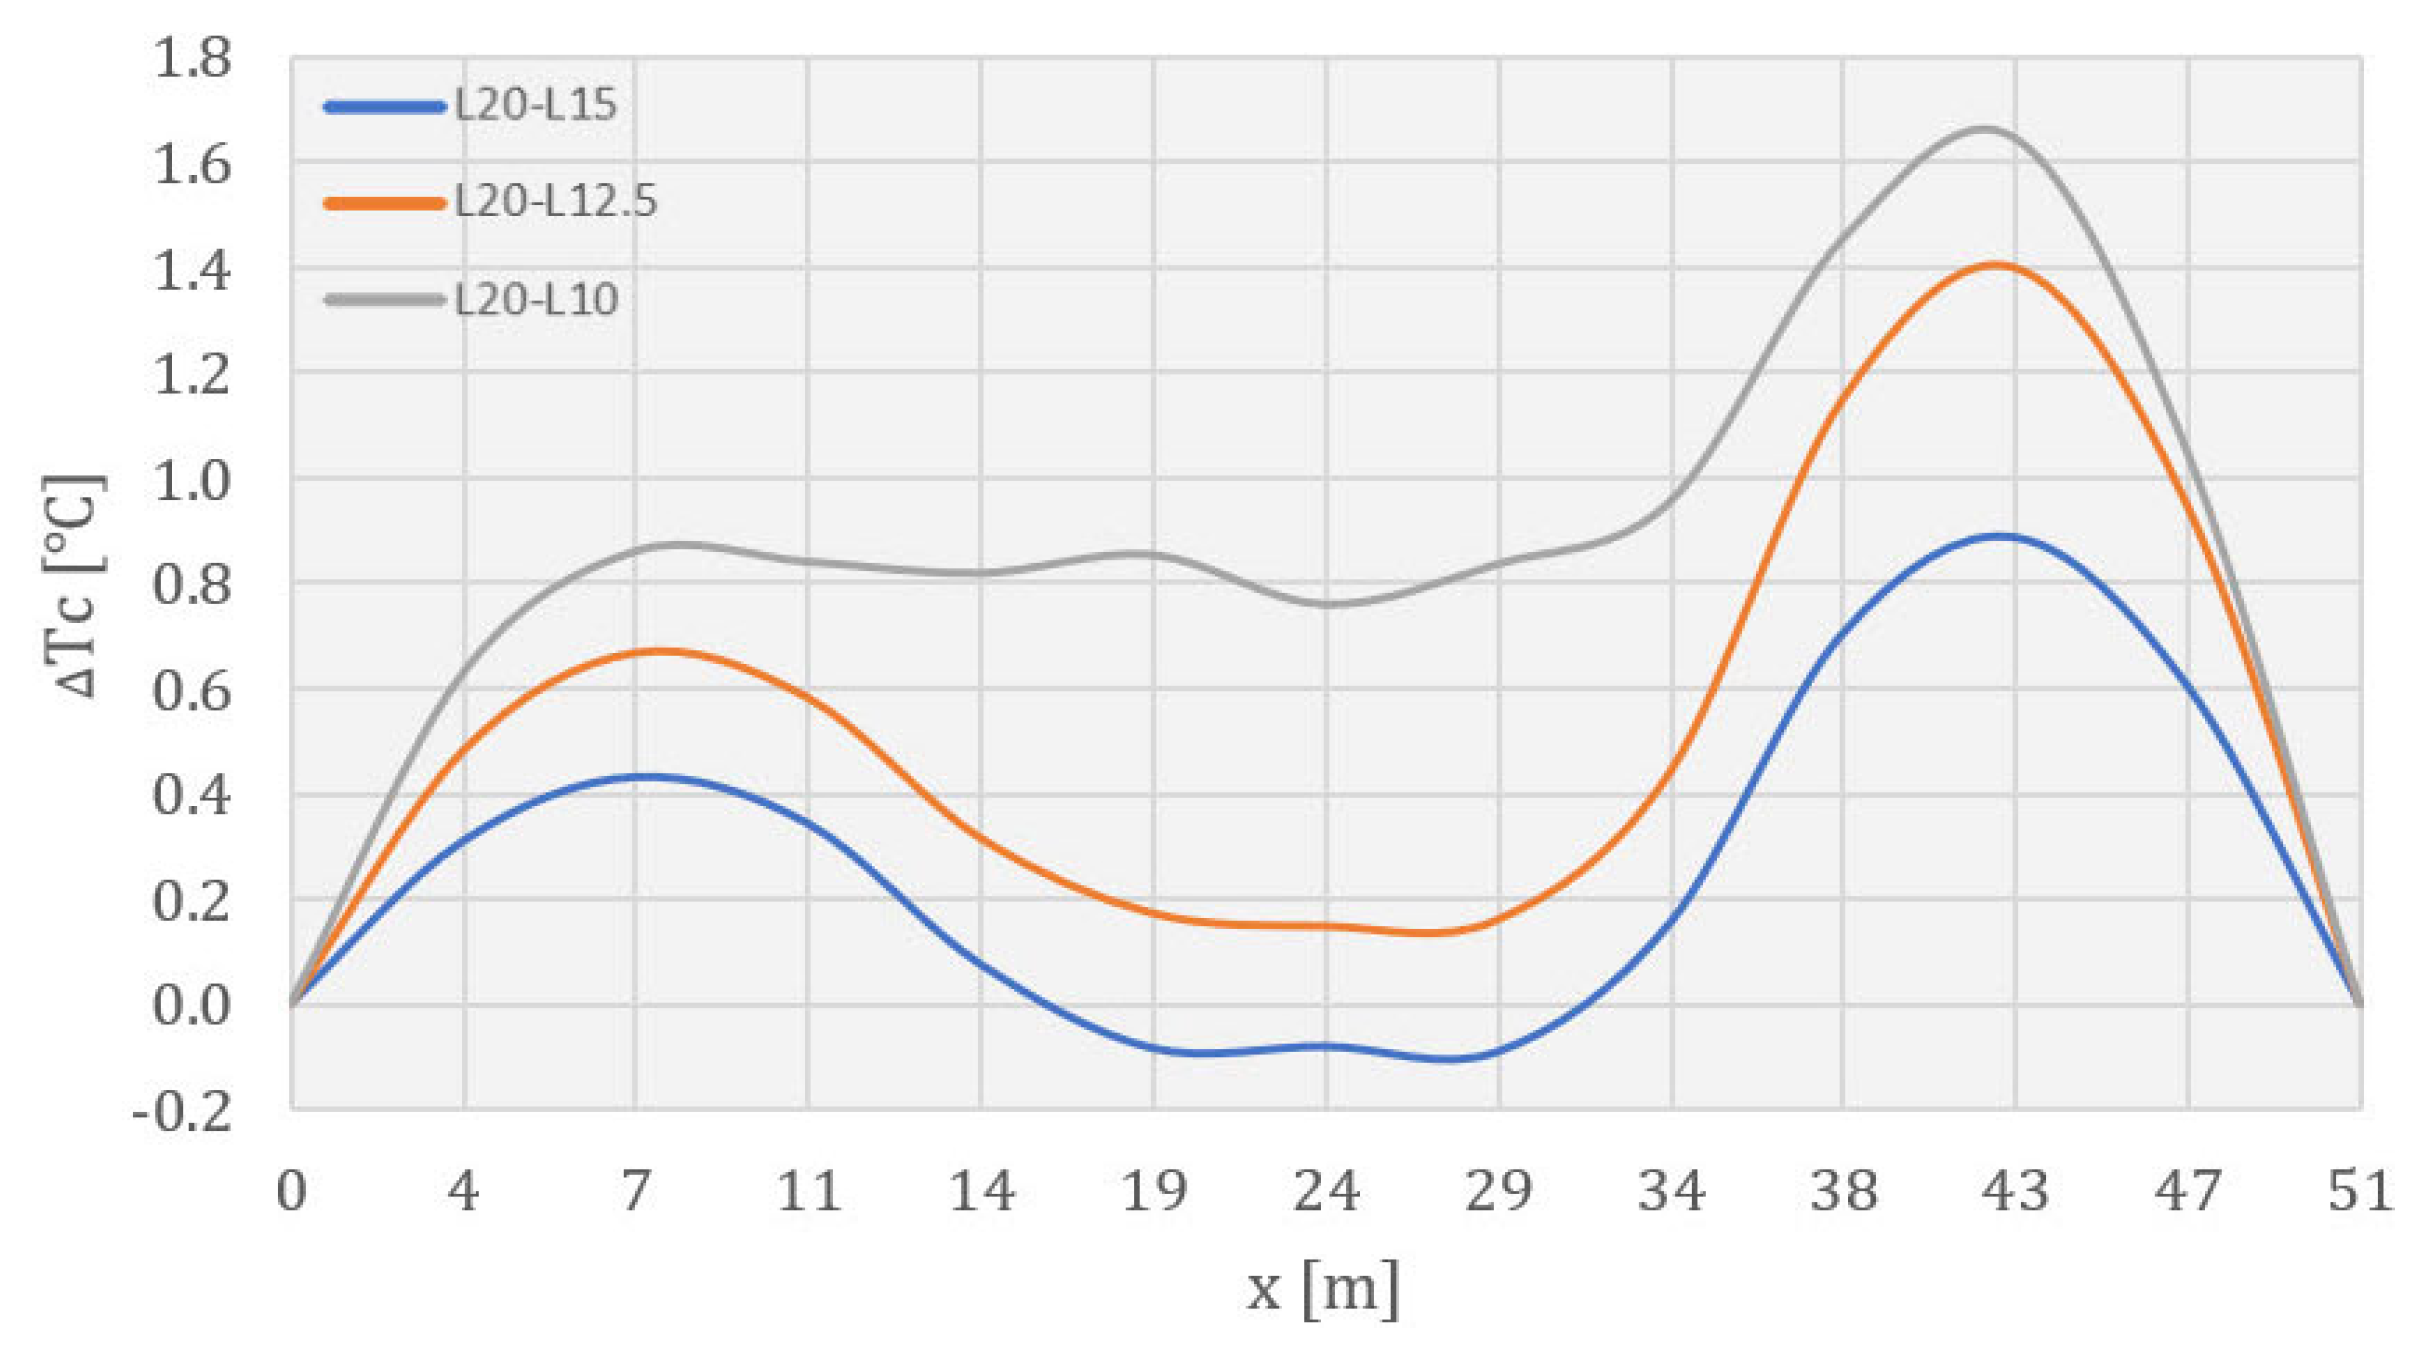
Figure 30, Figure 31 and Figure 32 show diagrams of the concrete temperatures in a horizontal cross-section at 162.75 m ASL for the considered monolith lengths for the 512nd day from the beginning of construction. Based on the diagram, it can be concluded that the temperatures decreased with a reduction in the monolith length, by a maximum of 0.6 °C when changing the monolith length from 20.0 m to 15.0 m, 0.8 °C when changing the monolith length from 20.0 m to 12.5 m, and 1.1 °C when changing the monolith length from 20.0 m to 10.0 m. Unlike the previous diagrams (for the 84th and 283rd days), the extreme values were located exactly at the points of maximum temperatures in the considered cross-section.

4.3. Temperature Field during Service Life

After the construction had completed, the gradual cooling of the structure began. In Figure 33, Figure 34 and Figure 35, this process can be seen as a reduction in the elevated temperatures of the central part of the monolith cross-section.
The influence of winter air temperatures on the near-surface zones of the monoliths is evident in Figure 34 for all the analyzed monolith lengths.
In Figure 33, Figure 34 and Figure 35, it can also be seen that the cooling process was affected by the water temperature in the reservoir (blue-colored zones on the upstream side in the contact zone with the reservoir).
Figure 34 shows that the cooling process is still affected by the galleries in the dam’s body. Here, too, the note given in the previous sub-chapter applies, because the temperature values were determined based on the mean monthly values of the ambient temperature [31].
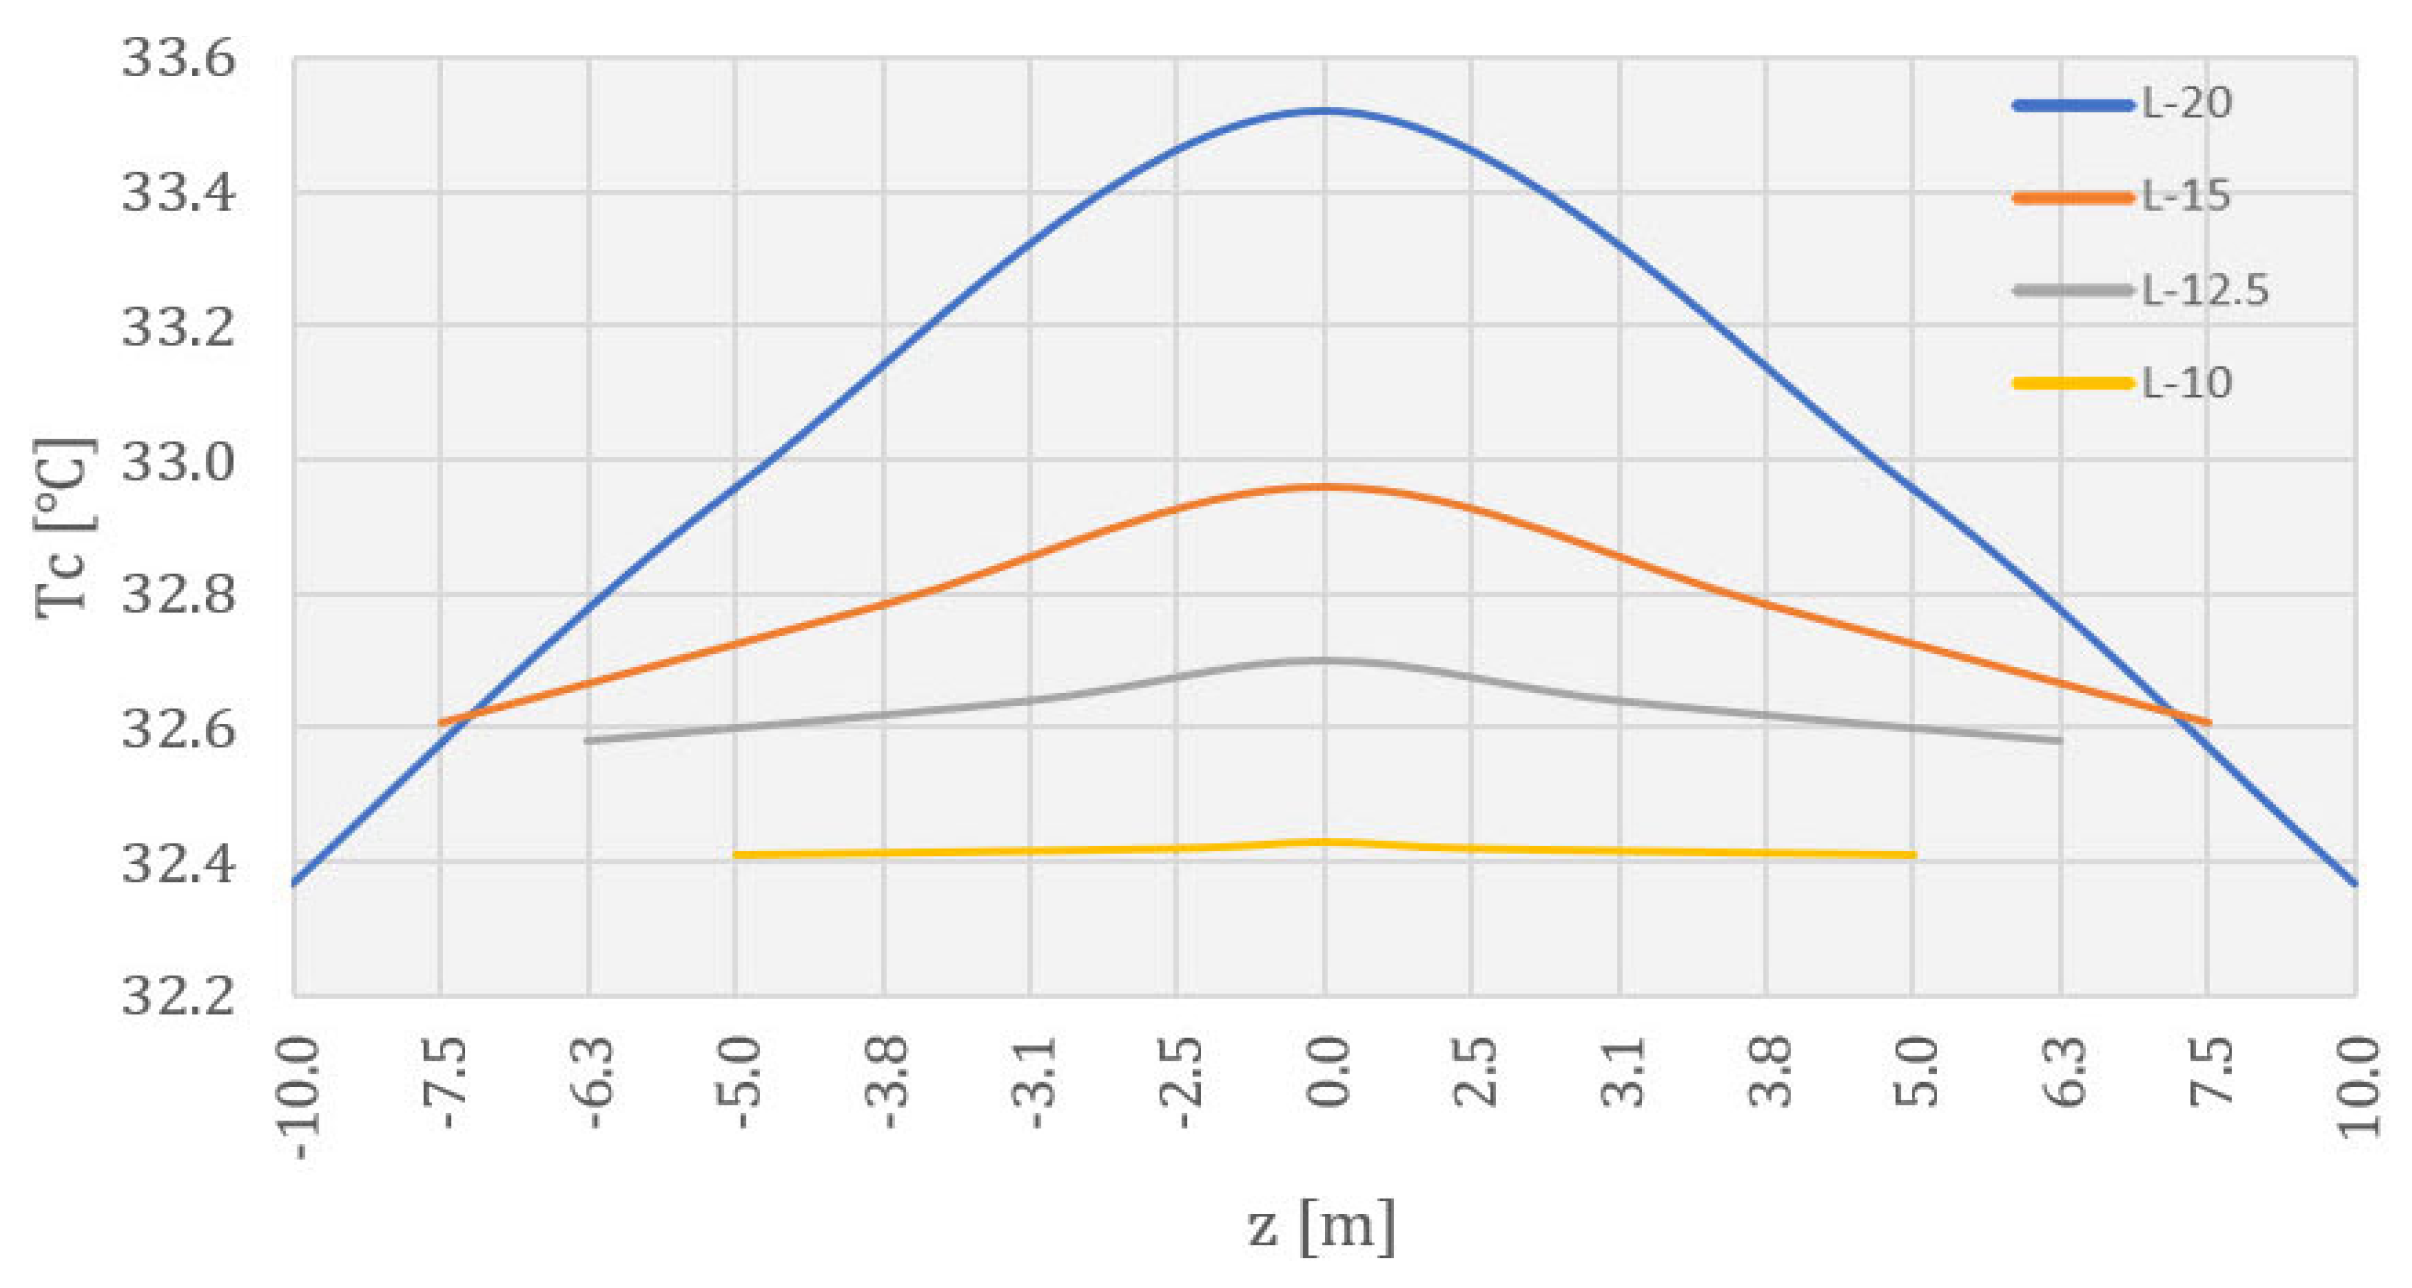
Figure 36, Figure 37 and Figure 38 show the temperature fields in selected horizontal cross-sections during the service life for all the considered monolith lengths: at 172.0 m ASL for the 1080th and 1505th days, and at 170.50 m ASL for the 1804th day. The position of these horizontal cross-sections was chosen so that they represent the zones with increased values of concrete temperatures, as well as changes in these temperatures with variations in the monolith length. The positions of transverse and longitudinal sections (upstream–downstream and towards the river banks, respectively) of the horizontal planes are marked with dashed lines, in which temperature changes with monolith length variations are shown.
Figure 39, Figure 40 and Figure 41 show diagrams of the concrete temperatures in a horizontal cross-section at 172.0 m ASL for the considered monolith lengths for the 1080th day from the beginning of construction. Based on the diagram, it can be concluded that the displayed temperatures decreased with a reduction in the monolith length, by a maximum of 0.2 °C when changing the monolith length from 20.0 m to 15.0 m, 0.3 °C when changing the monolith length from 20.0 m to 12.5 m, and 0.5 °C when changing the monolith length from 20.0 m to 10.0 m. The specified extreme values of the changes were located at the points of the maximum temperature values in the considered cross-section.
Figure 42, Figure 43 and Figure 44 show diagrams of the concrete temperatures in a horizontal cross-section at 172.0 m ASL for the considered monolith lengths for the 1505th day from the beginning of construction. Based on the diagram, it can be concluded that the displayed temperatures decreased with a reduction in the monolith length, by a maximum of 0.1 °C when changing the monolith length from 20.0 m to 15.0 m, 0.2 °C when changing the monolith length from 20.0 m to 12.5 m, and 0.5 °C when changing the monolith length from 20.0 m to 10.0 m. The specified extreme values of the changes were also located at the points of the maximum temperature values in the considered cross-section.
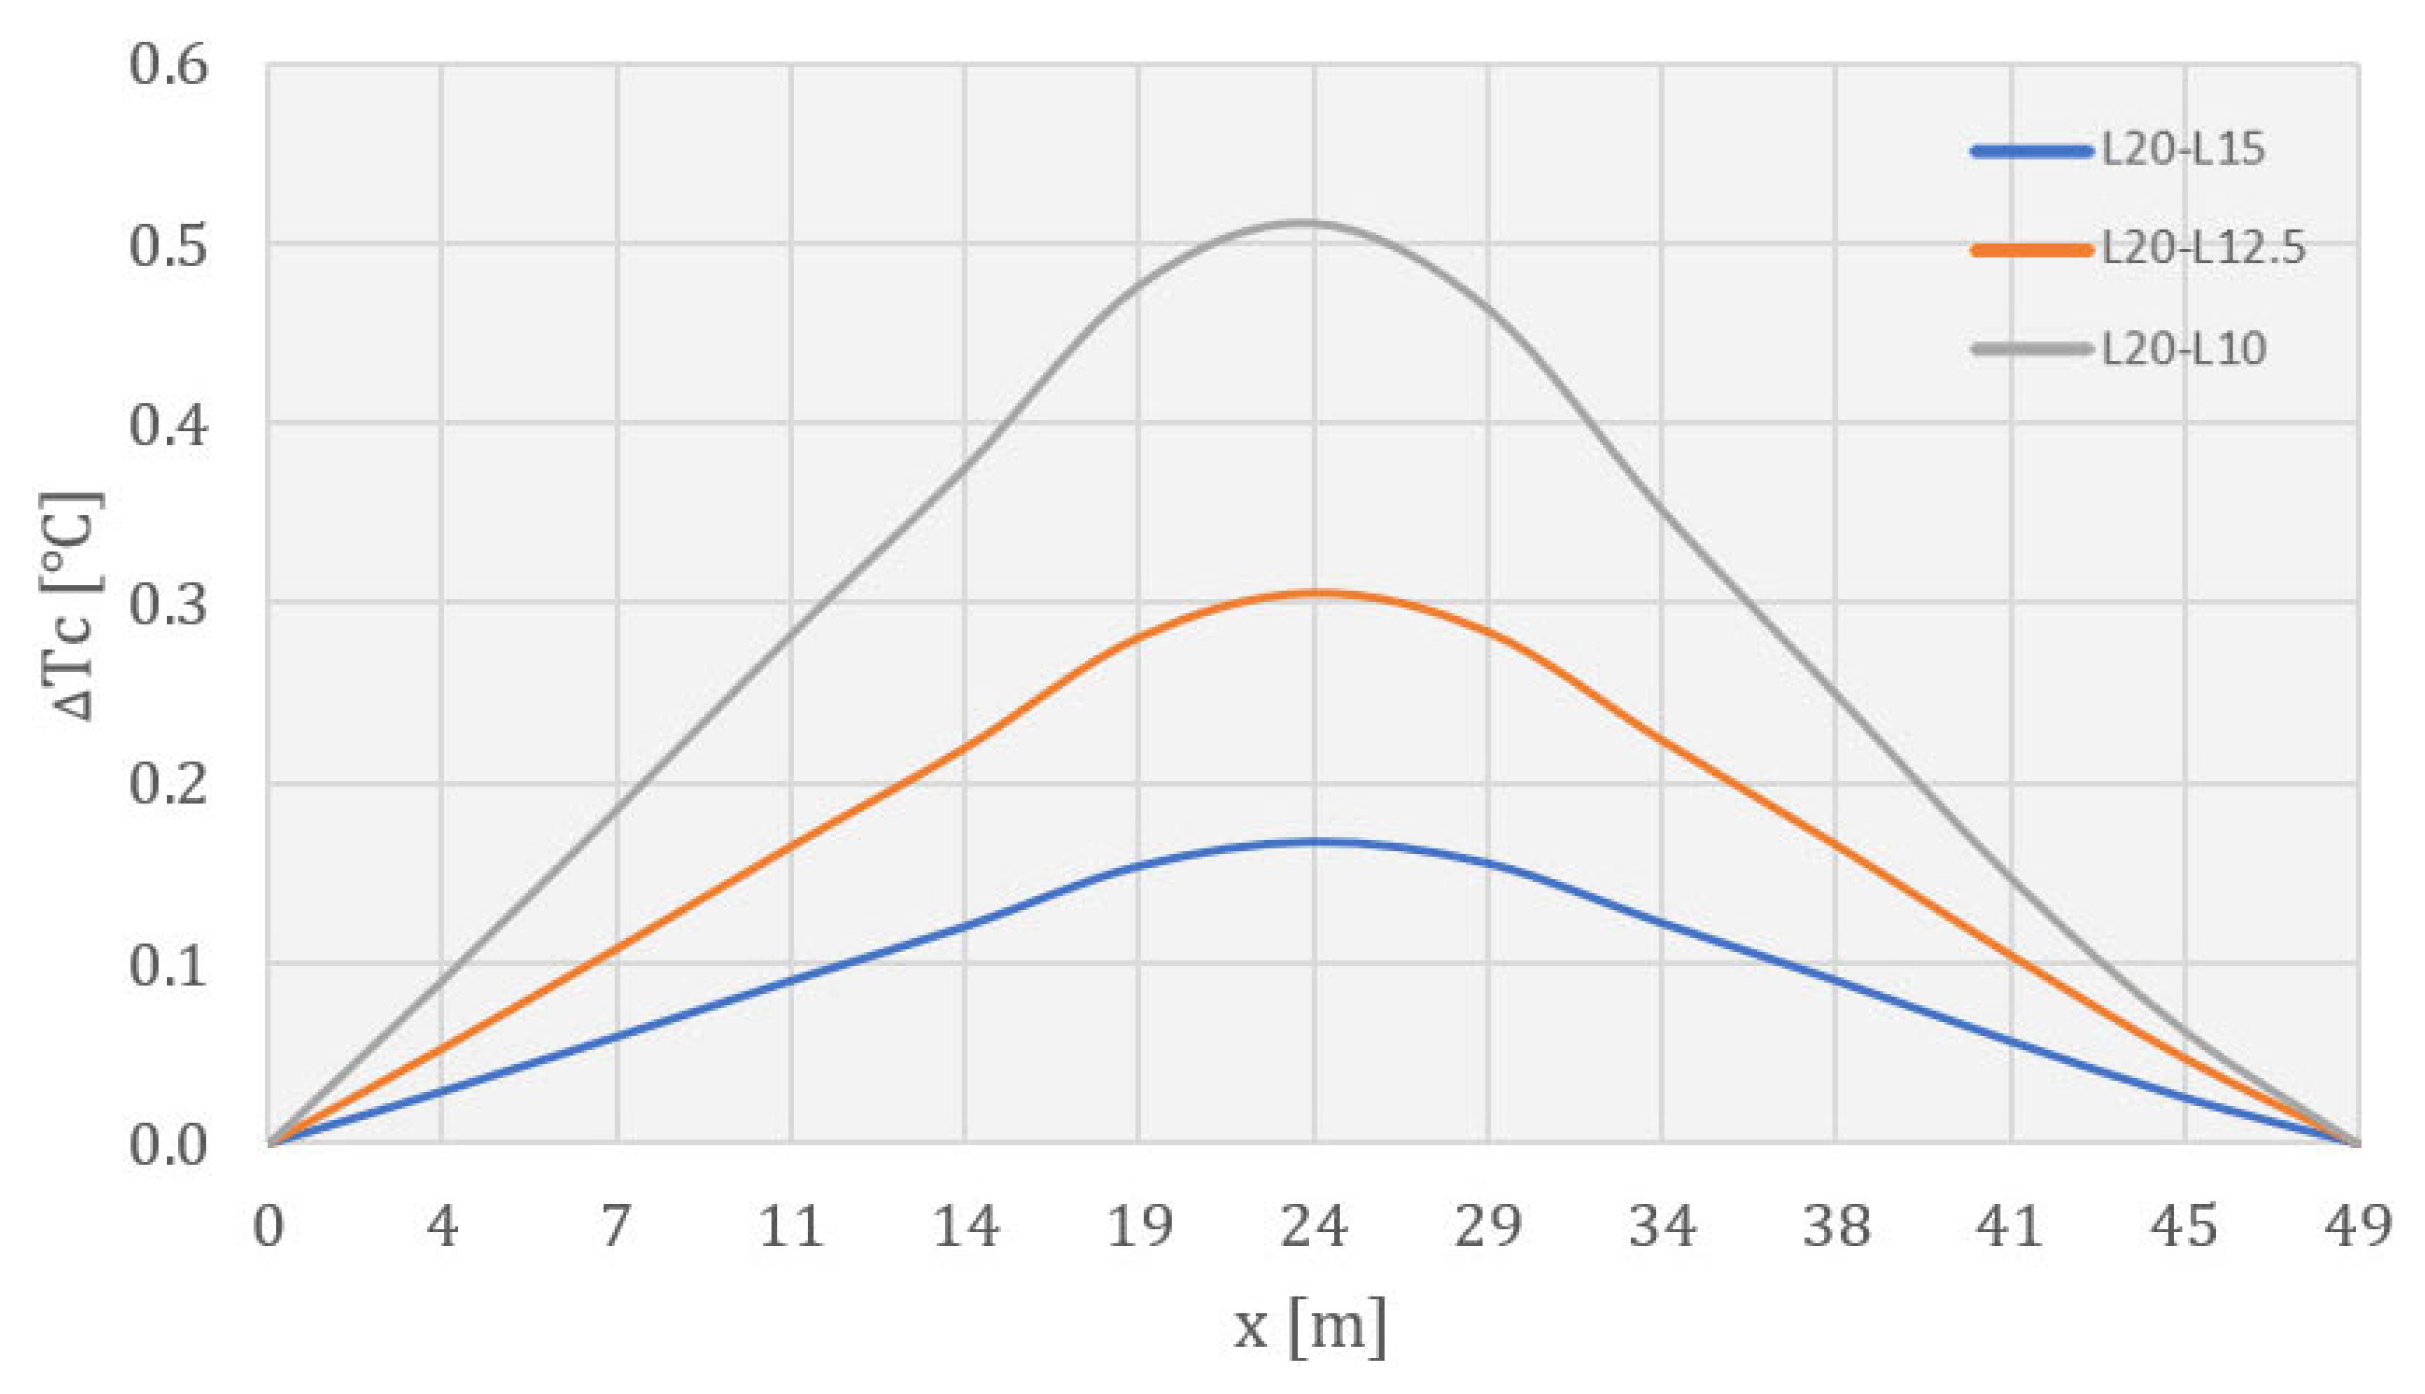
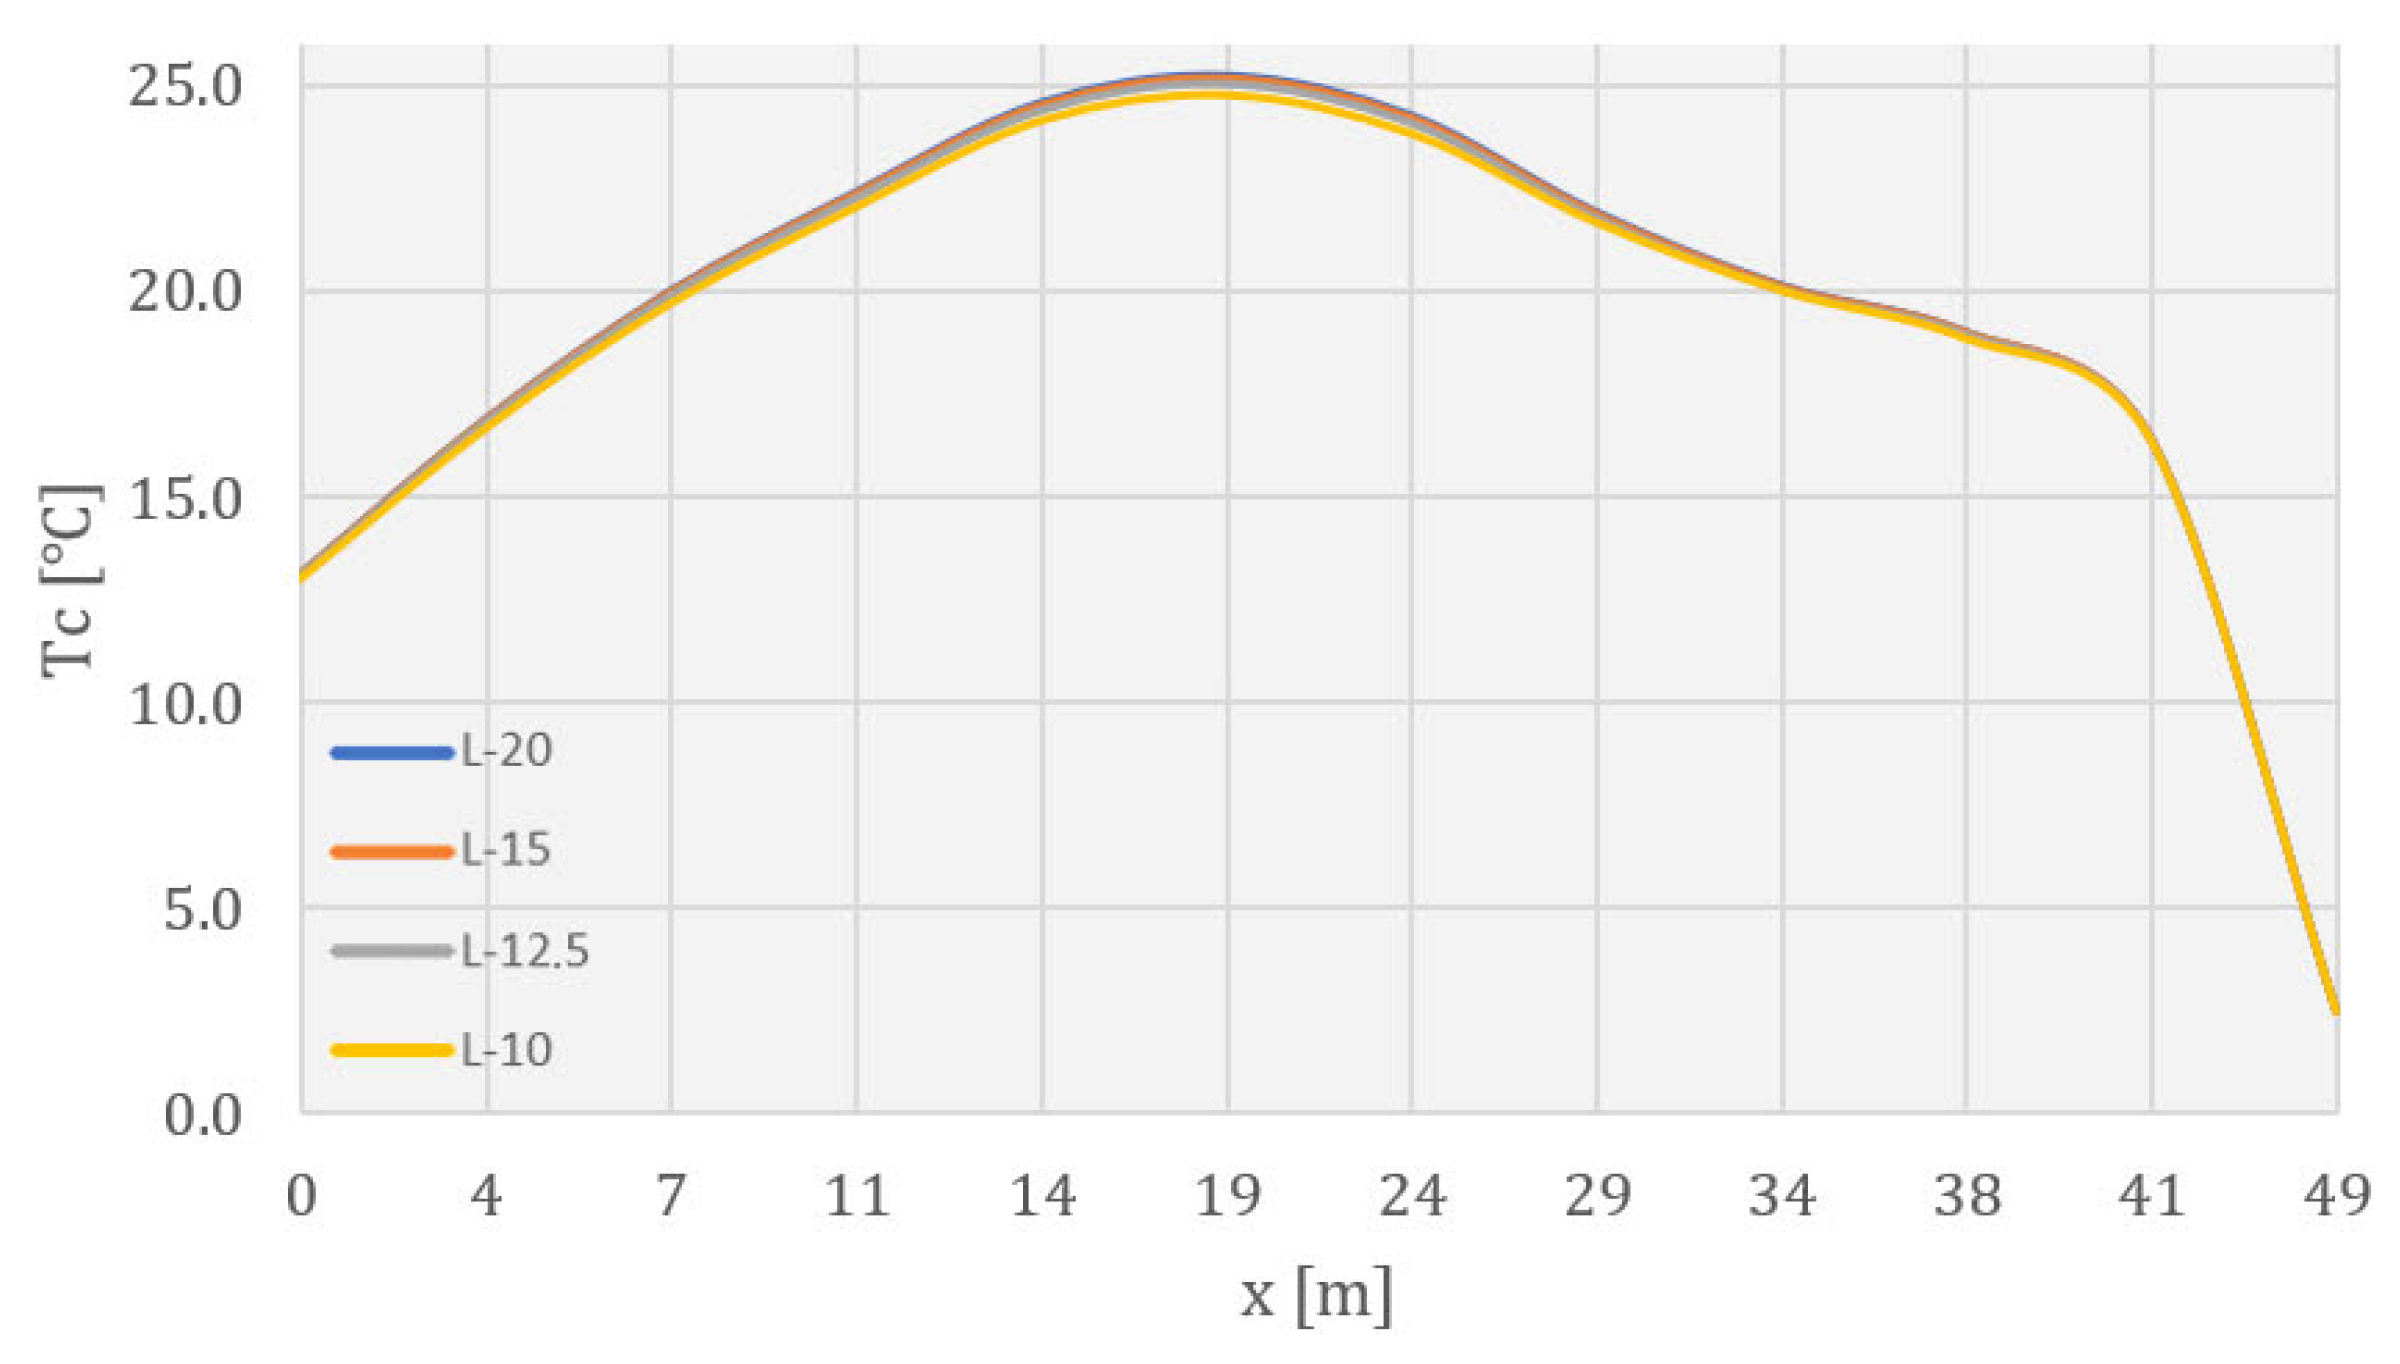
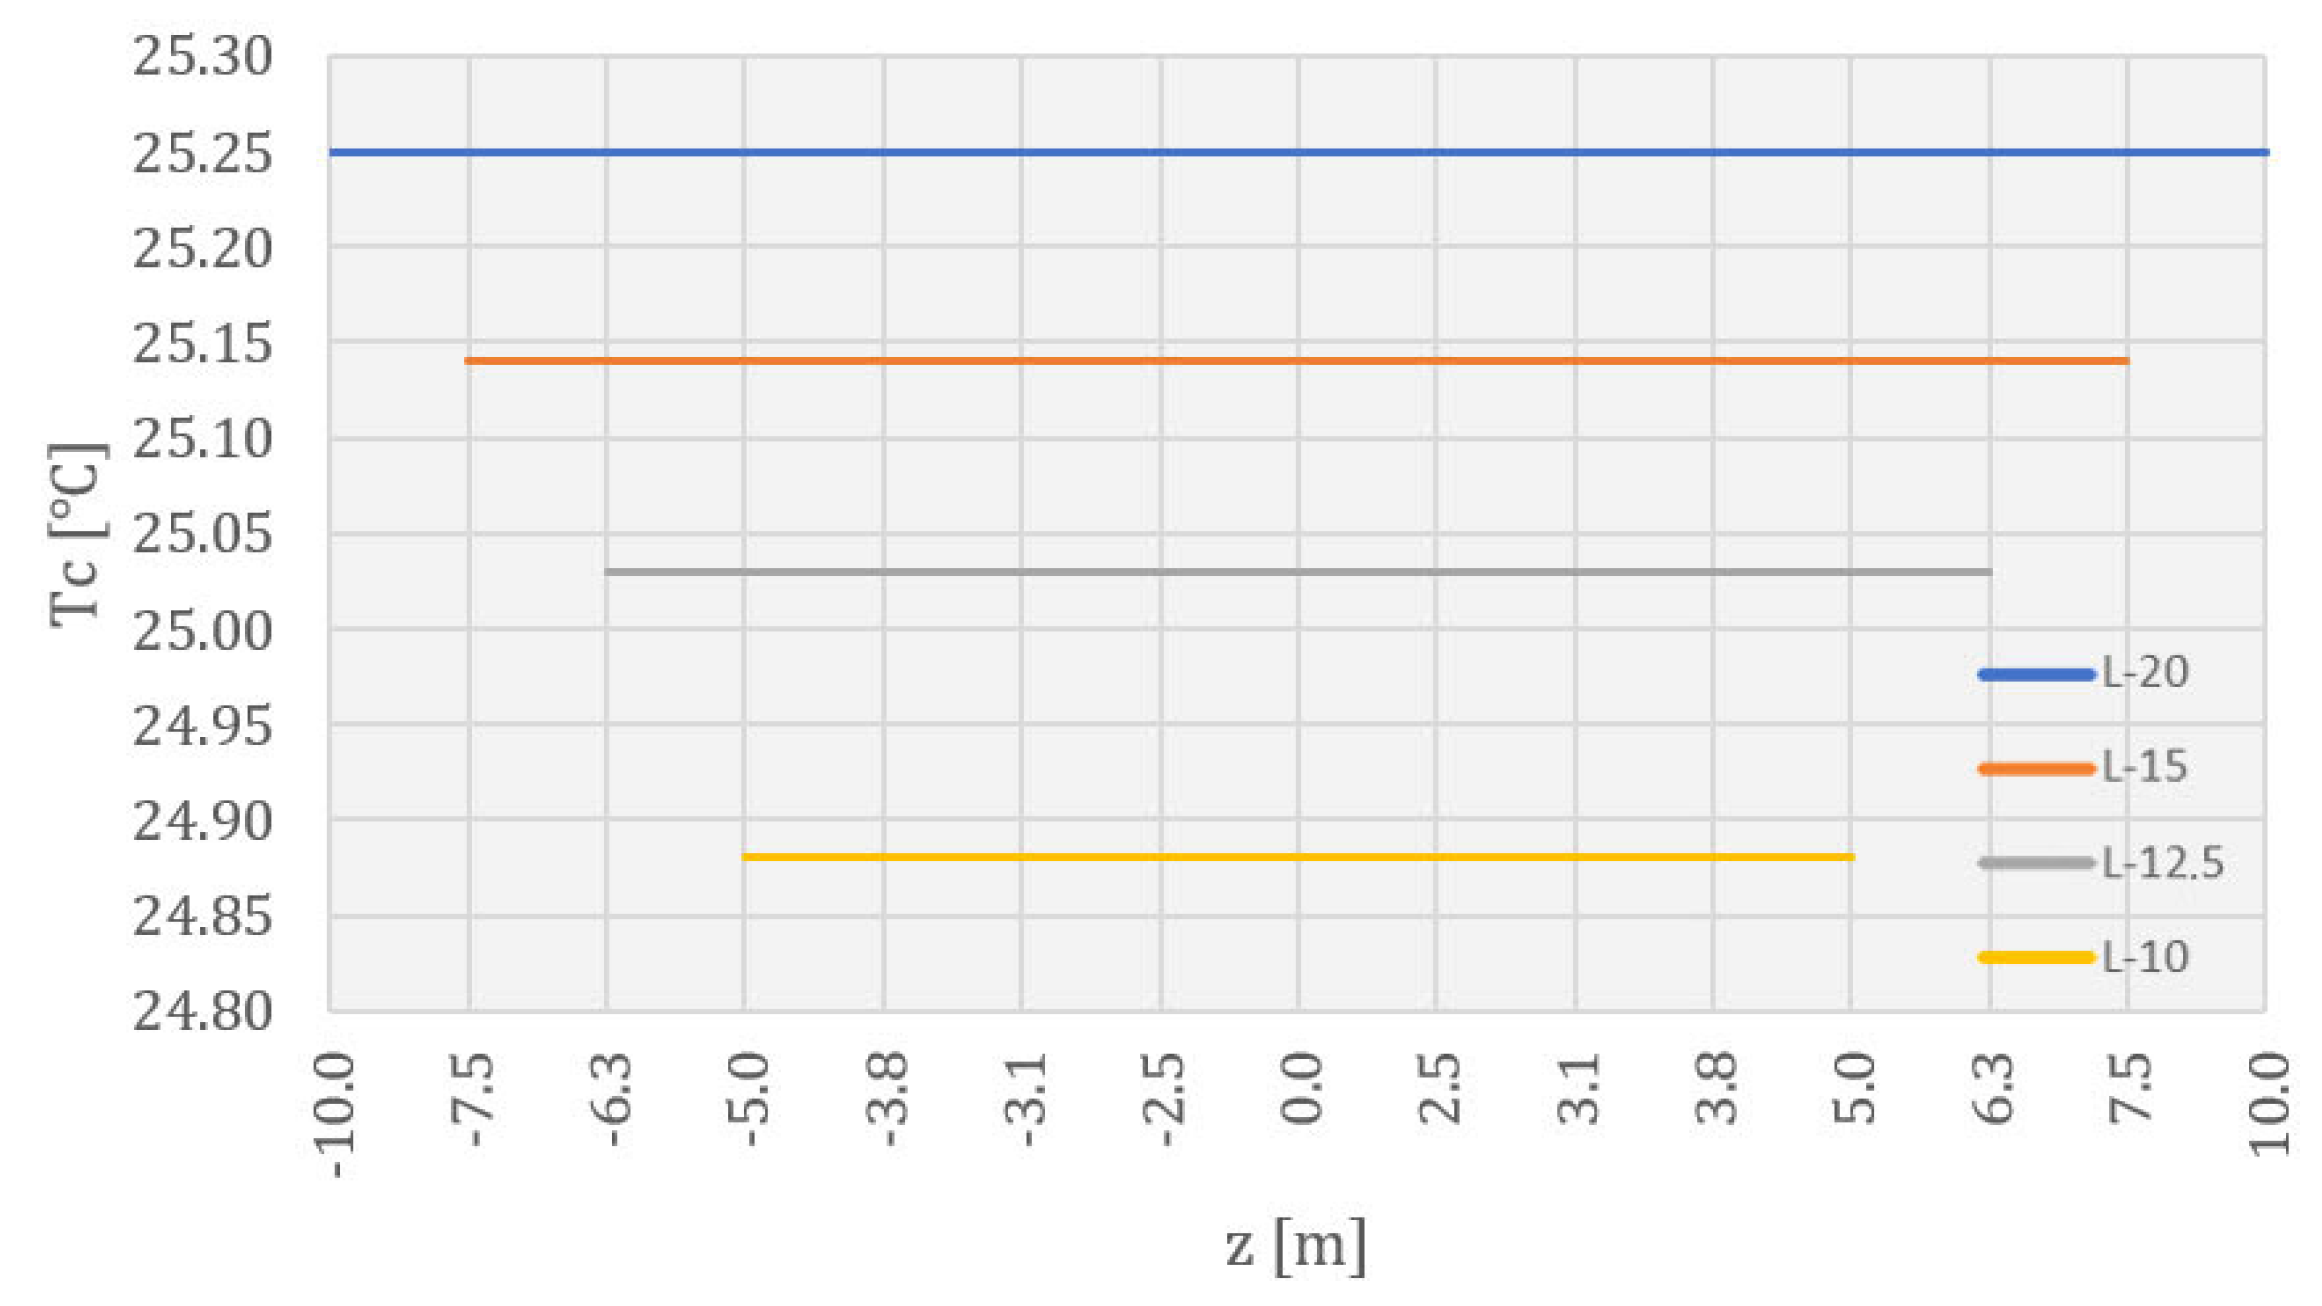
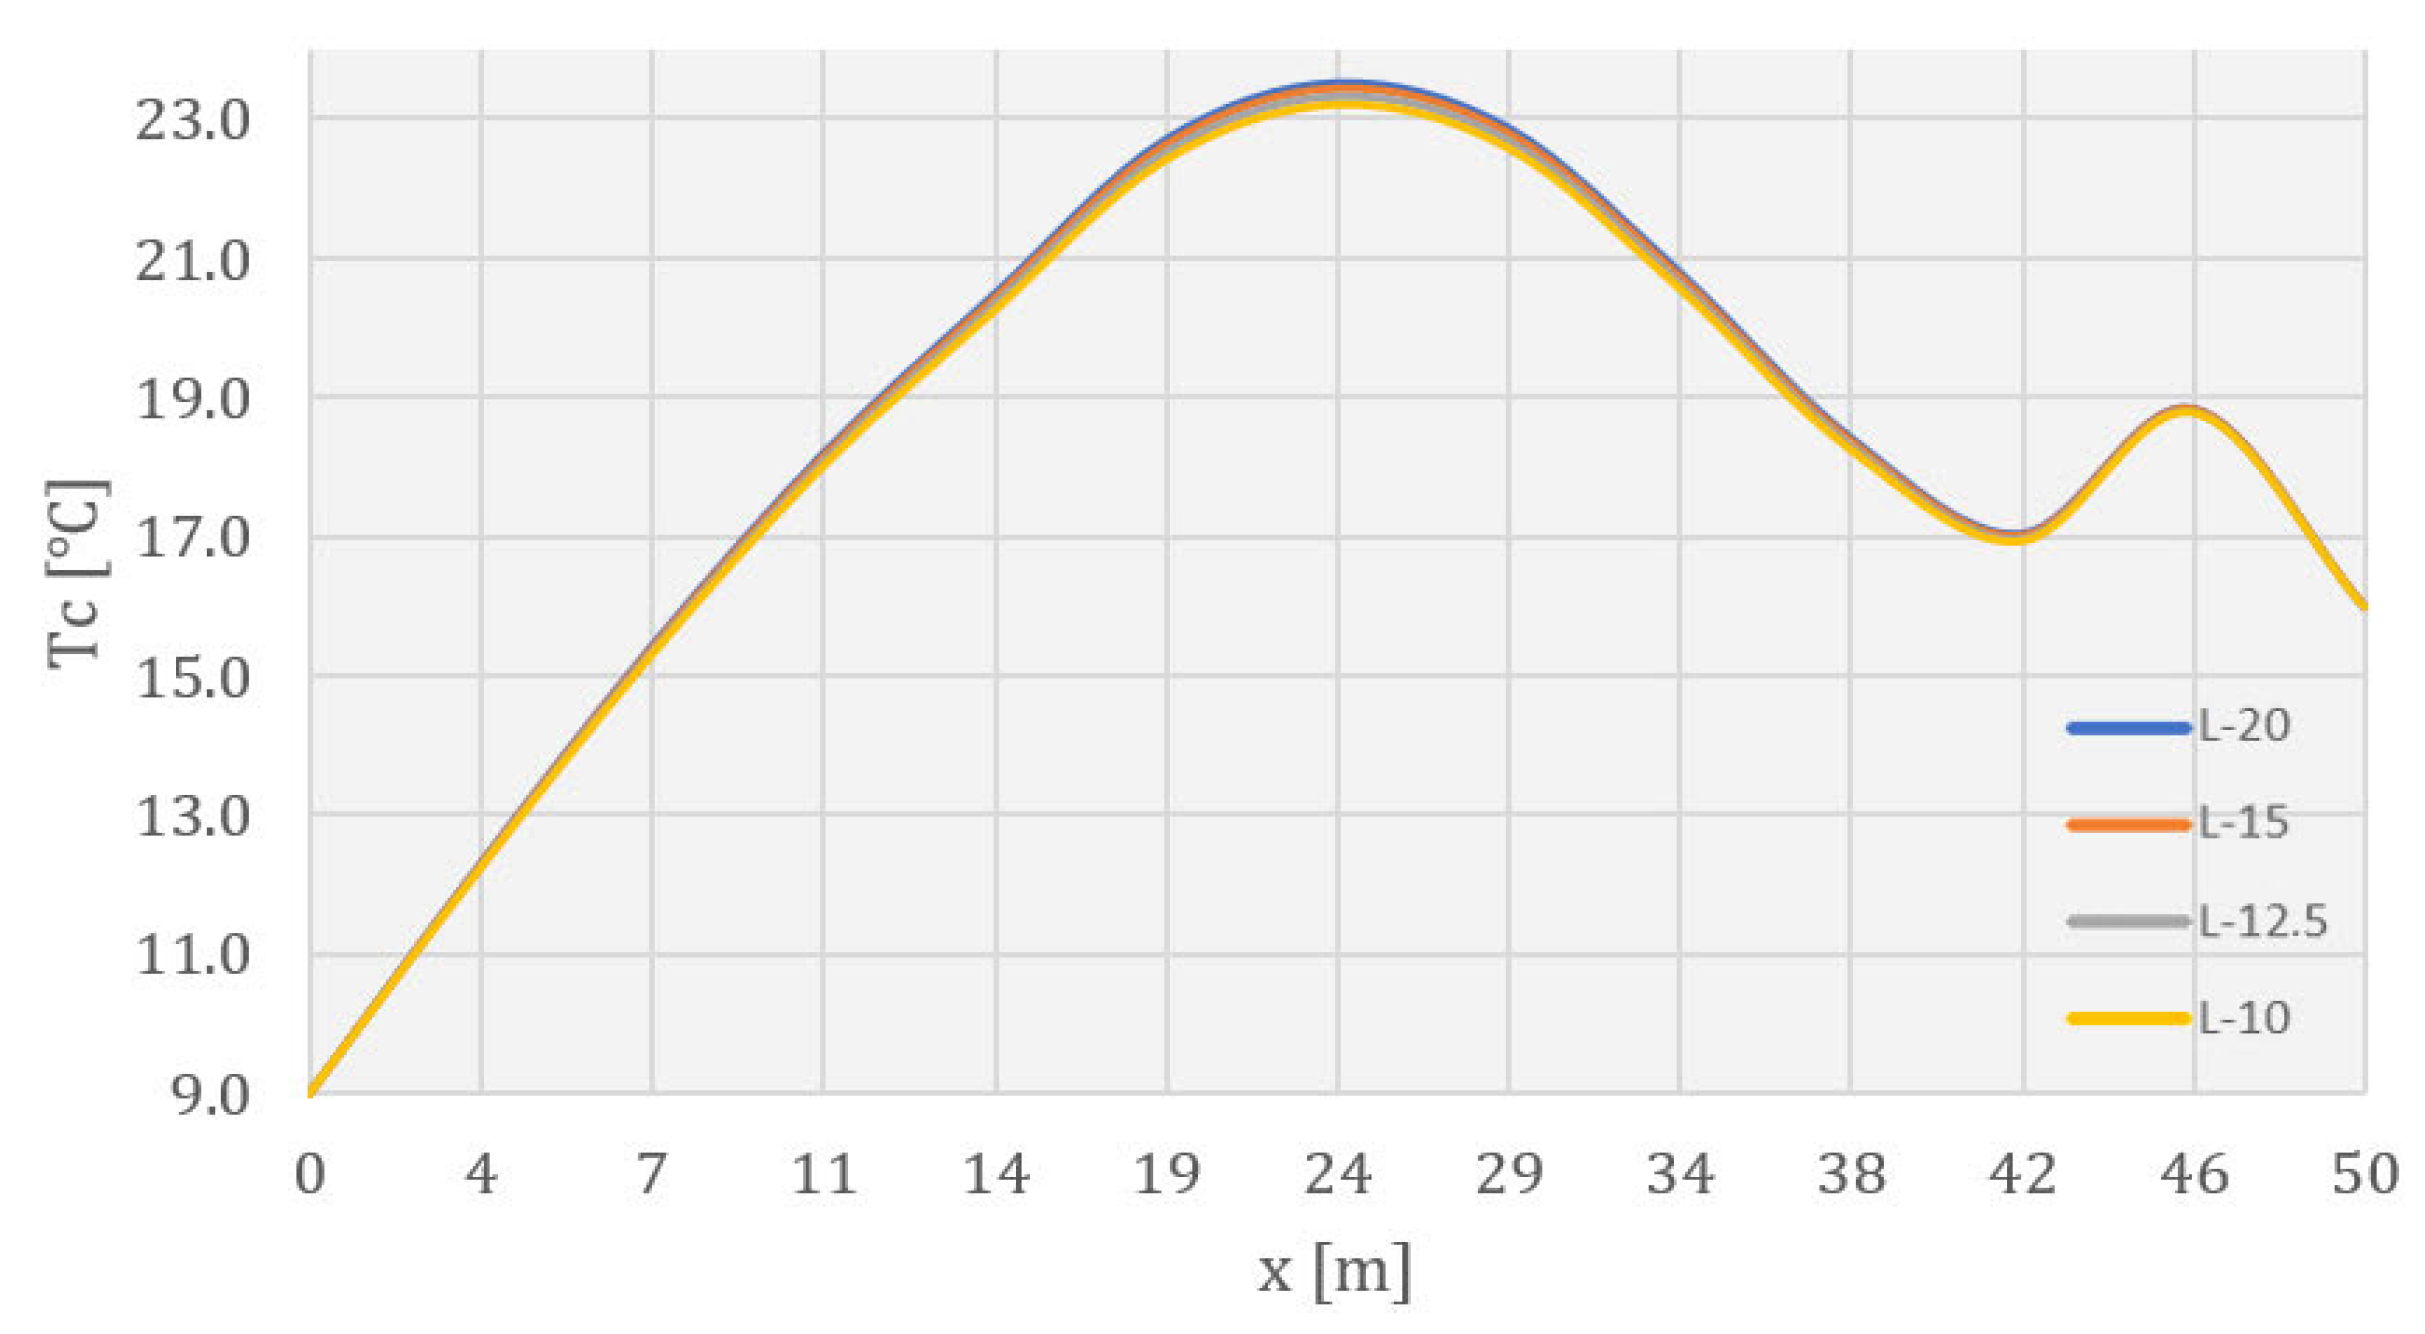
Figure 45, Figure 46 and Figure 47 show diagrams of the concrete temperatures in a horizontal cross-section at 170.50 m ASL for the considered monolith lengths for the 1804th day from the beginning of construction (the final calculation day). Again, the displayed temperatures decreased with a reduction in the monolith length, by a maximum of 0.1 °C when changing the monolith length from 20.0 m to 15.0 m, 0.2 °C when changing the monolith length from 20.0 m to 12.5 m, and 0.3 °C when changing the monolith length from 20.0 m to 10.0 m. As in the case of the previous two cross-sections, the specified extreme values of the changes were located at the points of the maximum temperature values in the considered cross-section.

5. Discussion

By analyzing previous research on the topic of thermal stress analyses of concrete dams, it was observed that the scope of the research on the monolith lengths of concrete gravity dams built using the block method is not wide enough. The problem of determining the monolith lengths has mainly been considered for gravity dams made of roller-compacted concrete (RCC).
This research was conducted with the use of a phase thermal analysis based on the finite element method. With the above, all the relevant thermal contour conditions were considered (those on the surfaces between the blocks and the rock mass, those on the surfaces between previously poured and newly poured blocks, those on the surfaces of the blocks that were in contact with water and air, and the initial temperature of the concrete mixture), as well as the concrete hydration process.
The conducted research describes, in more detail, the thermal behavior of the GBB, which was built using the block method during construction, the filling of the reservoir, and exploitation, and shows the influence of the monolith length (the distance between contraction joints) on the development of the temperature field.
Gravity dams are built in monoliths that enable the operation of the joint, which allows the thermal stresses to be relieved and prevents the formation of cracks. The length of the monolith, the dimensions of the blocks, and the schedule of concreting were determined in the past by experience instead of by conducting a complex thermal stress analysis.
The results of the conducted analysis improve the understanding of the thermal processes (which affect the development of thermal tension stresses) in concrete gravity dams, which could influence design decisions in order to increase the durability and reliability of these massive hydrotechnical objects. After concreting a block, it heats up due to the release of the heat of hydration. The heating of the concrete can be additionally supported by extremely high air temperatures for a long period of time. Subsequently, in the concrete-cooling process, which is evident in the results shown for both the construction process and the exploitation process, cracks may appear as a consequence of the volume-shrinkage process.
The presented results also show a significant sensitivity of the temperature field to changes in the value of the monolith length.
The above indicates the importance of controlling the temperature of the concrete (by carrying out measures during preparation as well as after pouring) under conditions of extreme temperatures, as well as the importance of choosing an adequate length for the monolith.
In order to develop complete insight into the thermal stress behavior of the structure, a stress-deformation analysis of the developed models should be conducted.
The disadvantages of the developed model are reflected in the omission of the dependence of the thermal and mechanical properties of the material on the temperature and the validation of the model by comparison with real temperature measurement data for the concrete during the construction and exploitation phases of the structure (it was not possible to implement it due to a change in the construction method).
Variations in the block layout, the duration of concreting, the dependence of material thermal properties on the temperature and moisture content, the influence of solar radiation, and the use of pipe systems for cooling and curing concrete during construction can be considered comprehensive guidelines for improving the presented research or for further research.
The developed models can, with the application of multiple calculations, enable a sensitivity analysis of the used parameters and the use of a larger number of control nodes, and they can also provide more accurate calculation results and even better insight into the thermal behavior of these structures.

6. Conclusions

As part of this research, an extensive long-term numerical thermal analysis of a non-overflow monolith of a 95.0 m high concrete gravity dam, built using the block method, was carried out, taking into account the realistic initial and boundary conditions for the period of construction, the filling of the reservoir, and the service, for a total duration of about 5 years.
The main contribution of the conducted research is the analysis of the maximum values of concrete temperatures in a monolith, as well as changes in these values depending on the monolith length reduction.
The obtained results show that, for the node in the central monolith zone, the extreme values of the temperature changed to 1.1 °C when changing the monolith length from 20.0 m to 15.0 m, 1.8 °C when changing the monolith length from 20.0 m to 12.5 m, and 2.6 °C when changing the monolith length from 20.0 m to 10.0 m. For the node above the central monolith zone, closer to the downstream face, the extreme values of the temperature change were as follows: 1.5 °C when changing the monolith length from 20.0 m to 15.0 m, 2.4 °C when changing the monolith length from 20.0 m to 12.5 m, and 3.4 °C when changing the monolith length from 20.0 m to 10.0 m. Finally, for the node in the crest of the dam, the extreme values of the temperature change were as follows: 0.5 °C when changing the monolith length from 20.0 m to 15.0 m, 0.9 °C when changing the monolith length from 20.0 m to 12.5 m, and 1.6 °C when changing the monolith length from 20.0 m to 10.0 m.
The general conclusions of this research could be applied to other massive concrete structures, but, considering the different possible geometries of these constructions and the different possible climatic conditions in which they are located, a separate thermal analysis should be carried out for each one.

Author Contributions

Numerical analysis and presentation of results, U.M. and V.K.; conceptualization, supervision, and methodology, V.K., U.M. and G.T.; writing, U.M., V.K. and G.T. All authors have read and agreed to the published version of the manuscript.

Funding

The second and third authors acknowledge the partial funding of this research by the Ministry of Science, Technological Development and Innovation of the Republic of Serbia, through Project No. 200092.

Data Availability Statement

The original contributions presented in the study are included in the article, further inquiries can be directed to the corresponding author.

Conflicts of Interest

The authors declare no conflicts of interest.

References

  1. Malm, R. Guideline for FE Analyses of Concrete Dams; Energiforsk: Stockholm, Sweden, 2016. [Google Scholar]
  2. Ishikawa, M. Thermal stress analysis of a concrete dam. Comput. Struct. 1991, 40, 347–352. [Google Scholar] [CrossRef]
  3. Léger, P.; Venturelli, J.; Bhattacharjee, S.S. Seasonal temperature and stress distributions in concrete gravity dams. Part 1: Modeling. Can. J. Civ. Eng. 1993, 20, 999–1017. [Google Scholar] [CrossRef]
  4. Léger, P.; Venturelli, J.; Bhattacharjee, S.S. Seasonal temperature and stress distributions in concrete gravity dams. Part 2: Behavior. Can. J. Civ. Eng. 1993, 20, 1018–1029. [Google Scholar] [CrossRef]
  5. Daoud, M.; Galanis, N.; Ballivy, G. Calculation of the periodic temperature field in a concrete dam. Can. J. Civ. Eng. 1997, 24, 772–784. [Google Scholar] [CrossRef]
  6. Ganelli, F.; Beko, A.; Mordini, A. Structural assessment of the Mignano solid-gravity dam based on the monitoring data. Struct. Eng. Int. 2012, 22, 130–138. [Google Scholar] [CrossRef]
  7. Embaby, R.A.; Abdelrahman, A.A.; Sayed-Ahmed, E.Y. Concrete gravity dams: Coupled thermal-stress numerical analysis. In IABSE Symposium Report, Proceedings of the International Association for Bridge and Structural Engineering, Madrid, Spain, 3–5 September 2014; Taylor & Francis: Boca Raton, FL, USA, 2014; Volume 102, pp. 467–474. [Google Scholar]
  8. Sayed-Ahmed, E.Y.; Abdelrahman, A.A.; Embaby, R.A. Concrete dams: Thermal-stress and construction stage analysis. Dams Reserv. 2018, 28, 12–30. [Google Scholar] [CrossRef]
  9. Ayotte, E.; Massicotte, B.; Houde, J.; Gocevski, V. Modeling the thermal stresses at early ages in a concrete monolith. ACI Mater. J. 1997, 94, 577–587. [Google Scholar]
  10. Cervera, M.; Oliver, J.; Prato, T. Simulation of construction of RCC dams-I: Temperature and aging. J. Struct. Eng. 2000, 126, 1053–1061. [Google Scholar] [CrossRef]
  11. Cervera, M.; Oliver, J.; Prato, T. Simulation of construction of RCC dams- II: Stress and damage. J. Struct. Eng. 2000, 126, 1062–1069. [Google Scholar] [CrossRef]
  12. Luna, R.; Wu, Y. Simulation of temperature and stress fields during RCC dam construction. J. Constr. Eng. Manag. 2000, 126, 381–388. [Google Scholar] [CrossRef]
  13. Amberg, F. Thermal analysis of a RCC dam during construction. In Proceedings of the 7th International Benchmark Workshop on Numerical Analysis of Dams, Bucharest, Romania, 24–26 September 2003. [Google Scholar]
  14. Waleed, A.M.; Jaafar, M.S.; Noorzaei, J.; Bayagoob, K.H.; Amini, R. Effect of Placement Schedule on the Thermal and Structural Response of R CC Dams, Using Finite Element Analysis. In Geo Jordan 2004, Proceedings of the Advances in Geotechnical Engineering with Emphasis on Dams, Highway Materials, and Soil Improvement Conference, Irbid, Jordan, 12–15 July 2004; ASCE Library: Lawrence, KS, USA, 2004; pp. 94–104. [Google Scholar]
  15. Malkawi, A.; Mutasher, S.; Qiu, T. Thermal-structural modeling and temperature control of roller compacted concrete gravity dam. Perform. Constr. Facil. 2003, 17, 177–187. [Google Scholar] [CrossRef]
  16. Zhang, X.F.; Li, S.Y.; Li, Y.L.; Ge, Y.; Li, H. Effect of superficial insulation on roller-compacted concrete dams in cold regions. Adv. Eng. Softw. 2011, 42, 939–943. [Google Scholar] [CrossRef]
  17. Kurian, T.; Kavitha, P.E.; Kuriakose, B. Numerical analysis of temperature distribution across the cross section of a concrete dam during early ages. Am. J. Eng. Res. (AJER) 2013, 1, 26–31. [Google Scholar]
  18. Kuzmanović, V.; Savić, L.; Mladenović, N. Computation of Thermal-Stresses and Contraction Joint Distance of RCC Dams. J. Therm. Stresses 2013, 36, 112–134. [Google Scholar] [CrossRef]
  19. Kuzmanović, V.; Savić, L.; Mladenović, N. Thermal-stress behaviour of RCC gravity dams. FME Trans. 2015, 43, 30–34. [Google Scholar] [CrossRef]
  20. Mirković, U.; Kuzmanović, V.; Todorović, G. Long-Term Thermal Stress Analysis and Optimization of Contraction Joint Distance of Concrete Gravity Dams. Appl. Sci. 2022, 12, 8163. [Google Scholar] [CrossRef]
  21. Zhang, Y.; Pan, J.; Sun, X.; Feng, J.; Sheng, D.; Wang, H.; Zhou, X.; He, Y.; Diao, M.; Zhan, Q. Simulation of thermal stress and control measures for rock-filled concrete dam in high-altitude and cold regions. Eng. Struct. 2021, 230, 111721. [Google Scholar] [CrossRef]
  22. Ijaz, N.; Weimin, Y.E.; ur Rehman, Z.; Ijaz, Z.; Junaid, M.F. Global insights into micro-macro mechanisms and environmental implications of limestone calcined clay cement (LC3) for sustainable construction applications. Sci. Total Environ. 2023, 907, 167794. [Google Scholar] [CrossRef] [PubMed]
  23. ACI. Manual of Concrete Practice. Part 1; American Concrete Institute: Detroit, MI, USA, 1981. [Google Scholar]
  24. Cervera, M.; Oliver, J.; Prato, T. Thermo-chemo-mechanical model for concrete. I: Hydration and aging. J. Eng. Mech. 1999, 125, 1018–1027. [Google Scholar] [CrossRef]
  25. Schindler, A.K.; Folliard, K.J. Influence of supplementary cementing materials on the heat of hydration of concrete. In Proceedings of the Advances in Cement and Concrete IX Conference, Copper Mountain Conference Resort in Colorado, Copper Mountain, CO, USA, 10–14 August 2003. [Google Scholar]
  26. Petrović, P. Hidrotehničke Konstrukcije, Drugi Deo; Građevinski Fakultet: Beograd, Srbija, 2002. [Google Scholar]
  27. Kim, S.G.; Wang, K. Effect of heat generation from cement hydration on mass concrete placement. Masters Abstr. Int. 2010, 49, 3. [Google Scholar]
  28. Ponce-Farfán, C.; Santillán, D.; Toledo, M.Á. Thermal Simulation of Rolled Concrete Dams: Influence of the Hydration Model and the Environmental Actions on the Thermal Field. Water 2020, 12, 858. [Google Scholar] [CrossRef]
  29. Bofang, Z. Prediction of Water Temperature in Deep Reservoirs. Dam Eng. 1997, 8, 13–25. [Google Scholar]
  30. Mirković, U.; Ivanović, J.; Pavić, M.; Radovanović, S.; Mirković, N.; Gospavić, R.; Todorović, G. A method of determining parameters of Bofang model on the example of “Bileca” reservoir. In Proceedings of the Zbornik Radova 7. Međunarodne Konferencije-Savremena Dostignuća u Građevinarstvu, Subotica, Serbia, 23–24 April 2019; pp. 695–705. [Google Scholar]
  31. Kuzmanović, V. Thermal-Stress Analysis of Roller Compacted Concrete Dams. Ph.D. Thesis, Faculty of Civil Engineering, University of Belgrade, Beograd, Serbia, 2007. [Google Scholar]
  32. Malcolm Dunstan & Associates. Available online: https://rccdams.co.uk/dams/platanovryssi (accessed on 1 March 2022).
  33. LUSAS. Available online: https://www.lusas.com (accessed on 1 March 2022).
  34. Platanovryssi Hydroelectric Project. Measurement Results; Public Power Corporation: Athens, Greece, 2004. [Google Scholar]
  35. Sheibany, F.; Ghaemian, M. Effects of environmental action on thermal stress analysis of Karaj concrete arch dam. J. Eng. Mech. 2006, 132, 532–544. [Google Scholar] [CrossRef]
  36. Bofang, Z. Introduction. In Thermal Stresses and Temperature Control of Mass Concrete; Butterworth-Heinemann: Oxford, UK, 2014; pp. 1–10. [Google Scholar] [CrossRef]
  37. Bofang, Z. Precooling and Surface Cooling of Mass Concrete. In Thermal Stresses and Temperature Control of Mass Concrete; Butterworth-Heinemann: Oxford, UK, 2014; pp. 401–408. [Google Scholar] [CrossRef]
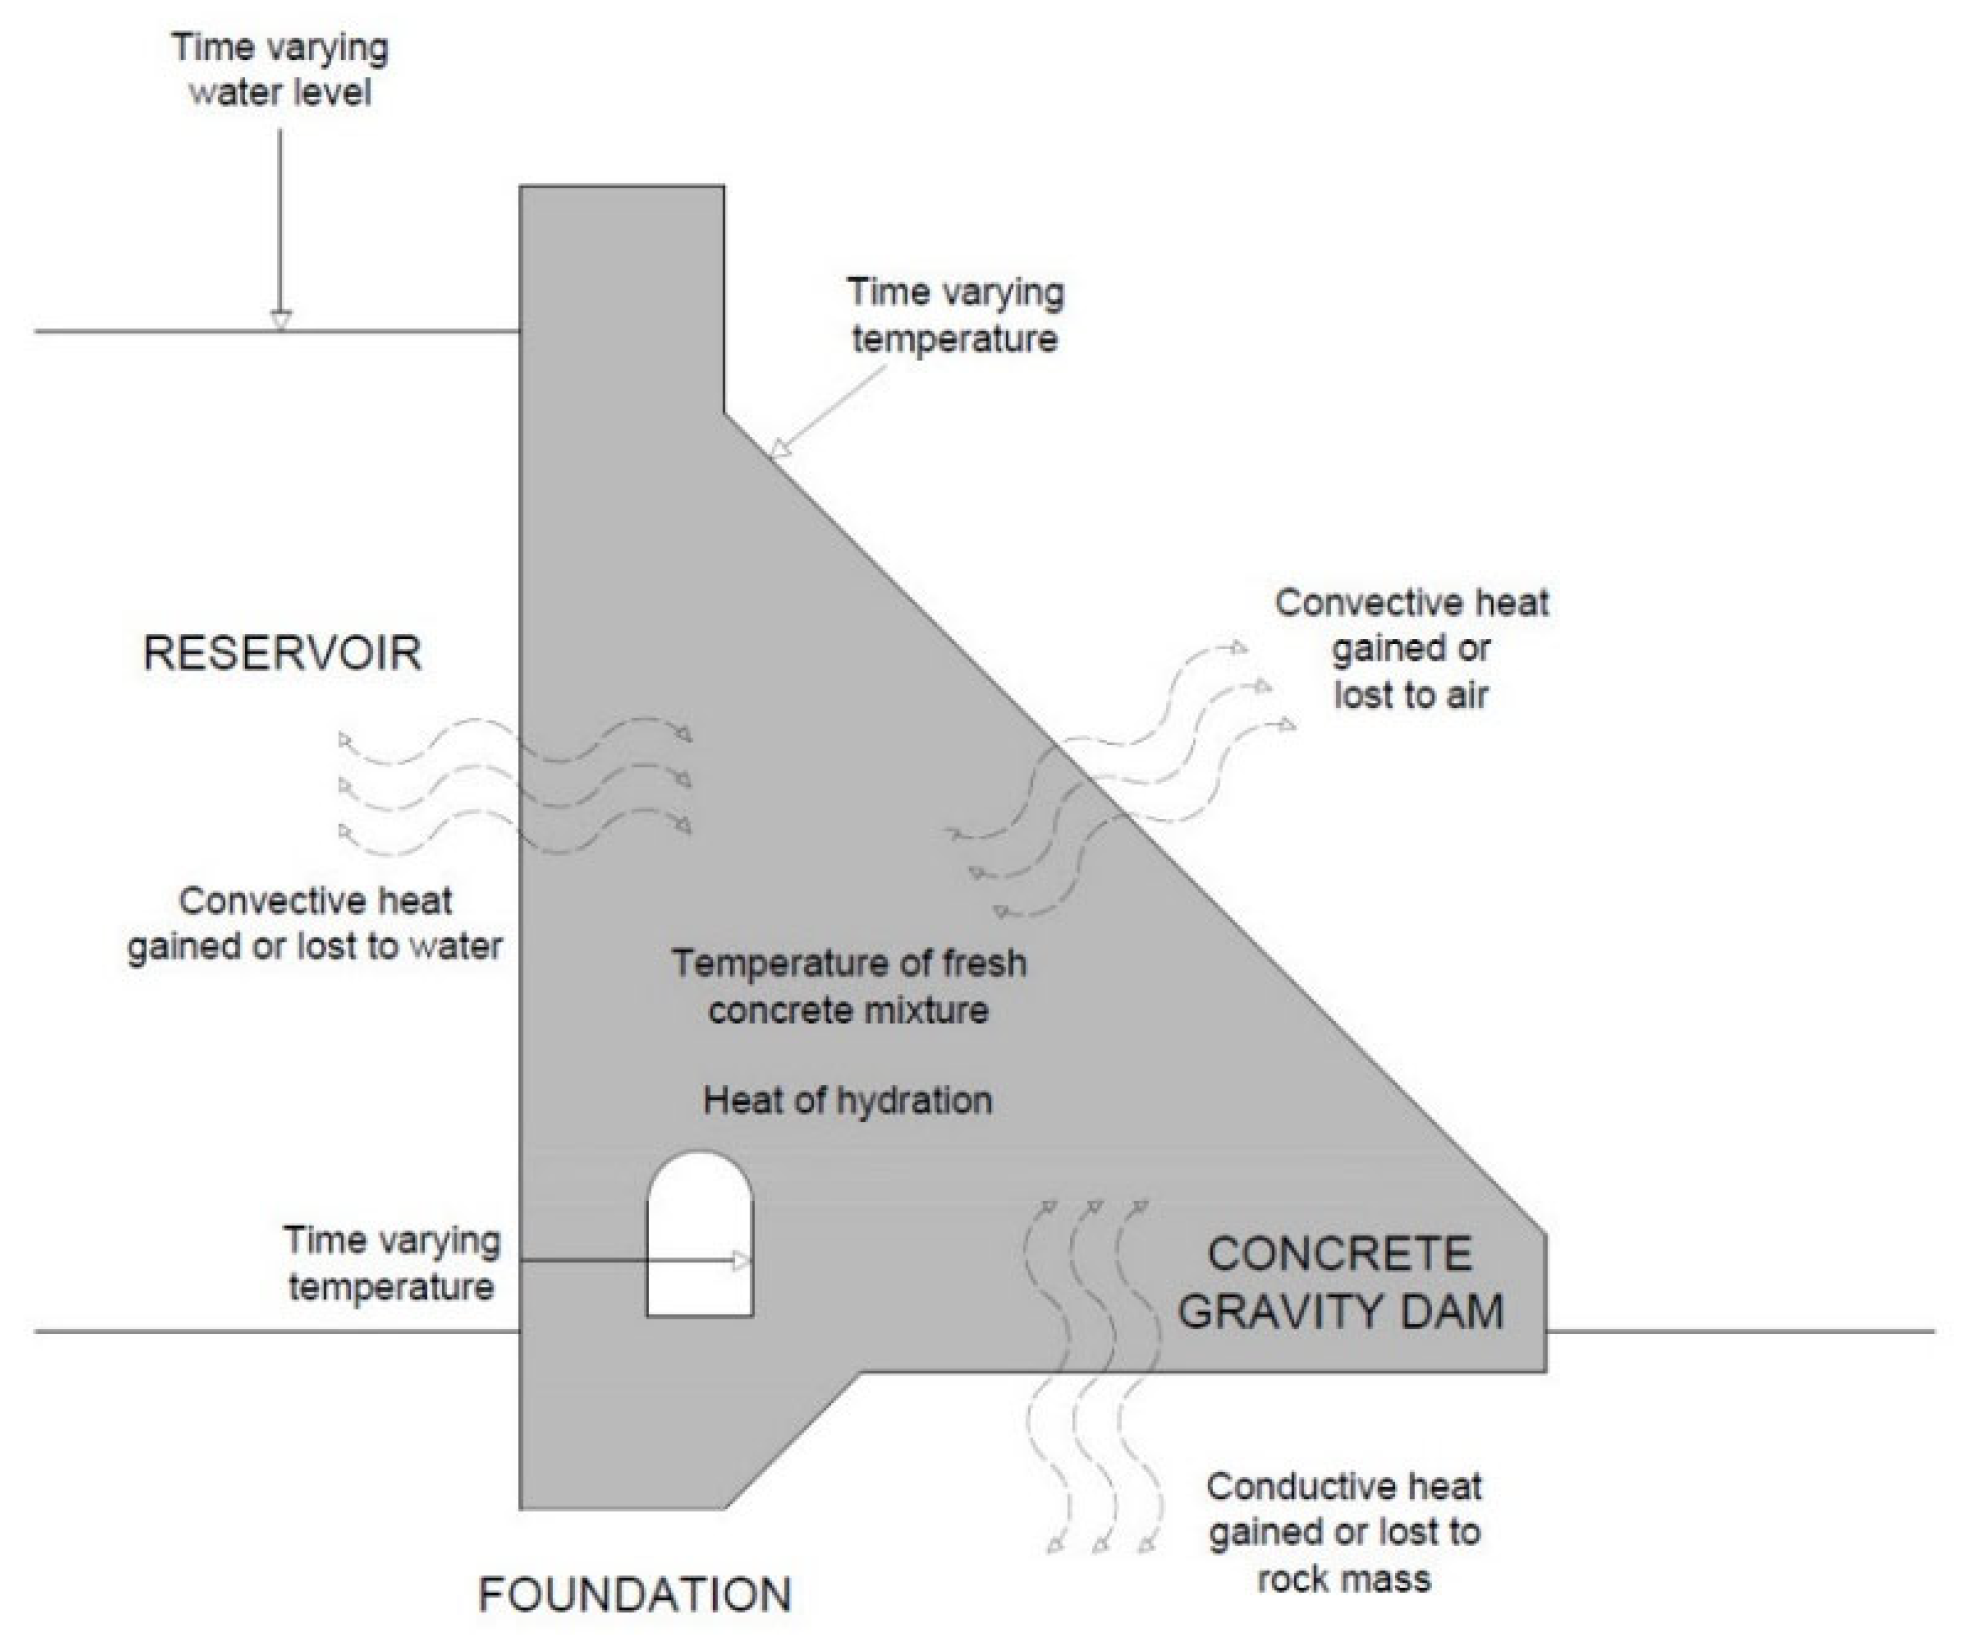
Figure 1. Heat-transfer processes presented in this paper.
Applsci 14 03248 g001
Figure 2. (A) The FEM model of the monolith with the surrounding rock mass; (B) the hexahedral finite element used for monolith mesh generation.
Applsci 14 03248 g002
Figure 3. Blocks in the numerical model (the numbers indicate the sequence of concreting) [20].
Applsci 14 03248 g003
Figure 4. The boundary condition allowing for heat transfer on the contact surfaces of the blocks with the rock mass and the previously cast blocks (the concreting of the block was not shifted).
Applsci 14 03248 g004
Figure 5. The boundary condition allowing for heat transfer on the contact surfaces of the blocks with the previously cast blocks (shifted concreting).
Applsci 14 03248 g005
Figure 6. The boundary condition for the surfaces of one block in contact with air (the concreting of the block was not shifted).
Applsci 14 03248 g006
Figure 7. The boundary condition for the surfaces of one block in contact with air (shifted concreting).
Applsci 14 03248 g007
Figure 8. Distinctive control nodes of the model in the mid-plane of the monolith.
Applsci 14 03248 g008
Figure 9. Concrete temperature (°C) in node 2787 (upstream face).
Applsci 14 03248 g009
Figure 10. Concrete temperature (°C) in node 2853 (downstream face).
Applsci 14 03248 g010
Figure 11. Concrete temperature (°C) in node 2938 (monolith’s central zone).
Applsci 14 03248 g011
Figure 12. Concrete temperature change (°C) in node 2938, depending on monolith length change.
Applsci 14 03248 g012
Figure 13. Concrete temperature (°C) in node 3016 (above central zone).
Applsci 14 03248 g013
Figure 14. Concrete temperature change (°C) in node 3016, depending on monolith length change.
Applsci 14 03248 g014
Figure 15. Concrete temperature (°C) in node 3184 (dam crest zone).
Applsci 14 03248 g015
Figure 16. Concrete temperature change (°C) in node 3184, depending on monolith length change.
Applsci 14 03248 g016
Figure 17. Dependence of the amplitude ratio R x R 0 on the node distance from the outer surface x [m] [4,23].
Applsci 14 03248 g017
Figure 18. Isometric view of the TF for different monolith lengths (84th day—10 January of the 2nd year).
Applsci 14 03248 g018
Figure 19. Isometric view of the TF for different monolith lengths (283rd day—27 July of the 2nd year).
Applsci 14 03248 g019
Figure 20. Isometric view of the TF for different monolith lengths (512th day—13 March of the 3rd year).
Applsci 14 03248 g020
Figure 21. The TF in the horizontal plane for different monolith lengths (84th day—10 January of the 2nd year—at 146.50 m ASL).
Applsci 14 03248 g021
Figure 22. The TF in the horizontal plane for different monolith lengths (283rd day—27 July of the 2nd year—at 169.0 m ASL).
Applsci 14 03248 g022
Figure 23. The TF in the horizontal plane for different monolith lengths (512nd day—13 March of the 3rd year—at 162.75 m ASL).
Applsci 14 03248 g023
Figure 24. Concrete temperatures in the middle of the horizontal section, in the upstream–downstream direction, at 146.50 m ASL for different monolith lengths (84th day—10 January of the 2nd year).
Applsci 14 03248 g024
Figure 25. Concrete temperature changes in the middle of the section, in the upstream–downstream direction, at 146.50 m ASL for different monolith lengths (84th day—10 January of the 2nd year).
Applsci 14 03248 g025
Figure 26. Concrete temperatures in the horizontal section, in the direction of the dam’s axis, at 146.50 m ASL for different monolith lengths (84th day—10 January of the 2nd year).
Applsci 14 03248 g026
Figure 27. Concrete temperatures in the middle of the horizontal section, in the upstream–downstream direction, at 169.0 m ASL for different monolith lengths (283rd day—27 July of the 2nd year).
Applsci 14 03248 g027
Figure 28. Concrete temperature changes in the middle of the section, in the upstream–downstream direction, at 169.0 m ASL for different monolith lengths (283rd day—27 July of the 2nd year).
Applsci 14 03248 g028
Figure 29. Concrete temperatures in the horizontal section, in the direction of the dam’s axis, at 169.0 m ASL for different monolith lengths (283rd day—27 July of the 2nd year).
Applsci 14 03248 g029
Figure 30. Concrete temperatures in the middle of the horizontal section, in the upstream–downstream direction, at 162.75 m ASL for different monolith lengths (512nd day—13 March of the 3rd year).
Applsci 14 03248 g030
Figure 31. Concrete temperature changes in the middle of the section, in the upstream–downstream direction, at 162.75 m ASL for different monolith lengths (512nd day—13 March of the 3rd year).
Applsci 14 03248 g031
Figure 32. Concrete temperatures in the horizontal section, in the direction of the dam’s axis, at 162.75 m ASL for different monolith lengths (512nd day—13 March of the 3rd year).
Applsci 14 03248 g032
Figure 33. Isometric view of the TF for different monolith lengths (1080th day—2 October of the 4th year).
Applsci 14 03248 g033
Figure 34. Isometric view of the TF for different monolith lengths (1505th day—1 December of the 5th year).
Applsci 14 03248 g034
Figure 35. Isometric view of the TF for different monolith lengths (1804th day—25 September of the 6th year).
Applsci 14 03248 g035
Figure 36. The TF in the horizontal plane for different monolith lengths (1080th day—2 October of the 4th year—at 172.0 m ASL).
Applsci 14 03248 g036
Figure 37. The TF in the horizontal plane for different monolith lengths (1505th day—1 December of the 5th year—at 172.0 m ASL).
Applsci 14 03248 g037
Figure 38. The TF in horizontal plane for different monolith lengths (1804th day—25 September of the 6th year—at 170.50 m ASL).
Applsci 14 03248 g038
Figure 39. Concrete temperatures in the middle of the horizontal section, in the upstream–downstream direction, at 172.0 m ASL for different monolith lengths (1080th day—2 October of the 4th year).
Applsci 14 03248 g039
Figure 40. Concrete temperature changes in the middle of the section, in the upstream–downstream direction, at 172.0 m ASL for different monolith lengths (1080th day—2 October of the 4th year).
Applsci 14 03248 g040
Figure 41. Concrete temperatures in the horizontal section, in the direction of the dam’s axis, at 172.0 m ASL for different monolith lengths (1080th day—2 October of the 4th year).
Applsci 14 03248 g041
Figure 42. Concrete temperatures in the middle of the horizontal section, in the upstream–downstream direction, at 172.0 m ASL for different monolith lengths (1505th day—1 December of the 5th year).
Applsci 14 03248 g042
Figure 43. Concrete temperature changes in the middle of the section, in the upstream–downstream direction, at 172.0 m ASL for different monolith lengths (1505th day—1 December of the 5th year).
Applsci 14 03248 g043
Figure 44. Concrete temperatures in the horizontal section, in the direction of the dam’s axis, at 172.0 m ASL for different monolith lengths (1505th day—1 December of the 5th year).
Applsci 14 03248 g044
Figure 45. Concrete temperatures in the middle of the horizontal section, in the upstream–downstream direction, at 170.50 m ASL for different monolith lengths (1804th day—25 September of the 6th year).
Applsci 14 03248 g045
Figure 46. Concrete temperature changes in the middle of the section, in the upstream–downstream direction, at 170.50 m ASL for different monolith lengths (1804th day—25 September of the 6th year).
Applsci 14 03248 g046
Figure 47. Concrete temperatures in the horizontal section, in the direction of the dam’s axis, at 170.50 m ASL for different monolith lengths (1804th day—25 September of the 6th year).
Applsci 14 03248 g047
Table 1. Concrete thermal parameters [20].
SymbolParameterValueUnit
kThermal conductivity coefficient1.80W/(m × K)
cSpecific heat capacity950.0J/(kg × K)
αCoefficient of thermal expansion11.5 × 10−61/°C
h1Combined convective heat-transfer coefficient (air–concrete)20.10W/(m2 × K)
h2Combined convective heat-transfer coefficient (water–concrete)500.0W/(m2 × K)
Table 2. Concrete hydration parameters [20].
ParameterValueUnit
Cement ratio (type I) in the concrete mass
m (for Portland cement)
50kg/m3
12.5 × 10⁻³¹/h
Water–cement ratio
Fly ash ratio in the concrete mass
0.47-
225.0kg/m3
CaO ratio in the fly ash17.0%
Table 3. Rock mass thermal parameters [20].
SymbolParameterValueUnit
kThermal conductivity coefficient2.40W/(m × K)
cSpecific heat capacity880.0J/(kg × K)
αCoefficient of thermal expansion9.0 × 10−61/°C
Table 4. Measured air temperature, T a   [°C] [20,34].
Date/Time24681012141618202224
X 8–2310.211.512.713.915.518.020.519.015.412.410.79.0
X–XI 23–84.25.46.77.99.19.510.09.47.55.44.23.0
XI 8–234.65.25.86.57.49.010.69.67.96.45.24.0
XI–XII 23–82.22.42.62.83.34.55.85.44.53.72.82.0
XII 8–230.00.00.00.00.42.54.53.62.51.81.00.0
XII–I 23–86.26.46.66.87.17.57.97.37.06.86.46.0
I 8–23−1.8−1.6−1.4−1.2−0.51.53.63.32.7−0.4−1.2−2.0
I–II 23–81.21.41.61.82.23.03.83.32.51.81.51.0
II 8–232.02.02.02.02.44.05.65.44.53.62.92.0
II–III 23–80.20.40.60.81.43.45.65.44.53.31.60.0
III 8–181.21.41.61.82.33.54.83.72.52.01.61.0
III 18–311.01.01.01.01.22.53.74.04.03.52.21.0
IV 1–144.64.74.84.95.47.59.610.09.07.46.04.5
IV 15–284.64.23.73.33.98.513.114.013.511.78.35.0
IV–V 29–1115.216.016.717.418.420.522.623.021.519.116.814.5
V 12–2613.014.115.116.217.721.024.324.323.020.316.212.0
V–VI 27–915.214.914.614.214.919.524.125.024.021.718.615.5
VI 10–2417.017.017.017.017.922.527.128.026.523.720.317.0
VI–VII 25–721.220.920.620.221.026.031.031.329.526.924.221.5
VII 8–2224.022.921.920.820.925.530.130.128.526.725.825.0
VII–VIII 23–520.719.520.021.723.828.032.233.032.029.525.722.0
VIII 6–1920.318.719.020.722.726.029.330.729.527.024.522.0
VIII–IX 20–216.215.316.017.719.622.525.424.723.522.019.517.0
IX 3–915.214.314.716.017.520.022.523.022.020.218.116.0
Table 5. The measured mean monthly temperatures of air inside the galleries [20,34].
MonthIIIIIIIVVVIVIIVIIIIXXXIXII
Tag,mm (°C)101012141620222220161210
Table 6. The measured mean monthly temperatures of the fresh concrete mixture [20,34].
MonthXXIXIIIIIIIIIVVVI
Tc (°C)10.09.79.59.59.79.712.313.112.9
Disclaimer/Publisher’s Note: The statements, opinions and data contained in all publications are solely those of the individual author(s) and contributor(s) and not of MDPI and/or the editor(s). MDPI and/or the editor(s) disclaim responsibility for any injury to people or property resulting from any ideas, methods, instructions or products referred to in the content.