1. Introduction
In recent times, organizations have given an increased level of attention to the human resources domain. Starting from, firstly, meticulously selecting the optimal candidates for the needed roles, followed by the process of developing their skills in alignment with the requirements of the organization, and, finally, evaluating them and assessing their performance and abilities, a process that can lead to offering these employees enhanced conditions for their work life, salary increases, or bonuses, which are offered based on performance. Consequently, it becomes highly important for companies to determine and anticipate the capabilities and the performance of their employees, factors that later will contribute to their productivity and organizational development [
1].
Evaluating an employee’s performance brings challenges, as it implies offering feedback and deciding on their future career development, salary, or promotion. It also involves identifying areas that require updates or modifications. Numerous research studies have explored methodological factors such as academic credentials, technical qualifications, characteristics, and psychological aspects as indicators of employee performance in organizations. However, these factors are applicable only in certain employment domains. It is crucial to explore a multitude of other factors to gain a comprehensive understanding of employee performance [
2].
Different elements can contribute to workforce attrition, including low job satisfaction, inappropriate wages, family concerns or a demanding business environment. Poor performance leads to involuntary employee attrition, which will affect, at the same time, the organization’s productivity and its progression and development [
3,
4].
This article initially analyzes employees based on individual factors, as well as job-related ones, in order to gain a better perspective of the employees’ behaviors, needs, and preferences. This process of observing the data and identifying correlations leads to a point where employee performance scores can be predicted, based on these elements, using machine learning techniques. Additionally, such an analysis can be useful in optimizing the business-related processes of human resource management, in terms of objectivity, fairness, and resource consumption, by replacing the traditional managerial appraisal with a mixed method. In addition, such predictions can be performed throughout the entire year (and not just at the end of a business year, when performance reviews usually happen) to prevent the other challenges of this sector, such as attrition, a lack of motivation, or a lack of productivity and to introduce other incentives such as promotions, bonuses, or any other benefits.
In the next chapter, the current research on elements/variables that generally contribute to employee performance will be described, as well as the best machine learning algorithms that can help in predicting the dependent variables affecting employee performance scores. While the current state of research in these areas and requirements of future development will be described, this paper will also conduct a study that will determine, in a particular case, the best attributes and algorithms to use to build such a model, and eventually, to predict employee performance scores without or not only by using human intervention. A methodology will be used in order to assure the quality of the research and the results obtained.
2. Background and Related Work
Numerous researchers have investigated the models that can help us predict employee performance. We can identify the fact that, generally, an individual that supervises the employee or are their direct manager is the best person to conduct an employee performance evaluation [
5]. It has also been determined that high levels of job satisfaction contribute to the increasing loyalty of the employee, a fact that later can reduce turnover rates [
6]. Additionally, a complete evaluation should include static and dynamic elements [
7].
Glinow proposes that attaining and maintaining high performance standards emerges as a predominant concern across various types of organizations, including private, public, for-profit, and non-profit entities. According to him, achieving high performance levels, accompanied by positive indicators, enhances the stability of the organization, while ensuring high levels of profitability, quality, productivity, motivation, innovation, and efficiency. Conversely, he asserts that low performance levels entail negative and dysfunctional outcomes for the organization. He argues that instances of low performance indicators are associated with specific circumstances [
8].
The most classical sources of performance data generally face limitations in correctly capturing the dynamic nature of performance. Particularly, it is well known that supervisors or managers are the ones who carry out the performance appraisal, with colleagues, subordinates, or even customers providing additional feedback or notes to them [
8].
Considering the dynamic nature of organizations, these sources and their ratings are often prone to rapid changes before the moment of the appraisal; therefore, these become unsuitable. Consequently, it also becomes more essential to adopt new methods for analyzing data from discrete sources and to gain a more comprehensive picture of employee performance in more organizational contexts [
9].
Recent research applying data mining techniques to predict employee performance scores concludes that the most important goal is to minimize the influence of subjective factors and reduce personal biases as well [
10]. Diverse performance attributes can direct the selection of appropriate data mining methods, promoting synchronization across multiple areas like business operations, technology, or information science. As a consequence, the process of performance evaluation tends to become a more scientific approach, lowering the arbitrary nature of artificial scoring. This development contributes to enhanced fairness, authority in assessments, and integrity, as well as simultaneously elevating employee engagement, productivity, and team collaboration [
10].
The development of data mining technology is clear and well-known, considering the years spent undertaking research and investigating practical applications, a fact that has provided increasingly complex model types and even mining functions. This maturity enables the provision of decision support in employee performance evaluations by correctly choosing the right index systems and training models [
11].
Recent efforts regarding employee performance classification have considered the implementation of various machine learning algorithms. Some studies targeted the exploration of psychological, socioeconomic and creative factors on employee performance and motivation [
2,
12]. One important research study considered the use of prediction model construction algorithms, such as random forest, logistic regression, support vector machine, artificial neural network or naïve Bayes [
13].
Other studies underline the critical importance of employee performance in organizational operations, highlighting it as the central factor in determining survival and competitiveness. Additionally, employee performance significantly influences the rewards system within an organization. Lucy acknowledges that performance is linked to actions related to productivity, innovation, flexibility, production levels, commitment, absenteeism rates, and the overall image of the organization. He categorizes performance into high, moderate, and low levels, emphasizing that low performance is the least desirable state for any organization. He advocates for high performance levels, which correlate with increased productivity, innovation, quality, efficiency, and commitment, recognizing the potential for better prospects for the organization [
14].
Liu et al. introduced a method based on artificial intelligence for predicting the employee turnover while using a dataset that was built from state enterprises. Feature extraction was undertaken as well, to determine crucial factors affecting employee performance. For classification purposes, algorithms such as random forest, support vector machine (SVM), and linear regression (LR) were used again, together with AdaBoost, also concluding that there was a direct correlation between the employees’ skills and associated performance scores [
15]. Another important work focused on correctly and efficiently classifying employee job performance, based on DISC personality ((D)ominance, (i)nfluence, (S)teadiness and (C)onscientiousness). The classification for this personality test is built by comparing an individual personality with the standard personality test that the person took. DISC represents one of the most popular tests in this domain, standing for dominance, influence, steadiness and compliance. They built some models that were tested on a self-made dataset concerning the results of the DISC personality test for 2137 employees. For these models, the authors again used algorithms such as SVM, K-nearest neighbors (KNN), random forest (RF), LR, decision trees or naïve Bayes. Regarding the results, it was concluded that, for the selection chosen, decision trees provided the best performance, with the lowest Hamming loss and the highest accuracy. In addition, as feature selection techniques, the results were better when using multi-label classification with a stacking technique [
16].
Jayadi et al. also investigated employee performance predictions using data mining, looking closely into the use of naïve Bayes for a dataset which was based on 310 employees [
17]. Ajit et al. focused on an approach based on the eXtreme Gradient Boosting (XGBoost) classifier, again using a self-made dataset with 73,115 labeled data registries. The introduction of feature extraction can also be identified in this last research study, while underlining the impact of turnover [
18].
Fallucchi et al. looked closer into machine learning approaches, like K-nearest neighbors, SVM, naïve Bayes, logistic regression, or random forest, regarding leaving the company. Their analysis included objective factors affecting worker wishes about turnover, considering both the correlation matrix for those features and running statistical analysis [
19].
Hamidah et al. explored various classification methods such as decision trees (DT), neural networks (NN), and K-nearest neighbors (KNN) for predicting talent outcomes. Their research aimed to identify the most accurate technique for processing Human Resource (HR) data. The findings indicated that the decision tree method was notably effective for talent forecasting within human resource management (HRM), demonstrating the highest level of accuracy. The data utilized in this research were gathered from an academic institution’s staff database [
20].
Juvitayapun et al. proposed logistic regression, random forest, gradient boosting tree and extreme gradient boosting tree classifiers to identify employees’ likelihood of turnover, while Duan et al. suggested logistic regression and XGBoost, with the latter being the better algorithm for the same purpose, outperforming logistic regression [
21].
Last, but not least, Sujatha et al. introduced machine learning classifiers such as XGBoost and gradient boosting, while working with a real-time dataset [
22]. Obiedat et al. tried to achieve the prediction of productivity performance in the garment sector, offering a hybrid algorithm that combines multiple algorithms for classification such as random forest, naïve Bayes, support vector machine, and multi-layer perceptron. They also tried to incorporate ensemble-learning methods such as AdaBoost and Bagging [
23].
3. Methods and Results
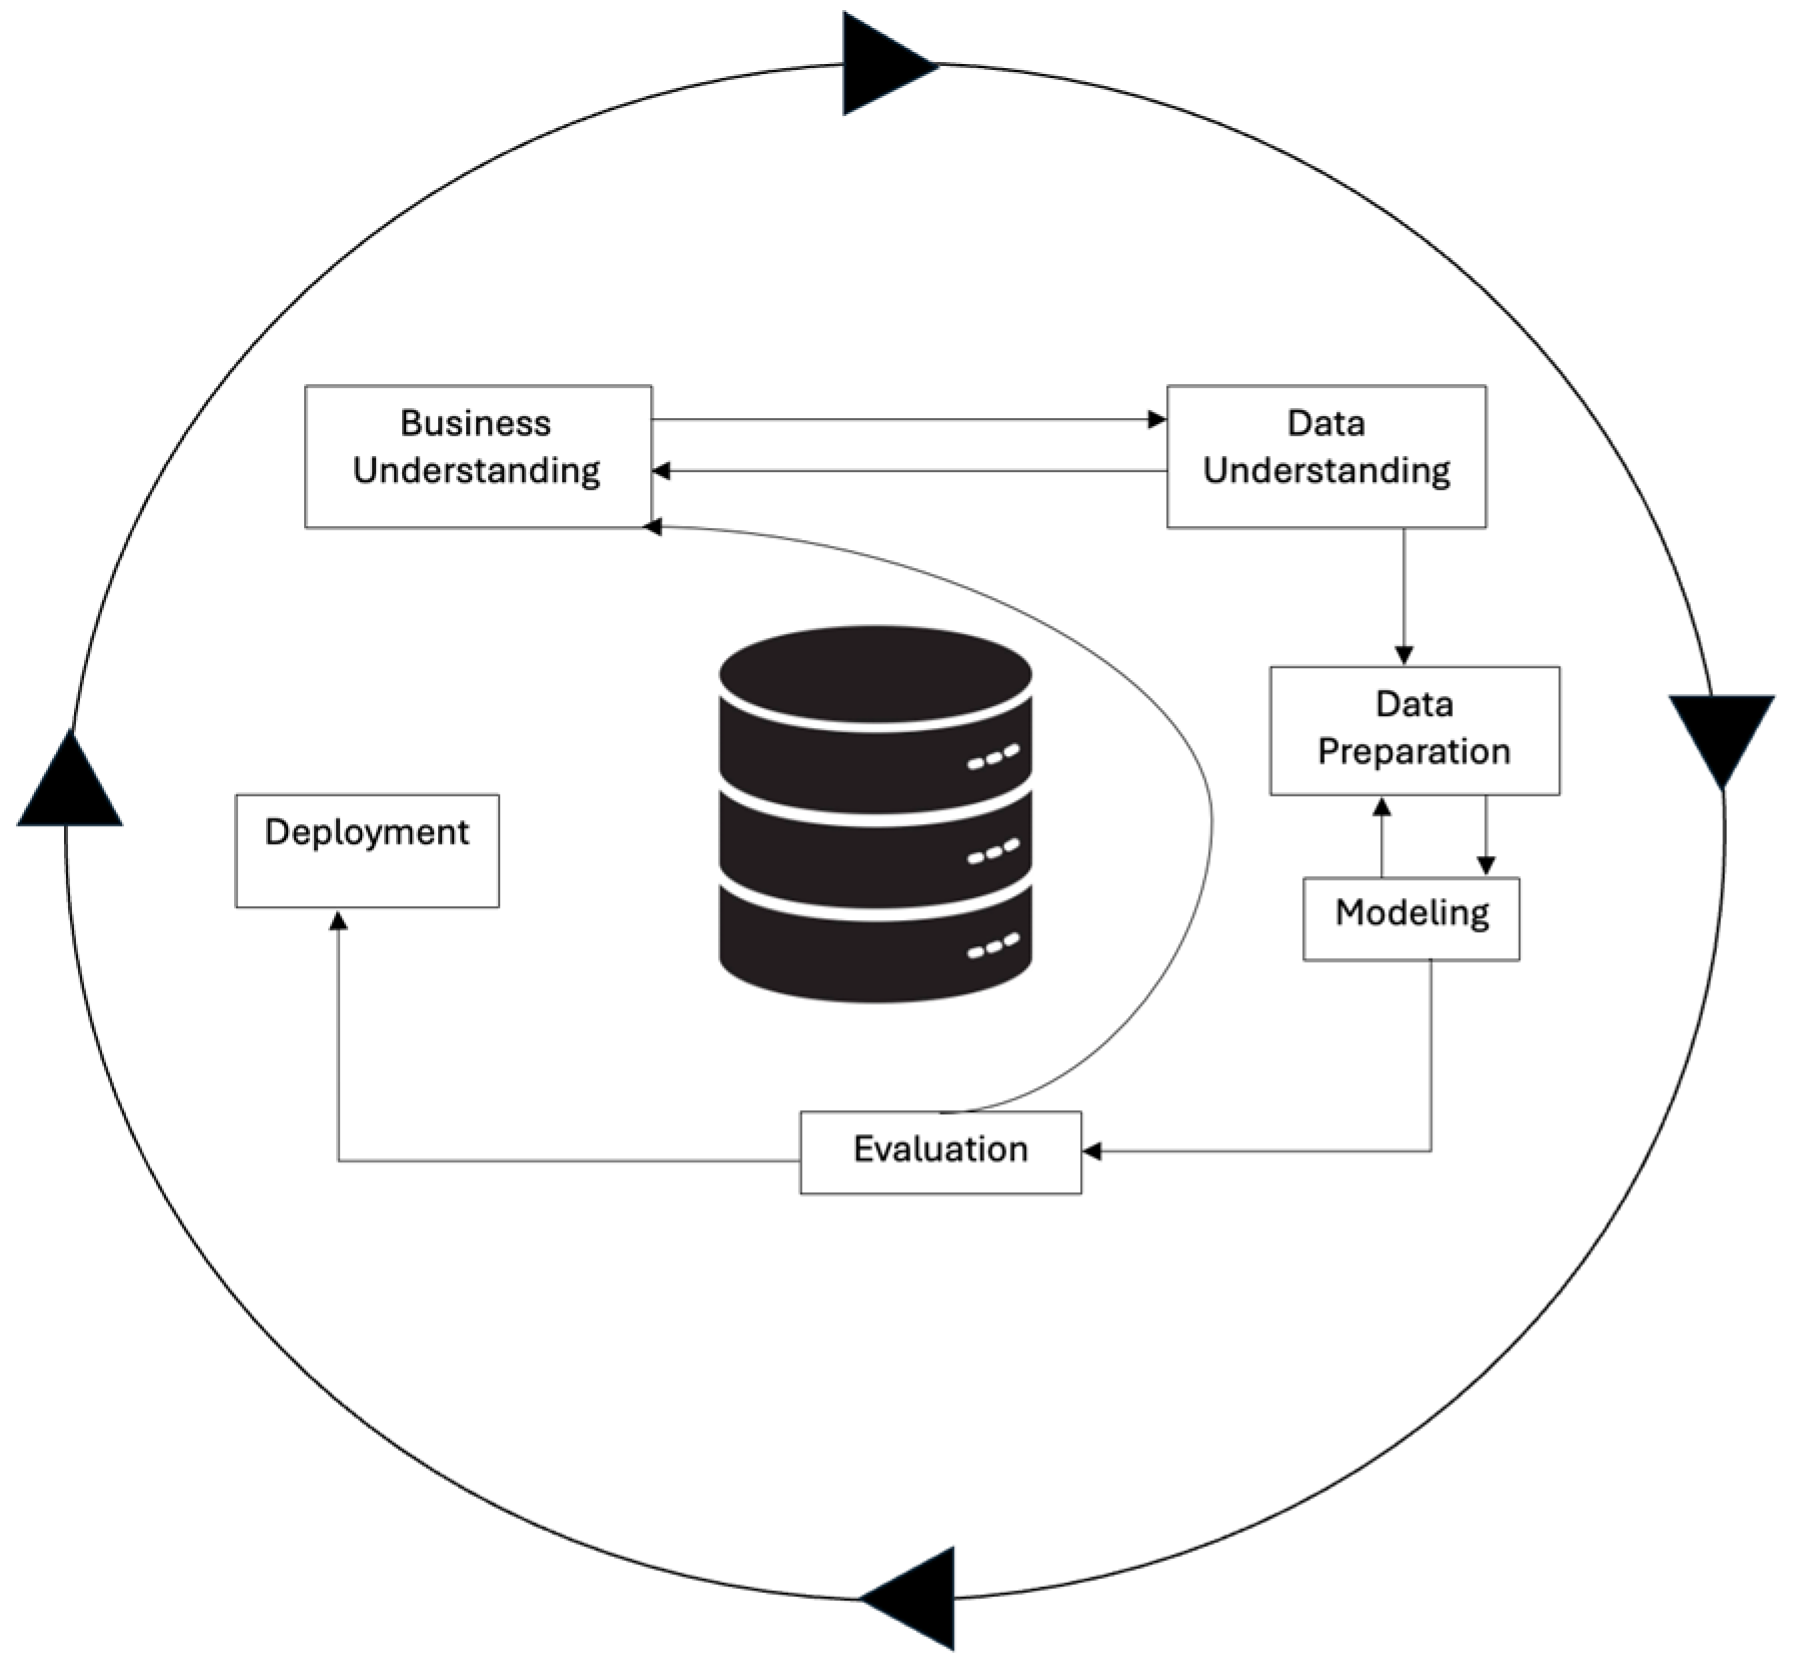
The steps followed in the current research are based on the CRISP-DM methodology, which stands for the cross-industry standard process for data mining. This is a generally used approach in guiding and structuring data mining processes, which also provides a comprehensive and organized procedure that helps to extract values, information, and insights from data. Moreover, this way of structuring the overall analysis is designed to be flexible and easy to apply, independent of the industries or the business areas that are under investigation [
24]. Lastly, while we will go through each step of this method and detail the ways in which we are applying it to our current paper, it is important to mention as well that this alternative way of organizing the process puts a higher focus on iterative and cyclical development, which also encourage constant improvement and adaptability throughout the whole cycle of this data mining process. We can observe below, in
Figure 1, a visual representation of the explained methodology, as well as the flow that will be conducted through the stages of it. It can be observed the process starts with understanding the business needs and the context, and it ends with deployment. All the other steps are critical, to obtain the best results in the end.
From a technical perspective, the code developed for this study was written in Python, using version 3.10.5. Additionally, some of the most important libraries used for this study were pandas, numpy, sklearn, text_normalizer, seaborn, matplotlib, optuna, and tensorflow. Lastly, a business intelligence tool was also used for user-friendly and graphically relevant visualizations, named Oracle Analytics. The purpose of introducing such a tool is to understand, easily and clearly, the insights of the data analyzed, without having to always be connected to code-based methods as this is a drag-and-drop solution.
3.1. Business Understanding
The goal of this research is to identify, firstly, the attributes that affect employee performance, in general. Secondly, using this information, the main objective is to build the algorithm that can best predict employee performance with the highest prediction results. Thus, a company can take advantage of this type of information and closely monitor underperforming staff, reward high-performing staff, or pay more attention to the individual development and skills of those who will become top performers.
3.2. Data Collection
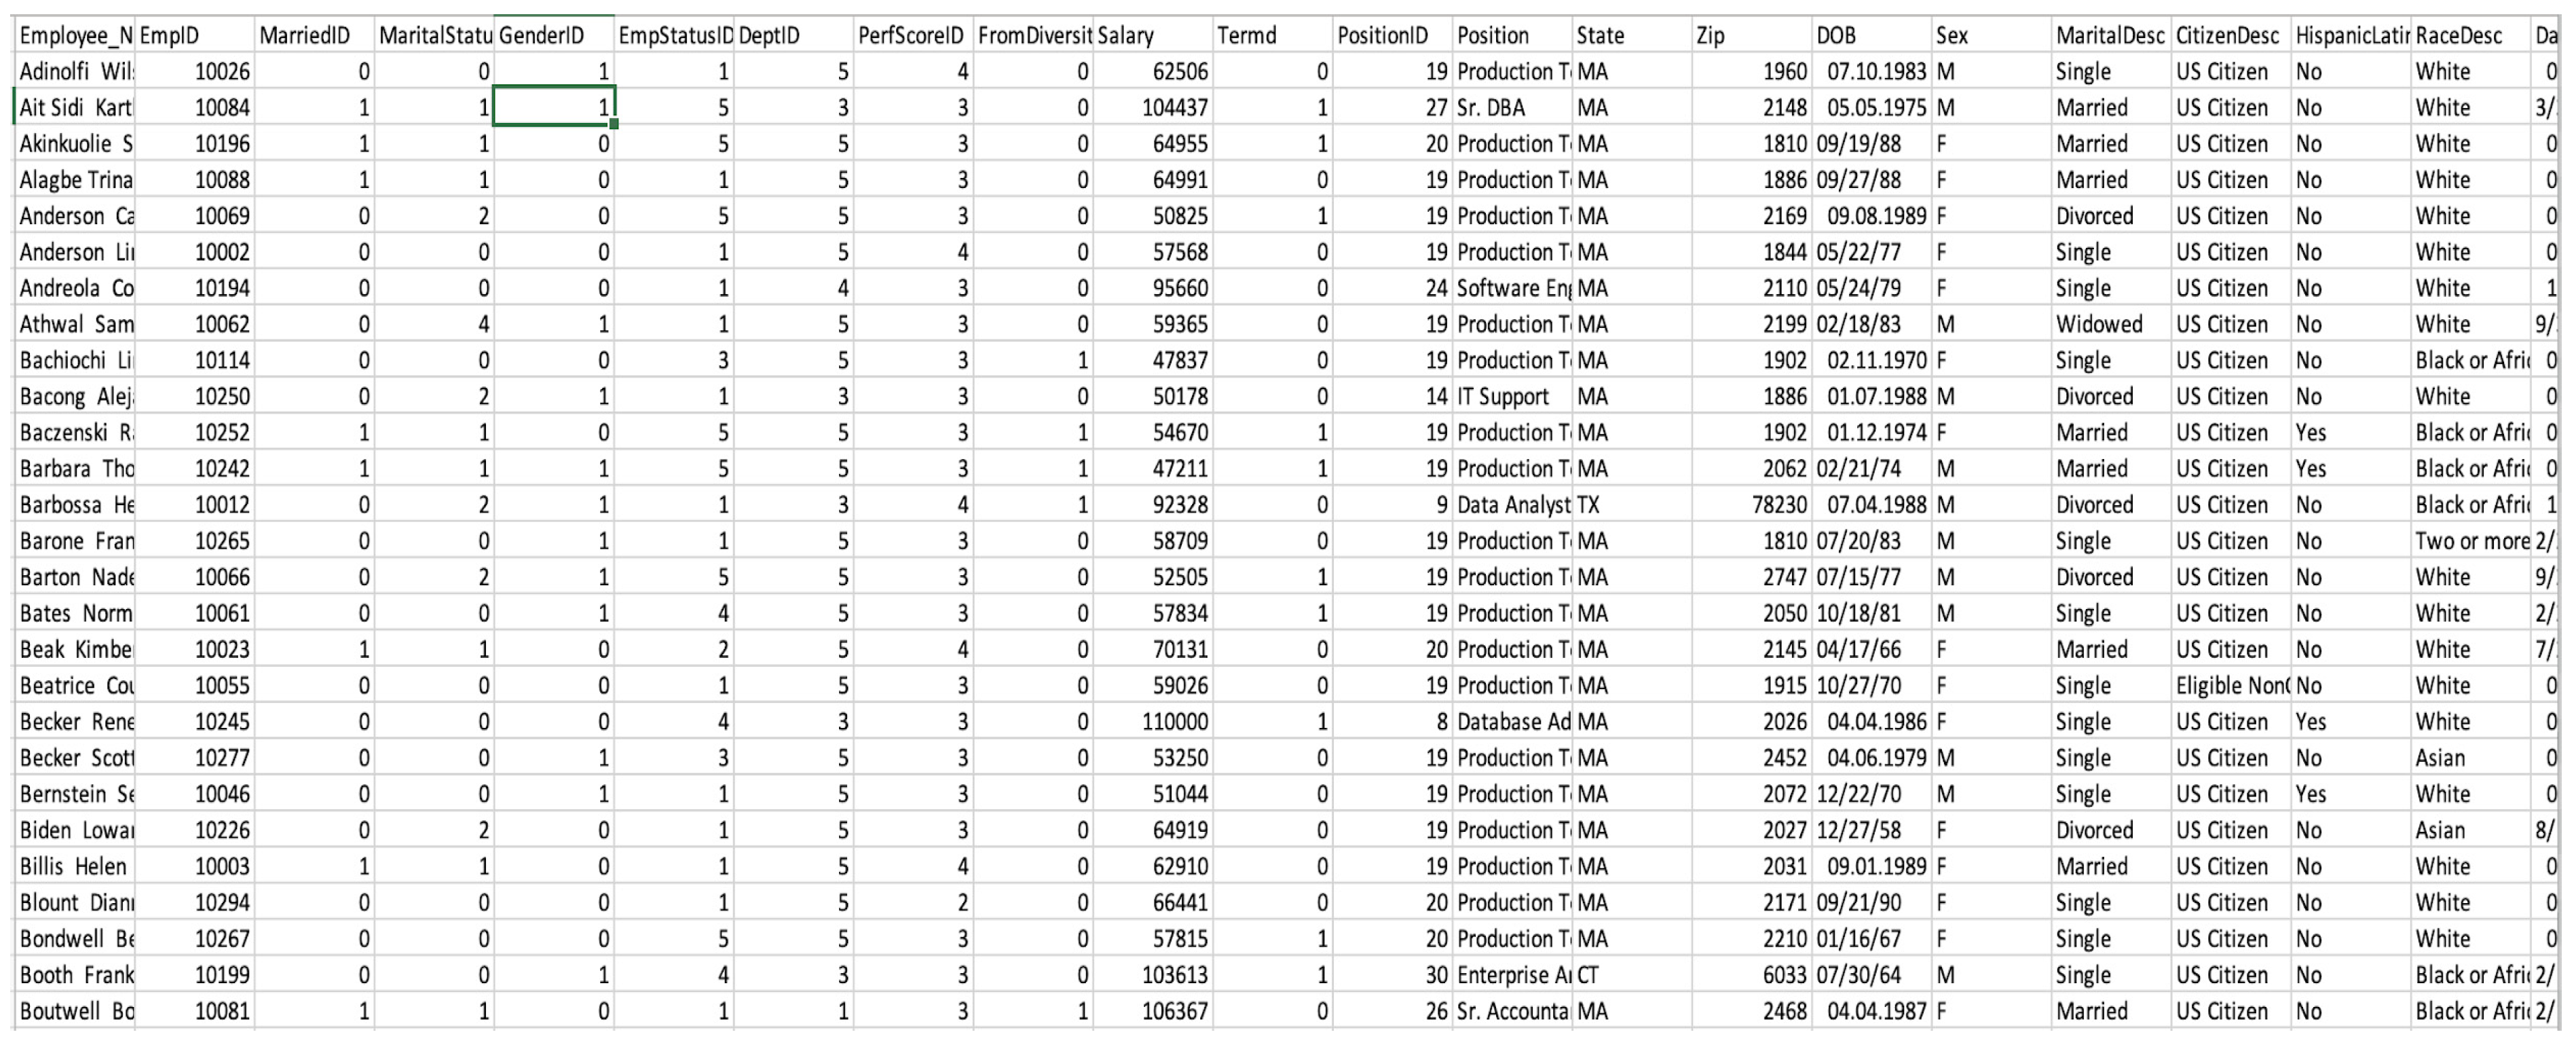
As this kind of test data is very difficult to collect from real organizations, in order to achieve this paper’s objective, a dataset found on Kaggle (San Francisco, CA, USA) was used. This dataset, presented in
Figure 2, includes several variables needed for our analysis, which include both individual characteristics and work-related ones. We can see below a preview of the dataset used for this current research, which contains inputs from 311 people, meaning that we have 311 rows, representing a good volume for an overall organization analysis, with a good split between the people analyzed, as will be seen later in the study. There are no missing values or outliers, as the considered structured dataset has been specially designed for such an analysis.
Considering the businesses’ needs, the following variables are included in the analyzed dataset:
- (a)
Individual attributes: Employee_Name, MarriedID, MaritalStatusID, GenderID, EmpStatusID, DOB, Sex, MaritalDesc, CitizenDesc, HispanicLatino, and RaceDesc.
The above data refer to individual characteristics of the employees, such as their name, marital status, sex, employment status, date of birth, citizenship type, and race. Some of the variables repeat themselves in terms of information provided; therefore, these variables will be handled later in the process.
- (b)
Geographical-related attributes: State and Zip.
The above data refer to the state where the employee lives and their zip code.
- (c)
Organizational-related attributes: EmpID, DeptID, FromDiversityJobFairID, Salary, Termd, PositionID, Position, DateofHire, DateofTermination, TermReason, EmploymentStatus, Department, ManagerName, ManagerID, and RecruitmentSource.
The above data refer to job-related data, such as the employee’s ID within a specific company, if the recruitment was undertaken through a diversity job fair or not, salary value, termination of the contract (if that is the case), position ID and position name, date when the employee was hired, date of termination (if that is the case), termination reason, employment status in the company, department the employee is part of, their manager’s name and ID, and the recruitment source of the specific employee.
- (d)
Work engagement attributes: EngagementSurvey, SpecialProjectsCount, DaysLateLast30, and Absences.
The above data refer to the engagement rate that the employee has shown within the organization, how many special projects they has been a part of, how many days the employee has been late in the last 30 days, and how many absences they have had in a respective year.
- (e)
Performance-related attributes: PerfScoreID, PerformanceScore, EmpSatisfaction, and LastPerformanceReview_Date.
The above data refer to the performance score associated with the employee, employee satisfaction at the workplace, and data regarding their last performance review.
3.3. Data Preparation
First of all, to correctly continue with the data preparation step, we will undertake an overview of the data that are going to be analyzed.
3.3.1. Data Overview
In order to better understand our data, we will have a look at the attributes that are part of this dataset, as well as descriptive statistics based on them.
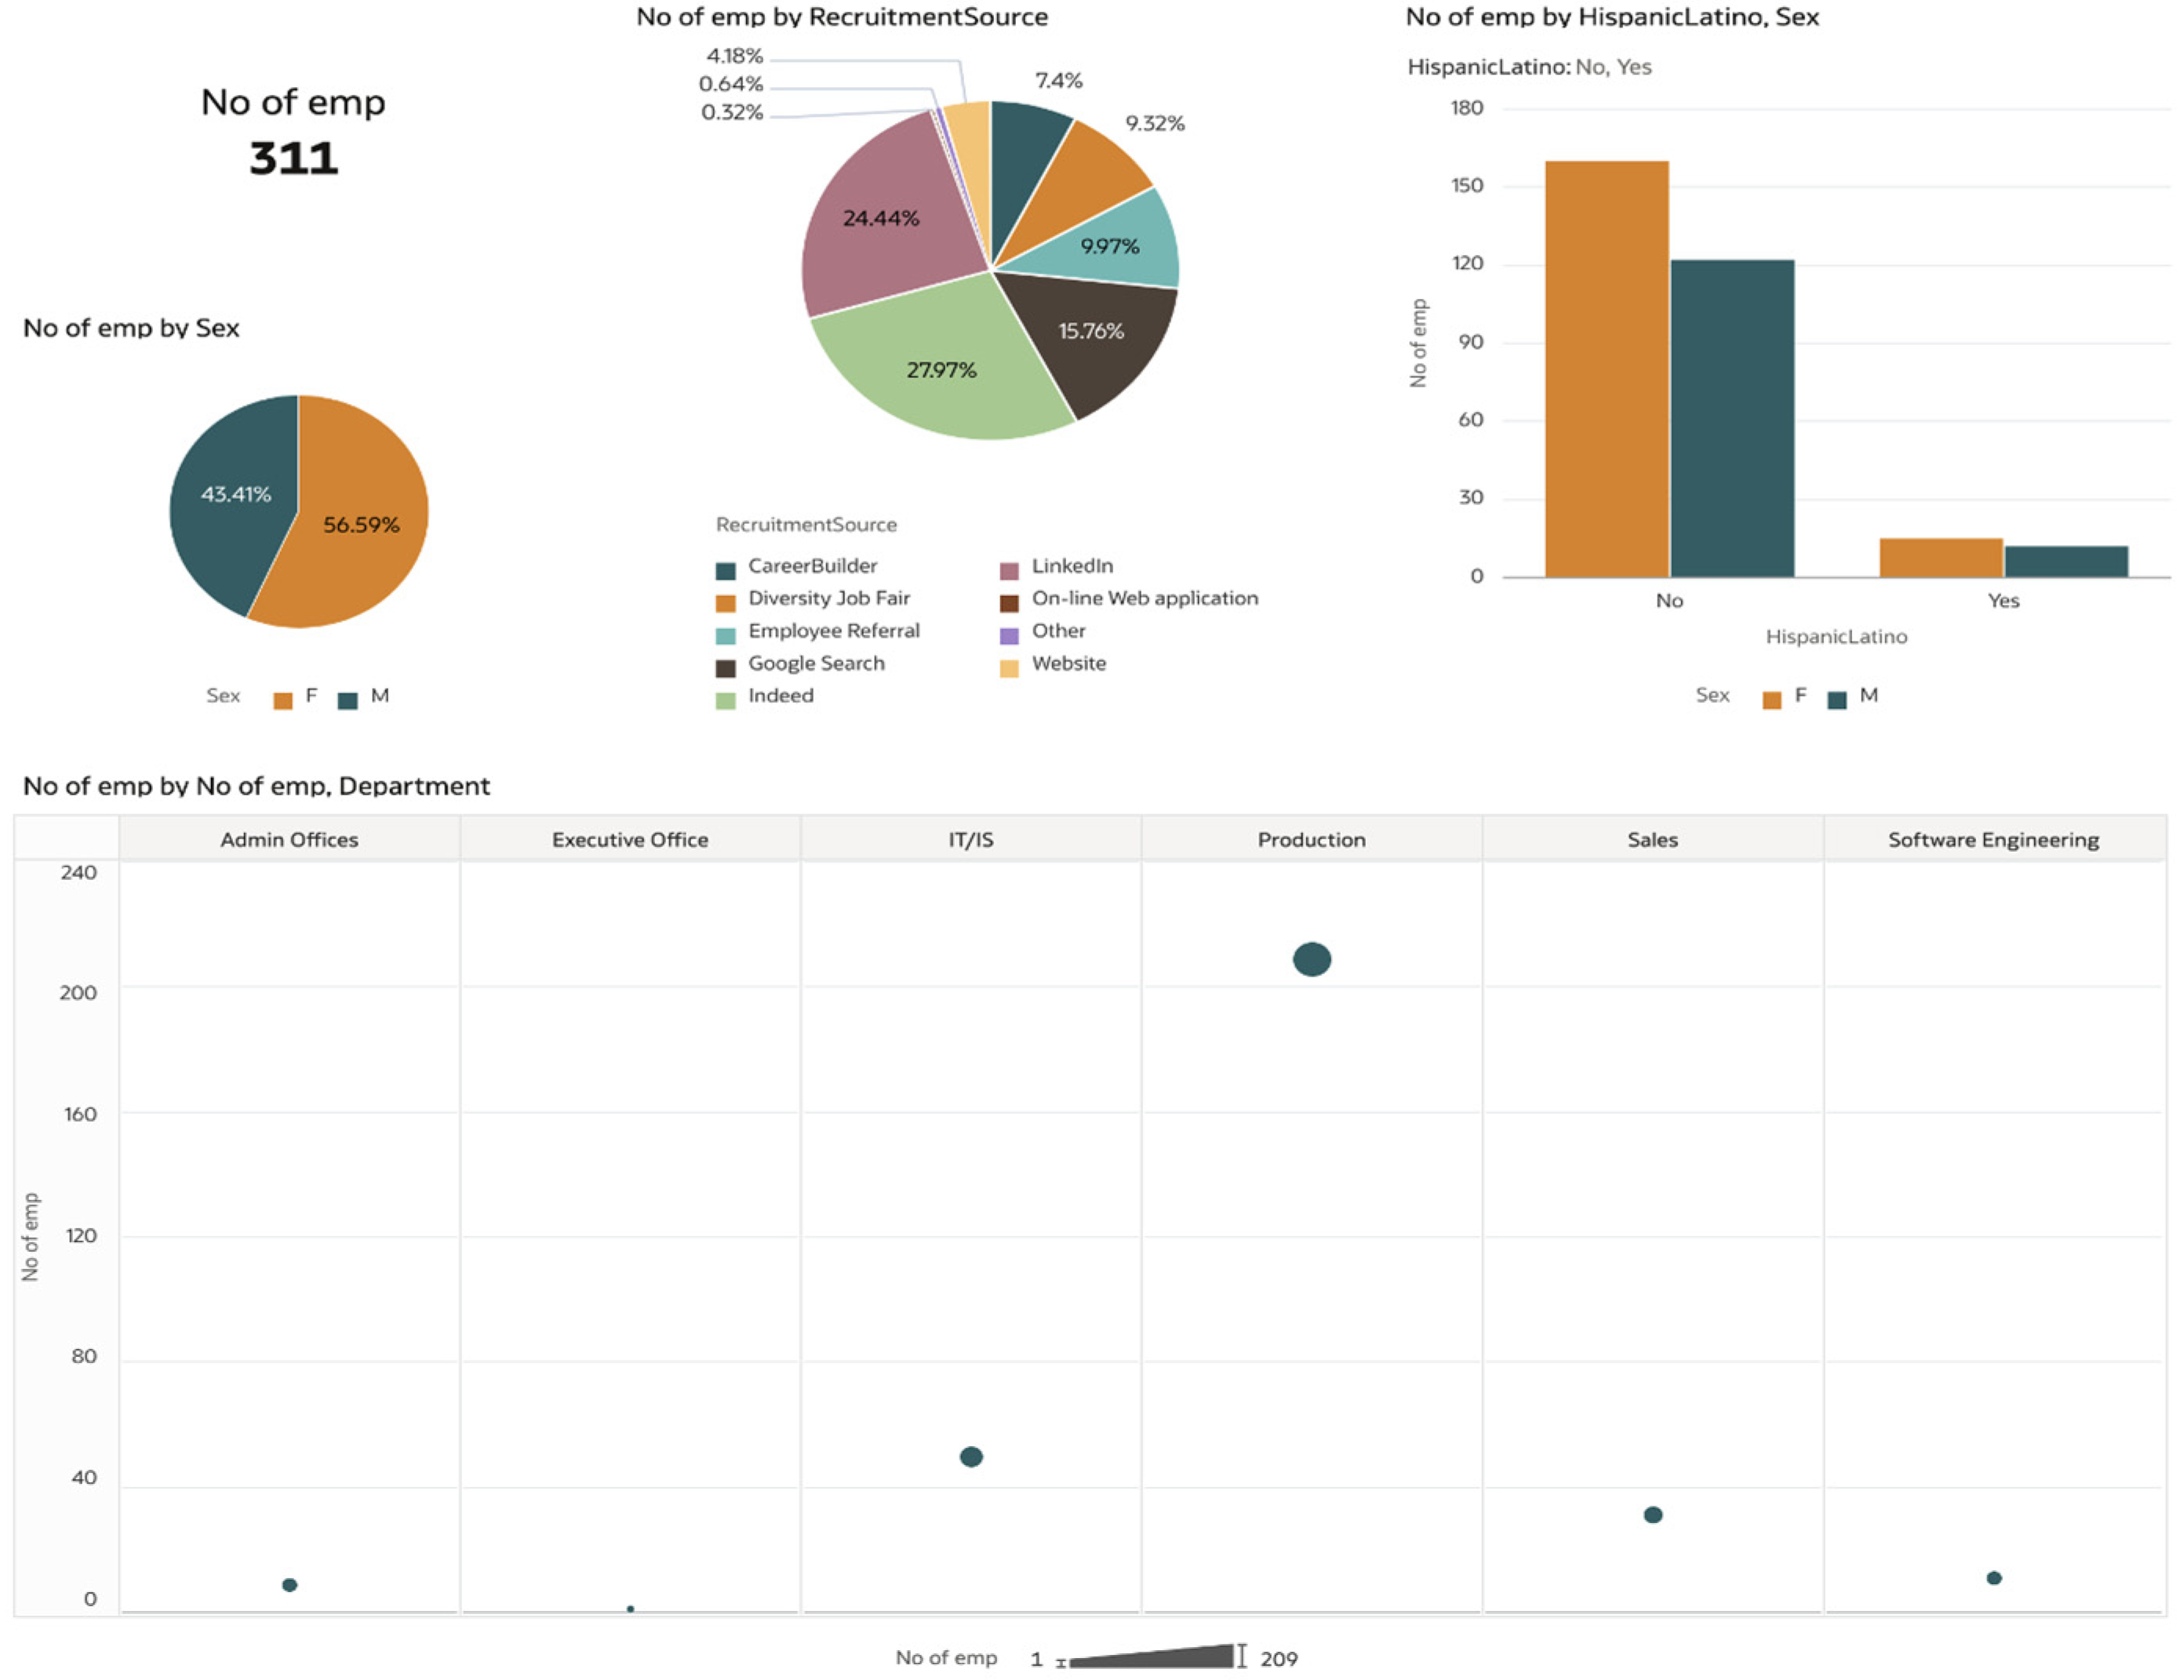
If we look at some visualizations of the dataset as shown in
Figure 3, we can obtain an overview of the analyzed inputs, as follows, with the number of employees (No of emp) being analyzed according to various criteria:
It can be seen that there are 311 employees that are under review and, therefore, 311 distinct registries in our dataset. Looking at the split by recruitment source, we observe that most of these employees were recruited through LinkedIn and Indeed, while others were recruited through Google search, employee referral, diversity job fair, or career builder. The online platforms are the most popular for the analyzed organization.
Moreover, if we look at the sex and race, we can first say that very few are Hispanic, while there is a balanced split between females and males that are part of this research. Lastly, we can conclude that most of our employees are part of the Production department, while another big group come from the Information Technology/Information Systems (IT/IS), Sales, and Admin offices. We can see that very few employees come from the Executive offices or the Software Engineering departments.
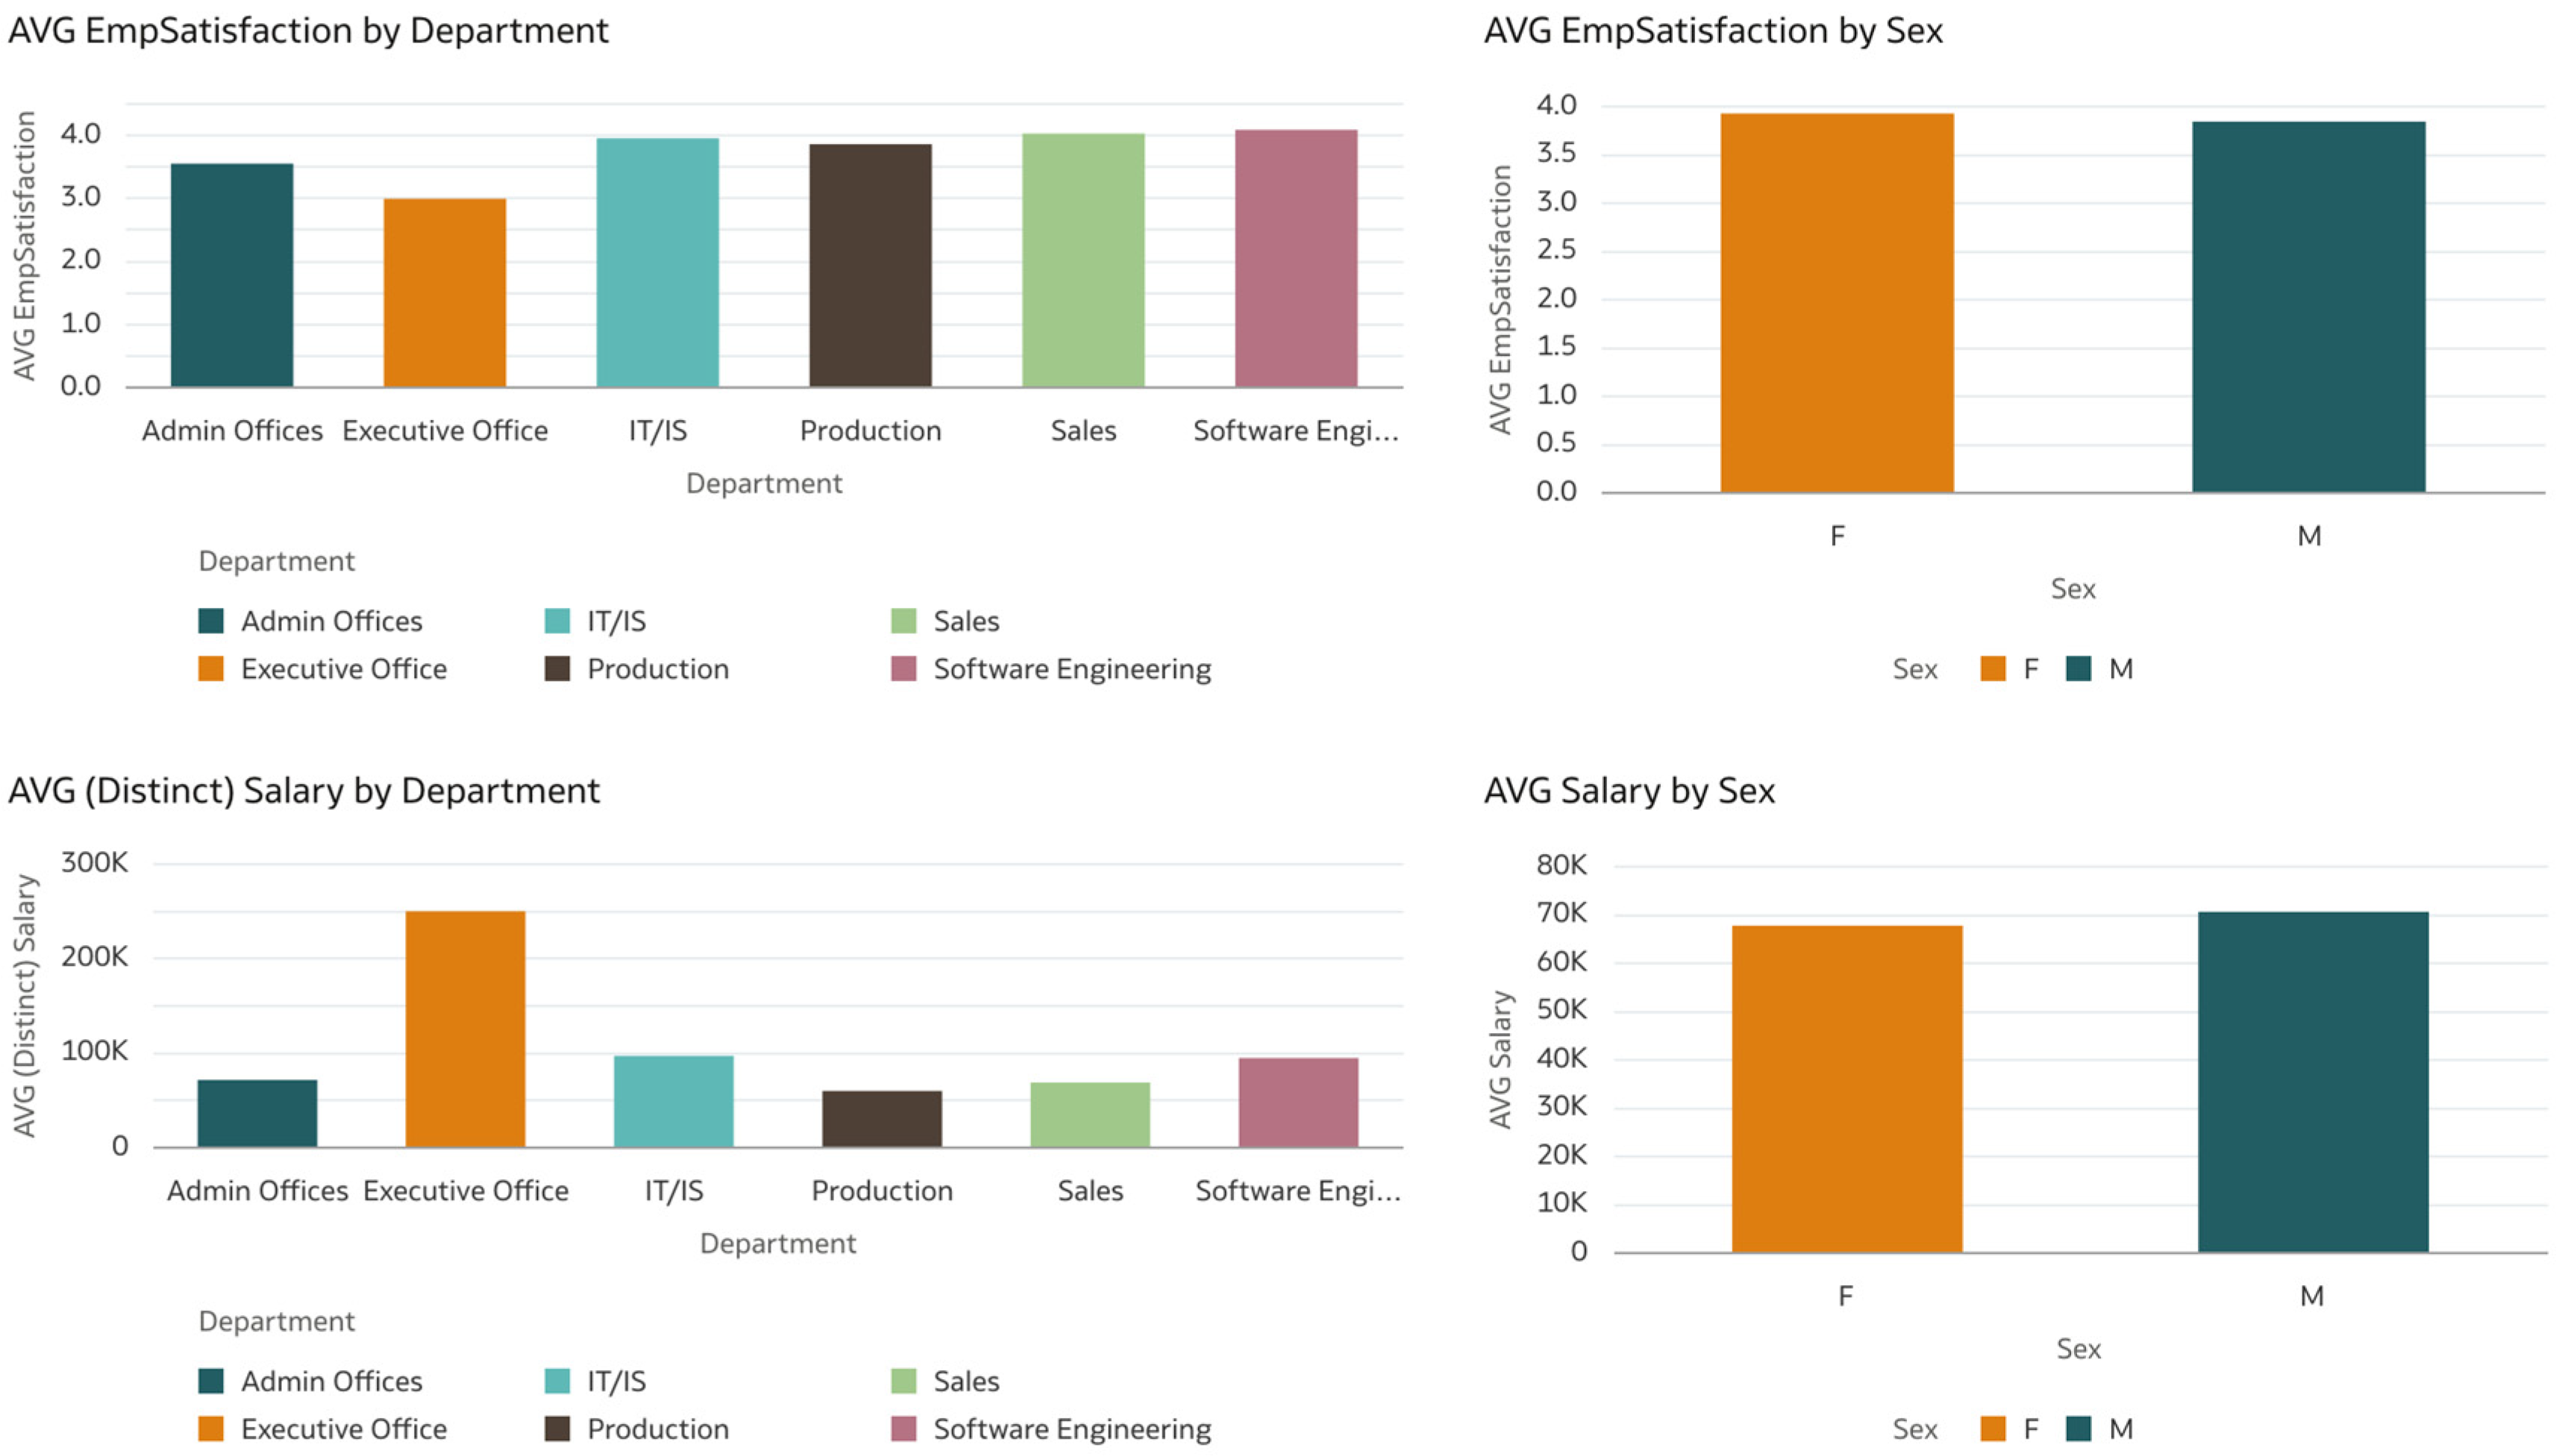
In the second set of visualizations, presented in
Figure 4, we can see that the average satisfaction score is lowest for the executive officers, and the highest for software engineers. In contrast, if we look at the average salaries for these categories, we can see that the Executive Office department has the highest value; therefore, it seems that not only salaries contribute to overall employee satisfaction. In addition, we can see that females have a slightly higher percentage than males in terms of employee satisfaction, while also having higher salaries on average than males.
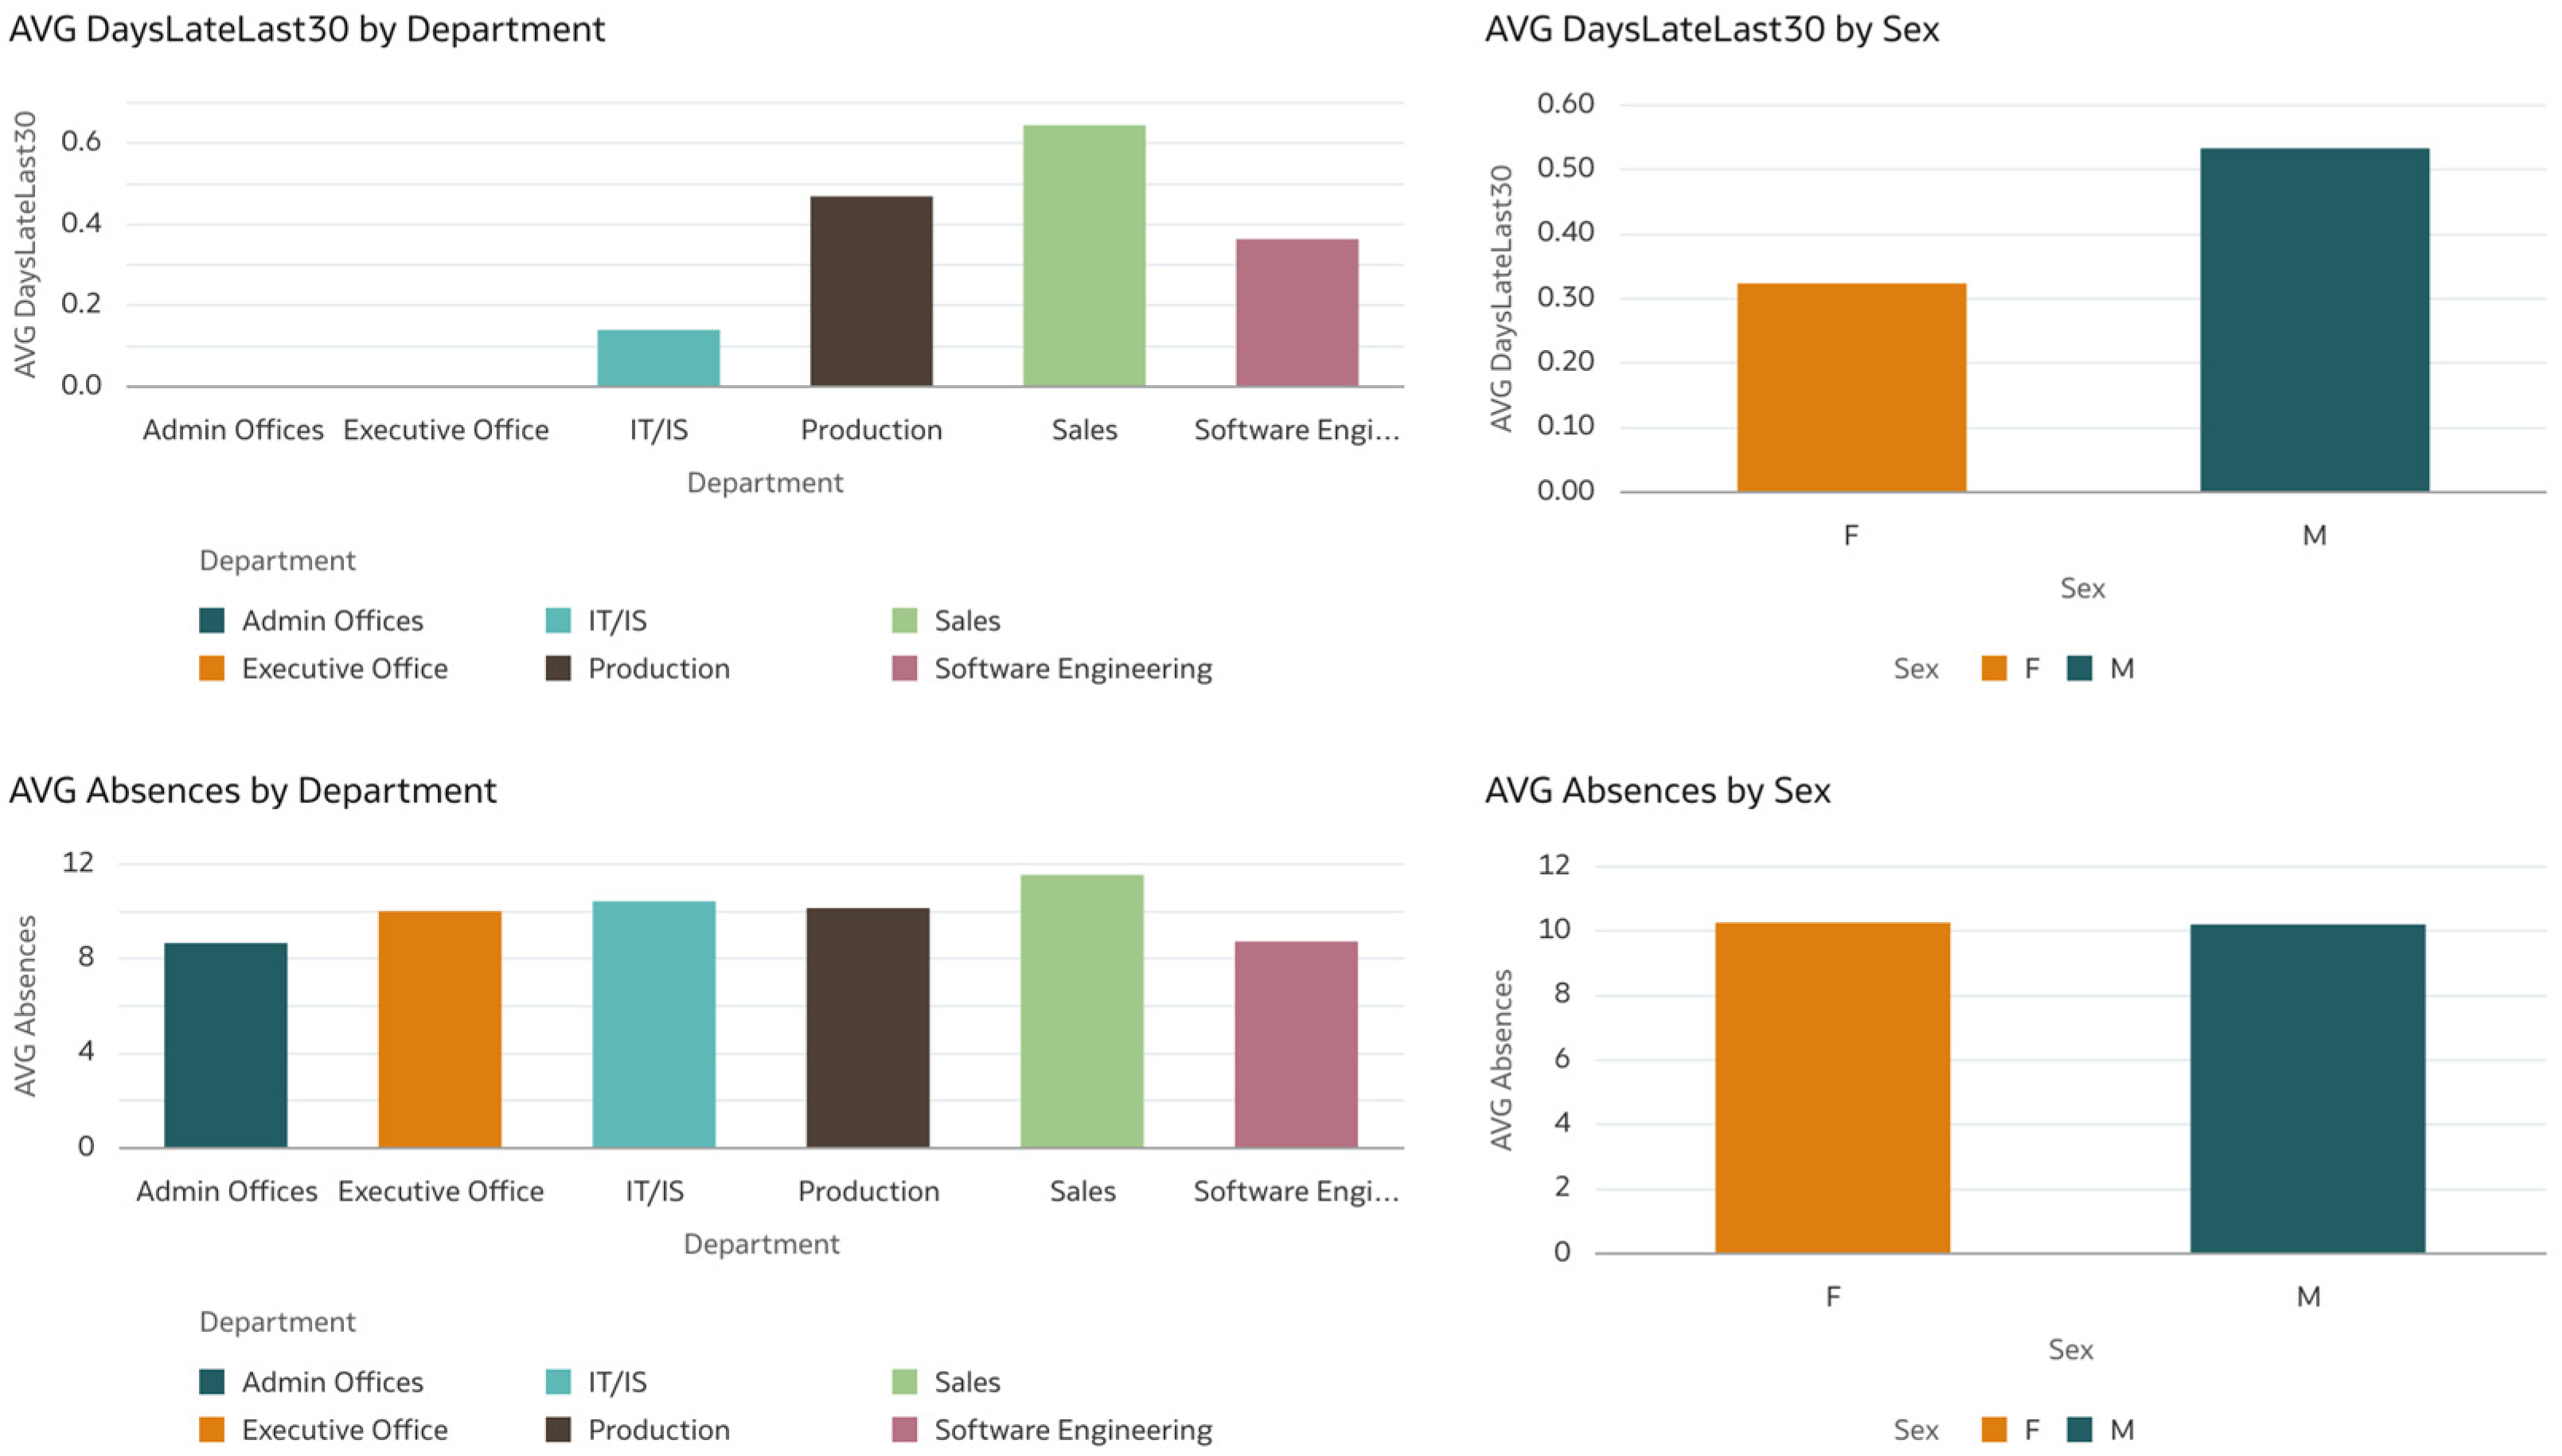
Analyzing the same statistics, as shown in
Figure 5, but with negative characteristics such as absences or number of days that employees were late to work, we can see that, on average, the Sales department has the highest number for both categories. Nonetheless, if we look at the Executive Office, we can see that, while they have the lowest satisfaction, they do not have any days in which they were late in the last 30 days, and also have a medium value for the absences taken. If we also return to the previous figure, we see that the Production department has the lowest salaries and low employee satisfaction, a fact that we can understand if we investigate the second chart, in which it is shown that the Production department has high values for both absences and days late at work.
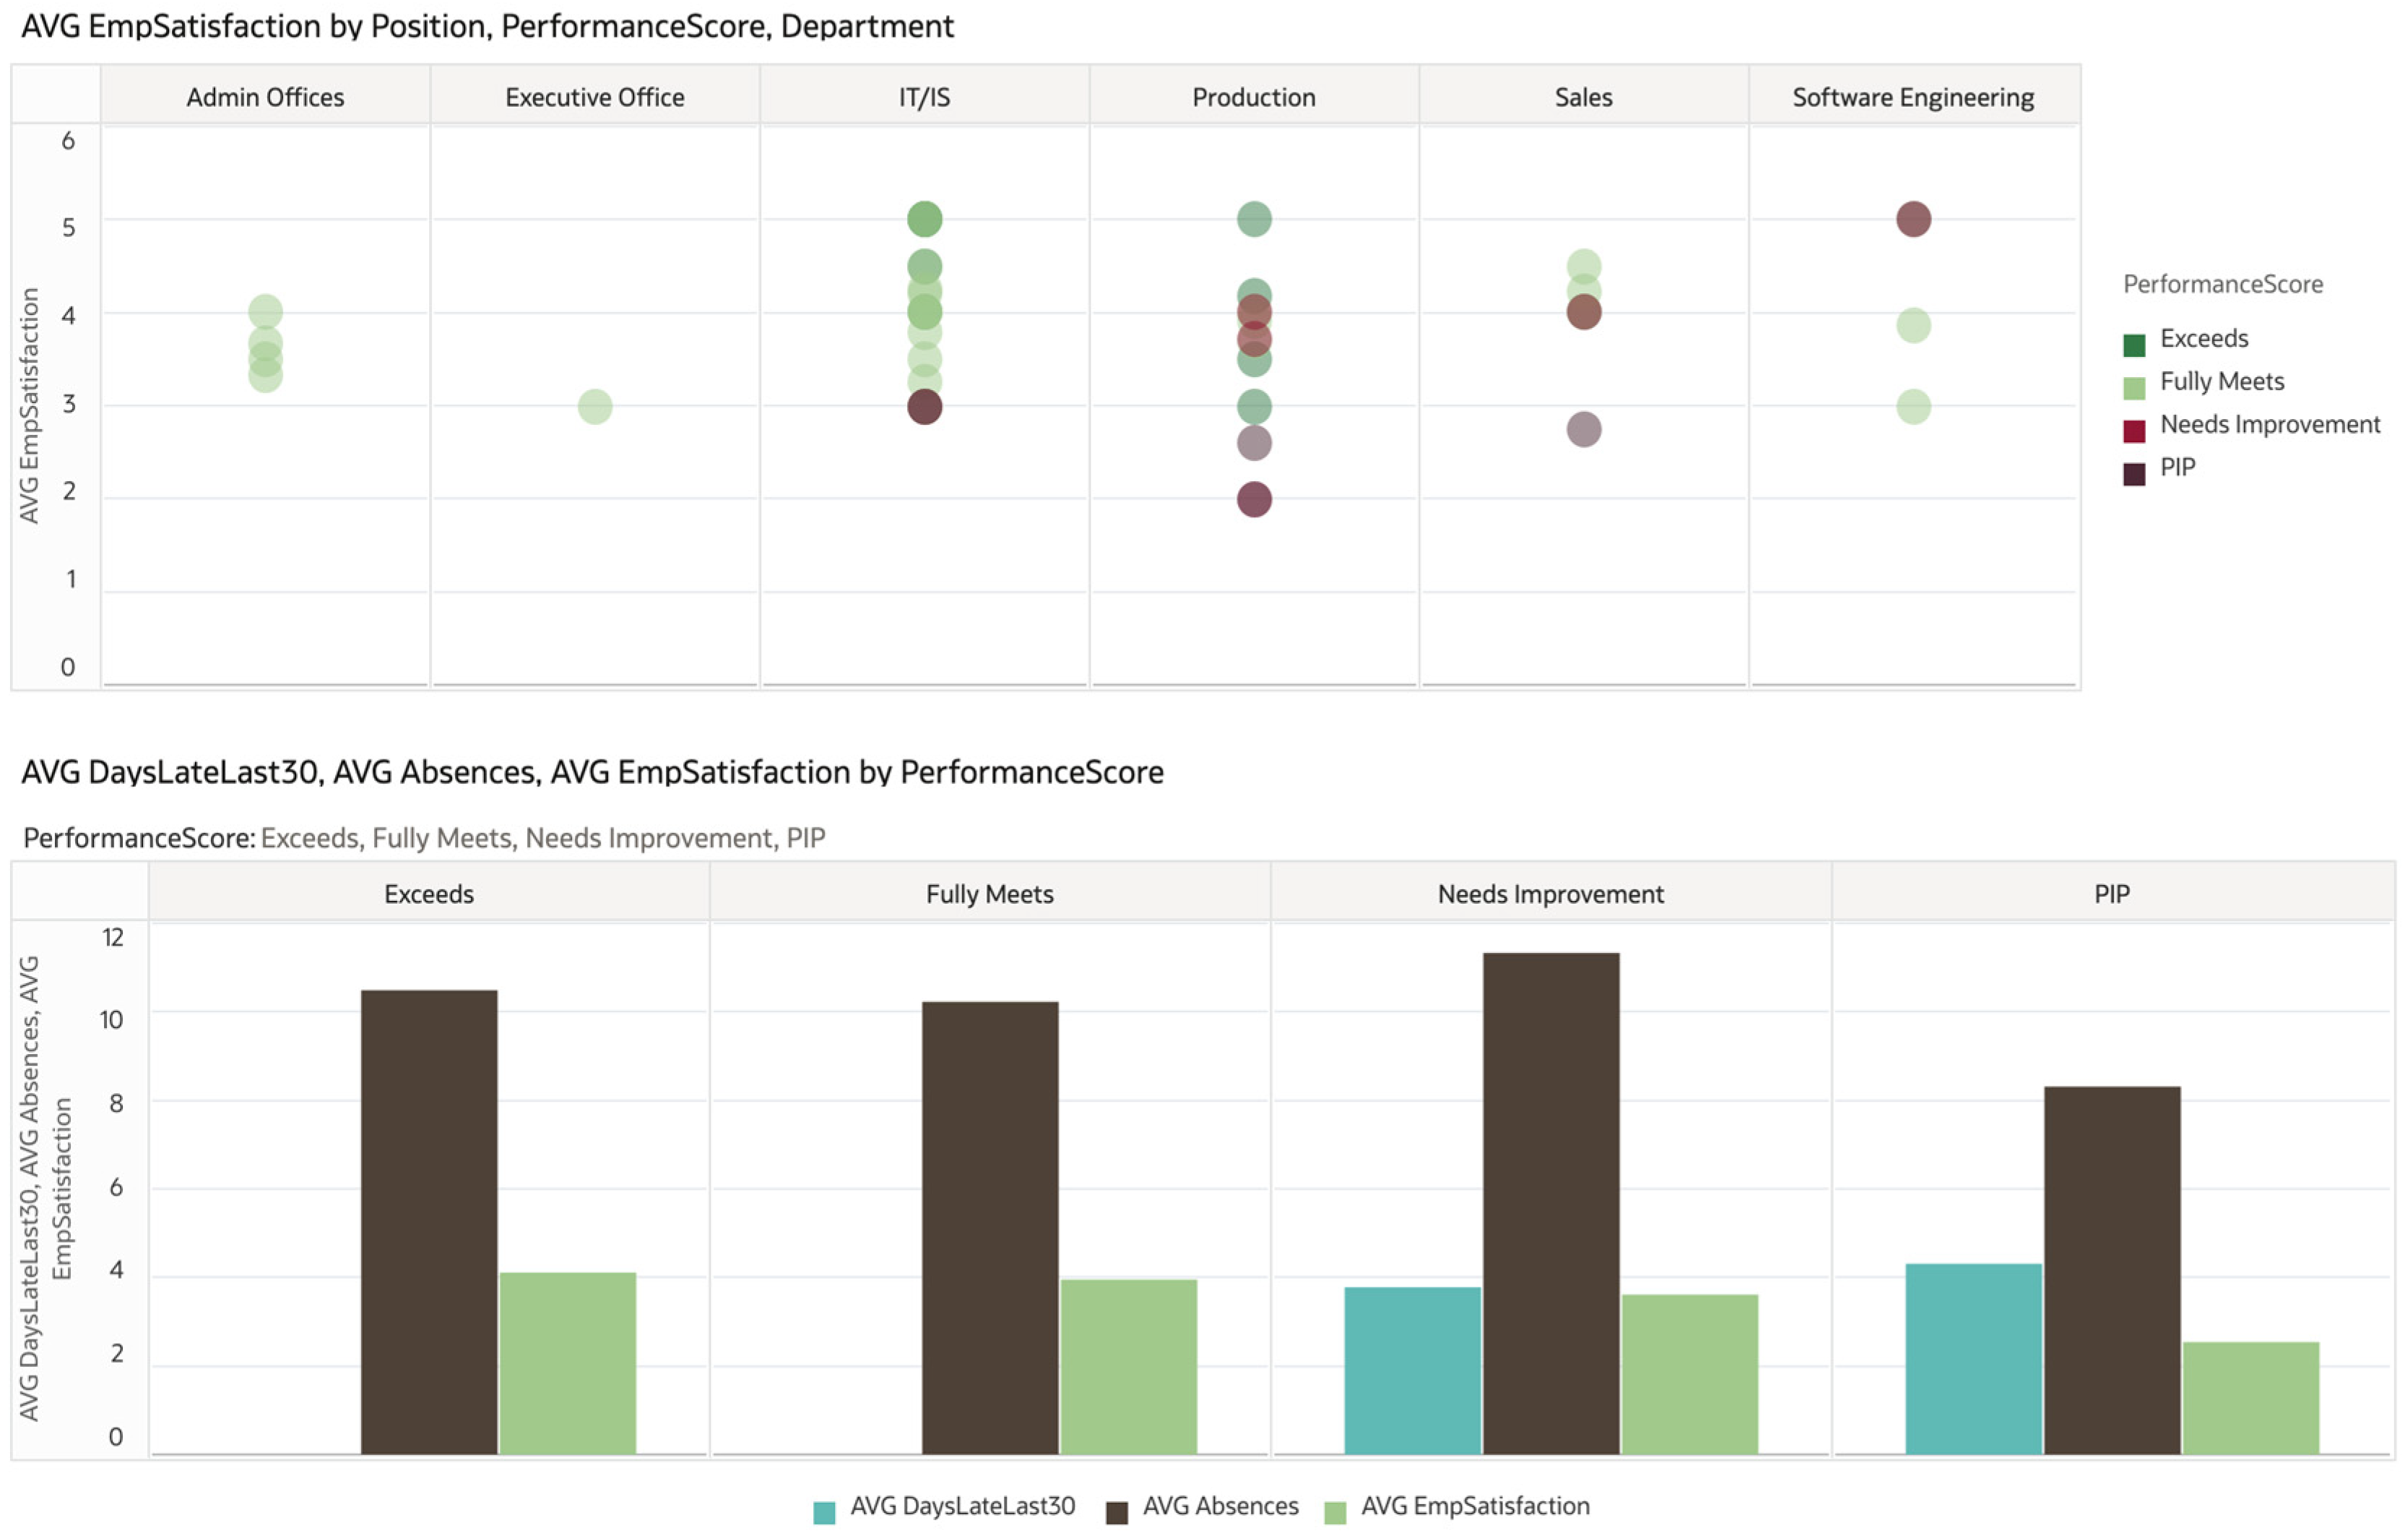
Moreover, if we look at
Figure 6, it is easy to observe, using historical data, how performance scores are distributed across departments. While Software Engineers have high levels of satisfaction but are still classified, in terms of performance, as needing improvement, the other departments, like IT/IS, Production, and Sales, have lower levels of satisfaction associated with lower performance scores. In addition, while there are absences for all employees (despite their performance), we can see that days late at work are only present for those with the lowest performance scores. Therefore, we can conclude that performance scores are not fully correlated with satisfaction; however, absences or tardiness in arriving at work are correlated with lower performances.
3.3.2. Data Cleaning and Encoding
Categorical data are frequently encountered in data science and machine learning tasks, presenting unique challenges compared to numerical data. Handling categorical variables requires preprocessing, because many machine learning models operate exclusively on numerical inputs. Thus, it is essential to convert categorical variables into numerical representations, to enable the model to effectively utilize and extract meaningful insights from them. Various encoding techniques exist for this purpose, with one-hot encoding being among the most popular methods. In one-hot encoding, each category level is compared to a chosen reference level, which is particularly useful in scenarios where there is no inherent ordering among the categories. Therefore, this is the solution used for this research study as well, to handle the categorical values [
25].
3.3.3. Data Pre-Processing
Feature scaling is a vital part of data pre-processing, so that we can build accurate and optimal machine learning models. Apart from their contributions to the models’ performances, these techniques also help to reduce the impact of outliers by avoiding the domination of those attributes which have a larger value. Feature scaling contributes to datasets that have different ranges or even different units of measurement and where variation existing in the attributes can lead to differences in model performance during the learning process. Some important techniques we need to outline for the feature scaling step are standardization, normalization, and min–max scaling.
For this research study, we will continue by applying the standard scaler method, which is a method that resizes the distribution of the data and obtains values that have a mean of zero and a standard deviation of one. This method is suitable when the characteristics of the input dataset differ in their ranges or measurement units [
26].
3.3.4. Data Selection
Considering the latest developments in technology, a huge number of computer and Internet applications have generated considerable amounts of data at an extraordinary speed. This kind of data has an important factor in common: high dimensionality, which generally imposes a large challenge for the analysis of data. Therefore, feature selection has been proven to be very effective in both theory and practice, when considering the subject of high-dimensional data analysis and magnifying learning productivity [
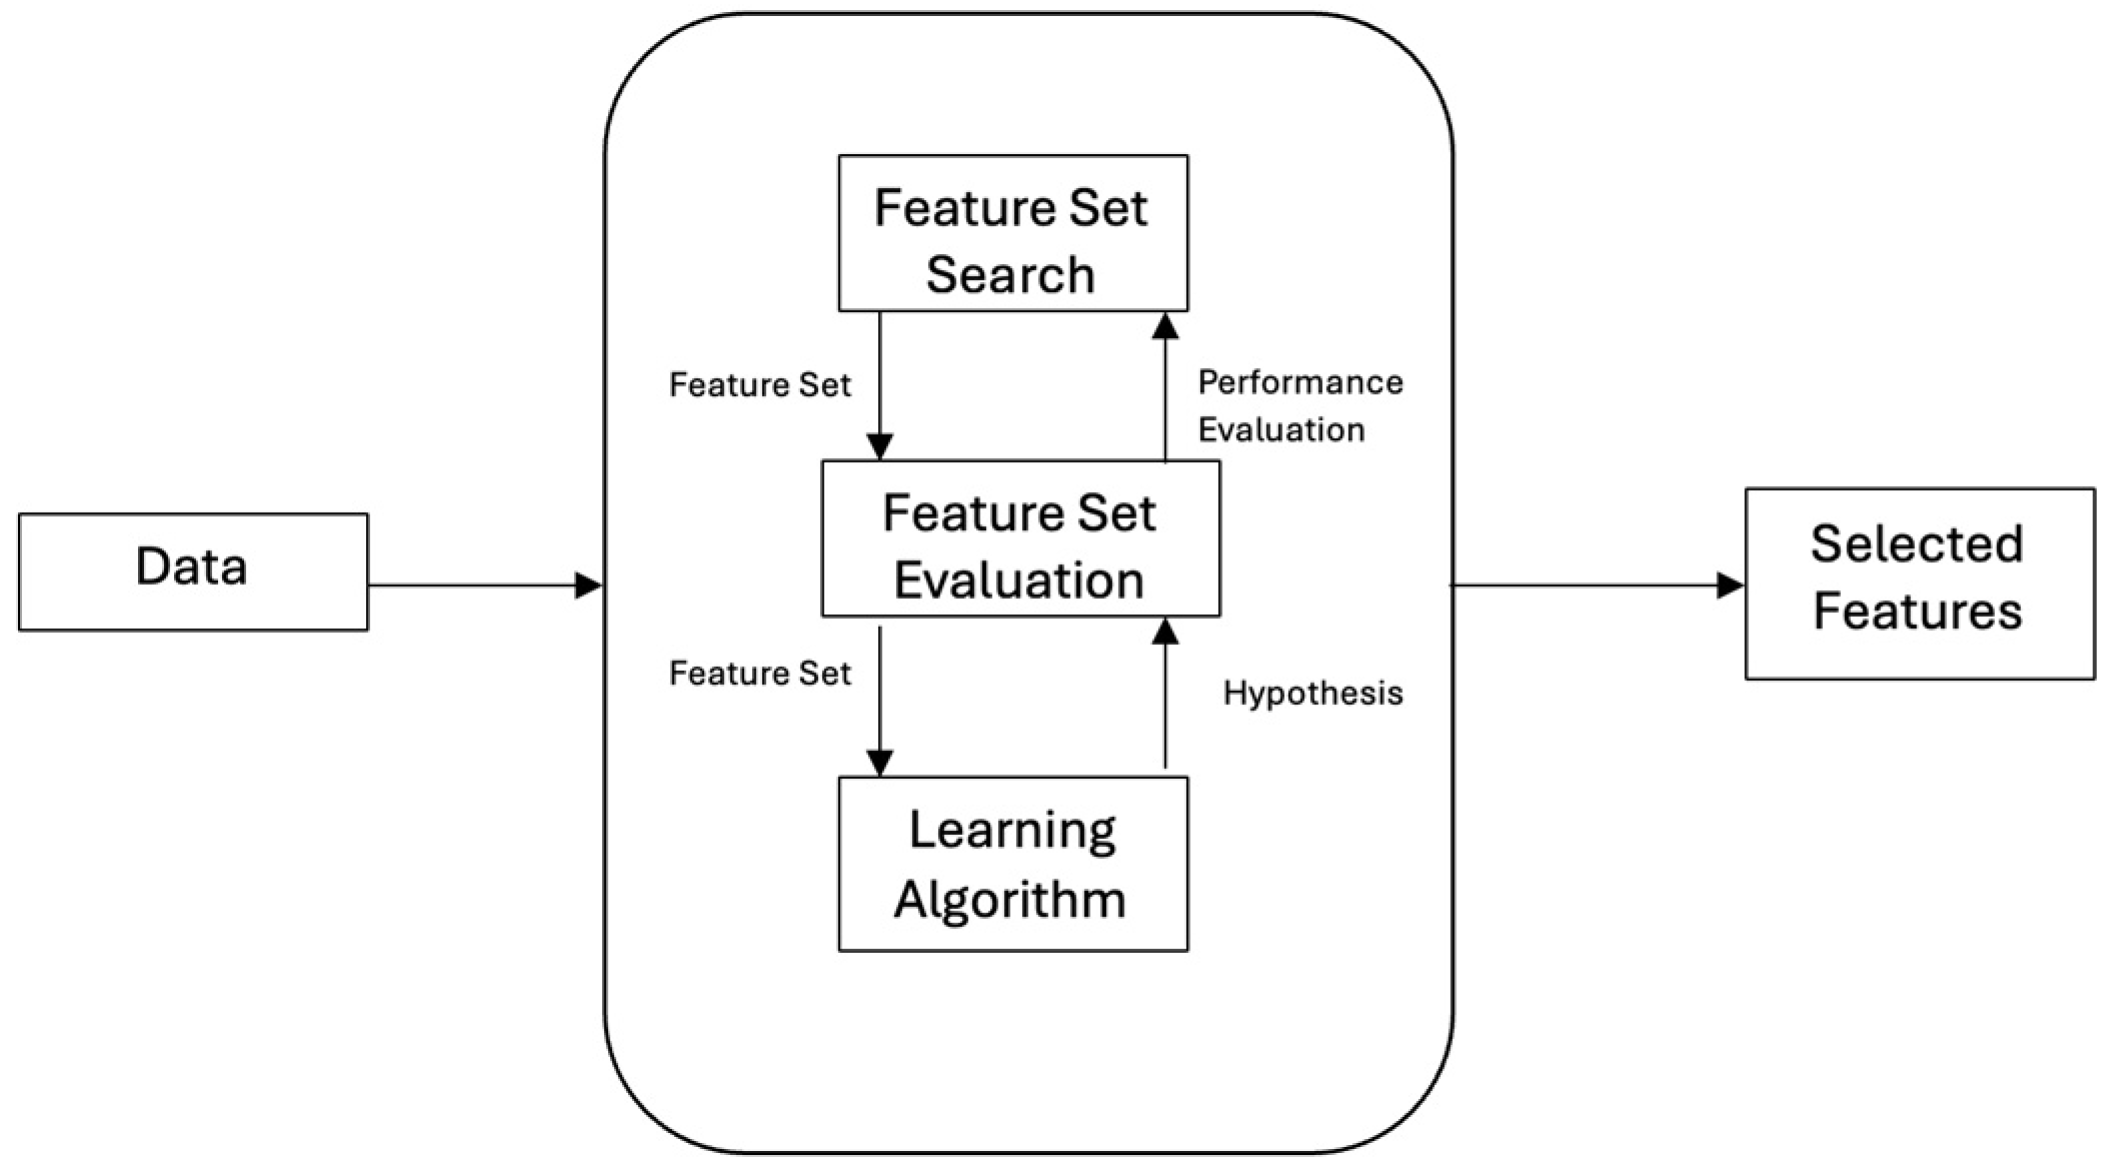
27]. We can see a detailed process flow of how this feature selection method generally works in
Figure 7, as follows:
Feature selection is the process of procuring a subgroup from the original dataset, according to certain ways of selecting the considered variables. This contributes enormously to the process of compressing data cleaning, wherein the redundant and unrelated features are removed. Feature selection methods can help to pre-process the learning algorithms, while adequate feature selection outcomes can improve the accuracy of the learning process, reduce the learning time, and simplify the learning results [
28]. Therefore, we can consider feature extraction, together with feature selection, as two important means of reducing dimensionality. In contrast with feature selection, feature extraction methods need, generally, to transform the original data into different features, which are characterized by a strong pattern identification ability, in which the original data can be seen as attributes without firm recognition abilities.
Feature selection has been demonstrated to increase the performance of classification across multiple applications. In recent studies, it has been used for a high-dimensional cancer microarray dataset, in the field of Arabic text classification, and in predicting heart diseases using bio-inspired optimization techniques [
29,
30].
The utilization of feature selection is important, especially in the areas where decision-makers do not have the ability to decide the relevance of each feature for the specific domain.
The literature in the area of feature selection can be categorized into three major areas, organized considering the selection process: filter, wrapper, or embedded methods. Of all these methods, filter techniques have attracted the most attention because of their computational efficiency. Moreover, these are independent of classifiers, therefore making these techniques suitable for problems involving a high number of features [
31,
32].
To look even closer into the existing types of feature selection methods, below there are some of the examples for each category exemplified:
- (a)
Filter methods such as univariate feature selection, correlation-based feature selection, and variance thresholding.
- (b)
Wrapper methods: Wrapper methods are a type of feature selection technique that involves training a model iteratively with different subsets of features and evaluating their impact on the model’s performance. One of the most popular techniques for this is recursive feature elimination (RFE).
- (c)
Embedded methods: A type of feature selection technique that includes feature selection as a vital aspect of the model training process. One example here is related to variable importance feature selection (from tree-based models) [
33].
In order to apply, to our particular research, the optimal methods for feature selection and to observe, as well, how they behave, we have chosen some of the most popular ones from each of the categories mentioned above. In this way, we can understand more about how these will work, in which ways they can be applied, and what are the results for the dataset proposed.
A synthesis of the results is presented in
Table 1.
It can be seen in the results above that some attributes are always relevant, regardless of the method used, such as Salary, Position, or EmpSatisfaction. This is completely understandable, because human logic will generally consider that these characteristics can be very important for an employee and could affect their overall performance. Some variables play an important role in three out of four methods, such as DaysLateLast30, RecruitmentSource, and Absences, which again are very critical when we consider the context of analyzing an employee and trying to predict their overall performance. Moreover, we can generally observe the fact that all four methods include, in their selection, variables that are related to both employees as individuals and their performance and behavior in the workplace.
To continue the study and keep this selection as relevant as possible, the first subset of variables will be considered during the data modeling step. Given that the requirement of the business is to predict an employee’s performance, the selected features are also some of the most relevant attributes that a person will consider for evaluation.
3.4. Data Modeling
In this chapter, the current work continues by looking deeper into appropriate machine learning algorithms to be used for this classification problem, according to similar research and results in the area of human resource optimization.
Therefore, we will use for our research the algorithms random forest, decision trees, support vector machine, K-nearest neighbors and XGBoost. All of these have been continuously used for classification problems, as also stated previously in this paper, producing good results and consuming an optimal number of resources. Moreover, the selection brings together both very classical and straightforward methods, and more recent and complex ones, if we refer to artificial neural network (ANN) or XGBoost.
Last, but not least, overfitting of the decided models should be always avoided, considering that the final research aims to achieve real-life and objective results. Therefore, apart from simplifying the models and applying feature selection techniques, there will also be additional cross-validation for the models chosen.
3.4.1. Cross-Validating the Models
In the initial step, after having chosen the previously mentioned algorithms, the research study will use the considered dataset to cross-validate these models and observe the results. While there are multiple ways to achieve this, one of the most popular methods used for classification algorithms is the k-fold cross validation technique, together with leave-one-out. When working with bigger datasets, k-fold should be considered as the better option, because the accuracy obtained from the training data is generally too optimistic [
34]. When using this option, the method will randomly split a dataset into k separate, roughly equal-sized segments. For each iteration, one segment is used as the test set, while the remaining k − 1 folds are combined to form the training set. A classification algorithm is then applied to this training set to create a model, which is tested on the test set. The algorithm’s overall performance is determined by calculating the average accuracy across all k iterations.
For this particular research, the value for k was considered to be five, which is optimally used for similar tests, and the results obtained for all the chosen algorithms can be seen below in
Table 2.
Having obtained these results, these will indicate the overall performance that could be achieved by providing more accurate measures of these models’ real-world effectiveness.
3.4.2. Building the Models
In order to continue with this process, the dataset spilt will first be considered, as it will help us to obtain a better distribution of data across the training and testing phases. The split will be 80% and 20% for the two categories. The next step is to use the previously mentioned algorithms to build each of the models accordingly. In the next section, each of them will be briefly described, considering that these were chosen for this kind of analysis [
35].
Random forest is one of the most recurrent algorithms used in building predictive models. This algorithm works in a very simple manner, by dividing predictor variables into multiple binary slits in order to predict outcomes. Using a selected dataset as training data together with selected subsets of predictor variables that are randomly selected, this algorithm builds multiple classifications and regression trees. Considering the results of the individual trees, there is a prediction resulting from each observation. In conclusion, random forest offers a higher accuracy than any other decision tree model, maintaining at the same time the same level of benefits specific to tree models [
36].
Considered to be one of the most popular classification algorithms, the decision tree is a mathematical tool that helps in the decision-making process. This model shows the decision and also possible outcomes, with the help of a flowchart structure that uses nodes and leaves. Multiple nodes build a node network, while those that do not have any incoming edges are generally referred to as commonly. On the other hand, all the other nodes can have outgoing edges and are considered to be internal or tested nodes, or with incoming edges, and are considered to be decision nodes. In order to decide which node should be used, the decision tree algorithm will take into consideration the information received from each node. A root node will be considered a node with the highest gain, while all the other nodes will be set on using the rest of the nodes [
36].
Support vector machine is part of the linear classifiers category of algorithms. This works by identifying different classes while separating samples using decision boundaries, commonly known as hyperplane. Linear, together with non-linear, data can be classified with a support vector machine. Nonetheless, it is largely known as the maximum margin classifier, considering the fact that it can maximize the geometric margin while minimizing the empirical classification error [
36].
In the current scenario, where there are many algorithms for the purpose of classification, KNN is considered to be one of the simplest. This method involves the action of grouping of unknown data points that have an already known class. Lastly, using the k-value along with the nearest neighbor number of the data points, the nearest neighbor is calculated [
37].
It is thought that artificial neural networks are simulations of our biological brain. They are composed of numerous simple processing units connected through weighted links. These processing units, often referred to as “neurons”, only process information available locally, either stored within or received through the weighted connections. Each unit can receive inputs from and transmit outputs to many other units. Individually, a processing unit is not very potent, producing a scalar output—a simple nonlinear function of its inputs. However, the collective operation of many such units, when appropriately combined, unleashes the system’s true capability [
38].
While the previously described algorithms are some of the most classical ones used generally for multi-classification, XGBoost comes as an implementation of grading-boosting decision trees that builds predictive models, combining the predictions of multiple models in an iterative manner. The algorithm sequentially adds weak learners every time to the ensemble, considering that each learning will focus on correcting the errors that were made by the previous one, using gradient descent optimization to minimize a predefined loss function through the training process. One of the most important features for this algorithm consists of handling complex relations in data, regularization methods that can prevent overfitting, and including parallel processing for coherent computation. Finally, this last algorithm is universally used in multiple domains, due to its high predictive performance and adaptability across various datasets [
39].
3.4.3. Optimizing the Models
The second step of our data modeling is to optimize the results previously obtained as well, since this can be achieved for each of our algorithms. Based on related works on these kinds of methods, we will discover in the next chapter of the current paper how a hyperparameter can achieve a better performance in general, what kind of methods exist in order to achieve this, and what are the solutions chosen to apply to our research. Hyperparameter tuning is an important factor for machine learning algorithms and their associated processes, and it is also recognized as the best practice for maximizing the results of a successful implementation. This method varies among the different machine learning algorithms due to the variety of parameters existing for each of them, such as discrete, continuous, or even categorical parameters. Nonetheless, this is seen as an expensive implementation, as it also engages the evaluation of multiple combinations and demands a remarkable number of computational resources. Generally, building a productive model is time-consuming, which leads to calls for distinguishing the best model obtained using hyperparameter tuning [
40].
Over the last decades, grid search has been the classical approach used for parameter optimization when using machine learning techniques, which introduces a comprehensive search throughout a predefined subset of an algorithm’s hyperparameter space used for the learning process. While there are also proposed alternative methods, such as random search, Bayesian optimization or even gradient optimization, grid search remains the most popular one, due to its parallelization capability, lack of difficulty in terms of running it, and flexibility in low-dimensional spaces. Regardless of its simplicity, this method is still expensive in terms of the computational resources needed, mainly when using multiple hyperparameters at different levels, fact that also highlights the exponential growth of the computing cost [
41,
42].
On another note, there are some other types of optimization in terms of parameters that do not work in the standard way described above. One of these techniques is known as Optuna, and it is a Python library that is dedicated to working on hyperparameter optimization, with origins in Preferred Networks, which is a Japanese organization. This open-source instrument provides a complex and automated way to search the optimal hyperparameters by applying fine-tuning steps to an objective function. In addition, this comes with a very user-friendly design and demonstrates adaptability as well over-diversified machine learning frameworks.
Regarding the way Optuna works, it firstly defines the search space by having users illustrate the range and type of hyperparameters that are going to be used for optimization. Secondly, it also defines the object function that will be in charge of evaluating the model performance, considering a set of hyperparameters. Lastly, Optuna undergoes optimization, by handling iterative evaluations, and updates of the probabilistic model, while the search space will progressively narrow down until adequate parameters are identified [
43].
Lastly, since this is a relatively new approach considered for this type of optimization, we can underline some advantages of these methods, such as efficiency, improved performances, automation, and reproducibility. While other standard methods are already well-known and generally applied in similar research, Optuna can actually reduce the time and resources needed for this process; it explores, in a systematic way, the hyperparameter space, which increases the chances of discovering an optimal structure and also provides data mining analysts and developers with the opportunity to focus more on the model, rather than on manually tuning it, since this will mostly be undertaken automatically.
3.5. Evaluation
As explained previously in this current research, multiple classification algorithms that provided the most optimal results for our business case were chosen, so that we could observe how each of these algorithms behaved. Through this process, one could not only see a comparison between them but could also conclude which of these algorithms should be used for further analysis in performance score estimation. In addition, the step of tuning the hyperparameters of the built models was also taken, to achieve even better results.
Consequently, the research will again provide a comparison between the behavior of the chosen algorithms in three different states:
- i.
without having the hyperparameters tuned;
- ii.
with a classical way of tuning hyperparameters using grid search;
- iii.
by introducing Optuna, which is a framework specific to Python libraries that should provide an even better performance and results.
Table 3 presents the results specifically regarding precision, recall, accuracy, and F1 score for all the combinations possible, obtained as described above.
In the brief analysis conducted, the research evaluated all the models based on several key metrics: precision, recall, F1 Scores, and balanced accuracies.
Precision is calculated as the number of true positives divided by the sum of true positives and false positives. It is a measure of a model’s accuracy in predicting positive cases. The formula is as follows:
where TP represents true positive cases and FP represents false positive cases.
Recall assesses the model’s ability to correctly identify all actual positives. The formula for recall is as follows:
where TP stands for true positive cases and FN stands for false negative cases.
Accuracy reflects the proportion of true results (both true positives and true negatives) among the total number of cases examined. The accuracy formula is as follows:
where TP is true positives, TN is true negatives, FP is false positives, and FN is false negatives [
44].
While accuracy is commonly used to assess classification algorithms, it might not always be suitable, especially in cases of imbalanced class distribution. In contexts where minimizing false negatives holds significance, recall gains importance. Conversely, precision takes precedence when the goal is to minimize false positives. Moreover, the F1 score is introduced as a metric that combines precision and recall, offering a balanced assessment. This nuanced approach to model evaluation helps to ensure that the metrics chosen are aligned with the specific objectives and challenges of the classification task at hand [
45].
where Precision and Recall are described above.
By looking at each of these algorithms, one can immediately observe that decision trees and XGB obtained the best results in terms of performance, with F1 scores of approximately 91%. On the other hand, it can be concluded that KNN and ANN performed worst for our case study, with very low percentages for all the attributes reviewed above.
Moreover, for decision trees, each type of hyperparameter tuning provided better and better results, resulting in Optuna obtaining the best scores. However, for XGB, it is observable that grid search did not provide better results for the scores analyzed compared to the classical model; Optuna managed to obtain, even here, the best result.
On a general note, Optuna provided better and equal scores for accuracy, precision, and F1 score for all the considered algorithms, which can help us conclude that this is indeed a good technique, even for classification algorithms, for achieving a better performance. On the contrary, the same cannot be admitted regarding grid search, which provided even worse results, as we can see in the example obtained for SVM and XGB.
Finally, in order to continue this analysis and follow the step of applying these algorithms to new data, in order to achieve the prediction of performance scores, the firm conclusion is that XGB would be the best solution, considering also the resources used for running this algorithm.
3.6. Deployment
In order to continue with the deployment phase, as was mentioned before, it is clear that XGBoost will provide the best performance while optimizing the computational resources used for this process. Of course, as the best results have been obtained by applying hyperparameter tuning with the Optuna framework, this step will also be included in the deployment phase. Optuna addressed the challenges and offered an enhanced solution through the development of its framework. This innovative method provided a change to its users by dynamically generating a search space, while providing an abundance of tailored sampling, searching, and pruning algorithms for effective implementation. According to the amount of data to be classified, as well as the changes that might appear in the variables considered for training the model, the feature selection methods might vary, as well as the algorithms used for classification.
In order to include this type of analysis in a relatable eco-system, using the batch processing for analyzing data could be considered, since more data as inputs means better results in the end. Moreover, to automate the whole pre-preparation steps needed for every iteration of the training the algorithm, data pipelines could be considered, as well as different platforms used for repetitive steps that could be triggered automatically [
46].
Another important step of the deployment phase is the collection of feedback, regarding the results received in comparison to the ones expected. Comparing these periodically and observing the efficiency of the different algorithms, as well as, from time to time, applying the whole selection of algorithms again to understand if the outputs have changed, could lead to an overall improvement in performance. Nonetheless, it is mandatory to also check the associated efficiency coefficients all the time and be aware if any changes appear in the training process.
Last, but not least, as part of this section, it should be considered in the final implementation the biases that could appear. Since the results could highly affect the overall employment process and development, it is crucial to take into consideration the fairness of the results.
4. Discussion
Considering the objective of this research, it is certain that there is a clear focus on developing a machine learning algorithm and providing a method to create a more automatic and objective model for scoring performance. However, it is important not to forget the fact that these kinds of approaches can be dangerous, as, in case something is not working as expected from the start of the process, humans would not be available to correct that [
47]. Therefore, as the study has been conducted on a small dataset, this should only be used as a starting point. Humans can supervise or they can also develop similar analyses and the results could be compared, while very different results could be flagged for a second analysis. In this way, not only could this process be improved, but the subjectivity could be lowered.
Moving on to the data that have been used, considering the standard dataset specially created for this kind of analysis, it is much simpler to address the accuracy and balance of the dataset, so that the data can be used at their real value, as opposed to other situations where this can represent a large challenge in the process [
48]. Therefore, specifically to address this important step, the first section of the research focused on feature selection, not only as a method to optimize the classification algorithm, but also as a conclusion to understand the best variables for objectively determining performance scores, it was concluded that Salary, Position, and EmpSatisfaction are commonly seen, no matter the method used; however, it proved to us, once again, that compensation, along with work/life balance and additional perks, contribute enormously to overall performance scores. Moreover, variables such as DaysLateLast 30, RecruitmentSource, and Absences also contribute a lot to performance scores for most of the methods. In this area, other studies confirmed that JobTitle, UnivType, and Age can be decisive for employee performance. In addition, other educational factors, such as degree and grade, affected performance scores very little; however, these results were all obtained using classification techniques [
49]. On the other hand, even though similar research studies have been presented, they do not underline or reconfirm the most significant attributes that will lead to the best performance in the end [
13,
17].
Looking at related papers regarding types of classification problems using supervised algorithms, it was determined, once again, that classical algorithms are still the most popular ones used across different datasets and data types. In human resources management, the most classical ones have been chosen for tests, and results have varied. Some decided that naïve Bayes behaves well in terms of some data types and business problems, while others concluded the same for decision tree and XGBoost. However, looking closer, XGBoost has been mostly tested on attrition problems and classification, rather than on determining employee performance scores. Therefore, in addition to the general algorithms used for previous classification problems in predicting performance scores, this research added artificial neural networks and XGBoost. While the former provided some of the worst results, XGBoost managed to provide the opposite. Therefore, the search could confirm that XGBoost could easily be the best solution for classification problems even when talking about predicting employee performance scores, with some of the best results in terms of time and resource consumption as well.
Another important factor added to this study was observing how all these algorithms performed when hyperparameter tuning was added for each of them. Analyzing related works, it can be concluded that grid search was one of the most used and well-known methods for this type of optimization, because of its simple implementation [
50]. However, while this is a classic approach, it comes with some downsides as well, especially regarding computational costs. Looking into recent developments in this area, Optuna was discovered, a framework designed to work in a more automatic manner and help with parameter tuning. Despite its novelty, this is already known to work very well and also reduce the number of resources needed. Similar studies show that Optuna, even when compared with other similar frameworks and not with classical approaches of hyperparameter tuning, still provides the best results and takes less computing time than HyperOpt [
50]. By applying both methods, it was demonstrated clearly that Optuna provides better results, especially for decision trees and XGBoost. There are indeed some implementations that are not so challenged by introducing this tuning methods; therefore, better results are not generally obtained for random forest. Another important category is the one that includes all the other examples where grid search did not help in any way with performance, but instead provided worse results, even though Optuna managed to maintain the same level of performance. In the end, the most important conclusion is the fact that this research provided a framework in terms of best performances and also for performance prediction, by adding Optuna as the best method for improving the algorithm’s performance [
51].
5. Conclusions
Human resources represent a vital domain in any organization, especially nowadays, when resources are generally limited and used at their full capacity. As there are multiple changes happening in different domains, industries, and technologies, people start to differentiate from one another, based on their skills and their adaptability capacity. Therefore, as outlined by several other research works in this area, having skilled, flexible, motivated, and productive workers becomes a great challenge for any organization, but, ultimately, a great need [
52].
When considering human resources and data mining, several ideas come into discussions for improving businesses and overall performance, such as automating the recruitment process, CV selection, employee turnover, employee satisfaction, yearly reviews, and performance scores. All these areas are connected. This paper has focused on performance scores, and we have understood from previously mentioned related works that poor performance at work leads to involuntary attrition; therefore, it could be considered that one solution can contribute to solving more than one problem. While standard performance scores are generally provided at the end of a working year, this might come too late into the picture, since previous situations or conditions cannot be changed. Therefore, this is the reason why this paper is considering predictions based on previously known factors related to both the work environment and individual characteristics. Since performance reviews are normally performed by direct managers, this also includes the idea that the evaluations might be biased, due to the relationship existing between the two people. Consequently, this gives us another reason to believe that working on a prediction algorithm will not only contribute to the overall mechanism, but it will also transform this process into a more objective one.
One of the main challenges while developing such an analysis can be availability of the data. The variables inside the dataset could also contribute to the end results and overall conclusions; therefore, having so few available datasets make this analysis even harder to perform. On the other hand, it is equally challenging to even be able to introduce such an analysis, as ethical norms should be considered. Therefore, adding to what has been also mentioned in pre-processing steps, for real data, data minimization and anonymization steps should be added. Of course, when extending this analysis into wider optimization for human resources processes, it is mandatory to take into consideration data security and access control, receiving informed consent where this is the case, and following legal regulations. Another important aspect that should be mentioned is related to the fact that this kind of analysis would eventually replace analyses carried out by humans, especially since one of the final objectives is to also optimize, i.e., reduce, resources [
53]. However, in such cases, another limitation could extend to bias and a lack of fairness, in the case that the dataset is not correctly built to include all the needed details for such an analysis. While the process develops and the data are trained on new batches of data regularly, a process of comparing human results with prediction could be introduced, at least until the entire process arrives to a maturity and the level of confidence regarding the number of details collected for each employee is high.
Moving forward to the possible extensions of the current research, there are some areas that could benefit and even include this type of study, in the field of human resources. First of all, the results obtained could help to identify talent as part of the hiring process, considering that there are some characteristics that are specific to the best performers, and one organization can look after them. Additionally, it could be used to evaluate the hiring process and resource allocation. When the factors that help a person to perform better as known, it is easier to provide benefits in the early stages of the hiring process that could attract very skilled professionals, as well as offering specific tasks to those that are more skilled in one area than another. Lastly, feedback collection and development are very important domains wherein this research could contribute [
54]. Being careful and also warning an employee about their performance in the early stages of the review could lead to collecting more feedback from these employees, so that problems or requests can be reviewed rather sooner than later. In the same manner, knowing someone’s intentions, performance, and engagement can also contribute a lot in achieving more accurate and individually adapted development plans.
Finally, this paper managed to provide a set of methods, algorithms, and best practices that need to be applied in order to increase the performance scores of a classification prediction. While similar methods have been used before for other types of data or classification problems (such as attrition), this research has provided the ideal combination for use with the chosen problem. Additionally, it is worth mentioning the challenges faced during this research, which are mainly focused on data availability, collection and volumes. Nonetheless, the means to extend the current paper would include using all the other feature selection results, applying the same steps and comparing the results. In this way, another conclusion could be drawn, related to the best feature selection method to be used when trying to predict performance scores using the given attributes.


