Article

Structural Health Monitoring for Prefabricated Building Envelope under Stress Tests

by
Laura Vandi
1,
Maria Teresa Calcagni
2,
Francesco Belletti
1,
Giuseppe Pandarese
2,
Milena Martarelli
2,
Gian Marco Revel
2,
Vincent Docter
3 and
Alessandro Pracucci
1,4,*
1
Focchi S.p.A., 47824 Poggio Torriana, Italy
2
Department of Industrial Engineering and Mathematical Sciences, Università Politecnica delle Marche, 60131 Ancona, Italy
3
PhotonFirst International, 1812 SC Alkmaar, The Netherlands
4
Levery S.r.l. Società Benefit, 47814 Bellaria Igea Marina, Italy
*
Author to whom correspondence should be addressed.
Appl. Sci. 2024, 14(8), 3260; https://doi.org/10.3390/app14083260
Submission received: 14 February 2024 / Revised: 25 March 2024 / Accepted: 27 March 2024 / Published: 12 April 2024

Abstract

:
This paper details the comprehensive activities conducted in a laboratory setting to assess the structural health monitoring (SHM) of prefabricated building envelopes. Integrating sensors into building components like curtain wall facades poses challenges but offers opportunities for monitoring structural health, requiring compliance with regulatory standards. The research investigates the possibility of defining a kit of conventional and multi-parameter sensors integrated within the building envelope to monitor its behavior during the performance test conducted. The kit of sensors also includes Fiber Optic Sensors for effectively monitoring building envelope behavior and structural integrity. In this context, the European project InComEss (H2020-GA862597) aims to define a stand-alone solution for SHM using Piezoelectric Energy Harvesting Systems (PE-EHS) for façade monitoring through FBG/FOS system. After analyzing the main façade structural stress, a series of FBGs, accelerometers, and force washers were integrated within a 1:1 scale façade prototype and tested in a laboratory following the test sequence parameters required by the curtain wall standard EN 13830. The data collected were analyzed with the aim of monitoring the façade behavior before and after the tests. The results show that the façade’s performance passed the assessing test criteria without reporting any damages. In addition, the outcomes demonstrated the effectiveness of the defined kit of multi-parameter sensors for the building envelope’s SHM.

1. Introduction

The building environment’s increasing reliance on smart technologies opens up opportunities for a deeper understanding and consequent service operations of building performance within the so-called Intelligent Building [1,2]. The relevance of data-driven approaches within the smart built environment is consolidating dynamic control for energy optimization and occupant well-being within building automation [3,4].
This field involves the continuous and real-time assessment of a structure’s structural integrity, allowing for the early detection of potential issues such as deterioration, damage, or unforeseen structural changes. In the dynamic and ever-changing urban environment, where buildings are subjected to diverse loads, environmental conditions, and unforeseen events, structural health monitoring (SHM) serves as a proactive measure to mitigate risks and enhance the resilience of structures [5]. By leveraging advanced sensing technologies, data analytics, and monitoring systems, SHM empowers engineers and stakeholders with valuable insights, enabling timely interventions, maintenance, and, ultimately, the optimization of overall performance and safety.
In recent years, both civil construction and the building sector have explored the utilization of sensing technologies for SHM embedded in their structure [6,7]; in particular, focus has been given to the SHM of bridges [8,9]. However, the integration of sensors into non-load-bearing structures, such as a curtain wall façade, represents an increasing topic that needs to be further investigated. Indeed, this component faces the risk of sudden breakage, vulnerability to severe weather conditions, and unexpected collisions. These variables present significant obstacles to maintaining the longevity and dependability of these architectural elements. Recent research focused on the SHM of glass curtain walls of a super-high-rise building by integrating thermocouples in a real building to monitor the temperature distribution [10] with the aim of avoiding thermal shock or monitoring the wind effect on a single-layer cable net with modern curtain walls [11]. SHM sensors in no-load-bearing building components are also useful for analyzing the actual behavior of buildings and the relationship between the building response and the damage caused by earthquakes [12]. Moreover, other solutions for façade SHM could be investigated without directly integrating sensors within the façade; indeed, the study conducted by Brell-Cokcan and Co. investigated the possibility of developing an automated system that scans the façade surface through a projector light with the aim of detecting defections and alerting the automized components’ replacing system positioned at the façade perimeters [13].
Investigating sensing solutions embedded in prefabricated façades becomes a perspective opportunity, as demonstrated by the exploration of smart applications for other building applications [14,15]. Indeed, as the interface between the internal and external environments, building envelopes serve as invaluable indicators of a building’s structural health. For these reasons, compliance with regulatory standards, such as EN 13830 [16] and CWCT’s ‘Standard for Systemized Building Envelopes’-Part 8 Testing-Section 8.12.2 [17], is compulsory. Therefore, performing a mock-up validation is required to ensure the façade’s functional efficacy and safety. The validation process, outlined in detail in Table A1 and reported in Appendix A of these standards, provides a systematic sequence of steps for conducting the validation phase. Each parameter critical to the façade’s performance and safety undergoes evaluation within this framework. Structural integrity and functioning are scrutinized to guarantee compliance with established benchmarks. Indeed, by adhering to these standards, the industry demonstrates a commitment to upholding safety and operational standards in curtain wall façade construction ensuring safety of curtain wall façades, mitigating risks, and safeguarding the well-being of occupants. The standards also defined assessing criteria for each test paraments for verified the façade behavior during each test. These criteria, reported in Table A1 of Appendix A, determine the test pass or failure limit values.
Within this scientific and technological context focused on façade applications, this research investigates the possibility of defining a kit of conventional and multi-parameter sensors integrated within the building envelope to monitor its behavior during performance tests. During the research, the kit is validated with the aim of demonstrating its effectiveness and replicability for structural health monitoring of building envelopes. Therefore, an analysis of conventional sensors was conducted to determine the most suitable ones. Fiber Optic Sensors (FOS) featuring Fiber Bragg Gratings (FBGs) [18,19] are examined with the goal of demonstrating potentialities and limitations for their application in building envelopes. Together with FBG sensors, the possibility of integrating conventional devices was investigated; therefore, vibration sensors and force washers have been explored to monitor structural conditions [20]. Numerous research works have not only considered the use of accelerometers to detect the impact of weathering and external forces on buildings for structural analysis, to monitor the behavior in infrastructure [21] and historical building behavior [22], or to quantify the seismic damage in building structure [23], but also for the identification and verification of possible structural damage because of the stresses imposed on the structure under investigation by performing a modal analysis before and after the events [24]. In fact, modal parameters can be used to evaluate the safety condition of a structure and assess structural health based on modal parameters [25]. Deng et al. [9] demonstrated that temperature is an important factor that affects the natural frequency of the bridge, and it is not negligible. Therefore, the temperature must be controlled in order to not consider a variation in frequency only due to temperature change as a damage indicator. Strain gauge-based force washers have also been considered as commercial sensors to monitor bolt irregularities [26]. This research focuses on monitoring the structure behavior during the performance of the standard compliance tests for wall curtain façades; the temperature variation results in a few degrees between days since they were accelerated tests, and thus they were performed in short duration even if the temperature is monitored during the performance of the test.
In line with these research and technological scenarios, the EU-funded InComEss project [27] aims to define a stand-alone solution for SHM using Piezoelectric Energy Harvesting Systems (PE-EHS) for façade monitoring [28], and this paper presents the structural health monitoring sensing solutions within the InComEss architectural system [29]. The architectural design of the InComEss system is geared towards harnessing the potential of Piezoelectric Energy Harvesting Systems (PE-EHS) to supply energy to a fiber optic sensor, MonadGator. This interrogator reads data from FBG and communicates with a Power Conditioner Circuit (PCC) seamlessly integrated with a Printed Circuit Board (PCB) powered by a locally implemented Supercapacitor (SC). The connection between the PCC/PCB, an Internet of Things (IoT) gateway, and a cloud-based IoT monitoring platform facilitates data collection and analysis. The overarching objective is to showcase the practicality of Wireless Sensor Networks (WSNs) for structural health monitoring (SHM). Based on the InComEss system architecture conceptualization, the PE-EHS and FBG sensors are designed to demonstrate their integrability within a prefabricated façade. Figure 1 shows the InComEss architecture underlining the components embedded within the façade and the digital components.
The first considerations presented are related to physical components such as the FBG sensors. This product represents an application for the façade demo case, and during the InComEss project, it will demonstrate the potential of its applicability for SHM in the building envelope market. An optical fiber consists of a core and cladding. The cladding of the fiber has a typical diameter of 125 μm while the core has a diameter of typically ~10 μm. The core has a higher refractive index than the cladding, such that the light is captured in the core. A Fiber Bragg Grating is a periodic modulation of the refractive index in the fiber core. A representation can be seen in Figure 2.
The period of the refractive index modulation determines the wavelength of light that is reflected. Due to temperature or strain, the period of the modulation, and thus, its reflected wavelength, will change. Due to this principle, FBG sensors serve dual roles as both strain and temperature detectors. When mounted within a hollow capillary, an FBG sensor exclusively detects temperature changes, disregarding strain. The sensor’s wavelength indicates temperature variations through a fixed, linear conversion based on glass material properties. The MonadGator interrogator is the measurement device developed to measure the shift in Bragg wavelength of the FBG sensors. The system uses a light source that emits a broadband wavelength spectrum through the fiber toward the FBG sensors. The reflected wavelength is measured by the MonadGator and converted to a strain or temperature. This MonadGator is designed to operate with low power consumption. Figure 3 reports the InComEss architecture, showing how the energy generated powered the MonadGator for the FBG sensors.
An Arduino nano is used to rapidly start up the MonadGator and execute a measurement of the FBG wavelength. The broadband light source is turned on for a period of 70 ms. In that time span, the FBG sensor is read, and the data from the photodiodes are acquired by the Arduino. These data are transferred using a Bluetooth Low Energy (BLE) connection to the IOT gateway. The Arduino is powered by a power conditioning circuit, which is charged with the energy that is harvested from the energy harvester connected to this circuit. A total measurement cycle, including wireless data transfer, takes less than 150 ms and uses only 0.08 J of energy per measurement.
In this scenario, the research aims to investigate the possibility of integrating a kit of sensors for structural health monitoring (SHM) into the curtain wall facade to monitor its behavior post-installation. Therefore, this paper outlines the results achieved by the SHM sensors during a performance test, wherein a full-scale facade prototype was subjected to various weather and mechanical conditions in a controlled laboratory environment. The objective was to monitor the facade’s behavior under stress from weather conditions and accidental impacts. The paper’s objectives are to investigate and provide original contributions in the scientific field to support analyses useful for establishing monitoring solutions integrated into building envelopes using low-consumption sensing technology. Additionally, it aims to explore potential applications within facade components to define the stress application of Fiber Bragg Grating (FBG) and Fiber Optic Sensors (FOS).
Furthermore, the study seeks to validate the facade’s integrability and the effectiveness of the multi-parameter sensor kit for facade SHM, along with the measurement method employed.
This paper is structured as follows: Section 2 presents the methods used for the identification of SHM’s sensors to be integrated into the façade, along with the tests conducted for their validation and the design and integration activities in the façade; Section 3 presents the outcomes of the laboratory test activities, displaying collected data and graphical representations for SHM sensing technologies; Section 4 highlights the relevant insights that SHM integrated into the façade can provide and identifies gaps for its application; Section 5 summarizes the main achievements related to the paper’s goal of analyzing SHM opportunities within stand-alone solutions as the one proposed by InComEss architecture and suggests further investigations needed for market adoption.

2. Materials and Methods

This section offers an overview of the developed methodology, including the stages involved, and delineates the materials utilized for conducting the research activities presented in this paper, specifically focusing on the selection of SHM sensors and the testing set-up.

2.1. Method

The methods are focused on the stages deployed for the SHM’s sensing solutions adopted within the InComEss system architecture with the following development stages.

2.1.1. Analysis of Façade Structural Stress

The analysis of structuring components to be monitored is investigated with the objective of examining the stress conditions and the range of operations, consequently deriving the sensing solution needed. The comprehensive evaluation of these components to be monitored addresses the final structural health monitoring sensing technologies to be included in an SHM configuration.
Given their exposure to various environmental stressors, such as wind, temperature fluctuations, moisture, accidental impact, and seismic activity, façades are susceptible to degradation and structural issues over time. Consequently, defining the components and parameters relevant to façade monitoring becomes important for effective maintenance, timely detection of defects, solution replicability, and proactive mitigation of risks. Indeed, during the research, a list of possible façade defects to be monitored and relative parameters based on structural analysis and an internal key stakeholders’ interview was defined. Table 1 presents the façade parameters, their description, and the range of value acceptable for the façade structural health together with the selected monitoring sensors.
Therefore, Table 1 summarizes the most relevant parameters in terms of façade safety, scheduled for monitoring, accompanied by a selection of the suitability of employing FBG technology and conventional sensors for each defined objective. Alongside FBG, conventional sensors will also be applied in the façade system with the aim of defining a complete kit of sensors for building envelope SHM. Therefore, the kit of sensors selected for the façade monitoring, based on possible façade defects, are described as follows:
  • FBGs—Previous applications demonstrated the effectiveness of these technologies in the building and infrastructure sectors, such as bridges [29,30,31], concrete, wood [32], and steel structures, where strain and temperature have so far been the dominating measurands of interest. Utilizing conventional FBG sensors for SHM in building façades offers significant advantages over electrical strain gauges. Unlike electrical strain gauges, which require multiple wires per sensor point, leading to scalability issues, FBG sensors allow for multiplexing multiple sensors into a single fiber. This feature makes FBG sensors highly suitable for environments requiring numerous sensor points, such as the building envelope sector. The main advantages are their lightweight characteristics, single-ended connections, water and corrosion resistance, and absence of electric current in the measurement array, making them suitable for embedding within or attaching to a structure [33], which make them suitable for embedding within or attaching to a structure. In addition, research on integrating FBG cables into the façade system involved examining critical factors to determine the optimal configuration. Key considerations included the FBG cable’s bending radius, path within façade components towards the monitoring system for efficiency and aesthetics, sensor position, cable dimensions, lengths, thickness, and material properties for fixing method (e.g., glue, silicone). In this research, the use of FBG for temperature monitoring is integrated into the InComEss architecture. Given that the MonadGator can monitor only one FBG at a time, it was connected to the FBG for temperature, which requires punctual monitoring. The integration of FGB for temperature in the glazed façade design should prevent thermal shock episodes in vision and spandrel parts caused by solar radiation and light converting to IR. Installing temperature sensors can prevent damage and provide data for future thermal shock designs. Conversely, conventional FBGs for strain were selected to investigate further applications and to compare their results to those of conventional sensors such as accelerometers. In this case, FBGs for strain are connected to a conventional switchgator, allowing for measuring multiple FBGs and powered by commercial energy.
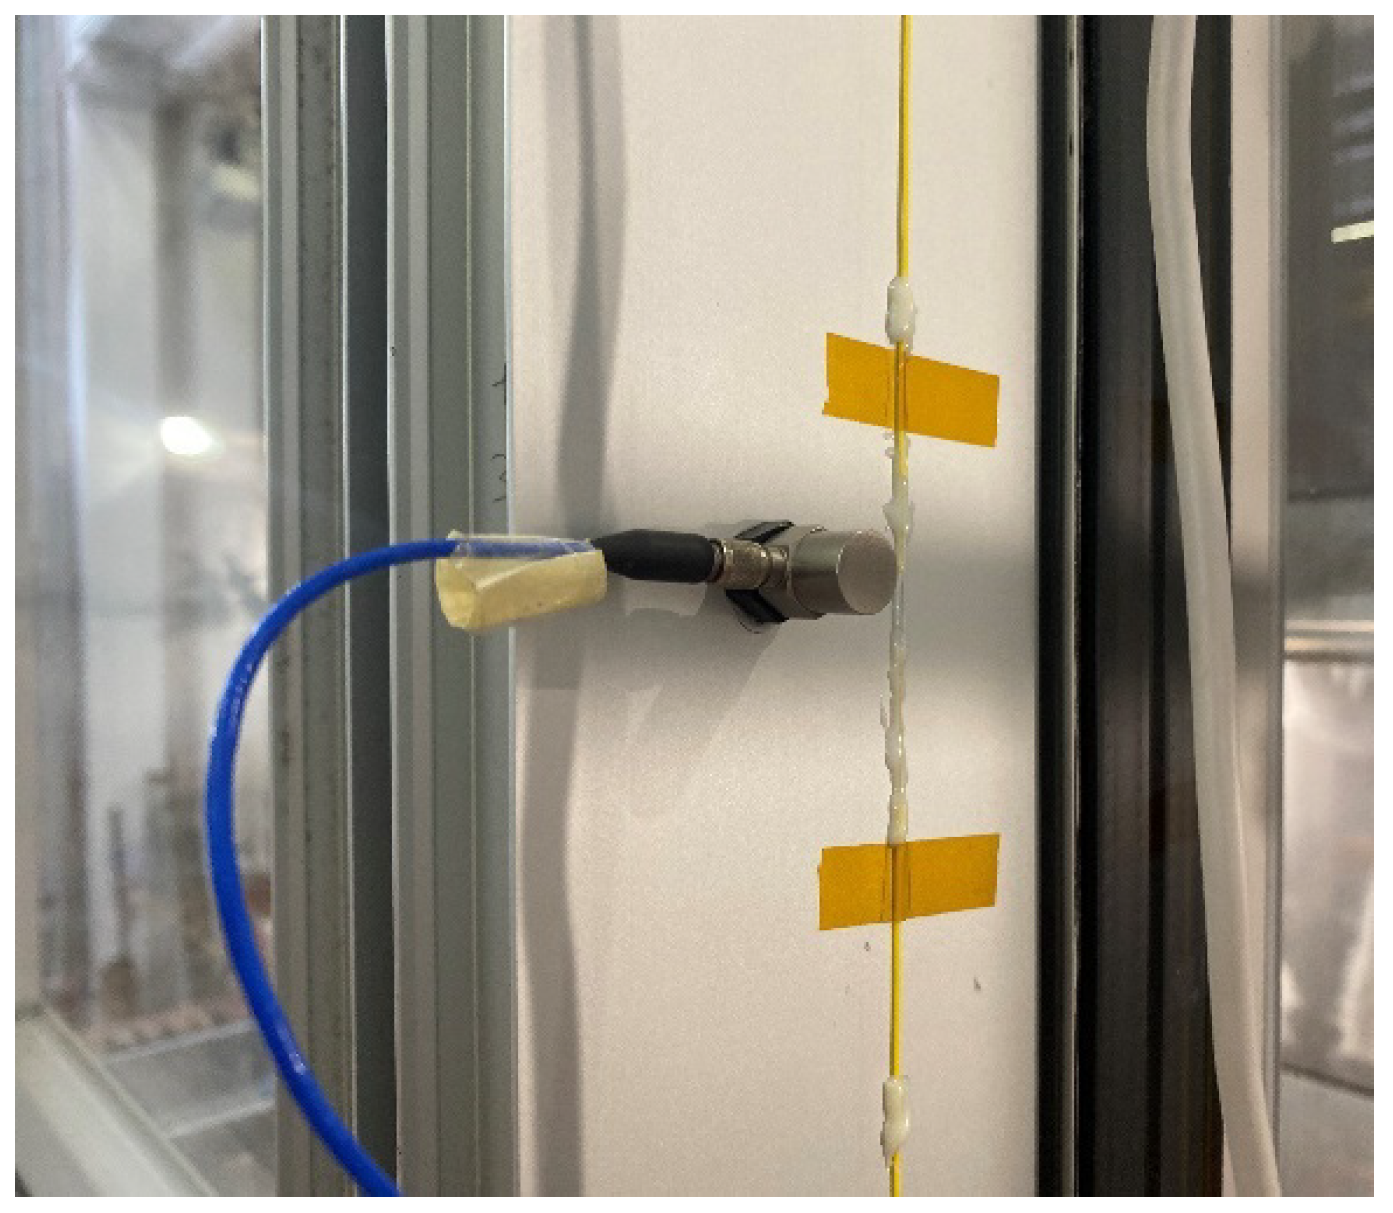
  • Accelerometers—Vibrational sensors have been considered for the monitoring of a structure combined with IoT systems [20]. The vibration signals encompass parameters such as displacement, velocity, and acceleration. Accelerometers prove to be efficient instruments for detecting vibrations. Several studies have been conducted with accelerometers, starting from the structure analysis to identify the weathering and excitation agents affecting the buildings [21,22,23,34,35] Positioned on curtain wall façades, they detect dynamic forces such as wind or seismic activity, providing insights into structural health by converting vibrations into electrical signals for frequency, amplitude, and duration analysis [35]. Indeed, in this research, accelerometers were used with the following two aims: The first was to evaluate the structural status of the curtain wall façade, performing a modal analysis—one before the tests of compliance and the other one at the end of the tests. The second was the monitoring of the structure during the compliance test to understand the phenomenology of the event affecting the structure. For the façade integration, the sensors were selected based on their dimensions, water-tightness characteristics, and functionalities. Accelerometers are connected to commercial data collectors.
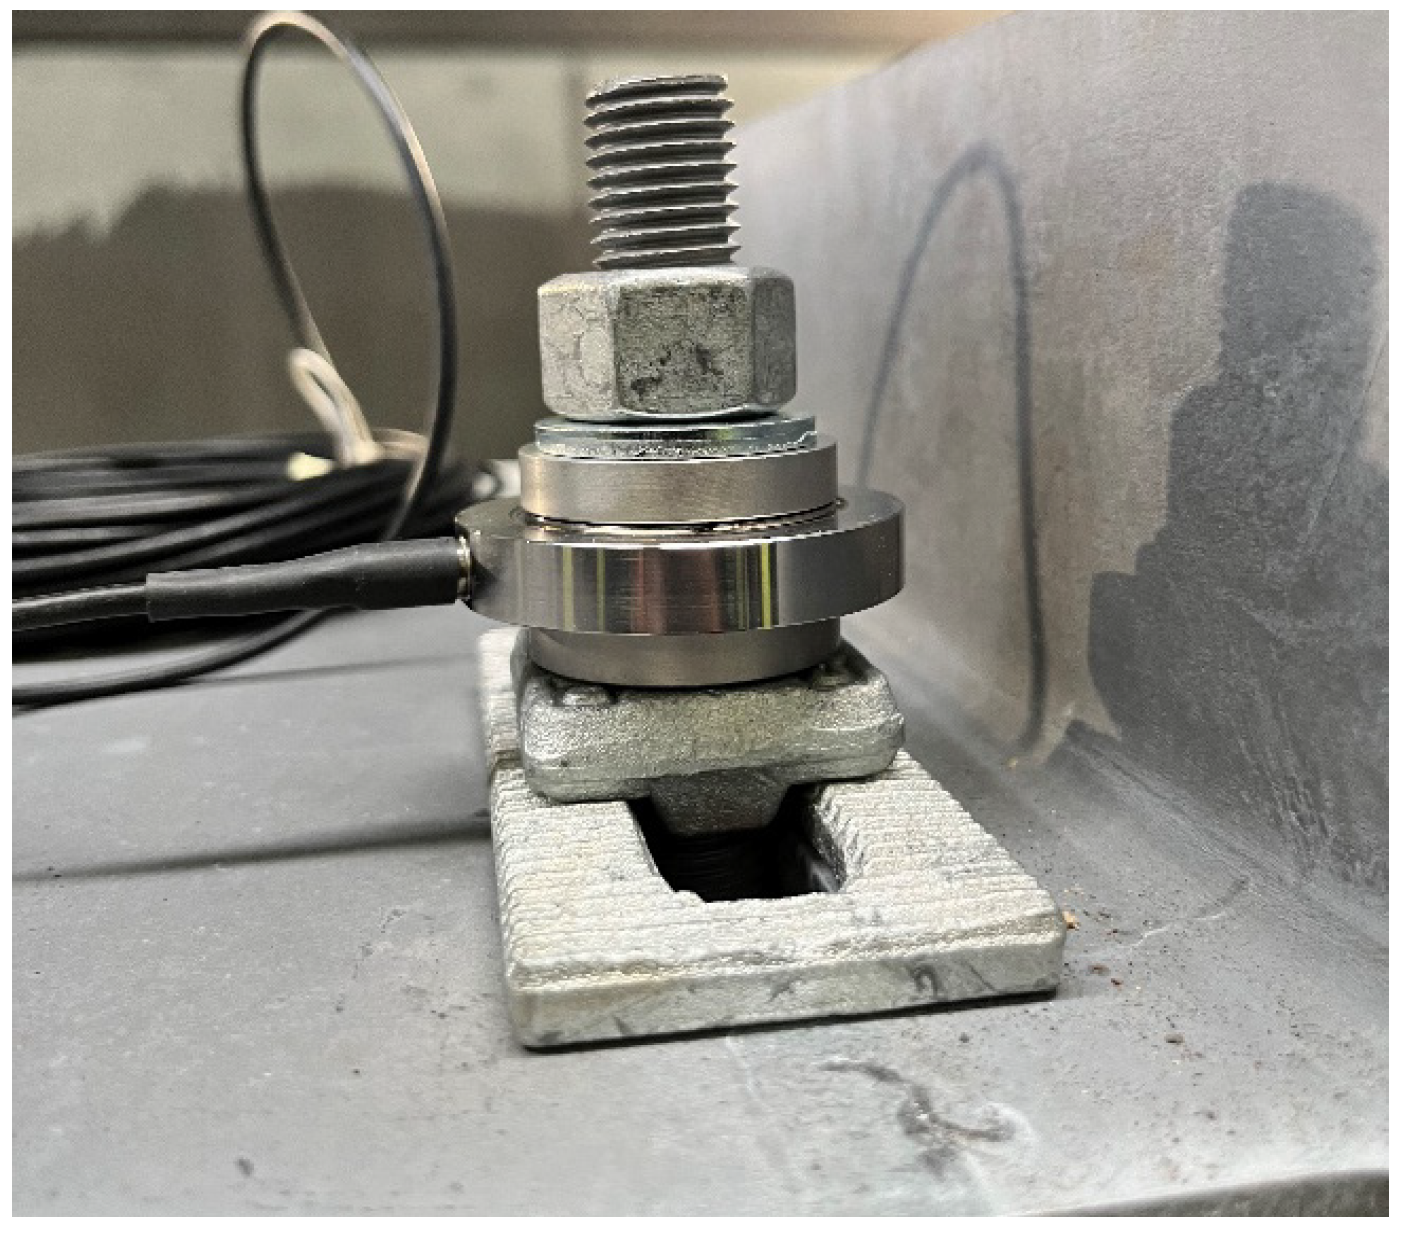
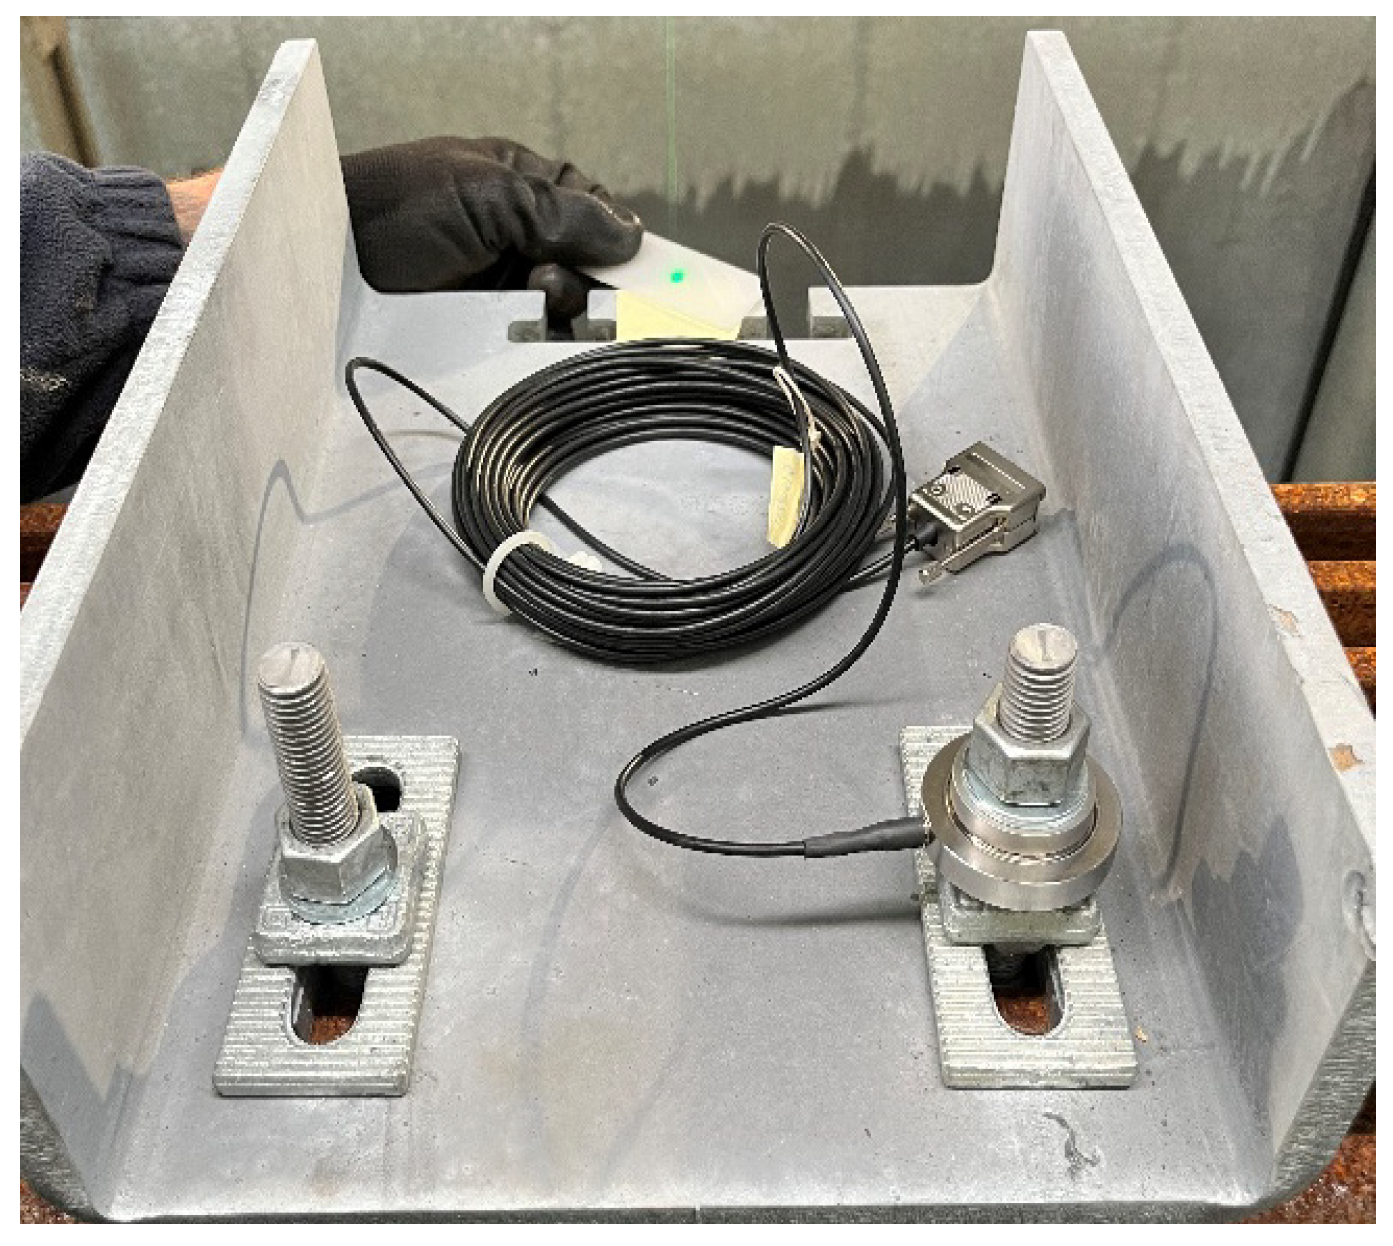
  • Force washers—The curtain wall façade relies on precisely torqued screws within a bracket system, which is essential for accurate positioning and optimal performance [36,37]. Therefore, an issue that could affect the life cycle of a structure could be bolt anomalies. Dominika Ziaja et al. analyzed and proposed a procedure for fault detection, as well as for the determination of their location and type, using IoT [26]. This is why, for our project, a non-destructive system, the strain gauge-based force washers—useful for the measurements of the bolt’s load—were installed and strategically placed within these brackets to facilitate accurate measurements, providing insights into façade response under diverse conditions. These washers record structural deformations, aiding in ongoing assessment of façade integrity and performance, enhancing structural resilience and efficiency.
In this research, the information exploited by the force transducers was combined with the information from the accelerometers.

2.1.2. Sensing Technologies Integration in Façade

Structural sensing technologies are designed for integration in façade, studying their applicability during off-site façade manufacturing, as well as during installation.
The integration of these sensors underwent a thorough examination involving an analysis of several key parameters. Dimensions were examined to determine compatibility and correctness for its application. Further consideration was given to the sensors’ positioning, factoring in orientation and functionality to optimize data collection effectiveness. This included assessing the efficacy of data obtained, co-locating commercial sensors near Fiber Bragg Grating (FBG) sensors for direct comparative analysis, and situating sensors to monitor critical components of the facade, such as the center of transom width, the center of mullion height, and the center of the ventilated cavity. Additionally, the routing and length of cables connecting the sensors were analyzed to ensure efficient signal transmission and practical installation. The fixing system methodology was examined to guarantee stability and reliability in data acquisition. This comprehensive analysis contributes to an informed understanding of the integrated sensor system’s performance within the context of the monitored facade. In Section 2.3, the final sensor integration designed for the testing activities is reported.

2.1.3. Testing Activities and Outcomes Analysis

The laboratory tests for structural health monitoring sensing technologies were analyzed based on multiple testing conditions to obtain a complete comprehension of their behavior under weather conditions. The FBG/FOS and conventional sensors were analyzed to wrap up potentialities and limitations within real environment applications.

2.2. Materials

The materials adopted for the research activities were:
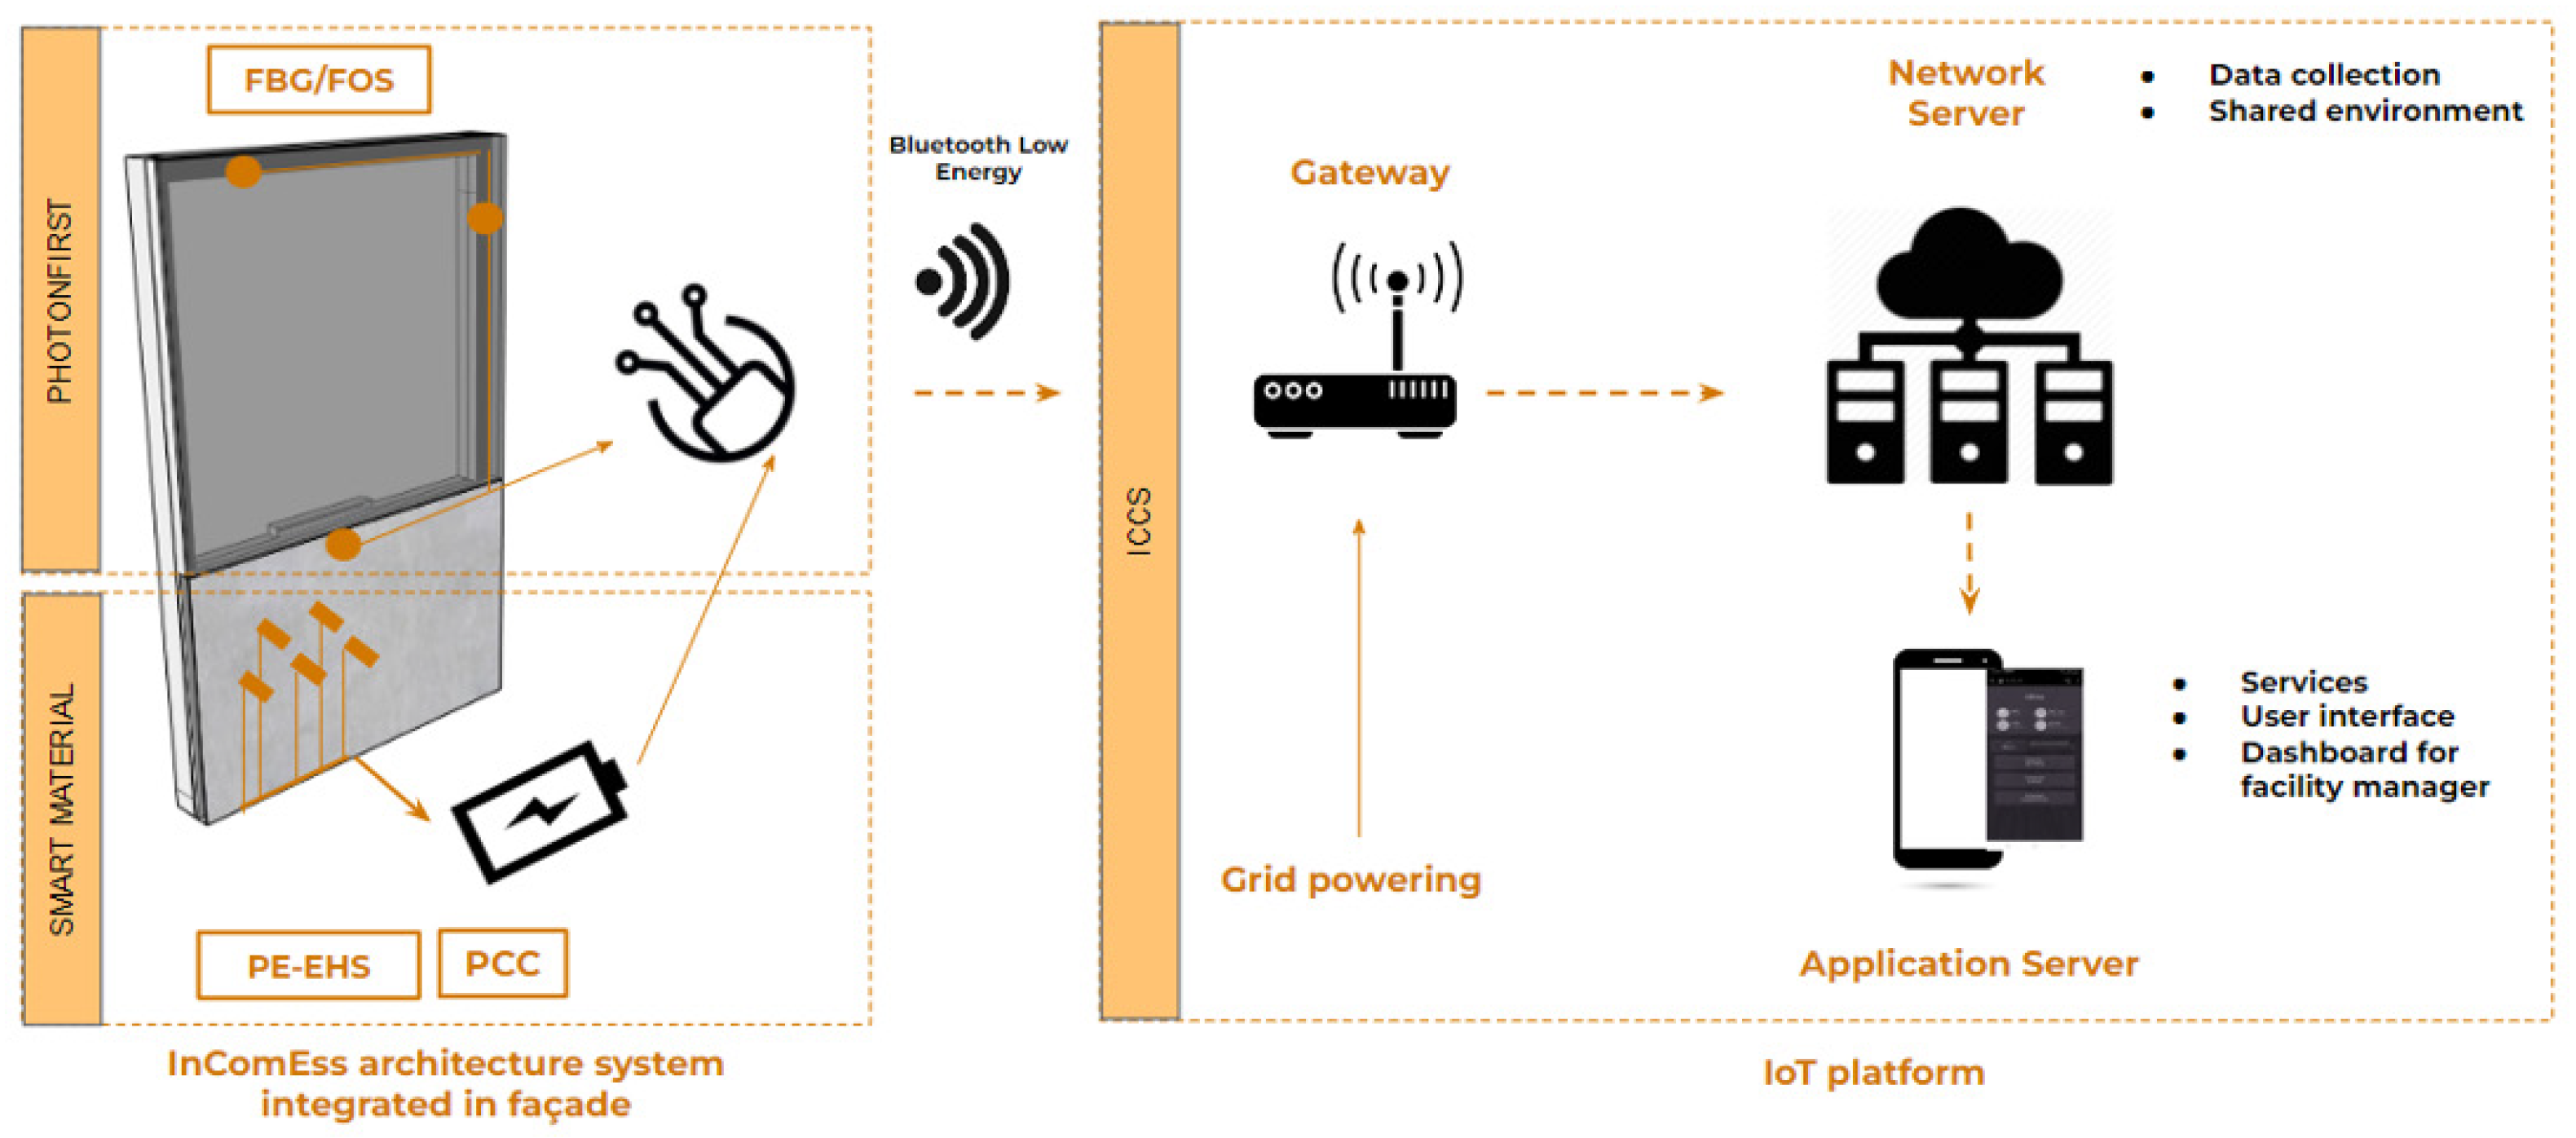
  • InComEss components—the research was based on component development within the InComEss project [27] concerning the FOS MonadGator. The FOS MonadGator is based on a low-energy consumption solution for data gathering and transmission of the InComEss system architecture. The FOS MonadGator needs 3.3 V to be powered.
  • On-market sensing solutions for SHM:
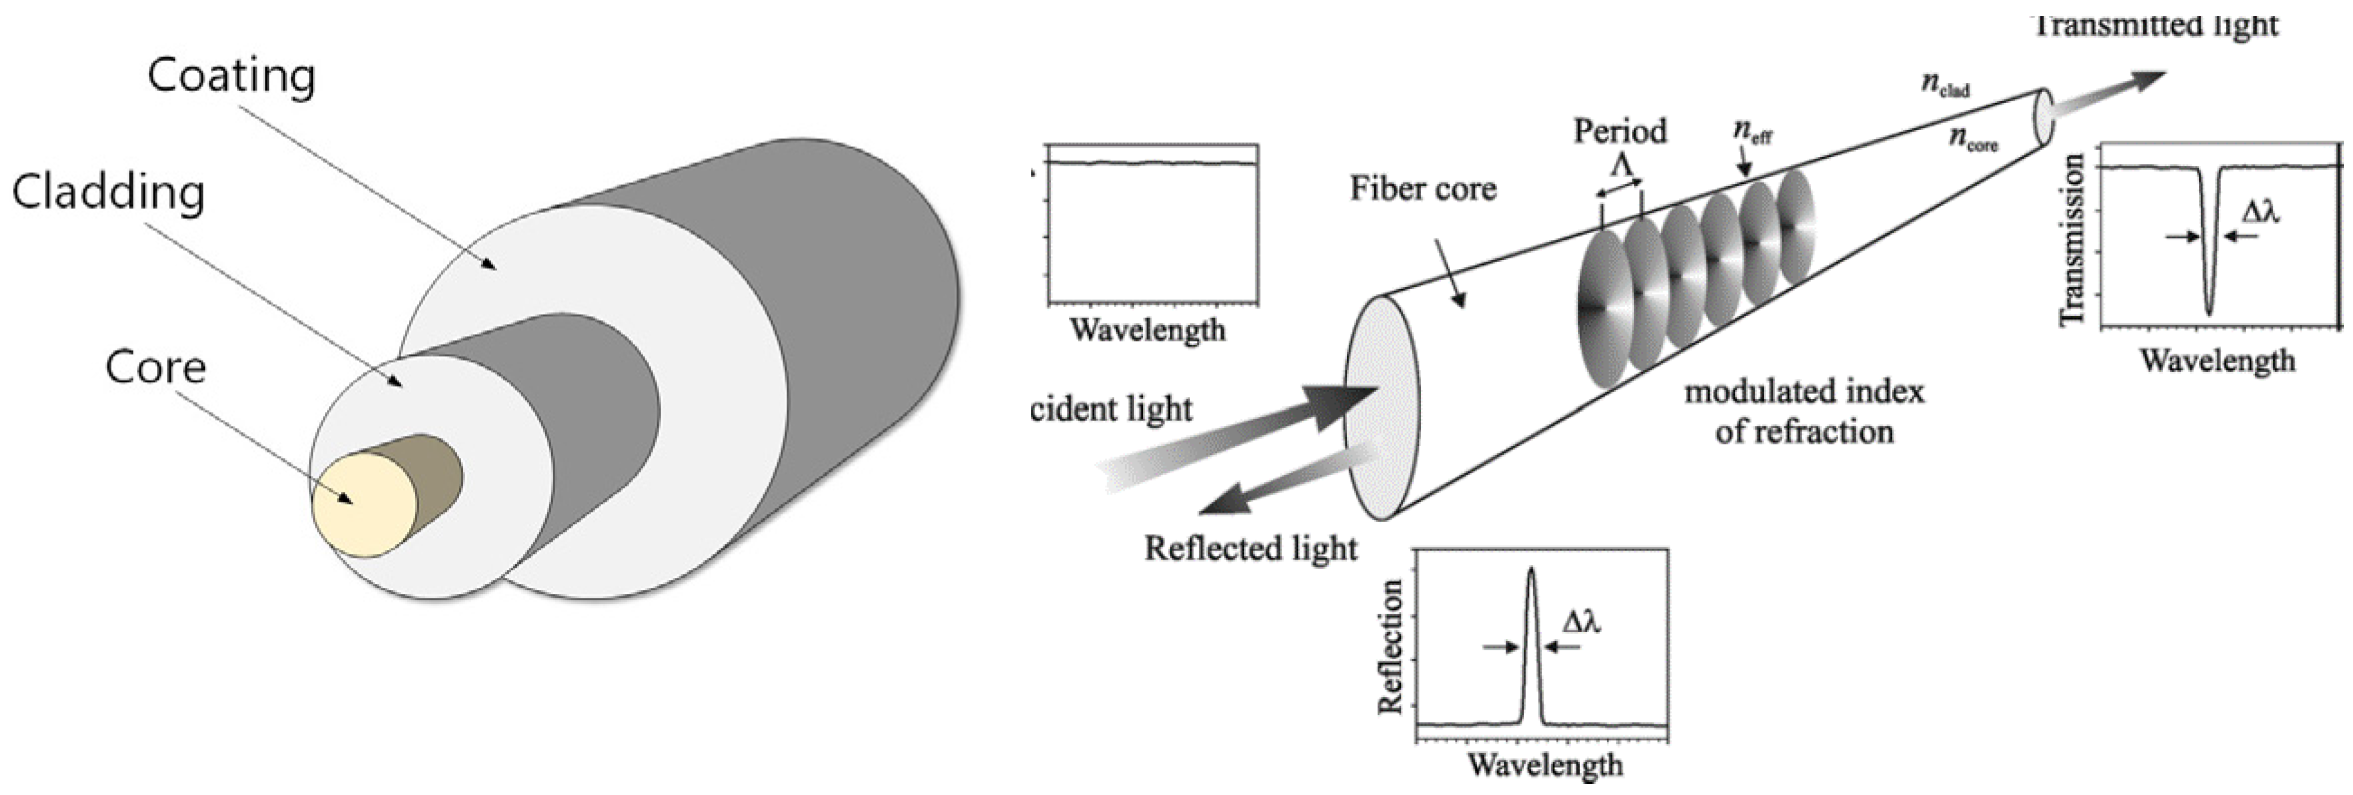
    • FBG for FOS to monitor stress conditions of façade. The selection of FBG is based on well-established sensors on the market. The InComEss project did not expect to investigate and develop FBG solutions. The FBG used for this research was a fiber type SM1250B, with a length of 9 mm, a reflectivity of 45%, and 3 dB bandwidth of 0.16 nm. The FBG coating is a fiber polyamide.
  • Sensors in the field of structural health monitoring to monitor stress conditions of façade to collect data not collectible from FBG, such as the following:
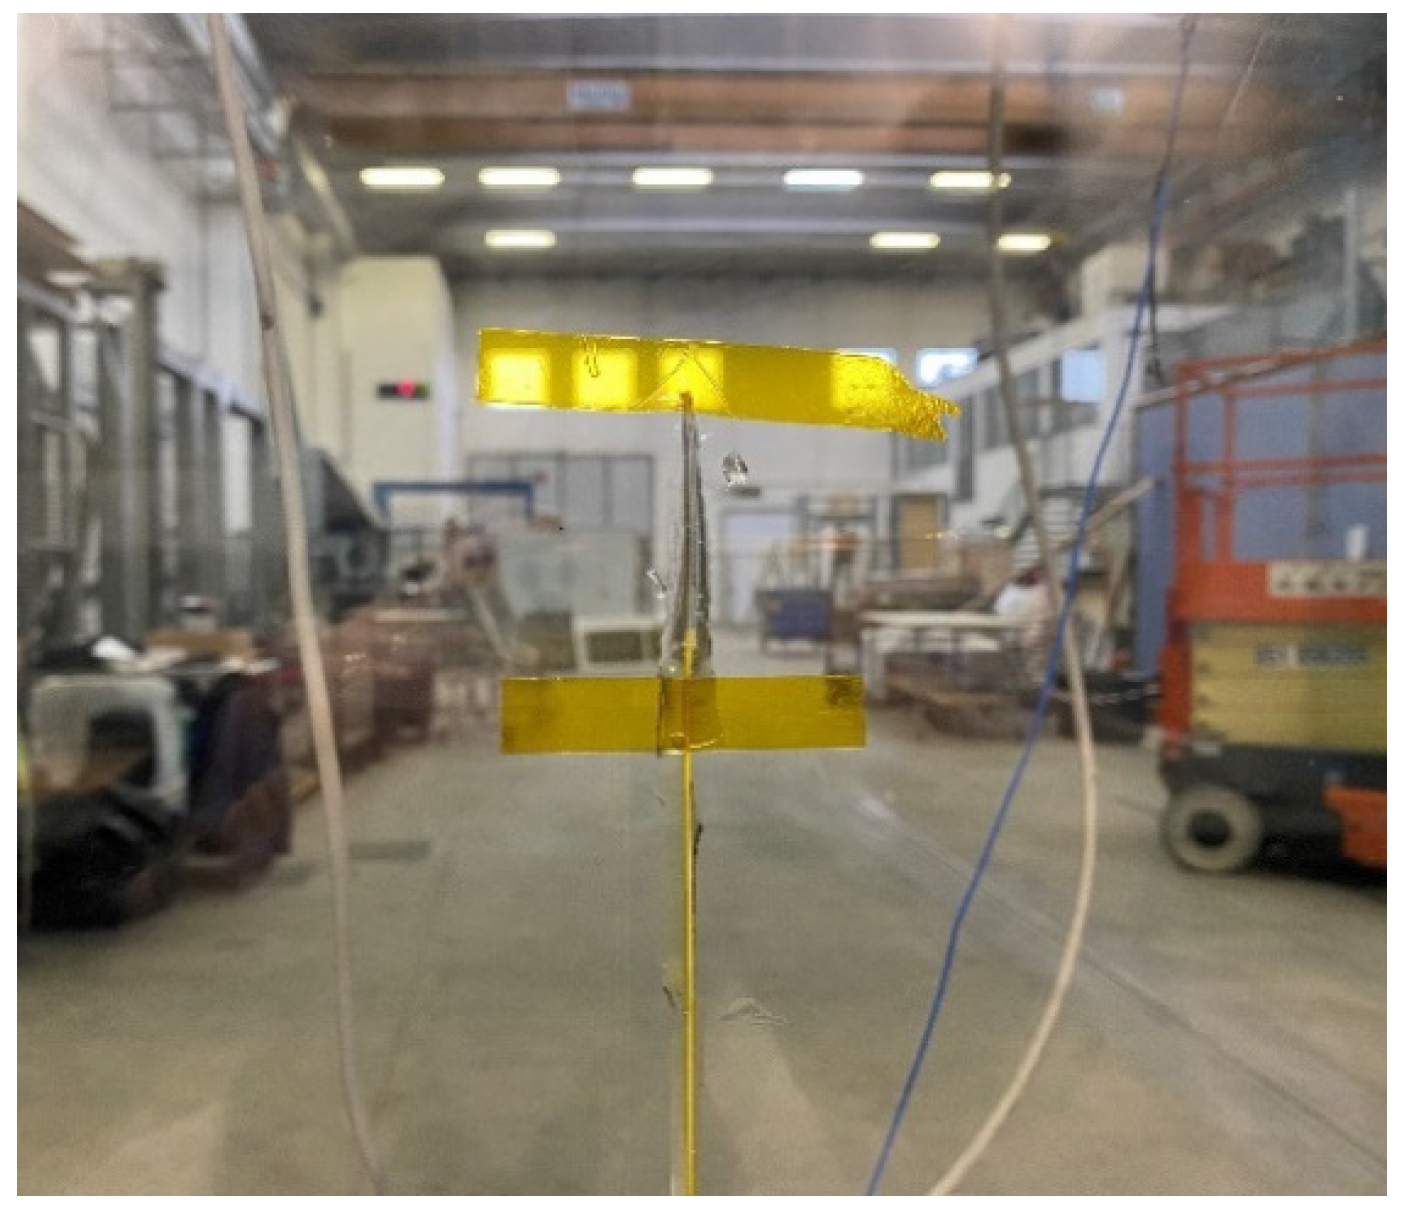
    • Accelerometers—On the external side of the façade prototypes, a triaxial accelerometer PCB 354C03 is integrated with IP66 characteristics and a compact dimension of 27 × 21 × 11 mm. It is feasible to be integrated into the façade ventilated cavity. On the internal side, the selected accelerometers are monoaxial sensors model PCB 352C33 with no IP66 characteristics and dimensions of 18 × 11 × 17 mm;
    • Strain gauge-based force washers—the selected model was the K-KMR+200K-01M5-Q with connectors D-SUB HD 15 polis, and the monitoring system was MX840, 8 channels. This washer has a nominal force of 200 kN based on the standard force applied to façade stresses. Force washers are connected to commercial data collectors.
  • Monitoring systems for data collection:
    • FBG interrogator MonadGator, in which the wavelength range is 1575–1582 nm; noise level: σ < 1 pm; sampling speed: 2 kHz; FBG’s per channel: 1; and the number of channels available is 1;
    • FBG interrogator switchgator, in which wavelength range is 1516–1583 nm; noise level: σ < 1 pm; sampling speed: 19.23 kHz; FBG per channel is 8; and the available number of channels is 8;
    • NI 9234 for accelerometer monitoring;
    • For the strain gauge-based force, it was the QUANTUM X MX840B monitoring system.
  • Prefabricated façade—a unitized façade system for multifactional façades is selected to improve solutions in the same product development.
  • Method statement for testing activities conducted in a laboratory environment to validate façade system modules based on EN 13830:2015 [16] and EN 14019:2016 [38] for curtain walling—impact resistance—performance requirements, as referenced in Appendix A. These tests involved the use of a fan positioned at 600 mm and rain-simulating nozzles targeting façade joints, delivering a continuous flow rate of 2 L/min·sqm at 400 mm from the façade. To replicate rain in a controlled laboratory setting, a system employing nozzles at typical joint locations on the façade was used. Two types of rain tests were conducted:
    • Dynamic Rain Test: this test simulates wind gusts, generating pulsating pressure variations every 3 s, fluctuating between 750 Pa and 250 Pa to mimic the dynamic nature of wind-induced pressure changes.
    • Static Rain Test: this test aimed to assess behavior under constant rain conditions, maintaining a constant pressure of 600 Pa throughout the test duration.
Table A1 in Appendix A also includes the fail/pass criteria for each parameter.

2.3. Experimental Design

This chapter describes the design of the testing activities, focusing on the sensor’s integration within the façade prototype and the test sequence. The façade prototype is composed of 6 prefabricated modules with dimensions of 1400 × 3450 mm. Indeed, the realized 1:1 scale façade mock-up total dimension is 6.90 × 4.50 mt, and the technology used is aluminum frames and double skin glaze. The façade modules were assembled off-site while the sensors were integrated on-site once the façade was installed in the laboratory. The sensor integration was deeply investigated, considering the sensor characteristics and façade components or orientations. In particular, the position of the sensor within the façade was defined according to the following:
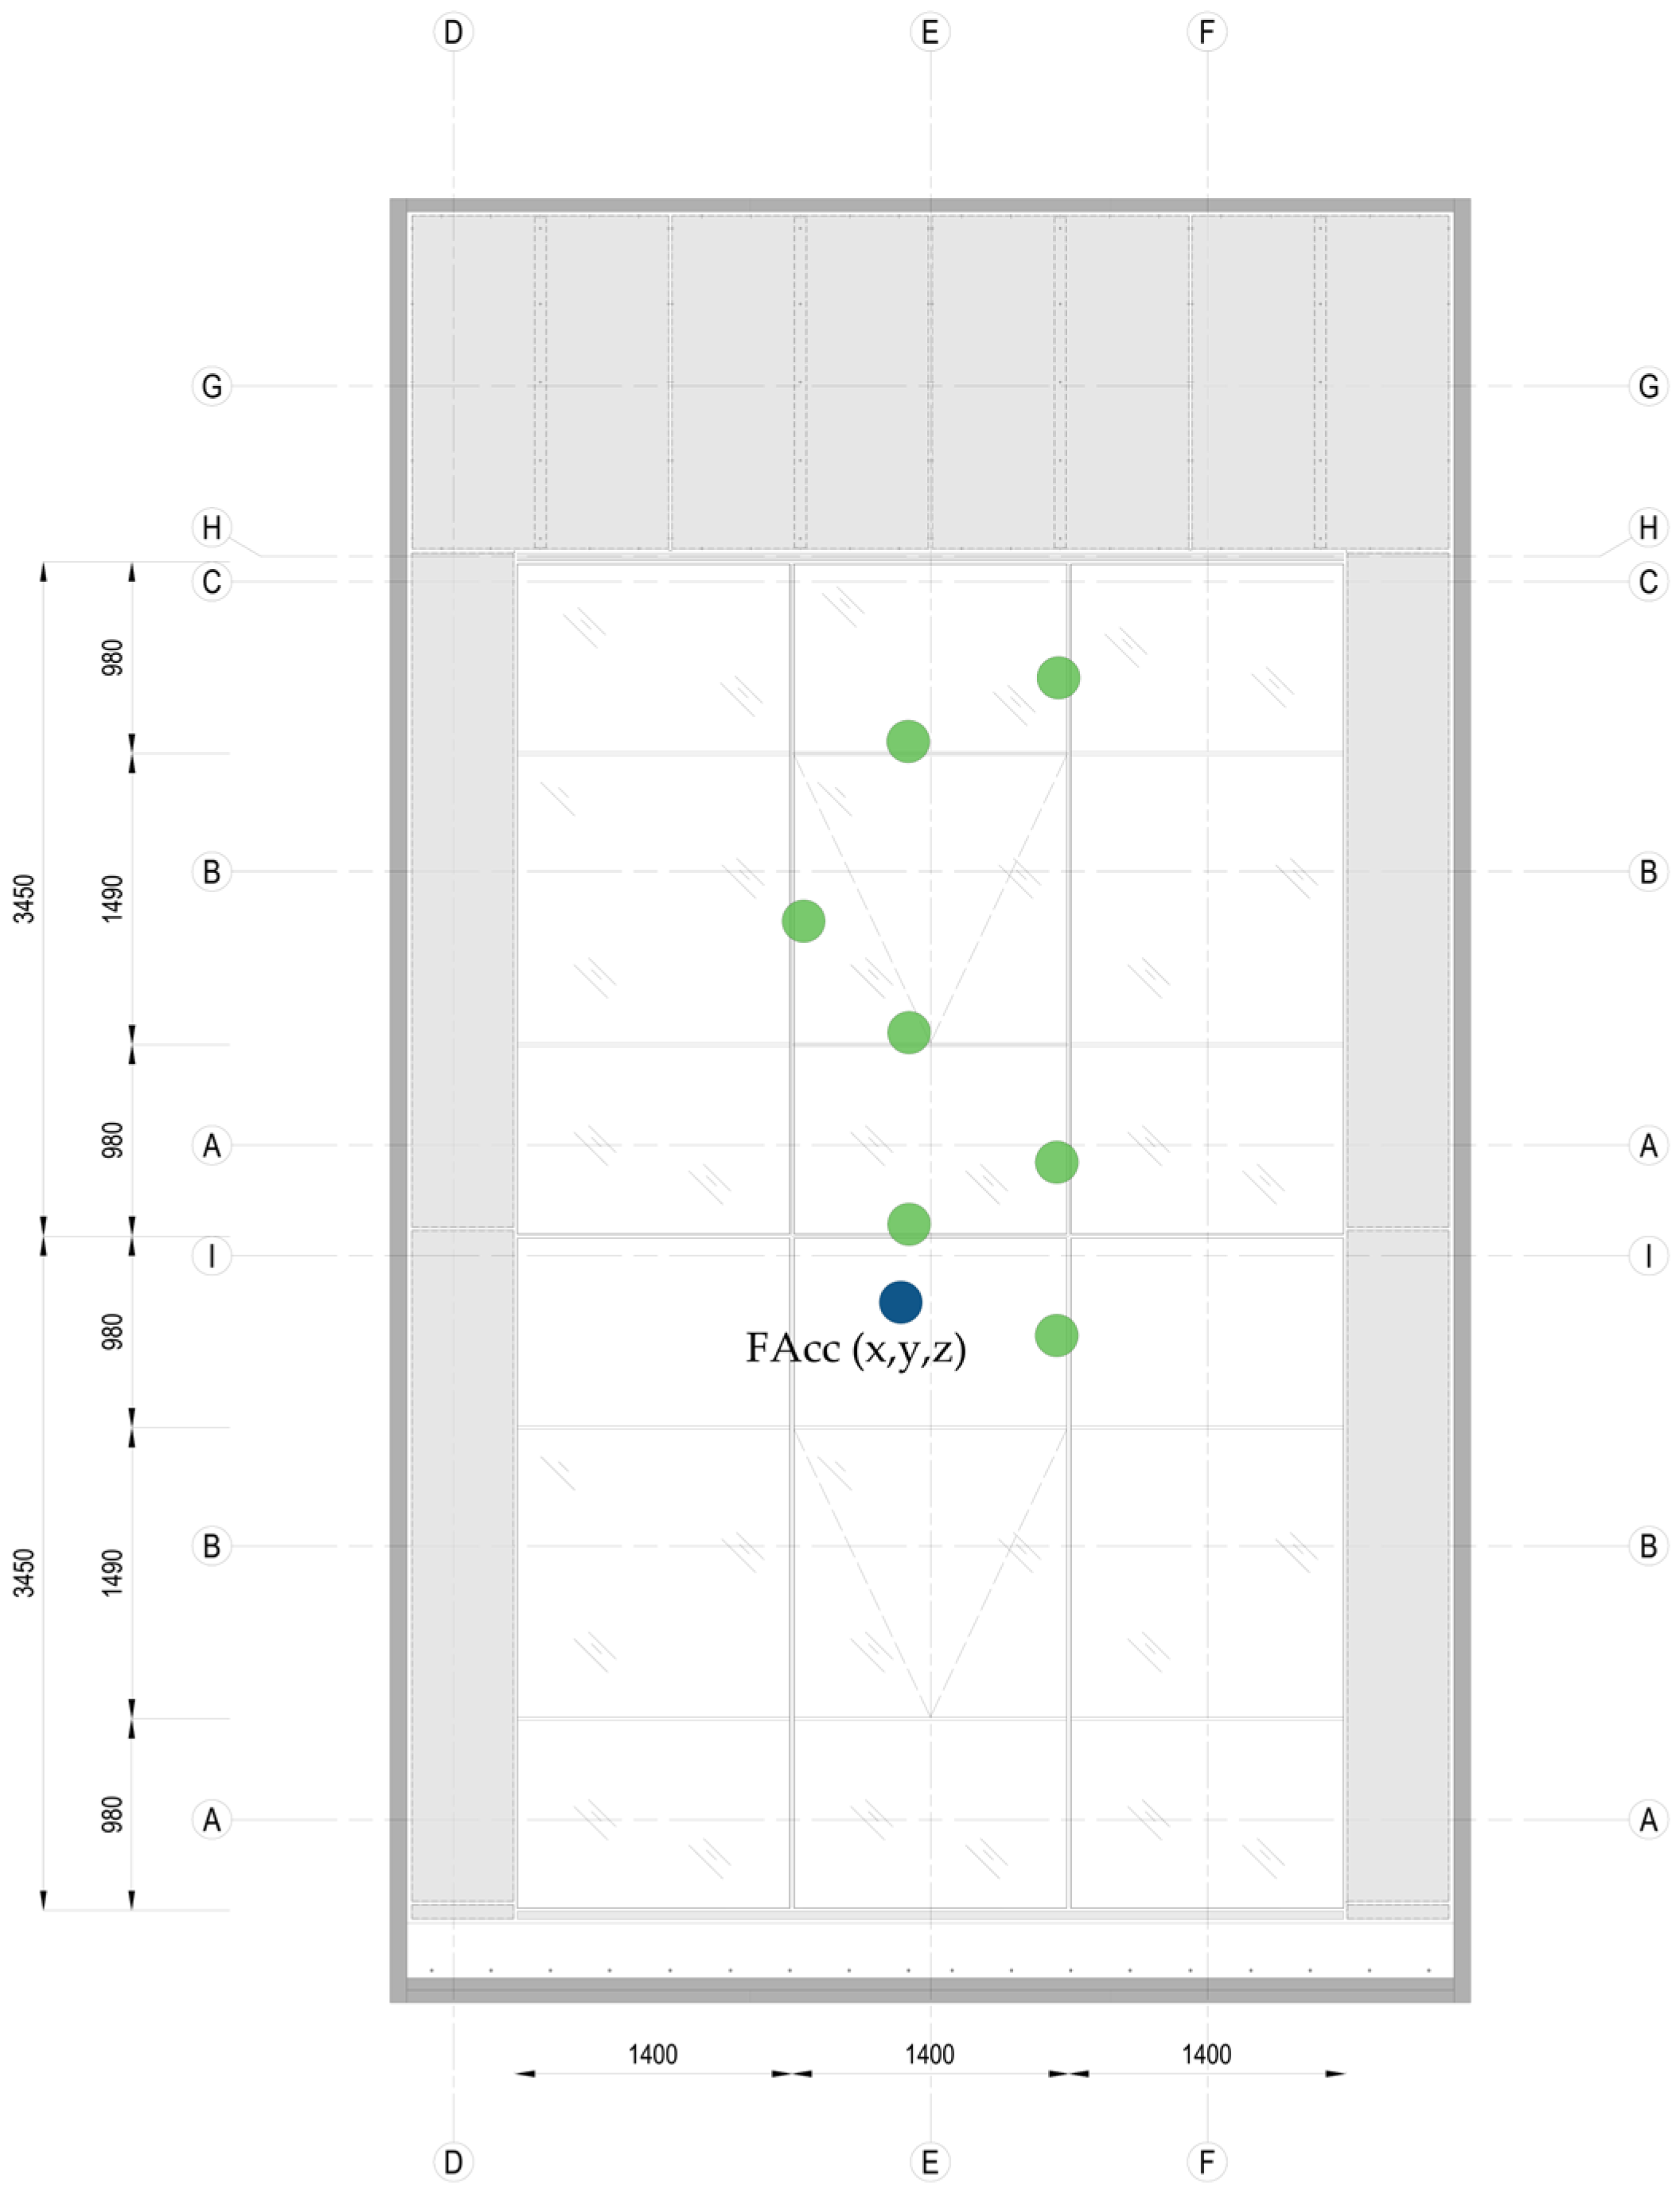
  • The test standards (EN 13830 [16]), which defined the façade positions and parameters to assess the façade behavior. Indeed, the positions correspond to the most stressful façade position in the central part of aluminum profiles and glazed panels.
  • Façade axis. Both FBG and accelerometers were positioned with different orientations with the aim of testing the façade behavior in all directions. As a reference for sensor monitoring, the different axes were considered, such as X—left, right; Y—up, down; and Z—inside, outside.
  • Avoiding impact position test—the standard EN 14019 and EN 12600 [39] determine several façade positions where to conduct the impact test; the sensors were not positioned there to avoid damage.
Table 2 shows the list of sensors integrated within the façade prototype for the testing activities.
The FBG sensors are period refractive index modulation in fiber and are completely solid state. The sensitivity is, therefore, not limited by the FBG sensor but by the measurement system connected to it. At the maximum sample rate of 19.2 kHz, the switchgator interrogator can measure strain changes of 1 microstrain or, when measuring temperature, a temperature change of 0.1 °C. By resampling to lower speeds, this sensitivity is improved by the square root of the resampling factor.

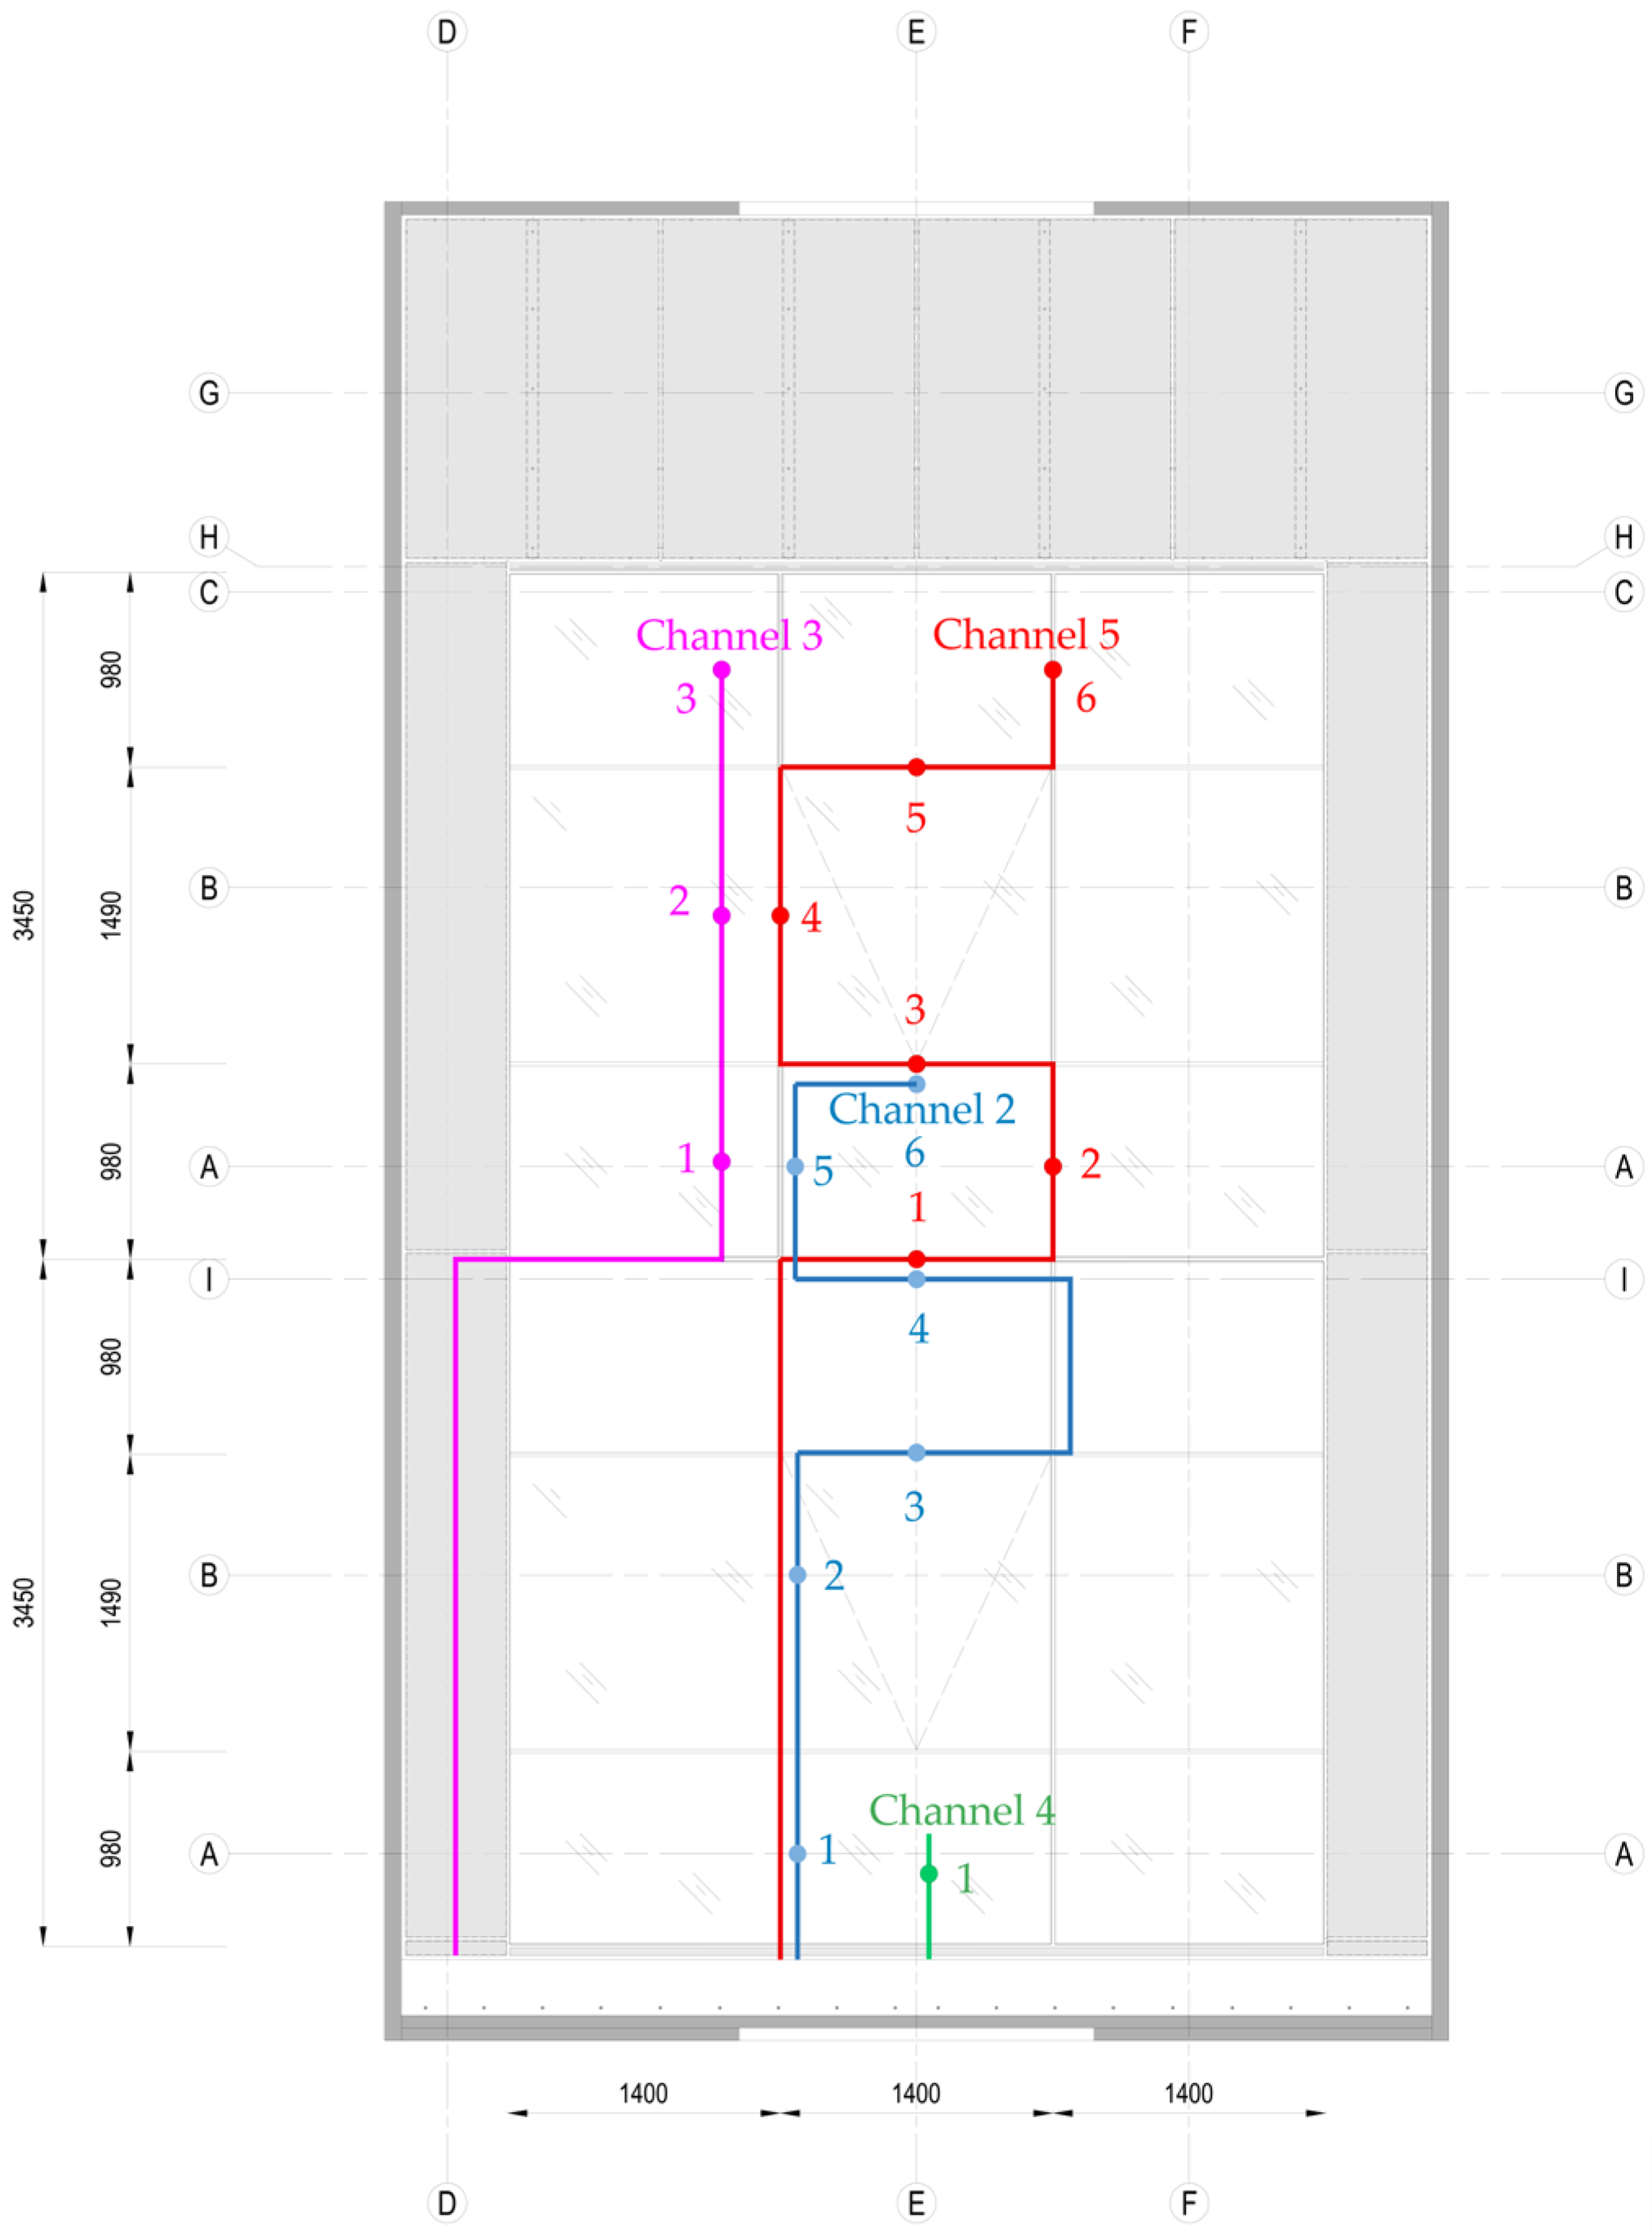
2.3.1. FBG Integration within the Façade

According to the previous outcomes, the fiber optic cables were applied to the glass surface and the aluminum profiles in specific positions. The FBG sensors monitor the direction of its application; thus, two fiber cables were installed to monitor the x and y direction, while one monitored the z direction. Figure 4 shows the cable path and the FBG positions within the façade.
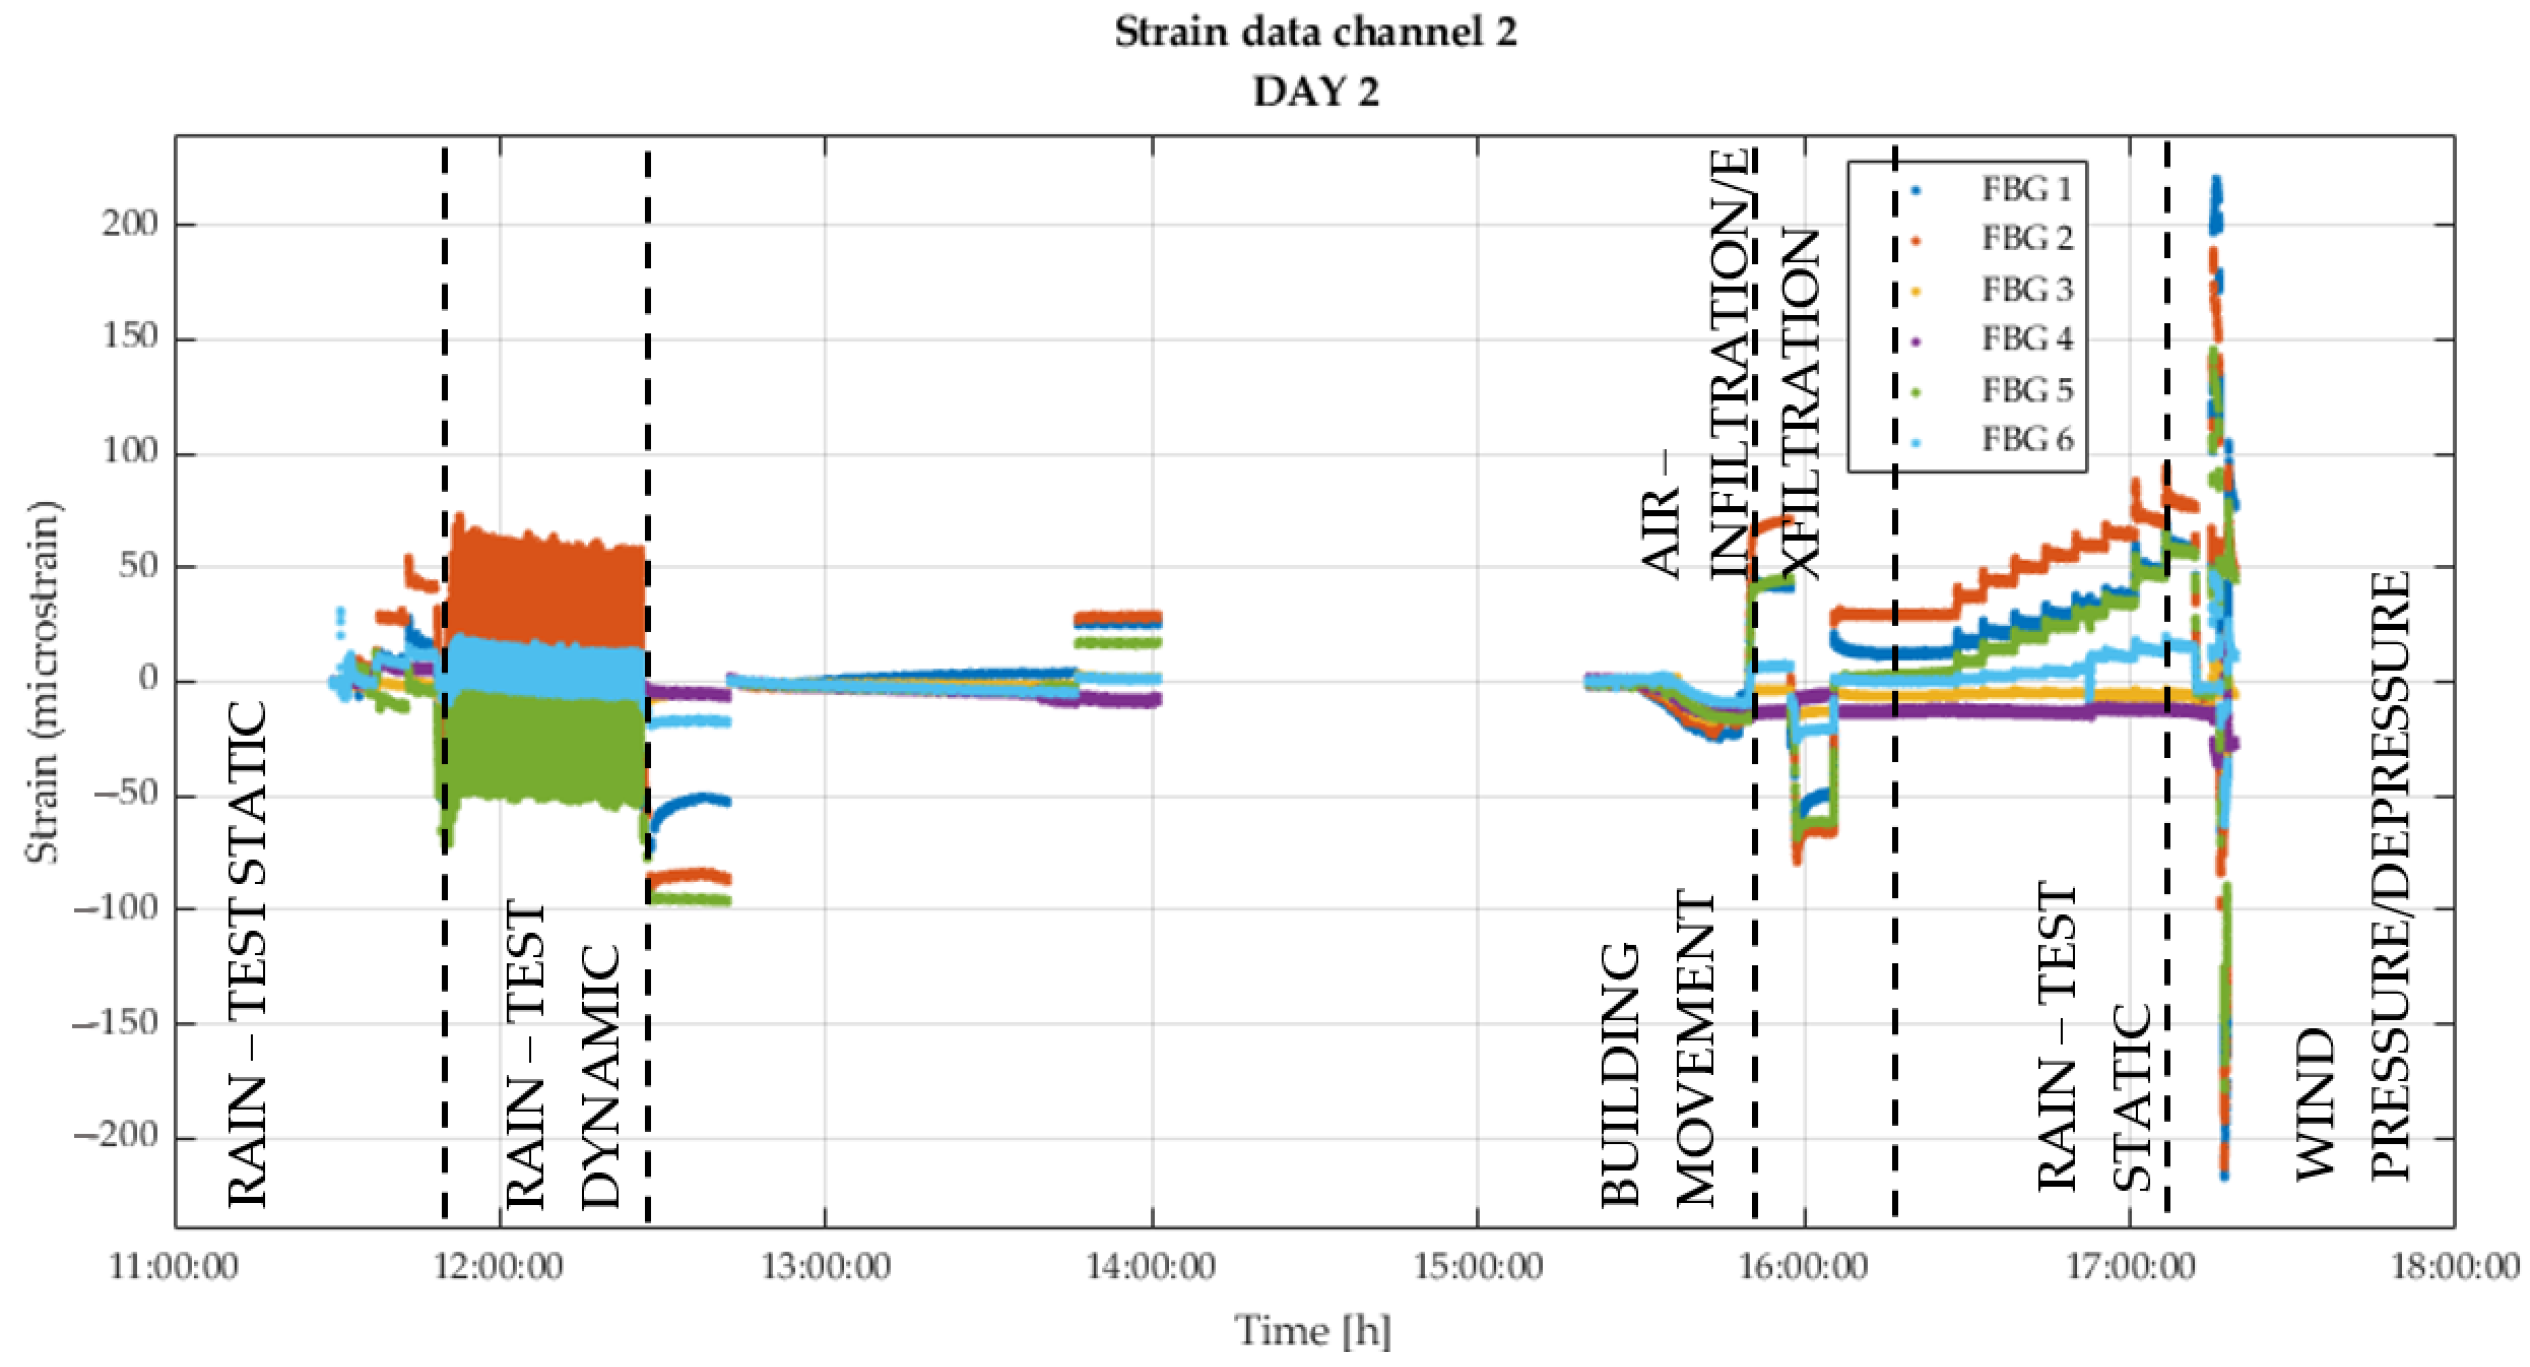
  • Channel 2—central glazed panel for temperature;
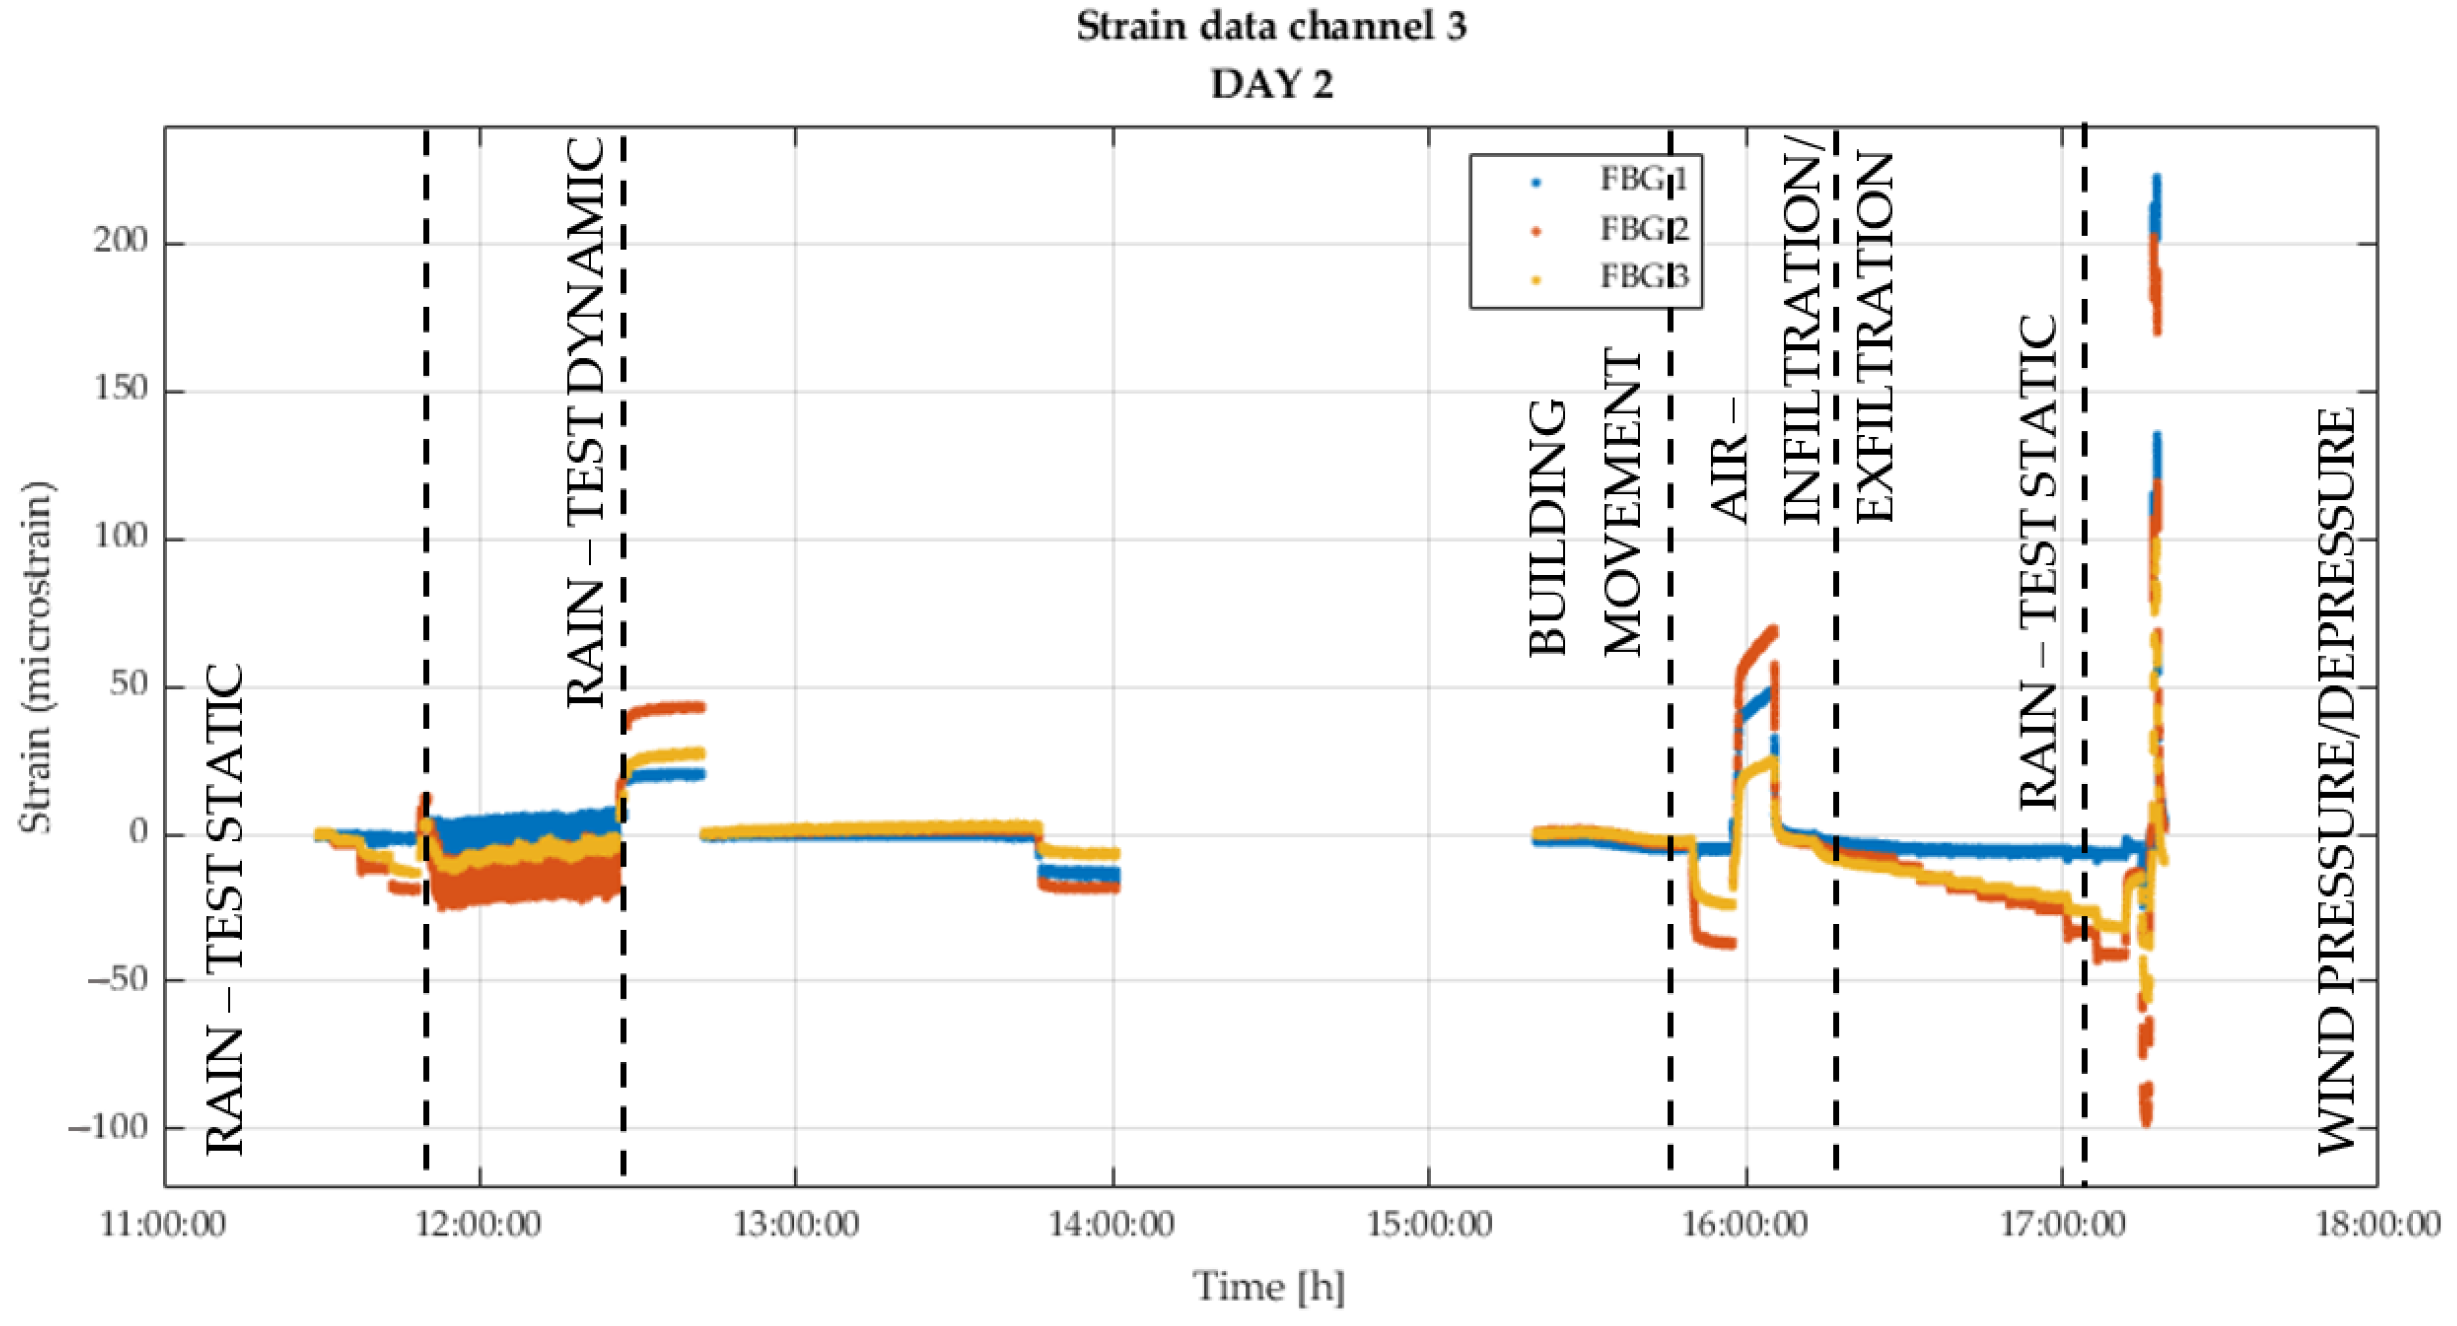
  • Channel 3—slightly central glazed panel for strain (to avoid the impact test);
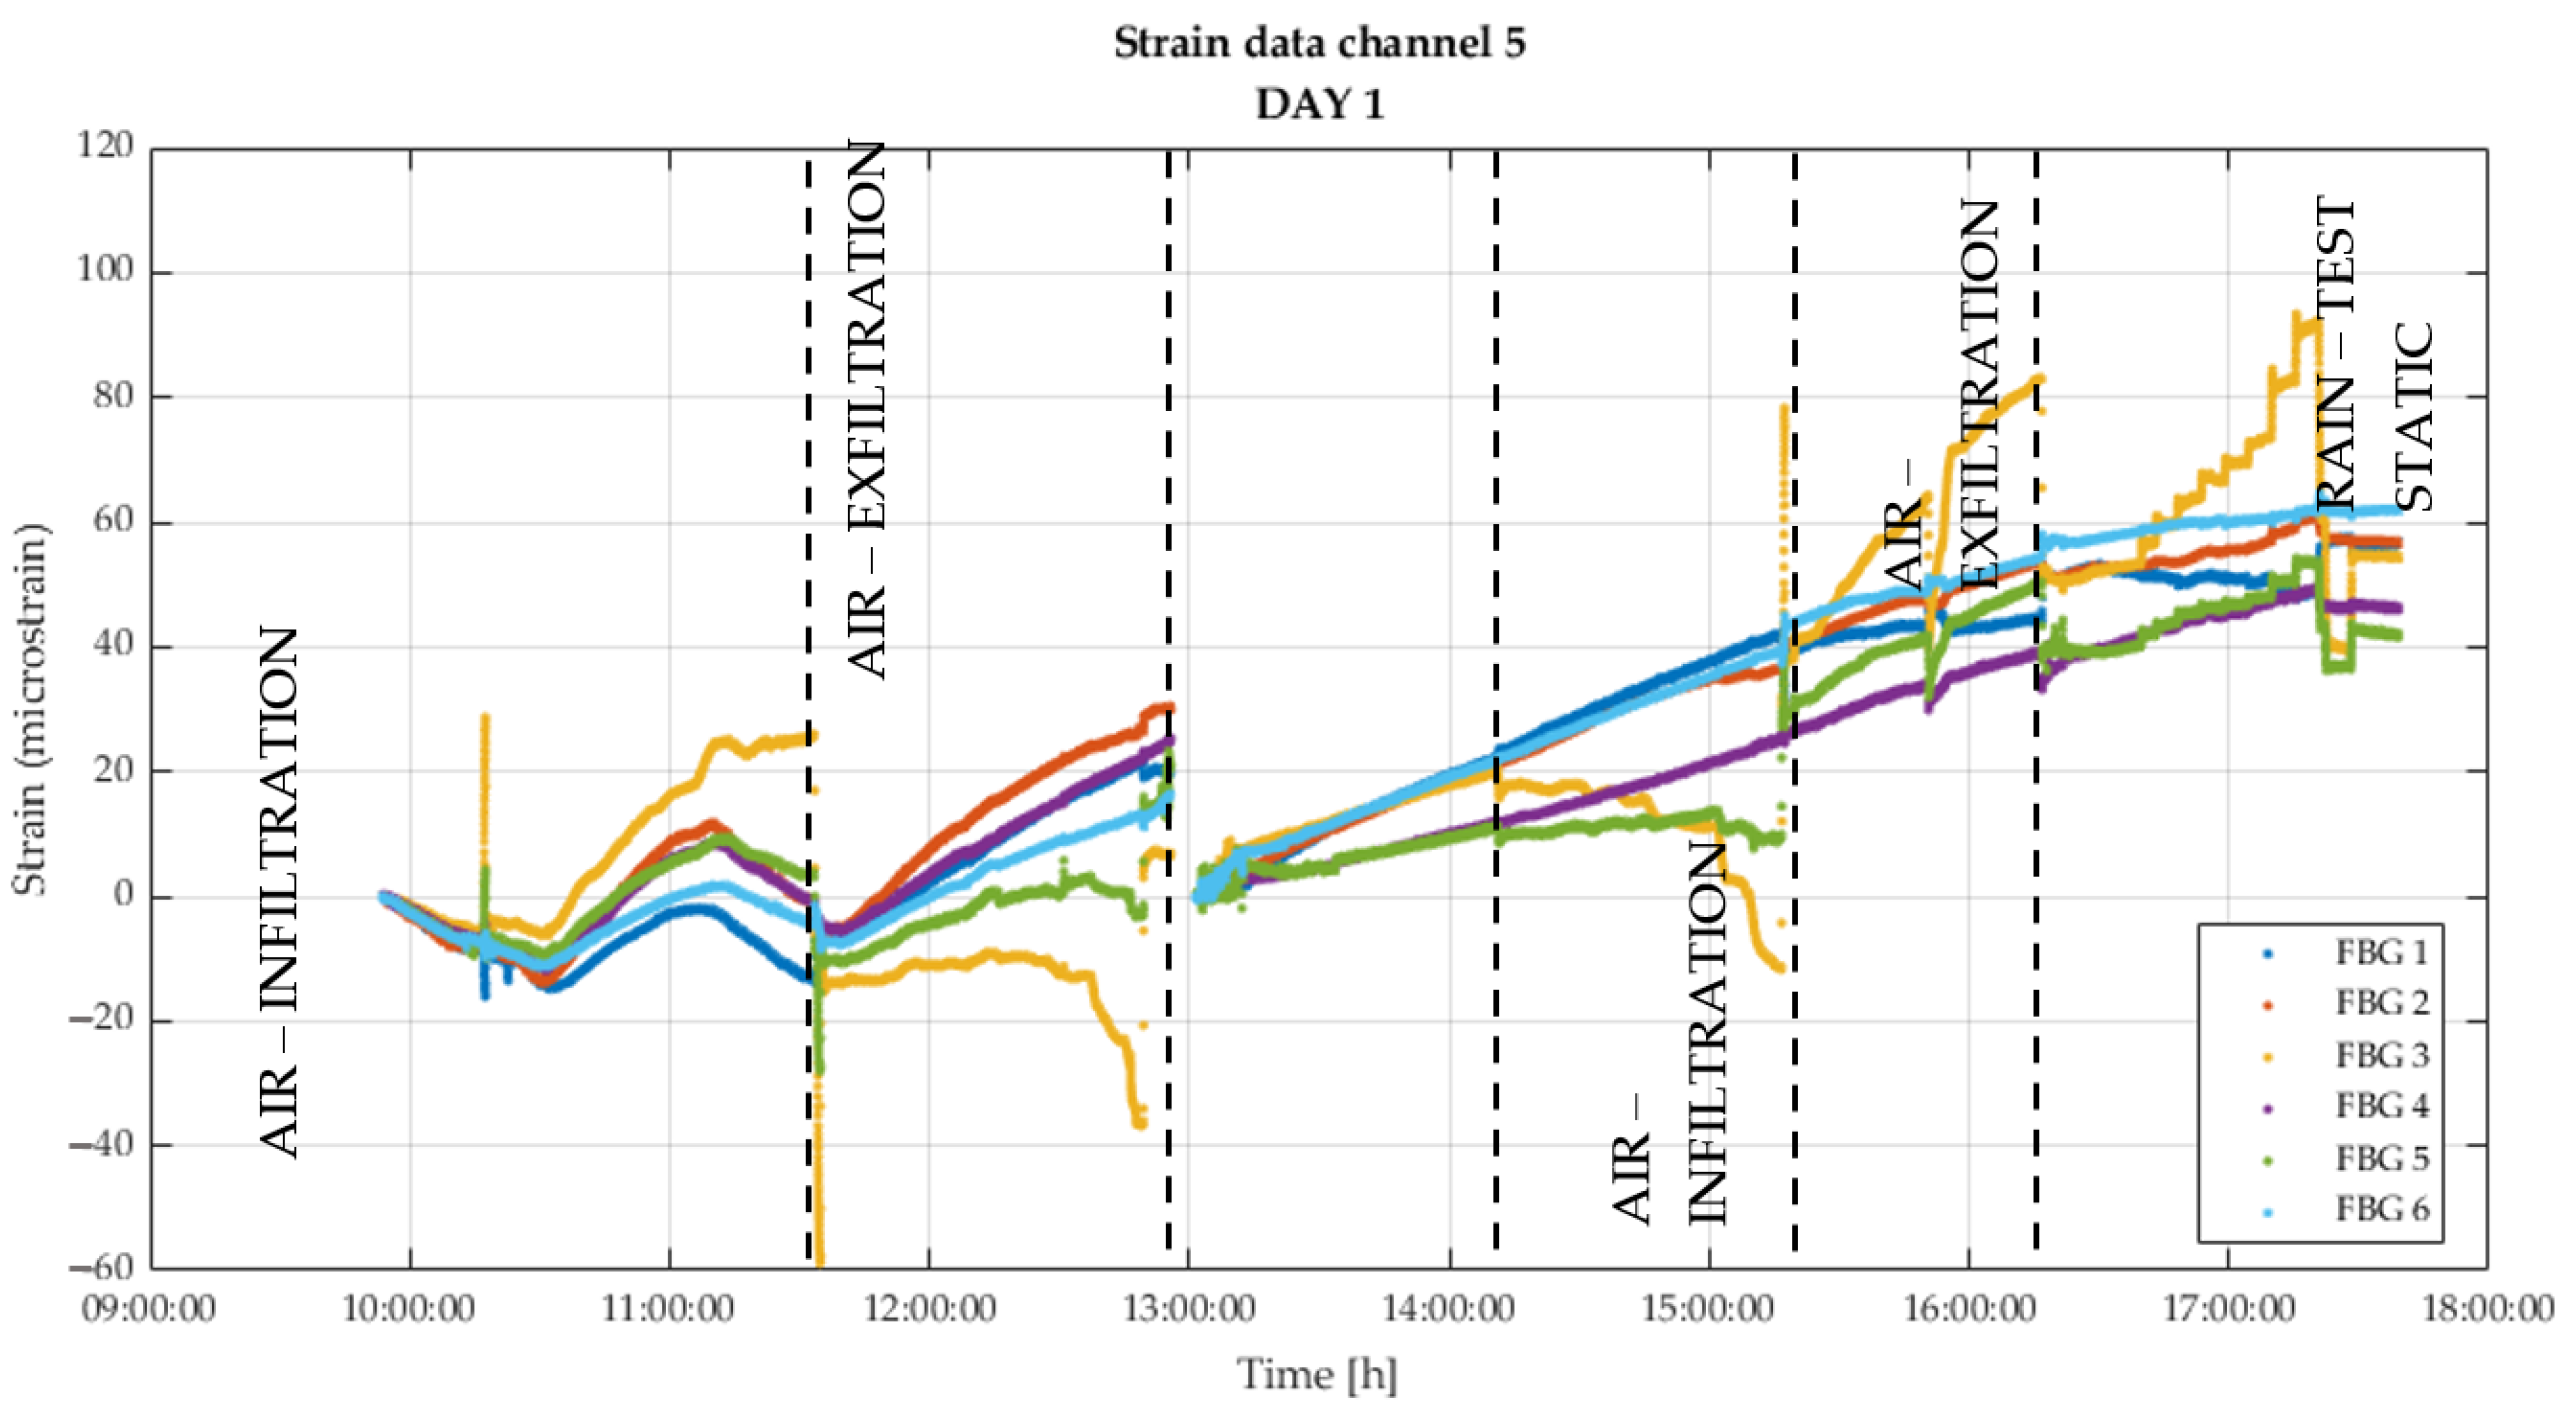
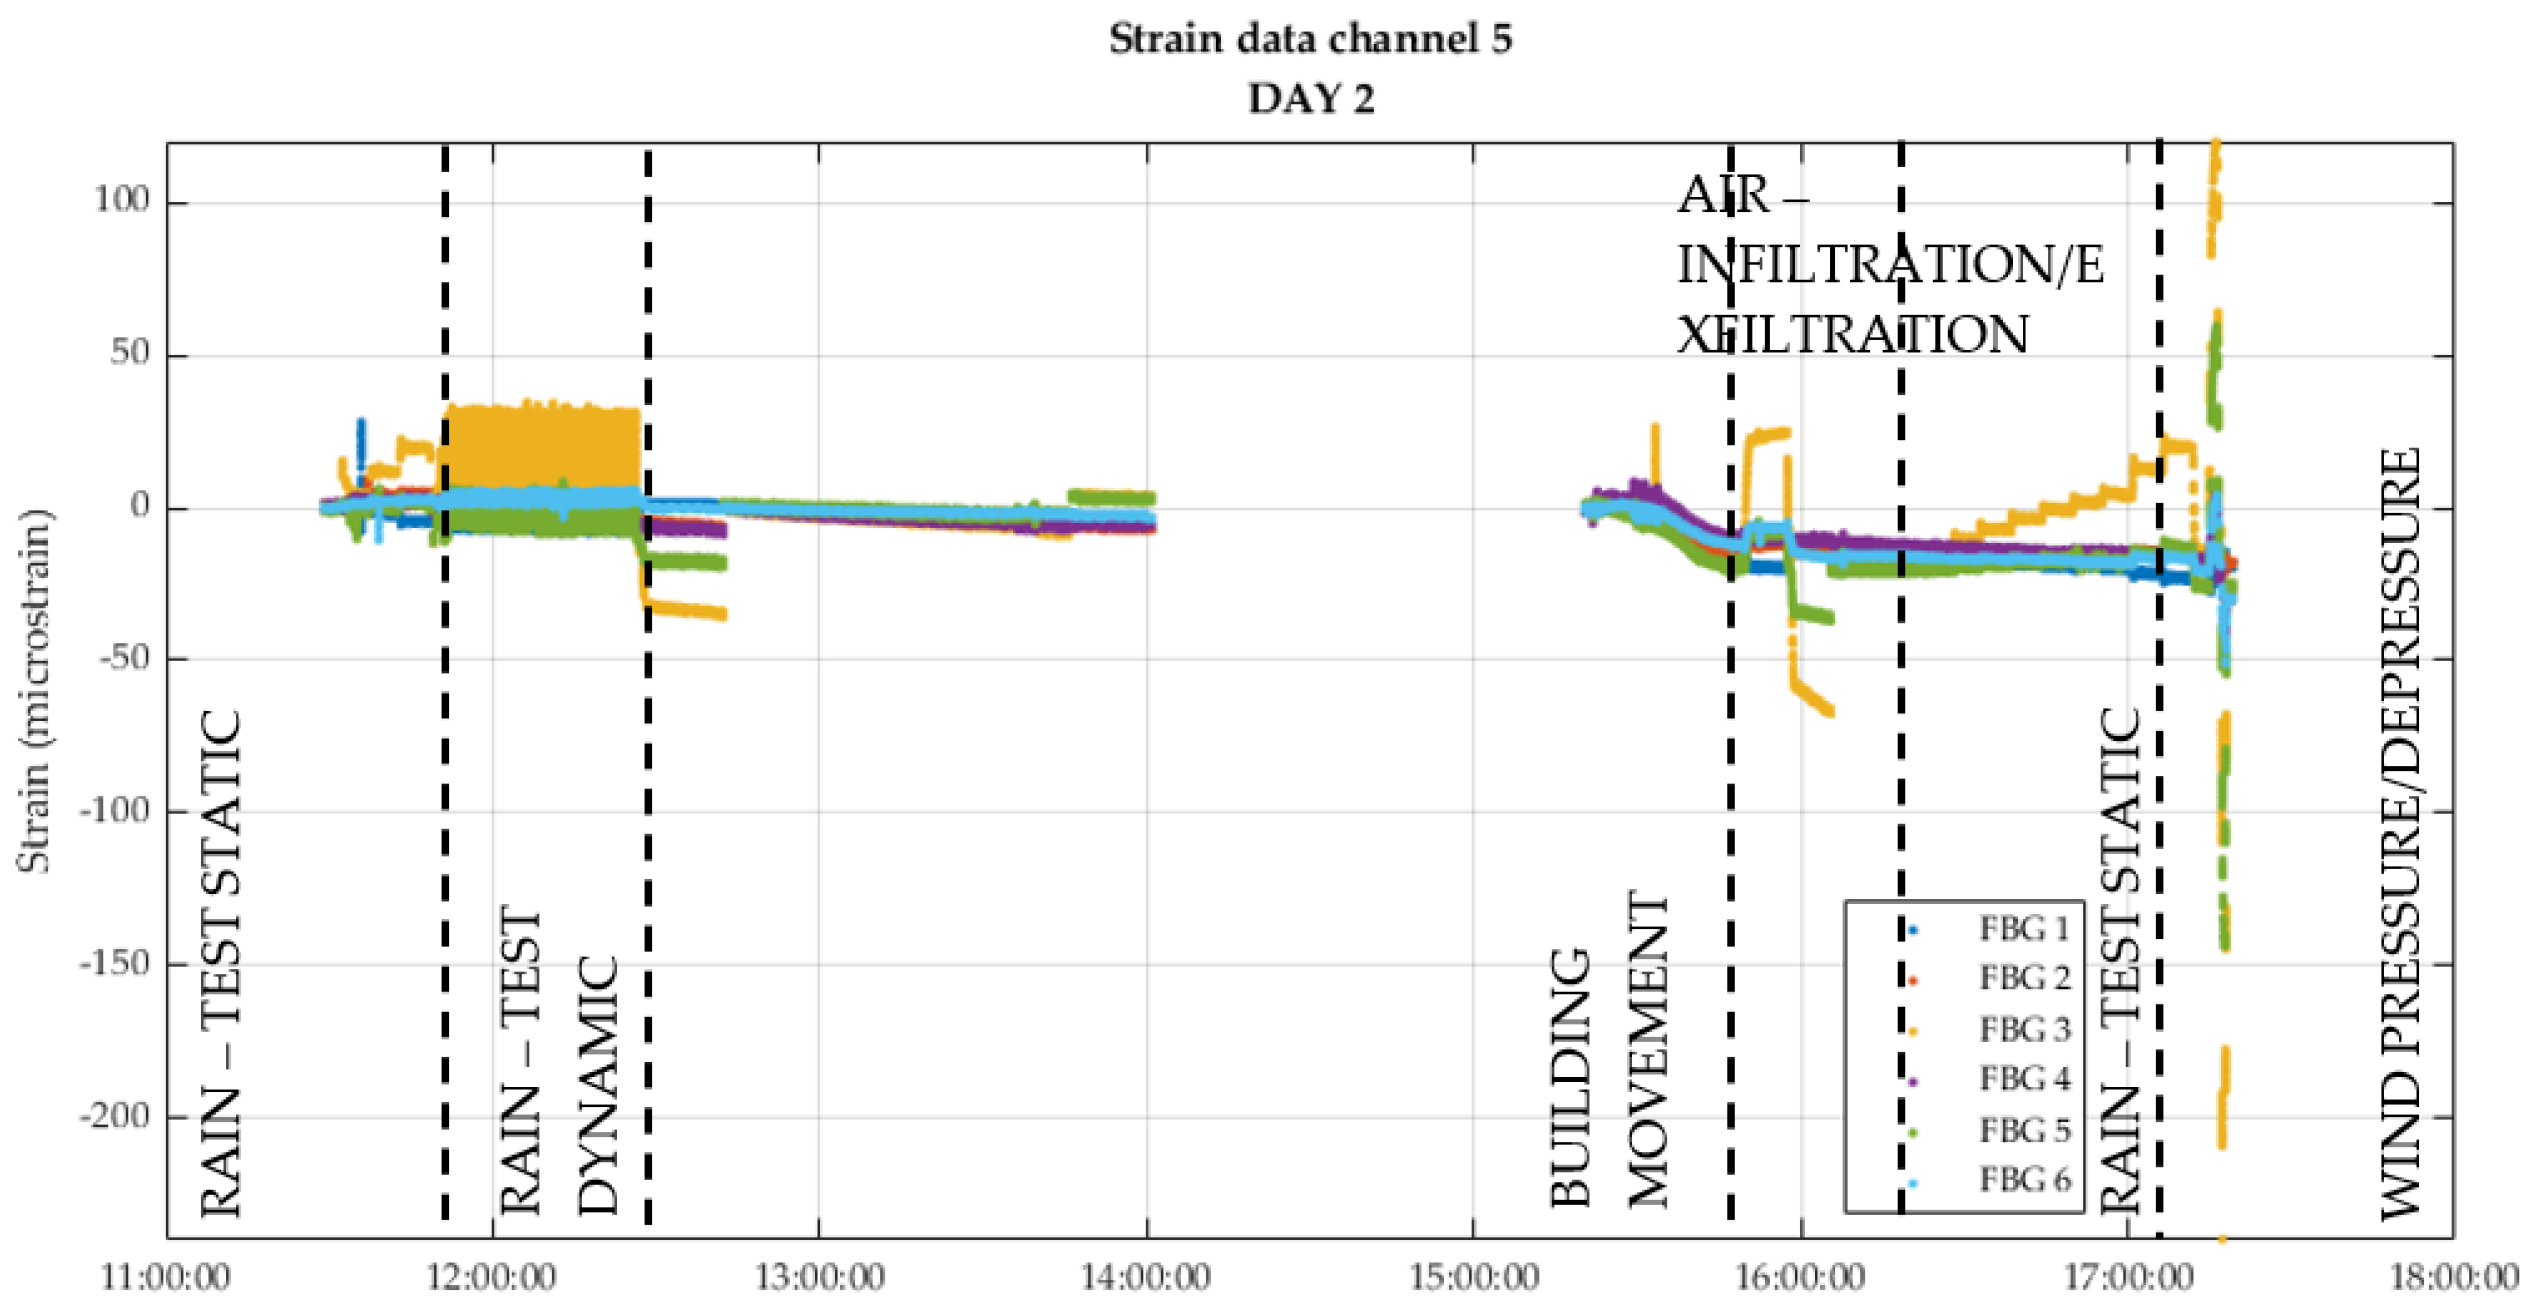
  • Channel 5—aluminum central profiles (x direction);
  • Channel 6—aluminum central profiles (z direction).

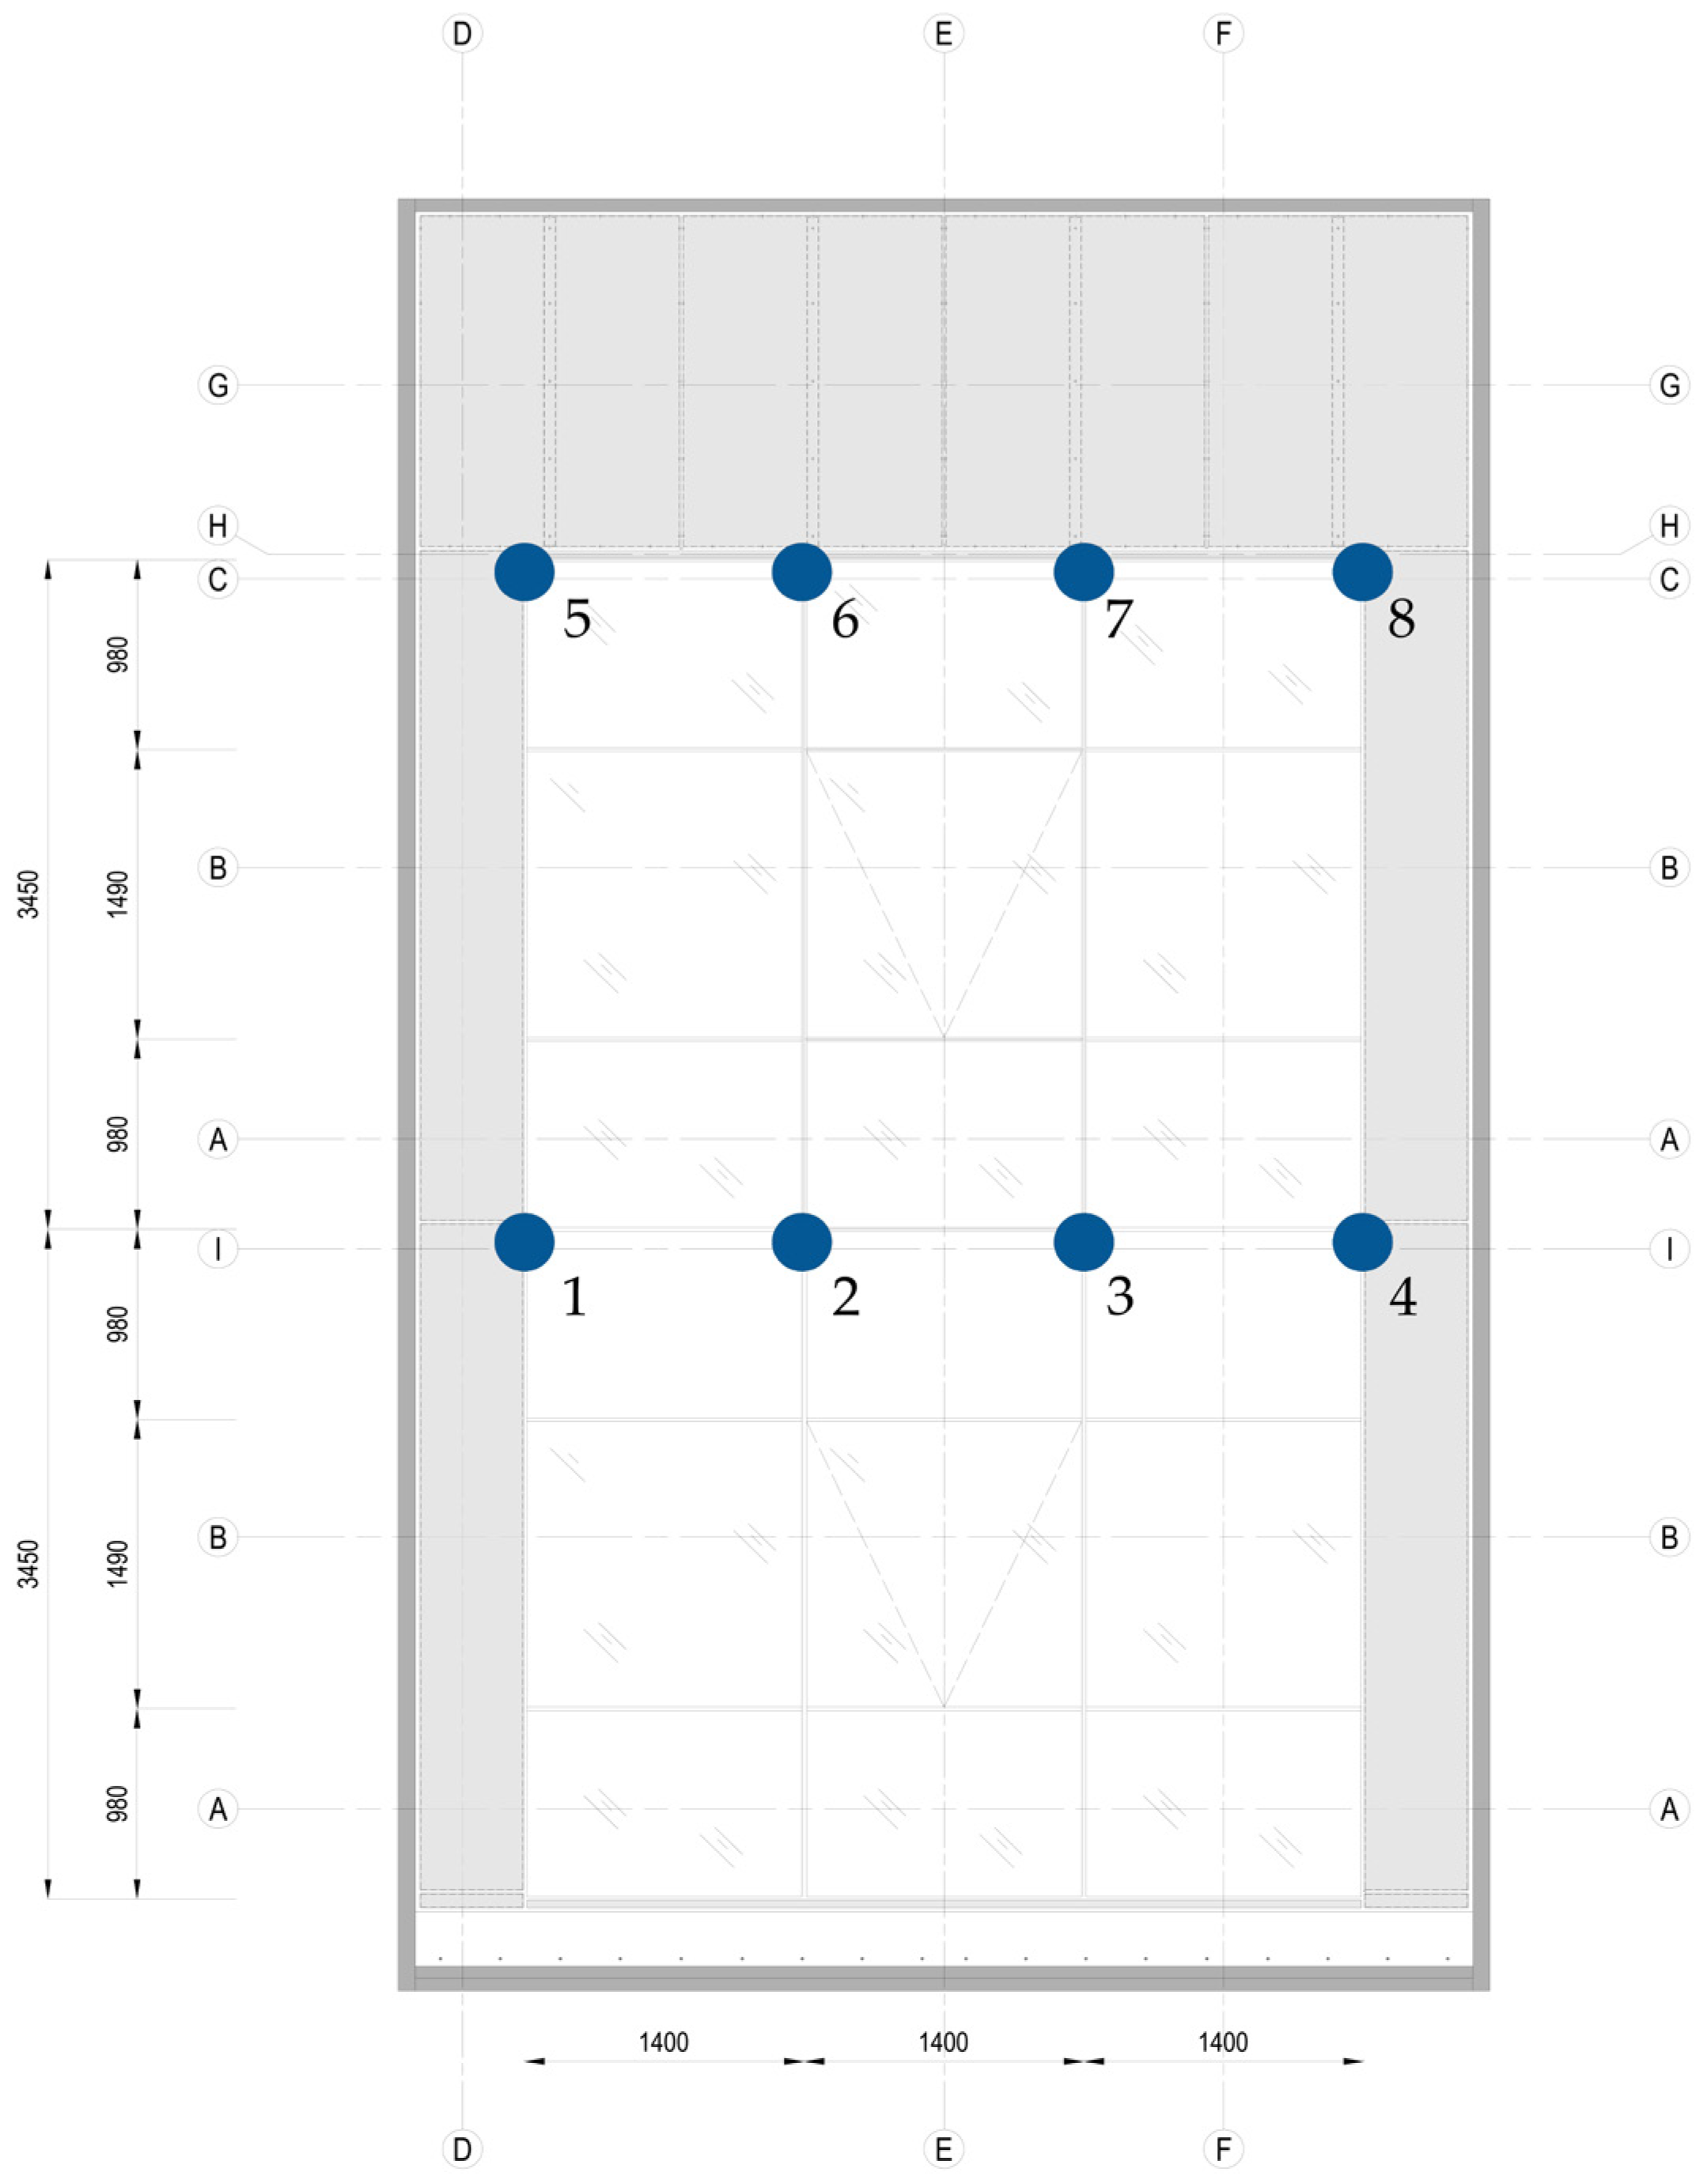
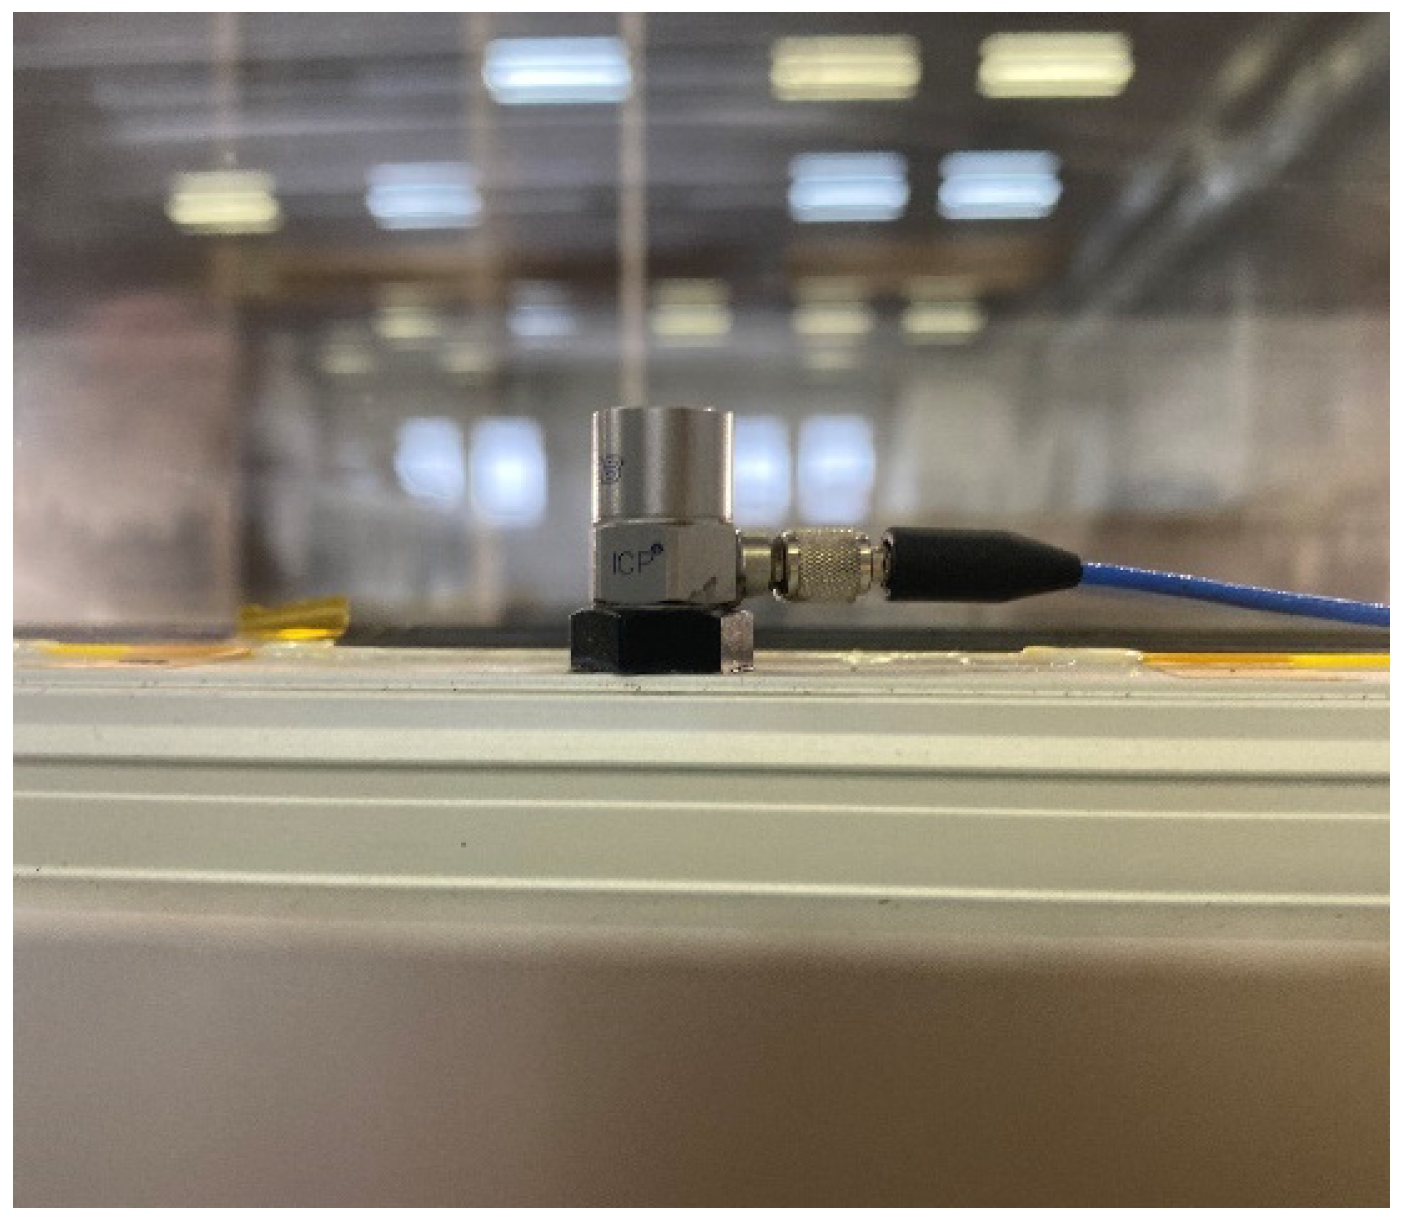
2.3.2. Accelerometers Integration within the Façade

Figure 5 shows the accelerometer positions, including both external (colored in blue) and internal ones (colored in green). The internal monoaxial accelerometers were located on the aluminum profile corresponding to the FBGs sensors. Indeed, 6 accelerometers were placed beside 6 FBG sensors (the sequence follows channel 5, FBG positioning). Both sensors were positioned in the central part of aluminum mullions and transoms. Considering the middle upper façade modules, there were 6 positions to monitor (upper mullions and transom, openable vent mullions and transom, and lower mullion and transom). For each position, 1 accelerometer and 1 FBG were placed.

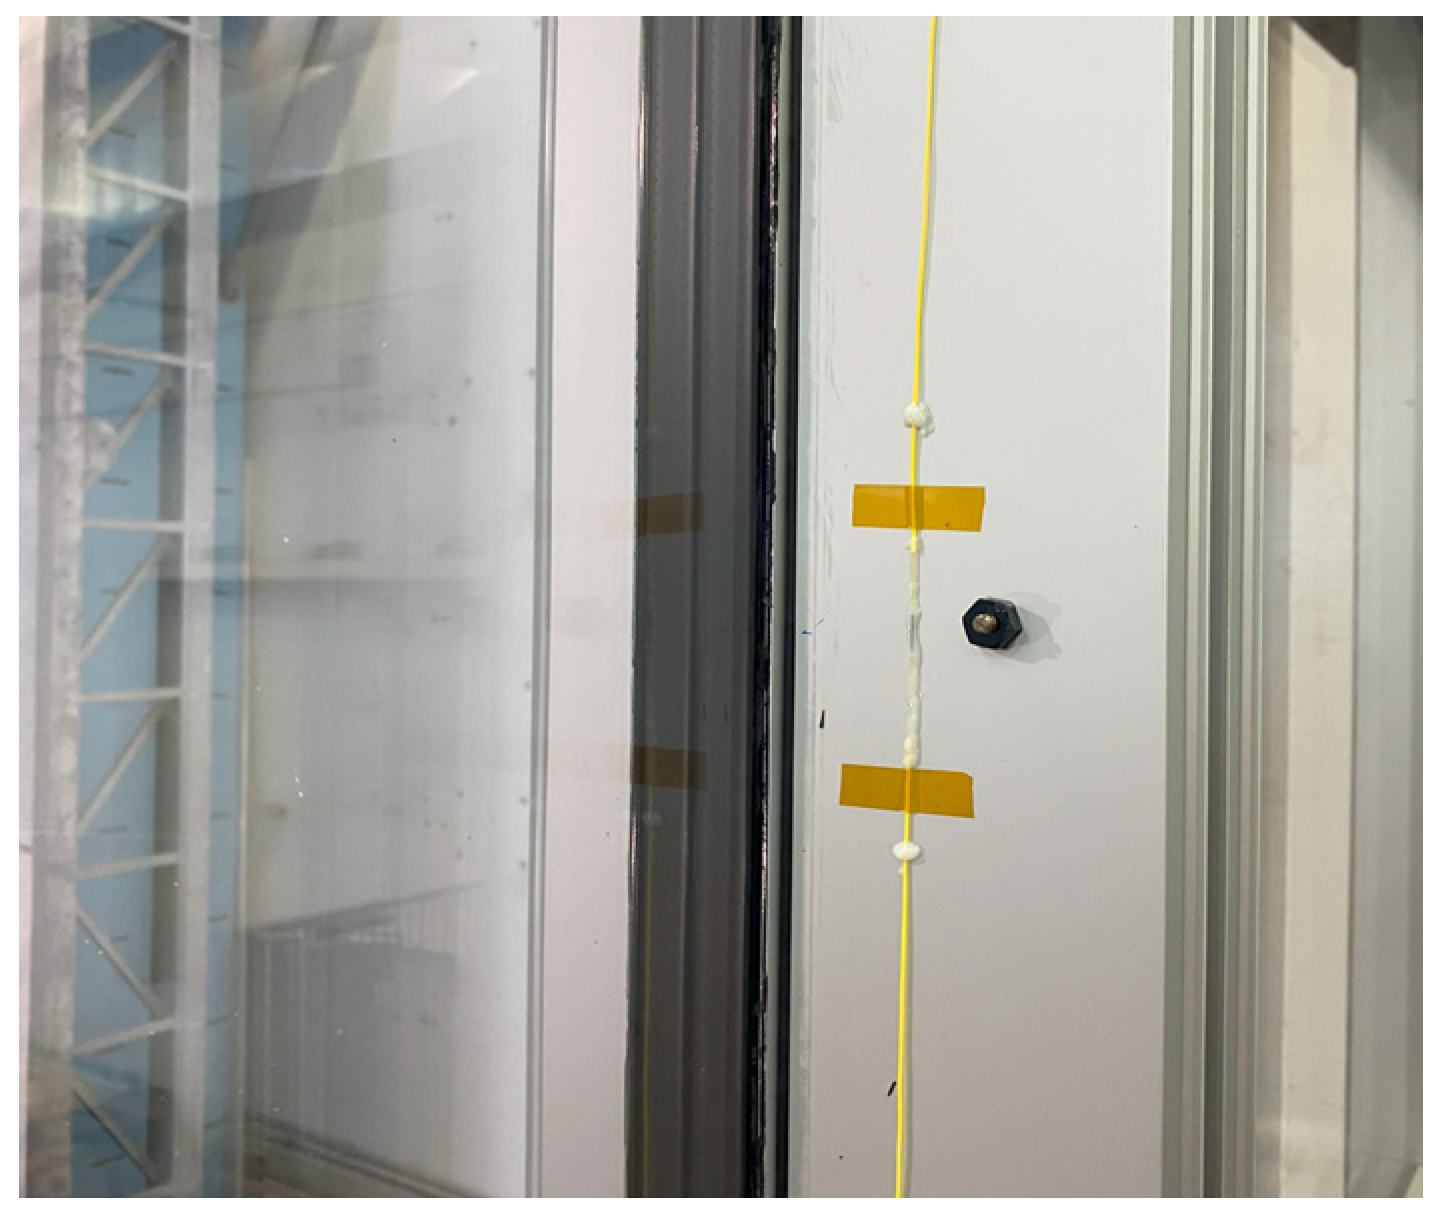
2.3.3. Force Washers’ Integration within the Façade

Figure 6 shows the No. 8 force washer positions located in the façade brackets bolt to monitor the behavior of each bracket position.

2.4. Testing Methods

The test aims to monitor the façade behavior and validate the integration of sensors, both regarding the InComEss architecture and the defined kit of conventional sensors. Therefore, the outcomes of previous phases were validated in a controlled lab environment by collecting data from integrated sensors for structural health monitoring (SHM) analysis. The defined set of SHM sensors integrated into a façade prototype was tested under controlled weather conditions following the curtain wall standard EN 13830. During the test, a defined tests sequence was conducted to stress the façade’s behavior. The series included air infiltration and exfiltration (+600/−600 Pa), wind pressure and depressure (+1750/2000 Pa for serviceability and +2625/−3000 Pa for safety), and rain in static and dynamic regimes (+600 Pa static test and dynamic water penetration test with a fan pulsing every 3 s from 750 Pa to 250 Pa). The tests were conducted with a fan at 600 mm and with a water source simulating rain in correspondence of façade joints with a flow rate of 2 L/min·sqm and at 400 mm from the façade.
Additionally, mechanical tests such as building movement (horizontal and vertical) and impacts at different times and forces were performed. The full test lasted three days and was performed following a determinate sequence of parameters, as reported in Appendix A. During each test, the façade was constantly monitored and checked in real-time while the sensor’s data were collected, considering the test duration and parameters, to facilitate the analysis of the results. The full test sequence is reported in Appendix A (Table A1).

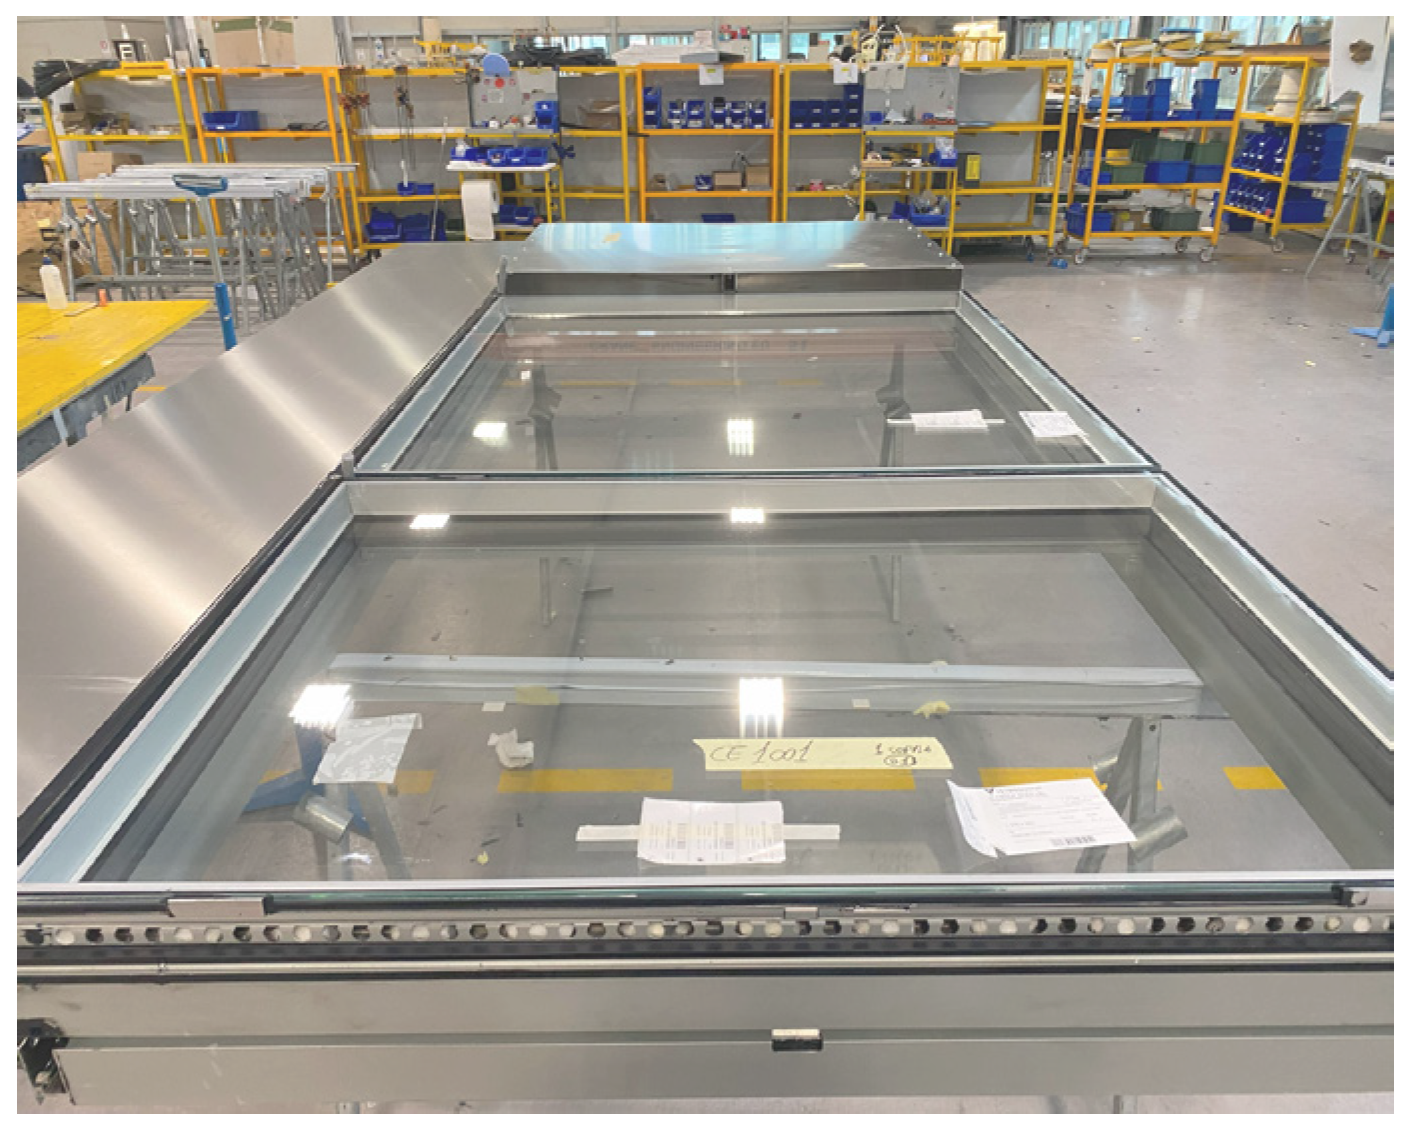
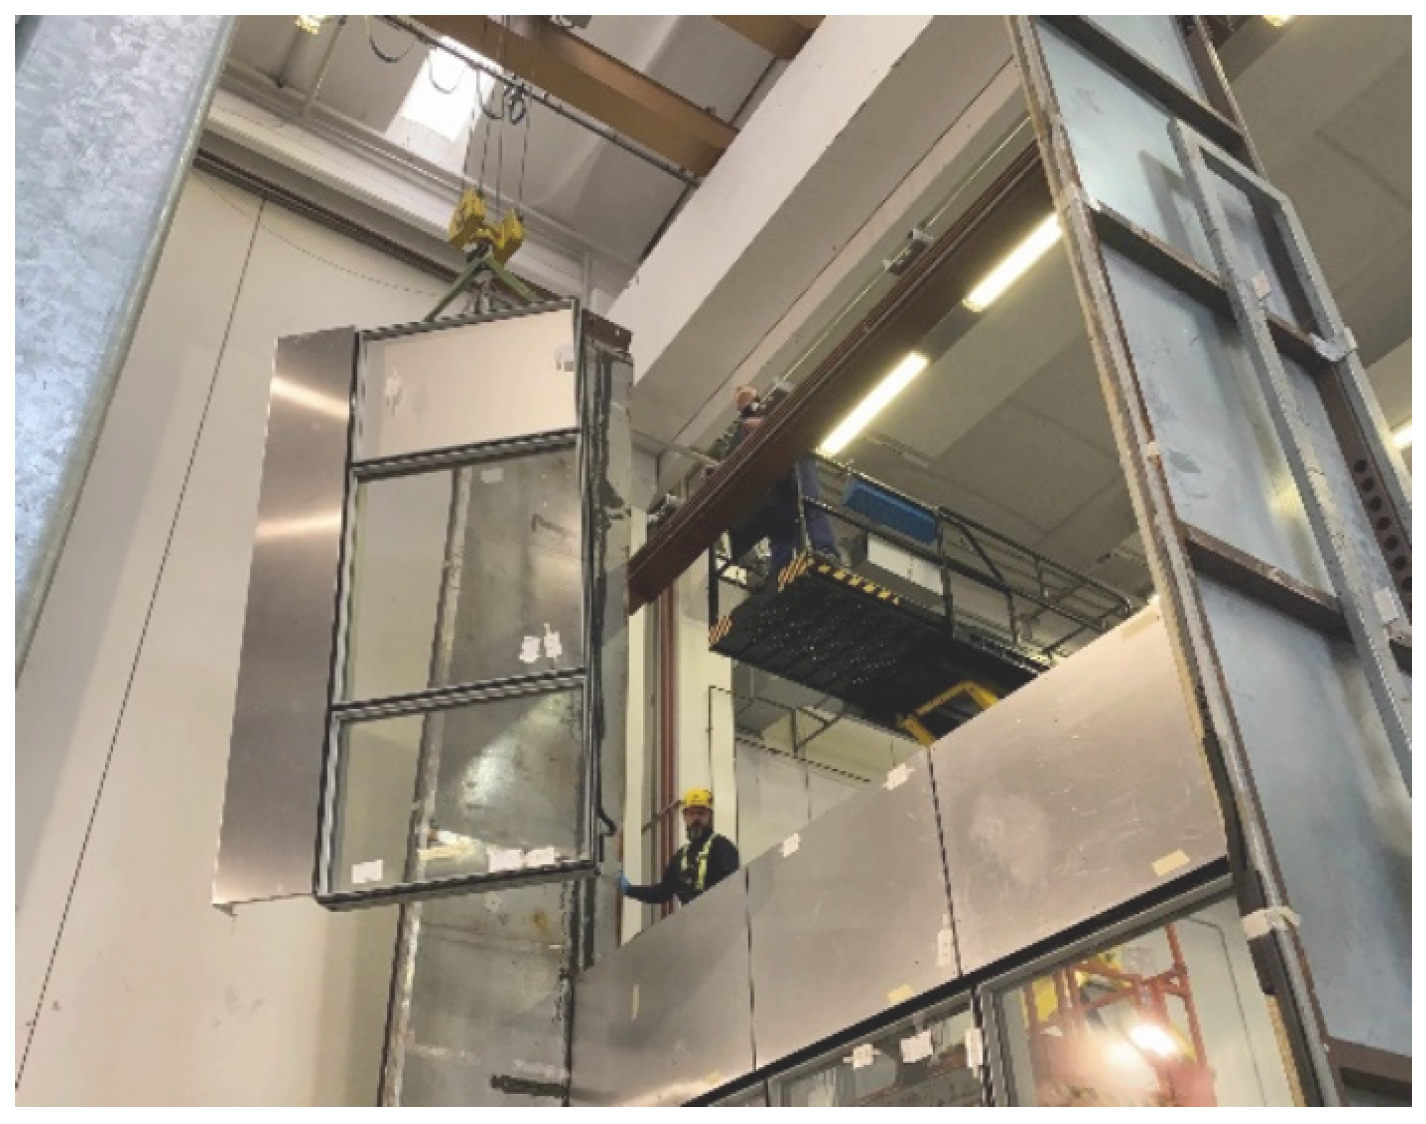
2.5. Sample Preparation

The sample preparation involved manufacturing and installation of façade modules and then integrated sensors within the façade. Figure 7 shows the off-site process of façade manufacturing, and Figure 8 shows the on-site installation.
For FBG, 4 different cables were installed within the façade: 2 in the glass panel and 2 on the aluminum profiles. Indeed, two cables were fixed on the glass surface through epoxy resin DP125 for bonding on glass (Figure 9), while DP410 was used for bonding on aluminum profiles (Figure 10).
Accelerometers were installed on the curtain wall façade to acquire vibrational phenomena. A triaxial accelerometer was integrated in the external façade side, while 6 monoaxial accelerometers were positioned in the internal façade’s side along the central module of the façade as shown in Figure 11 and Figure 12. The triaxial sensor, positioned in the ventilated cavity (thick 67 mm), is fully integrated and not visible from the outside due to its compact dimension (27 × 21 × 11 mm), while the internal monoaxial sensors are visible and not completely integrated into the façade aluminum profiles due to their dimensions.
Strain gauge-based force washers were installed on the façade bolts. There were 8 sensors installed, one on each façade bracket. The integration of force washers is shown in Figure 13 and Figure 14.

3. Results and Test Analysis

In the following paragraphs, the results obtained during the test and the relative analysis are reported.

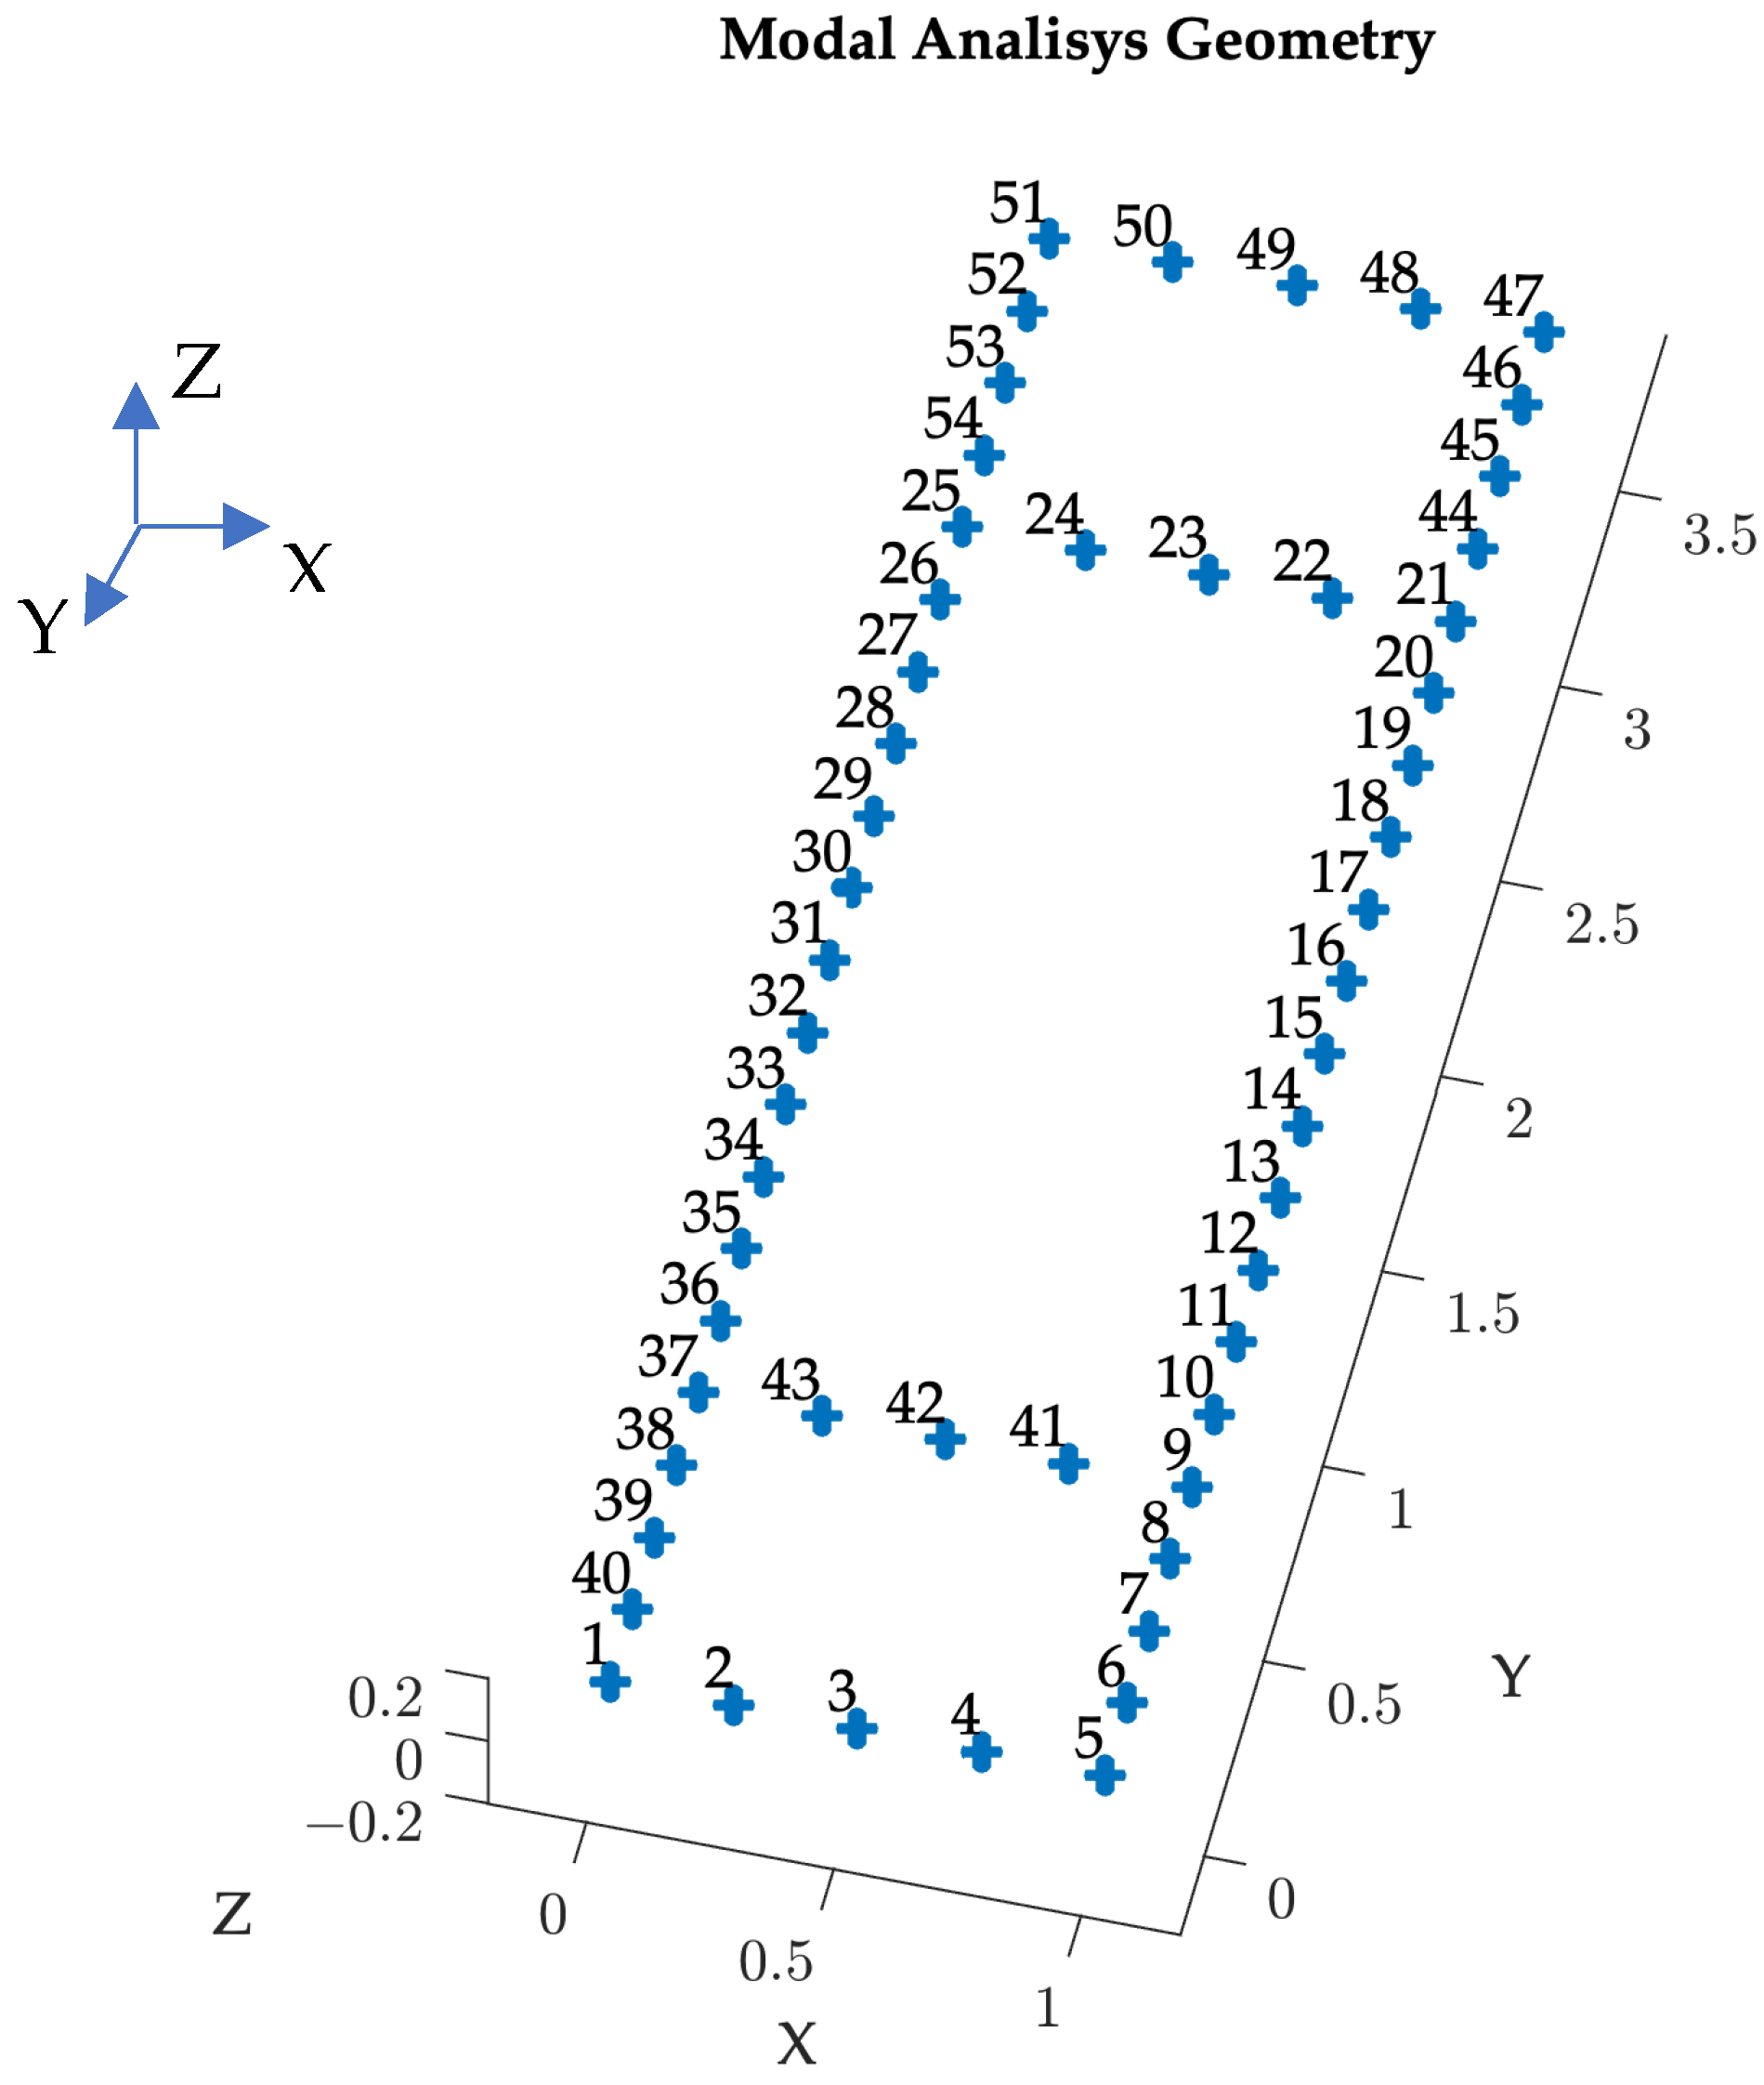
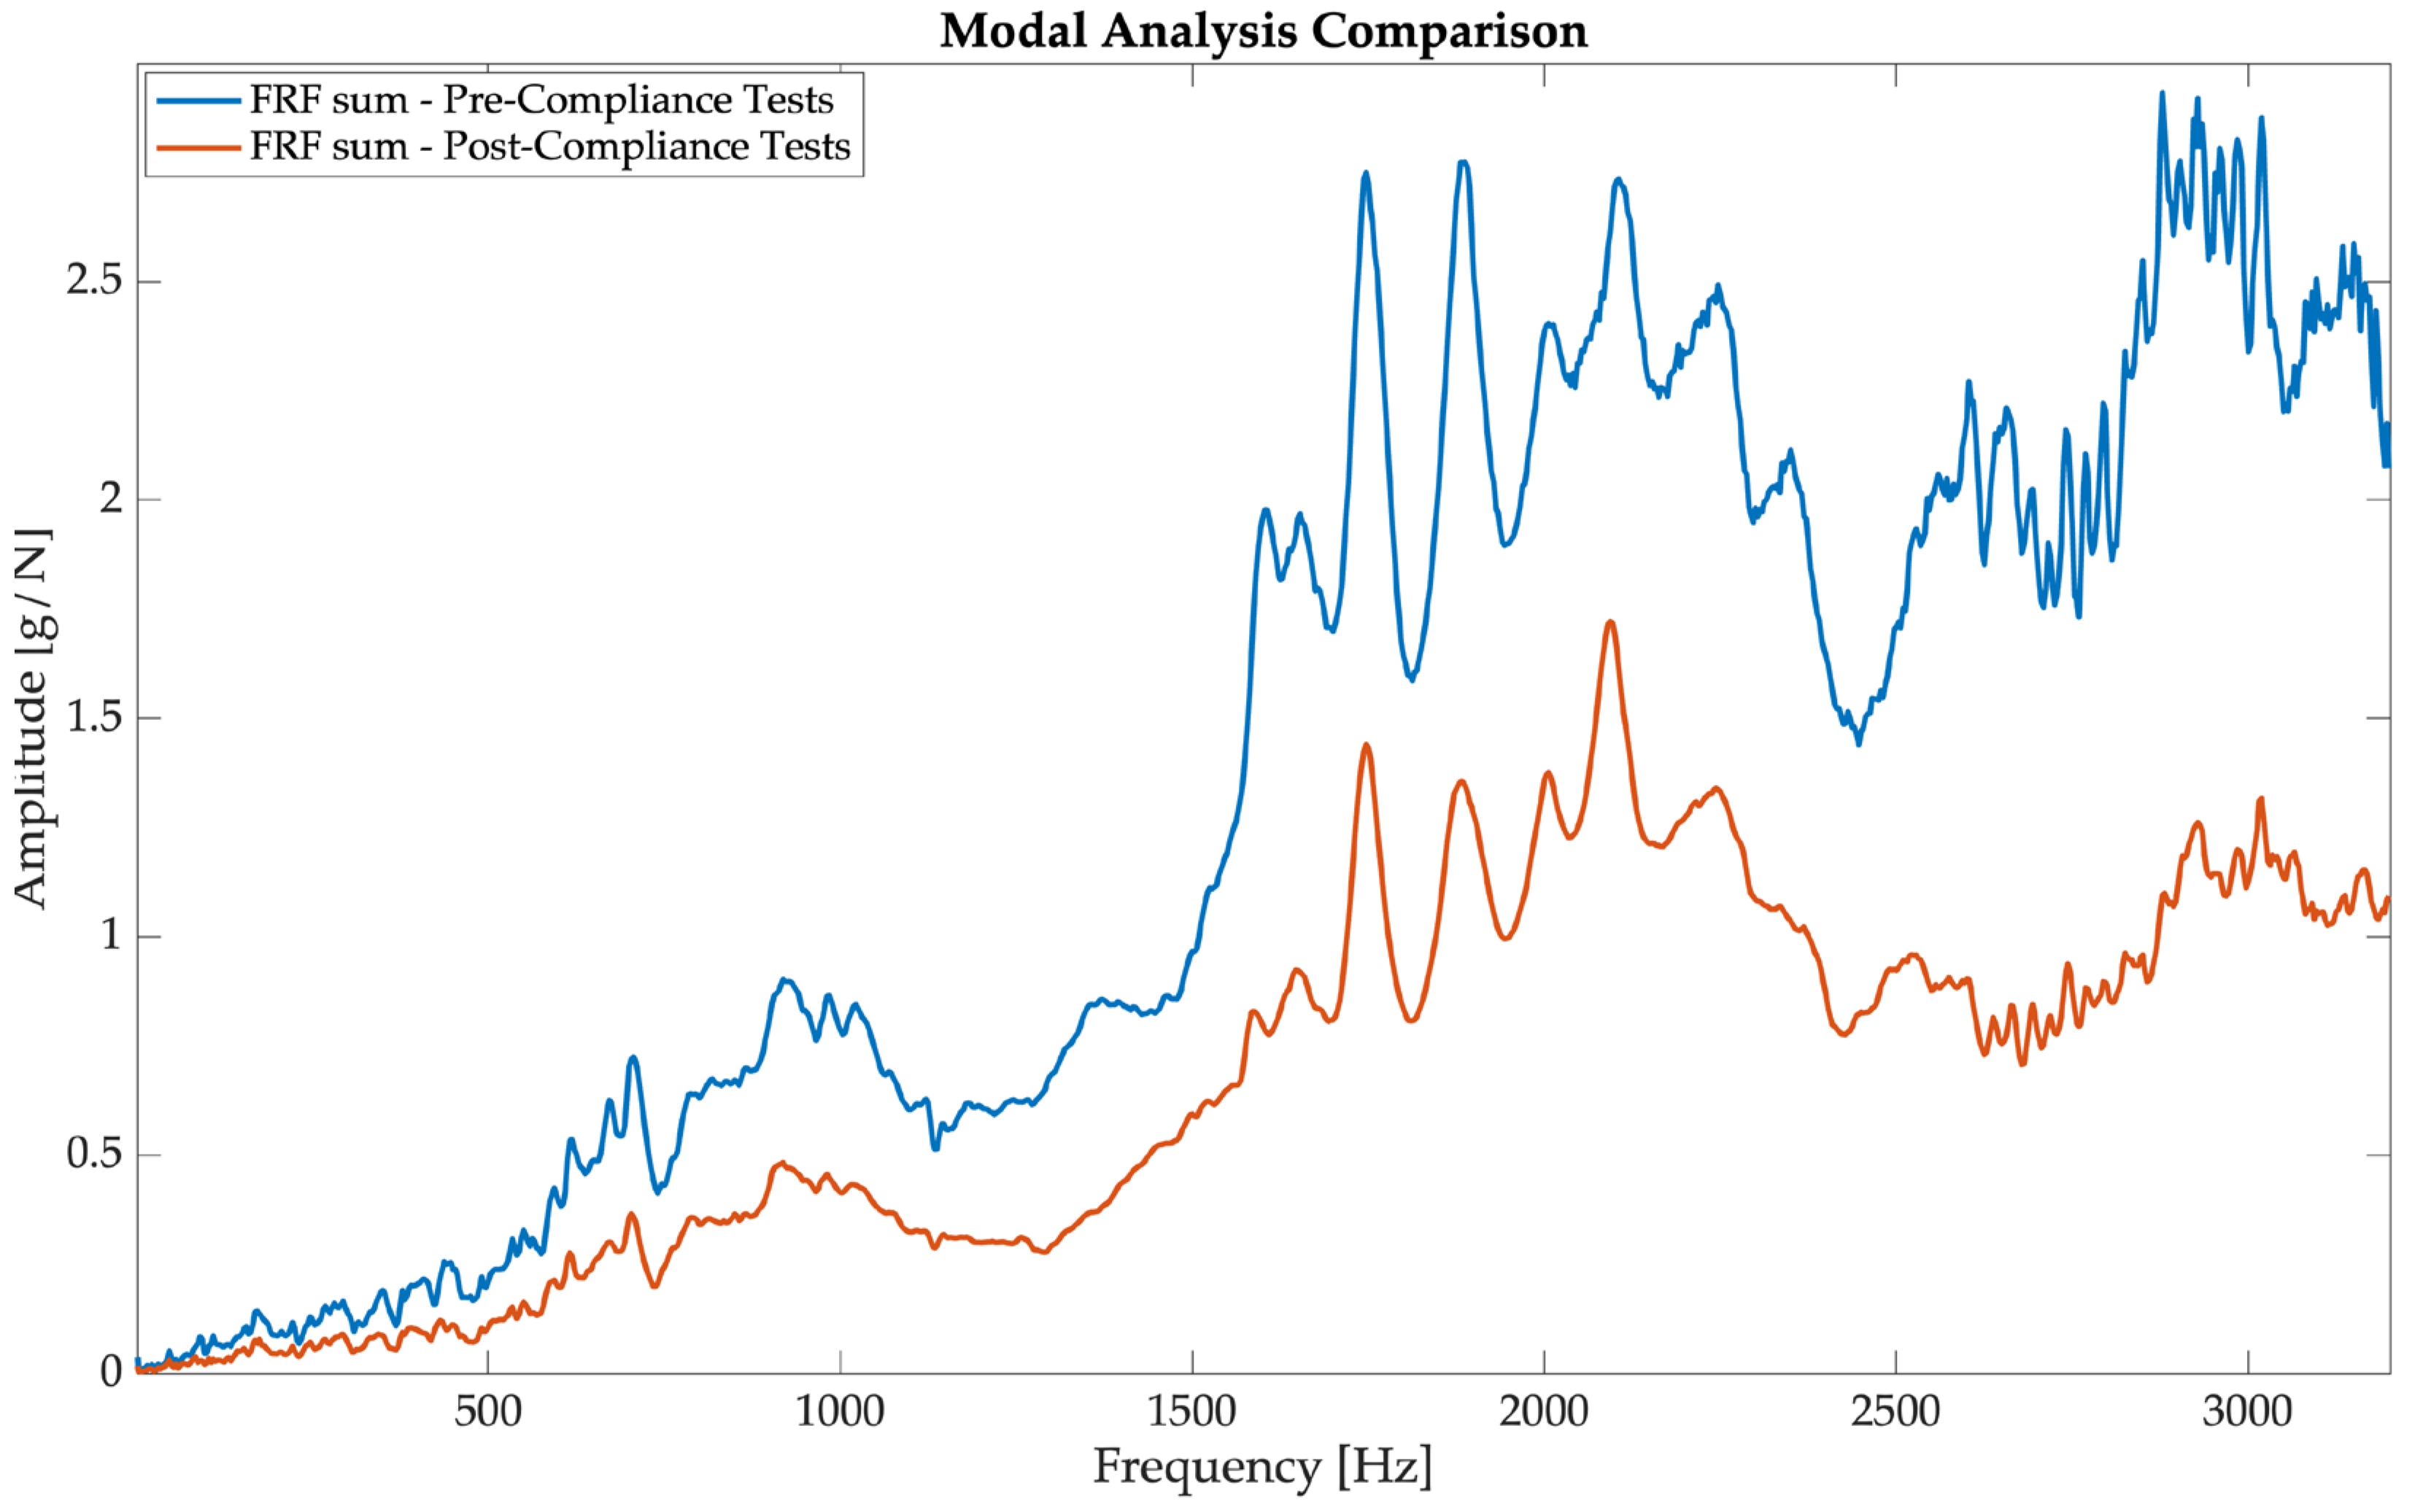
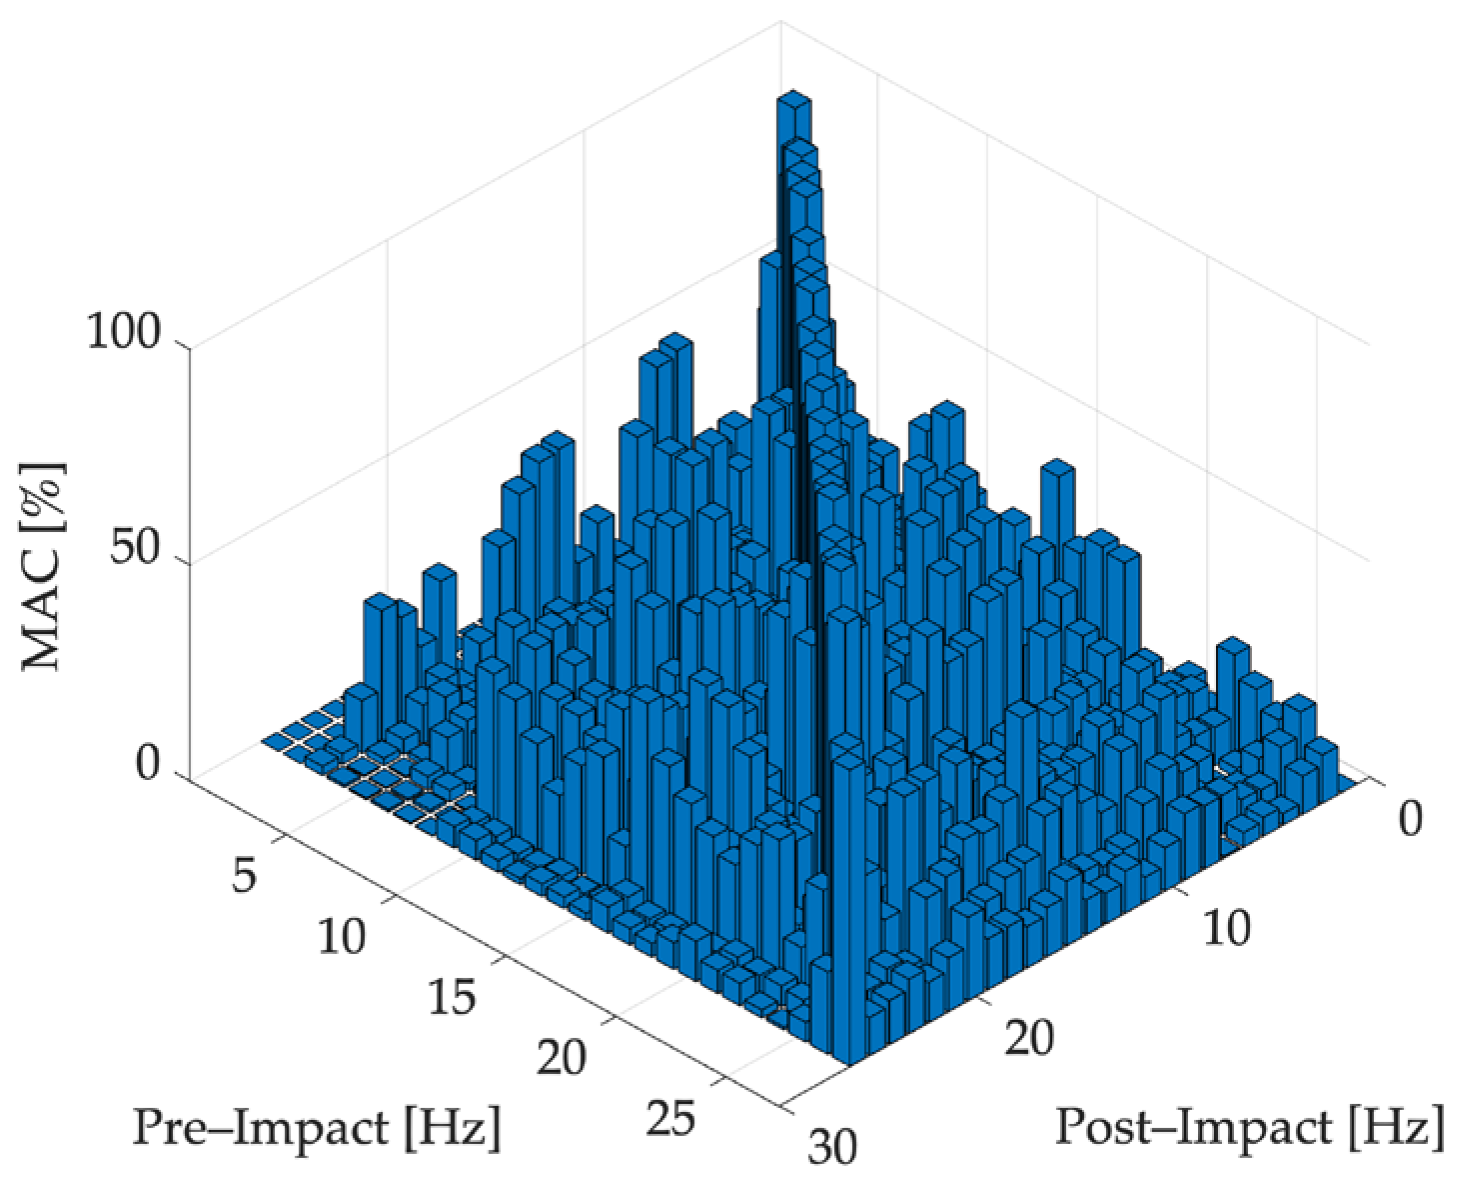
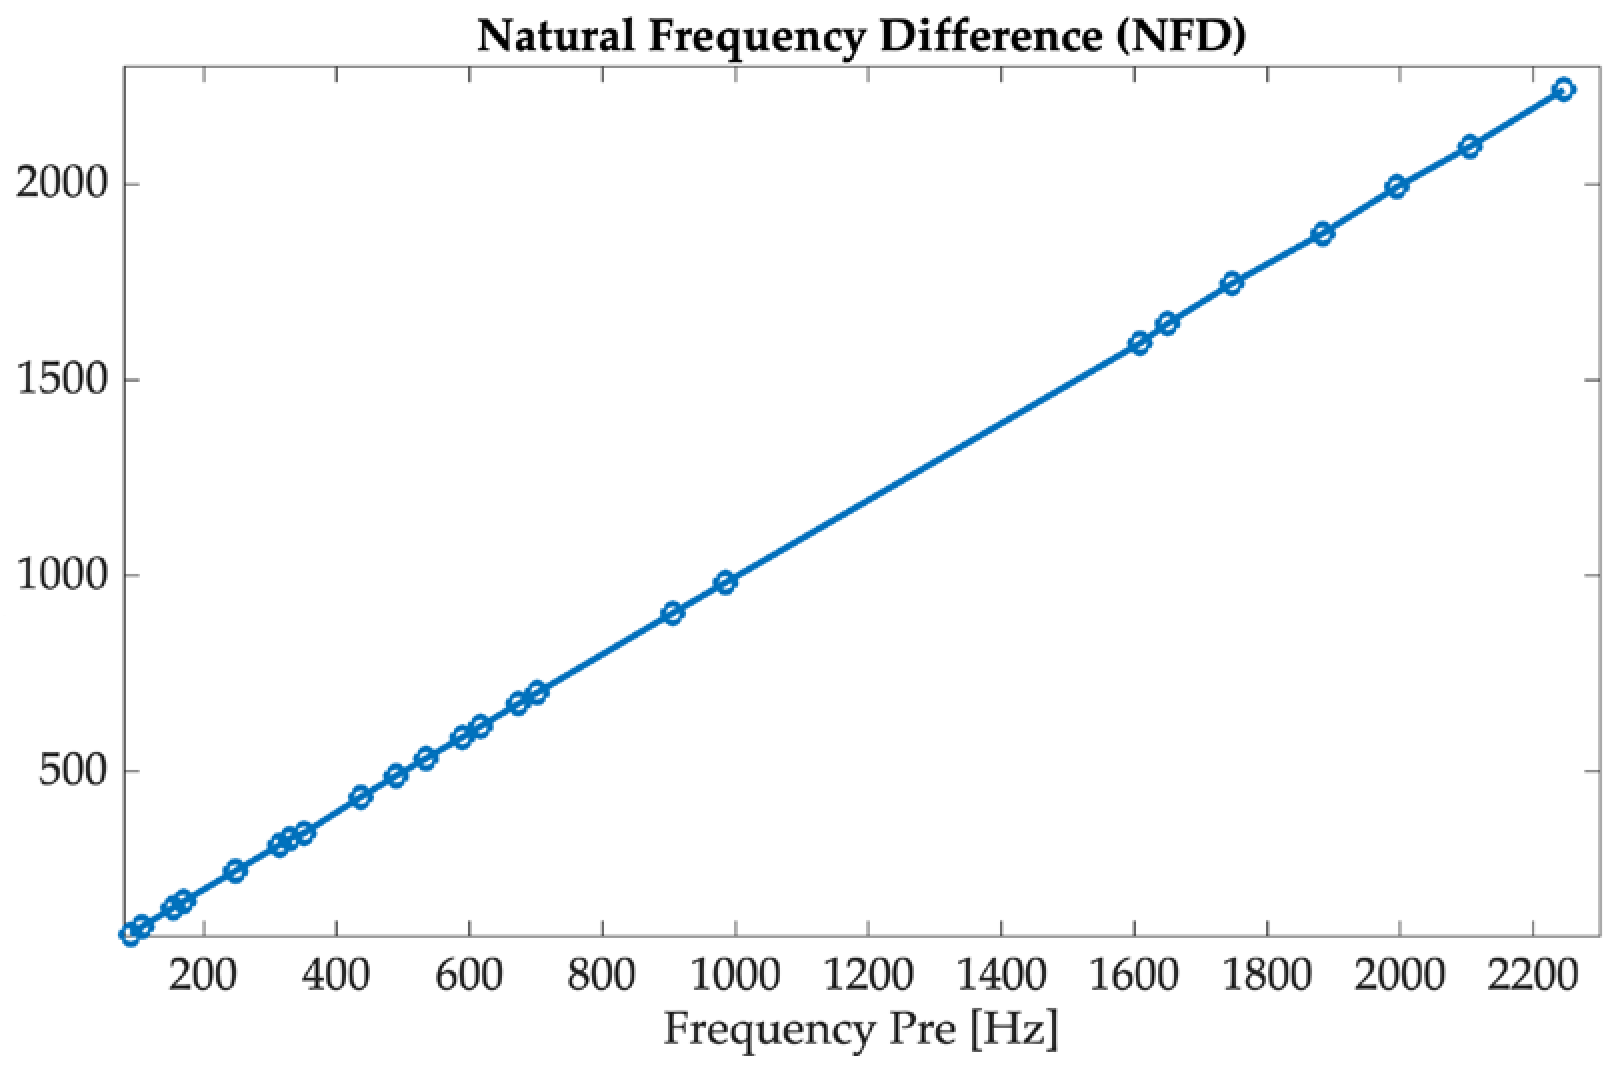
3.1. Modal Analysis (Pre/Post)

Two modal analyses were conducted to assess any changes in structure that might have occurred due to the conformance tests explained in Appendix A. The procedure for the evaluation of the structure was applied to the central module of the wall façade, and the geometry was configured based on the dimension of the module of interest: 54 nodes were created, as shown in Figure 15.
An instrumental hammer was used for the excitation of the surface, and the dynamic response at the nodes reported in Figure 15 was measured with monoaxial accelerometers installed for measuring in Z, moved all over the nodes. The force exerted by the hammer and the acceleration were collected by means of a SIEMENS acquisition system (SCADAS). At each node, the frequency response function was calculated as a response over force ratio. The sum of all the FRFs acquired is reported in Figure 16.
A modal analysis was performed on the FRF dataset collected to estimate the dynamic parameters of the structure under test (natural frequencies, damping loss factors, and mode shapes). A comparison between those parameters was estimated in the modal tests performed before and after the stress tests were performed. To compare mode shapes, the Modal Assurance Criterion (MAC) was used; to compare the variation in the natural frequencies, the Natural Frequency Difference (NFD) was estimated. The MAC and the SFD are reported in Figure 17 and Figure 18, respectively.
Two modes were selected to have an example of the structure movements at selected frequencies, as reported in Figure 19.
The natural frequencies of all the mode shapes identified with the modal analysis performed on the FRF dataset acquired on the structure before and after the compliance tests are reported in Table 3.

3.2. Accelerometers

In this section, the most relevant results are reported. As mentioned above, the accelerometer results could be comparable, with no significant differences among them. Therefore, in this article, the reported results consist of the data collected and analyzed from the external accelerometer’s ‘z’ direction called FAcc—Z.
The data analysis reveals that relevant and significant results for the façade were obtained. The SHM can be performed considering the fixed installation of accelerometers on a wall curtain façade, as explained in Section 2.5.
At first, the analysis of the signal over time was performed to understand the global response of the accelerometers subjected to the compliance tests. In fact, a Root Mean Square (RMS) analysis of the signal over time was performed for each test day, as reported in Figure 19. In the following figure (Figure 20), the error bar is shown on RMS data for each day. This value was calculated by applying the accelerometer sensitivity value of ±10% to the accelerometer signals. The error band is outlined by a dashed line surrounding the accelerometer signal curve.
The structure excitation was evaluated for each day; the graph corresponding to each excitation event is reported in time on the left and in frequency on the right.
The tests performed during day 1 were acquired and are shown in Figure 21. During this day, air permeability and rain were performed. The power spectrum estimation function was used to reduce the signal noise and better evaluate information. Each 10 s time history was divided into 0.8 s chunks with a 50% overlap to obtain 25 averages.
The tests performed during day 2 were acquired and are shown in Figure 22, are presented following the chronological order of the appearance of events. During this day, wind (repeated), air permeability (repeated), rain (repeated), and building movements were performed. To reduce the signal–noise ratio, the power spectra of the signals were calculated using a frequency-domain averaging procedure. The 10 s time histories were divided into 0.8 s chunks with a 50% overlap to obtain 25 averages.
The time history registered during the building movement test Figure 22i is evidenced by several transients. The power spectrum of each transient signal was calculated and then averaged to improve the signal-to-noise ratio.
The tests performed during day 3 were acquired and are shown in Figure 23 and are presented following the chronological order of the appearance of events. During this day, fan excitation and impact tests were performed. The power spectrum estimation function was used to reduce the signal noise and better evaluate information. Each 10 s time history was divided into 0.8 s chunks with a 50% overlap to obtain 25 averages.
The time histories registered during the impact tests show transient signals typical of impact excitation. The power spectra of these time histories were computed by selecting only three transient signals and averaging their power spectra to improve the signal-to-noise ratio.
The physical phenomenon is demonstrated with the example shown in Figure 24, in which two comparable tests—rain (static)—between two different days (day 1 and day 2) are presented. By comparing the power spectrum acquired during the first rain test (blue line) and the one acquired during the second rain test (red line), it is evident that the resonances excited by the simulated environmental dynamic load (represented by the impacting rain) are shifted towards lower values. This allows the inference that the structure underwent a stiffness decrease, which can be due to structural yielding.
After conducting the tests, it became evident that the structure is stressed during dynamic tests, as monitored by the RMS level of the accelerometers. These dynamic tests allow for the extraction of a frequency response function, revealing various modes of vibration and any changes in the structural response during testing. The responses of the accelerometers can be correlated with those of the other examined sensors.

3.3. Force Washers

This paragraph reports structure behavior during the stress test analysis of the forces. The results obtained are evident in the graphs below (Figure 25). The error bar is delineated by a light blue dashed line surrounding the force washer’s signal curves. This band was computed considering the uncertainty related to the sensitivity deviation declared by the washer constructor, which is 1.5%.
By observing the trend of the bolt’s tightness during day 1, it is possible to notice that the tightness at the end of the test is equal to the tightness measured before starting the test; this means that the structure did not experience any modification. On the contrary, during the second day, a negative trend of the bolt’s tightness is evident. Table 4 reports the value of the tightness measured by all the washers at the beginning and at the end of the tests performed during day 2 and their difference. It is possible to see that all the washers experience a decrease in tightness, particularly those connected to channels 2 and 7 (see Figure 4) for the force channels position. An important drop in the bolt tightness is visible immediately after the first test (wind resistance). As for day 1 and day 3, the tightness of the bolts remains almost constant.
The force washers allow for the visualization of trends in the load curves of individual tests, enabling the identification of instances when the grab brackets experience stress in shear or compression, as well as any loosening of the anchor bolts. Continuous monitoring of the clamping forces will be highly beneficial for the health monitoring of the entire structure and for triggering alerts when the clamping forces fall below the specified limits.

3.4. FBG Sensors

FBGs for temperature—Figure 26 displays the results obtained by the FBG sensor for temperature (Channel 4) associated with the InComEss architecture. A noticeable increase in temperature was recorded during the first day of testing, indicating the correct procedure for data collection. The markable timestamps are as follows: 11.50 h—temperature decrease recorded during the air exfiltration test (−600 Pa) (i); 12.10 h—temperature increase of 0.5 degrees can be observed during the test since a heat lamp was placed near the temperature sensor (ii); 16.30 h—rapid temperature increases from 16 to 18 degrees due to the rain test likely due to the water temperature (iii).
The temperature on this test day was much more stable throughout the second day, as recorded by the temperature sensor reported in Figure 27.
In this paragraph, the FBG for strain’s test results are reported. In Figure 28, the strain results obtained by the cable applied on the glass panel during the first day can be observed. The test started with air infiltration followed by exfiltration, repeated twice. The glass surface reached negative values of strain during the increasing pressure and positive ones during the negative pressure. Indeed, the FBG sensors in the first case were compressed, while in the second, they were expanded.
The strain levels on channel 5 (the cable on the aluminum profile) are minor because the sensors are applied on the aluminum profile where the façade strain due to deformation is contained (Figure 29).
The highest strain levels were measured at the end of the second day in channel 3 (z) when the wind pressure and depressure were executed; indeed, in less than 5″, the façade was stressed from 0 to +2625 Pa, and from 0 to −3000 Pa (Figure 30 and Figure 31).
Figure 31 displays the result obtained for channel 5 (x, y) during day 2.
Figure 32 reports the result obtained for channel 2 during day 2. Strain results obtained from channel 2 (z direction monitoring) are higher than channel 5 (x, y). This can clearly be observed in the rain—dynamic test, which executes from 11:50 h to 12:20 h, and the rain—test static, which executes from 16:20 h to 17:20 h, where the strain level is raised in steps following the pressure curve increasing(+600 Pa).

4. Discussion

The results demonstrate the efficacy of the developed technique, which is capable of monitoring various parameters. However, it is important to mention that during the test, the façade passed all the assessing criteria defined by the standard. Even though the façade did not undergo damage or deformation, the installed kit demonstrated its potential to be applied in SHM. Indeed, it is sensitive to minor structural variations, suggesting its potential for early damage detection.
Several key findings regarding the performance of different sensor types for building envelope health monitoring under various loading conditions were highlighted by the activities to validate sensing technologies:
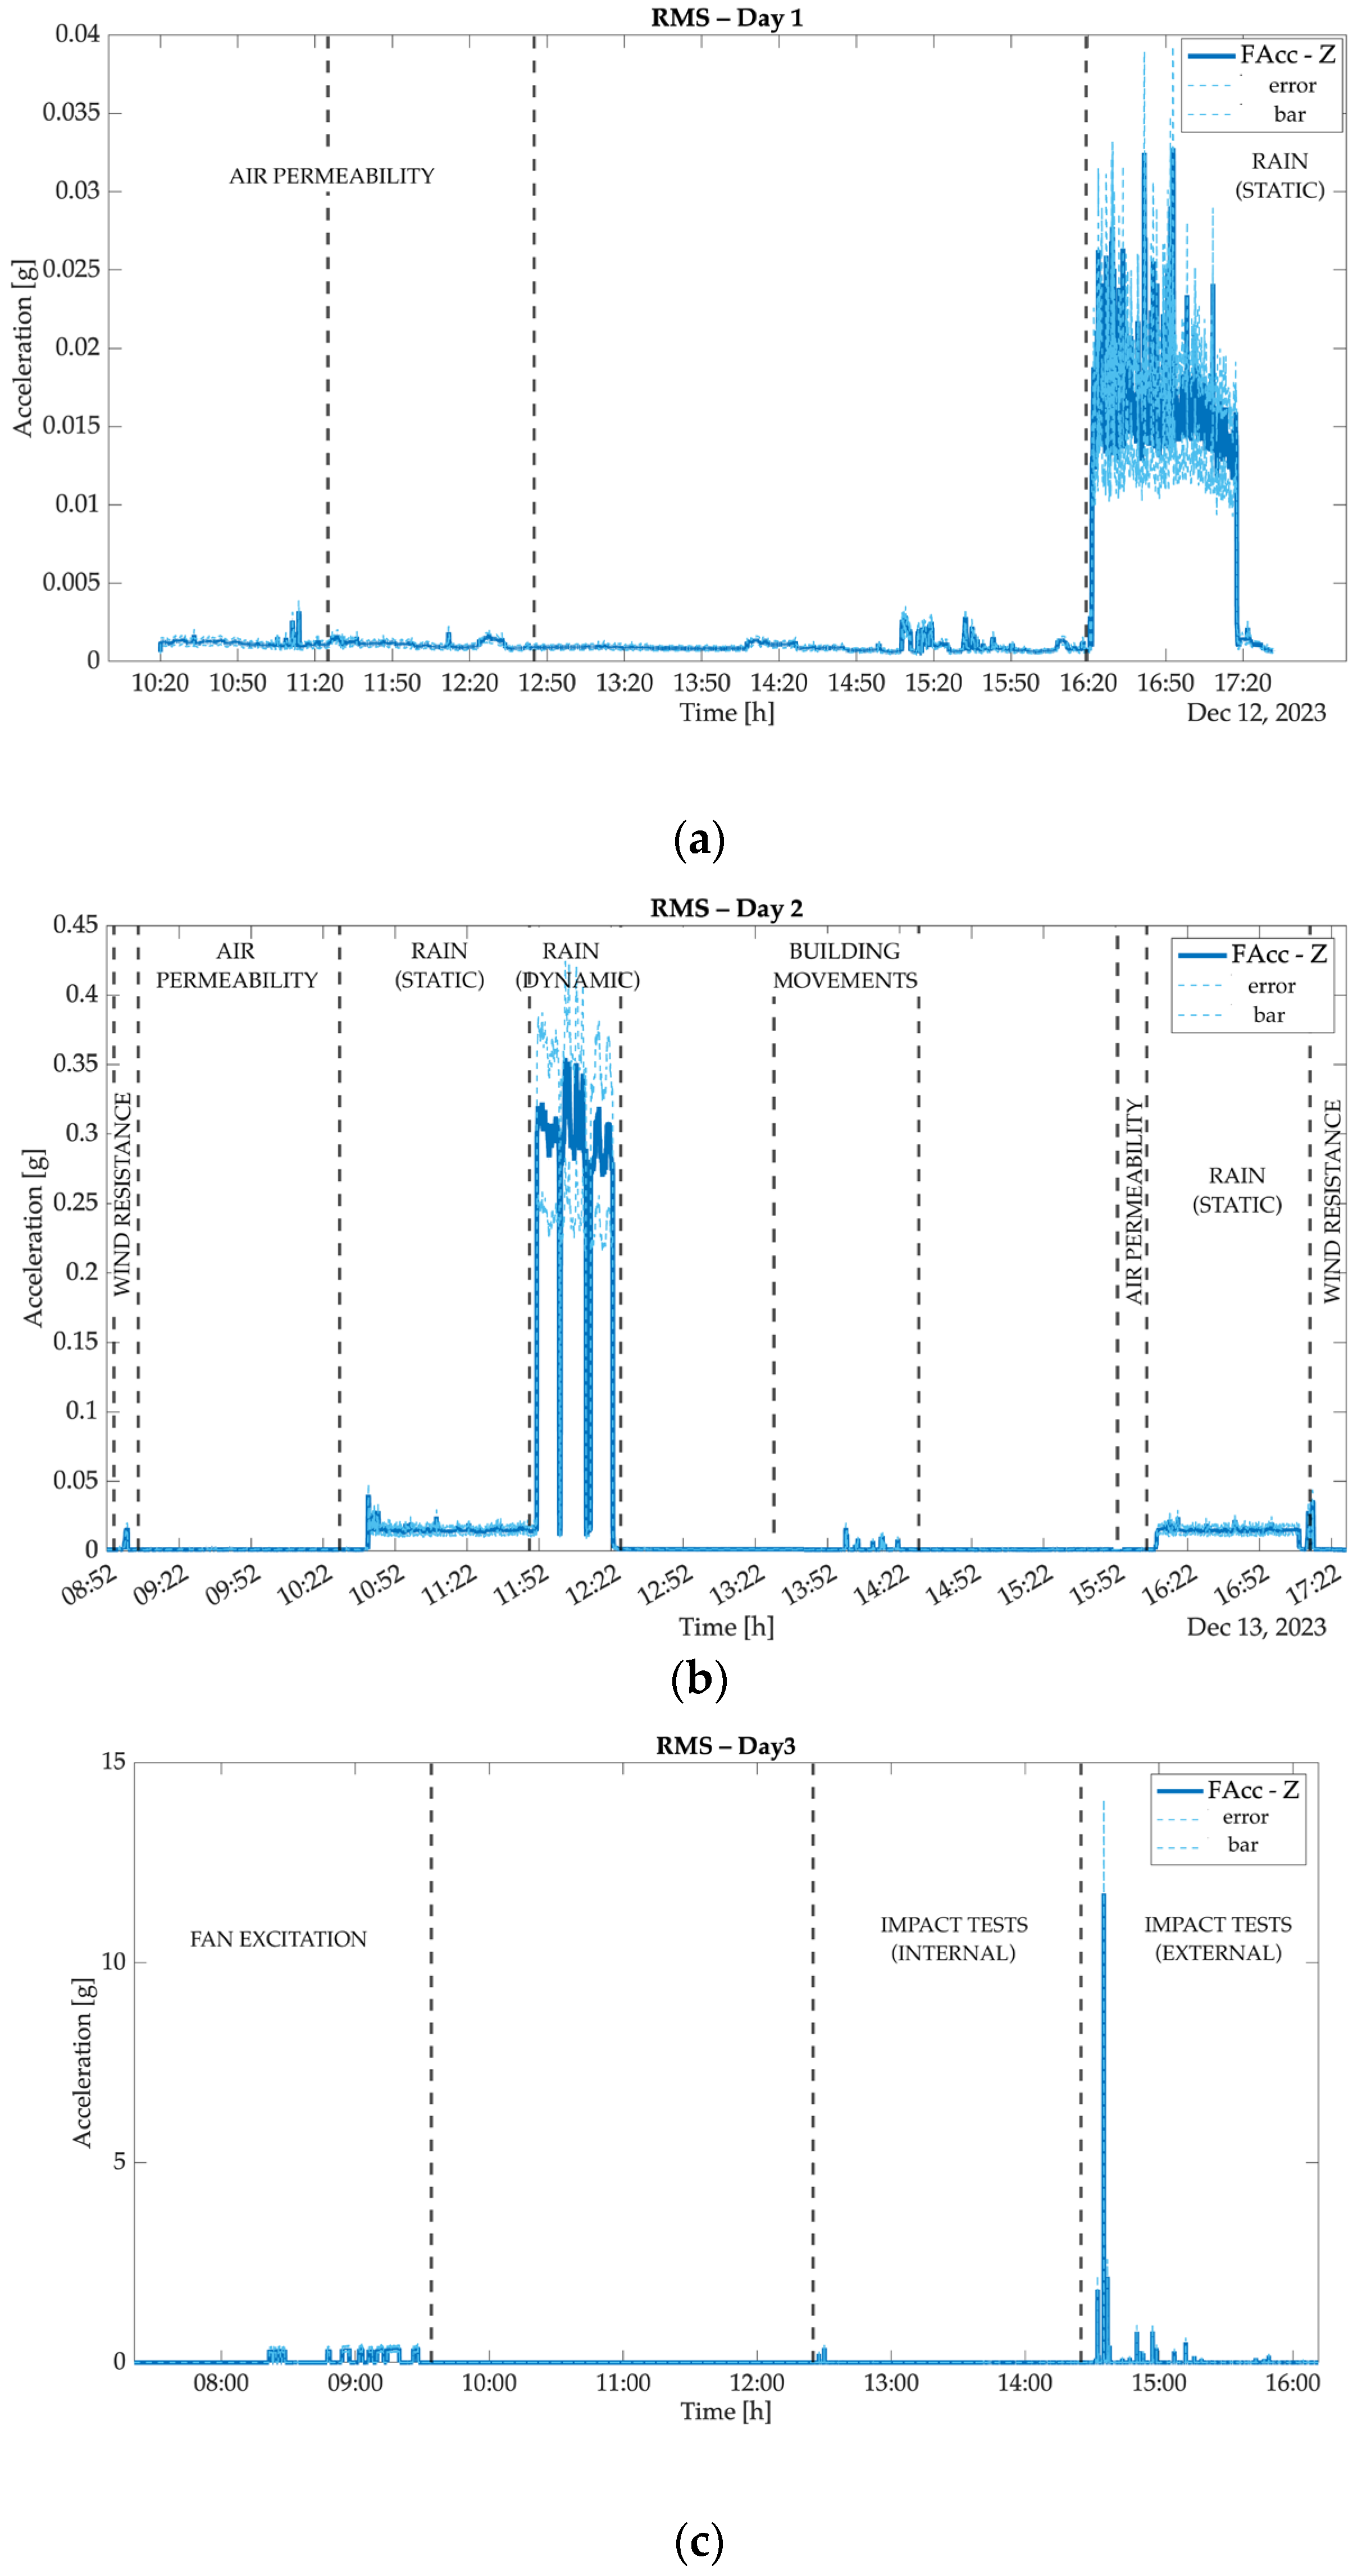
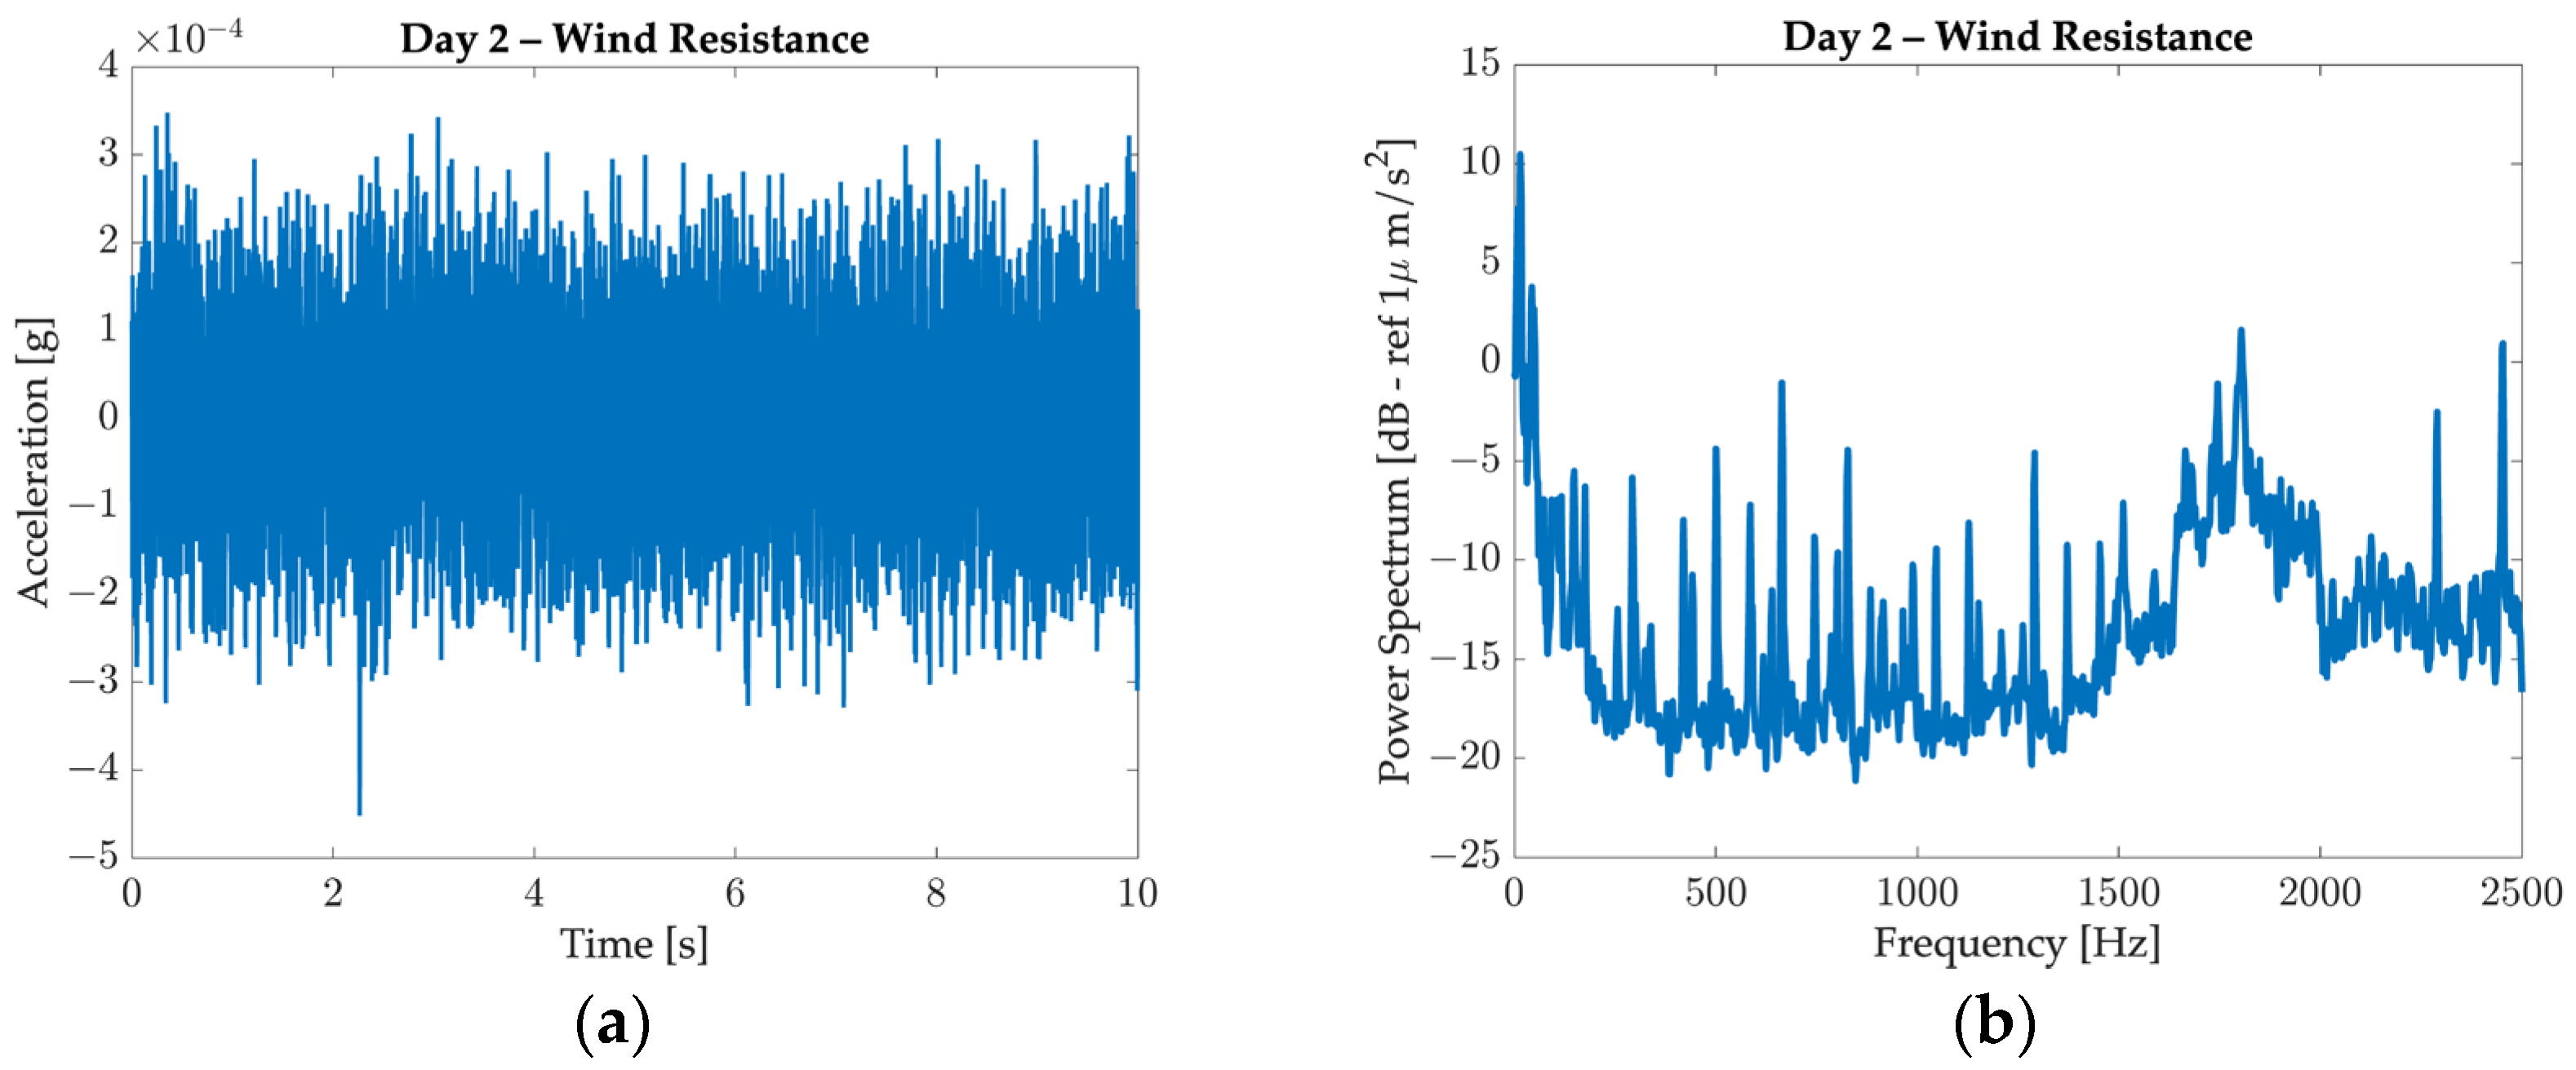
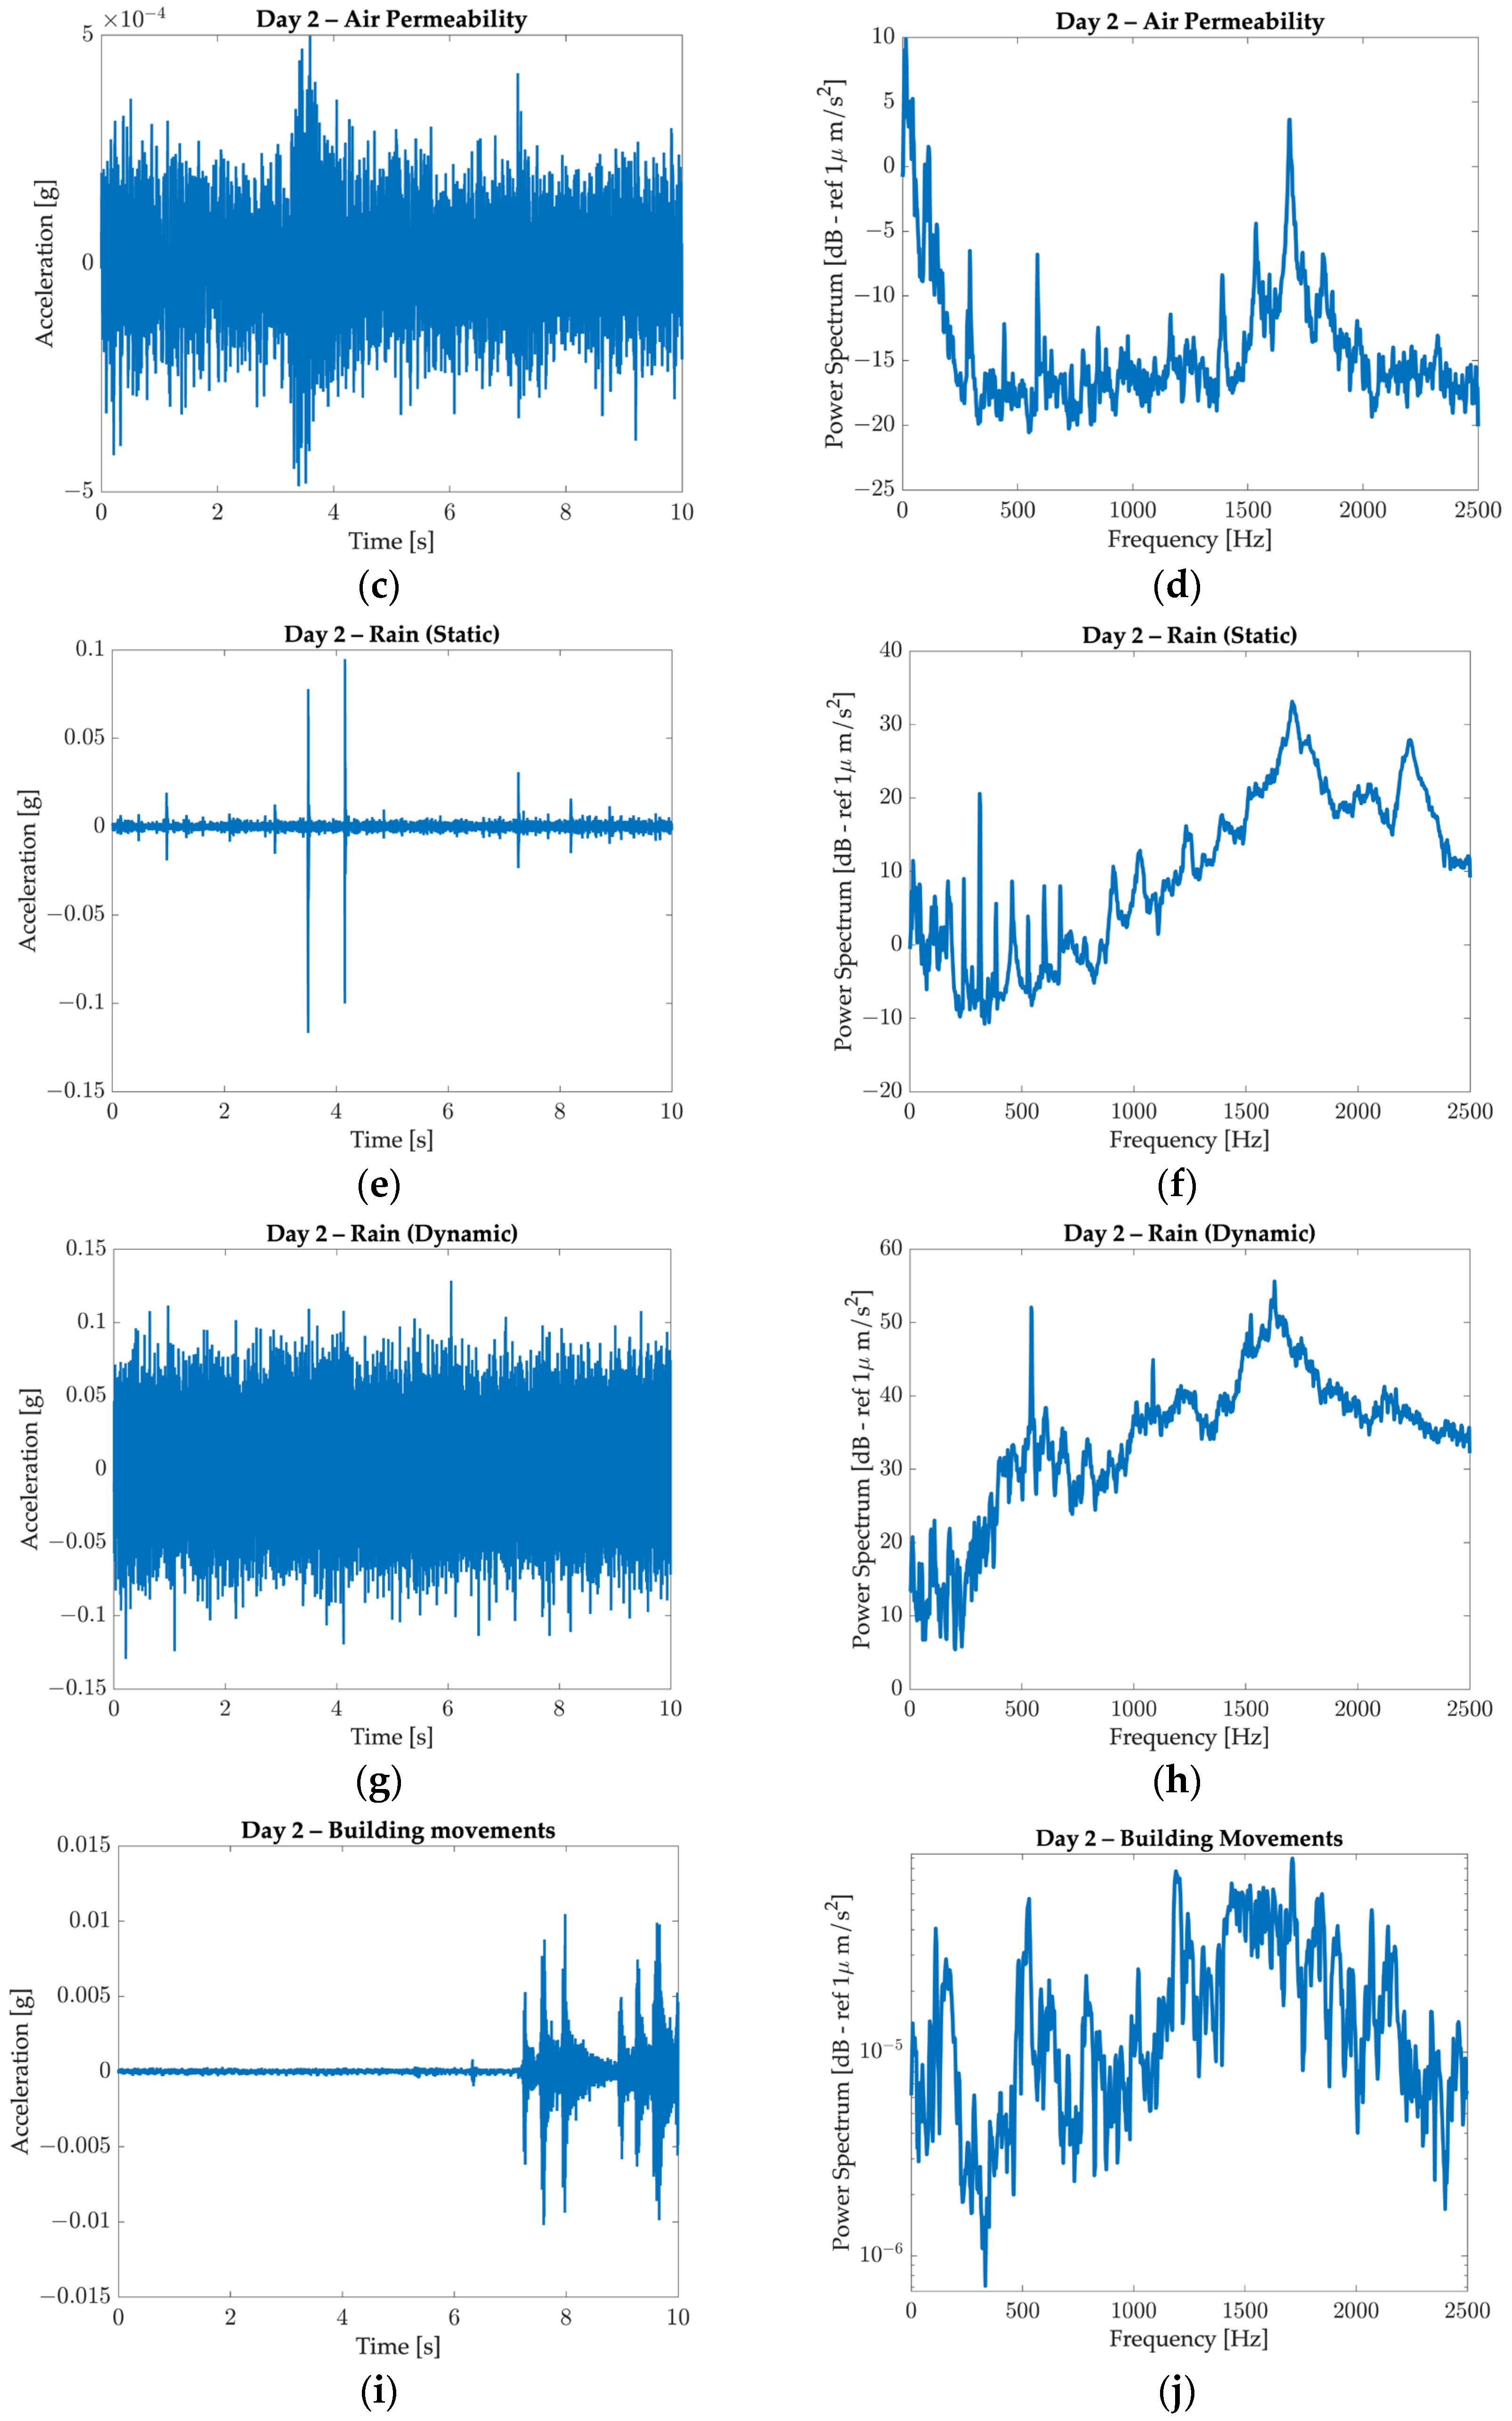
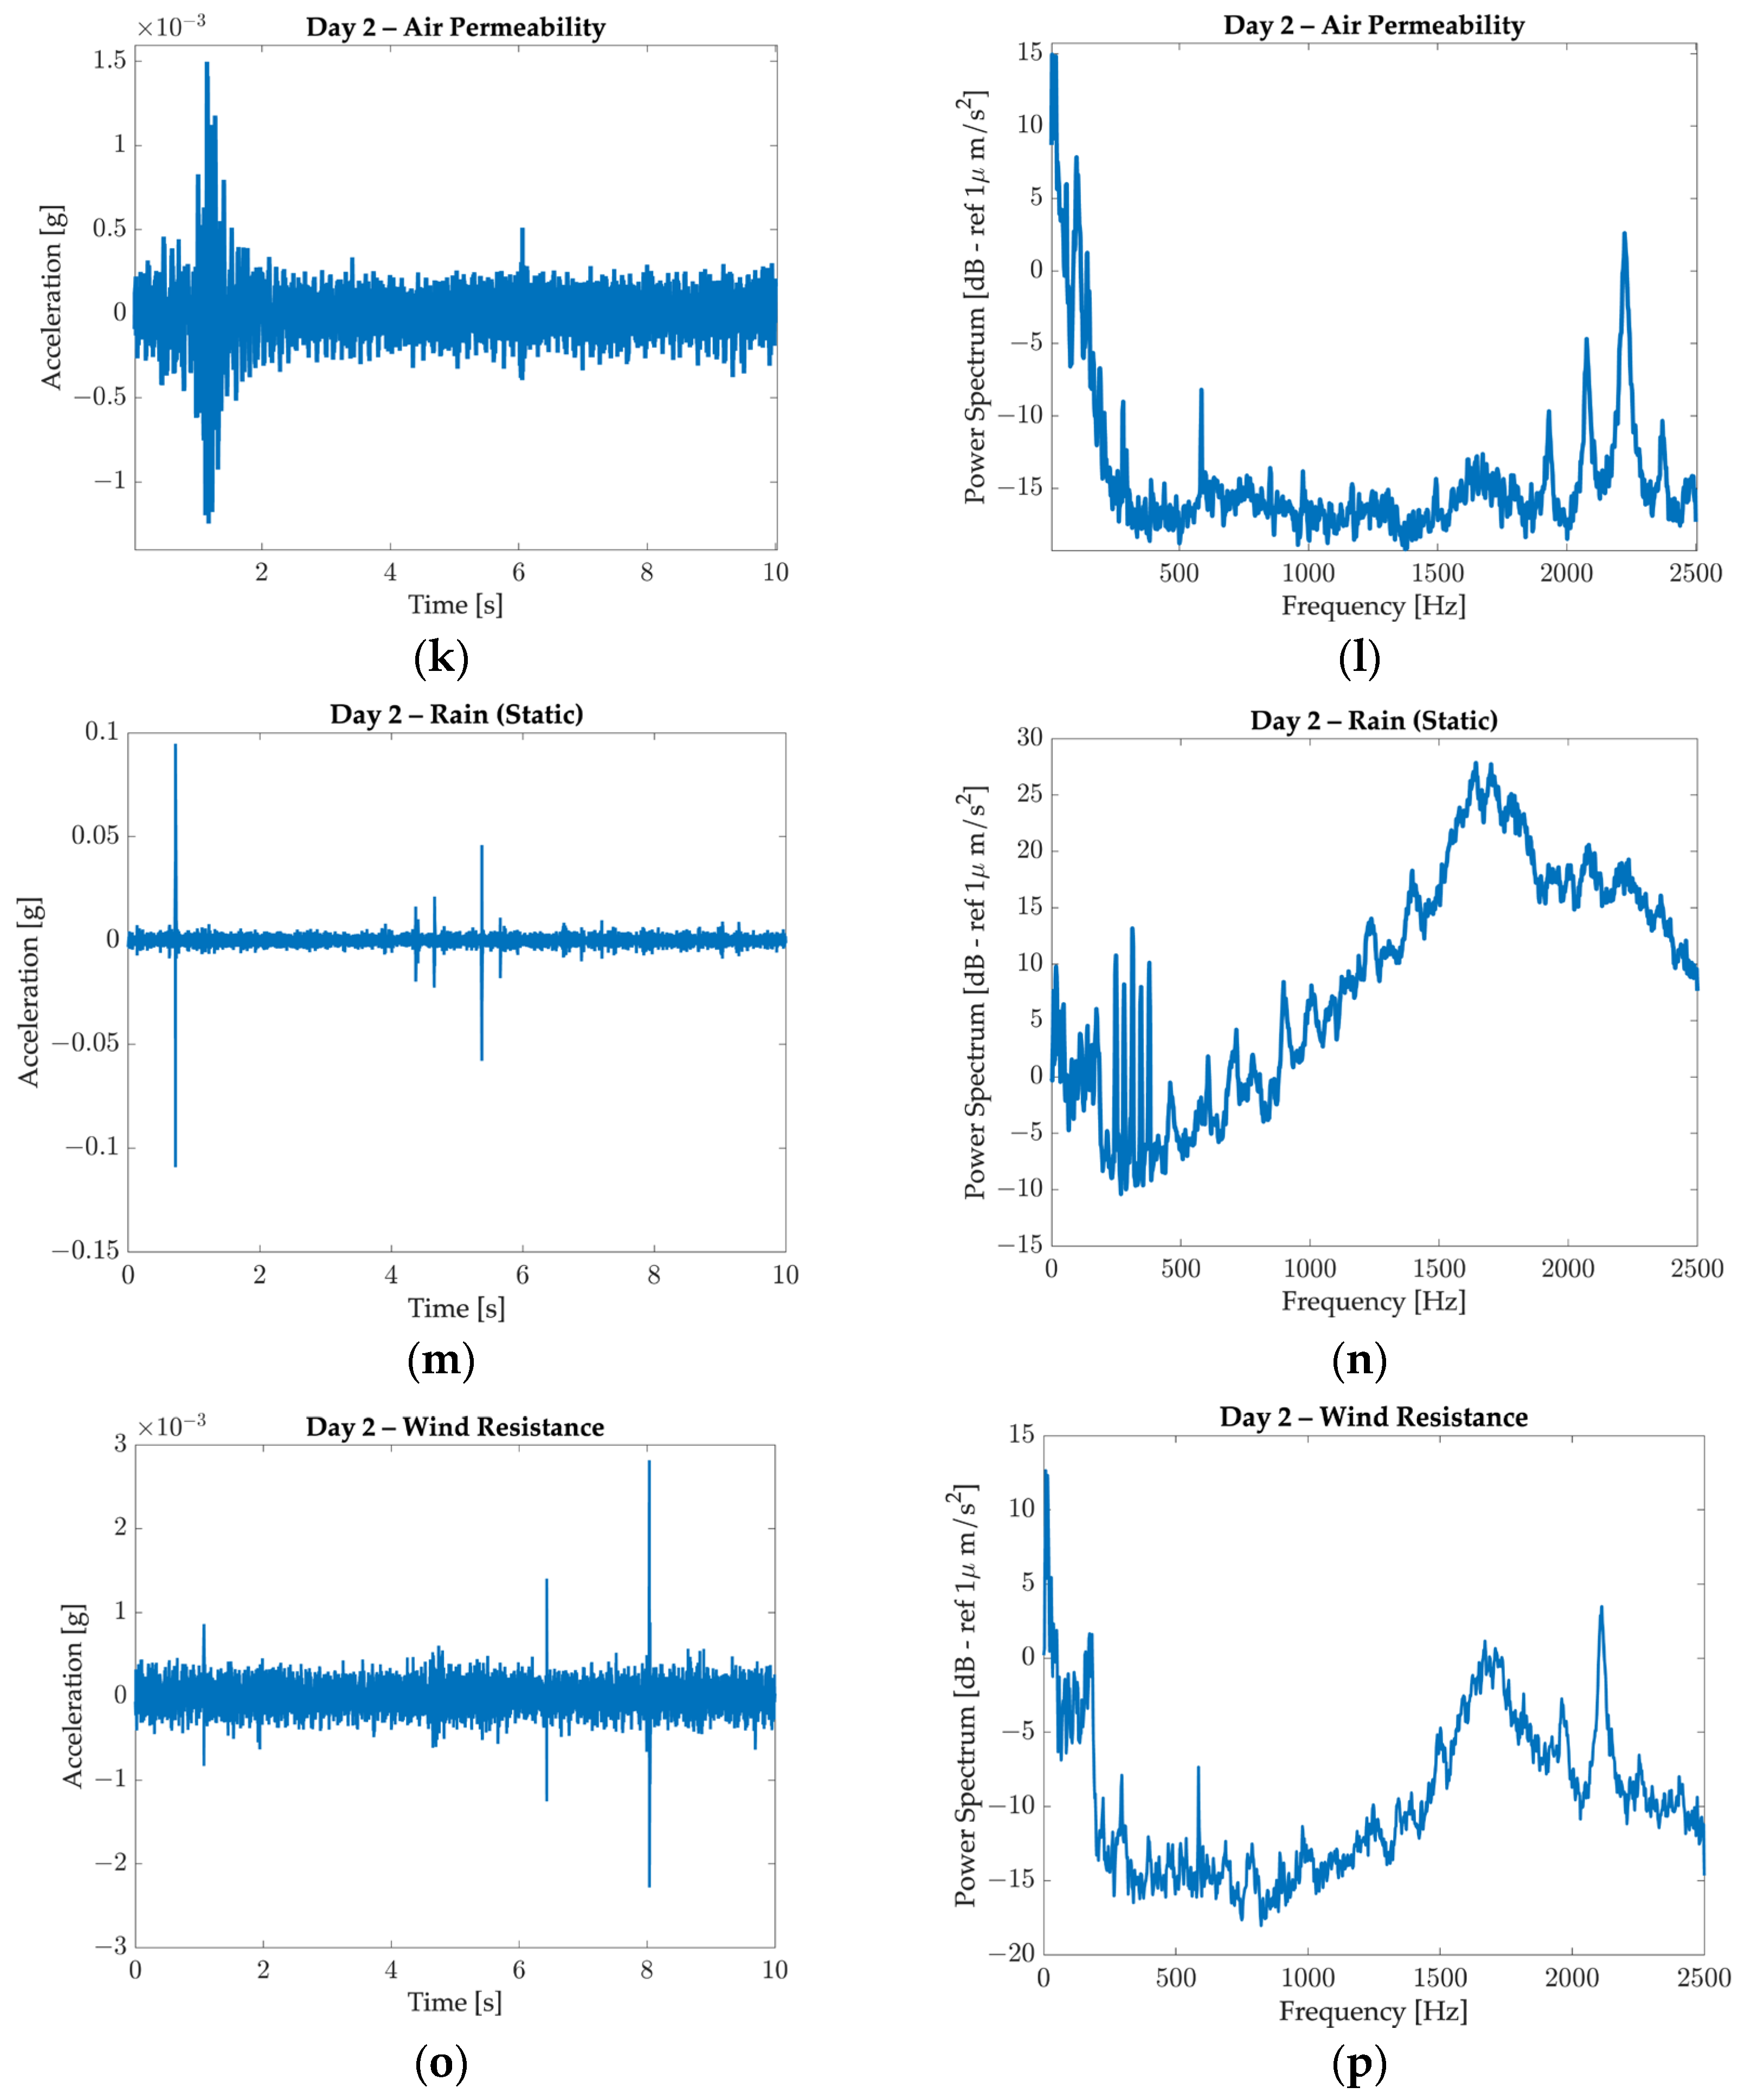
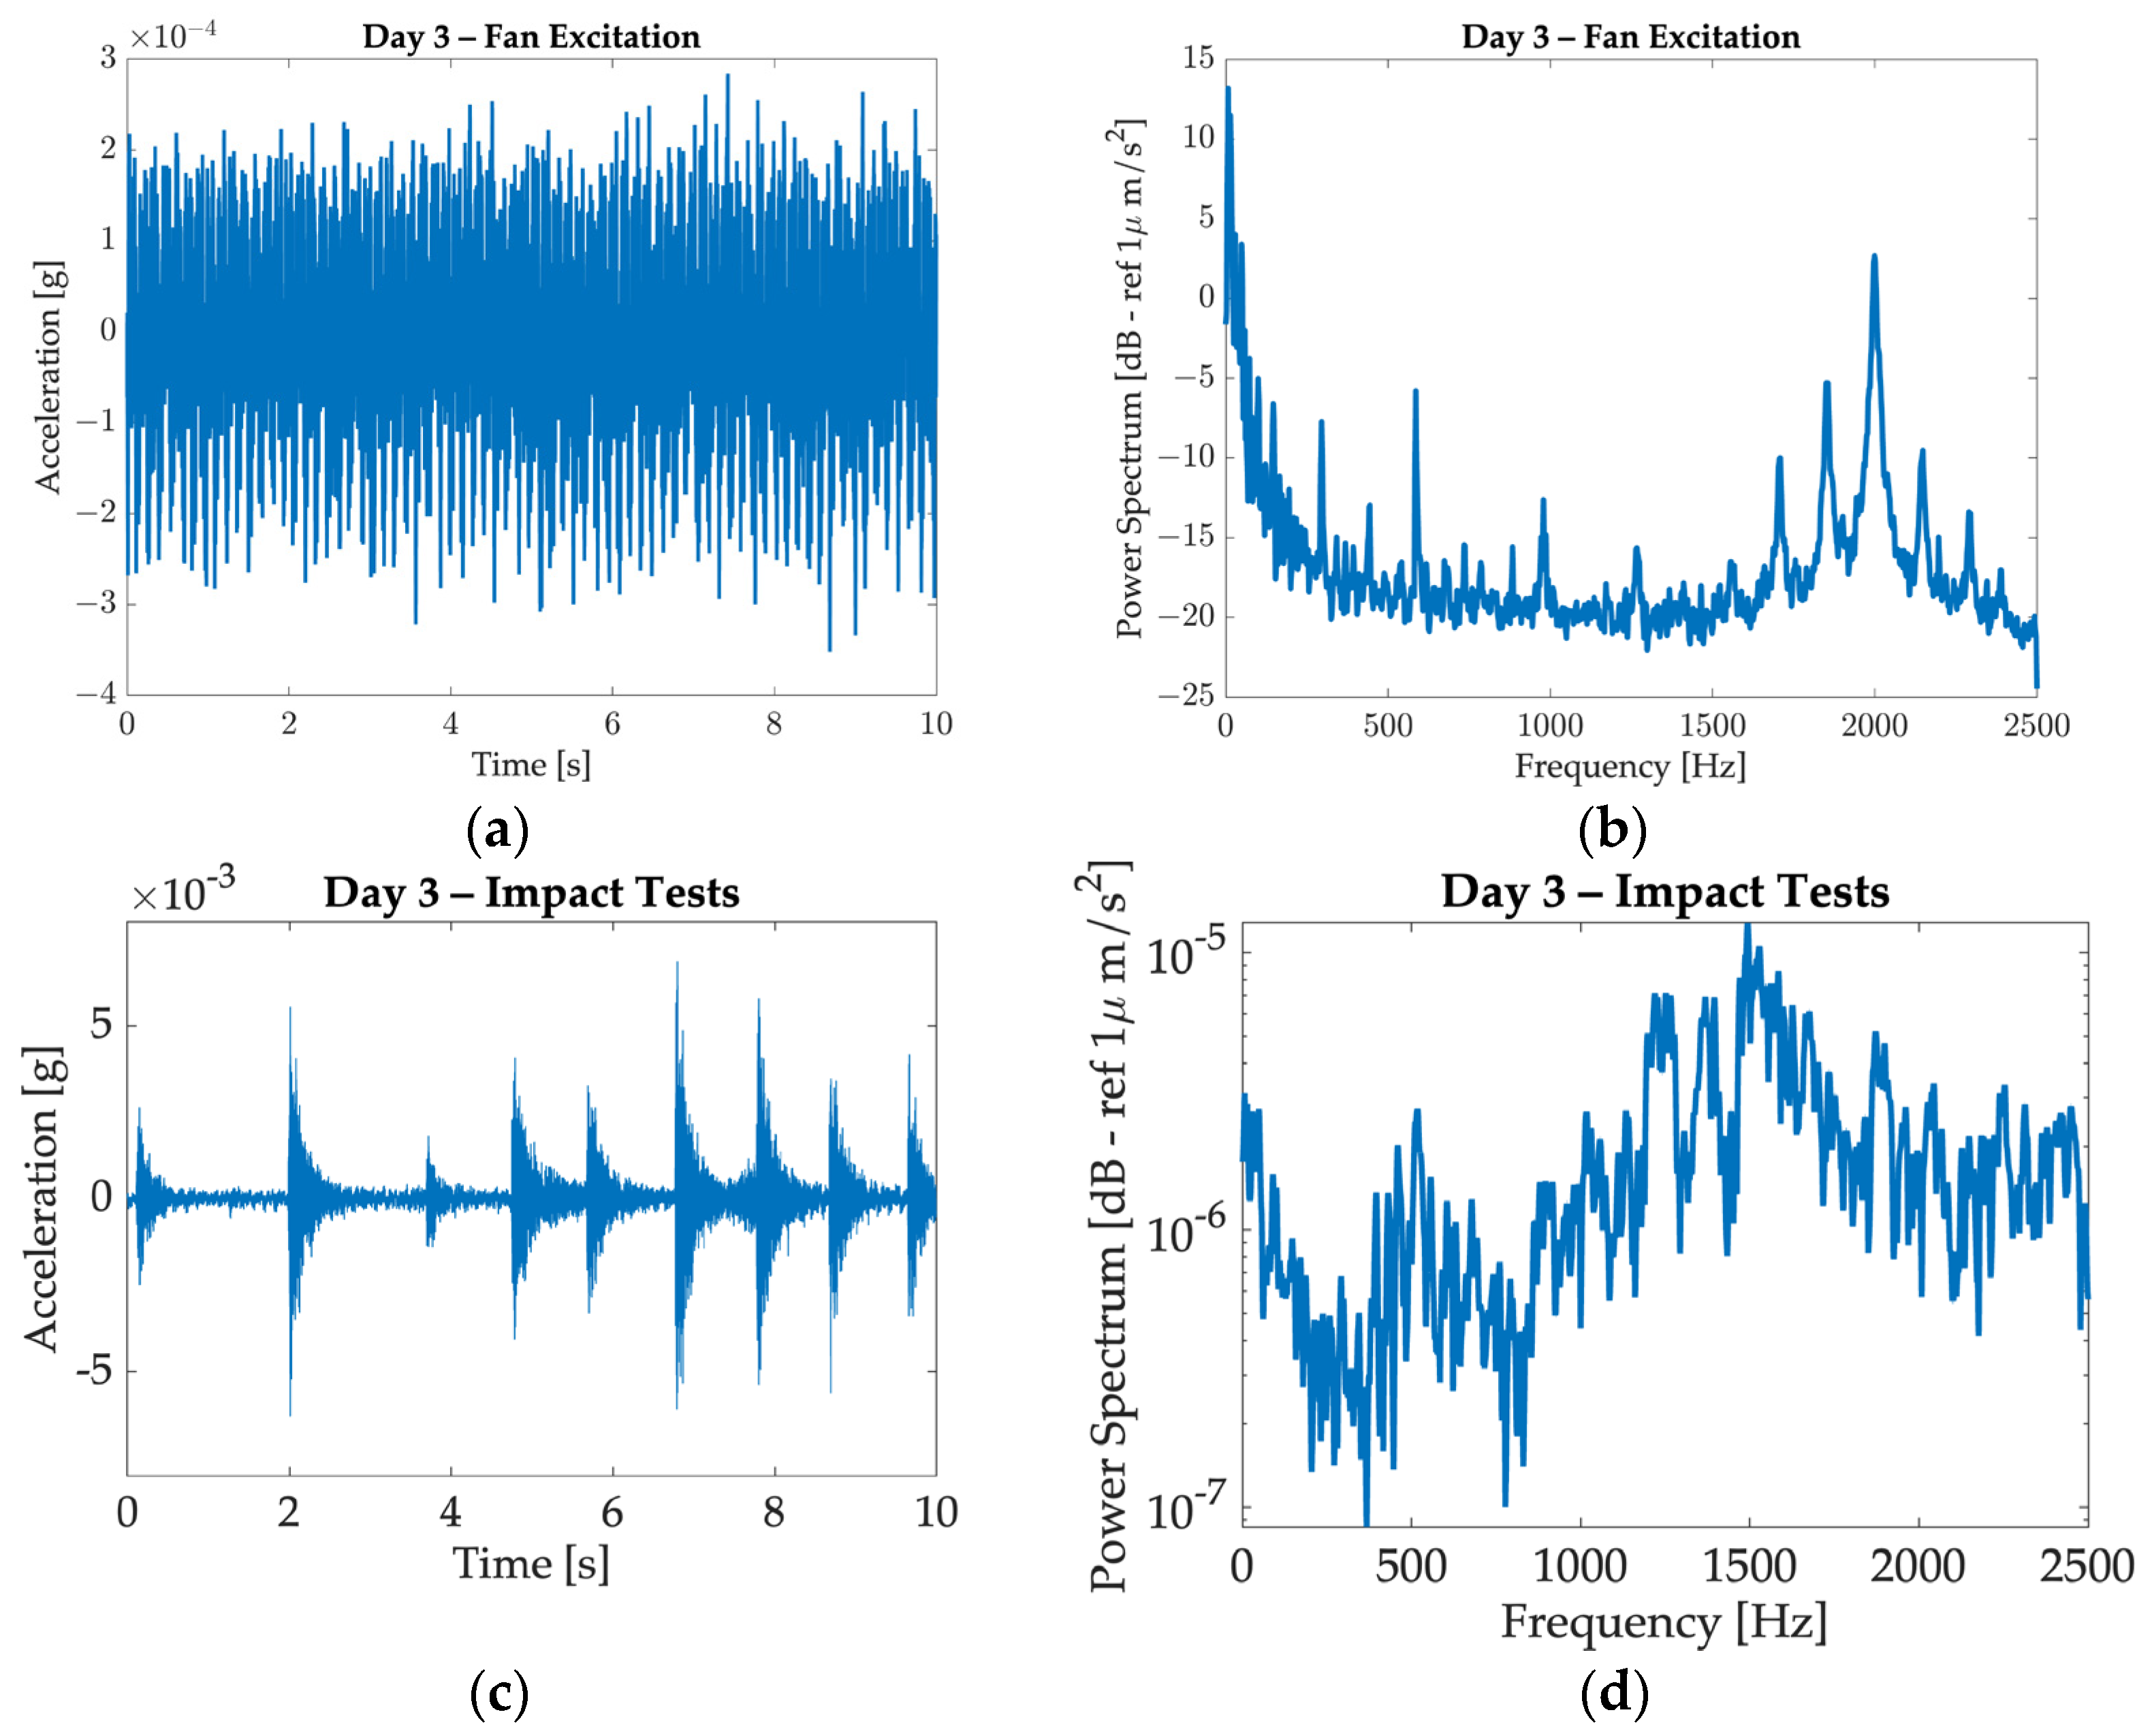
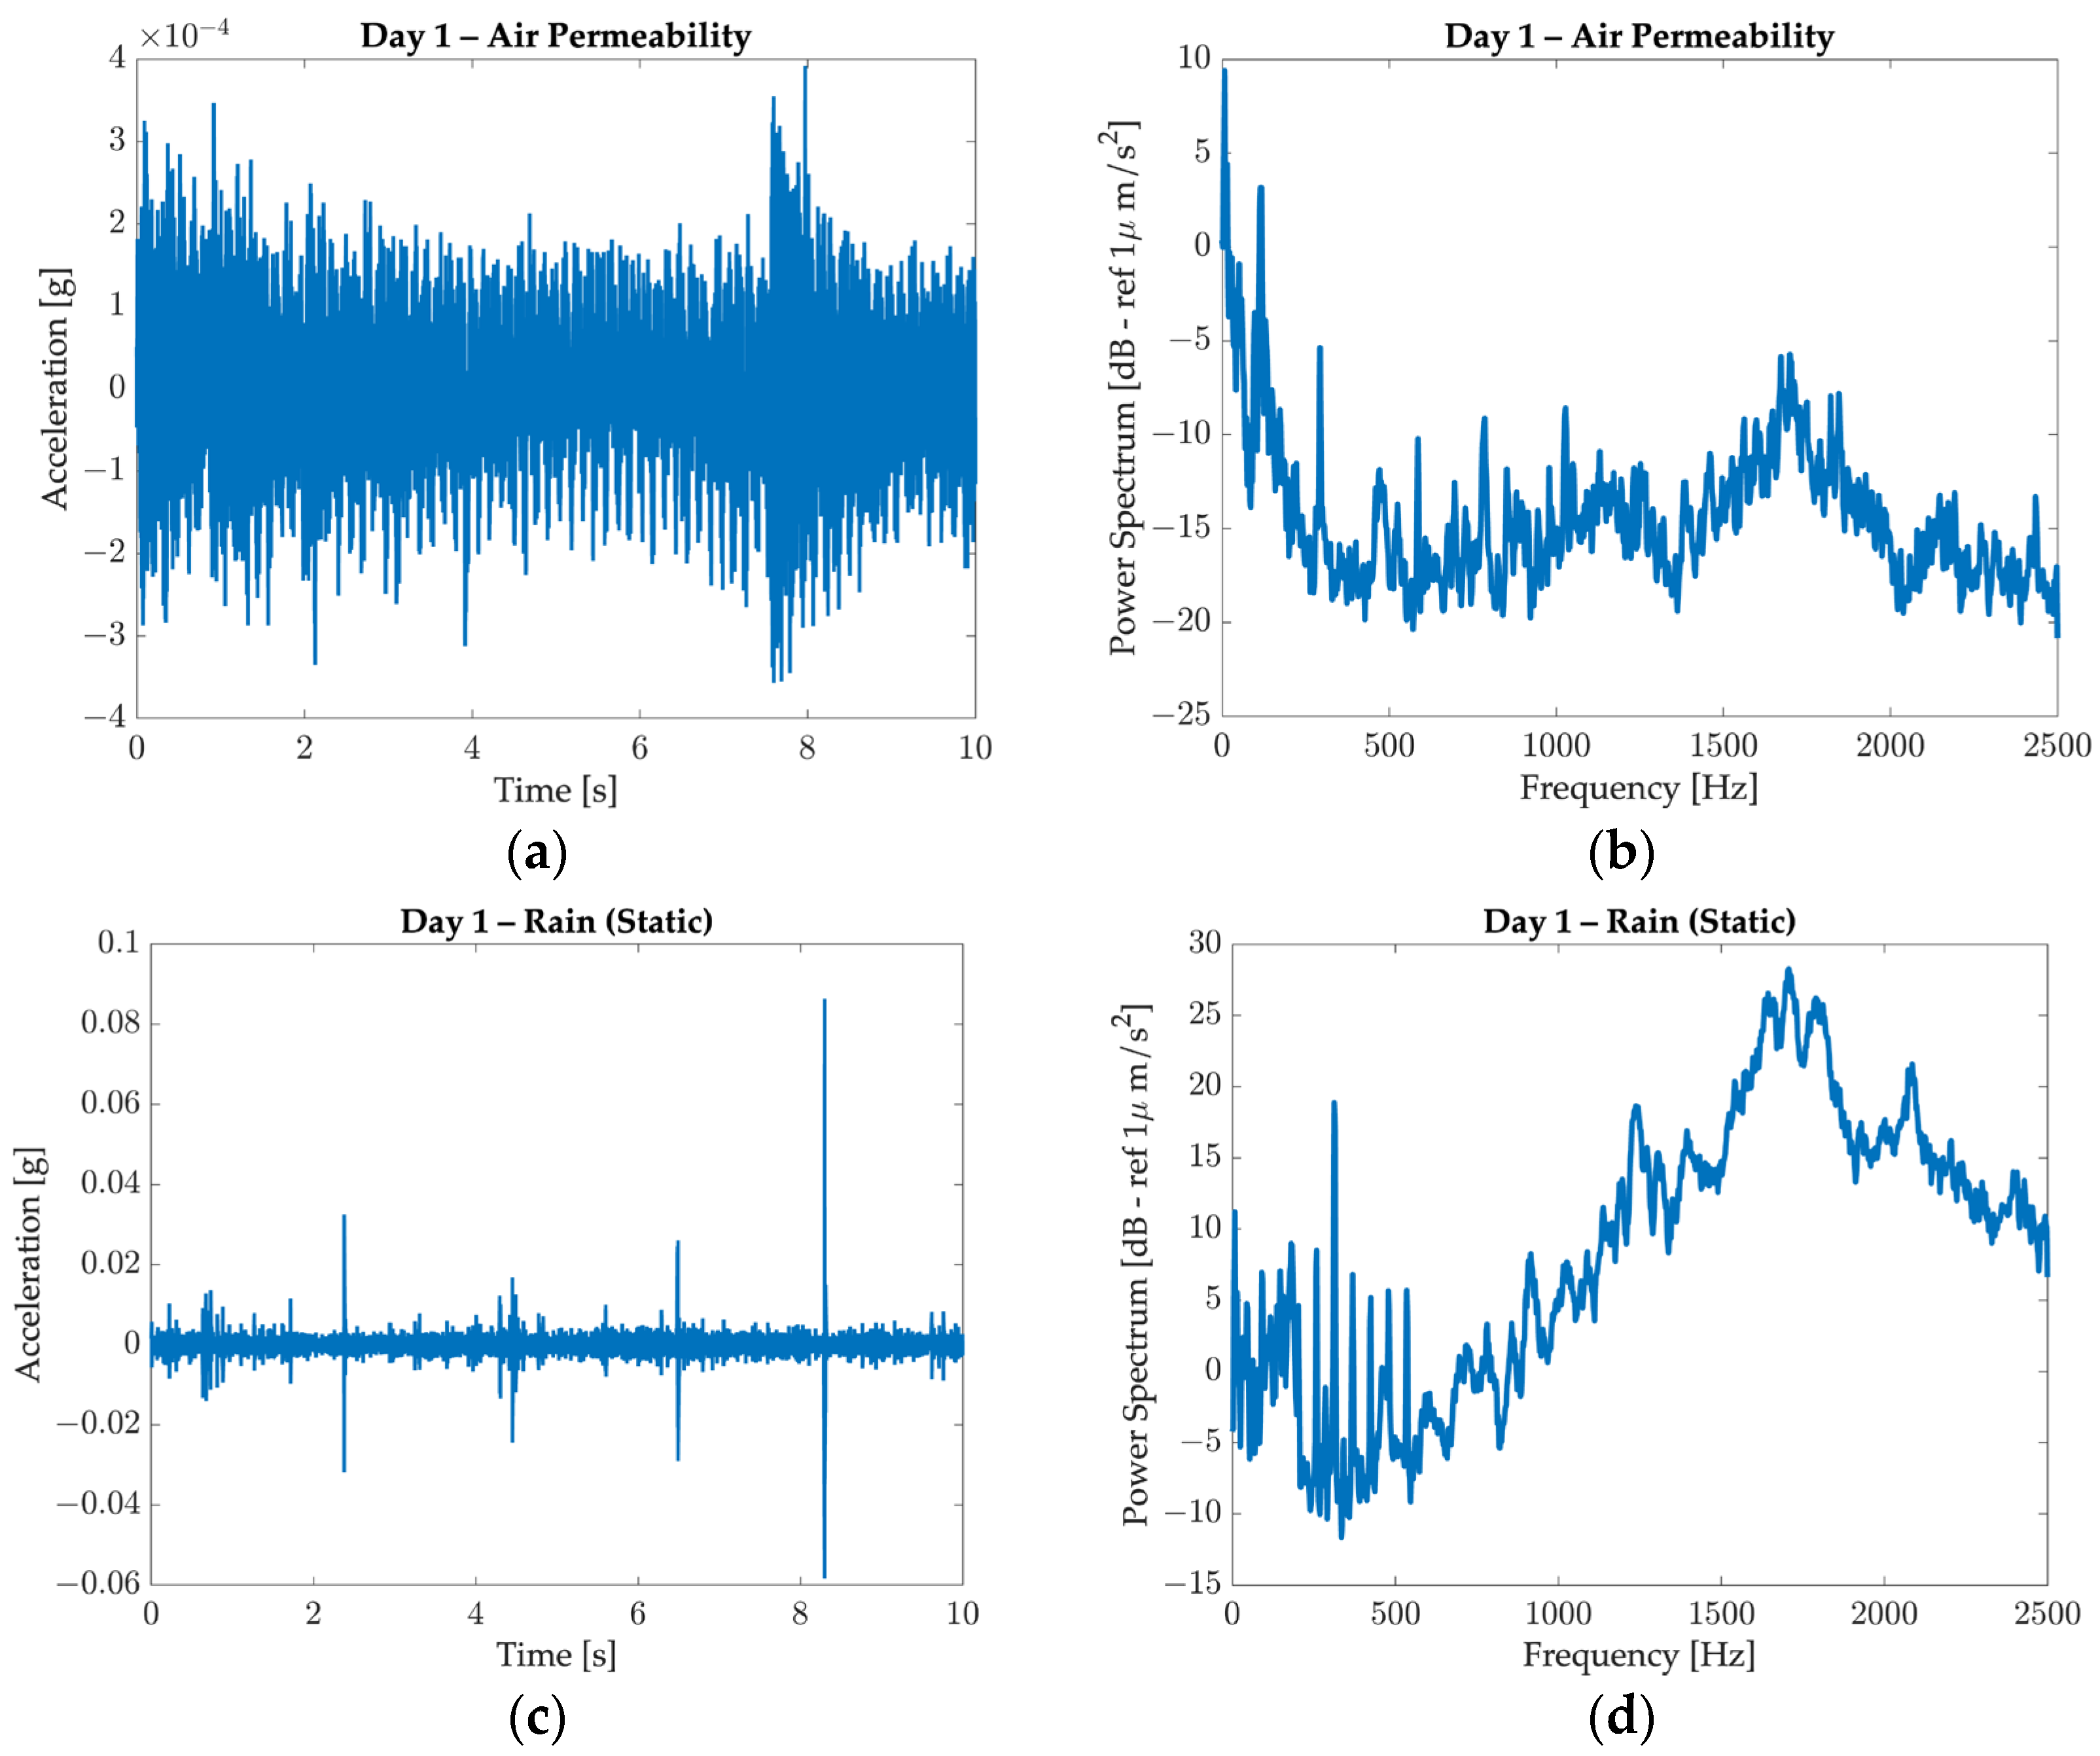
  • Accelerometers monitor dynamic evidence and impulsive effects acting on the structure and can highlight any critical effects and whether the structure has, therefore, been compromised. Structural variation can be highlighted by performing a comparison between different modal analyses or spectral response variations. From the accelerometers, several considerations can be made from the data collected. From the modal analyses performed before and after the monitoring of the phenomena acting on the glass façade, it was possible to notice a decrease in the modal frequencies of the structure after the exemption of the tests on the wall. This is evidenced by the results obtained in Section 3.2. Regarding the analysis of the structural vibration monitored with the accelerometers attached to the structure, two types of observations can be made: The first one is based on the RMS level of the acceleration that allowed for sensing a significant signal increase when the building was subjected to rain (dynamic), impacts, wind, building movements, and fan excitation. Also, a static rain and air permeability test was sensed by the accelerometers thanks to their high sensitivity (100.5 mV/g), even though the dynamic effects of those loads are limited due to their static nature.
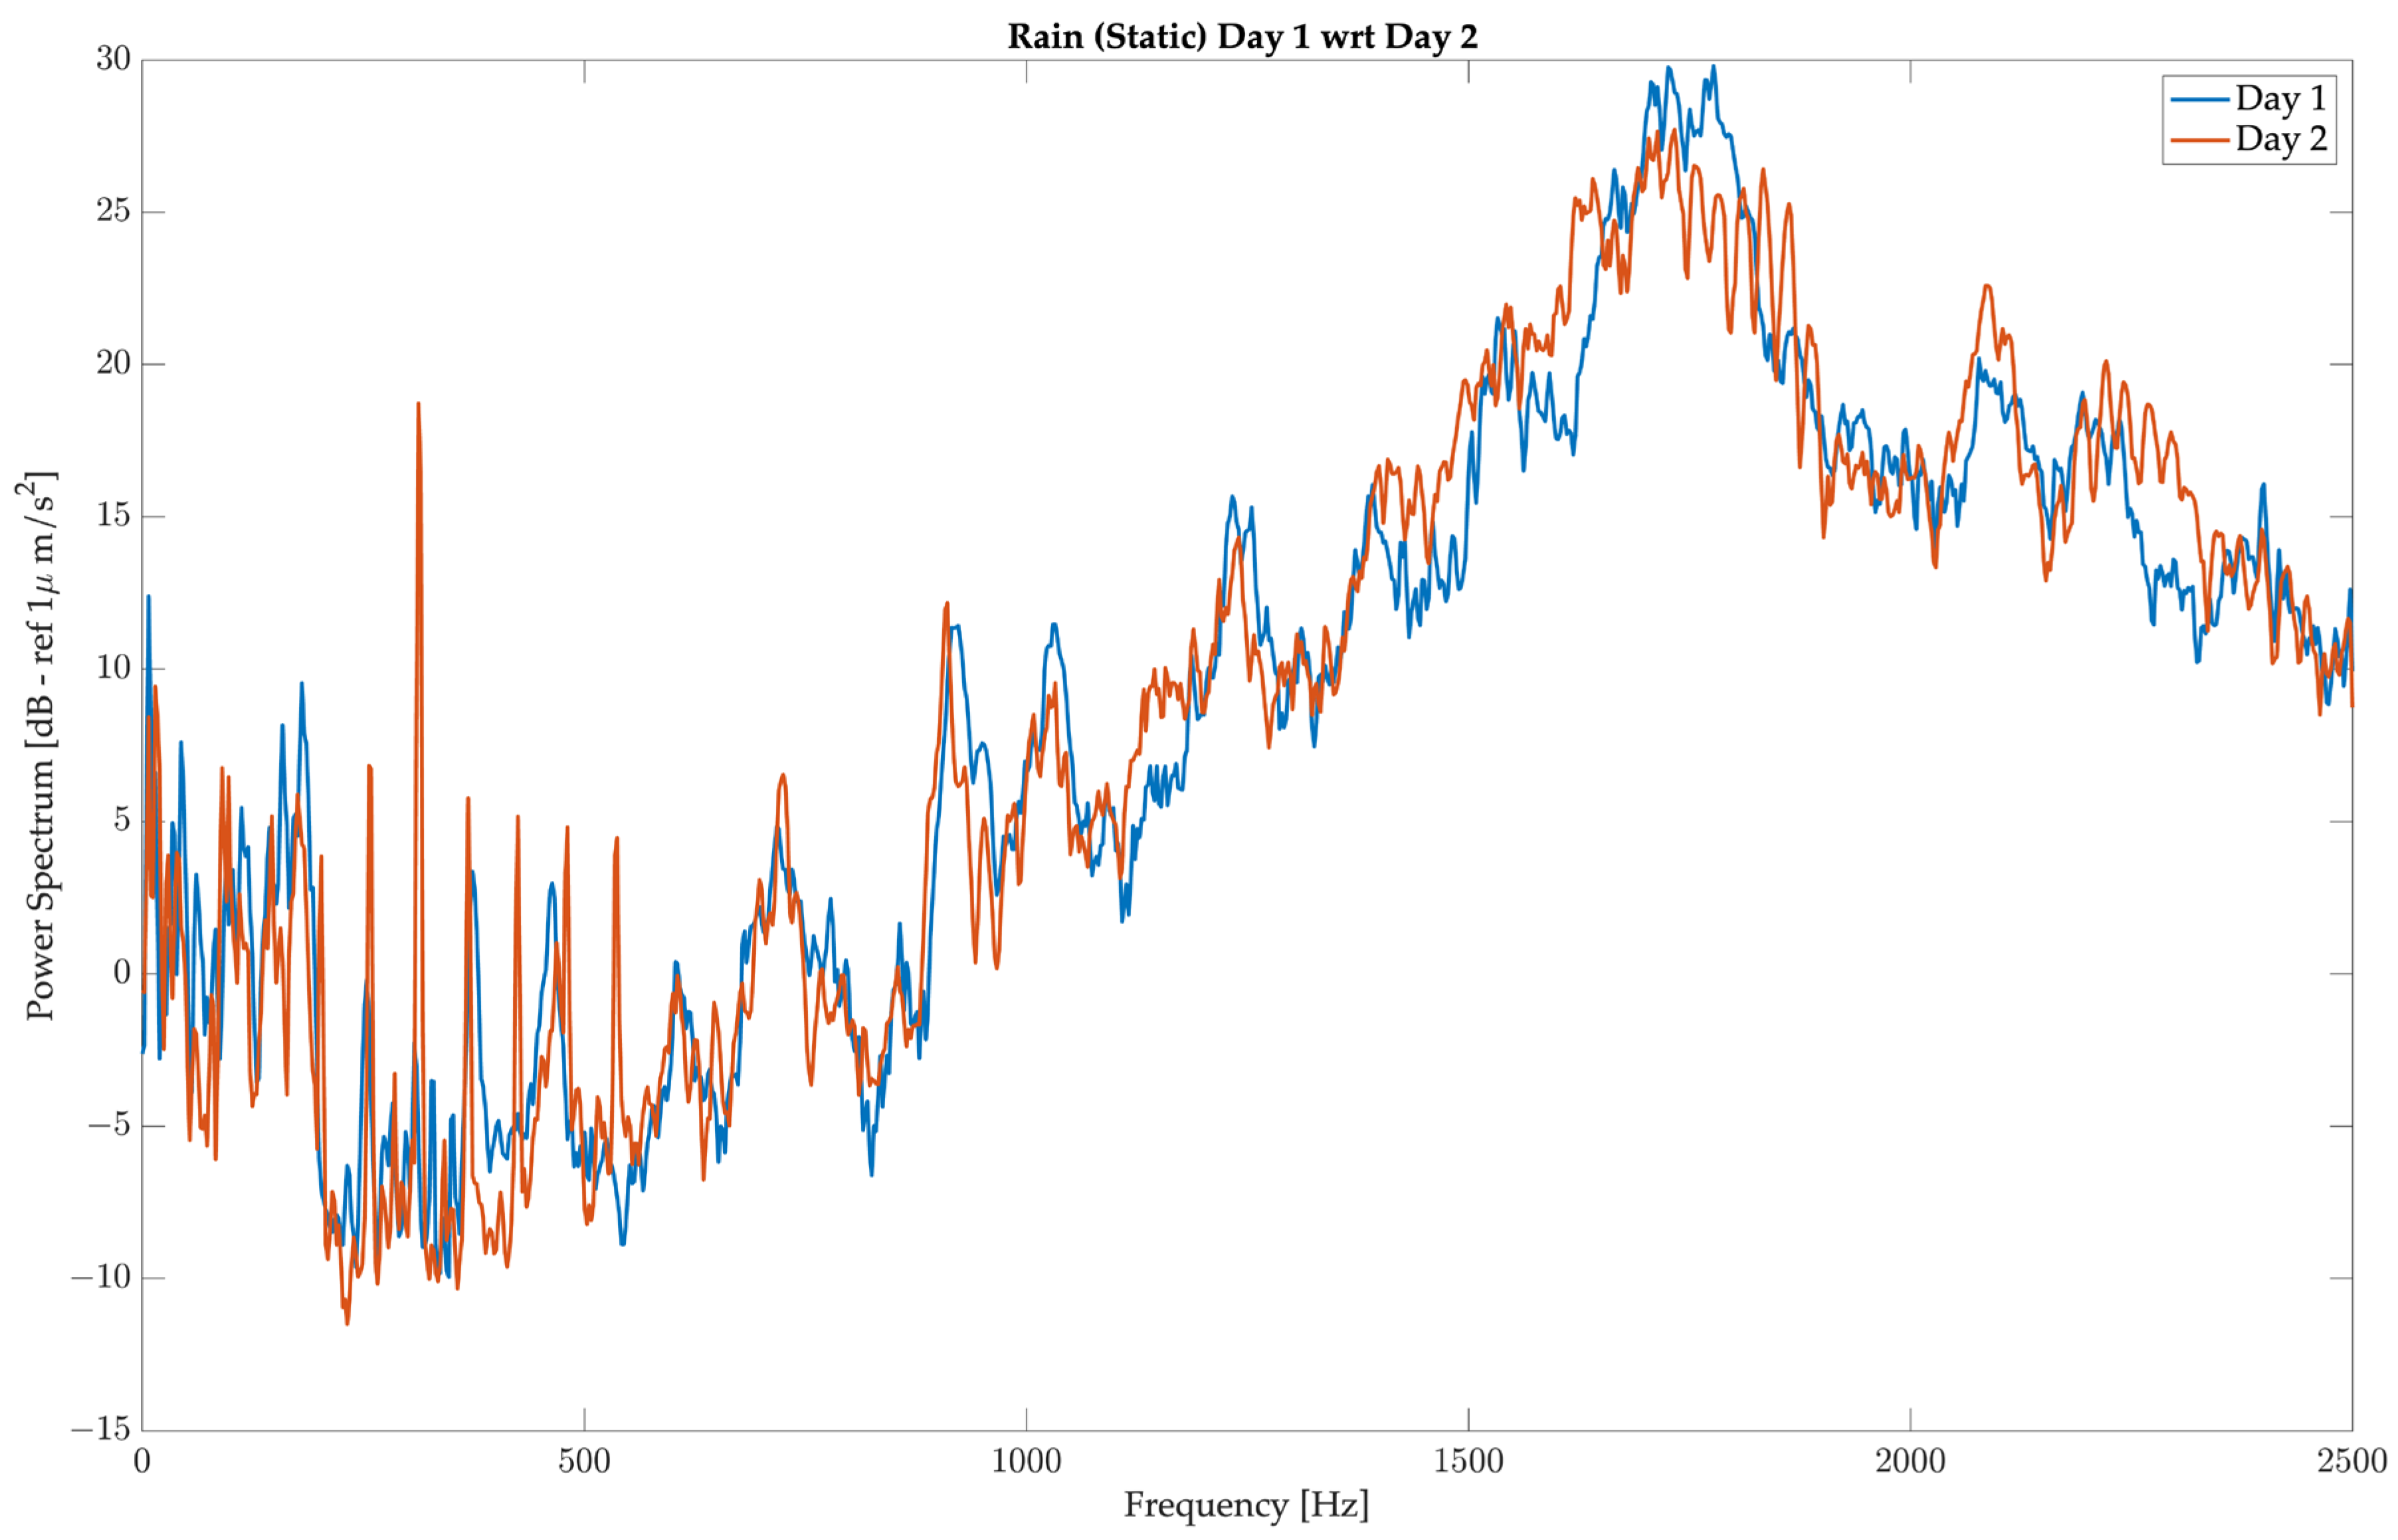
  • The second observation is the monitoring of the dynamic behavior of the building, which was monitored by the power spectra estimated from the time histories measured by the accelerometers. The spectra show different signatures depending on the type of test that the building is subjected to. For example, in the fan excitation, the typical harmonic pattern is visible, consisting of the fan blade passing frequency and its high-order harmonics. Another piece of evidence is the deviation detected between the power spectra acquired on the first day of static rain and the same test realized on the second day, see Figure 24. Also, in this case, a decrease in the resonance frequencies of the building was observed, which confirms what is evidenced by the modal analysis.
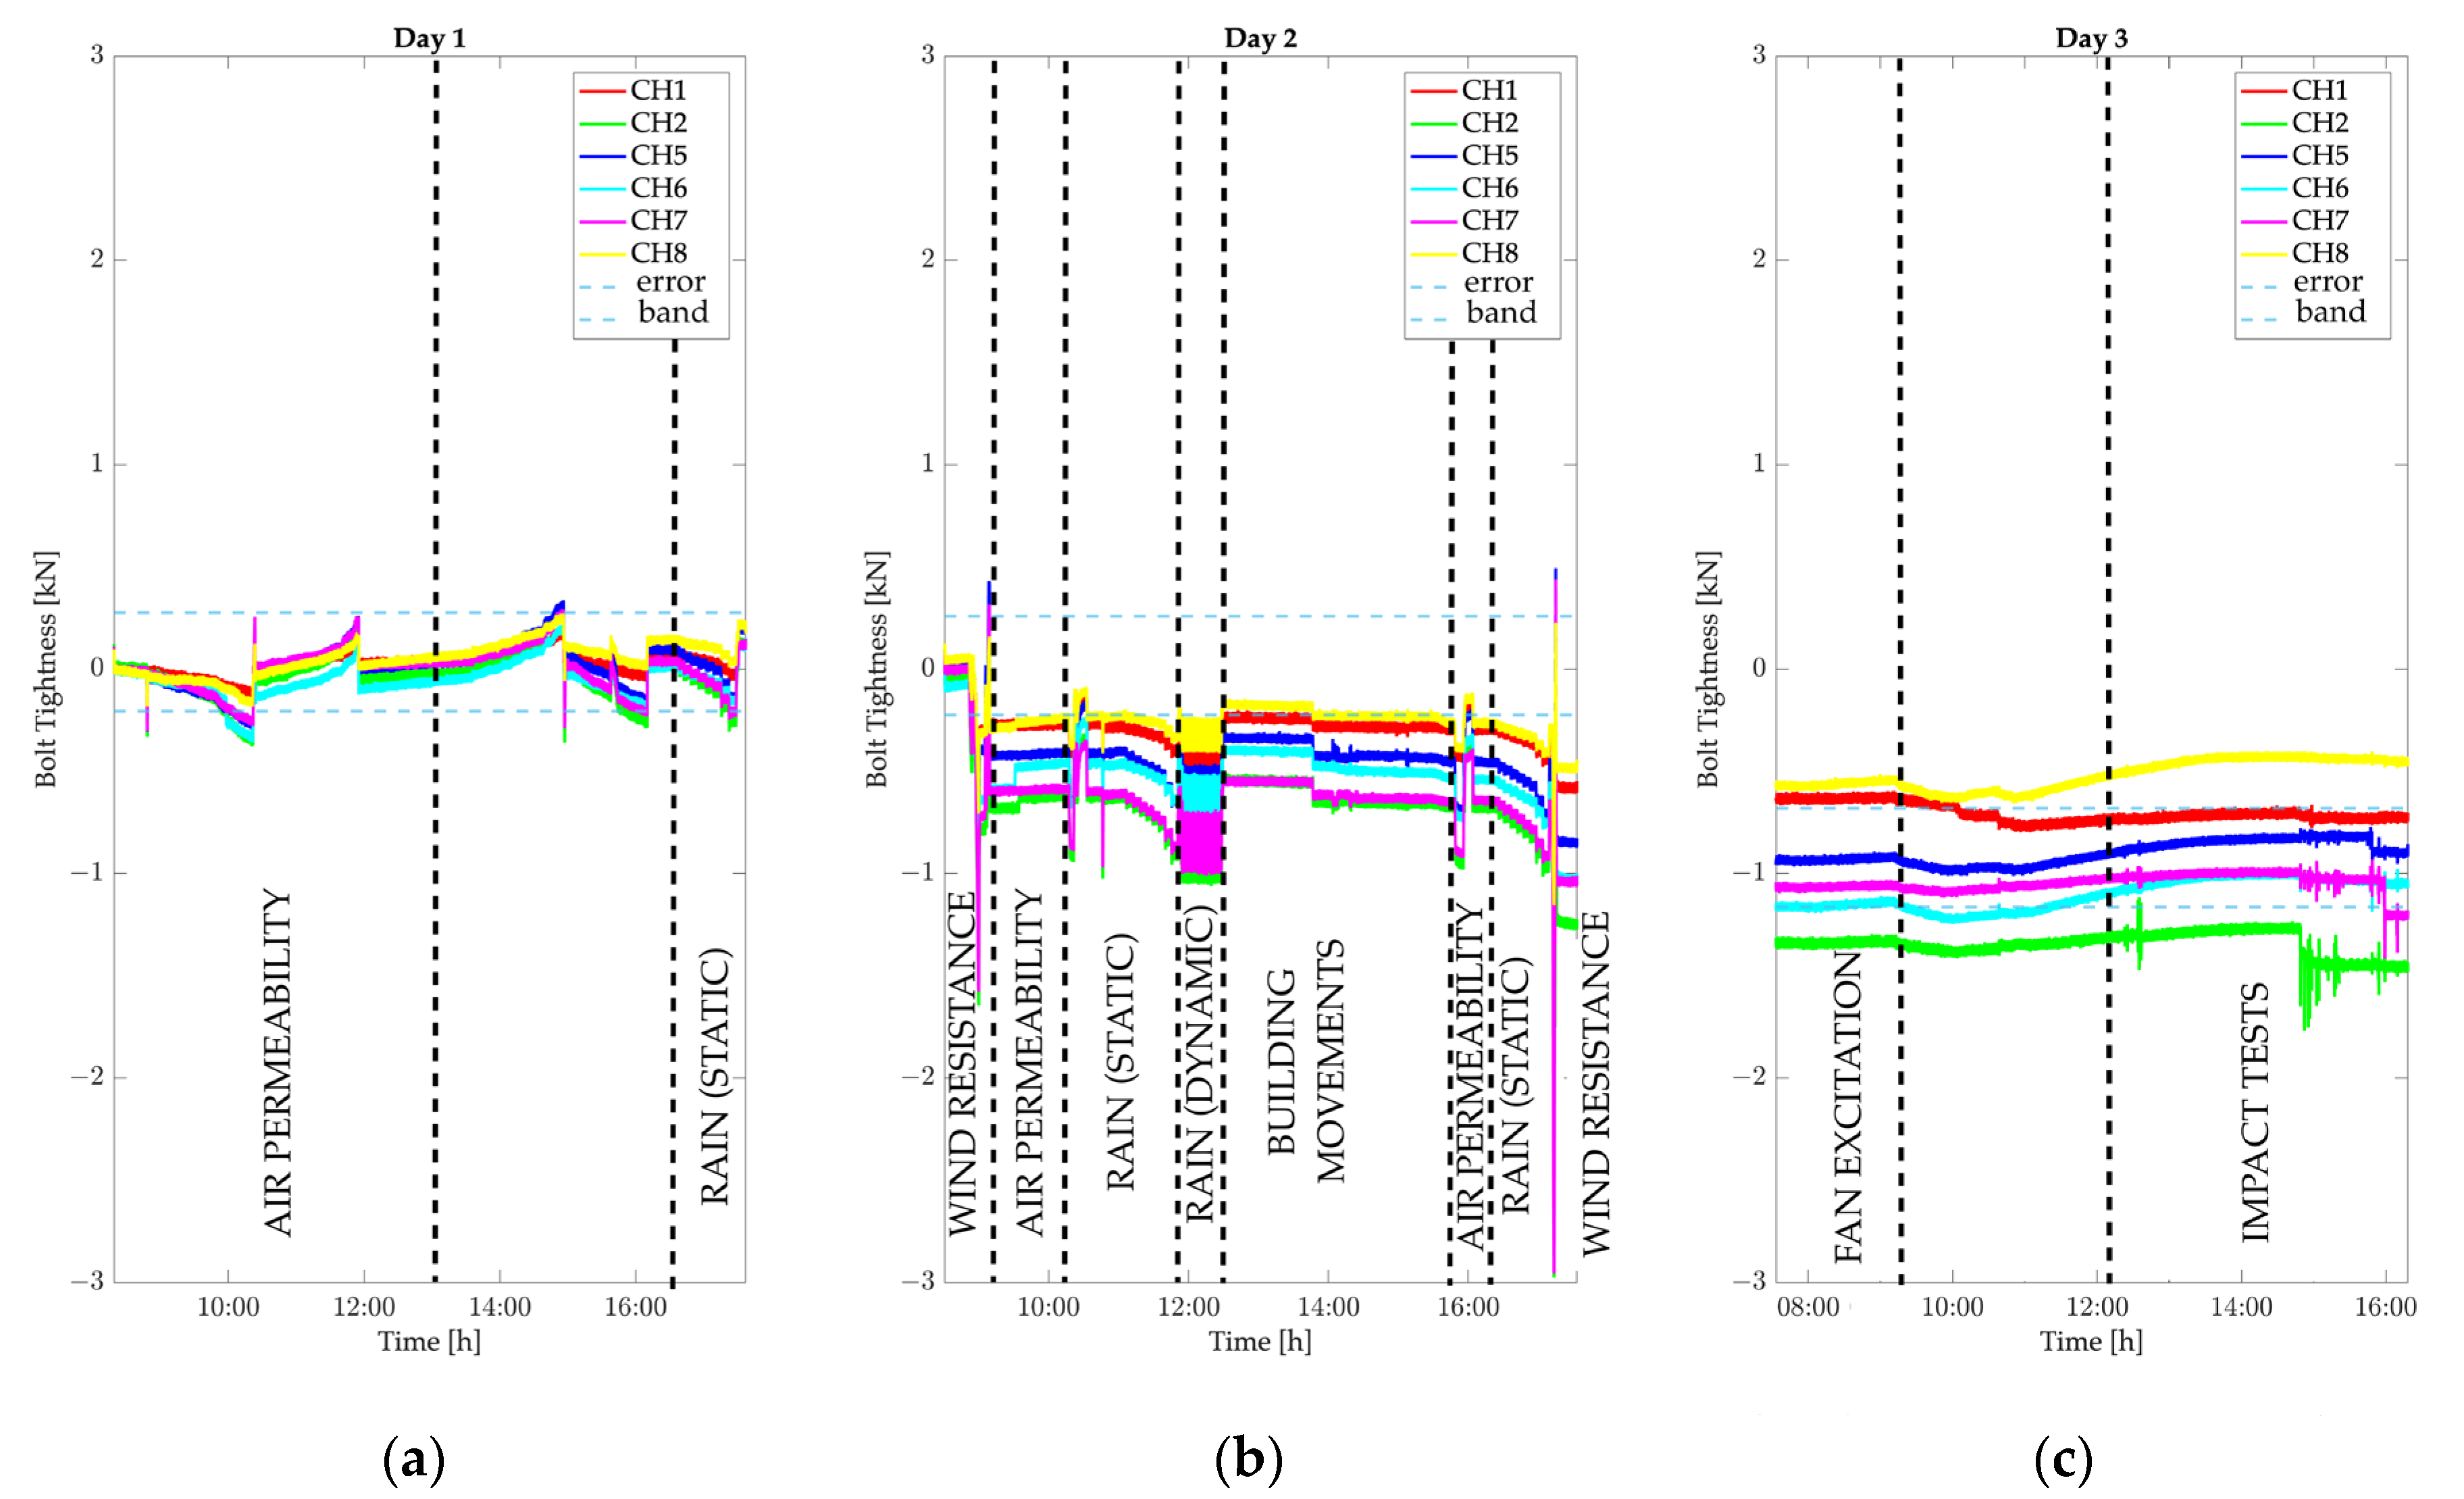
  • Conversely, force washers effectively monitored structural health under static and dynamic loads. They accurately measured applied loads, providing valuable insights into the façade’s stress response. Interestingly, washers with embedded sensors revealed normal behavior under typical service loads (600 Pa), regaining initial torque after stress as demonstrated at the end of tests in the 3 days. However, wind pressure tests (2625 Pa positive, −3000 Pa negative) showed permanent torque changes, indicating high-stress conditions. These sensors detected changes in the washer tightening torque, signifying critical stress levels requiring additional maintenance. This demonstrates the potential of integrating such sensors into façades for continuous monitoring of wind-vulnerable areas, confirming the force loads’ suitability for SHM applications. This type of sensor made it possible to visualize the changes during all three days of the tests, and it enabled the capture of static phenomena more prominently. On the second day, it was possible to see that the tests tended to degrade the tension on the screws of the structure from the initial state. Also, considering the uncertainty band of the sensors, it is possible to evidence that some events produced an important tension variation on the screw, at least on some of them and particularly during the tests performed on the second day.
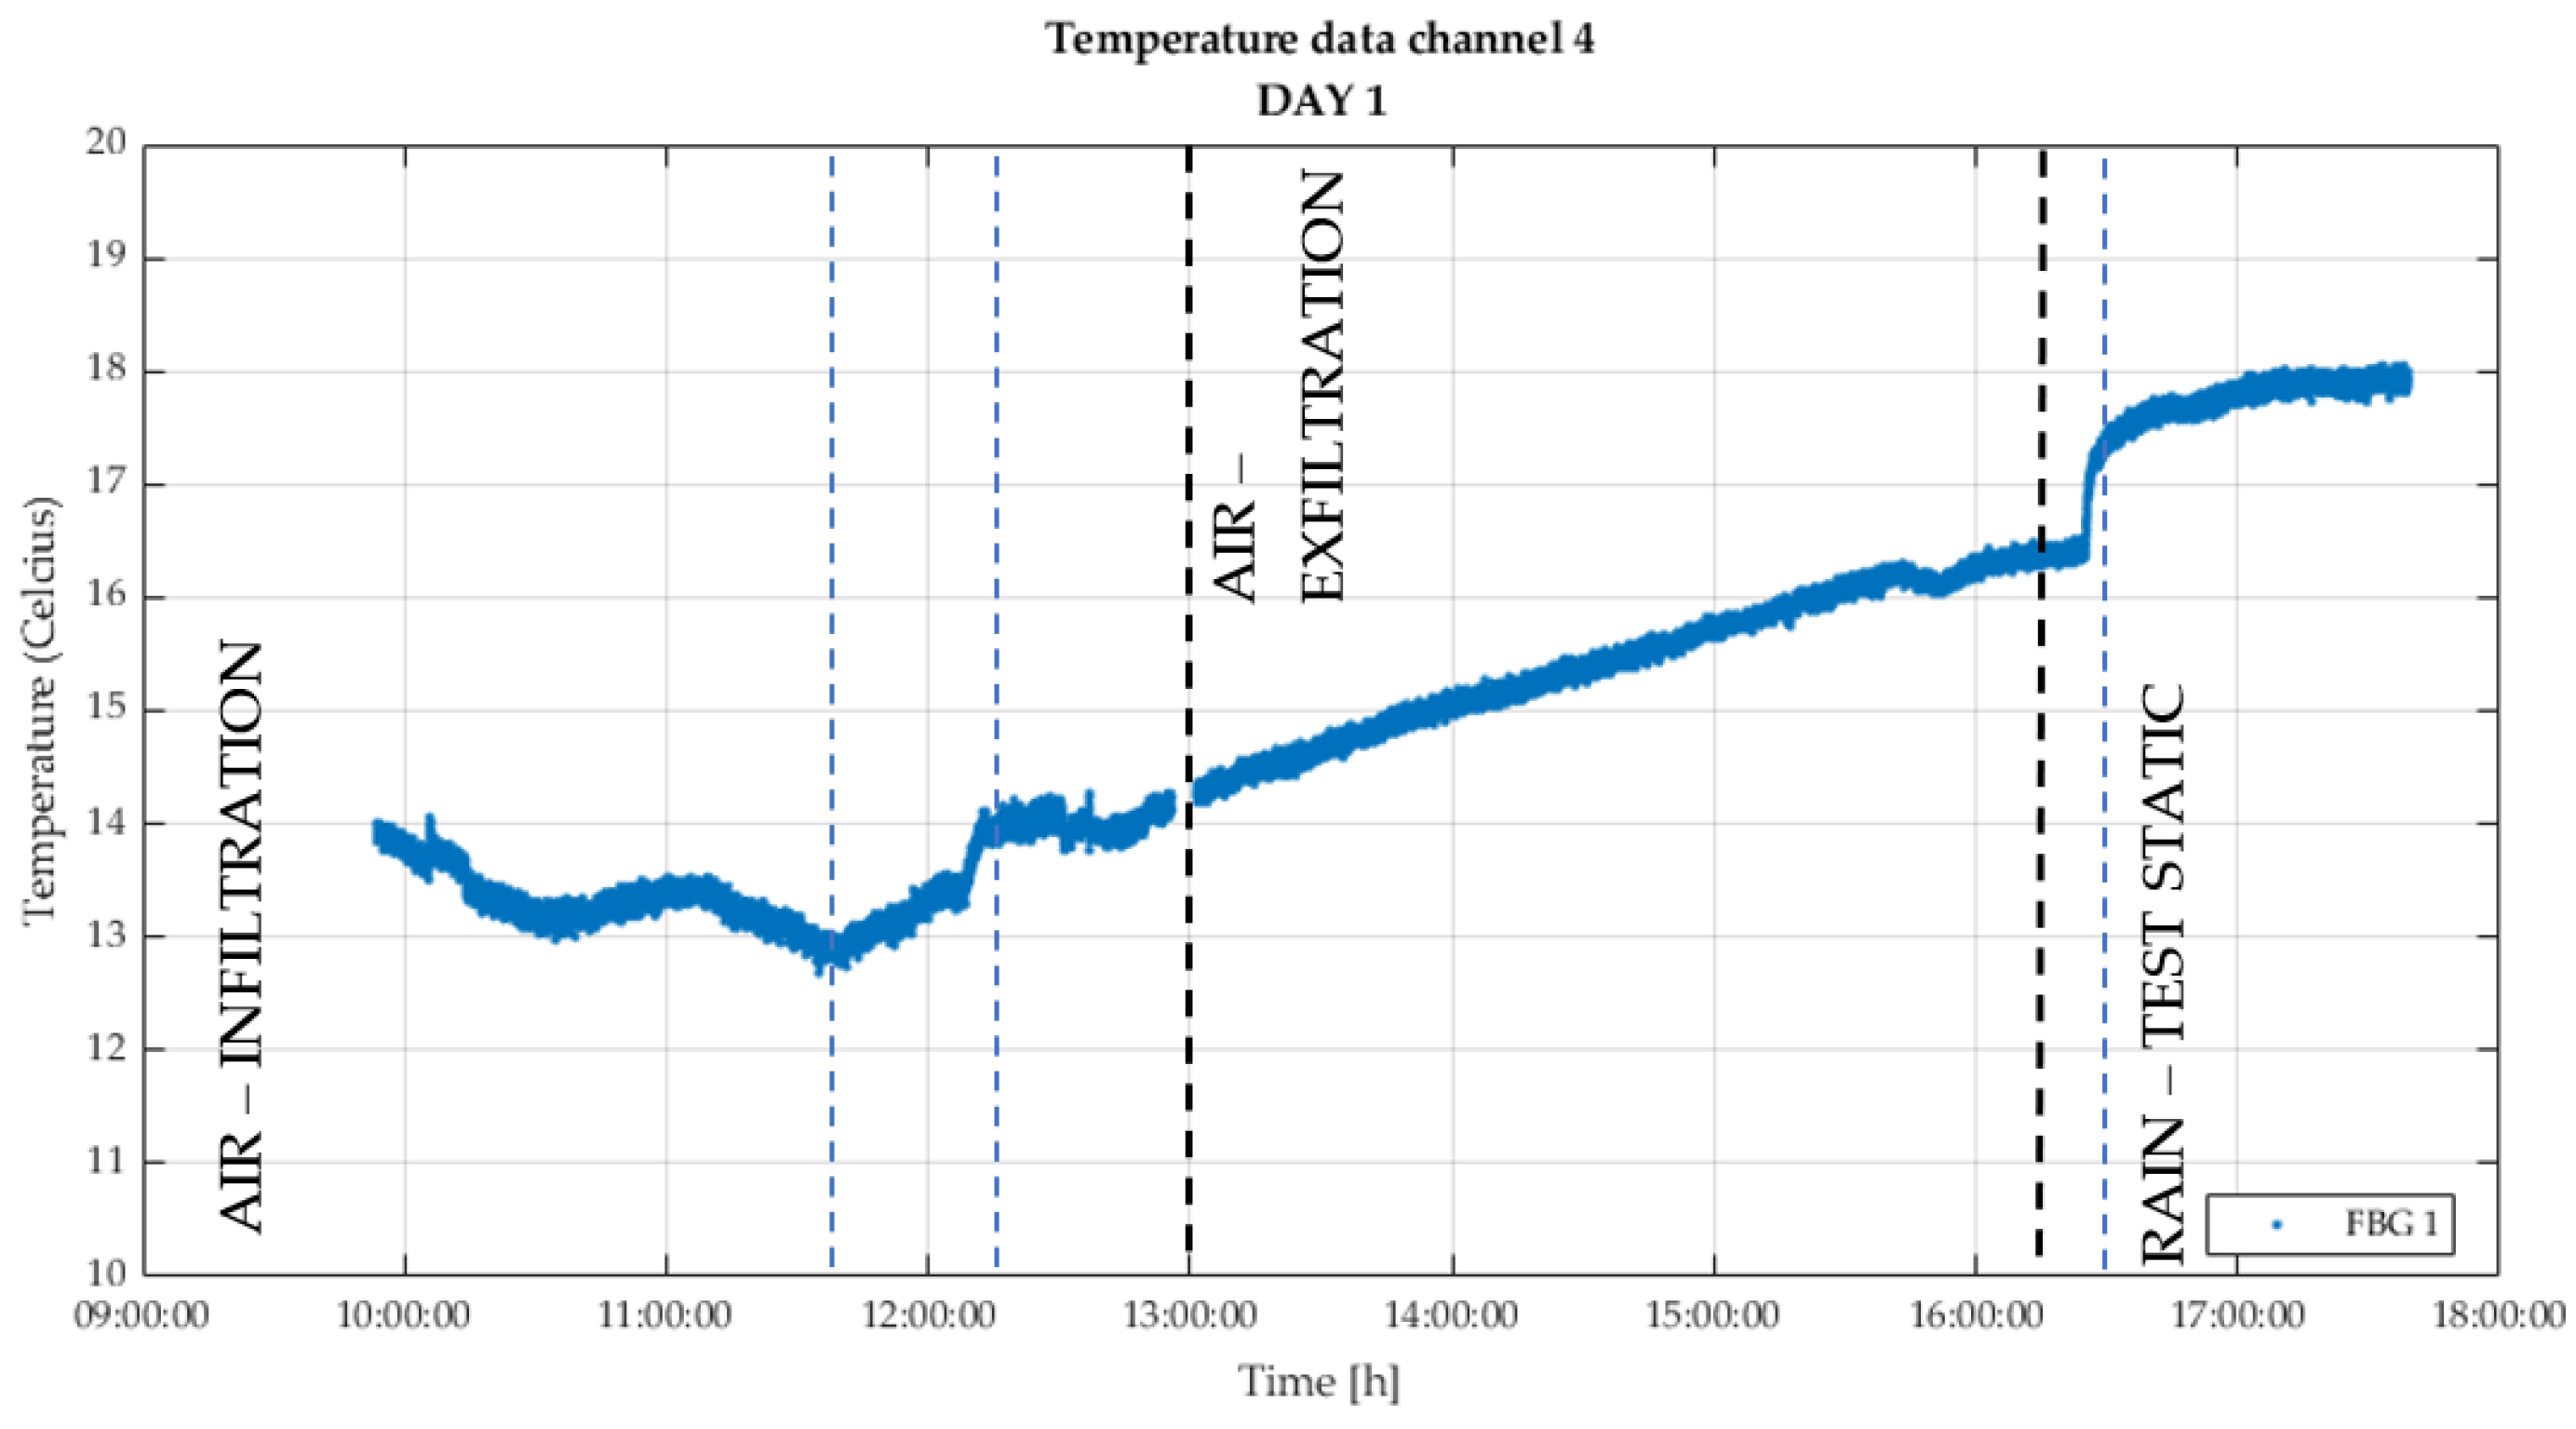
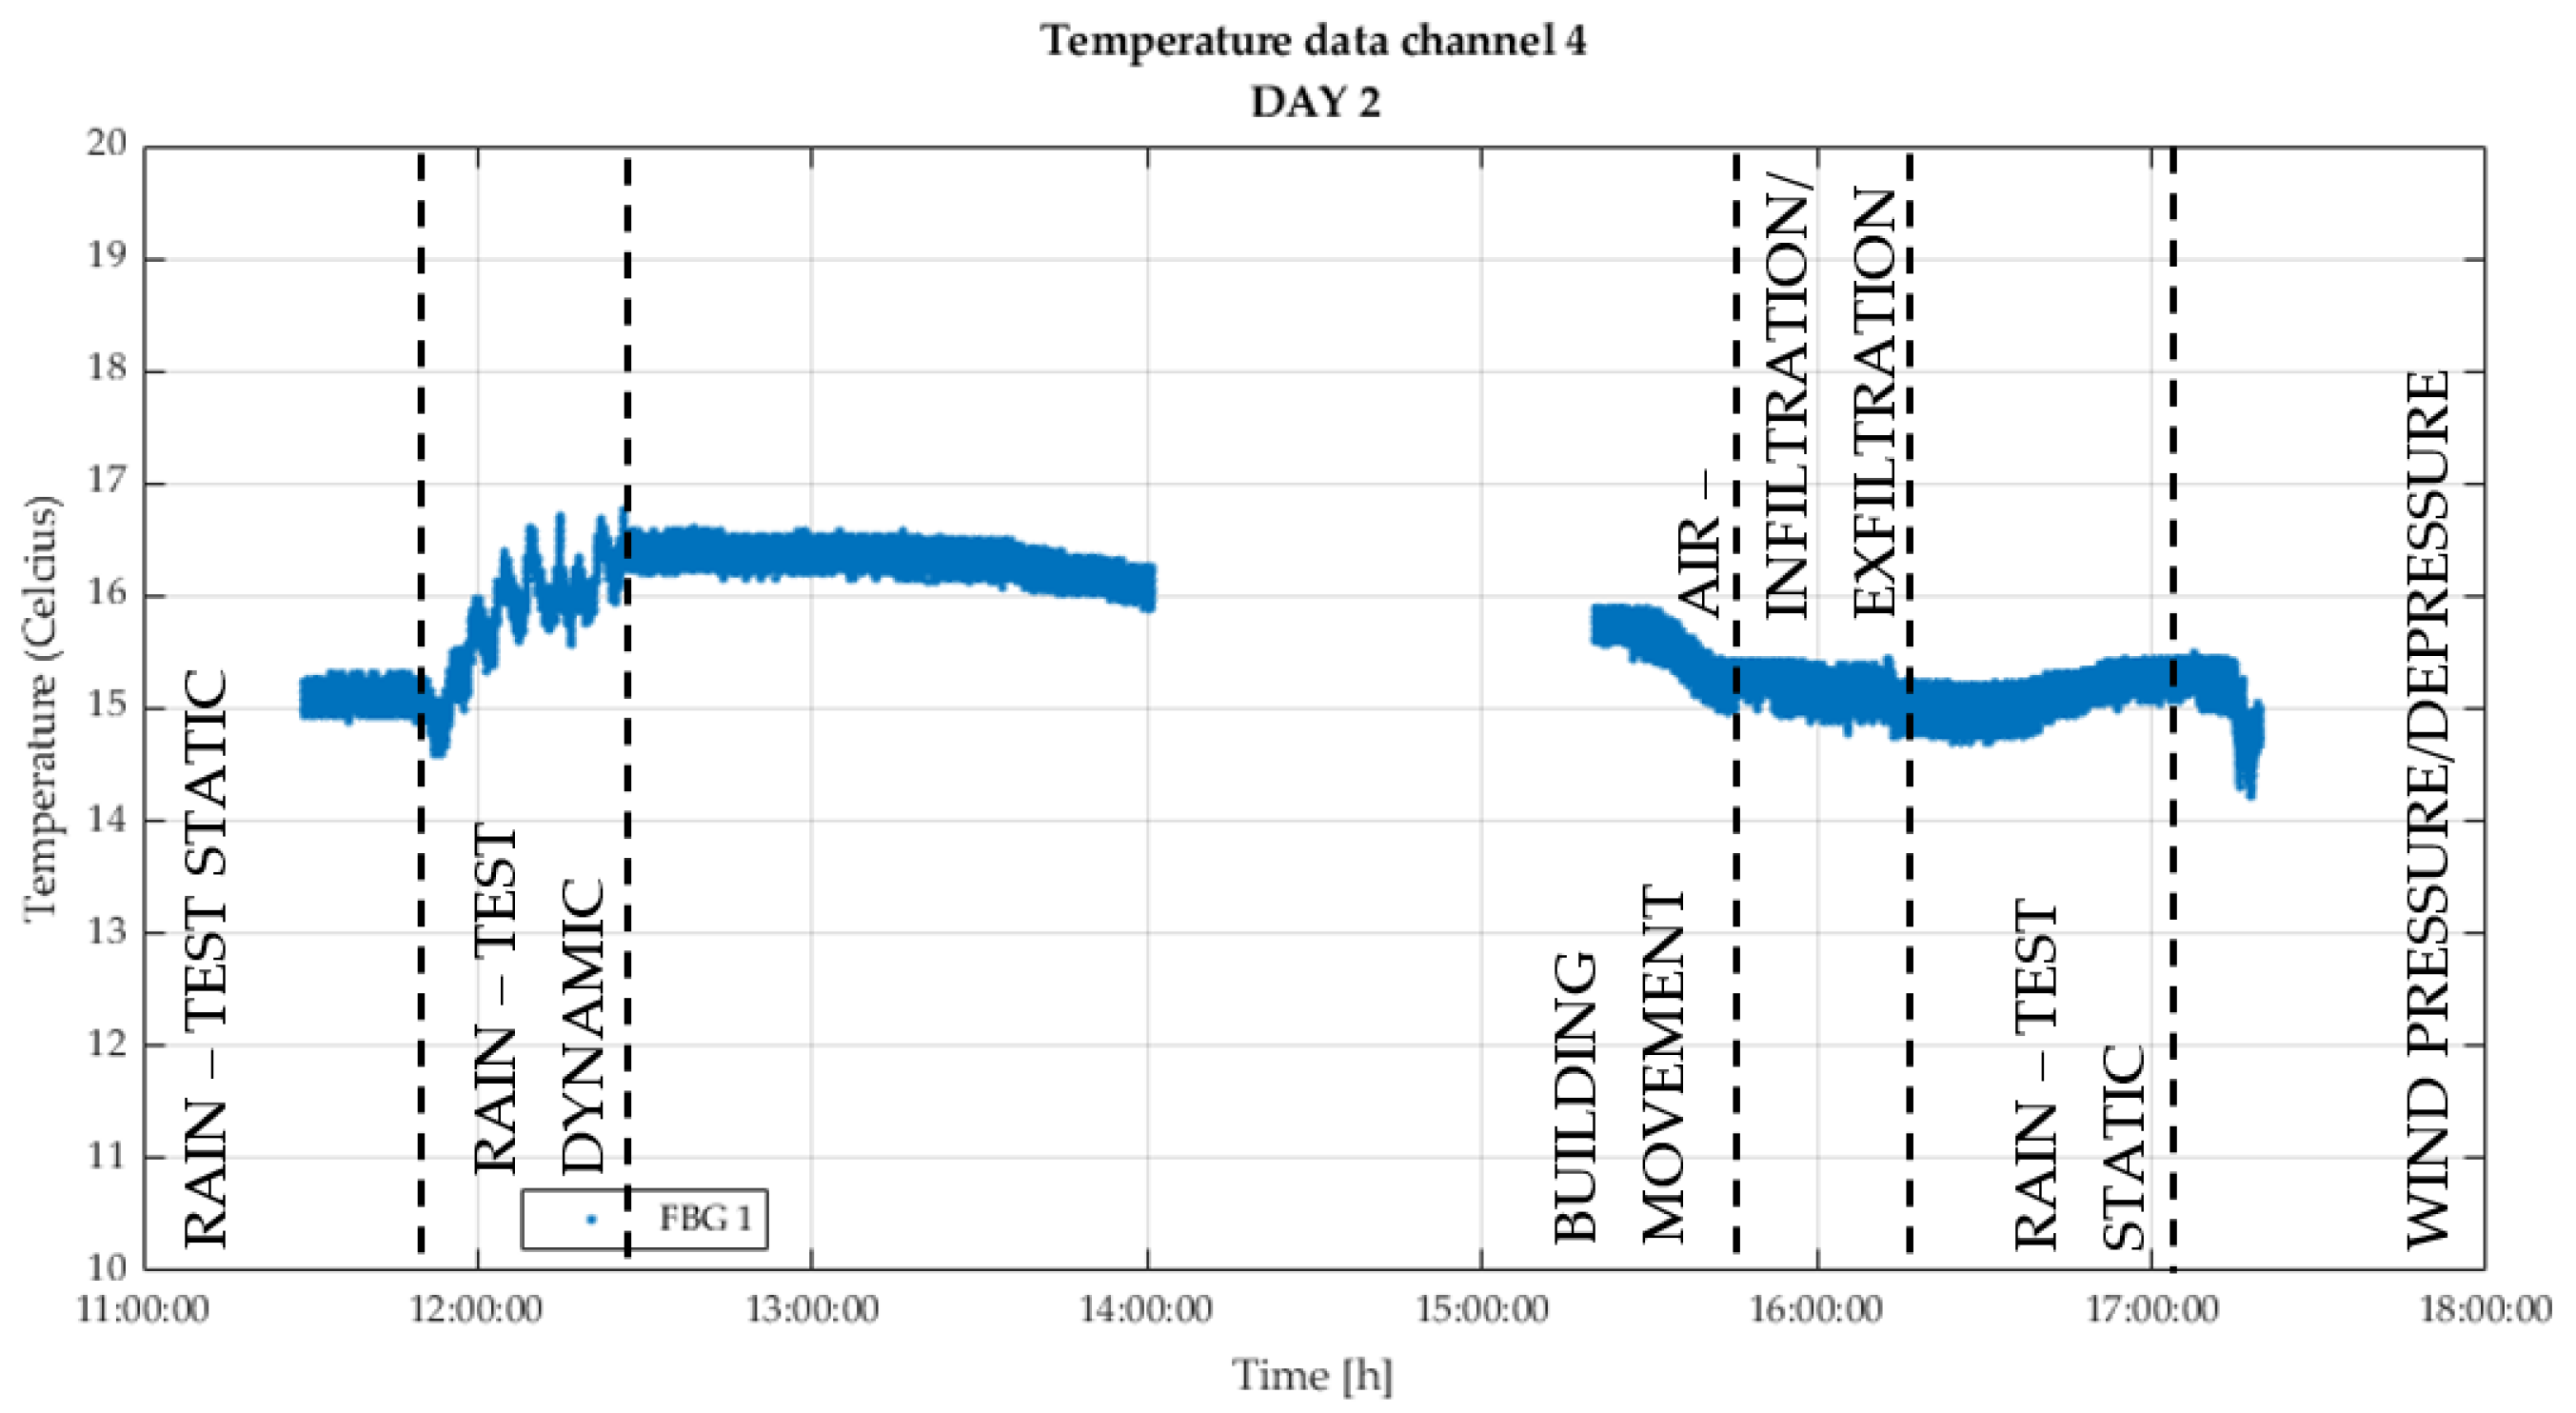
  • FBG for temperature—Since the temperature increased all day, the FBG sensors in the other fibers responded to the temperature. The noise contributions in this temperature measurement originate mostly from the FBG interrogator. This causes a noise band up to ~0.3 °C. Resampling of the data to a lower frequency could reduce the noise band. Other noise contributions to the temperature sensor are negligible since the temperature sensor is mounted without strain. FBG sensors react to temperature and strain, so drift in the strain measurements can originate from temperature changes. However, is it possible to correct this when the temperature is known or when a second FBG is used as a temperature sensor for more accurate results? The obtained results validate the feasibility of integrating FBGs into the building envelope to measure temperature, aiming to prevent thermal shock damage. In comparison to conventional sensors such as thermocouples, FBGs offer a valuable alternative due to their compact dimensions, both for the sensor and connectors, and the ability to incorporate multiple tens of sensors in a single fiber. Similar considerations could be applied to the following:
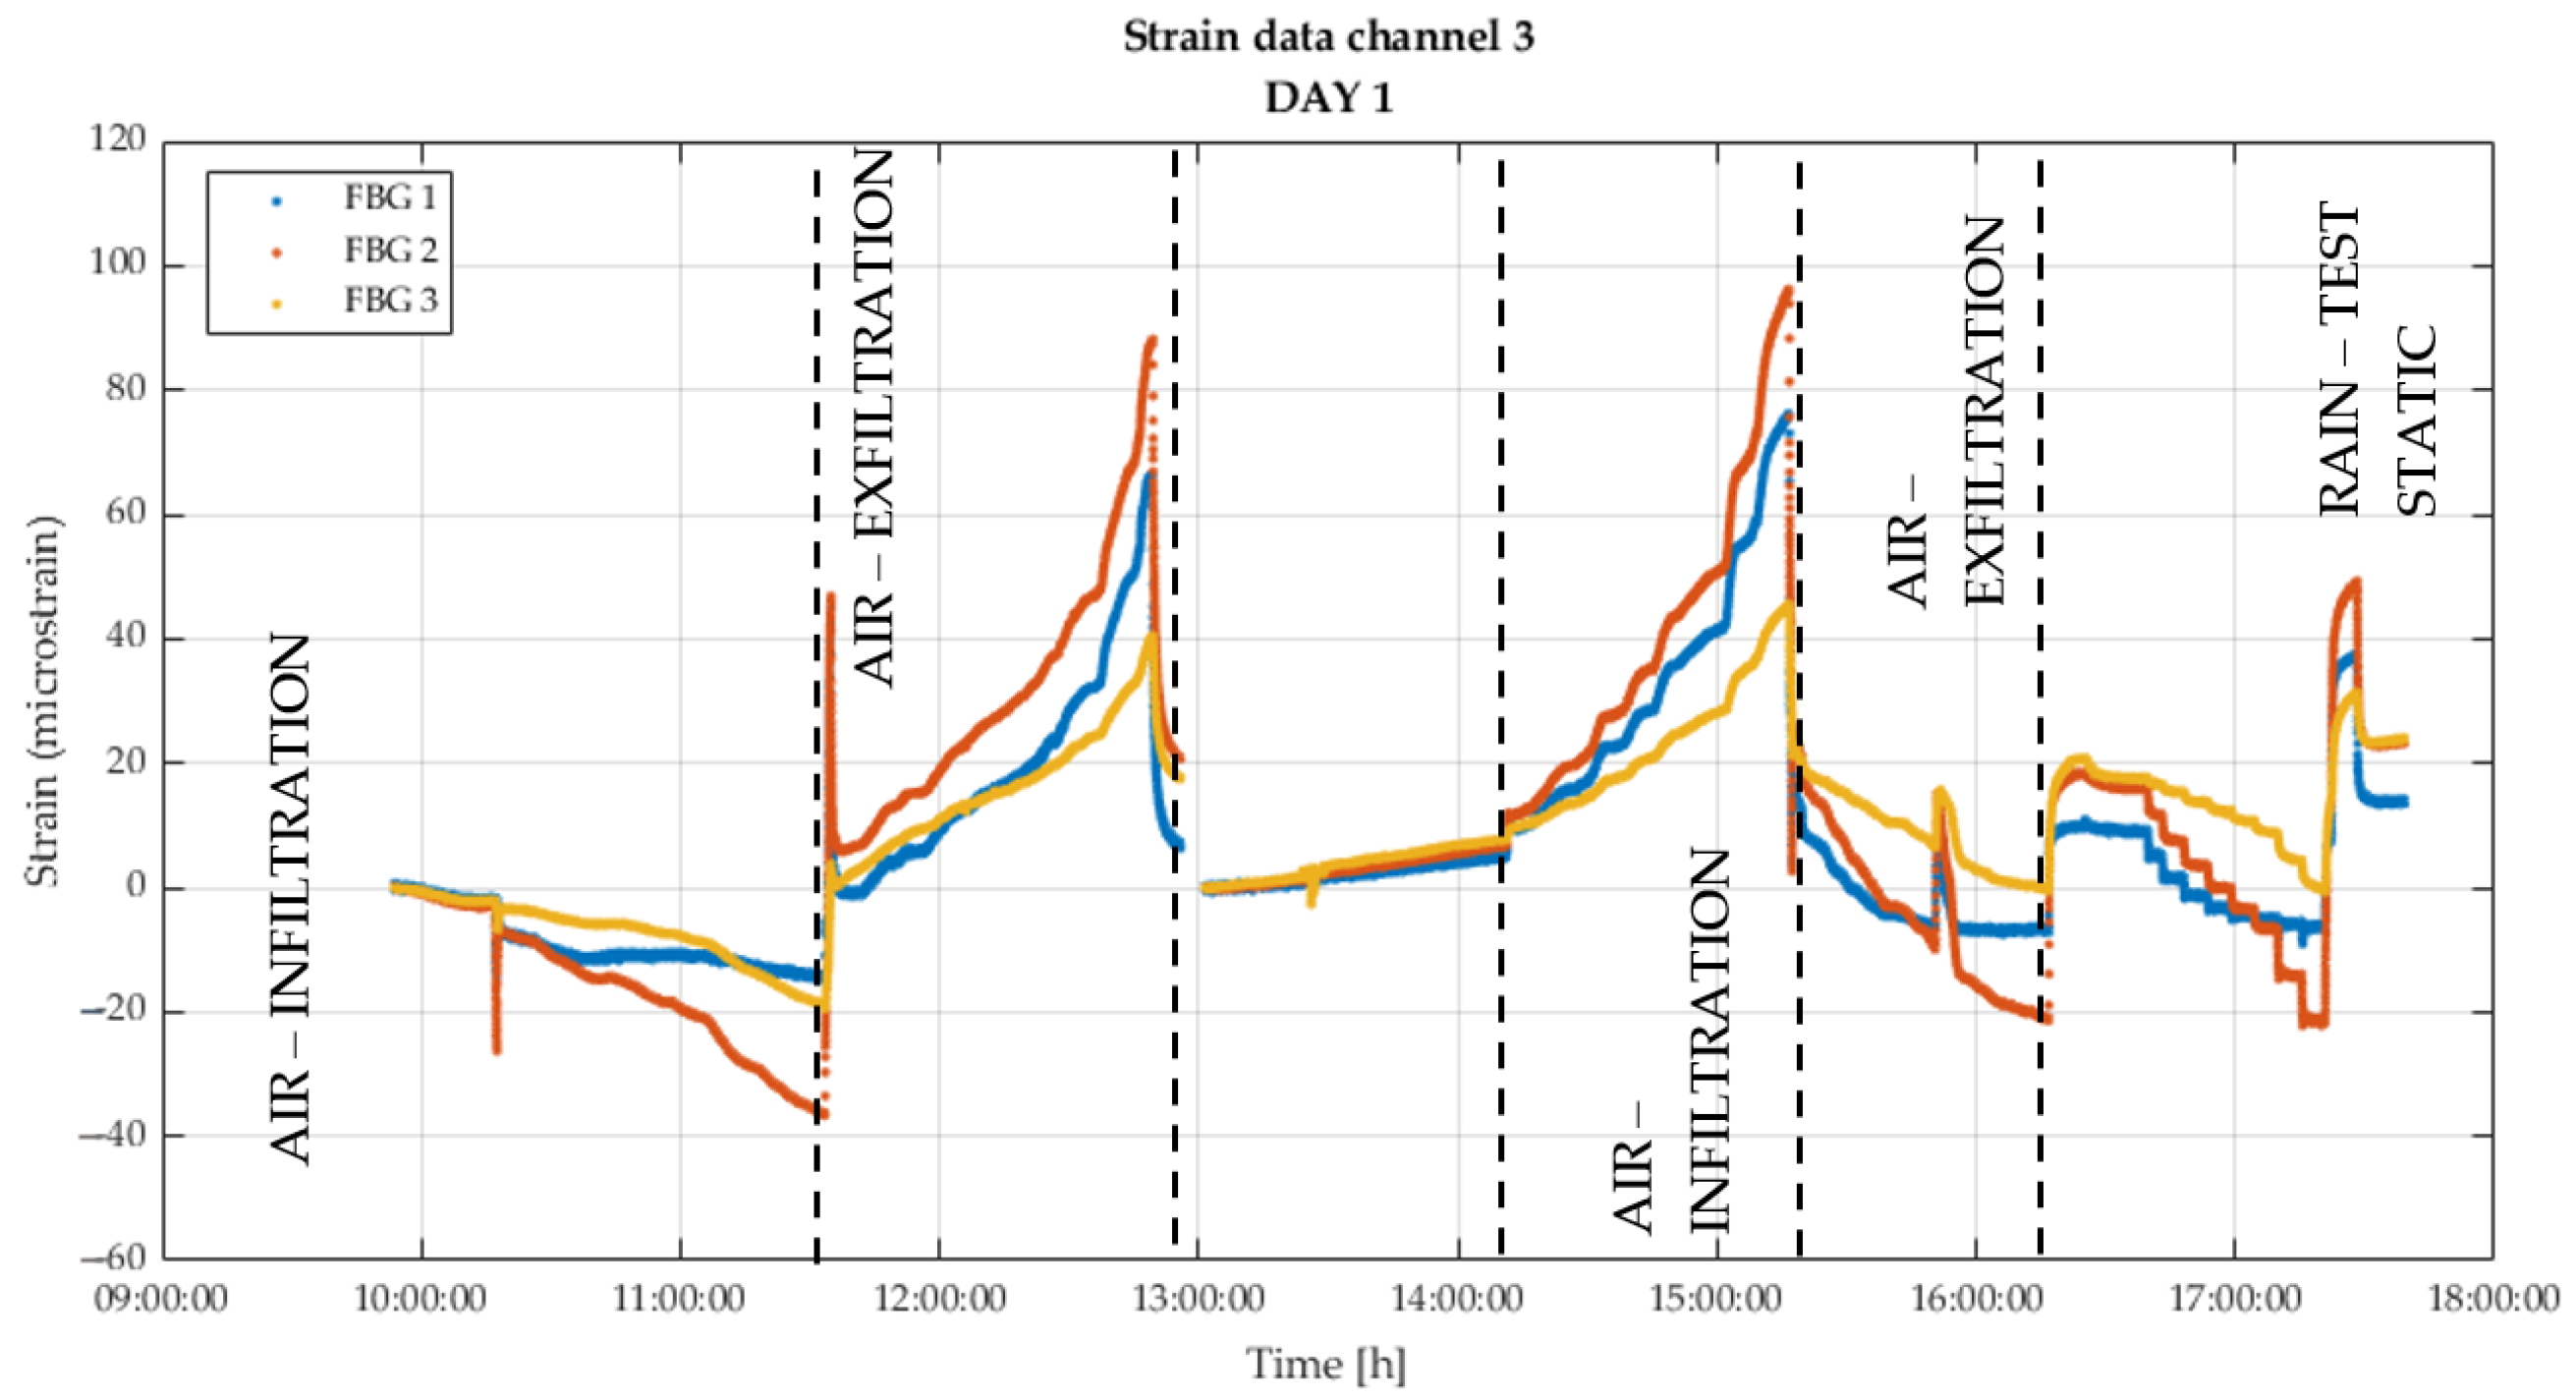
  • FBGs for strain and vibration—The obtained results could be compared to those obtained from the conventional force washers. Indeed, the outcomes show the strain and vibration registered during the test provoked by accidental impacts or dynamic pressure. The FBG integration within the façade represents a potential solution due to their characteristic with a particular focus on their dimensions compared to conventional force washers, which have larger dimensions. FBG sensors are solid-state sensors of glass and have no moving or active components. Therefore, the lifetime of the sensors is not critical. Furthermore, no effects are expected on the structural integrity since the sensors are passive and the fiber is less than 1 mm in diameter.
  • With respect to the state of the art, this paper presents a methodology based on the use of different types of sensors for measuring a wide number of physical parameters to make identifying possible damages in the SHM field more robust.

5. Conclusions

The data-driven approach presented in this paper unlocks a deep understanding of how building envelopes respond to various stresses, including wind, seismic activity, material strain, temperature changes, and other dynamic loads. The research conducted demonstrated the potential of various sensor types for SHM in building envelopes. Considering the nature of different environmental events, a multivariant approach is the best solution for SHM. The facade, in this case, overcame all standard tests, but the different sensors detected minimal structural variation. Modal analysis is useful even if a critical event has been registered and allows for printing the status of the structure in a specific time frame. The final considerations on the obtained results are as follows:
  • From the modal analysis point of view, the maximum deviation of the natural frequencies experienced is 1.2% between the structure status at the beginning and at the end of the certification tests.
  • This was also confirmed by the monitoring accelerometers and observing the power spectra of the time histories registered during rain (static) between day 1 and day 2 (Figure 16, where the shift towards lower natural frequency is evident)
  • Force washers evidenced that between day 1 and day 2, the bolts undergo loosening, especially concerning the bolt registered by the sensor installed on channel 2 (a decrease in the tension of that bolt of about 8% was registered).
  • Integration of FBGs into building envelopes for temperature monitoring prevents thermal shock damage, offering compact size and multiplexing capabilities. FBGs also excel in strain, ensuring longevity and structural integrity, with potential applications in façades to improve safety during the entire life of the structure.
The achieved results demonstrate that sensing façade for SHM can open new approaches in the following: preventive maintenance schedules within the building envelope, identifying potential issues before they become critical, thereby reducing downtime and costs and minimizing environmental impact, reducing unnecessary repairs and interventions by prioritizing targeted maintenance based on data-driven insights; prioritizing retrofitting requirements directing resources towards façade areas most in need of improvement for enhanced safety; guiding design improvements integrating real-world performance data into future building designs for increased resilience and sustainability. For future works, a threshold that identifies and detects anomalies will be studied for each variable. In addition, it is also necessary to optimize sensor placement, with a particular focus on integration within the façade, finding a balance between aesthetic harmony, sensor monitoring, and maintenance. Sensor integration should be conducted during manufacturing activities, with the aim of inserting them into the aluminum profile cavity and isolated chamber within double-glazed panels. Other applications could be investigated, such as embedding Fiber Bragg Gratings (FBGs) for temperature monitoring in glass PVB components during the glass lamination phase, aiming to prevent thermal shock glass defects and guarantee aesthetic harmony in the building envelope. Additionally, integrating FBGs for strain monitoring in structural silicone, which are responsible for supporting hundreds of kilograms of glass in minimal space, can ensure the façade’s safety and serviceability.

Author Contributions

Conceptualization, A.P. and L.V.; methodology A.P. and L.V.; software, M.T.C. and G.P.; validation, A.P. and L.V.; formal analysis, A.P., L.V. and M.M.; investigation, A.P., L.V. and G.M.R.; resources, A.P., L.V., F.B., V.D., M.T.C. and G.P.; data curation, A.P., L.V., V.D., M.T.C. and G.P.; writing—original draft preparation, A.P. and L.V.; writing—review and editing, A.P., L.V., F.B., M.M., G.M.R., V.D., M.T.C. and G.P.; visualization, L.V., F.B., V.D., M.T.C. and G.P.; supervision, A.P.; project administration, A.P.; funding acquisition, A.P. All authors have read and agreed to the published version of the manuscript.

Funding

This research was funded by the European Union’s Horizon 2020 Research and Innovation Program, grant number 862597.

Institutional Review Board Statement

Not applicable.

Informed Consent Statement

Not applicable.

Data Availability Statement

The original contributions presented in the study are included in the article, further inquiries can be directed to the corresponding author.

Conflicts of Interest

Authors Laura Vandi, Francesco Belletti and Alessandro Pracucci was employed by the company Focchi S.p.A. Author Vincent Docter was employed by the company PhotonFirst International. Author Alessandro Pracucci was employed by the company Levery S.r.l. Società Benefit. Author Maria Teresa Calcagni, affiliated with Università Politecnica delle Marche, was engaged with a service contract by the company Focchi S.p.A. The remaining authors declare that the research was conducted in the absence of any commercial or financial relationships that could be construed as a potential conflict of interest.

Appendix A

Table A1. Laboratory environment’s tests method statement.
SequenceTestActivity—Range ValuesPass/Fail Criteria =EU ReferenceTest Time
1AAir—infiltrationTest Pressure: +600 Pa (Class A4)Air leakage ≤ 1.5 m3/hm2EN 12152 [42], EN 12153 [43]45′
1BAir—exfiltrationTest Pressure: −600 Pa (Class A4)Air exfiltration rate ≤1.5 m³/hm² at test pressures up to 100 Pa1 h 15′
2Rain—test staticTest pressure: 600 Pa (Class R7)No leakage at 600 PaEN 12154 [44], EN 12155 [45]55′
3AWind—pressionTest pressure: +1750 PaMullion deflection limit: 3435/300 + 5 = 16.45 mm (ABC)
Residual deformation: 005 *Max measured deformation or 1 mm)
EN 12179 [46]8′
3BWind—depressionTest pressure: −2000 Pa8′
4AAir—infiltrationTest Pressure: +600 Pa (Class A4)Air leakage shall not exceed that measured at point 1B by more than 0.3 m³/hm²EN 12152, EN 121538′
4BAir—exfiltrationTest Pressure: −600 Pa (Class A4)Air leakage shall not exceed that measured at point 2 by more than 0.3 m³/hm²8′
5Rain—test staticTest pressure: 600 Pa (Class R7)No leakage at 600 PaEN 12154, EN 121551 h 5′
6Rain—test dynamicDynamic water penetration test with fan with a pulsing every 3 s from 750 Pa to 250 PaNo leakageCWCT ‘Standard Method for building envelope’ part 8. clause 8.7.2.1 36′
7ABuilding movement—vertical1. Vertical offset of the intermediate unit: uz = ±7 [mm]—2 cycles-CWCT ‘Standard Method for building envelope’ part 17n.a.
7BBuilding movement—horizontal2. Horizontal offset of the intermediate beam: uz = ±7 [mm]—2 cycles-CWCT ‘Standard Method for building envelope’ part 17n.a.
8AAir—infiltrationTest Pressure: +600 Pa (Class A4)Air leakage shall not exceed that measured at point 1B by more than 0.3 m³/hm²EN 12152, EN 121537′ 30′’
8BAir—exfiltrationTest Pressure: −600 Pa (Class A4)Air leakage shall not exceed that measured at point 2 by more than 0.3 m³/hm²7′ 30′’
9Rain—test staticTest pressure: 600 Pa (Class R7)No leakage at 600 PaEN 12154, EN 121551 h
10AWind—pressionTest pressure: 2625 PaIntegrity: Residual deformation = 6.90 mm
(3435 mm/500)
EN 121792′
10BWind—depressionTest pressure: −3000 Pa2′
11Fan excitationDynamic test--1 h 35′
12AImpacts test- hard body6 J (1.224 mm height with 0.5 kg steel ball)
10 J (1.020 mm height with 1.0 kg steel ball)
Negligible risk
(TN76)
CWCT TN 76n.a.
12BImpact test—soft body120 J (245 mm height)
500 J (1020 mm height)
Negligible risk
(TN76)
n.a.
12CImpact test—double tyre343 J (700 mm height)No part exceeding the mass of 50 g shall fall.
No holing shall occur permitting a test block E2 according to EN 1630
(ellipse) to be passed through it;
EN 14019 and BS 12600n.a.

References

  1. Wang, G.; Ke, J. Literature Review on the Structural Health Monitoring (SHM) of Sustainable Civil Infrastructure: An Analysis of Influencing Factors in the Implementation. Buildings 2024, 14, 402. [Google Scholar] [CrossRef]
  2. Intelligent Buildings—An Overview|ScienceDirect Topics. Available online: https://www.sciencedirect.com/topics/engineering/intelligent-buildings (accessed on 29 January 2024).
  3. Blum, D. Data-Driven Smart Buildings: State-of-the-Art Review; Energy in Building and Communities Programme; CSIRO: Newcastle, NSW, Australia, 2023; p. 103.
  4. Kaboli, A.; Shirowzhan, S. Advances and Technologies in Building Construction and Structural Analysis; IntechOpen: London, UK, 2021; ISBN 978-1-83881-141-9. [Google Scholar]
  5. Faridi, A.; Roy, K.; Singhal, V. Damage Quantification in Beam-Type Structures Using Modal Curvature Ratio; Innovative Infrastructure Solutions; Springer International Publishing: Berlin/Heidelberg, Germany, 2024. [Google Scholar]
  6. Valinejadshoubi, M.; Bagchi, A.; Moselhi, O. Structural Health Monitoring of Buildings and Infrastructure. Int. J. Civ. Environ. Eng. 2016, 10, 9. [Google Scholar]
  7. Ferreira, P.M.; Machado, M.A.; Carvalho, M.S.; Vidal, C. Embedded Sensors for Structural Health Monitoring: Methodologies and Applications Review. Sensors 2022, 22, 8320. [Google Scholar] [CrossRef] [PubMed]
  8. Comisu, C.-C.; Taranu, N.; Boaca, G.; Scutaru, M.-C. Structural Health Monitoring System of Bridges. Procedia Eng. 2017, 199, 2054–2059. [Google Scholar] [CrossRef]
  9. Deng, Z.; Huang, M.; Wan, N.; Zhang, J. The Current Development of Structural Health Monitoring for Bridges: A Review. Buildings 2023, 13, 1360. [Google Scholar] [CrossRef]
  10. Li, S.; Chen, S. Field Monitoring and Prediction on Temperature Distribution of Glass Curtain Walls of a Super High-Rise Building. Eng. Struct. 2022, 250, 113405. [Google Scholar] [CrossRef]
  11. Yang, B.; Zhu, H.; Wüchner, R.; Zhang, Q. Monitoring of Wind Effects on a Wind-Sensitive Hybrid Structure with Single-Layer Cable-Net Curtain Walls under Typhoon Muifa. J. Build. Eng. 2021, 44, 102960. [Google Scholar] [CrossRef]
  12. Ogasawara, S.; Kanda, K.; Suzuki, Y. Damage Investigation of Non-Structural Components in Buildings with SHM System in the 2018 Osaka Earthquake. In Proceedings of the 17th World Conference on Earthquake Engineering, Sendai, Japan, 13–18 September 2020. [Google Scholar]
  13. Brell-Cokcan, S.; Adams, T.J.; Kerber, E.; Dai, R.; Lee, H.J.; Kirner, L.T.; von Hilchen, M.; Adams, T.J. Construction & Robotics: Research Driven Project, Volume 1: Research Paper/SS 2021; RWTH Aachen University: Aachen, Germany, 2022; 179p. [Google Scholar]
  14. Bouzan, G.B. Building Facade Inspection: A System Based on Automated Data Acquisition, Machine Learing, and Deep Learning Image Classification Methods. ARPN J. Eng. Appl. Sci. 2021, 16, 1516. [Google Scholar]
  15. Giovanardi, M.; Baietta, A.; Belletti, F.; Magnani, S.; Casadei, O.; Pracucci, A. Exploiting the Value of Active and Multifunctional Façade Technology through the IoT and AI. Appl. Sci. 2024, 14, 1145. [Google Scholar] [CrossRef]
  16. EN13830-2022; Curtain Walling. CEN—Comitè Europeen de Normalisation: Bruxelles, Belgium, 2022.
  17. Armstrong, S.; Auty, M.; Aylward, T.; Campbell, J.; Claridge, P.; De Bleecker, H. Standard Test Methods for Building Envelopes; Centre of Window and Cladding Technology: Bath, UK, 2005; ISBN 1-874003-39-4. [Google Scholar]
  18. Majumder, M.; Gangopadhyay, T.K.; Chakraborty, A.K.; Dasgupta, K.; Bhattacharya, D.K. Fibre Bragg Gratings in Structural Health Monitoring—Present Status and Applications. Sens. Actuators Phys. 2008, 147, 150–164. [Google Scholar] [CrossRef]
  19. Bremer, K.; Wollweber, M.; Weigand, F.; Rahlves, M.; Kuhne, M.; Helbig, R.; Roth, B. Fibre Optic Sensors for the Structural Health Monitoring of Building Structures. Procedia Technol. 2016, 26, 524–529. [Google Scholar] [CrossRef]
  20. Ur Rehman, S.; Usman, M.; Younus Toor, M.H.; Hussaini, Q. Advancing Structural Health Monitoring: A Vibration-Based IoT Approach for Remote Real-Time Systems. Sens. Actuators Phys. 2024, 365, 114863. [Google Scholar] [CrossRef]
  21. Mazzei, M.; Lellis, A.M.D. Capacitive Accelerometers at Low Frequency for Infrastructure Monitoring. Procedia Struct. Integr. 2023, 44, 1212–1219. [Google Scholar] [CrossRef]
  22. Arezzo, D.; Quarchioni, S.; Nicoletti, V.; Carbonari, S.; Gara, F.; Leonardo, C.; Leoni, G. SHM of Historical Buildings: The Case Study of Santa Maria in Via Church in Camerino (Italy). Procedia Struct. Integr. 2023, 44, 2098–2105. [Google Scholar] [CrossRef]
  23. Lobianco, A.L.; Zoppo, M.D.; Ludovico, M.D. Correlation of Local and Global Structural Damage State for SHM. Procedia Struct. Integr. 2023, 44, 910–917. [Google Scholar] [CrossRef]
  24. Li, J.; Hao, H. Substructure Damage Identification Based on Wavelet-Domain Response Reconstruction. Struct. Health Monit. 2014, 13, 389–405. [Google Scholar] [CrossRef]
  25. Li, J.; Hao, H.; Lo, J. Structural Damage Identification with Power Spectral Density Transmissibility: Numerical and Experimental Studies. Smart Struct. Syst. 2015, 15, 15–40. [Google Scholar] [CrossRef]
  26. Ziaja, D.; Nazarko, P. SHM System for Anomaly Detection of Bolted Joints in Engineering Structures. Structures 2021, 33, 3877–3884. [Google Scholar] [CrossRef]
  27. InComEss. Available online: https://www.incomess-project.com (accessed on 29 January 2024).
  28. Pracucci, A.; Vandi, L.; Belletti, F.; Melo, A.R.A.; Vlachos, M.; Amditis, A.; Calcagni, M.T.; Esteves, D.S. Integration of Piezoelectric Energy Harvesting Systems in Building Envelope for Structural Health Monitoring with Fiber Optic Sensing Technology. Preprints 2024, 2024031168. [Google Scholar] [CrossRef]
  29. Tommasino, D.; Moro, F.; De Pablo Corona, E.; Vandi, L.; Baietta, A.; Pracucci, A.; Doria, A. Optimization of a Piezoelectric Wind-Excited Cantilever for Energy Harvesting from Facades. In Advances in Italian Mechanism Science; Niola, V., Gasparetto, A., Quaglia, G., Carbone, G., Eds.; Mechanisms and Machine Science; Springer International Publishing: Cham, Switzerland, 2022; Volume 122, pp. 848–856. ISBN 978-3-031-10775-7. [Google Scholar]
  30. Ye, X.-W.; Su, Y.-H.; Xi, P.-S. Statistical Analysis of Stress Signals from Bridge Monitoring by FBG System. Sensors 2018, 18, 491. [Google Scholar] [CrossRef]
  31. Zhou, Z.; Ou, J. Development of FBG Sensors for Structural Health Monitoring in Civil Infrastructures. In Sensing Issues in Civil Structural Health Monitoring; Ansari, F., Ed.; Springer: Dordrecht, The Netherlands, 2005; pp. 197–207. [Google Scholar]
  32. Čápová, K.; Velebil, L.; Včelák, J. Laboratory and In-Situ Testing of Integrated FBG Sensors for SHM for Concrete and Timber Structures. Sensors 2020, 20, 1661. [Google Scholar] [CrossRef] [PubMed]
  33. Mieloszyk, M.; Majewska, K.; Zywica, G.; Kaczmarczyk, T.Z.; Jurek, M.; Ostachowicz, W. Fibre Bragg Grating Sensors as a Measurement Tool for an Organic Rankine Cycle Micro-Turbogenerator. Measurement 2020, 157, 107666. [Google Scholar] [CrossRef]
  34. Gomasa, R.; Talakokula, V.; Kalyana Rama Jyosyula, S.; Bansal, T. A Review on Health Monitoring of Concrete Structures Using Embedded Piezoelectric Sensor. Constr. Build. Mater. 2023, 405, 133179. [Google Scholar] [CrossRef]
  35. Lei, Y.-J.; Li, R.-J.; Zhang, L.-S.; Hu, P.-H.; Huang, Q.-X. Optical Accelerometers for Detecting Low-Frequency Micro-Vibrations. Appl. Sci. 2022, 12, 3994. [Google Scholar] [CrossRef]
  36. Lee, H.; Oh, M.; Seo, J.; Kim, W. Seismic and Energy Performance Evaluation of Large-Scale Curtain Walls Subjected to Displacement Control Fasteners. Appl. Sci. 2021, 11, 6725. [Google Scholar] [CrossRef]
  37. Aiello, C. In-Plane Seismic Response of a Glazed Curtain Wall: Full-Scale Laboratory Test and Non-Linear Modelling. In Proceedings of the 7th International Conference on Computational Methods in Structural Dynamics and Earthquake Engineering (COMPDYN 2019), Crete, Greece, 24–26 June 2019; Institute of Structural Analysis and Antiseismic Research School of Civil Engineering National Technical University of Athens (NTUA) Greece: Crete, Greece, 2019; pp. 269–281. [Google Scholar]
  38. EN 14019:2016; Curtain Walling—Impact Resistance—Performance Requirements. Slovenski Inštitut za Standardizacijo: Ljubljana, Slovenia, 2016. Available online: https://standards.iteh.ai/catalog/standards/cen/1bfe4fa0-6bf4-4ae7-b2a2-0a87ced89e0d/en-14019-2016 (accessed on 12 February 2024).
  39. La Norma Uni En 12600: Prova Del Pendolo–Metodo Della Prova Di Impatto E Classificazione Per Il Vetro Piano. Available online: https://www.ingenio-web.it/files/guida-alle-norme-tecniche-del-vetro-per-edilizia.pdf (accessed on 9 February 2024).
  40. NI-9234 Specifications—NI. Available online: https://www.ni.com/docs/en-US/bundle/ni-9234-specs/page/specs.html (accessed on 13 March 2024).
  41. HBK (Hottinger, Brüel & Kjær). QuantumX MX840B Universal Amplifier. Available online: https://www.hbm.com/en/2129/quantumx-mx840b-8-channel-universal-amplifier/?product_type_no=QuantumX%20MX840B/MX440B:%20Universal%20Data%20Acquisition%20Module (accessed on 9 February 2024).
  42. UNI BS EN 12152_2002; Facciate Continue Permeabilità All’aria Requisiti Prestazionali e Classificazione. 2003.
  43. UNI EN 12153:2002; Facciate continue-Permeabilità all’aria-Metodo Di Prova. 2002.
  44. UNI BS EN 12154_1999; Curtain Walling—Watertighness-Performance Requirments and Classification. 1999.
  45. UNI EN 12155:2002; Facciate Continue-Tenuta All’acqua-Prova Di Laboratorio Sotto Pressione Statica. 2002.
  46. UNI EN 12179:2002; Facciate Continue-Resistenza al Carico Del Vento-Metodo Di Prova. 2002.
Figure 1. Scheme of InComEss system architecture with components integrated into façade and communication to IoT platform.
Applsci 14 03260 g001
Figure 2. Schematic representation of a fiber and Fiber Bragg Grating inscribed into the core of an optical fiber.
Applsci 14 03260 g002
Figure 3. Scheme of InComEss architecture.
Applsci 14 03260 g003
Figure 4. Scheme of FBGs channel position.
Applsci 14 03260 g004
Figure 5. Accelerometer positions—façade external view.
Applsci 14 03260 g005
Figure 6. Force washers’ positions.
Applsci 14 03260 g006
Figure 7. Façade manufacturing process.
Applsci 14 03260 g007
Figure 8. Façade installation process.
Applsci 14 03260 g008
Figure 9. FBGs sensors applied on the glass surface for temperature monitoring.
Applsci 14 03260 g009
Figure 10. FBGs application on the aluminum profile for strain monitoring.
Applsci 14 03260 g010
Figure 11. Accelerometer applied on aluminum transom.
Applsci 14 03260 g011
Figure 12. Accelerometer applied on aluminum mullion.
Applsci 14 03260 g012
Figure 13. Zoom on the force washer installed on the bracket’s bolt.
Applsci 14 03260 g013
Figure 14. Façade bracket with force washer installation.
Applsci 14 03260 g014
Figure 15. Modal analysis geometry consists of 54 nodes representing the modulus of the facade used for performing modal analysis.
Applsci 14 03260 g015
Figure 16. FRF sum comparison between pre- and post-compliance tests.
Applsci 14 03260 g016
Figure 17. MAC (Modal Assurance Criterion) between the two performed modal analysis.
Applsci 14 03260 g017
Figure 18. NFD (Natural Frequency Difference) between the two performed modal analysis.
Applsci 14 03260 g018
Figure 19. Three modal shapes comparison between pre-compliance test and post-compliance test: Yellow markers represent the mode shape estimated before the compliance test and the cyan ones represent the mode shape estimated after the compliance test.
Applsci 14 03260 g019
Figure 20. Signal RMS analysis. In sequence, top figure: RMS of day 1 (a); middle figure: RMS of day 2 (b); bottom figure: RMS of day 3 (c).
Applsci 14 03260 g020
Figure 21. Day 1 tests: respectively, story time and power spectrum for each test: air permeability acceleration/time (a); air permeability power spectrum /frequency (b); rain (static) acceleration/time (c); rain (static) power spectrum /frequency (d).
Applsci 14 03260 g021
Figure 22. Day 2 tests: respectively, story time and power spectrum for each test: wind resistance acceleration/time (a); wind resistance power spectrum/frequency (b); air permeability acceleration/time (c); air permeability power spectral power spectrum/frequency (d); rain (static) acceleration/time (e); rain (static) power spectrum/frequency (f); rain (dynamic) acceleration/time (g); rain (dynamic) power spectrum/frequency (h); building movements acceleration/time (i); building movements power spectrum/frequency (j); air permeability acceleration/time (k); air permeability power spectrum/frequency (l); rain (static) acceleration/time (m); rain (static) power spectrum/frequency (n); wind resistance acceleration/time (o); wind resistance power spectrum/frequency (p).
Applsci 14 03260 g022aApplsci 14 03260 g022bApplsci 14 03260 g022c
Figure 23. Day 3 tests: respectively, story time and power spectrum for each test: fan excitation acceleration/time (a); fan excitation power spectrum/frequency (b); impact test acceleration/time (c); impact test power spectrum/frequency (d).
Applsci 14 03260 g023
Figure 24. Power spectrum comparison between rain (static) test of day 1 and test of day 2.
Applsci 14 03260 g024
Figure 25. Strain gauge-based force washer data collected during the 3 days: day 1 (a); day 2 (b); day 3 (c).
Applsci 14 03260 g025
Figure 26. Day 1 FBG for temperature—Channel 4.
Applsci 14 03260 g026
Figure 27. Day 2 FBG for temperature—Channel 4.
Applsci 14 03260 g027
Figure 28. Day 1 FBG for strain—Channel 3.
Applsci 14 03260 g028
Figure 29. Day 1 FBG for strain—Channel 5.
Applsci 14 03260 g029
Figure 30. Day 2 FBG for strain—Channel 3.
Applsci 14 03260 g030
Figure 31. Day 2 FBG for strain—Channel 5.
Applsci 14 03260 g031
Figure 32. Day 2 FBG for strain—Channel 2.
Applsci 14 03260 g032
Table 1. List of defined most relevant parameters to be monitored in terms of safety.
LabelDescriptionRangeSelected Sensor
SHM—thermal shock—temperature Glazed façade needs to be designed to prevent episodes of thermal shock in vision and spandrel parts linked to the thermal variation due to solar radiation and light conversion into IR on glass and other façade components. The installation of a temperature sensor allows for collecting a set of data to support further thermal shock design.Temperature of service with a daily excursion between 5 °C and 120 °C
Temperature of service with a daily excursion between −5 °C and 80 °C
FBG
SHM—mechanical stress—Strain and vibration due to accidental impactsFaçade could be stressed by extraordinary events as accidental and not possible to foreseen impacts, which could compromise the structural façade’s behavior.Accidental impact—range between 6 J (1.224 mm height) and 343 J (700 mm height)FBG Accelerometer
Force washers
SHM—mechanical stress—Strain and vibration due to dynamic pressure Façade is stressed by ordinary (wind load) and extraordinary (seismic load) loads and its mechanical behavior needs to be monitored to guarantee the structural integrityPressure ranges from −3000 Pa to +2625 PaFBG
Accelerometer
Force washers
SHM—mechanical stress—torque screw Façade hangs on a brackets system fixed to the load-bearing structure through the utilization of screws specifically torqued to guarantee the right placement and performance of the façade. This torque needs to be preserved during building service to avoid a loss of façade performance and safety issues. The monitoring of torque (e.g., brackets on steelwork) can directly intervene to preserve the façade serviceability and detect defects as distance façade/slab and façade/edge (±5 mm), stack joint distance (±5 mm).60–120 NForce washers
Table 2. Summit of integration sensor within the façade and key information.
QuantityType of SensorMeasured Physical QuantityData Collection SystemApplication on the FaçadeAxisSensor ModelSample Rate [Hz]Acquisition System [bit] Sensitivity
6Monoaxial accelerometersAccelerationNI 9234 [40]Internal position X, Y, ZPCB 352C33500024100 mV/g
1Triaxial accelerometersAccelerationNI 9234External position X, Y, ZPCB 354C035000241000 mV/g
8Forced washersBolt TightnessQUANTUM X MX840B
[41]
Façade bolt brackets K-KMR+200K30242 mV/V
Fnom = 200 kN
6FBGs (channel 2)StrainSwitchgatorInternal on aluminum profileX0.15 nm FBG100018-
3FBGs (channel 3)StrainSwitchgatorExternal on glass surfaceZ0.15 nm FBG1000–19,230 (for impact tests)18-
1FBGs (channel 4)TemperatureMonadgatorExternal on glass surface-0.15 nm FBG <114-
6FBGs (channel 5)StrainSwitchgatorInternal on aluminum profileZ0.15 nm FBG 1000–10,230 (for impact tests)18-
Table 3. Modal frequencies pre-compliance test (on the left), post-compliance test (on the right).
0–400 Hz400–1000 Hz1000–3000 Hz
Pre-TestPost-TestPre-TestPost-TestPre-TestPost-Test
46.945.6436.24435.111608.311593.50
90.282.5489.64489.371650.31644.79
106.6103.7534.23533.51746.91746.79
154.2152.14589.13587.51882.861874.07
169.3168.14615.8614.871993.21995.06
313.9312.19672.64672.342105.162096.57
329.5328.9701.09700.952246.172241.69
351.22343.04984.54982.11--
Table 4. Load values of the load cells during day 2.
ChannelTightness at the Beginning of the Test on Day 2Tightness at the End of the Test on Day 2Delta
10.4−0.60.64
2−0.06−1.31.2
50.02−0.80.82
6−0.08−1.020.94
7−0.004−1.031.026
80.04−0.40.44
Disclaimer/Publisher’s Note: The statements, opinions and data contained in all publications are solely those of the individual author(s) and contributor(s) and not of MDPI and/or the editor(s). MDPI and/or the editor(s) disclaim responsibility for any injury to people or property resulting from any ideas, methods, instructions or products referred to in the content.

