Article

Simulated Digestion of Red Sea Cucumber (Parastichopus tremulus): A Study of Protein Quality and Antioxidant Activity

1
Department of Biotechnology and Food Science, The Norwegian University of Science and Technology (NTNU), N-7012 Trondheim, Norway
2
Norwegian College of Fishery Science, UiT-The Arctic University of Norway, N-9037 Tromsø, Norway
*
Author to whom correspondence should be addressed.
Appl. Sci. 2024, 14(8), 3267; https://doi.org/10.3390/app14083267
Submission received: 16 February 2024 / Revised: 8 April 2024 / Accepted: 9 April 2024 / Published: 12 April 2024
(This article belongs to the Special Issue Natural Products and Bioactive Compounds)

Abstract

:
Sea cucumbers from unharvested areas, are underutilized resources which may have the potential to become a future food resource. The aim of this study was to evaluate protein quality and investigate the changes in antioxidant activity from frozen and freeze-dried red sea cucumber (Parastichopus tremulus) subjected to digestion, using an in vitro digestion model. P. tremulus constituted high moisture content (90%), comparable protein (4%) and ash (4%) content, and low lipid (1%) content. The biochemical components in freeze-dried samples were largely retained during the freeze-drying process. Frozen samples showed significantly higher (p < 0.05) antioxidant activity compared to freeze-dried samples (calculated on a dry weight basis). The quantity of essential amino acids was high (31%) and corresponds to the Food and Agriculture Organization of the United Nations reference protein. Frozen samples showed an increase in antioxidant activity during digestion measured by three different antioxidant assays. Freeze-dried samples only showed an increase in one of the antioxidant assays. Correlations (p < 0.05) were found between specific free amino acids and antioxidant activity. The amount of free amino acids exceeded the threshold to taste bitter, umami, sour, and sweet flavors. This study showed that P. tremulus constitutes good protein quality, performed antioxidant activity, and has the potential to be used as a flavor-enhancing ingredient.

1. Introduction

Over the last decades, the use of the term ‘functional food’ has increased [1]. ‘Functional foods’ are defined as foods containing or enriched with components associated with positive health effects and therefore reduce the risk of disease [1]. Functional components include amino acids, peptides, proteins, vitamins, minerals, omega-3 polyunsaturated fatty acids, and phospholipids [2]. There has been an increasing demand for a healthier diet in order to increase the quality of life and well-being [1]. In addition, there is an increasing focus on utilizing less common marine species in the ocean, such as mollusks, sponges, seaweeds, and sea cucumbers, which could be a critical source of important nutrients or as a potential food ingredient [1,3]. Particularly, Southeast Asia has a long history of utilizing sea cucumbers such as Apostichopus japonicus, Holothuria fuscogilva, Holothuria nobilis, Holothuria whitmaei, Holothuria scabra, Holothuria lessoni, and Thelenota ananas, as a food source or as nutraceuticals [4,5]. The sea cucumbers are available as fresh, frozen, or processed products such as dried (bêche-de-mer), fermented, or smoked [6].
Many sea cucumber populations have declined in Asia and Indo-Pacific regions for the last 40 years due to the high demand in the eastern world and overexploitation [7,8]. This includes Holothuria whitmaei from the Great Barrier Reef in Australia [9] and Thelenota ananas [10].
Sea cucumbers contain valuable vitamins and minerals (zinc, iron, magnesium, and calcium) [11,12]. Furthermore, sea cucumber has been reported to constitute important essential amino acids (EAAs) which could contribute to the nutritional value [11]. Sea cucumber may also have the potential to contribute to the umami flavor in foods [13].
The Norwegian red sea cucumber (Parastichopus tremulus) is distributed from the Barents Sea in the north to the Canaries in the south [14,15]. P. tremulus has gained attention in the Asia market due to its red color [6]. P. tremulus are mainly exported to Asian markets as frozen or dried products [16].
During normal metabolism, reactive oxygen species (ROS) are constantly produced, having an adverse effect on the human body, initiating accelerated cell death, and causing tissue damage when not countered [17]. Antioxidants perform an essential role in counteracting these ROS, preventing diseases, and maintaining human health [18]. Sea cucumbers have previously been shown to contain several bioactive compounds, including amino acids and peptides, which express antioxidative and anti-inflammatory properties [1,12]. This suggests that consumption of sea cucumber could attenuate the ROS formation in the human body [17]. The availability of bioactive peptides in sea cucumbers could be increased through enzymatic hydrolysis [13,19] or released naturally during gastrointestinal digestion [20].
The aim of this study was to evaluate protein quality and investigate the changes in antioxidant activity from frozen and freeze-dried red sea cucumber (Parastichopus tremulus) subjected to digestion, using an in vitro digestion model.

2. Materials and Methods
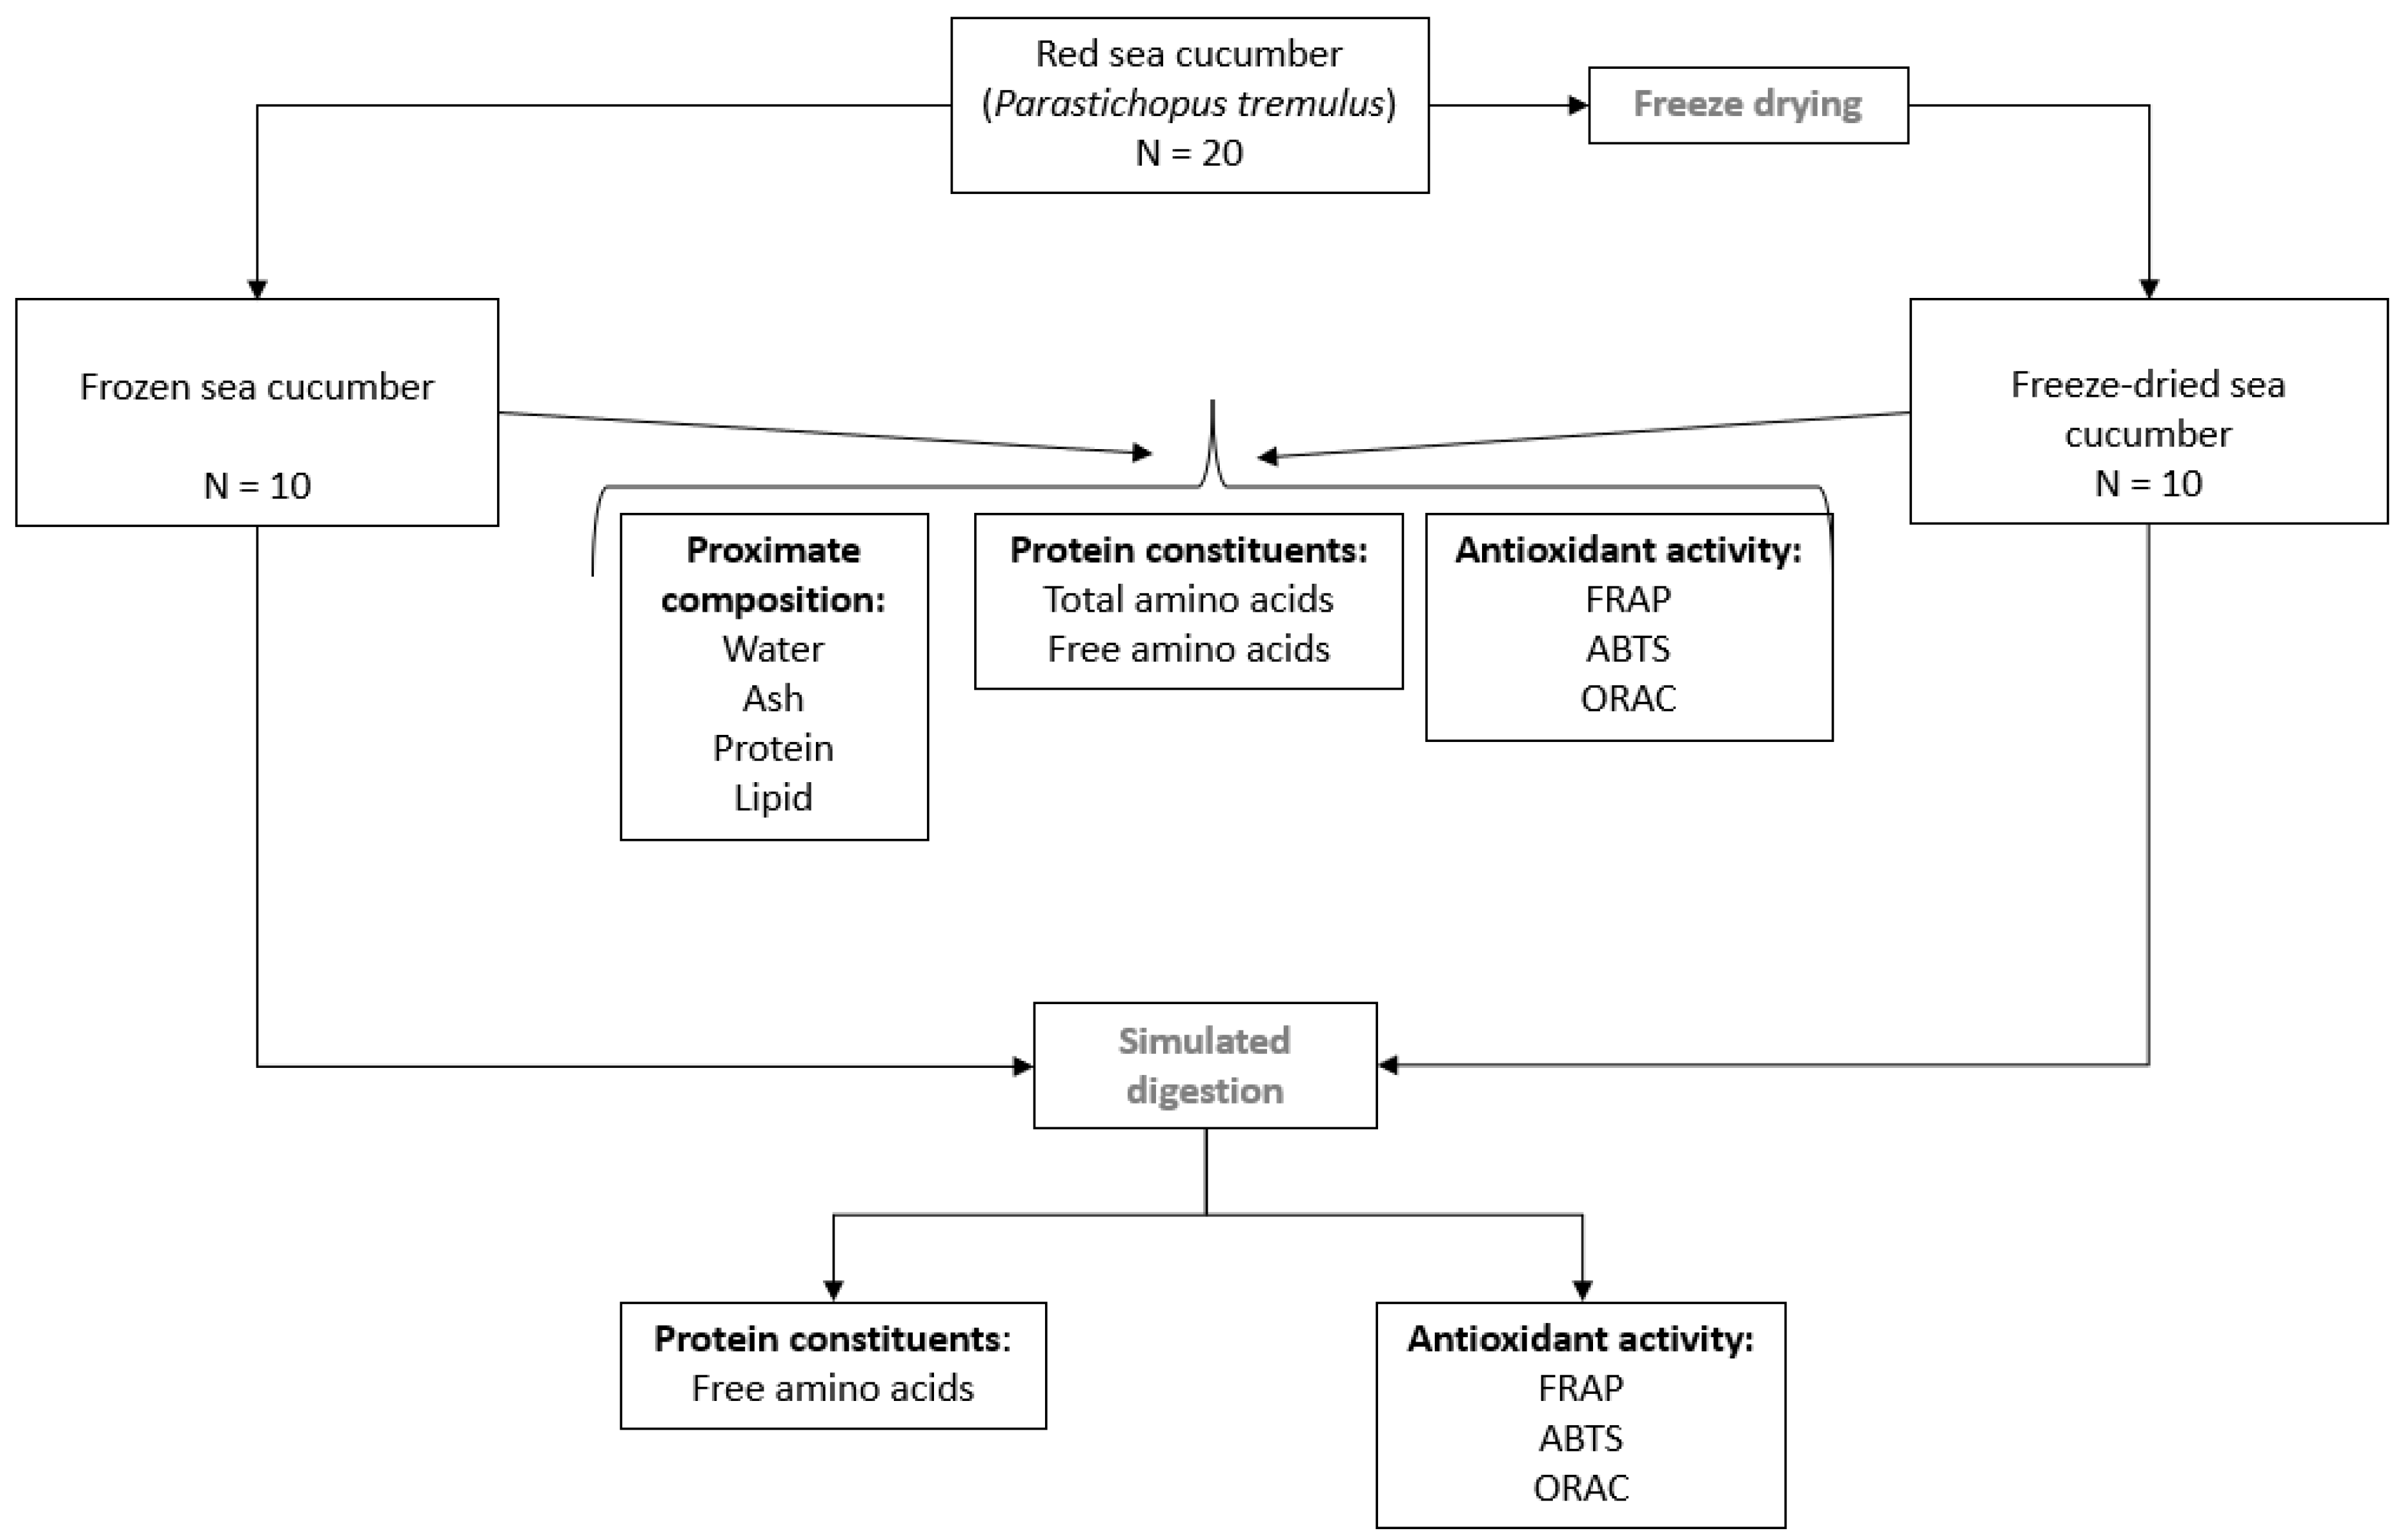
The Norwegian red sea cucumbers (P. tremulus) (n = 20), weighing 56 ± 19 g and measuring between 5 and 20 cm in length, were caught by the Gunnerus research ship in the Trondheim’s fjord (63°30.917 N 10°25.107 E) in October 2020 using a bottom trawler. The sea cucumbers were stored for approximately 10 months in seawater tanks in their natural bottom sediments and fed with salmon pellets grinded into small particles. The sea cucumbers were slaughtered by gutting in August 2021, and divided into two groups. The first group (n = 10) was frozen and subjected to the freeze-drying process (−50 °C at 0.040 mBar, <13.3 Pa) before storage at −80 °C. The second group (n = 10) was frozen at −80 °C until further analysis.

2.1. Study Design

A schematic illustration of the study design, and analysis performed on frozen and freeze-dried samples in terms of proximate composition, amino acid composition, and antioxidant activity is shown in Figure 1.

2.2. Proximate Composition of Frozen and Freeze-Dried Sea Cucumbers

Water and ash content were determined gravimetrically according to the method described by Association of Official Agricultural Chemists (AOAC) [21]. The protein contents of both frozen and freeze-dried P. tremulus were analyzed by the Kjeldahl method, following the manufacturer’s protocol as described by Latimer [22]. The lipid content was determined gravimetrically as described by Bligh and Dyer [23]. All chemicals used, system parameters and the instrument analyses were performed as previously described in Vu et al. [13].

2.3. Analyses of Total and Free Amino Acids

The total amino acids (TAAs) content was determined based on the method by Blackburn [24] as described in Vu et al. [13]. The content of free amino acids (FAAs) was determined based on the method by Osnes and Mohr [25] as described in Vu et al. [13]. Both TAAs and FAAs were analyzed using a HPLC system (Dionex, Thermo Fisher Scientific, Sunnyvale, CA, USA) constituted of a TSP P400 pump, an ultimate 3000WP injector, a fluorescence detector RF2000, and a Nova-Pak C18 column with a particle size of 4 μm (3.9 mm × 150 mm, WAT086344, Waters Corporation, Milford, MA, USA).

2.4. Calculation of True Retention

True retention (TR) was calculated for the amino acids as previously described by Murphy et al. [26] using the following Equation (1):
% T R = n u t r i e n t   c o n t e n t   p e r   g   f r e e z e   d r i e d   s e a   c u c u m b e r × g   f r e e z e   d r i e d   s e a   c u c u m b e r n u t r i e n t   c o n t e n t   p e r   g   f r o z e n   s e a   c u c u m b e r × g   f r o z e n   s e a   c u c u m b e r × 100

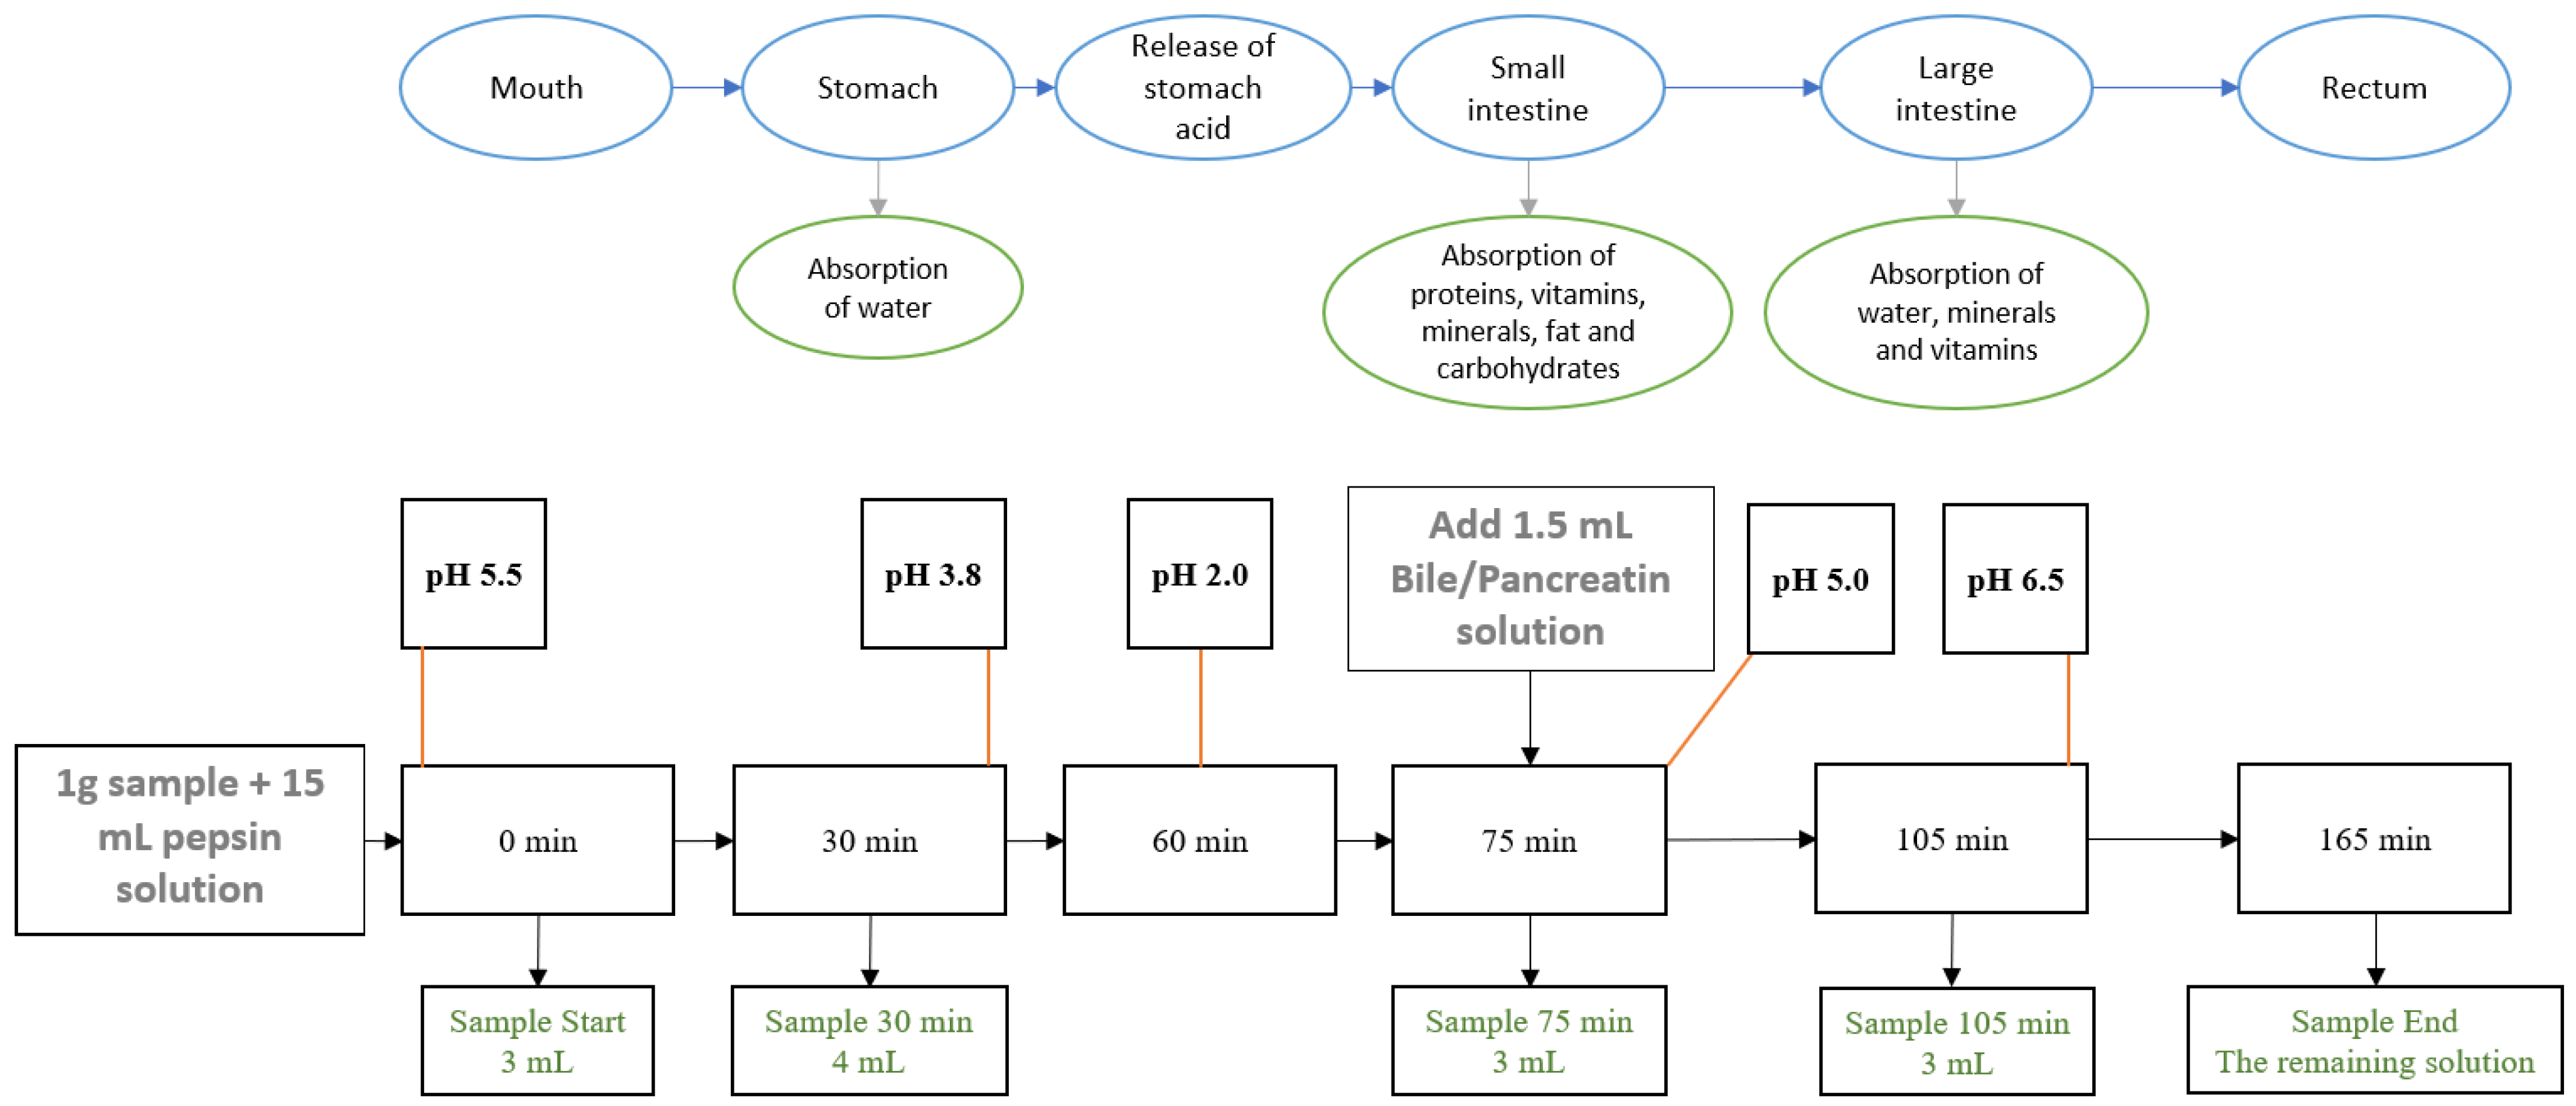
2.5. Simulated Gastrointestinal Digestion

The simulated gastrointestinal digestion was conducted as described by Jensen et al. [27] (Figure 2). The gastric phase consists of a pepsin solution containing pepsin from porcine gastric mucosa (0.462%, P6887, Sigma-Aldrich, Saint Louis, MO, USA), NaCl (49 mM, VWR, Leuven, Belgium), KCl (12 mM, Sigma-Aldrich, Darmstadt, Germany), CaCl2 (10, mM, Merck, Darmstadt, Germany), MgCl2 (2.4 mM, VWR, Leuven, Belgium), and K2HPO4 (3.5 mM, Merck, Darmstadt, Germany). The intestinal phase consists of a bile/pancreatin solution containing pancreatin from porcine pancreas (4 g/L, P1750, Sigma-Aldrich, Saint Louis, MO, USA), bile porcine extract (25 g/L, B8631, Sigma-Aldrich, Saint Louis, MO, USA), and NaHCO3 (0.1 M, Merck, Darmstadt, Germany). pH adjustments were performed using HCl (Sigma-Aldrich, Darmstadt, Germany) and NaOH (Sigma-Aldrich, Darmstadt, Germany).
Frozen, freeze-dried samples (1 g), or distilled water as control (1 mL) was mixed with pepsin solution (15 mL). The pH was adjusted to 5.5 and an initial sample (3 mL) was collected (0 min). The reaction mixtures were incubated on a magnetic stirrer (300 rpm) with temperature regulation (37 °C). After 30 min, a second sample (4 mL) was collected. The pH was adjusted to 3.8, and the reaction mixture was further incubated for an additional 30 min before another pH adjustment to pH 2.0. The reactions mixtures were incubated for an additional 15 min, before a third sample (3 mL) was collected. Thereafter, a pancreatin and bile solution (1.5 mL) was added, and the pH was adjusted to 5.0. The reaction mixtures were further incubated for 30 min before a fourth sample (3 mL) was collected. The pH was adjusted to 6.5 and the reaction mixture was continuously incubated for another 60 min. The remaining reaction mixture was collected. While the pH adjustment was negligible, the addition of bile/pancreatin resulted in a 1.2 dilution factor and has been taken into consideration when calculating the results.
The collected samples were centrifuged at 4500× g for 5 min at 4 °C. The supernatants were incubated at 90 °C (5 min) to inactivate the enzymes, cooled on ice, and frozen (−80 °C) until analysis. The digestion process was performed with two replicates for each sample.

2.6. Antioxidant Assays

The antioxidant activity was analyzed by ferric reducing antioxidant power (FRAP), 2′-azino-bis-(3-ethylbenzothiazoline-6-sulfonic acid) (ABTS), and oxygen radical absorbance capacity (ORAC). The FRAP assay was conducted as described by Benzie and Strain [28] with modifications explained by Jensen et al. [27]. The water-soluble vitamin E-analog, Trolox (Acros Organics, Geel, Belgium) was used as a standard with concentrations ranging from 0 to 1000 µmol/L. The FRAP measurement was analyzed using a spectrophotometer (PowerWave XS, BioTek, Winooski, VT, USA). The ABTS assay was performed as described by Re et al. [29], Nenadis et al. [30], and Nenadis et al. [31]. Propyl gallate (Sigma-Aldrich, Steinheim, Germany) was used as a standard with concentrations ranging from 0 to 50 µmol/L. The ABTS assay was analyzed using an UV-Spectrophotometer (UV-1800, Shimadzu Corporation, Kyoto, Japan). The ORAC assay was performed as described by Dávalos et al. [32] with modifications presented in Jensen et al. [27]. Trolox was utilized as standard with concentrations ranging from 0 to 100 µmol/L. The ORAC measurement was analyzed using a multimode reader TECAN (TECAN Spark 20 M, Männedorf, Switzerland).

2.7. Statistical Analysis

The analyses were performed on 10 parallels and run in duplicates unless otherwise stated. The results in tables are presented as average ± standard deviation, while the results in figures are presented as average ± standard error. IBM SPSS Statistics, version 29.0.1.0 (IBM, New York, NY, USA) were used to evaluate significant differences between frozen and freeze-dried red sea cucumber, and between different sample outtakes during the simulated gastrointestinal digestion. The data were analyzed by independent-samples t-test (p < 0.05). Univariate analysis of variance (ANOVA) was conducted with Tukey’s post hoc test (p < 0.05). The Pearson correlation was applied to determine the linearity between the variables.

3. Results and Discussion

3.1. Proximate Composition of Frozen and Freeze-Dried Materials

The water content in frozen samples was approximately 90%, while the protein (4%) and ash content (4%) constituted similar amounts, and a low concentration of lipids (1%) (Table 1). Freeze-dried samples constitute a water content of about 3%. The protein, lipid, and ash content thus constituted about 43%, 8%, and 36% of the freeze-dried samples, respectively. The results in this study are comparable to a previous study by Kjerstad et al. [6]. In their study, the fresh P. tremulus was caught at their natural habitat at Gryta and Vigrafjord during the period 2017 and 2018. The P. tremulus used in this current study were caught in October 2020 outside of Trondheim’s fjord and were fed with salmon pellets before slaughter. In general, habitat area, age, and seasonal catching are factors which could influence the biochemical composition in sea cucumbers [6,33].

3.2. Total and Free Amino Acid Composition in Frozen and Freeze-Dried Materials

In both frozen and freeze-dried samples, the most abundant amino acid was glutamic acid (6.8 g/100 g and 4.3 g/100 g dry weight), followed by glycine/arginine (6.1 g/100 g and 8.4 g/100 g dry weight) and aspartic acid (5.1 g/100 g and 3.5 g/100 g dry weight). Those three amino acids together represent about 53% and 57% of the TAAs profile (31.6 g/100 g and 30.4 g/100 g dry weight), respectively (Table 2). Glutamic acid, glutamine, leucine, methionine, serine, and tyrosine in frozen samples (theoretical calculation, dry weight) showed a significantly higher (p < 0.05) concentration compared to freeze-dried samples. Previous studies have found glycine to be the major amino acid in both frozen and freeze-dried P. tremulus [34,35]. In addition, glutamic acid, aspartic acid, and arginine have also been shown to be prominent in sea cucumbers [34,35].
In both frozen and freeze-dried samples, glutamic acid (139 and 414 mg/100 g dry weight), glycine/arginine (46 and 258 mg/100 g dry weight) and alanine (13 and 43 mg/100 g dry weight) are the dominating FAAs. Those dominating FAAs represent about 82% and 85% of the total FAAs content, respectively (Table 2). All FAAs in freeze-dried samples showed a significantly higher (p < 0.05) amino acid concentration compared to the theoretical calculation of frozen samples (dry weight), except aspartic acid. This is in accordance with a previous study [7]. The glycine concentration may be prominent in red sea cucumber, but it could not be separated from arginine during analysis. The levels of amino acid content have been shown to vary with seasonal variations, age, habitat area, and location [36]. In this study, the red sea cucumbers were harvested only once, in October 2020.

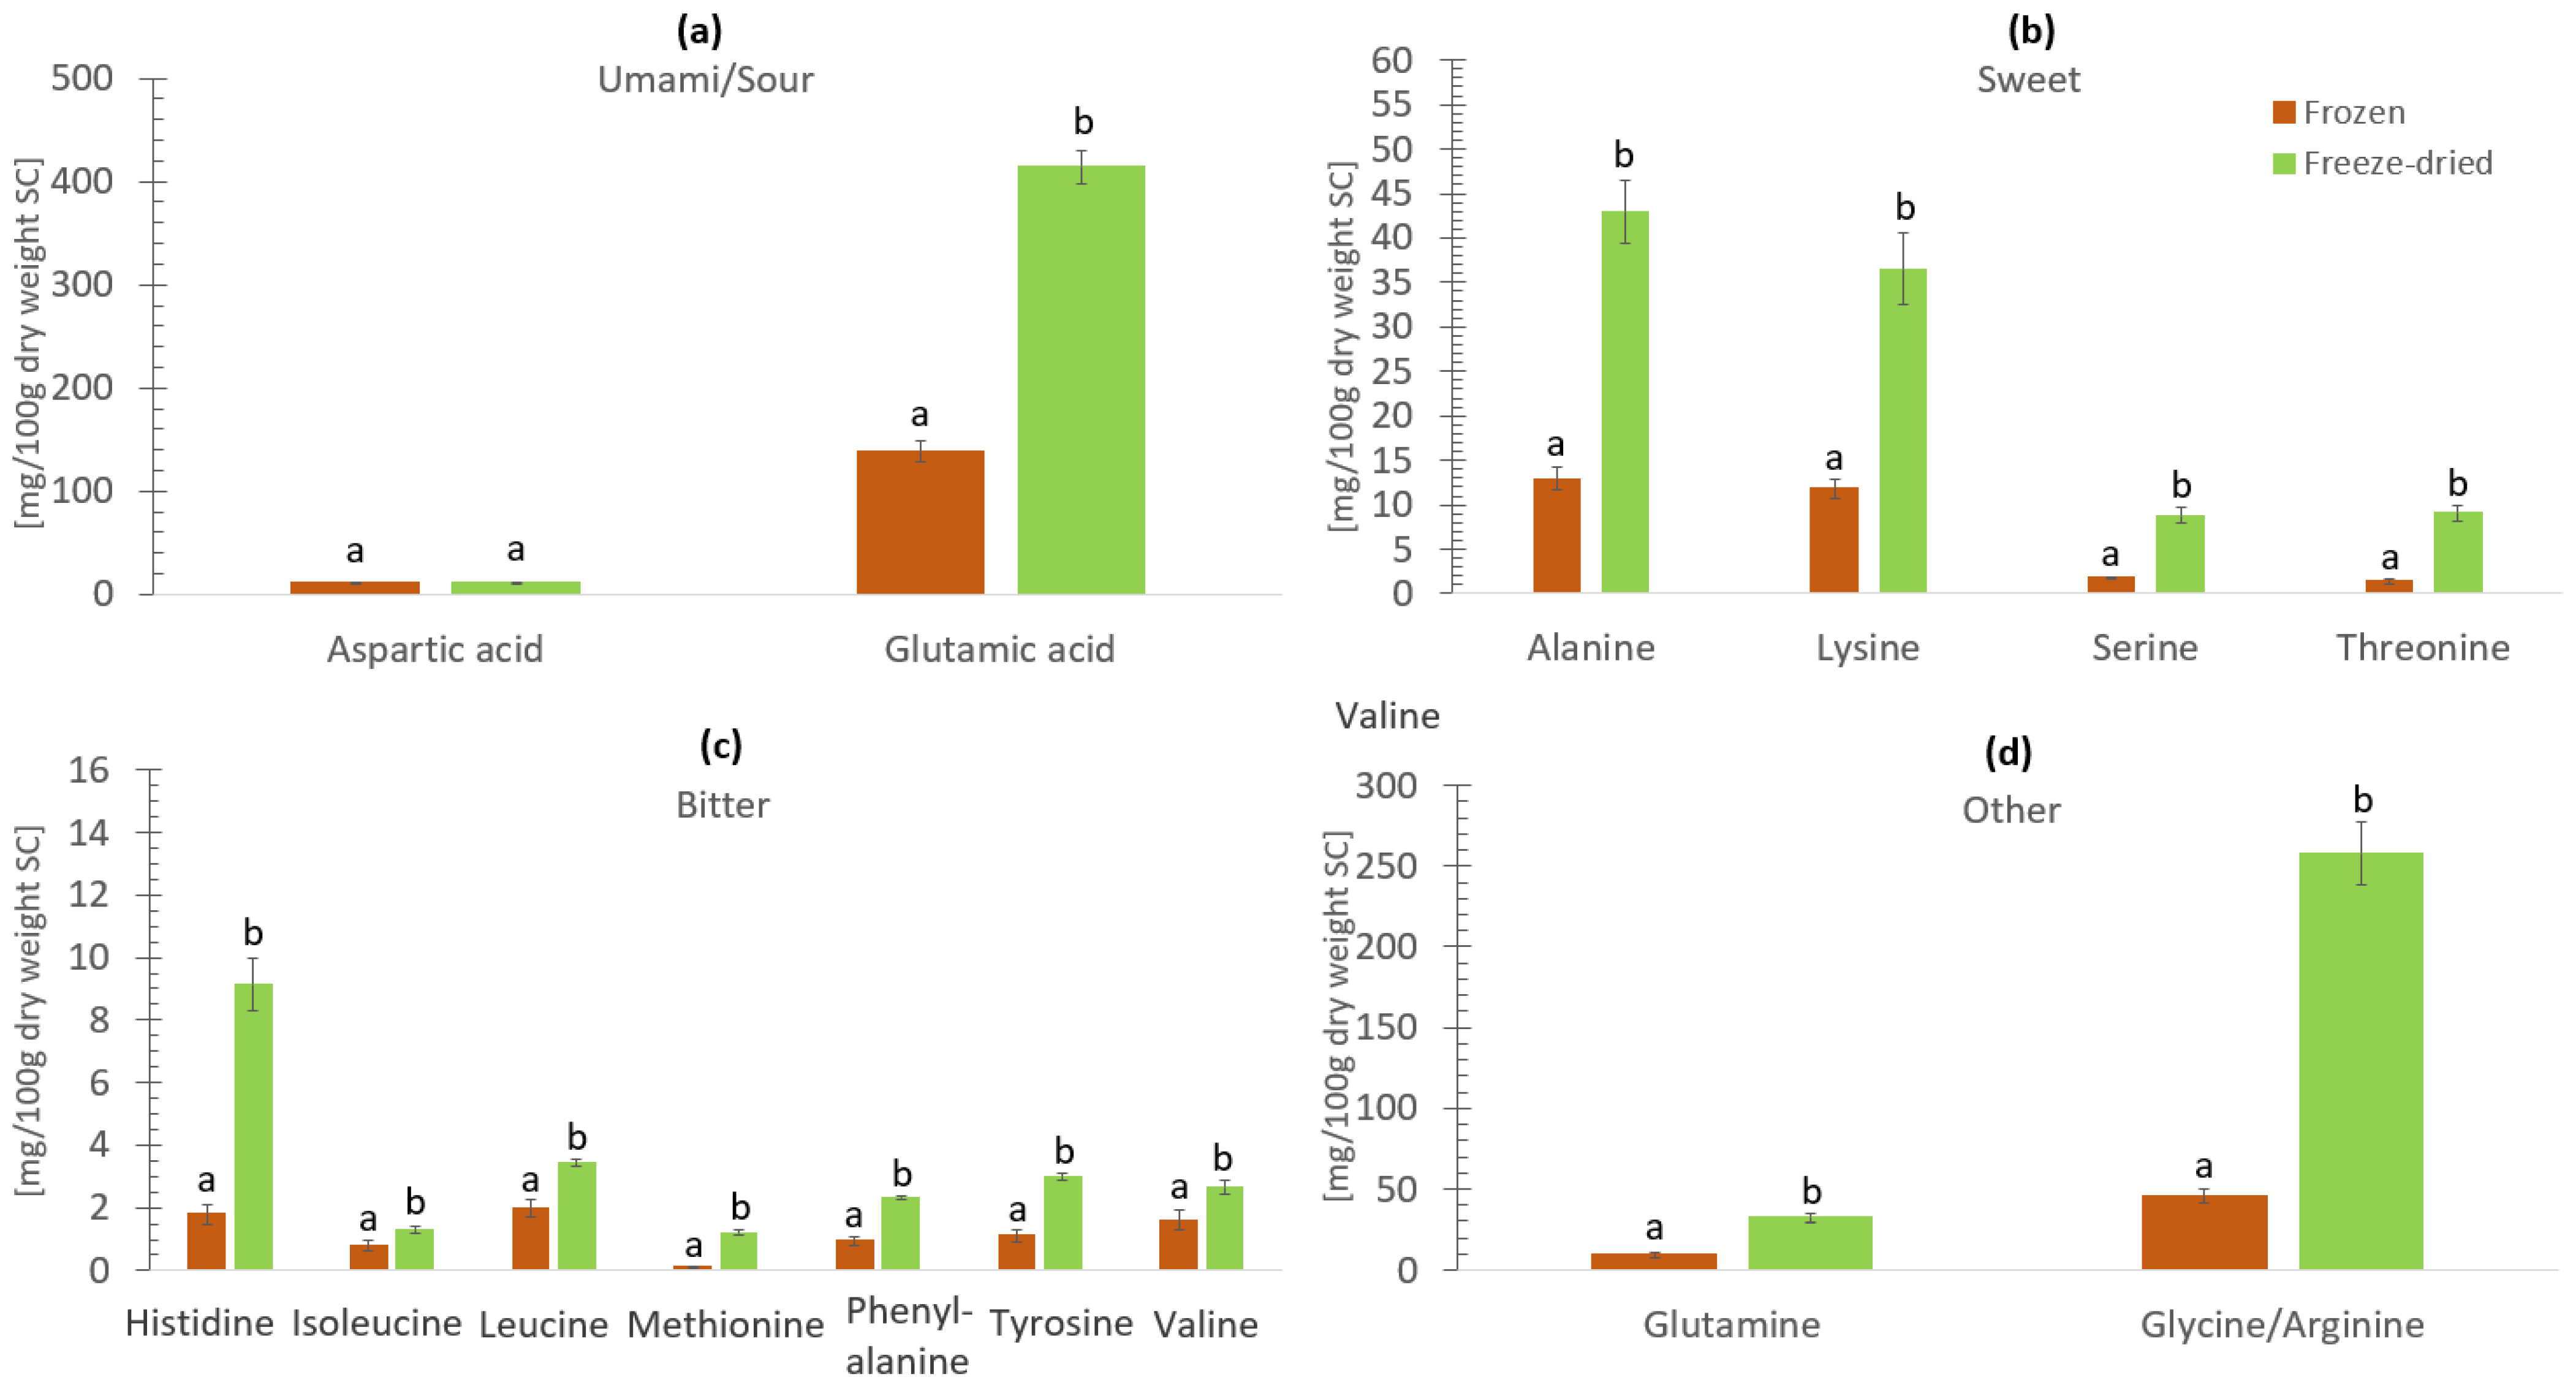
3.3. Free Amino Acids and Umami Flavor in Frozen and Freeze-Dried Materials

FAAs give rise to different flavors such as umami, sourness, bitterness, and sweetness. In Figure 3, the FAAs content in both frozen and freeze-dried samples are grouped corresponding to their respective flavors [13,37,38,39]. Glutamic acid had the highest concentration of FAAs in the ‘umami/sour’ group, followed by aspartic acid in both frozen and freeze-dried samples. Glutamic and aspartic acids are thought to impart a sour flavor, and contribute to the umami flavor in the presence of sodium salts like monosodium glutamate [40,41].
In both frozen and freeze-dried samples, alanine was the most abundant FAAs in the ‘sweet’ group, followed by lysine, threonine, and serine. Regarding bitter flavor, histidine constituted the highest concentration of FAAs in the ‘bitter’ group, followed by leucine, tyrosine, valine, phenylalanine, isoleucine, and methionine in both frozen and freeze-dried samples. In addition to having a bitter taste, phenylalanine and tyrosine have also been shown to improve the umami flavor [38]. Glutamine has been previously reported to contribute to both sweet and umami flavors [37]. Glycine is related to sweet flavor and arginine is related to bitter flavor [37]. As glycine and arginine could not be separated by the method in this study, and glutamine contributes to two different flavors, they are added to the ‘other’ flavor group. In addition, freeze-dried samples showed significantly higher (p < 0.05) FAAs concentrations in all flavor groups compared to frozen samples, except aspartic acid in the umami/sour group.
A major challenge to transitioning from regular diets to plant-based diets is the lack of umami taste in plant-based foods [42]. Seafoods have therefore been suggested to contribute with the highly sought umami flavor in plant-based diets [42]. Sea urchin [43], snow crab [44], squid [45], oyster [46], and scallop [47] contain high amounts of glutamic acid, which has been shown to increase the umami flavor.
A previous study reported high quantities of glutamic acid in the sea cucumber (Holothuria scabra) [48]. P. tremulus, in this study, contained high levels of glutamine, glutamic acid, and glycine. In addition, other compounds such as salts, sugars, bases, esters, organic acids, and peptides, and the synergy between these compounds may contribute to flavors in foods [37]. However, the components contributing to flavor may vary with processing method, environments, biochemical compositions, and species [38].
Drying by the use of elevated temperature has previously been reported to up-concentrate bitter compounds in raw materials [49]. Freeze-drying on the other hand, is known to be a more gentle process [50], maintaining heat-sensitive biomolecules, and nutrient composition [51,52] as well as the protein quality in materials such as sea cucumber (Stichopus japonicus) [53], but at the cost of high energy consumption and long drying times [53].
It has been found that the minimum threshold limit of flavors such as salty, bitter, umami, and sweet were at concentrations of 0.05, 0.08, 0.09, and 0.2 mg/L, respectively [54]. However, the taste perception threshold varies with body mass, sex, and age [55]. In this current study, the concentrations of umami/sour, bitter and sweet flavor found in both frozen and freeze-dried samples exceed the minimum taste perception threshold. Therefore, both frozen and freeze-dried samples may potentially contribute to the umami flavor and can be used as a taste enhancer or employed as a potential food ingredient.

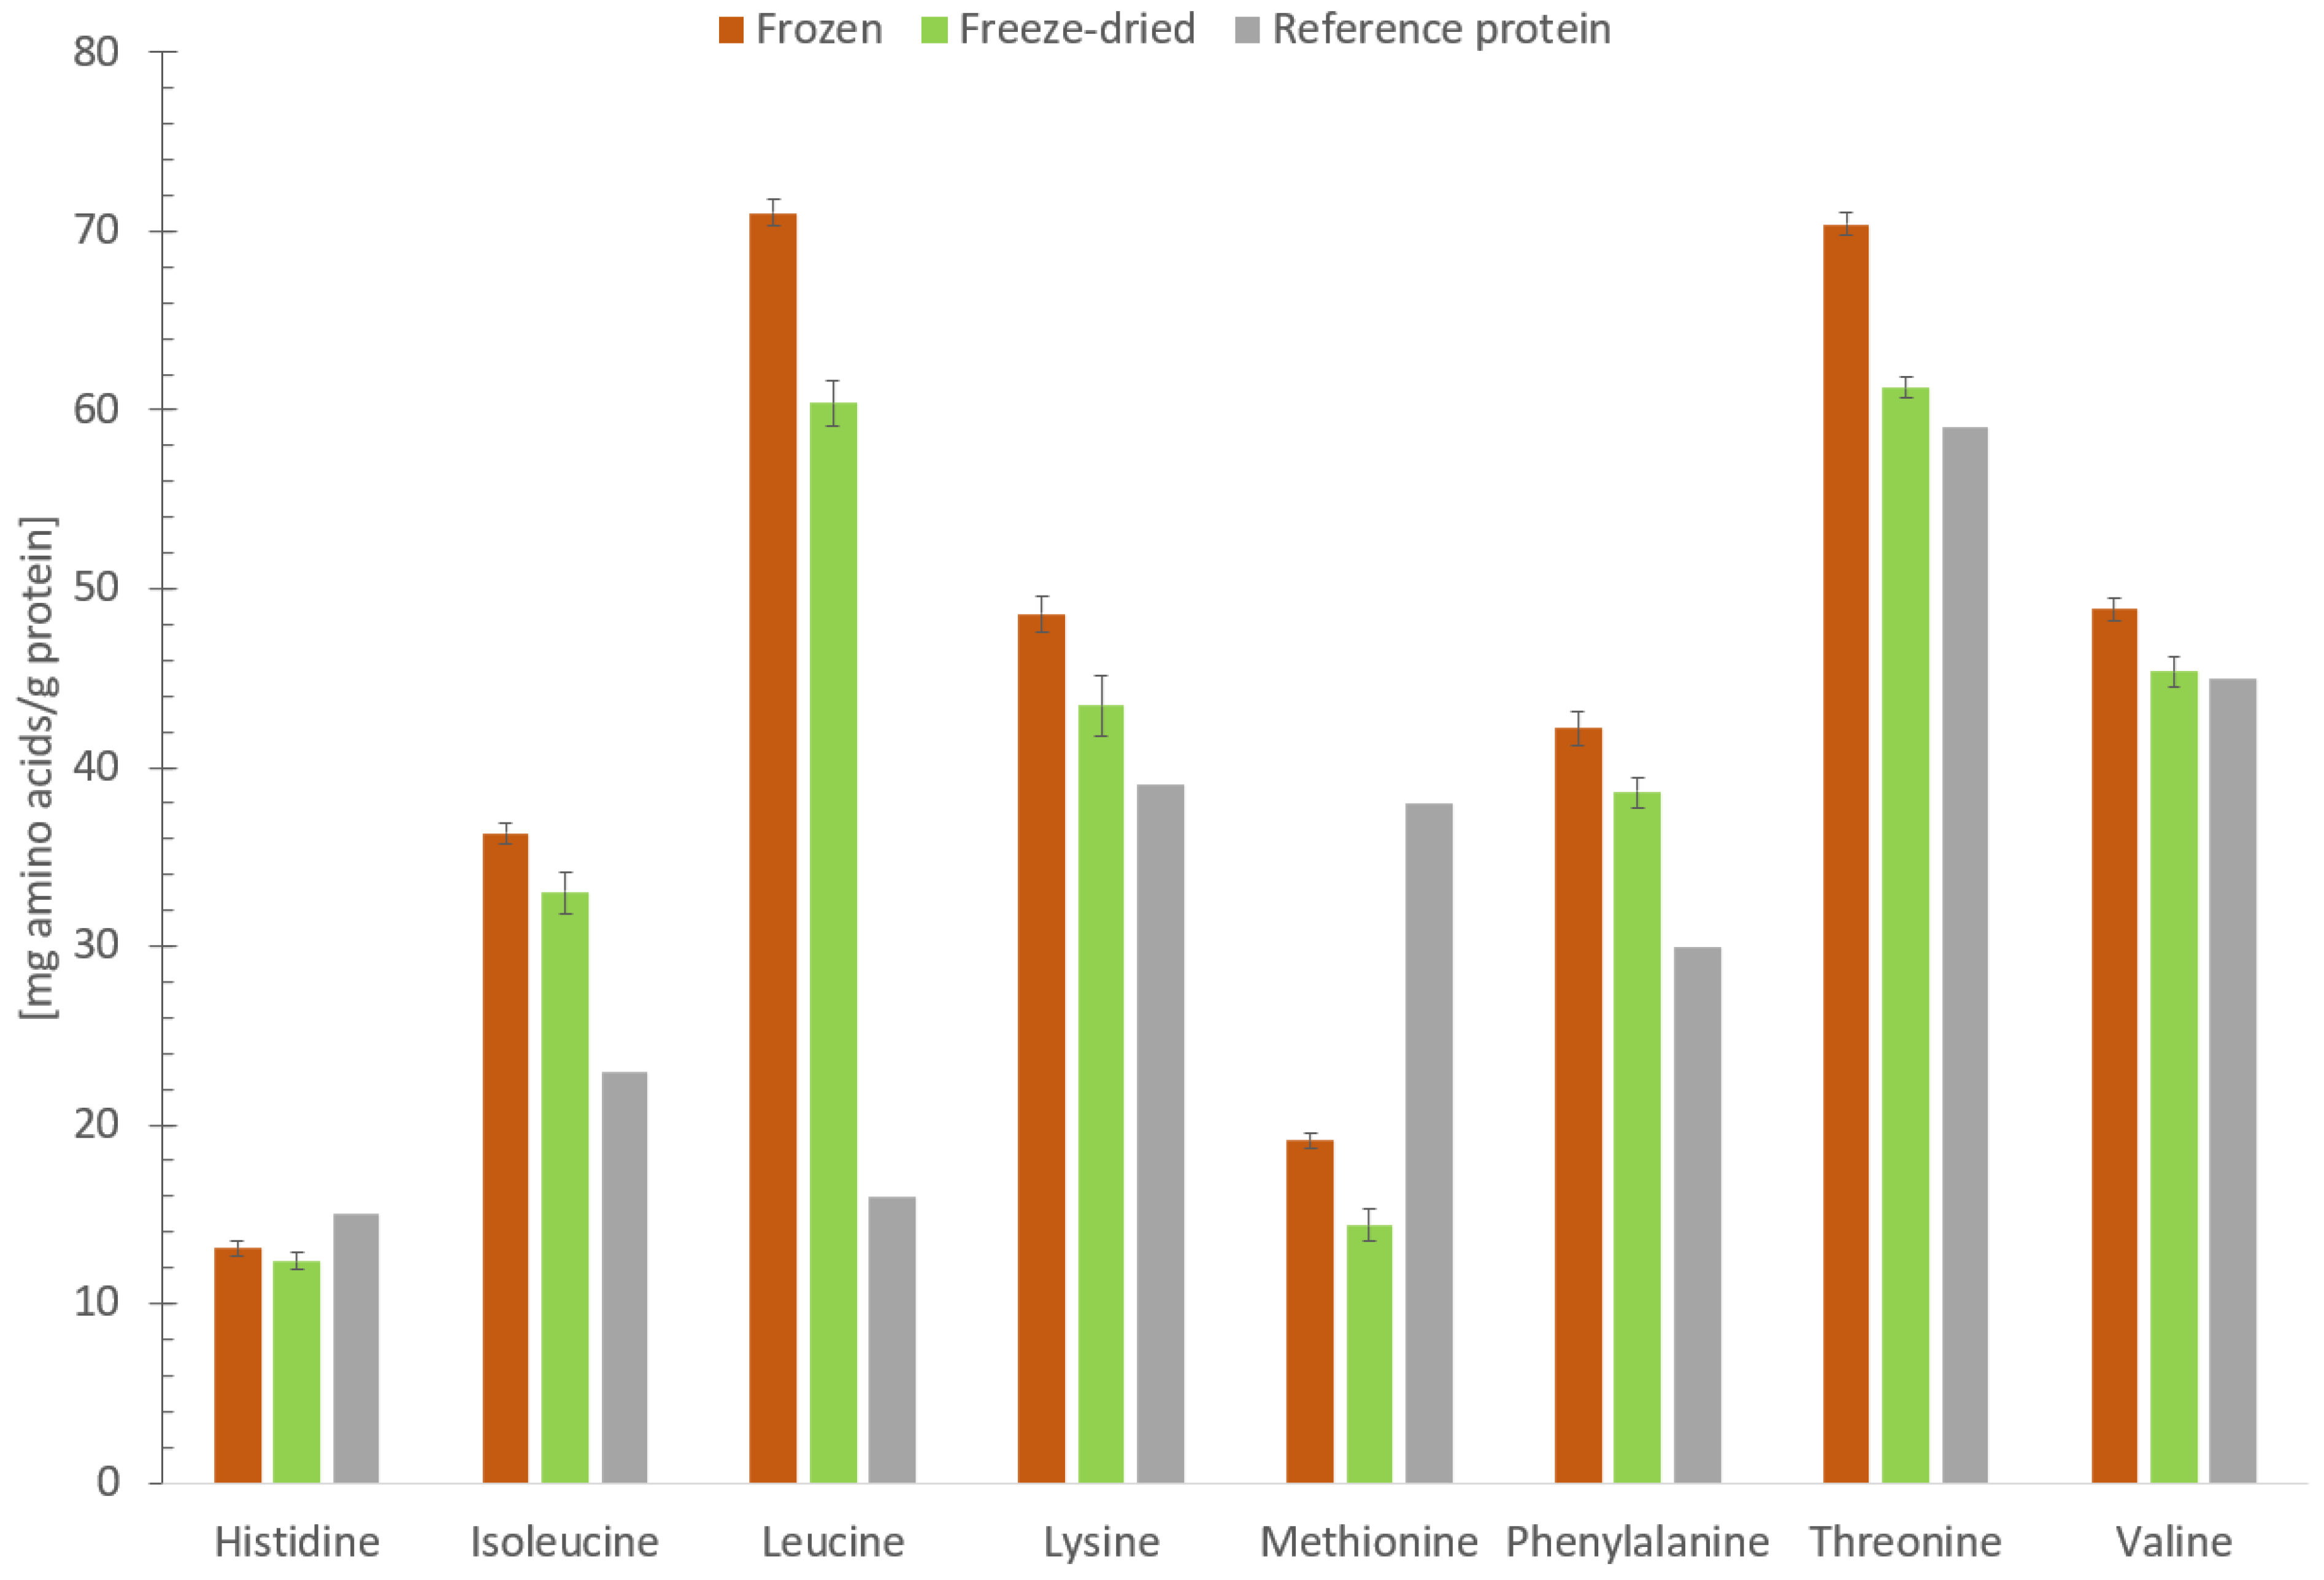
3.4. Protein Quality in Frozen and Freeze-Dried Materials

The quality of a protein is evaluated based on the content of essential amino acids (EAAs), as recommended by The Food and Agriculture Organization (FAO) and World Health Organization (WHO) [56]. In both frozen and freeze-dried samples, the chemical score was above 1.0 for all EAAs, except for methionine and histidine (Figure 4).
The level of EAAs in P. tremulus in this study were higher compared to previous studies of Holothuria scabra [57] and Apostichopus japonicus (except histidine) [58]. The same result was found in the study of orange-footed sea cucumber (Cucumaria frondosa) [13].

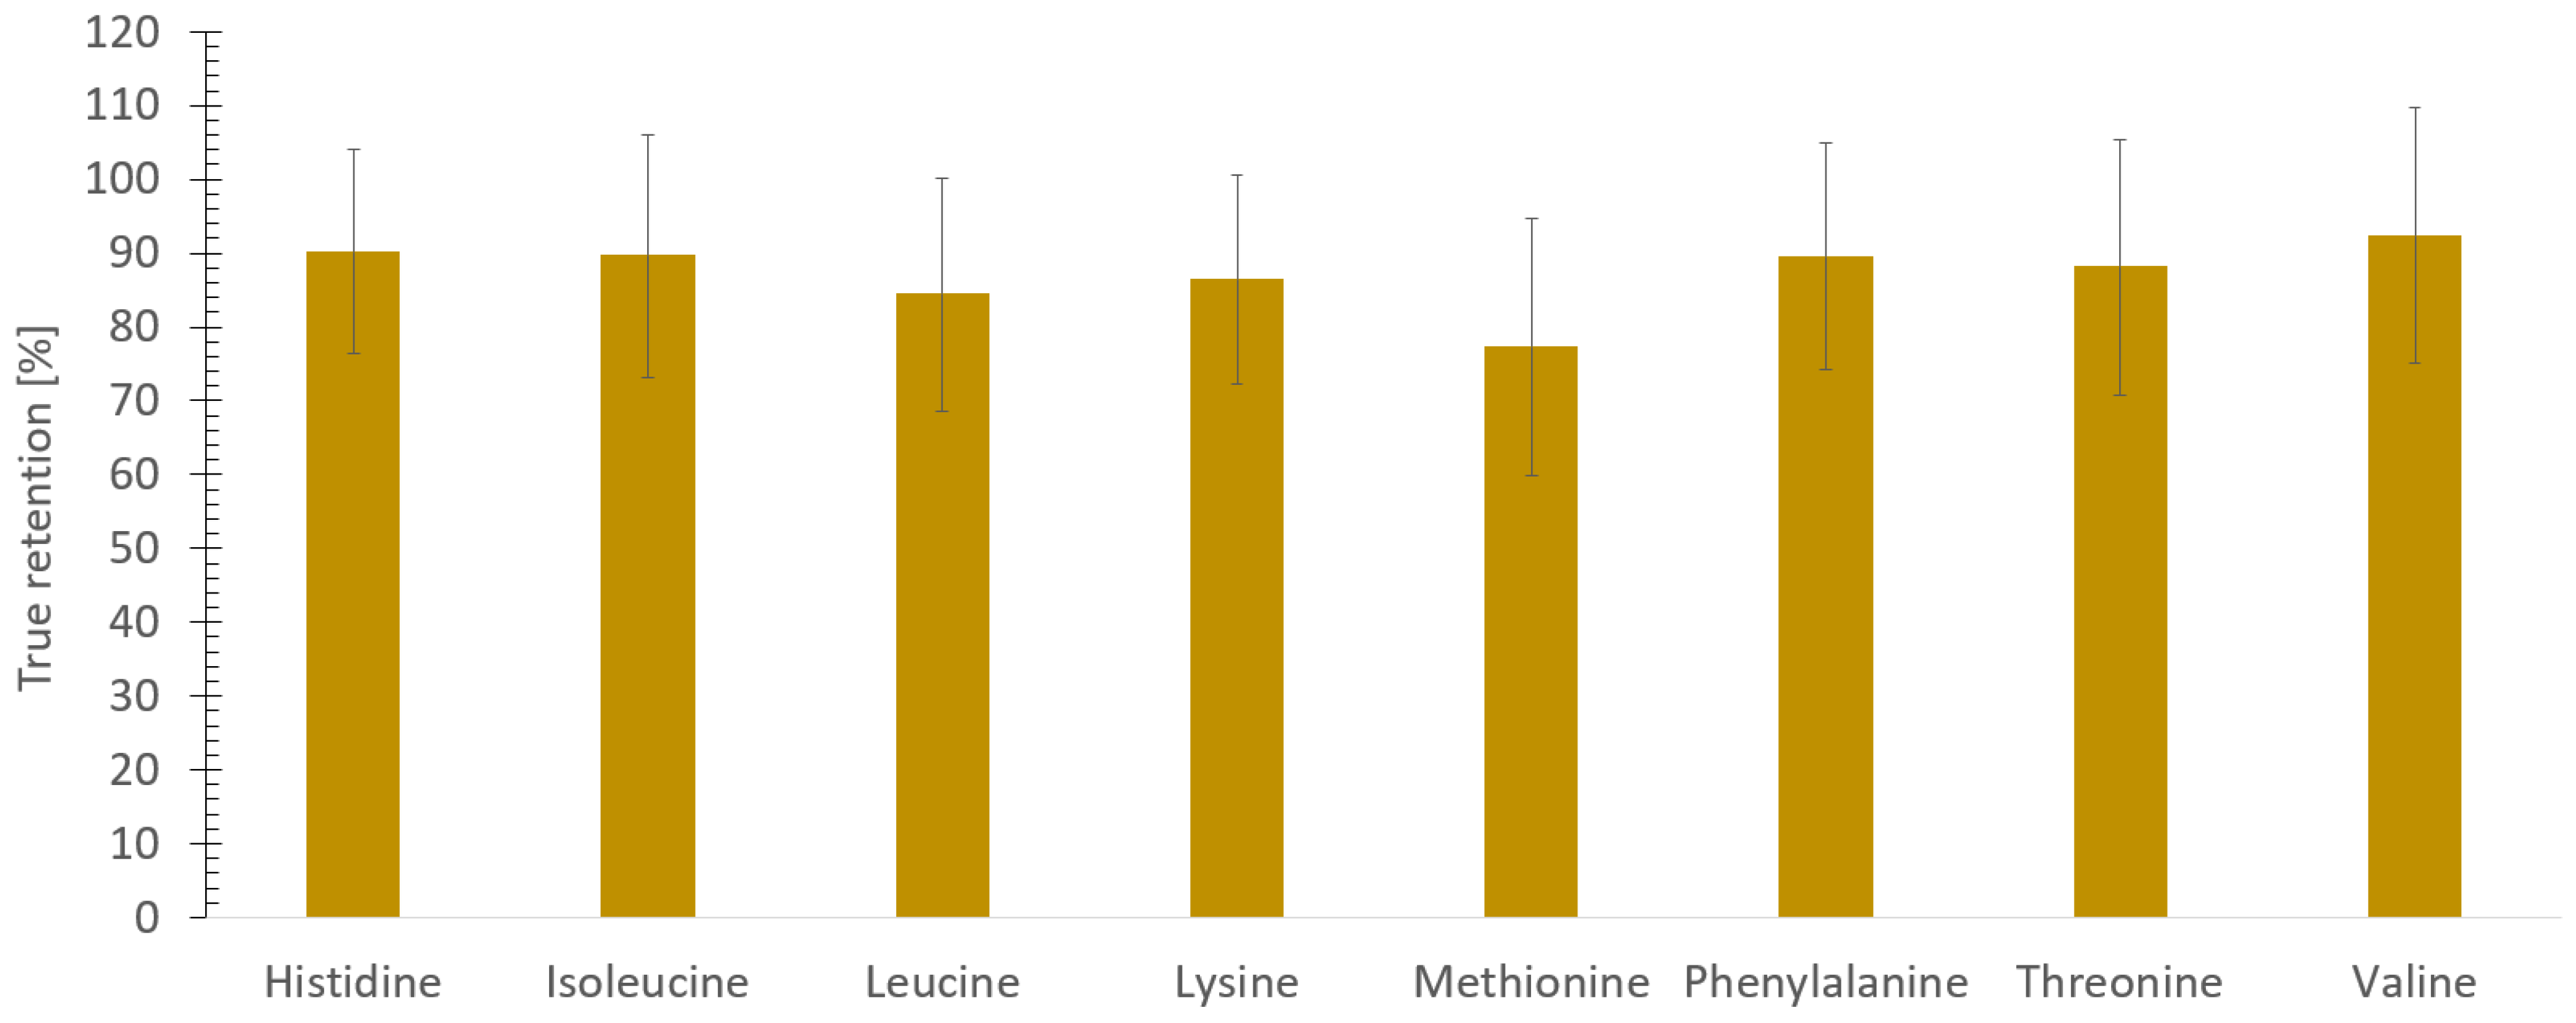
3.5. True Retention of Amino Acids during Freeze-Drying of Sea Cucumber

It has been previously reported that umami-dipeptides and related peptides may have a positive effect on the human body [59], hence it is relevant to see if there is any loss during the drying processes. When calculating true retention of amino acids, it was revealed that all amino acids remained in the powder after drying. The true retention (%) ranged between 77% and 92% among individual amino acids but with a relatively high standard error (Figure 5). Thus, the result in this study is inconclusive, but indicates that the freeze-drying process does not affect the red sea cucumber negatively and that nutrients are largely retained. The concentration of essential amino acids was calculated based on the average of 10 individual sea cucumbers, which could explain the high standard error. The concentration of amino acids could be influenced by each individual difference among the sea cucumbers, due to age, as previously described by Elvevoll et al. [33].

3.6. Antioxidant Activity in Frozen and Freeze-Dried Materials

Drying by the use of elevated temperature is a process that may imply thermal degradation and reduce the antioxidant activity in the raw materials. Freeze-drying is one of the most gentle drying processes, applied to increase the shelf-life and retain the nutrients of raw materials [13,50]. It has been previously shown that the freeze-drying process was the only treatment which did not reduce the antioxidant activity compared to normal drying and microwave-vacuum drying in strawberry [60]. Another study found that the freeze-drying process yielded the best quality of dried sea cucumber (Stichopus japonicus) [53]. Despite obtaining a good quality of food products using the freeze-drying process, the drying process has its drawbacks. The freeze-drying process is time consuming and costly, and hence, it is not always relevant in the industry [53]. Furthermore, the freeze-dried products could be more susceptible to lipid oxidation due to their porosity and exposure to oxygen in the food product after the removal of water [61].
The capability of a substance to decrease ferric (Fe3+) to ferrous (Fe2+) iron is evaluated by the ferric reducing antioxidant power (FRAP) assay [28]. The FRAP activity in both frozen and freeze-dried samples ranged between 1 and 3 mmol TE/100 g dry weight (Table 3). When calculating the FRAP activity of frozen samples based on dry weight, they showed significantly higher (p <  0.05) FRAP activity compared to freeze-dried samples. According to a previous study by Nursid et al. [62] on the antioxidant activity of dried sea cucumber, Holothuria edulis resulted in the highest FRAP activity, followed by Pearsonothuria graeffei and Stichopus herrmanni (48.5, 28.3, and 12.0 µmol Fe(II), respectively). The result in this study is lower compared to previous results. The reason for this difference could be due to the extraction and drying technique, resulting in a higher concentration [62], compared to the extract obtained in this study. However, the FRAP activity in both frozen and freeze-dried samples in this study exhibited similar FRAP activity compared to the protein hydrolysate of orange-footed sea cucumber (Cucumaria frondosa) [13], protein hydrolysate of fried herring (Clupea harengus) [63], and saithe (Pollachius virens) [64].
The ABTS assay evaluates a substance’s ability to reduce reactive oxygen species by electron transfer [29,31]. The ABTS activity ranged between 0.1 and 0.3 mmol propyl gallate equivalents (PGE)/g (Table 3). The freeze-dried samples exhibited the highest ABTS activity. A previous study found freeze-dried and hydrolysates of C. frondosa ranging between 2 and 13 µmol PGE/g dry weight in a sea cucumber [13].
The ORAC assay measures the ability of bioactive peptides to neutralize reactive oxygen species by hydrogen transfer [32]. The antioxidant activity ranged between 130 and 230 mmol TE/g (Table 3), where freeze-dried samples exhibited the highest ORAC activity. According to a study by Mildenberger et al. [65] on a peptide fraction of P. tremulus, the ORAC activity was found to be 0.4 mmol TE/µg protein. The ORAC activity found in protein hydrolysate of saithe (Pollachius virens) ranged from 331 to 558 µmol TE/g [64]. The ORAC activity is higher compared to previous results. Regardless, the ORAC activity is lower compared to a previous study by Vu et al. [13] on freeze-dried and hydrolysates of C. frondosa.

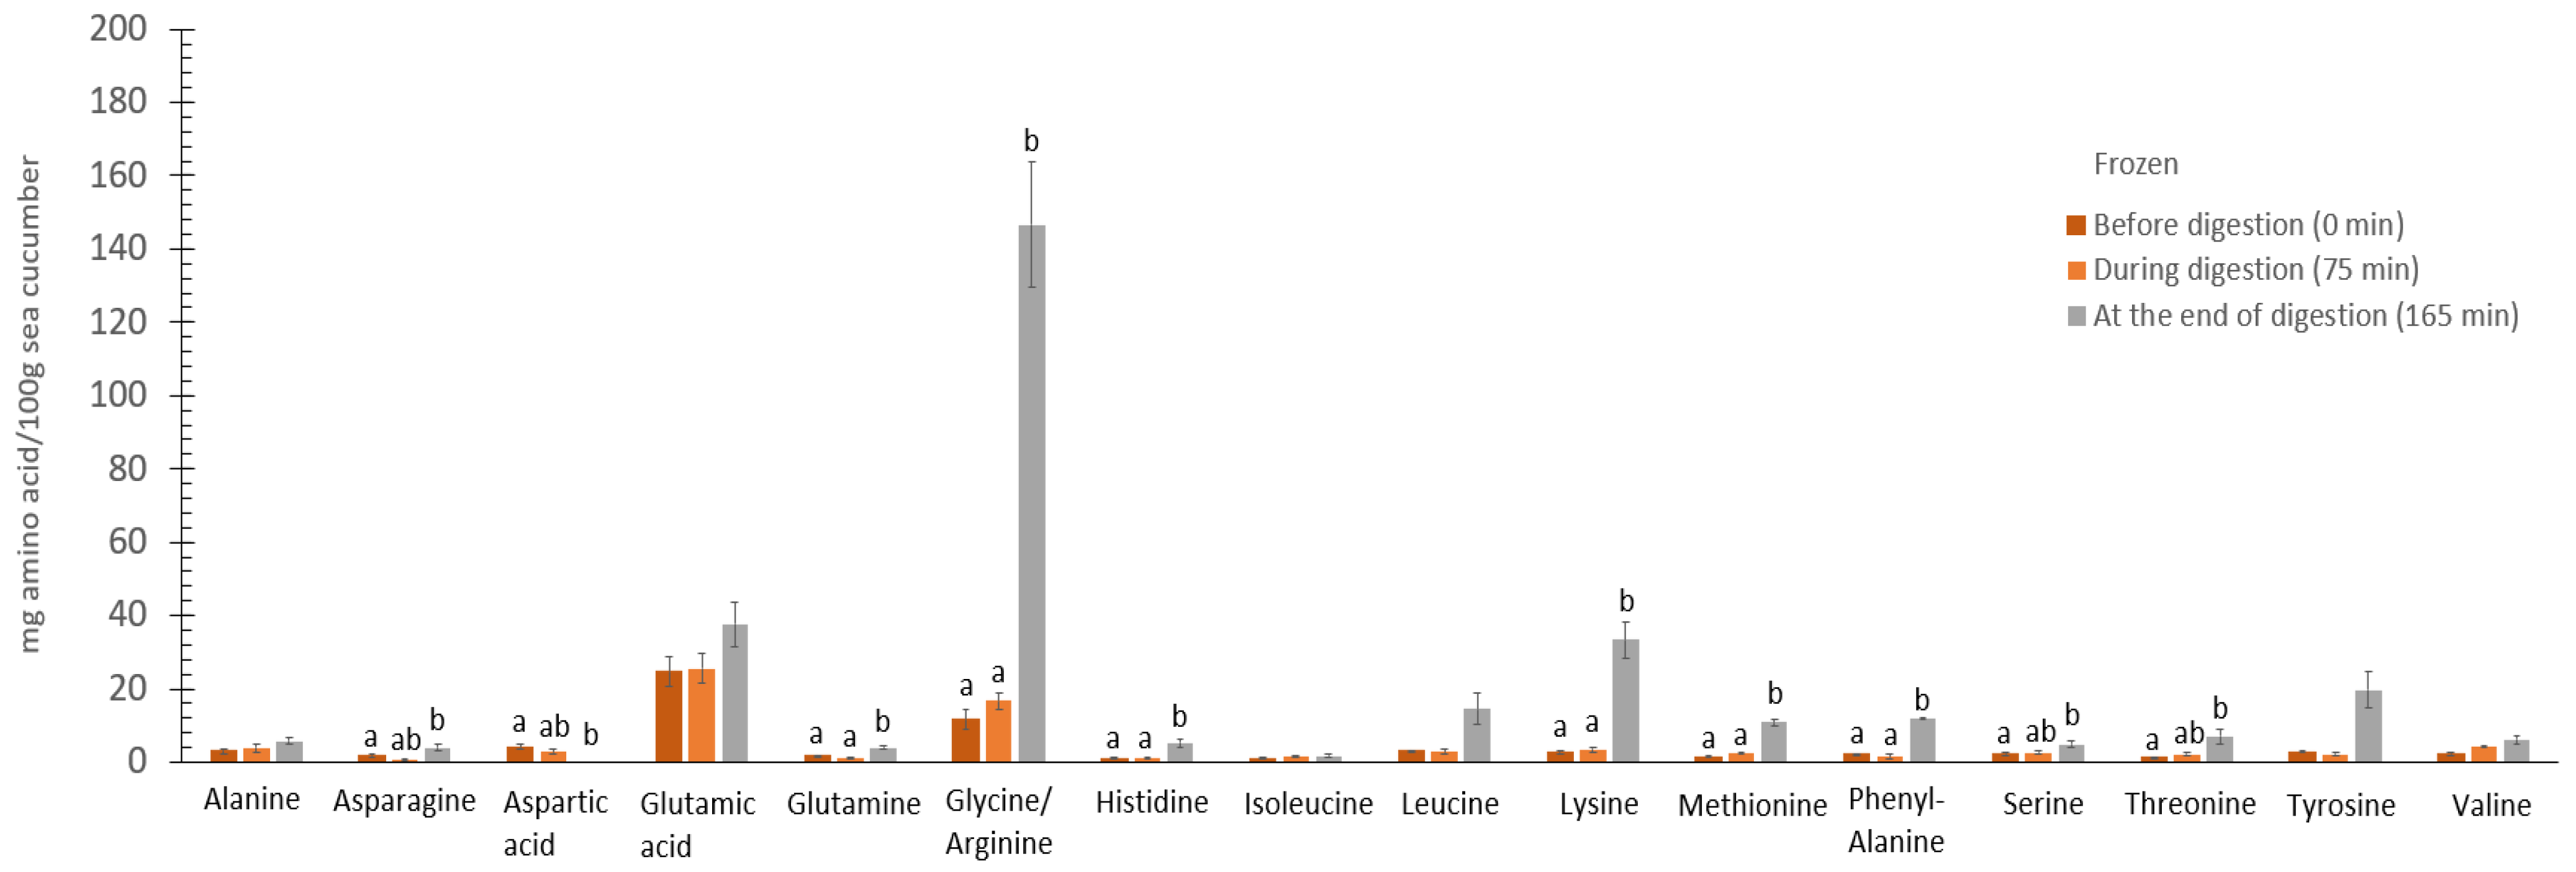
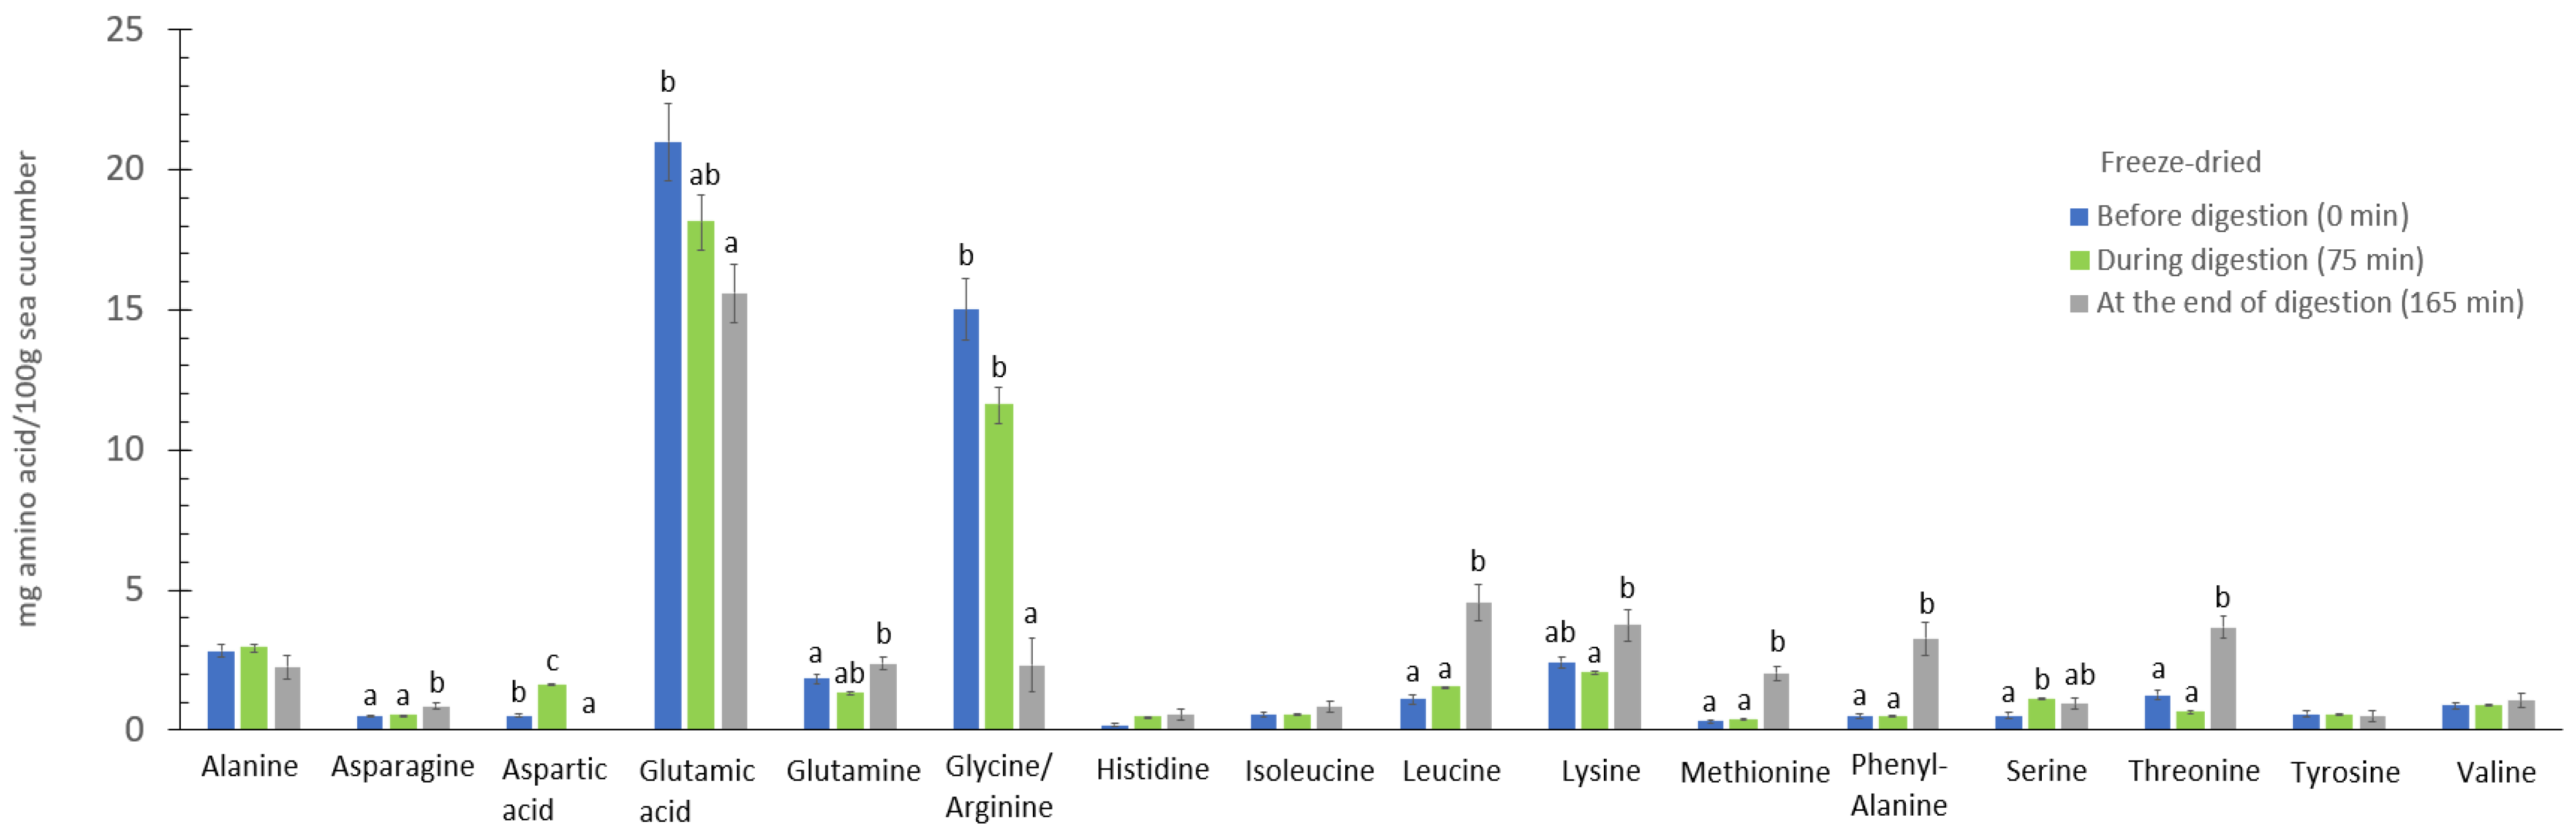
3.7. The Digestive Effect on Amino Acids

The release of FAAs from the digestive process of initially frozen samples ranged between 1 and 111 mg/100 g dry weight (Figure 6). Glutamic acid and glycine/arginine were the dominating FAAs throughout the digestive process. Amino acids such as alanine, histidine, isoleucine, tyrosine, and valine showed an insignificant increase in concentration at the end of digestion (165 min) compared to the beginning of digestion (0 min). However, asparagine, glutamine, leucine, lysine, methionine, phenylalanine, serine, and threonine showed a significant increase (p < 0.05) in FAAs concentration at the end of storage (165 min) compared to the beginning of the digestive process (0 min). Aspartic acid, glutamic acid, and glycine/arginine showed a significant decrease (p < 0.05) in concentration at the end of digestion (165 min) compared to the beginning of the digestive process (0 min).
The release of FAAs from the digestive process in freeze-dried samples ranged between 0 and 21 mg/100 g dry weight (Figure 7). Through the digestive process, glutamic acids were the dominating FAAs followed by glycine/arginine, except at the end of digestion (165 min). Amino acids such as asparagine, glycine/arginine, histidine, lysine, methionine, phenylalanine, serine, and threonine showed a significantly higher (p < 0.05) FAAs concentration at the end of digestion (165 min) compared to the beginning of digestion (0 min). However, aspartic acid showed a significantly lower (p  <  0.05) FAAs concentration at the end of digestion (165 min) compared to the beginning of digestion (0 min) due to no detection during analysis.
The FAAs concentration increased during digestion, with the largest increase seen in the large intestinal phase (165 min). Frozen samples showed an increase in all FAAs concentrations throughout the digestive process, except aspartic acid. Freeze-dried samples showed an increase in all FAAs concentrations throughout the digestive process, except aspartic acid, glutamic acid, and glycine/arginine. As already mentioned, asparagine and glutamine are determined during acid hydrolysis and are thus included as aspartic and glutamic acid. The digestion process and the availability of amino acids are determined by the effectivity of the digestive process, the food matrix, and the chemical composition of the raw material [66]. The decrease in glutamic acid and glycine/arginine could be due to changes in the composition, the availability of peptides, and the size of peptides during the digestive process [67].

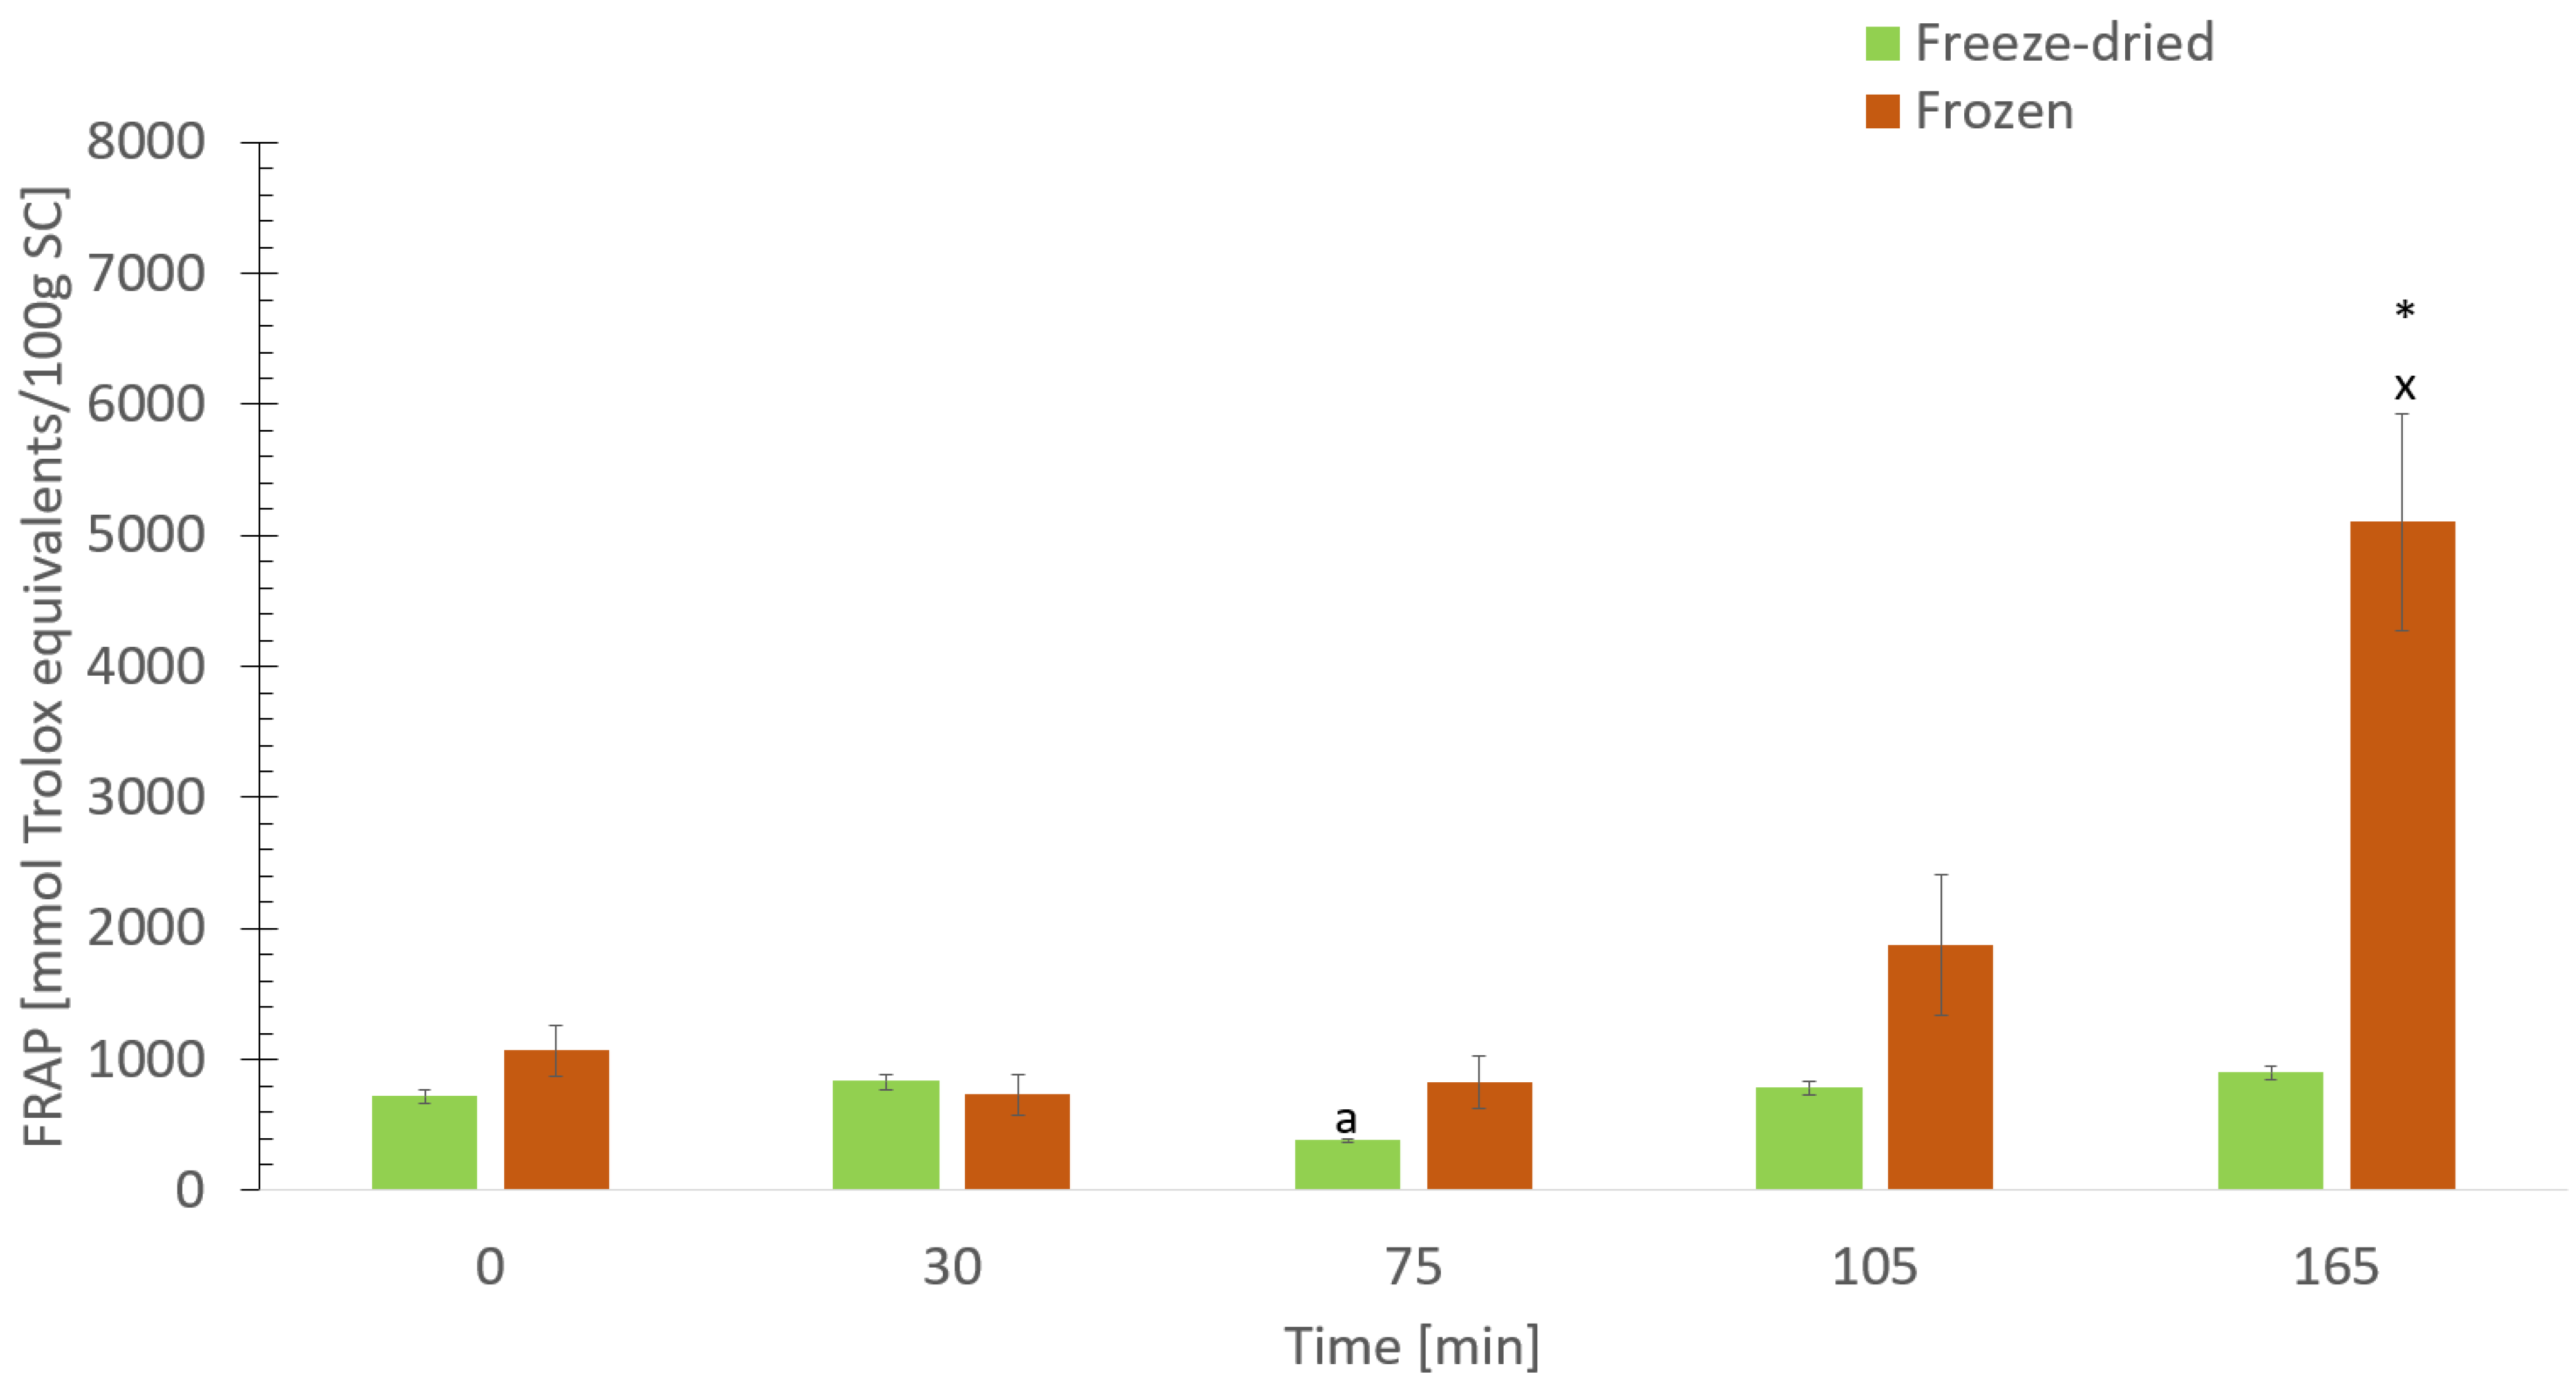
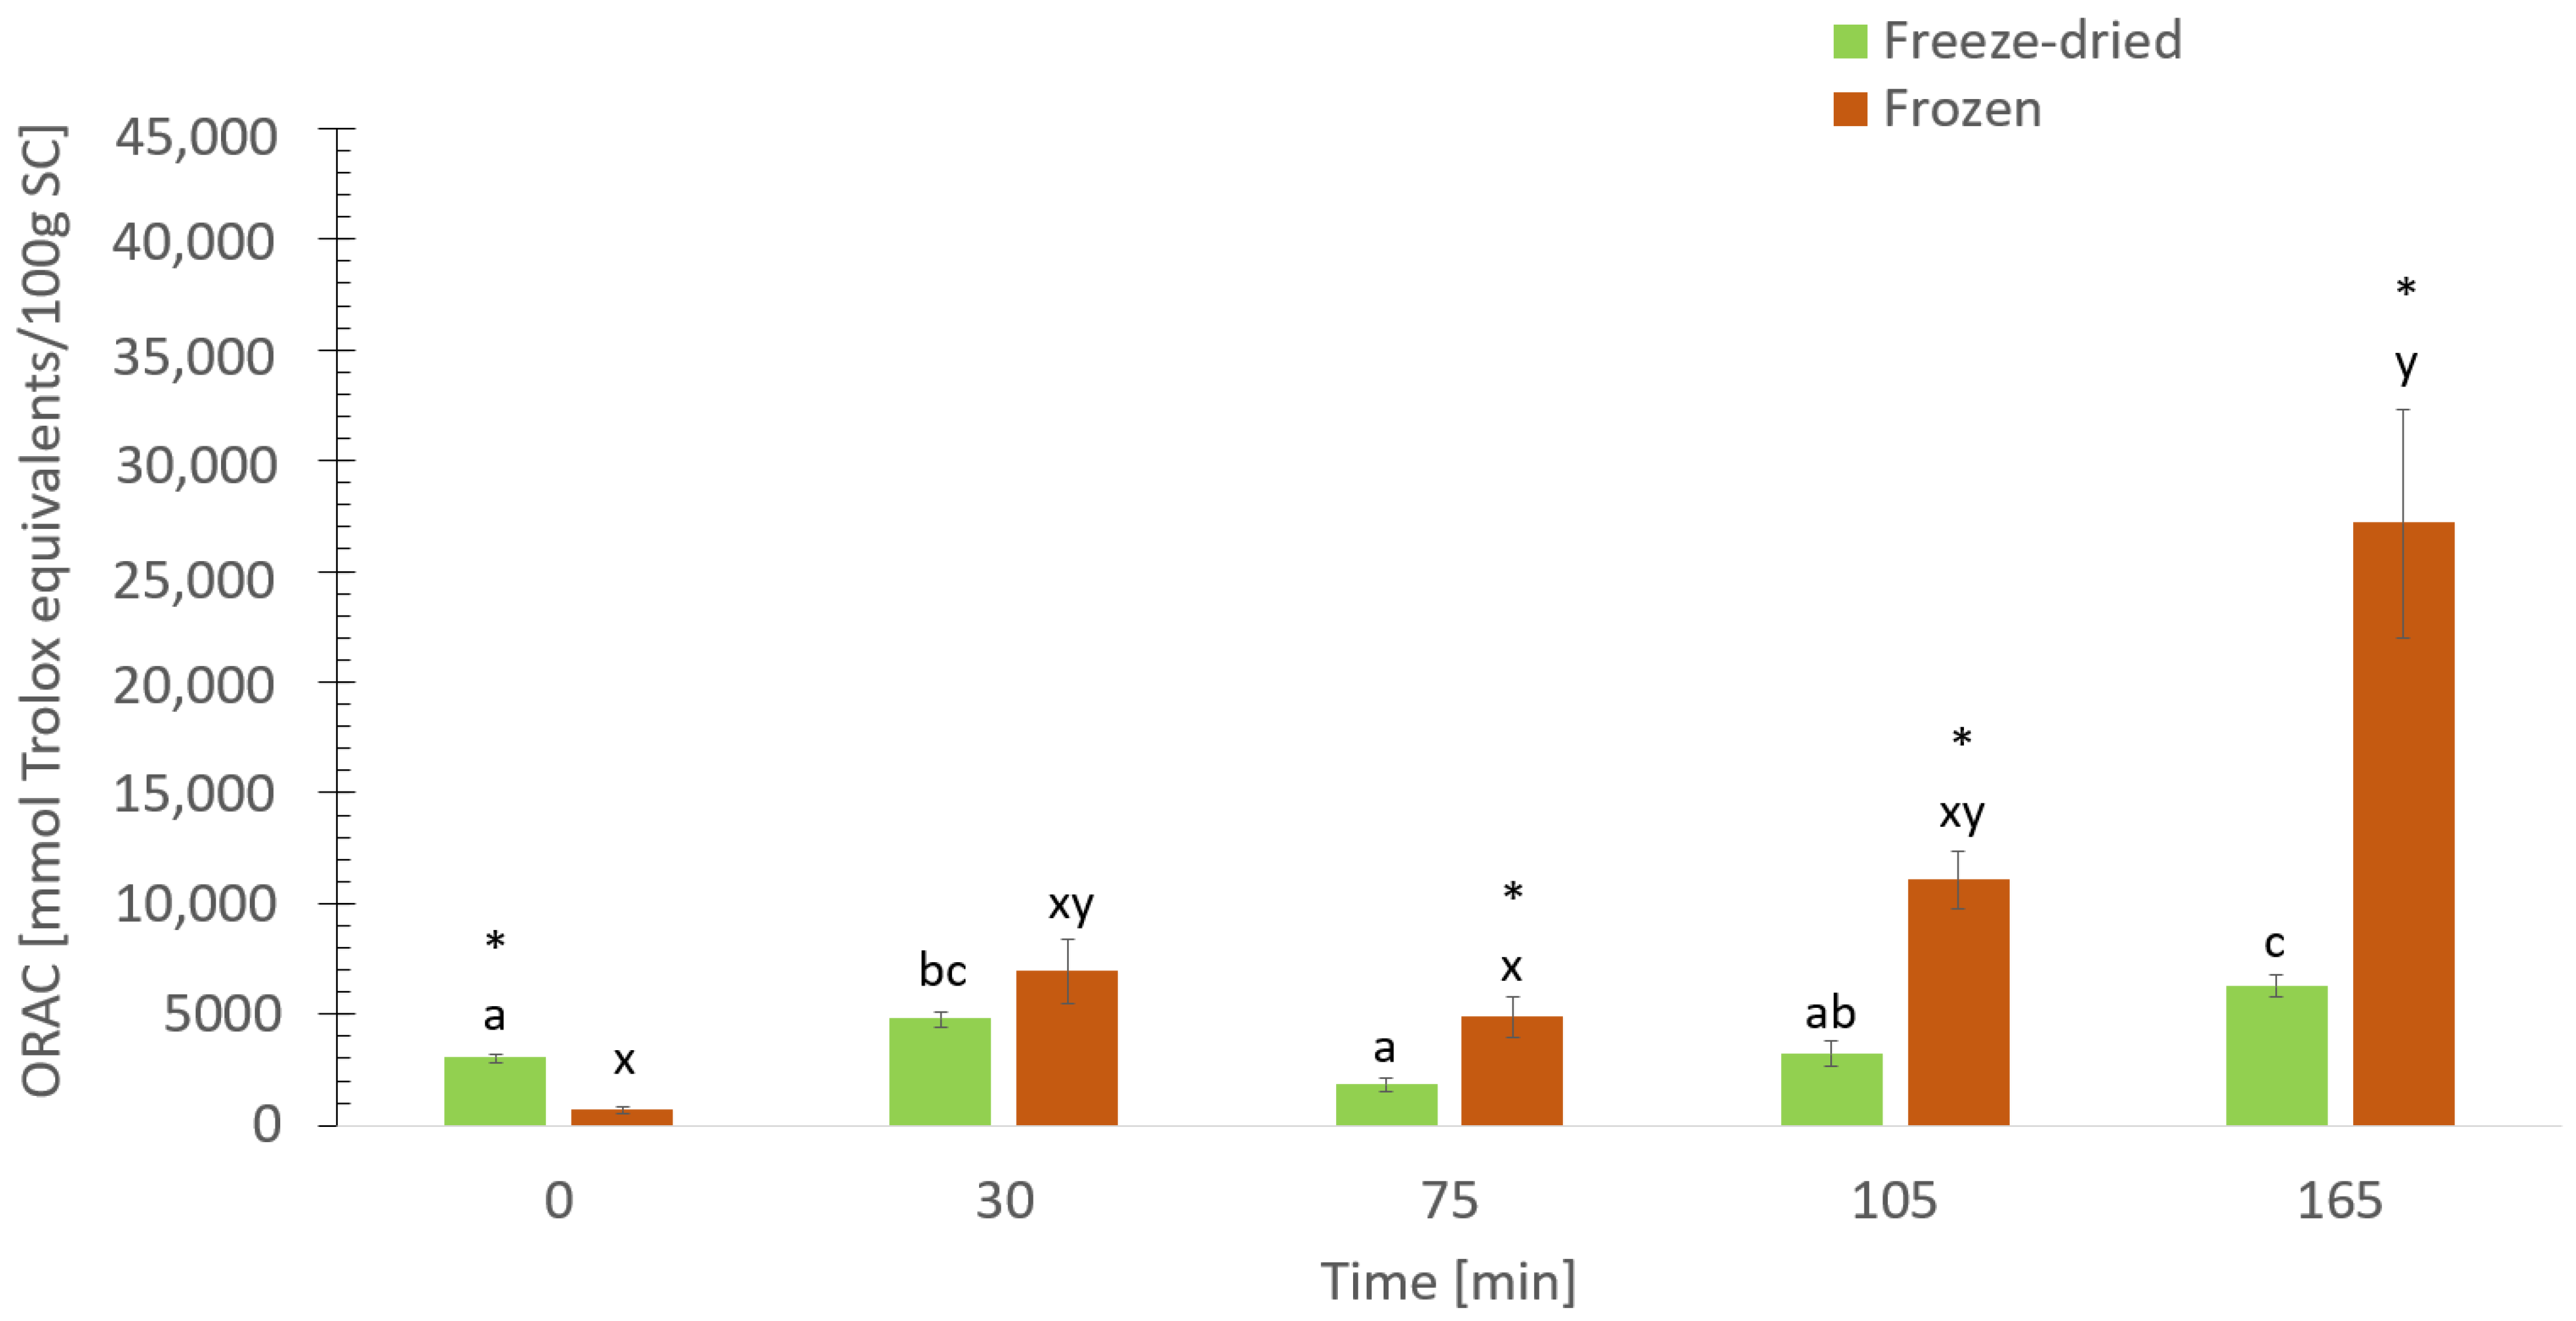
3.8. The Digestive Effect on Antioxidant Activity

The antioxidant activity in frozen and freeze-dried samples subjected to the gastrointestinal digestion process was measured by ferric reducing antioxidant power (FRAP), 2′-azino-bis-(3-ethylbenzothiazoline-6-sulfonic acid) (ABTS) and oxygen radical absorbance capacity (ORAC). The three antioxidant assays measure different mechanisms, at different conditions such as pH and temperature. As the human body has different processes, it is recommended to use different antioxidant assays to obtain the total overview of antioxidant activity in the raw material [68]. At five different time points (Figure 8), the FRAP activity in the frozen samples (dry weight) remained unchanged up until the near end of the digestive process (105 min), with a significant increase (p < 0.05) at the end of digestion (165 min). The FRAP activity in freeze-dried P. tremulus remained mostly stable. However, during digestion (75 min) of freeze-dried samples, the FRAP activity significantly decreased (p < 0.05), before significantly increasing (p < 0.05) throughout the rest of the digestive process. In addition, throughout the digestive process, no significant differences in FRAP activity were found between the frozen and freeze-dried samples, except at the end of the digestive process (165 min) where the FRAP activity of the frozen samples was significantly higher (p < 0.05) compared to the freeze-dried samples.
The exhibited ABTS (Figure 9) and ORAC (Figure 10) activity in both frozen and freeze-dried samples showed the same trend as the FRAP activity. Frozen samples showed a significantly higher (p < 0.05) ABTS activity at the end of the digestive process (165 min) compared to the previous time points. In addition, the ABTS activity in freeze-dried samples showed a significant decrease (p < 0.05) in ABTS activity during the digestive process (75 min) before a significantly increase (p < 0.05) in ABTS activity throughout the rest of the digestive process. Both frozen and freeze-dried samples showed a significantly higher (p  <  0.05) ORAC activity at the end of digestion compared to the beginning of the digestive process. Freeze-dried samples showed a significantly higher (p < 0.05) ORAC activity at the beginning (0 min) of digestive process compared to frozen samples. However, the frozen samples exhibited higher ORAC activity during digestion and at the end of the digestive process (p  <  0.05).
It has been shown previously that the antioxidant activity of P. tremulus increased during the digestive process [27,69]. The total antioxidant activity of proteins can be increased by breaking down the tertiary structure of the proteins to increase availability of amino acids with antioxidant activity [69]. This can be performed by enzymes, fermentation, or natural digestion [70].
The antioxidant activity measured by ORAC assay showed high variation between each replicate with high standard of error. One factor could be the measurement of ORAC activity, as a sensitive and unstable method with high dilution factors. Another factor could be the homogenization before the analysis, especially frozen samples during the digestive process.
The results from FRAP, ABTS, and ORAC assays indicate a stable increase in antioxidant activity throughout the digestive process, except for freeze-dried samples which showed a lowered activity at time point 75 min. This could be explained by the changes in the composition and size of peptides, and the presence of available free amino acids generated during the digestive process which affects the antioxidant activity [67]. From the start (0 min) to the middle (60 min) of the digestion process, pepsin has an optimal pH between 1 and 2. It breaks down proteins to free amino acids and short peptide chains [71]. After 75 min, the bile/pancreatin enzyme solution was added, and the antioxidant activity of some samples increased. At this time point in the simulated digestion process, the solution was exiting the gut and entering the small intestines. It is in the small intestines where peptides and free amino acids are absorbed, and this may explain why the antioxidant activity of some samples with added enzyme increased. Previously simulated digestion studies have shown that a mix of peptides from food proteins in combination with humans’ digestion enzymes during physiological conditions, causes an increase in antioxidant activity [72].

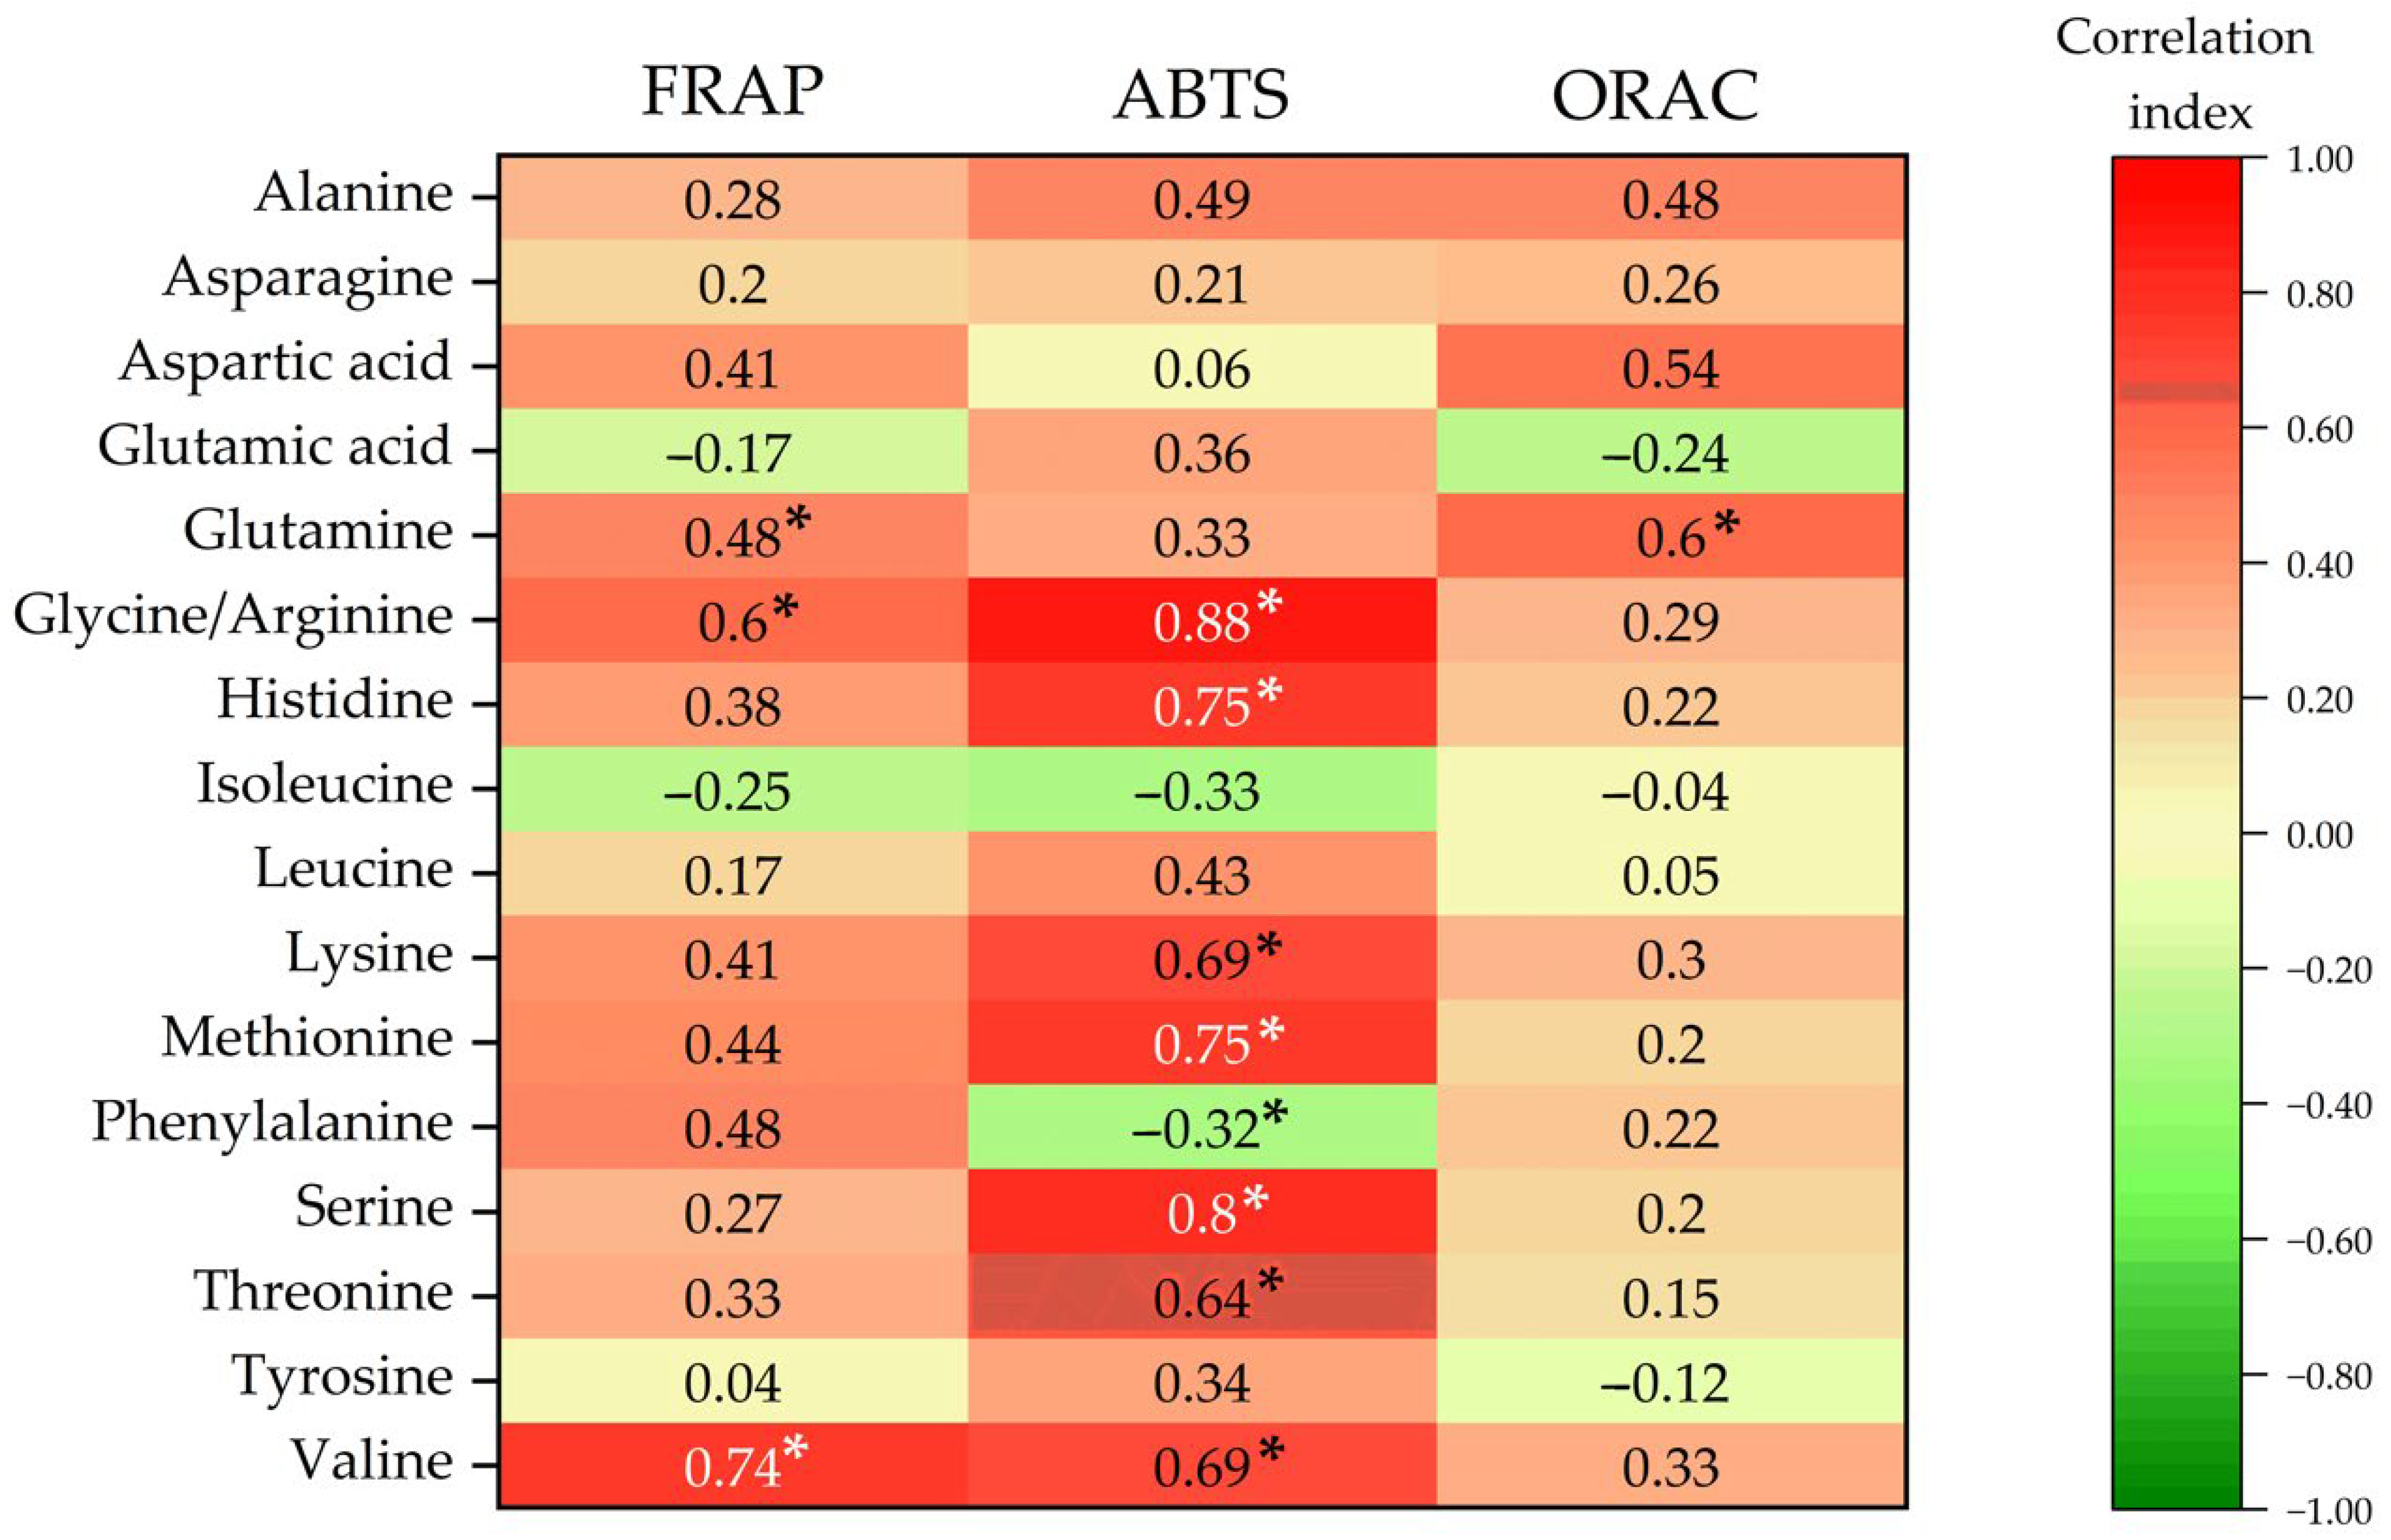
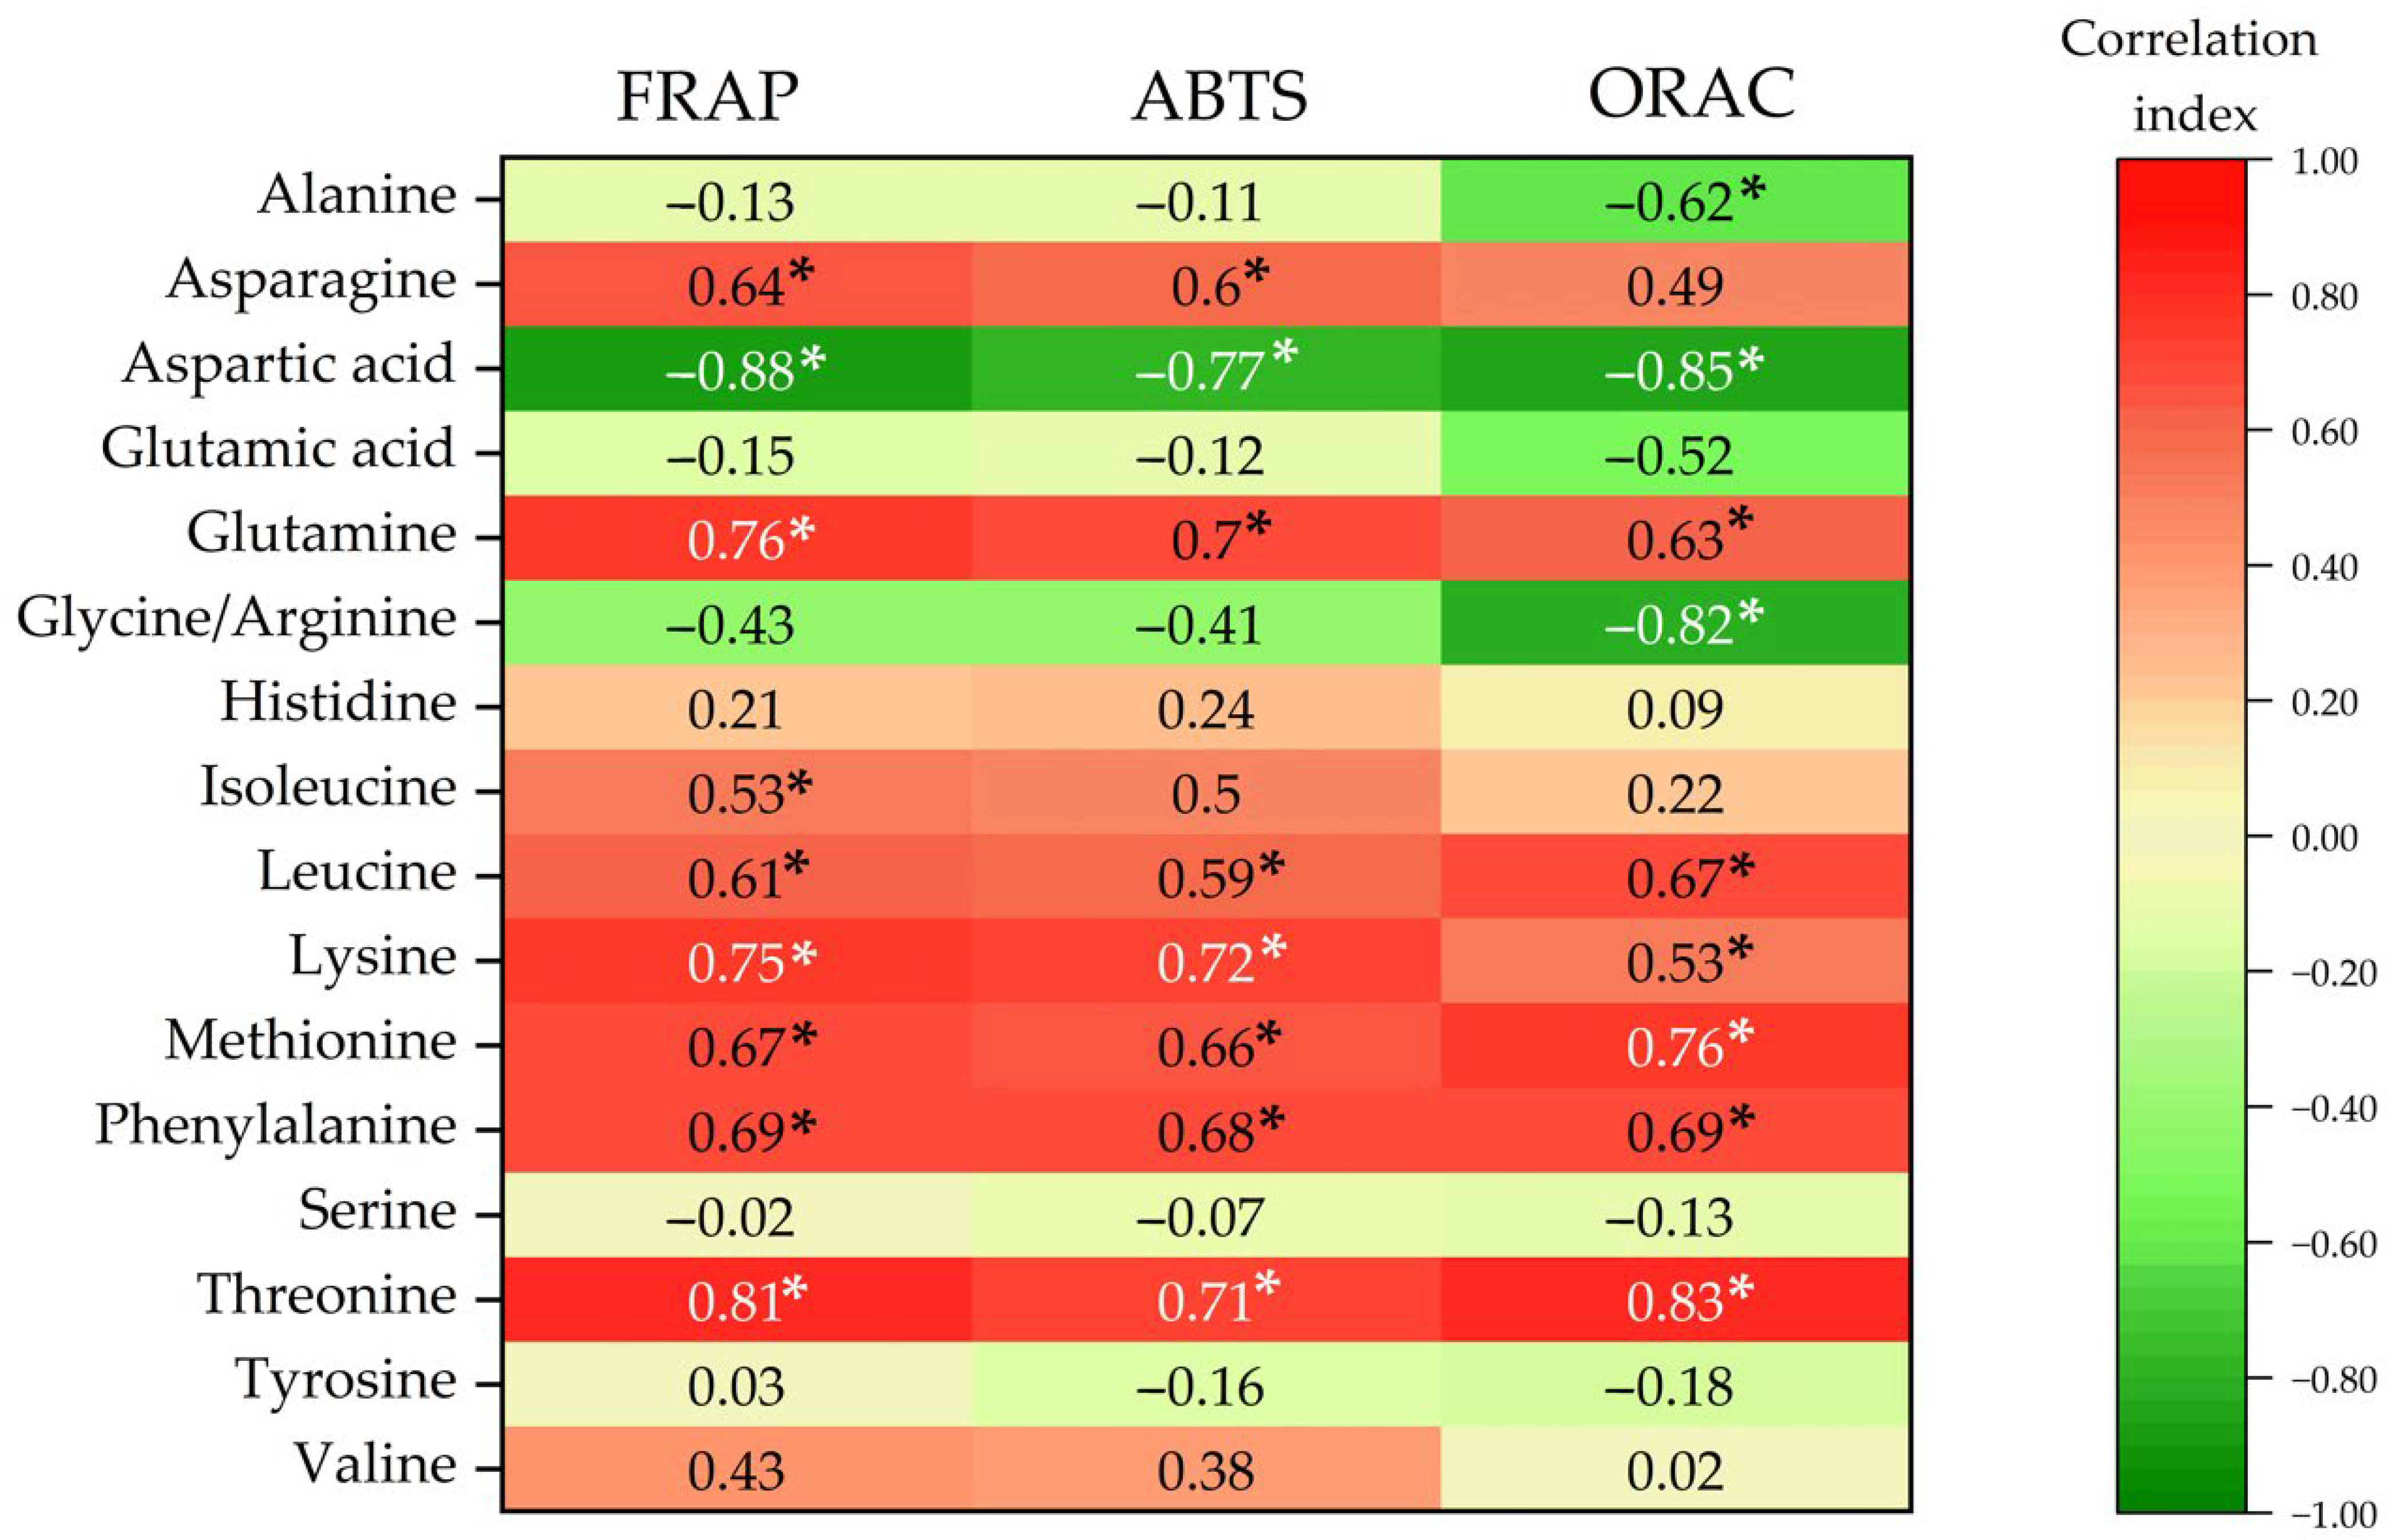
3.9. Release of Free Amino Acids Contributing to Antioxidant Activity

The release of FAAs from frozen samples correlated positively with the FRAP activity (p < 0.05) (Figure 11). Glutamine glycine/arginine and valine showed a positive correlation with the FRAP activity. The ABTS activity also correlated positively with the released FAAs through the digestive process (p < 0.05). Glycine/arginine, histidine, methionine, and serine showed a highly positive correlation, and lysine, threonine, and valine showed a moderately positive correlation with the ABTS activity. Glutamine was found to have a moderately positive correlation (p < 0.05) with the ORAC activity. The FAAs showed a moderate positively correlation with ABTS (p < 0.05) through the digestive process.
The release of FAAs from freeze-dried samples correlated both positively and negatively with the FRAP activity (p < 0.05) (Figure 12). Glutamine, lysine, and threonine showed a highly positive correlation, and asparagine, isoleucine, leucine, methionine, and phenylalanine showed moderate positive correlation with the FRAP activity. However, aspartic acid showed a highly negative correlation with the FRAP activity. The ABTS activity also correlated both positively and negatively with the released FAAs through the digestive process (p < 0.05). Glutamine, lysine, and threonine were found to have a highly positive correlation, and asparagine, leucine, methionine, and phenylalanine were found to have moderately positive correlation with the ABTS activity. However, aspartic acid was found to have a highly negative correlation with ABTS activity. At last, ORAC activity correlated both positively and negatively with the released FAAs through the digestive process (p < 0.05). Lysine showed a low positive correlation, glutamine, and phenylalanine showed a moderately positive correlation, and leucine, methionine and threonine showed a highly positive correlation with ORAC activity. However, alanine showed a moderately negative correlation, aspartic acid, and glycine/arginine showed a highly negative correlation with the ORAC activity.
The antioxidant activity is dependent on the amino acid sequence, the structure of the peptides, and the availability and the amount of hydrophobic amino acids in the peptides [70]. Previous studies have shown that the antioxidant activity is dependent on the composition of bioactive peptides, the sequences between 2 and 20 amino acids consisting of some reactive groups such as alanine, cysteine, glycine, histidine, leucine, methionine, tryptophan, tyrosine, and valine [27,70,73]. The results obtained in this study suggest that different amino acids contribute to the antioxidant activity measured by FRAP, ABTS, and ORAC assays. Further, some of the amino acids expected to contribute to the antioxidant activity did not correlate strongly with the antioxidant assays. This influence on antioxidant activity may be affected by the presence of FAAs, as well as the composition and the size of peptides generated during the digestive process [67].
There were some amino acids in the freeze-dried samples which showed a negative correlation with the three different antioxidant assays. The antioxidant activity is supposed to increase with the increase in certain amino acids such as alanine, aspartic acid, and glycine [70,74,75]. In addition, glutamic acid [76] and arginine [77] have been previously shown to have an indirectly positive effect on antioxidant activity regulation. It is important to note that our study has limitations to determine the relationship between amino acids and antioxidant activity due to several factors, such as the complexity of biological systems, the homogeneity during the digestive process, and the environmental conditions. Even though several studies have uncovered the antioxidant potential of sea cucumbers [62], more studies are needed to verify the antioxidant activity in P. tremulus during the digestive process.

4. Conclusions

The aim of this study was to evaluate protein quality and investigate the changes in antioxidant activity from frozen and freeze-dried red sea cucumber (Parastichopus tremulus) subjected to digestion, using an in vitro digestion model. The protein content in P. tremulus, although low, was of very high quality, suggesting that P. tremulus could be used as a potential protein source. The amino acids in freeze-dried samples were largely retained and were not affected negatively after the freeze-drying process. The antioxidant activity in frozen samples showed an increase in all three antioxidant assays, while the freeze-dried samples only showed an increase in one of the assays during the digestive process. Some specific amino acids were identified as correlating to antioxidant activity. This indicates that P. tremulus could be used as an antioxidant. A high content of free amino acids related to umami, bitter, sour, and sweet flavor suggests that this sea cucumber may contribute as a flavor enhancer in foods. This study implies that P. tremulus may provide potential functional properties, such as contributing as a potential protein source, antioxidant activity, and as a potential food flavor enhancing ingredient. Further study is recommended to verify the antioxidant activity of P. tremulus during the digestive process.

Author Contributions

Conceptualization, D.T.V. and I.-J.J.; methodology, D.T.V.; investigation, D.T.V. and M.C.K.; data curation, D.T.V. and I.-J.J.; writing—original draft preparation, D.T.V.; writing—review and editing, E.F, I.-J.J. and E.O.E.; visualization, D.T.V.; supervision, I.-J.J., E.F. and E.O.E.; All authors have read and agreed to the published version of the manuscript.

Funding

This research was funded by the Norwegian University of Science and Technology (NTNU), and by UiT—The Arctic University of Norway through the project SECURE Cristin grant ID 2061344.

Institutional Review Board Statement

Not applicable.

Informed Consent Statement

Not applicable.

Data Availability Statement

The data are available upon request.

Acknowledgments

The total and free amino acid content were analyzed by Siri Stavrum, NTNU.

Conflicts of Interest

The authors declare no conflicts of interest.

References

  1. Lobine, D.; Rengasamy, K.R.; Mahomoodally, M.F. Functional foods and bioactive ingredients harnessed from the ocean: Current status and future perspectives. Crit. Rev. Food Sci. Nutr. 2022, 62, 5794–5823. [Google Scholar] [CrossRef] [PubMed]
  2. Admassu, H.; Zhao, W.; Yang, R.; Gasmalla, M.; Alsir, E. Development of functional foods: Seaweeds (algae) untouched potential and alternative resource—A review. Int. J. Sci. Technol. Res. 2015, 4, 108–115. [Google Scholar]
  3. Golden, C.D.; Koehn, J.Z.; Shepon, A.; Passarelli, S.; Free, C.M.; Viana, D.F.; Matthey, H.; Eurich, J.G.; Gephart, J.A.; Fluet-Chouinard, E. Aquatic foods to nourish nations. Nature 2021, 598, 315–320. [Google Scholar] [CrossRef] [PubMed]
  4. Zhang, L. Ranching sea cucumbers to repair the oceans—And improve human health. Nature 2023, 617, 856. [Google Scholar] [CrossRef]
  5. Wirawati, I.; Pratiwi, R.; Widyastuti, E.; Ibrahim, P.S. Commercial sea cucumber trading status in Indonesia. Aquac. Aquar. Conserv. Legis. 2021, 14, 3204–3216. [Google Scholar]
  6. Kjerstad, M.; Bjørkevoll, I.; Christophersen, G. Sesonal Variation in Quality of Red Sea Cucumber—A Novel Seafood Product in Møre and Romsdal; Report No. MA 20-02; Møreforskning AS: Ålesund, Norway, 2020; pp. 1–51. [Google Scholar]
  7. Rasyid, A.; Yasman, Y.; Putra, M.Y. Current prospects of nutraceutical and pharmaceutical use of sea cucumbers. Pharmacia 2021, 68, 561. [Google Scholar]
  8. Purcell, S.W.; Mercier, A.; Conand, C.; Hamel, J.F.; Toral-Granda, M.V.; Lovatelli, A.; Uthicke, S. Sea cucumber fisheries: Global analysis of stocks, management measures and drivers of overfishing. Fish Fish. 2013, 14, 34–59. [Google Scholar] [CrossRef]
  9. Uthicke, S.; Welch, D.; Benzie, J. Slow growth and lack of recovery in overfished holothurians on the Great Barrier Reef: Evidence from DNA fingerprints and repeated large-scale surveys. Conserv. Biol. 2004, 18, 1395–1404. [Google Scholar] [CrossRef]
  10. The State of Queensland, Department of Primary Industries and Fisheries. Annual Status Report: East Coast beche-de-mer Fishery 2007. Brisbane. 2007. Available online: https://www.daf.qld.gov.au/__data/assets/pdf_file/0016/70270/AnnualStatusReport-EastCoastBeche-de-mer2007-10Jan08.pdf (accessed on 15 March 2024).
  11. Bordbar, S.; Anwar, F.; Saari, N. High-value components and bioactives from sea cucumbers for functional foods—A review. Mar. Drugs 2011, 9, 1761–1805. [Google Scholar] [CrossRef]
  12. Hossain, A.; Dave, D.; Shahidi, F. Northern sea cucumber (Cucumaria frondosa): A potential candidate for functional food, nutraceutical, and pharmaceutical sector. Mar. Drugs 2020, 18, 274. [Google Scholar] [CrossRef]
  13. Vu, D.T.; Falch, E.; Elvevoll, E.O.; Jensen, I.-J. Enzymatic Hydrolysis of Orange-Footed Sea Cucumber (Cucumaria frondosa)—Effect of Different Enzymes on Protein Yield and Bioactivity. Foods 2023, 12, 3685. [Google Scholar] [CrossRef] [PubMed]
  14. Jørgensen, L.L.; Ljubin, P.; Skjoldal, H.R.; Ingvaldsen, R.B.; Anisimova, N.; Manushin, I. Distribution of benthic megafauna in the Barents Sea: Baseline for an ecosystem approach to management. ICES J. Mar. Sci. 2015, 72, 595–613. [Google Scholar] [CrossRef]
  15. Hernández, J.C.; Clemente, S.; Tuya, F.; Pérez-Ruzafa, A.; Sangil, C.; Moro-Abad, L.; Bacallado-Aránega, J.J. Echinoderms of the Canary Islands, Spain. In Echinoderm Research and Diversity in Latin America; Alvarado, J., Solis-Marin, F., Eds.; Springer: Berlin/Heidelberg, Germany, 2013; pp. 471–510. [Google Scholar]
  16. Purcell, S.W.; Lovatelli, A.; González-Wangüemert, M.; Solís-Marín, F.A.; Samyn, Y.; Conand, C. Commercially Important Sea Cucumbers of the World; FAO: Rome, Italy, 2023. [Google Scholar]
  17. Nakai, K.; Tsuruta, D. What are reactive oxygen species, free radicals, and oxidative stress in skin diseases? Int. J. Mol. Sci. 2021, 22, 10799. [Google Scholar] [CrossRef]
  18. Aruoma, O.I. Free radicals, oxidative stress, and antioxidants in human health and disease. J. Am. Oil Chem. Soc. 1998, 75, 199–212. [Google Scholar] [CrossRef]
  19. Senadheera, T.R.; Hossain, A.; Dave, D.; Shahidi, F. Antioxidant and ACE-Inhibitory Activity of Protein Hydrolysates Produced from Atlantic Sea Cucumber (Cucumaria frondosa). Molecules 2023, 28, 5263. [Google Scholar] [CrossRef]
  20. Coelho, M.; Oliveira, C.; Coscueta, E.R.; Fernandes, J.; Pereira, R.N.; Teixeira, J.A.; Rodrigues, A.S.; Pintado, M.E. Bioactivity and bioaccessibility of bioactive compounds in gastrointestinal digestion of tomato bagasse extracts. Foods 2022, 11, 1064. [Google Scholar] [CrossRef]
  21. AOAC. Official Methods of Analysis of AOAC, 18th ed.; Association of Official Analytical Chemist: Gaithersburg, MD, USA, 2005. [Google Scholar]
  22. Latimer, G. Association of Official Analytical Chemists International, Official Methods of Analysis of AOAC International; AOAC International: Rockville, MD, USA, 2019. [Google Scholar]
  23. Bligh, E.G.; Dyer, W.J. A rapid method of total lipid extraction and purification. Can. J. Biochem. Physiol. 1959, 37, 911–917. [Google Scholar] [CrossRef] [PubMed]
  24. Blackburn, S. Amino Acid Determination: Methods and Techniques, 2nd ed.; Marcel Dekker: New York, NY, USA, 1978. [Google Scholar]
  25. Osnes, K.K.; Mohr, V. Peptide hydrolases of Antartic krill, Euphausia superba. Comp. Biochem. Physiol. B Biochem. Mol. Biol. 1985, 82, 599–606. [Google Scholar] [CrossRef]
  26. Murphy, E.W.; Criner, P.E.; Gray, B.C. Comparisons of methods for calculating retentions of nutrients in cooked foods. J. Agric. Food Chem. 1975, 23, 1153–1157. [Google Scholar] [CrossRef]
  27. Jensen, I.-J.; Abrahamsen, H.; Maehre, H.K.; Elvevoll, E.O. Changes in antioxidative capacity of saithe (Pollachius virens) and shrimp (Pandalus borealis) during in vitro digestion. J. Agric. Food Chem. 2009, 57, 10928–10932. [Google Scholar] [CrossRef]
  28. Benzie, I.F.; Strain, J.J. The ferric reducing ability of plasma (FRAP) as a measure of “antioxidant power”: The FRAP assay. Anal. Biochem. 1996, 239, 70–76. [Google Scholar] [CrossRef] [PubMed]
  29. Re, R.; Pellegrini, N.; Proteggente, A.; Pannala, A.; Yang, M.; Rice-Evans, C. Antioxidant activity applying an improved ABTS radical cation decolorization assay. Free Radic. Biol. Med. 1999, 26, 1231–1237. [Google Scholar] [CrossRef] [PubMed]
  30. Nenadis, N.; Lazaridou, O.; Tsimidou, M.Z. Use of reference compounds in antioxidant activity assessment. J. Agric. Food Chem. 2007, 55, 5452–5460. [Google Scholar] [CrossRef] [PubMed]
  31. Nenadis, N.; Wang, L.-F.; Tsimidou, M.; Zhang, H.-Y. Estimation of scavenging activity of phenolic compounds using the ABTS•+ assay. J. Agric. Food Chem. 2004, 52, 4669–4674. [Google Scholar] [CrossRef] [PubMed]
  32. Dávalos, A.; Gómez-Cordovés, C.; Bartolomé, B. Extending applicability of the oxygen radical absorbance capacity (ORAC− fluorescein) assay. J. Agric. Food Chem. 2004, 52, 48–54. [Google Scholar] [CrossRef] [PubMed]
  33. Elvevoll, E.O.; James, D.; Toppe, J.; Gamarro, E.G.; Jensen, I.-J. Food Safety Risks Posed by Heavy Metals and Persistent Organic Pollutants (POPs) related to Consumption of Sea Cucumbers. Foods 2022, 11, 3992. [Google Scholar] [CrossRef] [PubMed]
  34. Ringvold, H.; Kjerstad, M. Norwegian red sea cucumber, Parastichopus tremulus (Gunnerus, 1767) (Holothuroidea, Echinodermata): Chemical and nutritional analysis. In Blue Growth: Aquaculture, Fisheries, Market and Health Perspectives Orkana; Orkana Academy: Stamsund, Norway, 2018. [Google Scholar]
  35. Wen, J.; Hu, C.; Fan, S. Chemical composition and nutritional quality of sea cucumbers. J. Sci. Food Agric. 2010, 90, 2469–2474. [Google Scholar] [CrossRef] [PubMed]
  36. Abuzaytoun, R.; Budge, S.M.; Xia, W.; MacKinnon, S. Unusual ether lipids and branched chain fatty acids in sea cucumber (Cucumaria frondosa) viscera and their seasonal variation. Mar. Drugs 2022, 20, 435. [Google Scholar] [CrossRef] [PubMed]
  37. Kirimura, J.; Shimizu, A.; Kimizuka, A.; Ninomiya, T.; Katsuya, N. Contribution of peptides and amino acids to the taste of foods. J. Agric. Food Chem. 1969, 17, 689–695. [Google Scholar] [CrossRef]
  38. Sarower, M.G.; Hasanuzzaman, A.F.M.; Biswas, B.; Abe, H. Taste producing components in fish and fisheries products: A review. Int. J. Food Ferment. Technol. 2012, 2, 113–121. [Google Scholar]
  39. Fuke, S.; Konosu, S. Taste-active components in some foods: A review of Japanese research. Physiol. Behav. 1991, 49, 863–868. [Google Scholar] [CrossRef] [PubMed]
  40. Kendler, S.; Thornes, F.W.; Jakobsen, A.N.; Lerfall, J. Nutritional profiling and contaminant levels of five underutilized fish species in Norway. Front. Nutr. 2023, 10, 1118094. [Google Scholar] [CrossRef] [PubMed]
  41. Wang, W.; Zhou, X.; Liu, Y. Characterization and evaluation of umami taste: A review. Trends Anal. Chem. 2020, 127, 115876. [Google Scholar] [CrossRef]
  42. Mouritsen, O.G.; Styrbæk, K. Design and ‘umamification’ of vegetable dishes for sustainable eating. Int. J. Food Des. 2020, 5, 9–42. [Google Scholar] [CrossRef]
  43. Takagi, S.; Sato, Y.; Murata, Y.; Kokubun, A.; Touhata, K.; Ishida, N.; Agatsuma, Y. Quantification of the Flavor and Taste of Gonads from the Sea Urchin Mesocentrotus nudus Using GC–MS and a Taste-Sensing System. J. Sens. 2020, 20, 7008. [Google Scholar] [CrossRef] [PubMed]
  44. Lee, G.-Y.; Jung, M.-J.; Nam, J.-W.; Han, A.-R.; Kim, B.-M.; Jun, J.-Y. Preparation and Taste Profiling of the Enzymatic Protein Hydrolysate from a by-Product of Red Snow Crab Processing as a Natural Seasoning Compound. Foods 2022, 11, 3911. [Google Scholar] [CrossRef]
  45. Schmidt, C.V.; Olsen, K.; Mouritsen, O.G. Umami synergy as the scientific principle behind taste-pairing champagne and oysters. Sci. Rep. 2020, 10, 20077. [Google Scholar] [CrossRef] [PubMed]
  46. Schmidt, C.V.; Mouritsen, O.G. The solution to sustainable eating is not a one-way street. Front. Psychol. 2020, 11, 531. [Google Scholar] [CrossRef] [PubMed]
  47. Yamaguchi, S.; Ninomiya, K. Umami and food palatability. J. Nutr. 2000, 130, 921S–926S. [Google Scholar] [CrossRef]
  48. Sroyraya, M.; Hanna, P.J.; Siangcham, T.; Tinikul, R.; Jattujan, P.; Poomtong, T.; Sobhon, P. Nutritional components of the sea cucumber Holothuria scabra. Funct. Foods Health Dis. 2017, 7, 168–181. [Google Scholar] [CrossRef]
  49. Yin, M.; Matsuoka, R.; Yanagisawa, T.; Xi, Y.; Zhang, L.; Wang, X. Effect of different drying methods on free amino acid and flavor nucleotides of scallop (Patinopecten yessoensis) adductor muscle. Food Chem. 2022, 396, 133620. [Google Scholar] [CrossRef] [PubMed]
  50. Kamiloglu, S.; Toydemir, G.; Boyacioglu, D.; Beekwilder, J.; Hall, R.D.; Capanoglu, E. A review on the effect of drying on antioxidant potential of fruits and vegetables. Crit. Rev. Food Sci. Nutr. 2016, 56, S110–S129. [Google Scholar] [CrossRef] [PubMed]
  51. Chong, N.V.W.; Pindi, W.; Chye, F.-Y.; Shaarani, S.M.; Lee, J.-S. Effects of drying methods on the quality of dried sea cucumbers from Sabah—A review. Int. J. Nov. Res. Life Sci. 2015, 2, 49–64. [Google Scholar]
  52. Waghmare, R.B.; Perumal, A.B.; Moses, J.A.; Anandharamakrishnan, C. 3.05—Recent Developments in Freeze Drying of Foods. In Innovative Food Processing Technologies; Knoerzer, K., Muthukumarappan, K., Eds.; Elsevier: Oxford, UK, 2021; pp. 82–99. [Google Scholar] [CrossRef]
  53. Duan, X.; Zhang, M.; Mujumdar, A.S.; Wang, S. Microwave freeze drying of sea cucumber (Stichopus japonicus). J. Food Eng. 2010, 96, 491–497. [Google Scholar] [CrossRef]
  54. Hoehl, K.; Schoenberger, G.; Busch-Stockfisch, M. Stimulus and recognition thresholds for the basic tastes in deionized water. Are the recommendations for citric acid too high. Ernähr. Umsch. 2014, 61, 130–136. [Google Scholar]
  55. Guennoun, Y.; Benajiba, N.; Elkari, K.; Bouziani, A.; Elammari, L.; Al-Jawaldeh, A.; Elhaloui, N.; Barkat, A.; Benkirane, H.; Aguenaou, H. The threshold of sweet taste recognition among a sample of Moroccan population. Food Sci. Nutr. 2022, 52, 45–60. [Google Scholar] [CrossRef]
  56. WHO. Protein and Amino Acid Requirements in Human Nutrition: Report of a Joint FAO/WHO/UNU Expert Consultation. WHO Technical Report Series; No. 935. 2007. Available online: https://apps.who.int/iris/handle/10665/43411 (accessed on 20 September 2022).
  57. Ardiansyah, A.; Rasyid, A.; Siahaan, E.A.; Pangetistu, R.; Murniasih, T. Nutritional value and heavy metals content of sea cucumber Holothuria scabra commercially harvested in Indonesia. Curr. Res. Nutr. Food Sci. 2020, 8, 765–773. [Google Scholar] [CrossRef]
  58. Li, M.; Gao, Y.; Qi, Y.-X.; Song, Z.-Y.; Li, Z.-B.; Lin, Y.-T.; Zhao, Q.-C. Assessment of the nutritional value of cultured sea cucumber Apostichopus japonicus. J. Aquat. Food Prod. Technol. 2021, 30, 868–879. [Google Scholar] [CrossRef]
  59. Okuno, T.; Morimoto, S.; Nishikawa, H.; Haraguchi, T.; Kojima, H.; Tsujino, H.; Arisawa, M.; Yamashita, T.; Nishikawa, J.; Yoshida, M. Bitterness-Suppressing Effect of Umami Dipeptides and Their Constituent Amino Acids on Diphenhydramine: Evaluation by Gustatory Sensation and Taste Sensor Testing. Chem. Pharm. Bull. 2020, 68, 234–243. [Google Scholar] [CrossRef]
  60. Böhm, V.; Kühnert, S.; Rohm, H.; Scholze, G. Improving the nutritional quality of microwave-vacuum dried strawberries: A preliminary study. Food Sci. Technol. Int. 2006, 12, 67–75. [Google Scholar] [CrossRef]
  61. Valentina, V.; Pratiwi, R.A.; Hsiao, P.; Tseng, H.; Hsieh, J.; Chen, C. Sensorial characterization of foods before and after freeze-drying. Austin Food Sci. 2016, 1, 1027. [Google Scholar]
  62. Nursid, M.; Hadiati, D.; Winanto, T. Antioxidant capacity of dry sea cucumber Holothuria edulis, Pearsonothuria graeffei, and Stichopus herrmanni from Boalemo waters, Gorontalo, Indonesia. IOP Conf. Ser. Earth Environ. Sci. 2022, 967, 012027. [Google Scholar] [CrossRef]
  63. Korczek, K.R.; Tkaczewska, J.; Duda, I.; Migdał, W. Effect of Heat Treatment on the Antioxidant Activity as Well as In vitro Digestion Stability of Herring (Clupea harengus) Protein Hydrolysates. J. Aquat. Food Prod. 2021, 30, 806–825. [Google Scholar] [CrossRef]
  64. Hjellnes, V.; Rustad, T.; Jensen, I.-J.; Eiken, E.; Pettersen, S.M.; Falch, E. Ultrafiltration of Saithe (Pollachius virens) Protein Hydrolysates and Its Effect on Antioxidative Activity. Catalysts 2021, 11, 1053. [Google Scholar] [CrossRef]
  65. Mildenberger, J.; Remm, M.; Atanassova, M. Self-assembly potential of bioactive peptides from Norwegian sea cucumber Parastichopus tremulus for development of functional hydrogels. LWT 2021, 148, 111678. [Google Scholar] [CrossRef]
  66. Jahan-Mihan, A.; Luhovyy, B.L.; Khoury, D.E.; Anderson, G.H. Dietary proteins as determinants of metabolic and physiologic functions of the gastrointestinal tract. Nutrients 2011, 3, 574–603. [Google Scholar] [CrossRef] [PubMed]
  67. Klompong, V.; Benjakul, S.; Kantachote, D.; Hayes, K.D.; Shahidi, F. Comparative study on antioxidative activity of yellow stripe trevally protein hydrolysate produced from Alcalase and Flavourzyme. Int. J. Food Sci. Technol. 2008, 43, 1019–1026. [Google Scholar] [CrossRef]
  68. Pérez-Jiménez, J.; Arranz, S.; Tabernero, M.; Díaz-Rubio, M.E.; Serrano, J.; Goñi, I.; Saura-Calixto, F. Updated methodology to determine antioxidant capacity in plant foods, oils and beverages: Extraction, measurement and expression of results. Food Res. Int. 2008, 41, 274–285. [Google Scholar] [CrossRef]
  69. Suwaluk, R.; Chansuwan, W.; Sirinupong, N.; Chinachoti, P. Biological properties of peptide released by in-vitro stimulated digestion of cooked eats. J. Food Nutr. Res. 2021, 9, 87–95. [Google Scholar]
  70. Ucak, I.; Afreen, M.; Montesano, D.; Carrillo, C.; Tomasevic, I.; Simal-Gandara, J.; Barba, F.J. Functional and bioactive properties of peptides derived from marine side streams. Mar. Drugs 2021, 19, 71. [Google Scholar] [CrossRef]
  71. Blanco, A.; Blanco, G. Chapter 12—Digestion—Absorption. In Medical Biochemistry; Academic Press: London, UK, 2017; pp. 251–273. [Google Scholar]
  72. Sánchez, A.; Vázquez, A. Bioactive peptides: A review. Food Qual. Saf. 2017, 1, 29–46. [Google Scholar] [CrossRef]
  73. Zhang, Y.; He, S.; Bonneil, É.; Simpson, B.K. Generation of antioxidative peptides from Atlantic sea cucumber using alcalase versus trypsin: In vitro activity, de novo sequencing, and in silico docking for in vivo function prediction. Food Chem. 2020, 306, 125581. [Google Scholar] [CrossRef] [PubMed]
  74. Cheng, Y.-H.; Liu, B.-Q.; Cui, B.; Wen, L.; Xu, Z.; Chen, M.-L.; Wu, H. Alanine Substitution to Determine the Effect of LR5 and YR6 Rice Peptide Structure on Antioxidant and Anti-Inflammatory Activity. Nutrients 2023, 15, 2373. [Google Scholar] [CrossRef] [PubMed]
  75. Sichanova, M.; Geneva, M.; Petrova, M.; Miladinova-Georgieva, K.; Kirova, E.; Nedev, T.; Tsekova, D.; Ivanova, V.; Trendafilova, A. Influence of the Abiotic Elicitors Ag Salts of Aspartic Acid Derivatives, Self-Organized in Nanofibers with Monomeric and Dimeric Molecular Structures, on the Antioxidant Activity and Stevioside Content in Micropropagated Stevia rebaudiana Bert. Plants 2023, 12, 3574. [Google Scholar] [CrossRef] [PubMed]
  76. Fardus, J.; Hossain, S.; Rob, M.M.; Fujita, M. l-glutamic acid modulates antioxidant defense systems and nutrient homeostasis in lentil (Lens culinaris Medik.) under copper toxicity. Environ. Sci. Pollut. Res. 2023, 30, 78507–78520. [Google Scholar] [CrossRef]
  77. Sun, Y.; Miao, F.; Wang, Y.; Liu, H.; Wang, X.; Wang, H.; Guo, J.; Shao, R.; Yang, Q. L-Arginine alleviates the reduction in photosynthesis and antioxidant activity induced by drought stress in maize seedlings. J. Antioxid. 2023, 12, 482. [Google Scholar] [CrossRef]
Figure 1. The schematic illustration of research design and analyses performed to characterize proximate composition and amino acids of red sea cucumber (Parastichopus tremulus), simulate gastrointestinal digestion, and investigate the antioxidant activity. This was measured by ferric reducing antioxidant power (FRAP) assay, 2′-azino-bis-(3-ethylbenzothiazoline-6-sulfonic acid) (ABTS) assay, and oxygen radical absorbance capacity (ORAC) assay in frozen and freeze-dried materials during digestion.
Applsci 14 03267 g001
Figure 2. The schematic illustration of the simulated in vitro gastrointestinal digestion, with pH-adjustments, addition of enzymes, and sample collections at different time points.
Applsci 14 03267 g002
Figure 3. Distribution of free amino acids (FAAs) (mg/100 g dry weight sea cucumber (SC)) in frozen and freeze-dried red sea cucumber (Parastichopus tremulus). The distribution is grouped with different taste perceptions umami/sour (a), sweet (b), bitter (c), and other (d). The frozen samples have theoretically been calculated from wet weight to dry weight. The results are presented as mean ± standard error (n = 10). Values with different letters are significantly different (p < 0.05).
Applsci 14 03267 g003
Figure 4. The concentrations of essential amino acid (EAAs) (mg/g protein) in both frozen and freeze-dried red sea cucumber (Parastichopus tremulus) compared to the reference protein [56]. The results are presented as mean ± standard error, n = 10).
Applsci 14 03267 g004
Figure 5. True retention (%) of essential amino acids (EAAs) after freeze-drying of frozen red sea cucumber (Parastichopus tremulus). The results are presented as average ± standard error, n = 10.
Applsci 14 03267 g005
Figure 6. The free amino acids (FAAs) concentration before (0 min), during (75 min), and at the end (165 min) of the simulated gastrointestinal digestion for frozen red sea cucumber (Parastichopus tremulus) (n = 10). The frozen samples have theoretically been calculated from wet weight to dry weight. The results are presented as mean ± standard error as mg/100 g dry weight. Means with different letters (a, b) indicate significant differences (p < 0.05) throughout the digestive process. Tryptophan is destroyed during acid hydrolysis and is thus not detected. Cysteine, proline, and taurine are not detected in this method. Arginine/Glycine could not be separated in this method. Asparagine and glutamine are deaminated during acid hydrolysis and are therefore included in the aspartic acid and glutamic acid.
Applsci 14 03267 g006
Figure 7. The free amino acids (FAAs) concentration before (0 min), during (75 min) and at the end (165 min) of the simulated gastrointestinal digestion for freeze-dried red sea cucumber (Parastichopus tremulus) (n = 5). The results are presented as mean ± standard error in mg/100 g dry weight sea cucumber. Means with different letter (a–c) indicate significant differences (p < 0.05) throughout the digestive process Tryptophan is destroyed during acid hydrolysis and is thus not detected. Cysteine, proline and taurine are not detected in this method. Arginine/Glycine could not be separated in this method. Asparagine and glutamine are deaminated during acid hydrolysis and are therefore included in the aspartic acid and glutamic acid.
Applsci 14 03267 g007
Figure 8. The antioxidant activity measured by ferric reducing antioxidant power (FRAP) during the simulated gastrointestinal digestion in frozen (n = 10) and freeze-dried (n = 5) red sea cucumber (Parastichopus tremulus). The frozen samples have theoretically been calculated from wet weight to dry weight. The results are presented as mean ± standard error in mmol Trolox equivalents/100 g dry weight sea cucumber. * Denotes significant differences (p < 0.05) between frozen and freeze-dried samples at the specific time point. x and a denote significant differences (p < 0.05) in frozen (x) or freeze-dried (a) samples through the digestive process.
Applsci 14 03267 g008
Figure 9. The antioxidant activity measured by 2′-azino-bis-(3-ethylbenzothiazoline-6-sulfonic acid) (ABTS) during the simulated gastrointestinal digestion in frozen (n = 10) and freeze-dried (n = 5) red sea cucumber (Parastichopus tremulus). The frozen samples have theoretically been calculated from wet weight to dry weight. The results are presented as mean ± standard error in mmol Propyl gallate equivalents/100 g dry weight sea cucumber. * Denotes significant differences (p  <  0.05) between frozen and freeze-dried samples at the specific time point. a, b and x denote significant differences (p < 0.05) in frozen (x) or freeze-dried (a, b) samples through the digestive process.
Applsci 14 03267 g009
Figure 10. The oxygen radical absorbance capacity (ORAC) activity of the simulated gastrointestinal digestion in frozen (n = 10) and freeze-dried (n = 5) red sea cucumber (Parastichopus tremulus). The frozen samples have theoretically been calculated from wet weight to dry weight. The results are presented as mean ± standard error in mmol Trolox equivalents/100 g dry weight sea cucumber. * Denotes significant differences (p < 0.05) between frozen and freeze-dried samples at the specific time point. a, b, c, x, and y denote significant differences (p < 0.05) in frozen (x, y) or freeze-dried (a–c) samples through the digestive process.
Applsci 14 03267 g010
Figure 11. The Pearson correlation in the released free amino acids (FAAs) during the simulated gastrointestinal digestion of frozen red sea cucumber (Parastichopus tremulus) (n = 10), and between ferric reducing antioxidant power (FRAP), 2′-azino-bis-(3-ethylbenzothiazoline-6-sulfonic acid) (ABTS) and oxygen radical absorbance capacity (ORAC). The correlation range between 0.00 to ±0.10 denotes markedly low and negligible correlation, while a range from ±0.10 to ±0.30 denotes very low correlation, ±0.30 to ±0.50 denotes low positive correlation, ±0.50 to ±0.70 denotes moderate correlation, ±0.70 to ±0.90 denotes high correlation, ±0.90 to ±0.99 denotes very high correlation, and 1.00 denotes perfect correlation. * Denotes statistically significant differences (p < 0.05), calculated by ANOVA.
Applsci 14 03267 g011
Figure 12. The Pearson correlation in the release of free amino acids (FAAs) during the simulated gastrointestinal digestion of freeze-dried red sea cucumber (Parastichopus tremulus) (n = 5), and between ferric reducing antioxidant power (FRAP), 2′-azino-bis-(3-ethylbenzothiazoline-6-sulfonic acid) (ABTS) and oxygen radical absorbance capacity (ORAC). The correlation range between 0.00 to ±0.10 denotes markedly low and negligible correlation, while the range from ±0.10 to ±0.30 denotes very low correlation, ±0.30 to ±0.50 denotes low positive correlation, ±0.50 to ±0.70 denotes moderate correlation, ±0.70 to ±0.90 denotes high correlation, ±0.90 to ±0.99 denotes very high correlation, and 1.00 denotes perfect correlation. * Denotes statistically significant differences (p < 0.05), calculated by ANOVA.
Applsci 14 03267 g012
Table 1. The proximate composition in frozen and freeze-dried red sea cucumber (Parastichopus tremulus). Results are presented as average ± standard deviation, n = 10.
SamplesFrozen [%]Freeze-Dried [%]
Water89.7 ± 0.83.4 ± 1.0
Protein4.4 ± 0.743.1 ± 2.4
Ash4.0 ± 0.436.3 ± 2.8
Lipid1.3 ± 0.48.5 ± 2.2
Table 2. Total amino acids (TAAs) (g/100 g dry weight) and free amino acids (FAAs) (mg/100 g dry weight) content in both frozen and freeze-dried red sea cucumber (Parastichopus tremulus). The frozen samples have theoretically been calculated from wet weight to dry weight. The results are presented as average ± standard deviation, n = 10.
Total Amino AcidsFree Amino Acids
Amino Acidsg/100 g Dry Weight
Frozen
g/100 g Dry Weight
Freeze-Dried
mg/100 g Dry Weight
Frozen
mg/100 g Dry Weight
Freeze-Dried
Alanine2.76 ± 1.361.94 ± 0.3513.0 ± 4.242.9 ± 10.6 *
Asparagine<0.01<0.011.0 ± 0.63.5 ± 3.0 *
Aspartic acid5.08 ± 2.213.60 ± 0.7310.8 ± 1.611.2 ± 3.4
Glutamic acid6.79 ± 3.144.50 ± 1.08139.2 ± 31.4414.2 ± 48.1 *
Glutamine0.04 ± 0.02 *<0.019.5 ± 4.432.2 ± 7.1 *
Glycine/Arginine6.07 ± 3.028.45 ± 2.0445.8 ± 12.4257.6 ± 57.7 *
Histidine0.48 ± 0.210.37 ± 0.071.8 ± 1.09.1 ± 2.5 *
Isoleucine1.35 ± 0.581.00 ± 0.25<11.3 ± 0.3 *
Leucine2.65 ± 1.161.83 ± 0.412.0 ± 0.93.4 ± 0.3 *
Lysine1.81 ± 0.801.31 ± 0.3011.8 ± 3.336.5 ± 12.2 *
Methionine0.72 ± 0.34 *0.45 ± 0.16<11.2 ± 0.2 *
Phenylalanine1.55 ± 0.651.17 ± 0.241.0 ± 0.52.3 ± 0.2 *
Serine2.57 ± 1.21 *1.58 ± 0.461.8 ± 0.58.8 ± 2.5 *
Threonine2.63 ± 1.161.86 ± 0.421.4 ± 1.29.1 ± 2.5 *
Tyrosine1.33 ± 0.560.94 ± 0.191.1 ± 0.63.0 ± 0.3 *
Valine1.82 ± 0.781.38 ± 0.311.6 ± 0.92.6 ± 0.6 *
∑TAAs
∑FAAs
37.64 ± 17.1530.39 ± 6.67242.7 ± 53.1839.2 ± 110.3 *
Tryptophan is destroyed during acid hydrolysis and is thus not detected. Cysteine, proline, and taurine are not detected in this method. Arginine/Glycine could not be separated in this method. Asparagine and glutamine are deaminated during acid hydrolysis and are therefore included in the aspartic acid and glutamic acid. * Denotes statistically significant differences of total amino acids or free amino acids between frozen and freeze-dried samples (p < 0.05), using SPSS version 29.0.1.0 with independent-samples t-test (p  <  0.05) analysis.
Table 3. The antioxidant activity measured by ferric reducing antioxidant power (FRAP), 2′-azino-bis-(3-ethylbenzothiazoline-6-sulfonic acid) (ABTS), and oxygen radical absorbance capacity (ORAC) in frozen (dry weight) and freeze-dried (dry weight) red sea cucumber (Parastichopus tremulus). The frozen samples have theoretically been calculated from wet weight to dry weight. The results are presented as Trolox equivalents (TE)/100 g or Propyl gallate equivalents (PGE)/100 g dry weight as mean ± standard deviation (n = 10).
SamplesFRAP (mmol TE/100 g Dry Weight)ABTS (mmol PGE/100 g Dry Weight)ORAC (mmol TE/100 g Dry Weight)
Frozen3.2 ± 1.7 *0.1 ± 0.0229.6 ± 107.9 *
Freeze-dried1.2 ± 0.20.3 ± 0.1 *130.7 ± 37.1
* Denotes statistically significant differences (p < 0.05), between values in the same column calculated by ANOVA.
Disclaimer/Publisher’s Note: The statements, opinions and data contained in all publications are solely those of the individual author(s) and contributor(s) and not of MDPI and/or the editor(s). MDPI and/or the editor(s) disclaim responsibility for any injury to people or property resulting from any ideas, methods, instructions or products referred to in the content.

