1. Introduction
With recent trends toward the development of larger and faster ships, along with the expansion of various ports, offshore wind farms, and the designation of new routes, there is an increased likelihood of marine accidents owing to rapid changes in the maritime traffic environment.
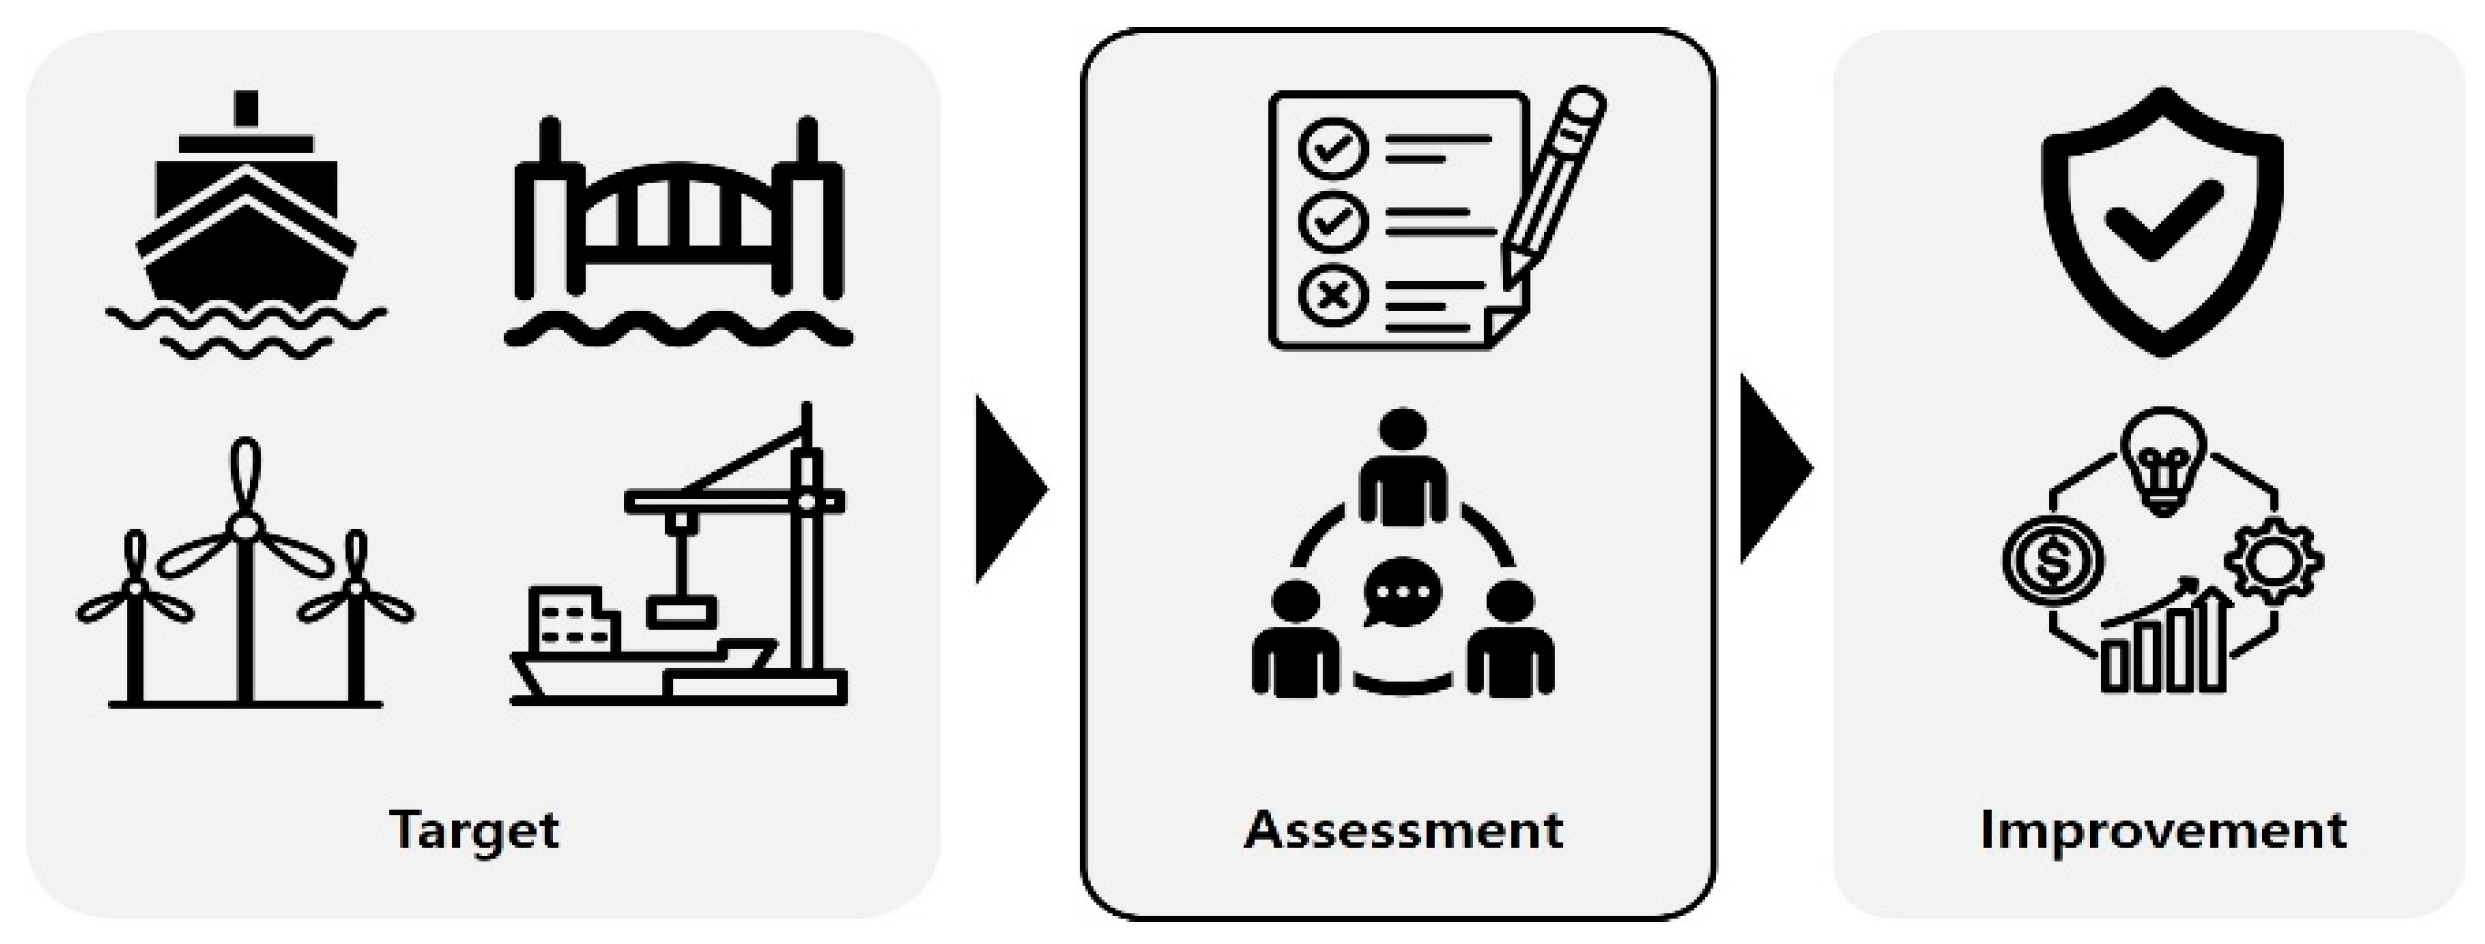
The Maritime Traffic Safety Assessment (MTSA) system aims to contribute to the reduction in marine accident risks, maximize port efficiency, and facilitate systematic project implementation by removing potential risk factors affecting vessel traffic when conducting marine development projects on a specific scale. The Ministry of Oceans and Fisheries of South Korea has institutionalized safety assessments in the maritime field for the first time globally, adopting some of the quantitative review techniques for traffic safety measures standardized by The Japan Association of Marine Safety [
1]. Since 2010, 196 assessments have been conducted using the MTSA system, progressing through the institutionalization and enhancement stages [
2].
Prior to the introduction of this system, there were concerns regarding the absence of standardized safety assessment criteria for marine development projects, which raised questions about its objectivity and reliability. However, since its introduction, this system has ensured safe navigation conditions for vessels, thereby promoting sustainable marine development. An overview of MTSA is illustrated in
Figure 1.
Initially, it was mandated that MTSA should be conducted for all marine development projects. However, there have been concerns regarding the need to perform MTSA for projects with minimal impact on maritime traffic safety. The government subsequently accepted this opinion and, in 2014, it refined and relaxed the criteria for MTSA-targeted projects. Since then, the scope of projects subject to MTSA has narrowed to areas where marine development projects are conducted in vessel traffic areas with ships over 100 m long. The specific scope of safety assessment-targeted projects is specified in the Enforcement Decree of the Maritime Safety Act [Appendix 2–3], and the details are shown in
Table 1.
While this system contributes to the prevention of marine accidents from the perspective of its effectiveness, there is a growing need for regulatory enhancements regarding marine development projects in the waterways of maritime routes for coastal passenger ships, which are categorized as safety blind spots. In particular, the majority (94%) of domestic coastal passenger ships are less than 100 m in length, resulting in the exclusion of marine development projects from safety assessment-targeted projects. Consequently, numerous near-accidents and safety hazards have been identified on completed bridges and in port facilities. Moreover, coastal passenger ships pose a higher risk of personal injury compared with other types of vessels. Therefore, it is necessary to expand the scope of safety assessments for the waterways of maritime routes for coastal passenger ships [
3].
However, MTSA is regulatory in nature, and it is therefore essential to calculate the safety benefits relative to the increased economic burden on marine developers to ensure the validity of system improvements [
4]. In numerous maritime safety-related studies, the occurrence of marine accidents is considered a crucial aspect of risk assessment [
5]. The reduction in such accidents can be quantified by converting them into monetary values [
6].
However, because of the relatively small number of marine accidents relative to the number of voyages made by coastal passenger ships, it is difficult to assess the probability of marine accidents using only statistical methods. In addition to statistical methods, machine learning (ML) can also be used to predict marine accidents based on various independent variables. There has been ongoing research that employs ML to predict accident risks for other modes of transportation, such as automobiles [
7,
8].
The aim of this study was to analyze the safety benefits and efficiency of expanding the scope of the system to include waterways of maritime routes for coastal passenger ships less than 100 m in length. In addition, the most appropriate option can be applied to the improvement of the MTSA system compared to the safety benefits derived and the administrative and economic burden on the operators. To achieve this, this study utilized ML models to derive the MTSA-related accident reduction rate (ARR) after implementing the MTSA system, focusing on accidents related to coastal passenger ships. The study is structured as follows:
The classification of maritime routes and MTSA-related accidents.
The prediction of the occurrence of MTSA-related accidents assuming no MTSA implementation.
The derivation of the MTSA-related ARR by comparing the predicted number of MTSA-related accident occurrences.
2. Analysis of Previous Studies
Various studies worldwide have focused on accident analysis, including both marine accidents and accidents in general. This study discusses methods for predicting marine accidents using marine spatial analysis and artificial intelligence (AI) ML against the backdrop of the relatively small number of systems such as MTSA. This section is divided into four sections. The first section analyzes research on accident identification from a spatial perspective. The second section examines systems related to risk assessment in maritime traffic safety. Next, studies on accident or risk prediction algorithm models are discussed in the context of various industries beyond maritime transportation. Finally, research that utilizes techniques for data sampling across diverse topics is analyzed.
Previous studies on identifying accident risk using algorithms have several limitations. They often focus on the data classification methodology rather than final outcomes such as accident rates, or they derive results by comparing the importance factor values of models based on various machine learning techniques. However, they do not identify the variables that are important for predicting accident risks. In this study, we addressed the problem of imbalanced data sets containing accidents using the SMOTE technique mentioned in the fourth section. Subsequently, we derived improvement metrics for accident occurrence probabilities after applying the MTSA system and identified the variables that are important for predicting accident risks. Furthermore, considering the accuracy derived from the evaluation to represent the validity of the model, we used it as a correction factor to determine the reduction rate of accidents after MTSA from a conservative perspective. The technical novelty of our study lies in the application of these multifaceted methodologies to derive the final results.
2.1. Spatial Identification
When combined with quantitative data analysis, the use of spatial data can result in synergistic effects to derive results on various topics. An analysis of similar studies using geographic information system (GIS) technology revealed the usefulness of GIS-based analysis in the identification of assessed project sites, related routes, and marine accidents.
Hazaymeh et al. investigated the spatiotemporal patterns of car accidents over several years in Jordan [
9]. They used a GIS-assisted technique based on statistical and clustering approaches to identify areas with car crash points.
Mesquitela et al. conducted research to identify safety measures to prevent traffic accidents in Lisbon [
10]. They applied meteorological data, historical traffic status data, and location datasets to ArcGIS Pro software.
Thanopoulou et al. conducted research on methods for monitoring vessels potentially at high risk of oil spills in marine pollution accidents using an electronic platform [
11]. The authors proposed the construction of an AI-based monitoring system within a GIS environment.
Yildiz et al. used GIS to develop a “Marine Accidents Density Map” for the Singapore Strait by reviewing areas where marine accidents are concentrated by performing the Kernel Density Analysis method [
12].
Studies have also combined GIS and electronic charts (e-charts) to analyze the relationship between marine accident locations and specific causes. Chou et al. used GIS to integrate spatiotemporal information, such as marine accident locations and timings, with environmental factors such as wind, waves, tides, and currents, after which the data were combined on e-charts [
13].
2.2. Maritime Traffic Safety Assessment
Various approaches have been investigated to identify and assess risks related to maritime traffic safety, such as Formal Safety Assessment (FSA), the IALA Waterway Risk Assessment Program (IWRAP), Ports And Waterway Safety Assessment (PAWSA), and the Event Sequence (ES) model. When revising agreements, regulations, and laws with regulatory characteristics, the cost–benefit of obtaining them, administrative burdens, and incurred costs should be extensively considered. In addition, it was confirmed that it is important to quantify data such as the number of marine accidents to obtain a quantitative data assessment in maritime risk assessment.
The FSA approach was formally adopted as a guideline at the 74th IMO MSC meeting in 2001, and is still in use today. The IMO defines FSA as an organizational and systematic safety assessment method that uses risk and cost–benefit assessments to improve maritime safety, including human life, the marine environment, and property protection [
14].
IWRAP, which was developed by the Technical University of Denmark’s ISESO Project, calculates the risk of ship collisions and grounding incidents. This program analyzes the risk to waterways using a quantitative risk assessment that is based on factors such as the type and size of vessels as well as vessel navigation data for specific water areas [
15].
PAWSA, an assessment model developed in the United States to ensure maritime traffic safety in waterways, uses the Analytical Hierarchy Process (AHP) developed by Dr. Jack Harrald of George Washington University and Jason Merrick of Virginia Commonwealth University [
16,
17].
The ES model is used to quantitatively evaluate the degree of burden imposed on ship operators, and is also utilized in the MTSA Scheme in Korea [
18,
19].
The Potential Assessment of Risk (PARK) model, which is a Korean model under development, measures the maritime traffic risk based on quantitative data that distinguishes ship type, tonnage, length, width, boarding experience, license possession, duties, etc., using regression analysis methods [
20].
Kim et al. investigated the feasibility of automatically setting the optimal route for ships without human intervention using ML techniques to ensure safety during navigation [
21].
Fu et al. identified the major thematic clusters in risk-influencing factors. They proposed a model for synthesizing and illustrating the relationships among environmental factors, ship-related risk-influencing factors, and accident scenarios in Arctic shipping [
22].
2.3. Risk Prediction Using Algorithms
It was found that weather conditions significantly influence the road conditions for automobiles. Accordingly, several studies have reported the development of models that predict risk using ML based on basic data, such as road and weather condition data collected from each country. Random forest models are widely used among ML algorithms for reasons such as unnecessary data-scale transformations and superior model performance, leading to high accuracy.
Amorim et al. developed a model using ML algorithms to identify accident hotspots by collecting data on accident dates, road types, and weather conditions. They devised methods for drivers on the Brazilian Federal Highway to alert them to potential highway risk areas in advance [
23].
Lee et al. focused on the occurrence of risks, such as hydroplaning, owing to variations in road friction coefficients during rainy seasons caused by climate change. They estimated the importance of factors that contribute to accidents during rainy seasons and developed a traffic accident forecasting model using ML [
24].
Jeong et al. aimed to identify the factors affecting the frequency and damage caused by traffic accidents in Seoul City by collecting data and using algorithms to analyze the impact of these factors [
7].
Kim et al. noted a high mortality rate owing to traffic accidents on highways during winter. They addressed the data imbalance using SMOTE and devised a winter highway risk prediction model using ML [
8].
2.4. Application of Data Sampling Techniques
Recent advancements in the construction of large databases have led to various ML studies being conducted on diverse topics. It has been shown that for the application of these ML algorithms, the quality of data, particularly the balance of data, is crucial, and several cases applying the SMOTE technique have been identified.
Xu et al. conducted research to predict the turnover rate of crucial nurses to ensure the quality of nationwide healthcare services. They selected 18 variables from a database and applied four ML algorithms after balancing the distribution of data between variables through data sampling [
25].
Imani et al. devised methods to reduce customer churn in the telecommunications industry by analyzing customer behavior and predicting churn variables through ML after addressing the data imbalance issue by sampling open data related to the telecommunications industry [
26].
Farooqi et al. conducted research on enhancing network intrusion detection. They applied the SMOTE technique to address the class imbalance issue in basic data. This ensemble voting classifier significantly enhances the accuracy and precision of network intrusion detection systems [
27].
3. Methodology
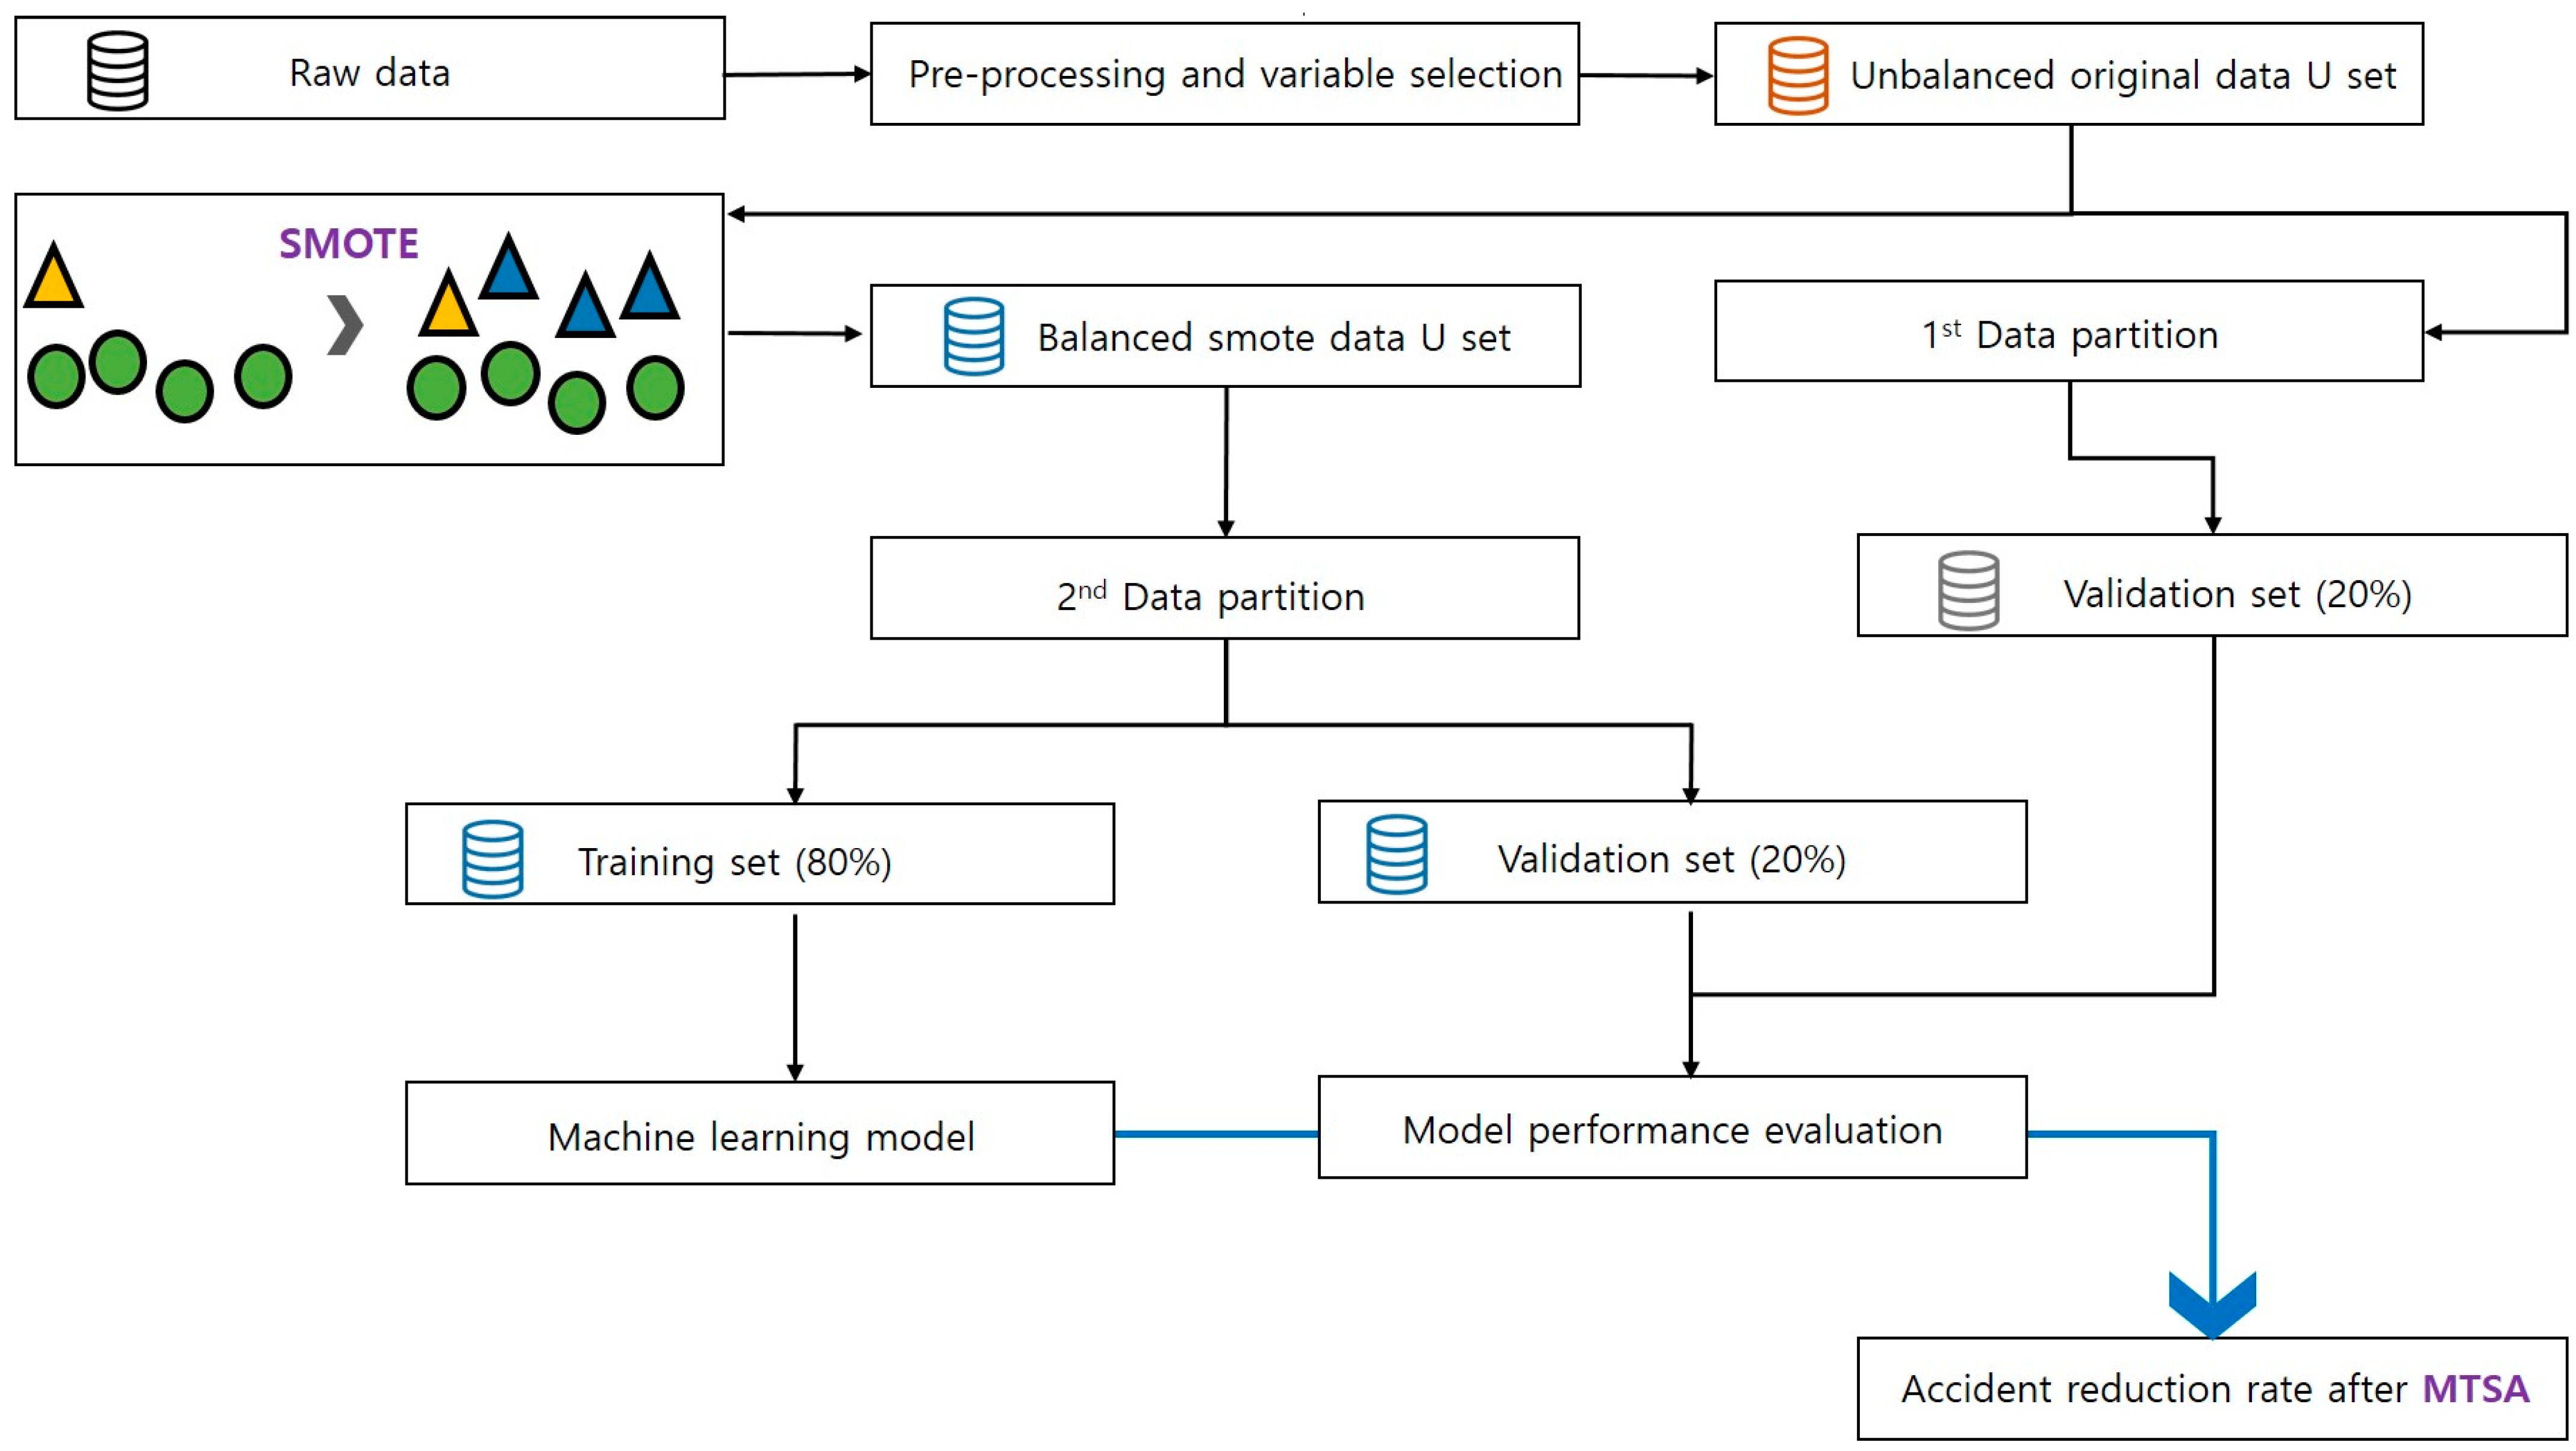
The aim of this study was to derive the MTSA-related ARR from routes near the assessed project sites when undergoing MTSA evaluation. The key procedures of this study are listed below and summarized in
Figure 2:
Data collection included an assessment of projected site data, marine accident data, and coastal passenger ship operation data, followed by data pre-processing.
The classification of maritime routes for coastal passenger ships related to the assessed projected sites and those unrelated through GIS analysis.
The classification of MTSA-related accidents among marine accidents occurring on these routes using GIS analysis.
Performing oversampling on the group of MTSA-related accidents with a relatively low occurrence compared to the coastal passenger ship operation information.
The calculation of feature importance for deriving accident occurrence probabilities using the ML algorithm based on coastal passenger ship operation information and MTSA-related accident information on routes unrelated to the assessed projected sites.
The prediction of MTSA-related accident occurrences assuming no MTSA implementation using the trained ML model on the operation information of routes associated with the assessed projected sites.
Validation and evaluation of the modeling results using both sampling and original data.
The derivation of MTSA-related ARR by comparing the predicted number of MTSA-related accident occurrences based on the MTSA implementation status derived from the modeling results.
To carry out these processes, it is necessary to examine important methods such as the concept of MTSA-related accident scope, data sampling, marine accident reduction, and ML techniques. The results of this analysis are discussed in the following subsections.
3.1. Data Collection Considering Marine Development Project Cycle
First, we collected MTSA-assessed project site data from 2010 to 2014 for marine development projects that directly or indirectly affected the operation of coastal passenger ships with a length of less than 100 m in waterways.
Moreover, we collected data on coastal passenger ship operations and marine accidents that occurred between 2017 and 2022. MTSA is required to obtain regulatory approval for project plans before commencing operations. Additional processes, such as user consultations, are required, which extend the timeframe from MTSA completion to project commencement to 1–3 years. Furthermore, depending on the type of project, construction periods range from 2–5 years after commencement. Therefore, we applied data from 2017 to 2022, assuming that this period provided sufficient time for the formation of maritime traffic patterns, reflecting post-MTSA project completion and the establishment of new facilities.
3.2. Methodology for Classifying MTSA-Related Accidents
To achieve the above-mentioned research goal of deriving the MTSA-related ARR, it is necessary to establish concepts, such as identifying routes passing through the vicinity of MTSA-assessed project sites, the types of marine accidents occurring on those routes, their relationships with the MTSA scheme, and the distance between the location of marine accidents and the marine development project site. In this subsection, we establish concepts for sea routes near MTSA-assessed project sites and MTSA-related accidents.
3.2.1. Classification of Sea Routes near MTSA-Assessed Project Site
In South Korea, licenses for coastal passenger ship routes are obtained from the government, and sea routes are designated by passenger ship operators and typically operated consistently unless there are specific reasons for this not to be the case. Based on this fact, we assessed the association between the maritime route for passenger ships and the distance to the assessed project site to determine whether there is a connection with the MTSA-assessed project site.
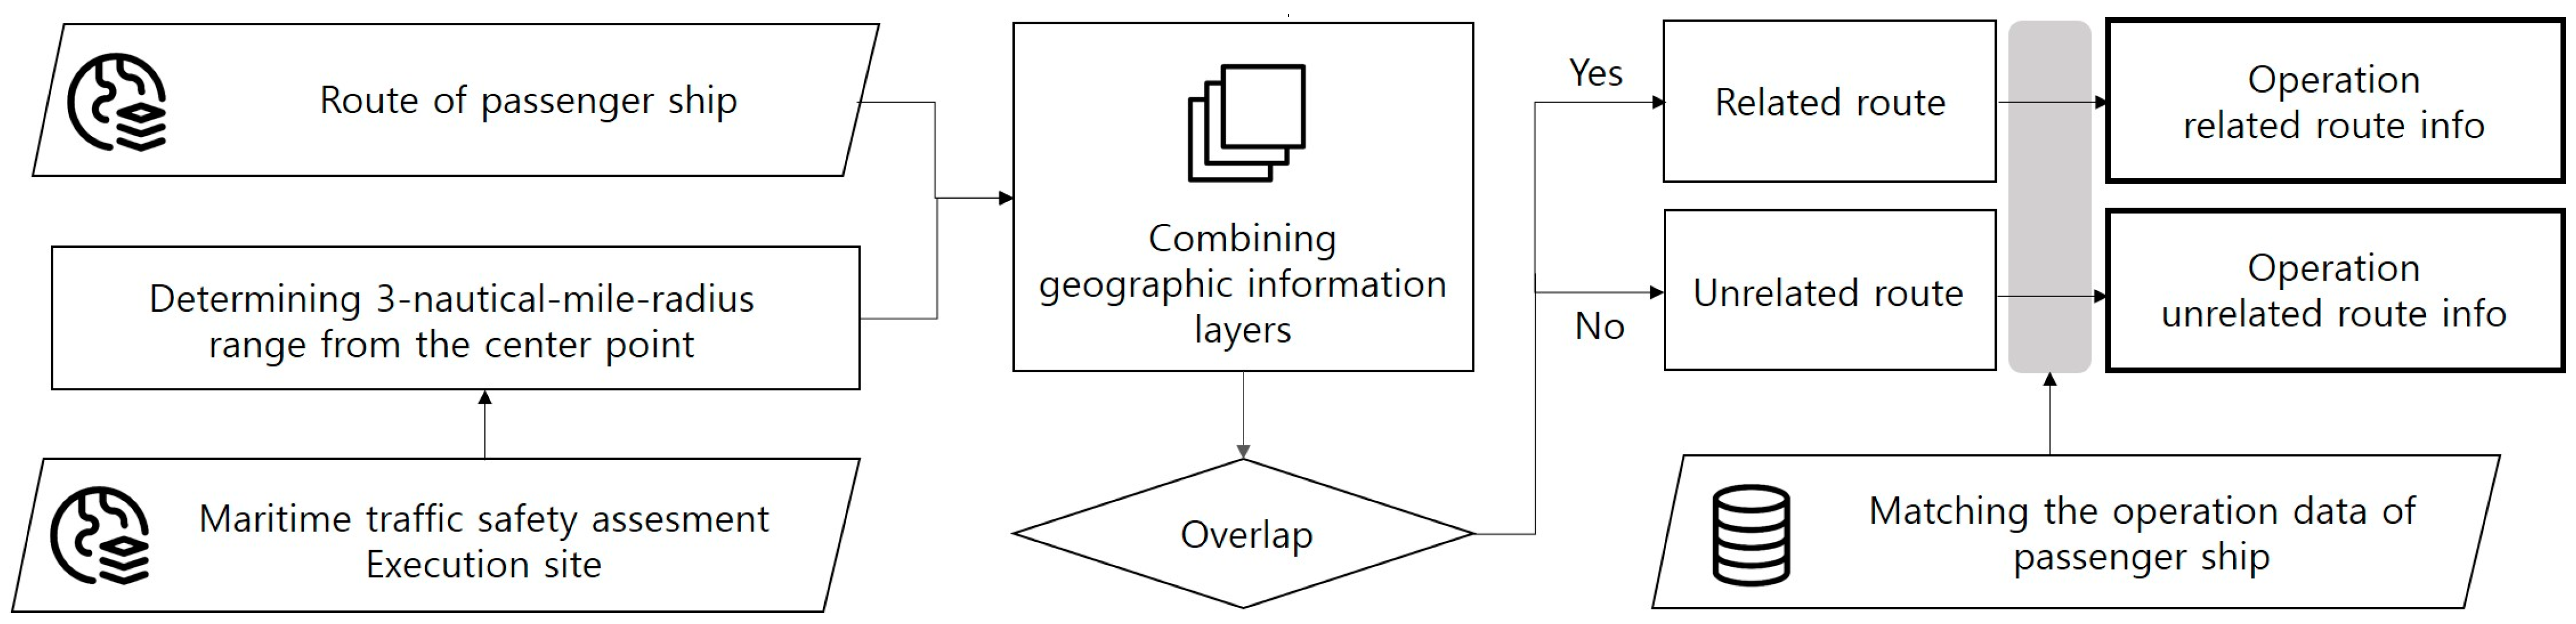
In this context, the distance was measured at three nautical miles (NMs) as the criterion for adjacency between the maritime route and the MTSA-assessed project site. This choice was based on the technical standards specifying the requirement for surveying the status within a range of 3 NM from the marine development project site during MTSA implementation.
By performing this process, maritime routes intersecting within a radius of 3 NM of the MTSA-assessed project site were classified as MTSA-related routes, whereas those that do not intersect within this radius were categorized as MTSA-unrelated routes.
3.2.2. Classification of MTSA-Related Accidents Based on Accident Types and Occurrence Locations
Marine accidents can be broadly categorized into human and environmental categories. MTSA is related to environmental factors, which refer to the physical and systematic conditions required for vessel navigation.
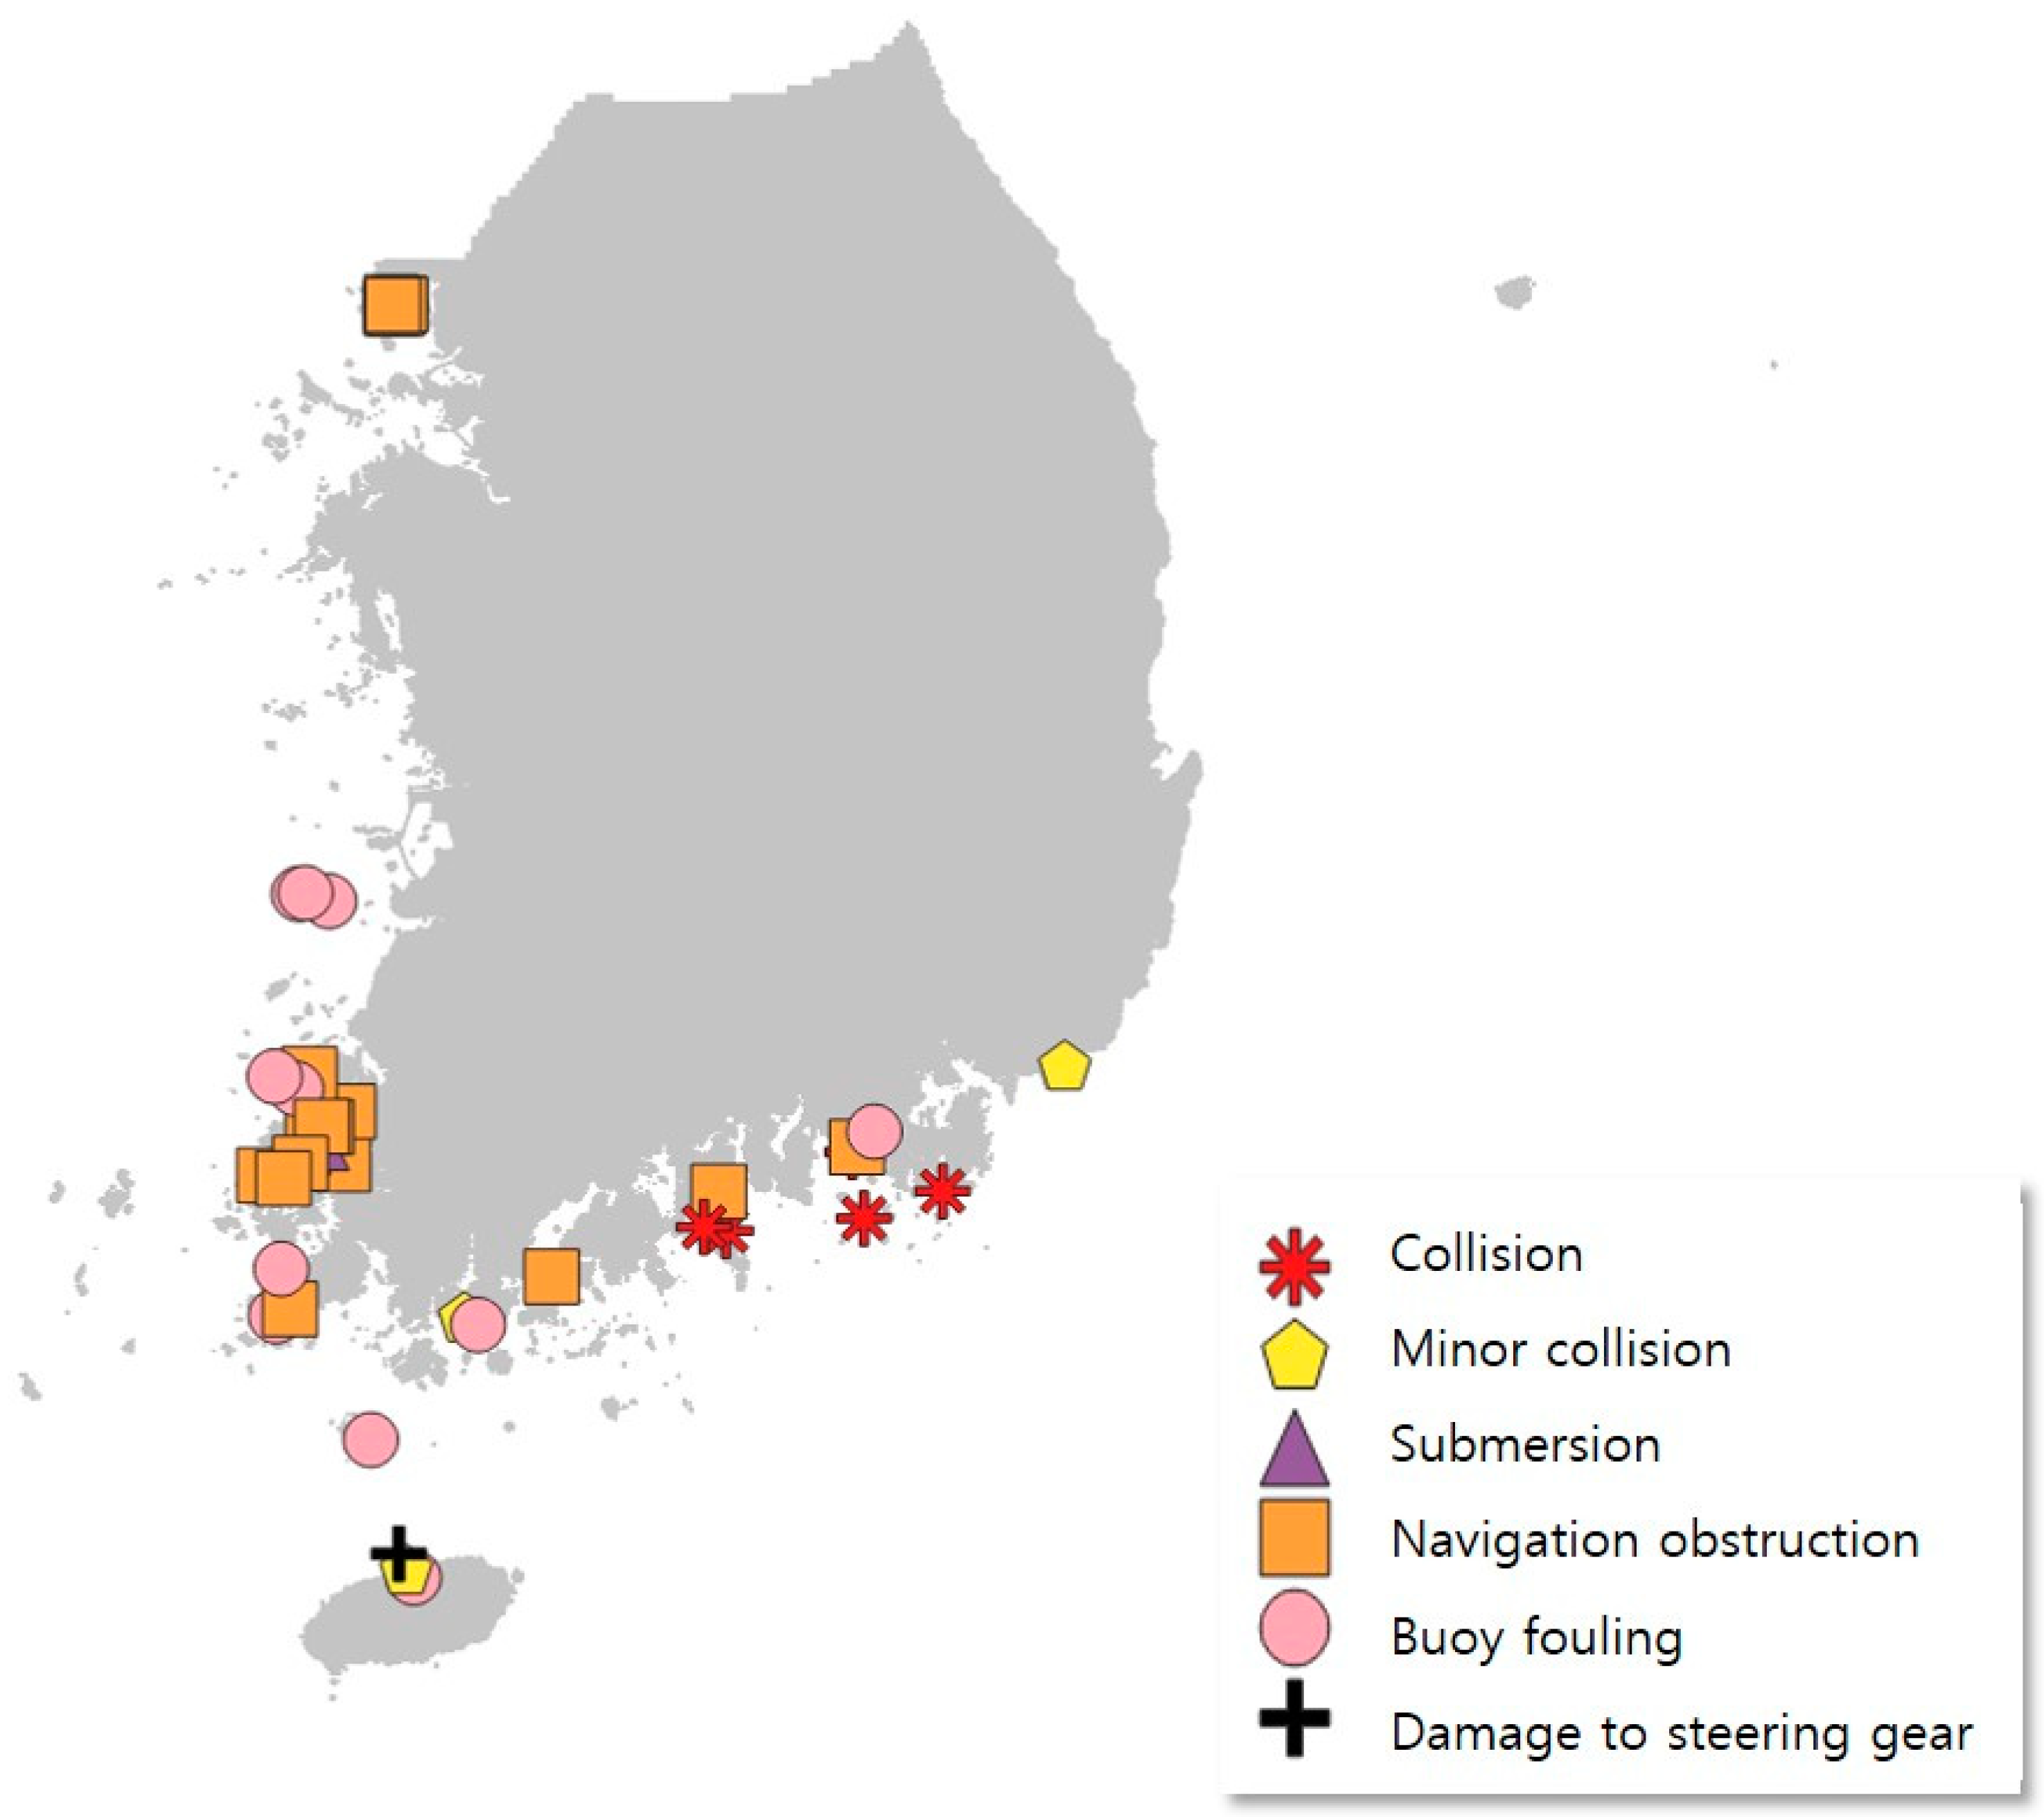
In this study, we focused on quantitatively deriving the reduction in marine accidents using MTSA. Therefore, accidents related to human elements indirectly associated with MTSA and incidents unrelated to vessel operations, such as equipment damage, were excluded. Consequently, accident types considered amenable to reduction through MTSA were classified into seven categories: collision, minor collision, grounding, buoy fouling, navigation obstruction, submersion, and damage to the steering gear; these are shown in
Table 2.
Among these categories, minor collisions represent the most direct accidents involving collisions related to MTSA resulting in facilities, whereas the remaining six accidents are considered to be relatively indirect.
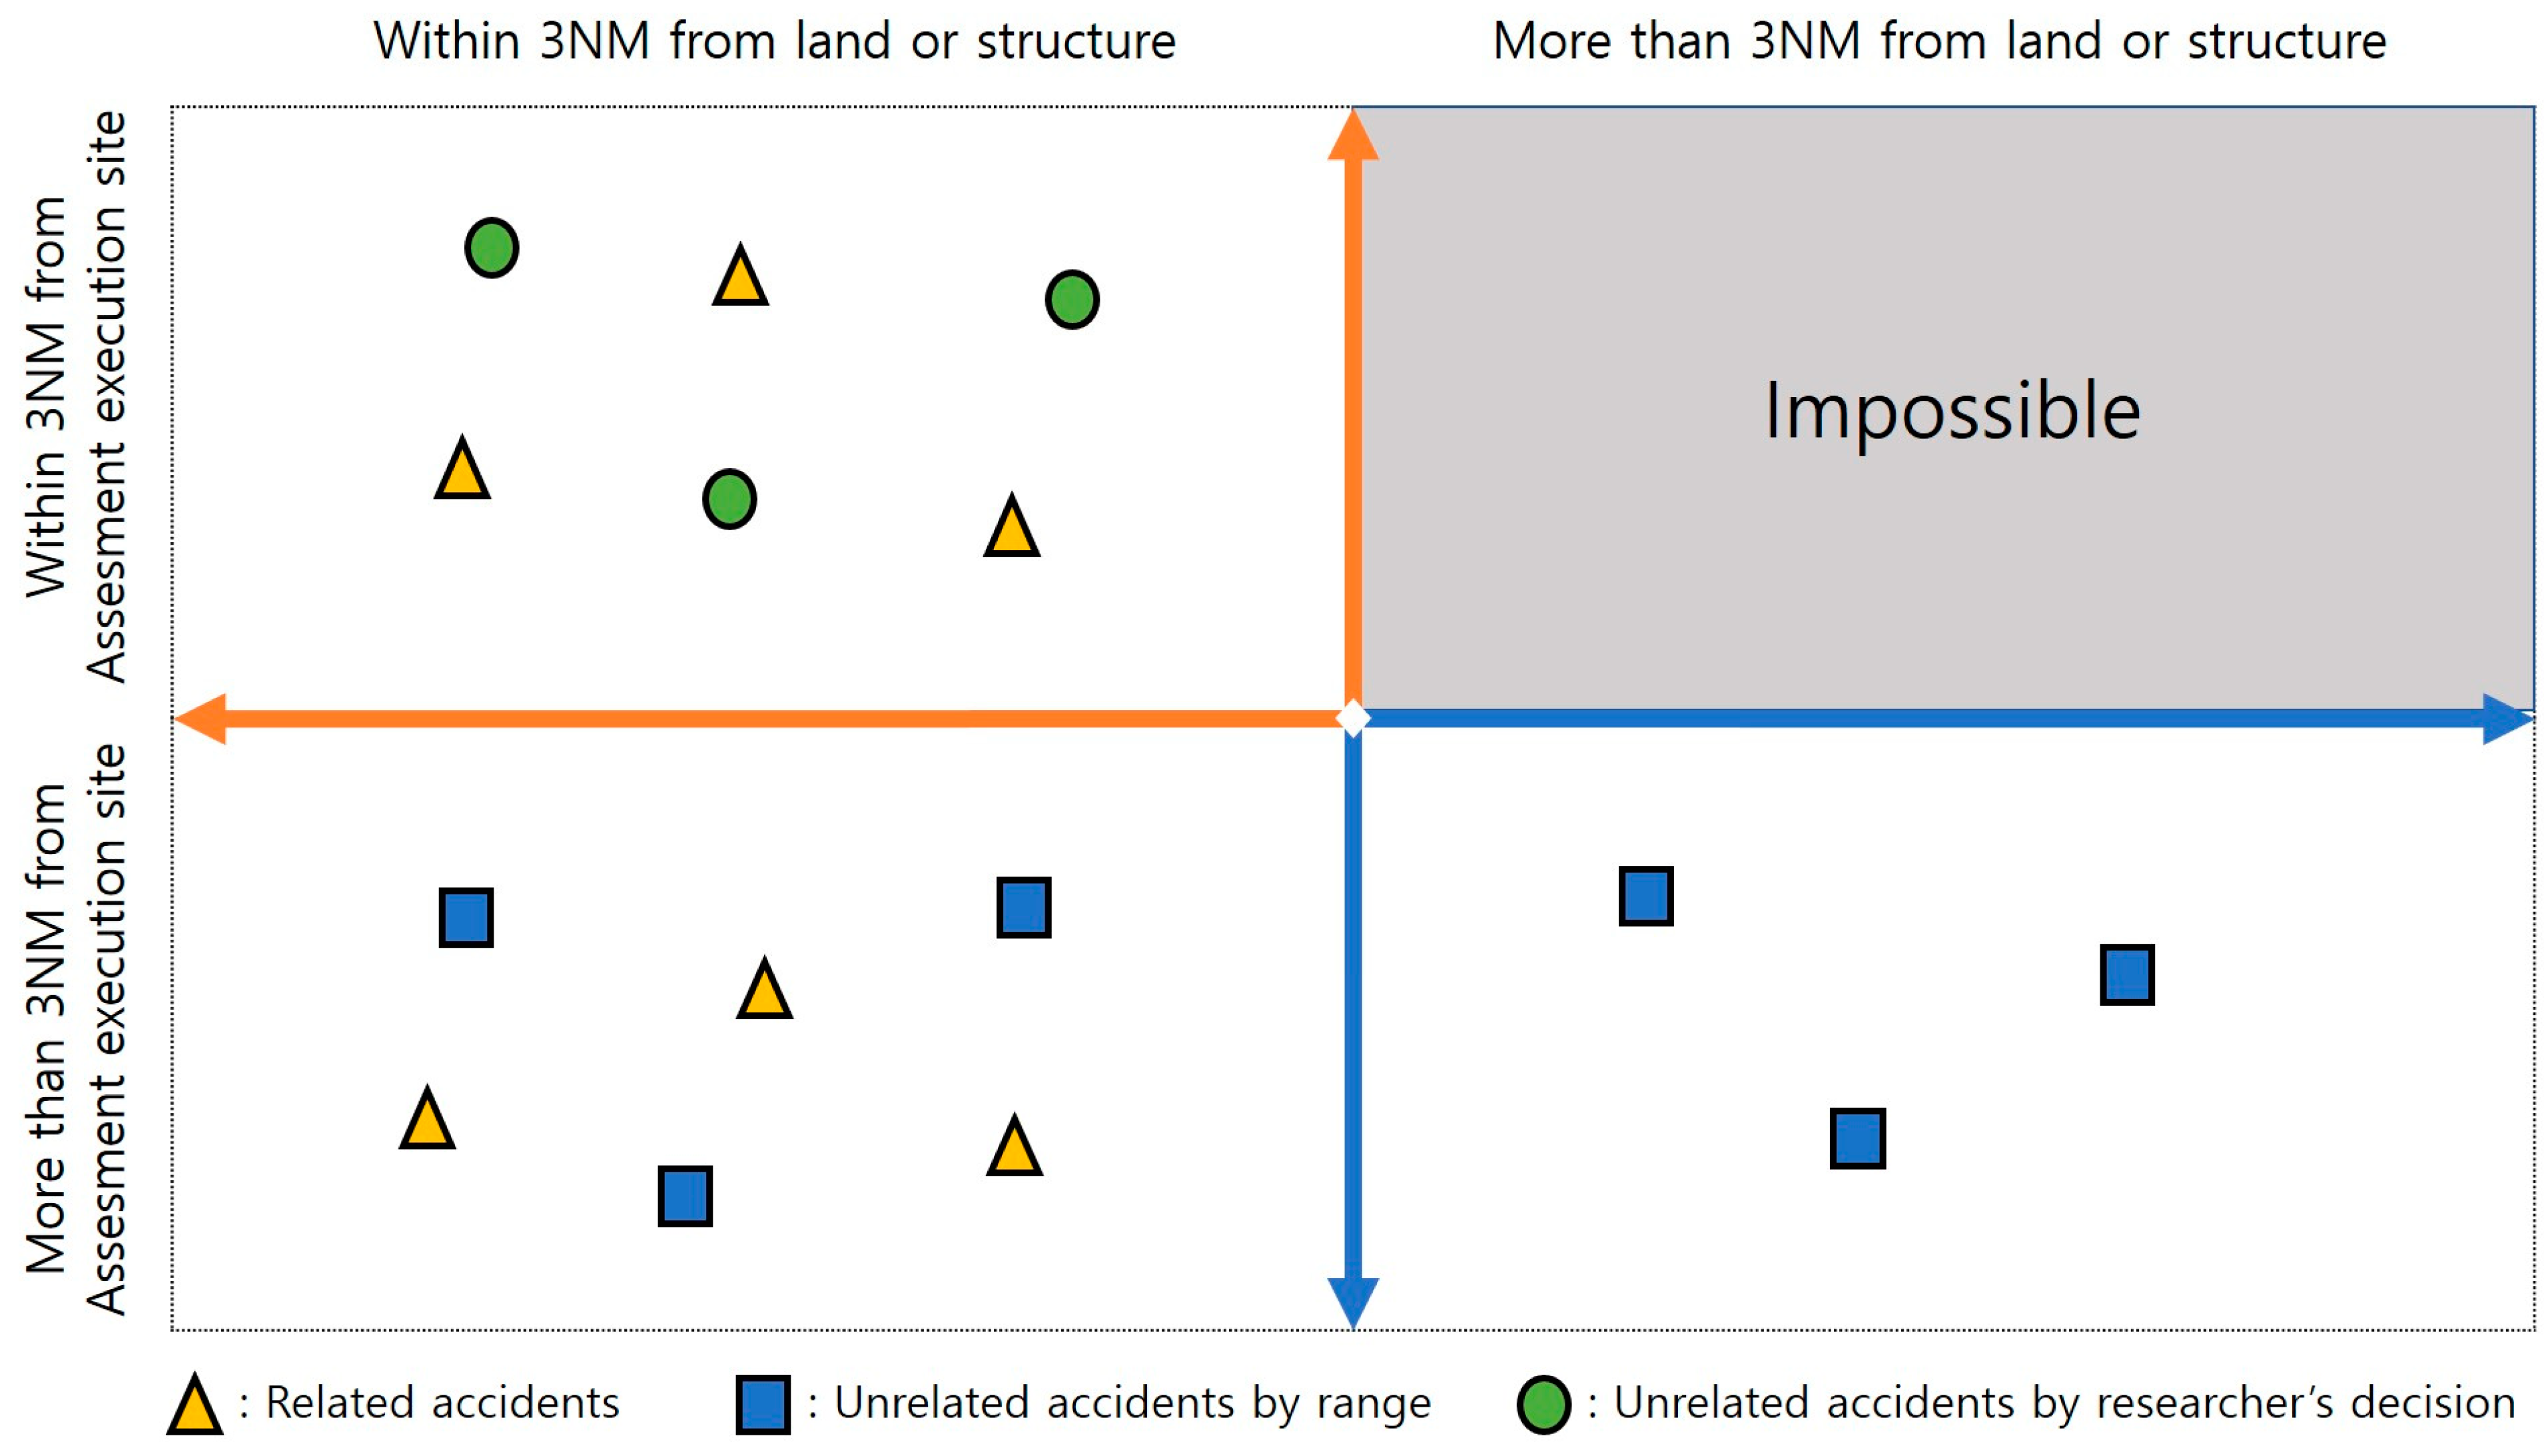
However, not all seven types of marine accidents can be classified as MTSA-related. Spatial connections, including the location of marine accidents and the distance from the marine development project site, should be carefully considered. Thus, to identify MTSA-related accidents based on their location relative to the MTSA-assessed project site, the following criteria were established:
Initially, the grouping of accidents was based on their distance from the marine development project site or land-based structures.
Within each group, to identify MTSA-related accidents, a detailed examination of the accident locations was conducted based on the criteria outlined below.
Further details on this process are provided in
Section 4.2.
3.3. Data Sampling Methodology
When incorporating imbalanced data into a model, there is a concern in that while the majority class may have high accuracy, biased results with low accuracy may be obtained for the minority class. To address this issue, several sampling methods have been proposed [
28]. Sampling techniques alter the class distribution of imbalanced data to create balanced data, which are typically classified into two categories: undersampling, where instances of the majority class are removed, and oversampling, where instances of the minority class are artificially increased.
Unlike simple methods that merely replicate instances of the minority class, SMOTE innovatively crafts synthetic samples through interpolation between existing instances of the minority class [
29]. This expansion leads to a more diverse and enriched decision space boundary, which is useful for applying ML algorithm models.
3.4. MTSA-Related Accident Reduction Rate Theory
The MTSA-related ARR is the ratio of the decrease in MTSA-related accidents at MTSA-assessed project sites to those at unassessed project sites.
First, coastal passenger ship operation information near MTSA-unassessed project sites and the history of MTSA-related accidents were combined into a dataset. This dataset was then used to train a pre-implemented ML algorithm to derive the feature importance.
Second, the trained model from the first step was applied to recent coastal passenger-ship operation information near the MTSA-assessed project sites. If safety diagnostics were not performed, the probability of future MTSA-related accidents could be determined. This probability was then summed to obtain the number of accidents before applying MTSA (BNA).
Third, the annual average number of MTSA-related accidents occurring on coastal passenger ships operating near the MTSA-assessed project sites was calculated. This number represented the number of accident cases after the application of MTSA (ANA).
In the second and third steps, the BNA and ANA were calculated under the same environmental conditions. These values were substituted into Equation (1) to derive the MTSA-related ARR.
3.5. ML Algorithm Methodology
Ensemble learning is a widely used ML technique that combines multiple decision trees [
30,
31]. In ensemble learning, the combination of various weak ML models enables the development of a stronger model with more accurate predictions [
32].
The random forest technique applies the bootstrap aggregation (bagging) approach [
33]. The random forest algorithm was applied to the training set using the following formula: in this process, bagging is repeated B times, and each repetition involves selecting random samples to fit trees to the sample [
27]. The formula for this random forest is shown in Equation (2):
where the elements are defined as follows:
B: number of bagging iterations.
: output the ensemble of trees.
: results of random forest regression.
4. Data Pre-Processing
4.1. Data Collection
The first step involved the collection of past MTSA performance data. This included gathering available datasets from the Korea Maritime Transportation Safety Authority (KOMSA) regarding MTSA implementation from 2010 to 2014, before the scope of the MTSA system was reduced in accordance with the marine development project cycle mentioned in
Section 3.1. During this period, 75 MTSAs were implemented. The data columns are structured as shown in
Table 3.
The second step involved the collection of information on coastal passenger ships and marine accidents. Data on the sailing of coastal passenger ships from 2017 to 2022 were collected from open data provided by the Korea Shipping Association (KSA). In addition, marine accident occurrence data for coastal passenger ships from 2017 to 2022 were collected from KOMSA. The major data column structures are listed in
Table 4 below.
4.2. Data Analysis and Processing
Based on the collected data, we identified the connections between maritime routes for coastal passenger ships, marine accidents, and past MTSA-assessed project sites. By performing this process, three types of data were derived: MTSA-related routes associated with past MTSA-assessed project sites, MTSA-unrelated routes, and marine accidents that occurred along each route.
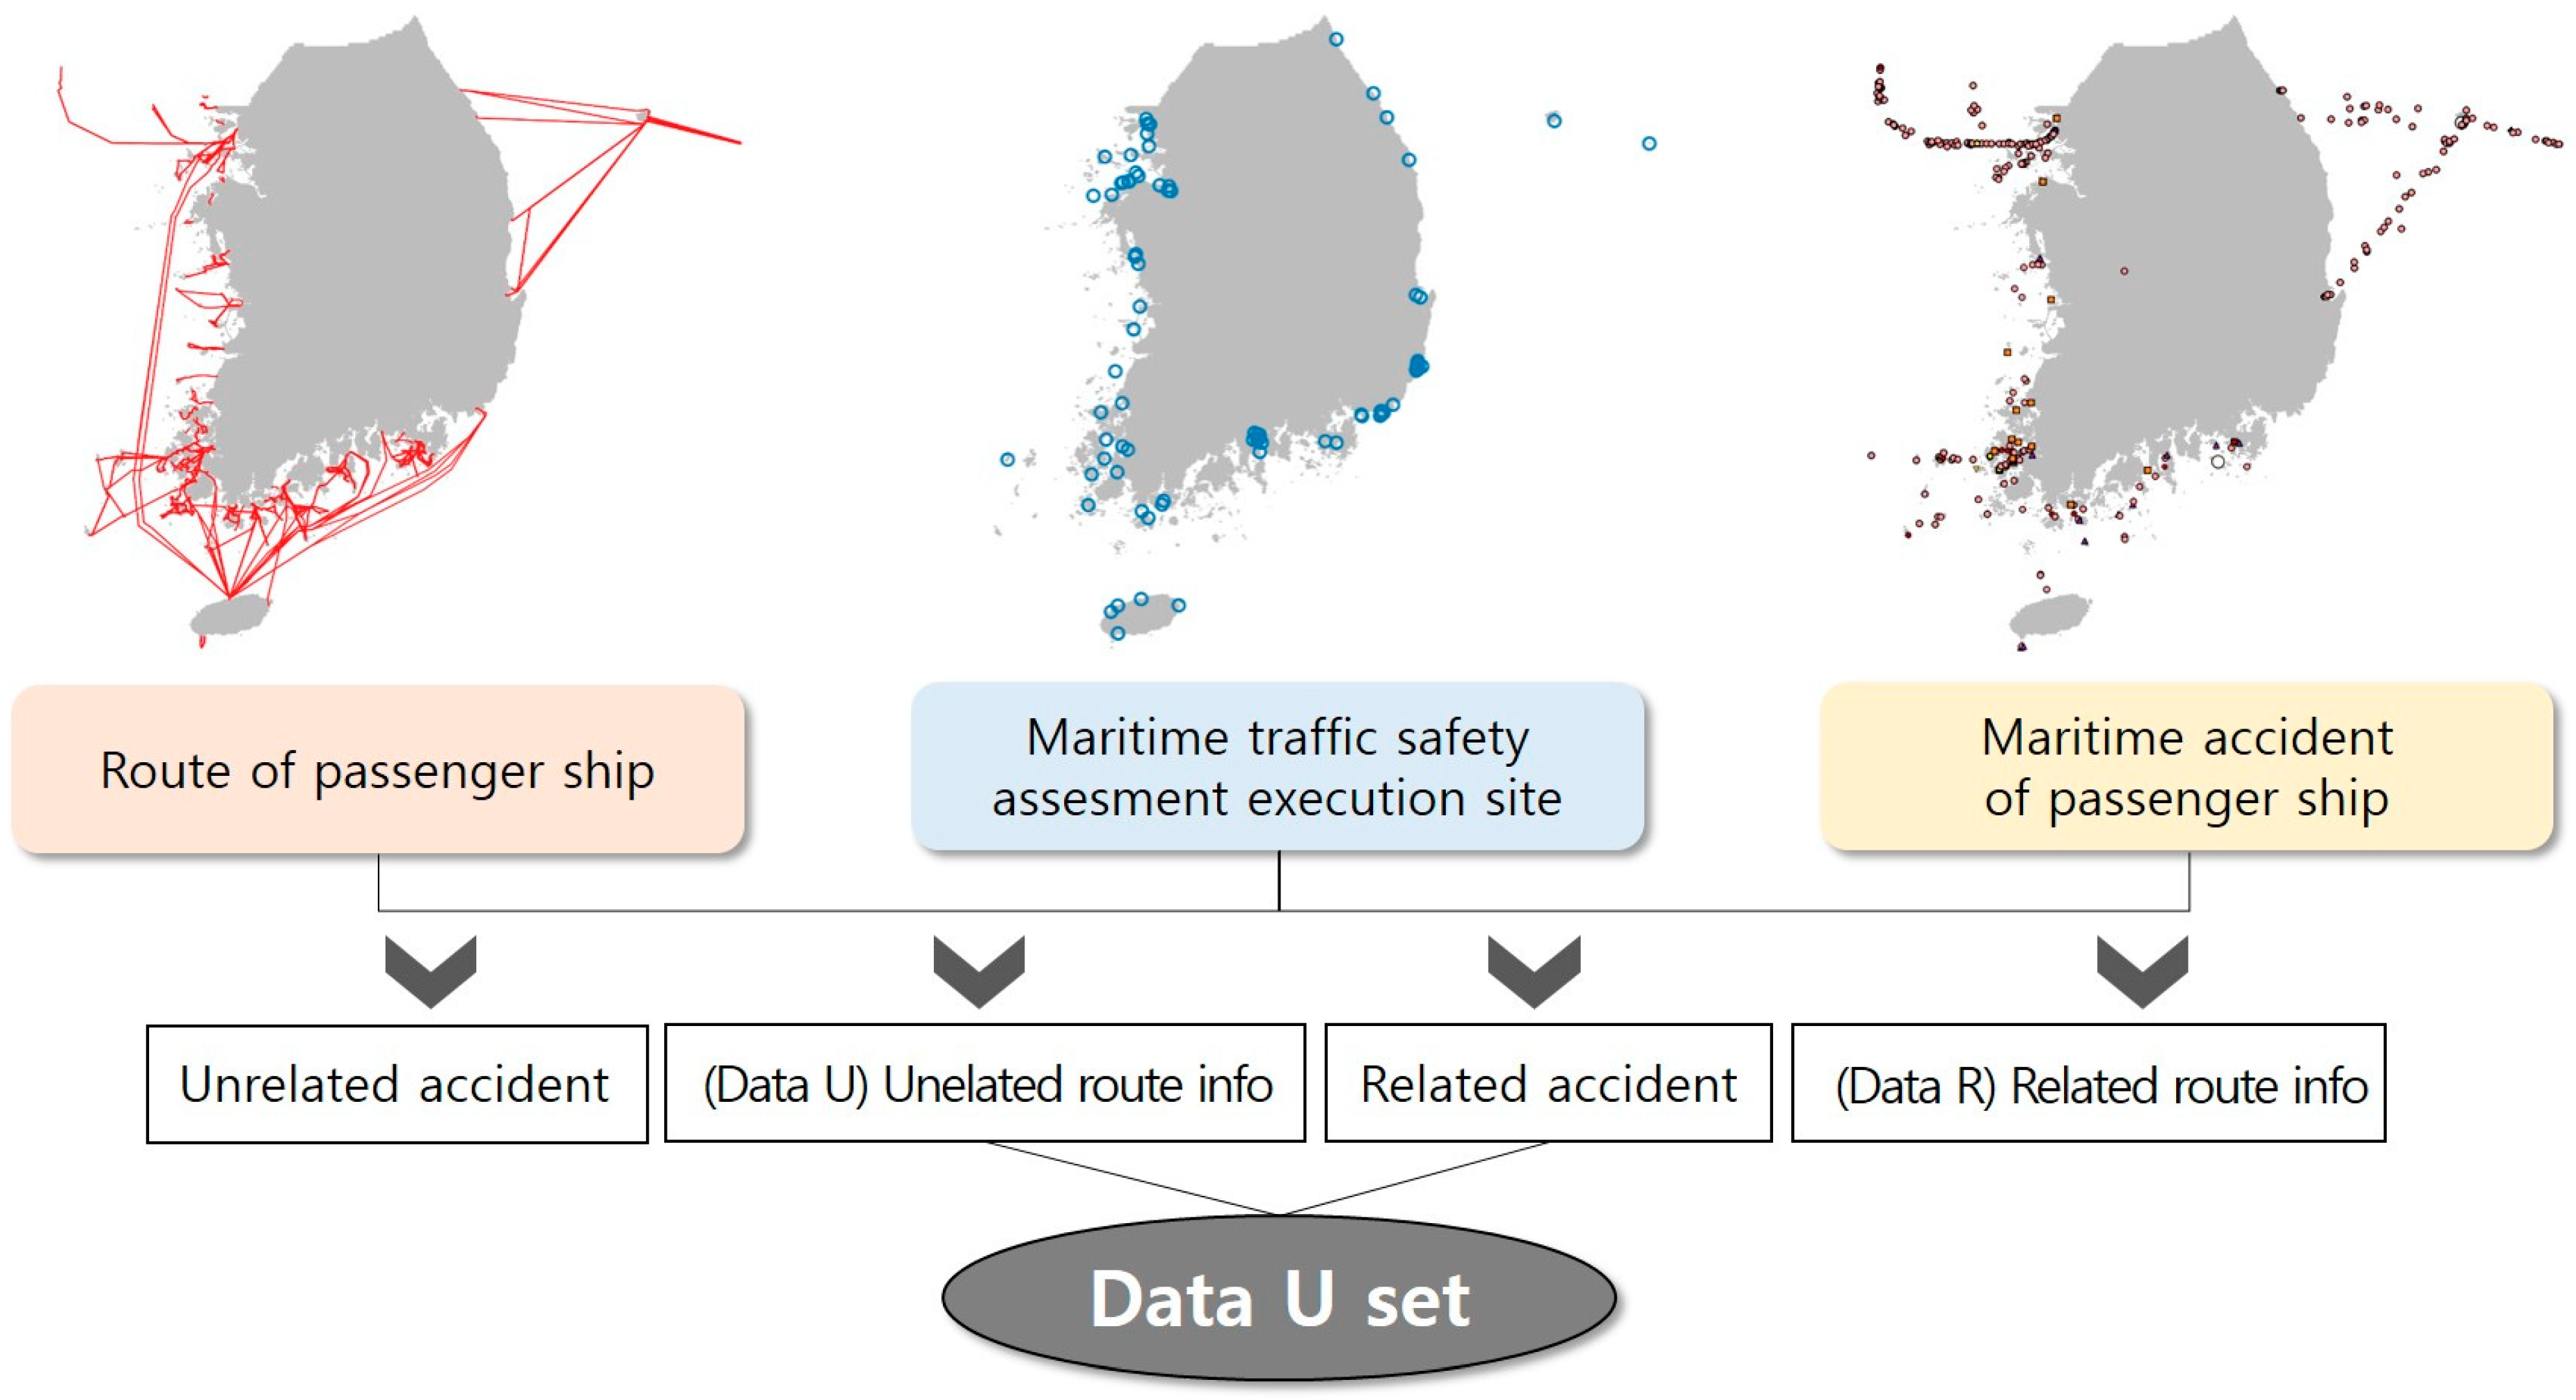
Here, we denote the combination of MTSA-unrelated route information and MTSA-related accident data as the original dataset set U. The configuration of the original dataset U is shown in
Figure 3. In addition, as mentioned in
Section 4.4, the dataset obtained after applying SMOTE was named SMOTE dataset U.
The modeling process involved training the algorithm on the SMOTE Data U set and then testing it on MTSA-related route information. This process was conducted twice. The analysis and processing steps for each dataset are illustrated in
Figure 3.
The process of deriving MTSA-unrelated route information and MTSA-related route information and the extraction of MTSA-related accidents were performed using QGIS software. QGIS is the most popular free geospatial software available worldwide. We used QGIS version 3.28 and executed it on a machine with 8 GB of RAM and an Intel Core i3 3.60 GHz CPU.
4.2.1. Classification and Calculation of Coastal Passenger Ship Routes and Operation Frequency
First, we sequentially connected point-shaped data representing waypoints to construct linear coastal passenger ship routes. Next, we visualized the locations and extents of MTSA-assessed project sites from 2010 to 2014 using GIS software. Based on the range of each project site, we calculated the centroid of the objects and generated circular ranges with a radius of 3 NM from the centroid, as per the distance criterion mentioned in
Section 3.2.1.
By overlaying these two spatial information layers, we measured whether the distance between each route and the location of past MTSA-assessed project sites was within 3 NM. If the distance was 3 NM or less, we classified the route as an “MTSA-related route;” if the distance exceeded 3 NM, we categorized it as an “MTSA-unrelated route.” These classification methods are summarized in
Figure 4.
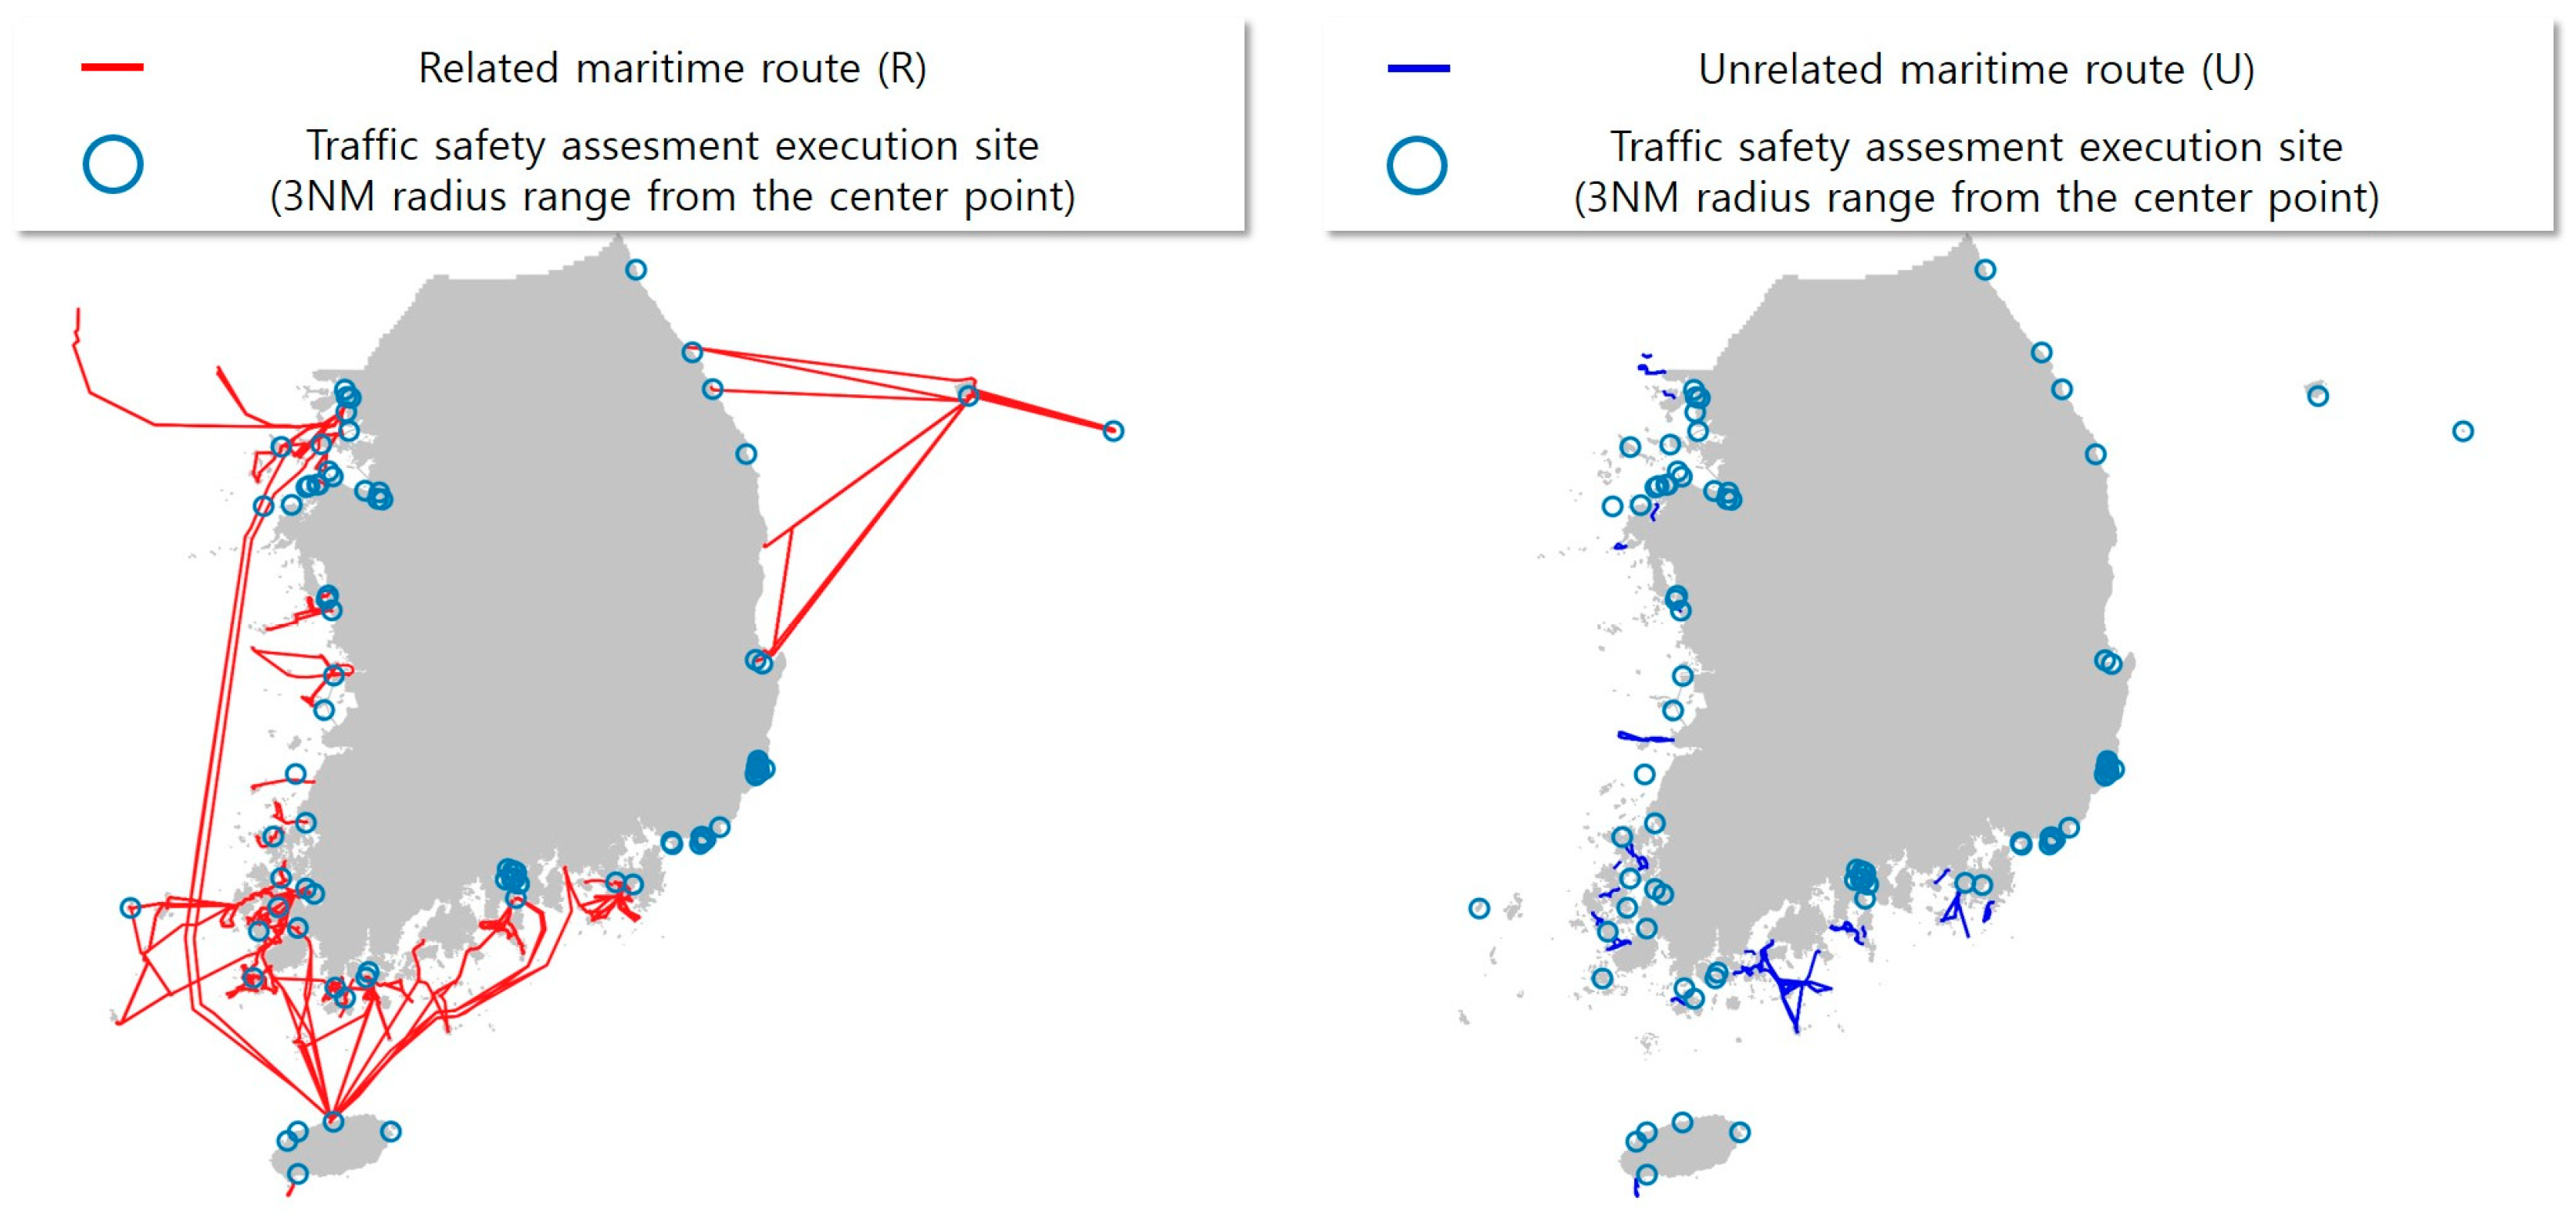
To organize the operational information for the classified routes, we combined annual sailing information based on port calls for each route and port data for each route to derive sailing information from 2017 to 2022 for both “MTSA-related routes” and “MTSA-unrelated routes.” The derived results are shown in
Figure 5 and in
Table 5.
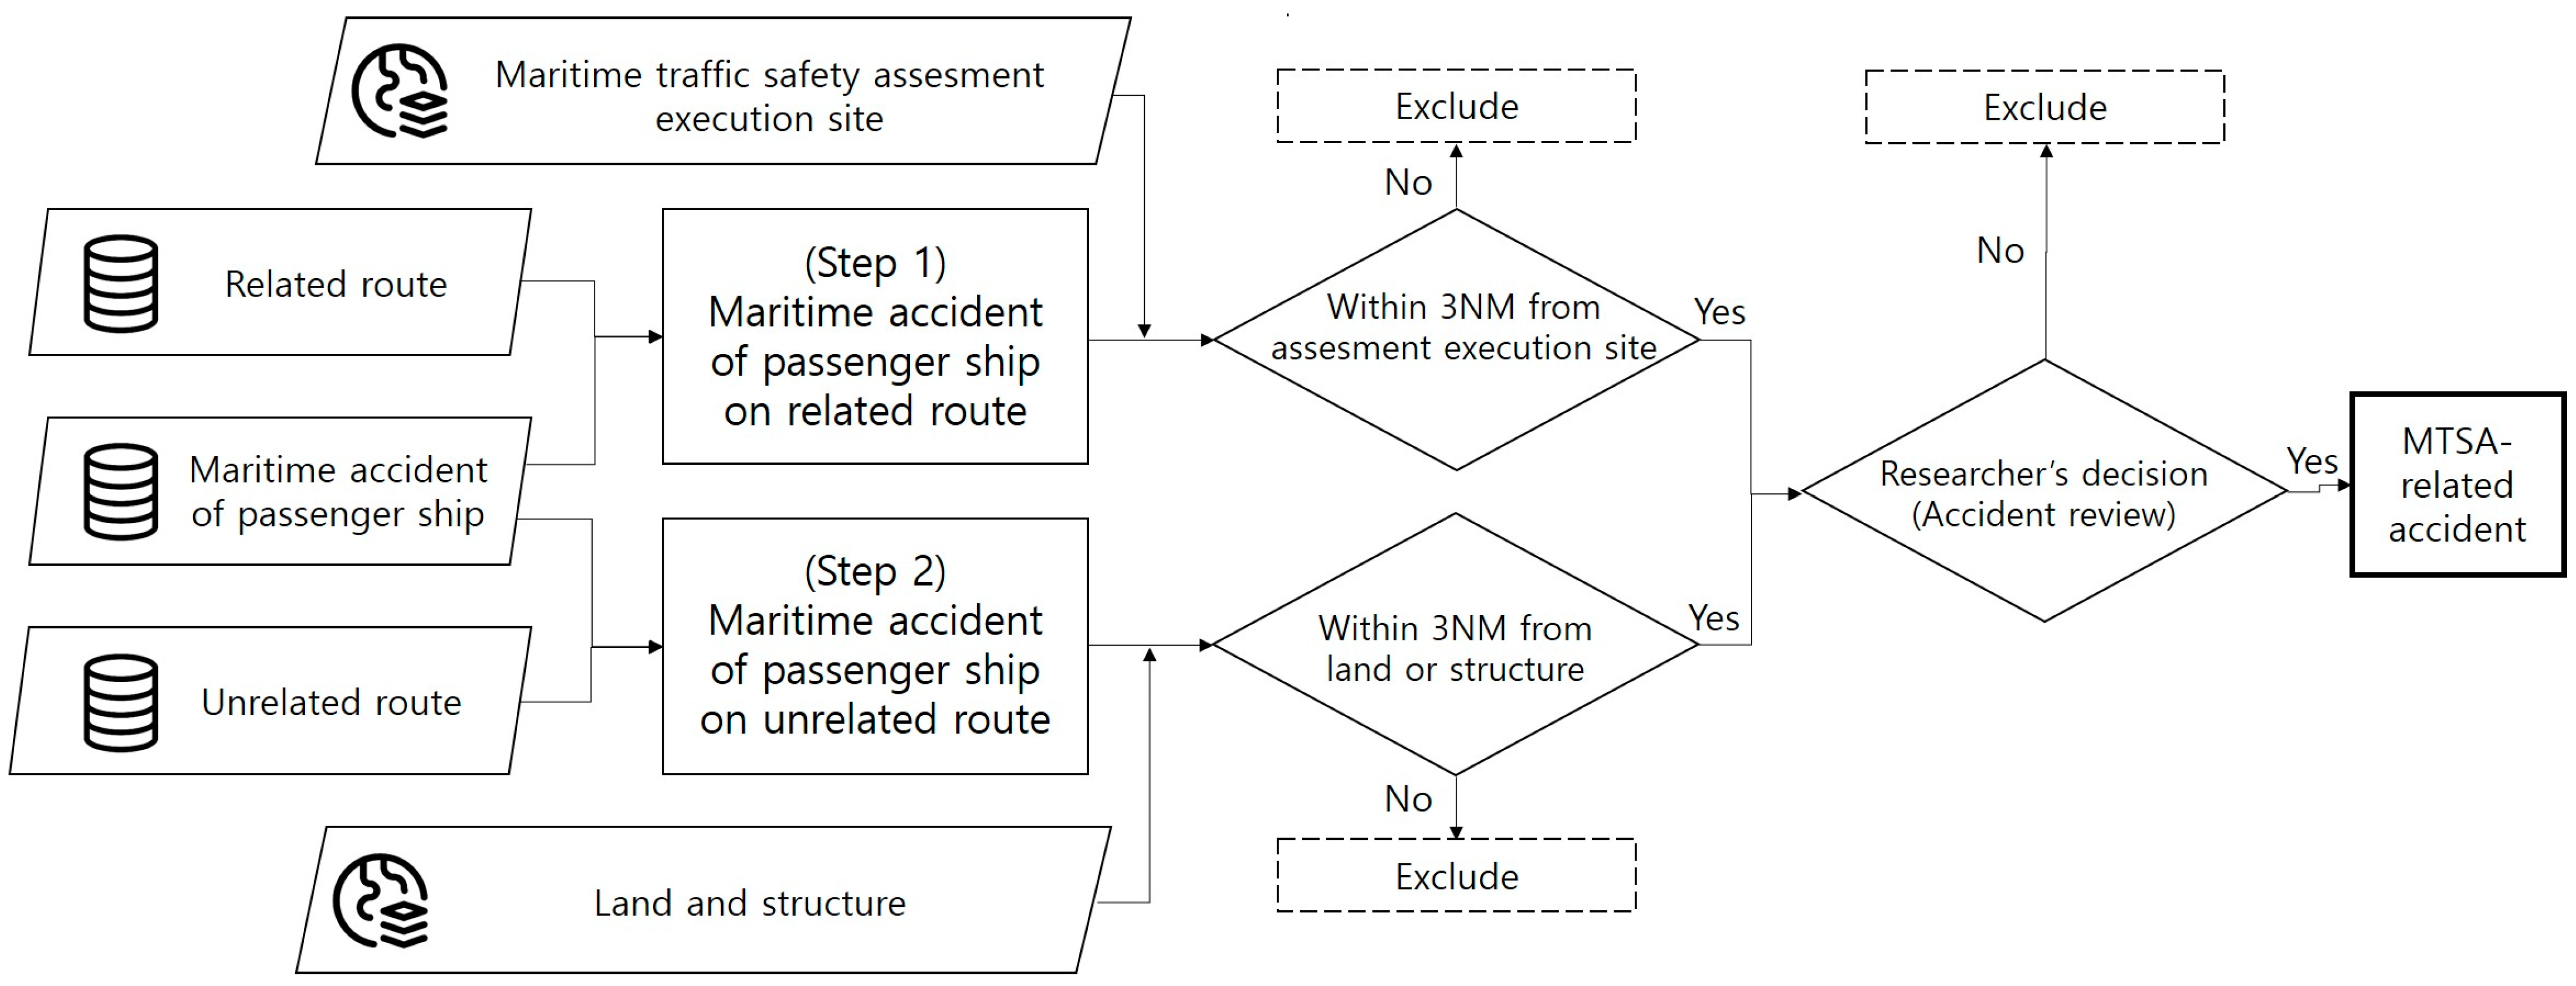
4.2.2. Classification of MTSA-Related Accidents
The marine accident data utilized in this study included the maritime routes of passenger ships involved in accidents. Therefore, by combining the reviewed sailing data on maritime routes, it is possible to distinguish between ships operating on MTSA-related routes and marine accidents on MTSA-unrelated routes. In addition, the association between marine accidents and MTSA was examined. This process allowed for the identification of MTSA-related accidents and MTSA-unrelated accidents. This process is illustrated in
Figure 6.
First, an overlay analysis of marine accidents and MTSA-related route data was conducted to identify marine accidents involving coastal passenger ships on MTSA-related routes. Subsequently, these data were implemented in the GIS software, and the location information of past MTSA-assessed project sites was input. Marine accidents occurring within 3 NM of the centroid of the project site boundary objects were extracted. Then, based on the maritime spatial characteristics of the extracted marine accident locations and the criteria mentioned in
Table 2 of
Section 3.2.2 regarding the classification of MTSA-related accidents, MTSA-related accidents on MTSA-related routes were confirmed.
Second, marine accident data were overlaid with data on MTSA-unrelated routes, and an analysis was conducted to identify marine accidents involving coastal passenger ships on MTSA-unrelated routes. These data were visualized in GIS software to verify whether marine accident locations were within 3 NM of various nearby structures (such as ports, piers, and bridges) where MTSA was not previously conducted. Marine accident data beyond 3 NM were excluded from this study. The marine accident classification is illustrated in
Figure 7, and the corresponding results are presented in
Figure 8 and
Table 6.
4.3. Data Pre-Processing
To effectively utilize raw data in ML algorithms, they should be transformed into a suitable format, and data pre-processing plays a crucial role in this regard. Data pre-processing involves the selection of variables to eliminate irrelevant features, thereby enhancing the performance of ML algorithms and reducing computational complexity. In this study, the data were subjected to four key stages to ensure the suitability of the classification techniques.
First, the categorical variables were simplified. For example, in the marine accident column, a One-Hot Encoding process was applied, where occurrences of marine accidents were assigned a value of 1, and instances where no marine accidents occurred were assigned a value of 0.
Second, columns deemed simple strings or those with low relevance were excluded during the data collection stage.
Third, if special characters such as dashes or underscores were inserted into the numerical variables in the raw data, they were all removed to reflect only pure numbers.
Finally, to address the issue of class imbalance, a synthetic minority oversampling technique (SMOTE) was applied using a model [
34]. Further details regarding SMOTE are provided in
Section 4.4.
In addition, to better evaluate the proposed ML algorithm model, a subset of the original Data U set was utilized. This subset consisted of 10 instances representing MTSA-related accident occurrences (label 1) of a total of 47 instances, and 10 instances representing no MTSA-related accidents (label 0). These instances were randomly sampled and used for ML model evaluation.
4.4. Execution of Synthetic Minority Oversampling Technique (SMOTE)
After constructing the original Data U set, the class imbalance issue of the dataset was addressed using SMOTE. This approach significantly improves the distribution of each class. Consequently, newly generated instances exhibit high similarity to the original data distribution [
35,
36].
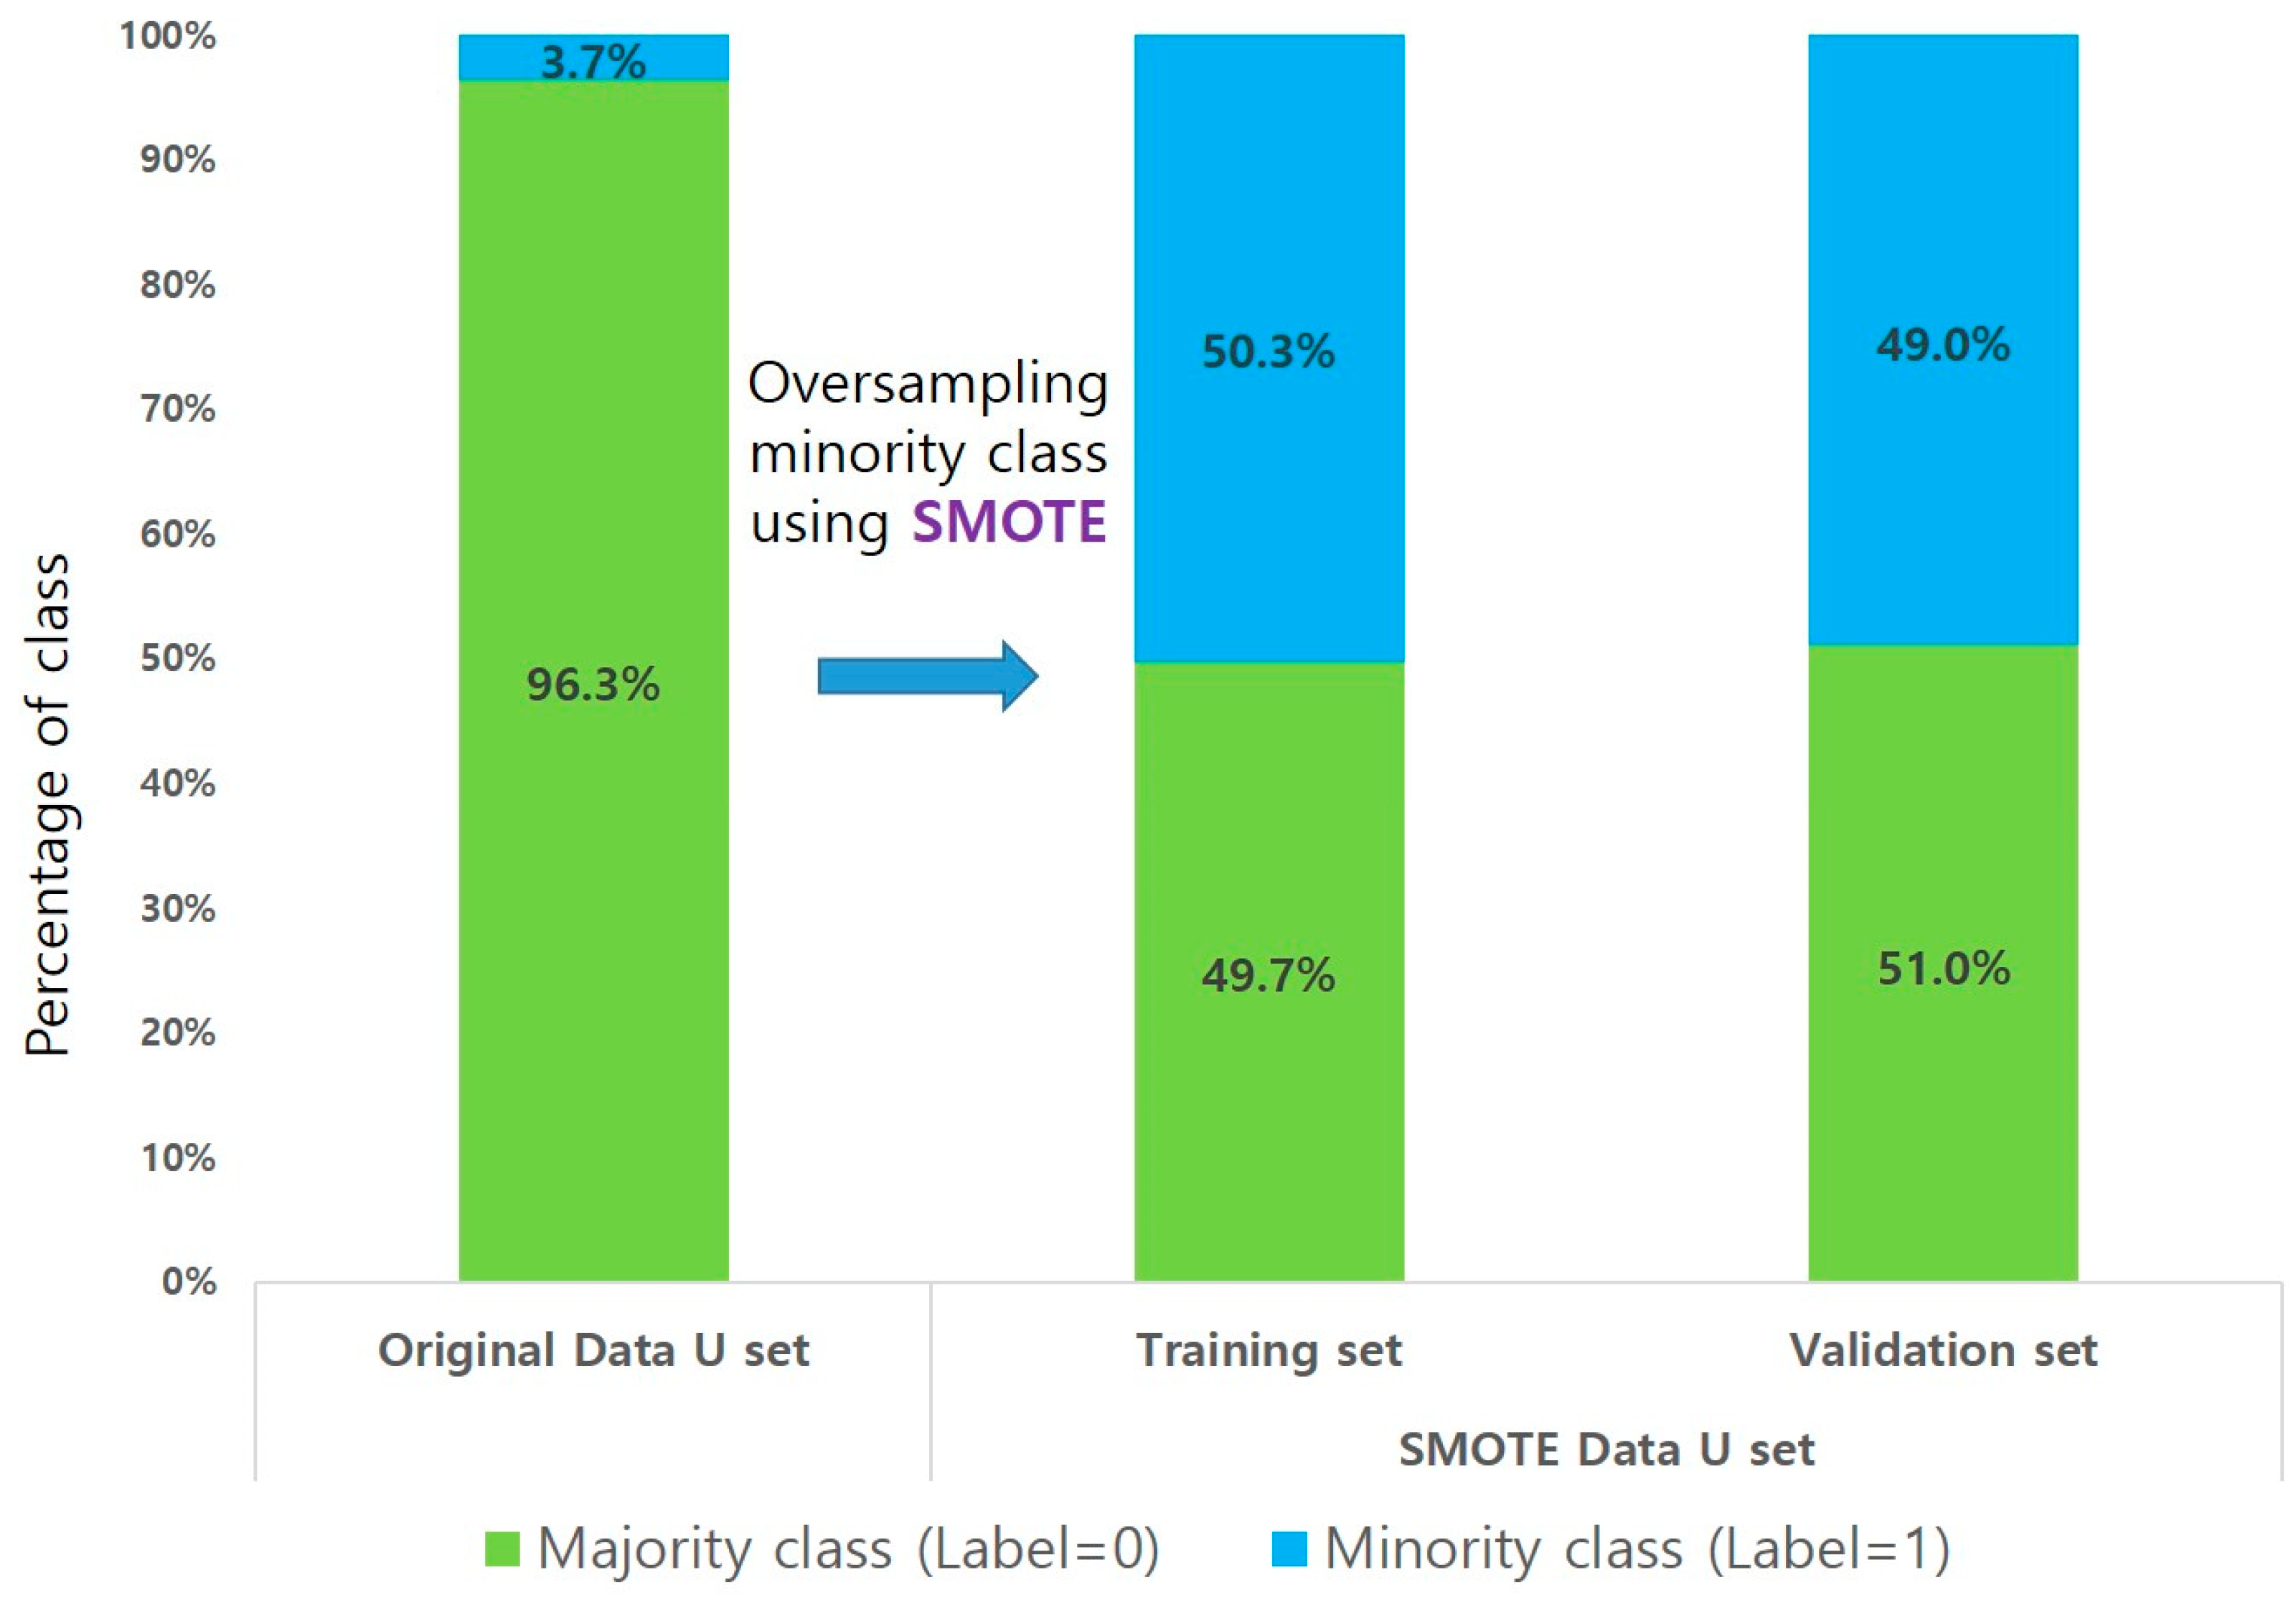
Using the SMOTE method, the number of groups related to MTSA-related accidents and non-accidents within the original U set was equalized to 50.0%.
The SMOTE Data U set, which underwent oversampling using the SMOTE technique, was then divided into a training set consisting of 1560 groups, accounting for 80%, and a validation set consisting of 390 groups, representing 20%, using random sampling. The distribution of classes in each dataset was balanced, as depicted in
Figure 9.
5. Application of Marine Accident Occurrence Prediction Model and Results
5.1. Characteristics of Data U Set
First, the characteristics of the Data U dataset were analyzed. In the original Data U set, the group in which related accidents occurred most had a travel distance of less than 50 km, accounting for 78.38%. Ships with a gross tonnage of 500 tons or more accounted for 43.24% of this group, indicating a relatively high presence of larger vessels. Moreover, approximately 67.57% of the vessels in this group had an annual sailing frequency of over 1600, indicating a correlation between higher sailing frequency and increased occurrence of MTSA-related accidents. The group where MTSA-related accidents occurred accounted for 37 cases (3.66%) within the original Data U set, which was relatively lower than the group where accidents did not occur.
Table 7 illustrates the distribution of the independent variables after applying SMOTE. Using this SMOTE oversampling technique, the imbalance in the distribution of the original Data U set was effectively addressed. The newly generated dataset maintained the characteristics of the original dataset because there were no significant changes in the distribution.
Secondly, the characteristics of the MTSA-related route information used for testing based on the trained model to predict the probability of MTSA-related accidents were as follows: The annual sailing frequency, which exceeded 1600 voyages, accounted for 37.62%, indicating a relatively high frequency of voyages. Voyages covering a distance of less than 50 km annually constituted 55.45%, indicating the prevalence of short-distance voyages. Furthermore, voyages with a duration exceeding 2 h (120 min) per leg accounted for 41.58%. From these data, it can be inferred that although the sailing distance may be short, the duration of the voyages is often considerable. Regarding the total tonnage of coastal passenger ships, vessels weighing less than 300 tons accounted for the majority (45.54%), indicating the prevalence of small vessels.
Table 8 presents the distribution of the characteristics of the main independent variables.
5.2. Training
All the simulations, including model training and prediction analyses, were performed using Google Colaboratory, which is well suited to ML, data science, and education, and thus, served as a platform for simulating our proposed ML method. The experiments were performed on a machine equipped with GPU NVIDIA V100 and 60 GB of RAM.
As described in
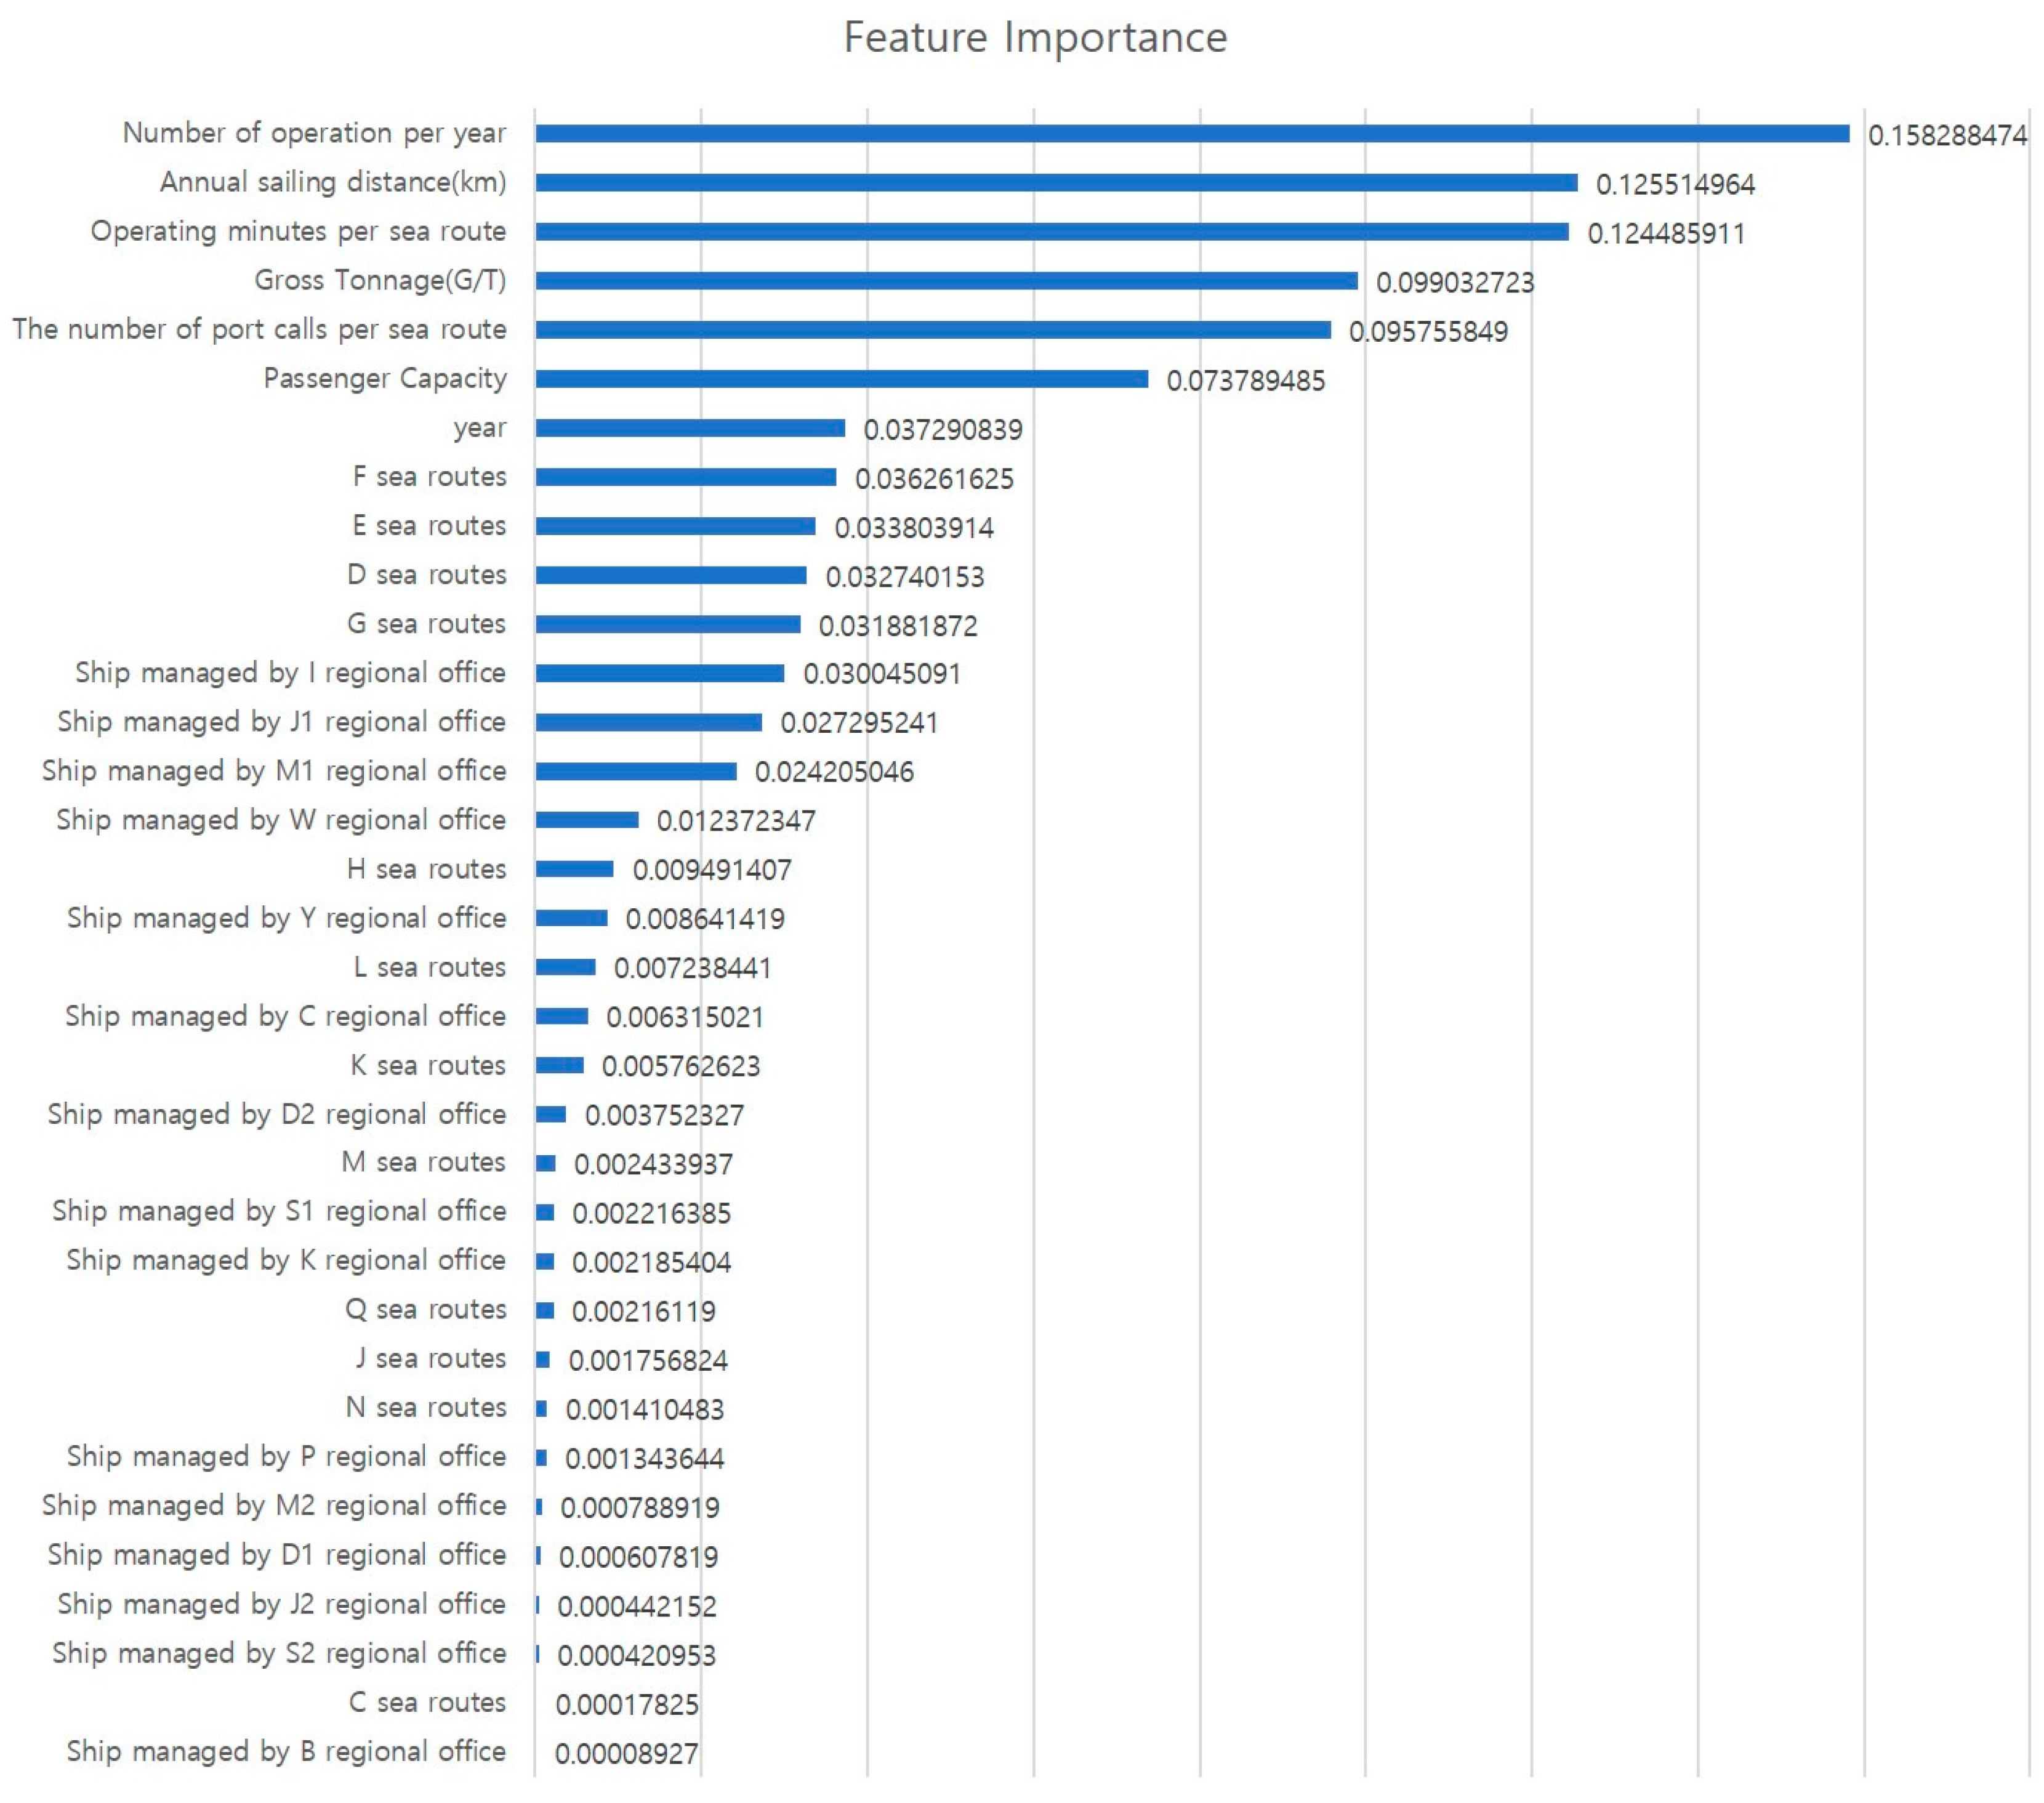
Section 4.4, training was conducted for the related accident-occurrence prediction algorithm on the training set, which accounted for 80% of the SMOTE Data U set. The importance of the derived features is illustrated in
Figure 10.
The six most important features of the ML algorithm are ranked as follows: number of operations per year (0.158288474), annual sailing distance (0.125514964), operating minutes per sea route (0.124485911), gross tonnage (0.099032723), number of port calls per sea route (0.095755849), and passenger capacity (0.073789485).
An assessment of the main characteristics associated with these high-importance features reveals that the frequency of vessel operation, distance traveled, time spent operating, and number of port calls significantly influence the related accidents. In particular, the frequency can be considered from a probabilistic perspective to be the number of attempts made at an event under the same conditions. The likelihood of an event occurring increases with the frequency of attempts.
5.3. Test for Predicting Marine Accident Probability
In
Section 5.3, we discussed the training of a model for predicting the probability of MTSA-related accidents during coastal passenger ship operations based on the SMOTE-applied training set. In this section, the trained model is applied to the 2022 MTSA-related route information for testing, as described in
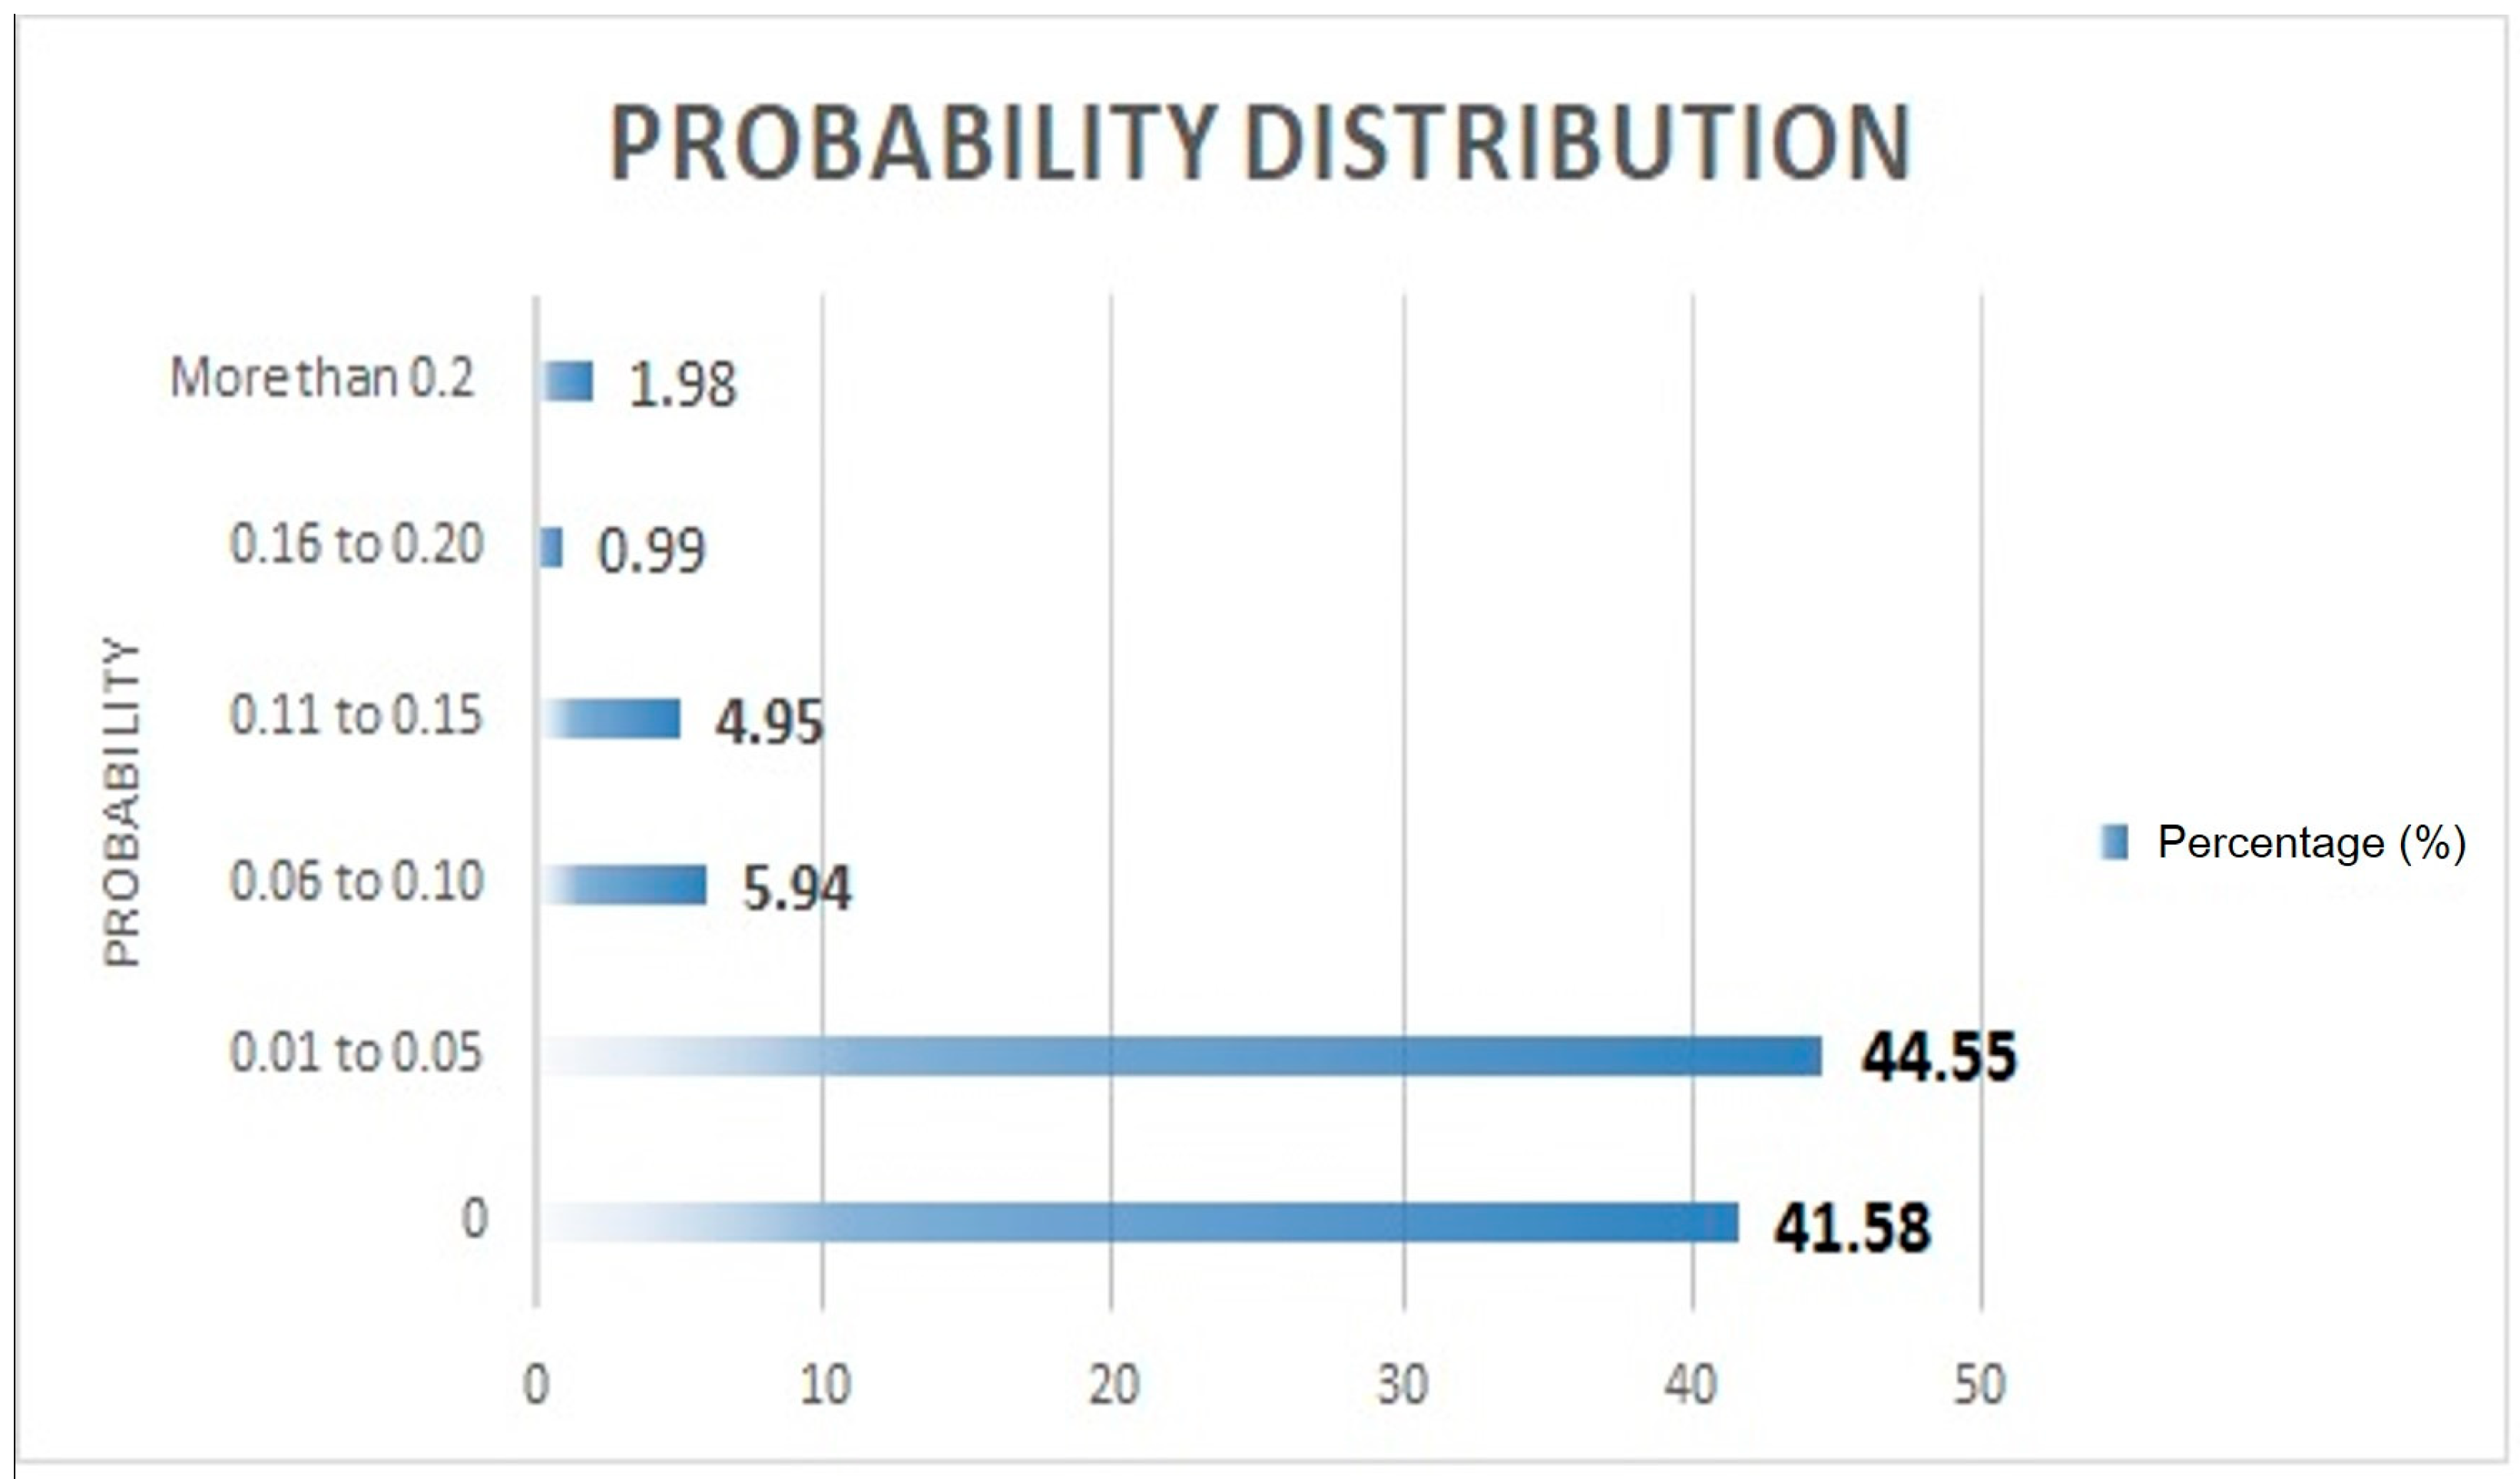
Section 4.2. This process was performed to estimate the probability of related accidents, assuming that the respective project site did not perform MTSA. The MTSA-related route information was divided into individual groups consisting of ship-route-sailing information, and the predicted probabilities of MTSA-related accident occurrences were derived for each group after applying the model. To ensure the accuracy of the experimental results, probabilities below 0.005 were set to zero and the remaining values were rounded to the third decimal place. The distribution of the predicted MTSA-related accident probabilities for the 101 data groups is illustrated in
Figure 11.
5.4. Evaluation of ML Model
To validate the SMOTE Data U set, the precision, recall, F1 Score, and accuracy were calculated. For the validation, 20% of the SMOTE Data U set was used as the validation set. Moreover, to better evaluate the ML model, the original Data U set was evaluated. The results of validation and evaluation are presented in
Table 9 and
Table 10, respectively.
5.5. Reduction in MTSA-Related Accidents upon Implementation of MTSA
5.5.1. Annual Number of Cases of Accidents before Application of MTSA (BNA)
The collection of all possible events, represented as a set, is called the sample space. If the sample space is denoted by Ω, and assuming an experiment A is conducted under exactly the same conditions repeatedly n times, with the occurrence of A denoted as n(A), then the probability (P) of event A is represented as P(A) and is defined as follows, according to Equation (3):
Considering A as an MTSA-related accident and n as the number of data groups for passenger ship operations, the derived probability (P) P(A) can be interpreted as the expected number of MTSA-related accidents per data group in the 2022 MTSA-related route information. Following this logic, by summing the individual real-numbered MTSA-related accident prediction probability values for the I data groups of all routes near the MTSA-assessed project sites and the ships navigating these routes, it is possible to obtain the predicted number of annual related accidents for coastal passenger ships when not subject to MTSA. However, for an accurate assessment, the accuracy value from the evaluation of the original Data U set is set as the correction factor (C) for the trained model, which is multiplied to correct the prediction.
The results calculated using this formula are presented in
Table 11 below.
5.5.2. Annual Number of Cases of Accidents after Application of MTSA (ANA)
The average number of MTSA-related accidents occurring within a 3-NM radius of past MTSA-assessed project sites over the last six years is defined as the anticipated annual MTSA-related accident prediction. As mentioned in
Section 3.1, marine accident data should be based on accident data following the MTSA according to the marine development project cycle. Therefore, the annual average number of MTSA-related accidents from 2017 to 2022 in the MTSA-related route information was derived. The results of the calculation of the number of accident cases after the application of the MTSA (ANA) are shown in
Table 12.
5.5.3. MTSA-Related Accident Reduction Rate Calculation
In this study, the MTSA-related accident occurrence predictive model was employed to learn the probability of MTSA-related accident occurrences using the SMOTE dataset U. Subsequently, the number of cases of accidents before the application of MTSA (BNA) was derived by applying this probability to Data R in 2022. In addition, the annual average number of MTSA-related accidents from 2017 to 2022 near the sites where MTSA was implemented was defined as the expected number of MTSA-related accidents after the implementation of MTSA (ANA), and it was then calculated. These values were then used to calculate the ARR defined in
Section 3.5 according to Equation (1), and the findings are presented in
Table 13.
6. Conclusions
The MTSA regulations are regulatory in nature. Hence, when considering the application scope of these regulations, the system should be revised to consider the safety benefits of each option and account for the administrative and economic burden on the operators. The MTSA regulations often overlook coastal passenger ships less than 100 m long. In this study, the MTSA-related ARR—an important safety benefit factor for areas where coastal passenger ships less than 100 m long operate—was derived while taking into account the expansion and application of marine development projects.
Using GIS technology, spatial information on marine structures and facilities that received MTSA over the past five years (2010–2014) was obtained. Subsequently, considering the marine development project cycle, the route information of coastal passenger ships collected in the last six years (2017–2022) after MTSA implementation was analyzed to classify the routes near marine structures and facilities into MTSA-related and MTSA-unrelated route information. The MTSA-unrelated route information was combined with the MTSA-related accident occurrence information to derive the original Data U set. However, the original Data U set had a relatively small number of accident occurrence data groups; therefore, SMOTE oversampling was applied to adjust the ratio of the data. Next, the random forest technique, which is an ML algorithm, was used to train the probability of MTSA-related accident occurrence by group using 80% of the SMOTE Data U set. Subsequently, the occurrence of MTSA-related accidents in an MTSA-unrelated operating environment was predicted based on the safety diagnosis of the project site’s operating information in the 2022 MTSA-related route information. The annual number of operations was identified as the most important feature among the independent variables. The validation of the random forest algorithm model based on the SMOTE Data U set yielded an accuracy of 0.98. Finally, the annual average number of actual MTSA-related accidents that occurred over the past six years in the MTSA-related route information was applied to denote the expected number of MTSA-related accidents in the future. The predicted numbers of MTSA-related accidents in the MTSA-unrelated and MTSA-related operating environments (derived from the same MTSA-related route information) were both applicable to the accident reduction formula. By applying a correction coefficient of 0.80 for the model accuracy of the original Data U set, the MTSA-marine ARR was calculated to be 17.41%.
The future application of the results of this study to safety benefit assessments could provide evidence for improving the MTSA system. In addition, the findings of this study can serve as a tool for identifying appropriate regulatory relaxation or improvements in similar regulatory frameworks.
However, this study has the following limitations:
First, this study was focused on expanding the limited scope of MTSA to coastal passenger ships and analyzing coastal passenger ship accidents. The scope of MTSA should be further expanded in the future by examining and analyzing the maritime routes and accidents of other vessel types. In particular, accidents involving dangerous cargo ships can lead to significant environmental damage. Hence, the scope of the MTSA regulations should be expanded regardless of the length and type of the vessel. Dangerous cargo ships frequently travel from ports near onshore oil-refining and petrochemical plants to their destinations; therefore, new methods for data collection and pre-processing may be necessary for other maritime routes.
Second, the structural and motion characteristics of the operating ships were not reflected in the basic data. Coastal passenger ships are classified into various types, such as general passenger ships, high-speed crafts, and car-ferries. Their speeds and engine outputs differ, and these factors are significant in accident prediction. However, due to the limited number of MTSA-related accident occurrence data groups in this study, there was a constraint in excluding data about vessel characteristics by narrowing down the variable range to prioritize data deemed highly relevant to accidents. In the future, the structural and motion characteristic data of operating ships can be exploited to account for the inherent characteristics of ships and the associated accident risks. Thus, predicting the maritime accident probabilities and deriving the corresponding ARR may be possible. Consequently, the MTSA scope for dangerous cargo ship navigation in coastal areas may be expanded.
Finally, a cost–benefit analysis regarding the expansion of the MTSA scope needs to be conducted. Obtaining high-quality outcomes through cost–benefit analysis was difficult owing to the wide scope of this study. The focus of this study was on utilizing ML techniques to predict accident probabilities and derive MTSA-related ARRs. In future marine development projects, a cost–benefit analysis of MTSA scope expansion will be conducted to analyze its economic feasibility. This will involve comparing the safety benefits of implementing MTSA to prevent future maritime accidents while accounting for the expenses that regulatory targets, such as business owners, will bear in delegating the MTSA tasks to other agencies.
In this context, future research should broaden its scope to include other types of vessels, such as dangerous cargo ships, to enable a comprehensive assessment of the impact of MTSA on maritime safety near marine developments. In addition, in future studies, various ensemble learning techniques other than random forest will be applied to further strengthen the research results.
Author Contributions
Conceptualization, data curation, software, supervision, project administration, writing—original draft, W.W.; software, visualization, formal analysis, M.L.; validation, writing—review and editing, W.K. All authors have read and agreed to the published version of the manuscript.
Funding
This research was funded by the Ministry of Oceans and Fisheries of Korea, “Maritime Traffic Route Safety Assessment Study 2023” (No. 202304136BF). The opinions expressed in the research findings may differ from the official views of the Ministry of Oceans and Fisheries of the Republic of Korea.
Institutional Review Board Statement
The study was conducted in accordance with the Declaration of Helsinki.
Informed Consent Statement
Not applicable.
Data Availability Statement
The Excel datasets generated and/or analyzed during the current study are available from the corresponding author upon reasonable request.
Acknowledgments
The authors thank the anonymous reviewers of this paper for the time and effort invested in reviewing the paper to improve its quality. The authors thank Kim Junwoo for the technical support.
Conflicts of Interest
The authors declare no conflict of interest.
References
- Kim, D.W. A Primary Study on the Development of Evaluation Model for Marine Traffic Safety Assessment. Ph.D. Thesis, The Graduate School of Korea Maritime and Ocean University, Busan, Republic of Korea, 2011; pp. 16–41. [Google Scholar]
- Jo, M.C. A Study on the Ways of Improve of the Maritime Safety Audit. Master’s Thesis, Department of Maritime Traffic Information, The Graduate School of Korea Maritime and Ocean University, Busan, Republic of Korea, 2012; pp. 4–7. [Google Scholar]
- Lee, H.; Kim, S.; Kim, D. A Study on the Scope of Passenger Vessels and Dangerous Goods Carriers Subject to Maritime Traffic Safety Audits. J. Korean Soc. Mar. Environ. Saf. 2017, 23, 767–774. [Google Scholar] [CrossRef]
- Guidelines and Discount Rates for Benefit-Cost Analysis of Federal Programs. Available online: https://www.whitehouse.gov/wp-content/uploads/2023/11/CircularA-94.pdf (accessed on 2 February 2024).
- Burmeister, H.-C.; Walther, L.; Jahn, C.; Toter, S.; Froese, J. Assessing the Frequency and Material Consequences of Collisions with Vessels Lying at an Anchorage in Line with IALA iWrap MkII. TransNav 2014, 8, 61–68. [Google Scholar] [CrossRef]
- Revised Guidelines for Formal Safety Assessment (FSA) for Use in the IMO Rule-Making Process. Available online: https://wwwcdn.imo.org/localresources/en/OurWork/Safety/Documents/MSC-MEPC%202-Circ%2012-Rev%202.pdf (accessed on 5 February 2024).
- Jeong, H.; Kim, I.; Han, K.; Kim, J. Comprehensive Analysis of Traffic Accidents in Seoul: Major Factors and Types Affecting Injury Severity. Appl. Sci. 2022, 12, 1790. [Google Scholar] [CrossRef]
- Kim, D.; Jung, S.; Yoon, S. Risk Prediction for Winter Road Accidents on Expressways. Appl. Sci. 2021, 11, 9534. [Google Scholar] [CrossRef]
- Hazaymeh, K.; Almagbile, A.; Alomari, A.H. Spatiotemporal Analysis of Traffic Accidents Hotspots Based on Geospatial Techniques. ISPRS Int. J. Geo-Inf. 2022, 11, 260. [Google Scholar] [CrossRef]
- Mesquitela, J.; Elvas, L.B.; Ferreira, J.C.; Nunes, L. Data Analytics Process over Road Accidents Data; A Case Study of Lisbon City. ISPRS Int. J. Geo-Inf. 2022, 11, 143. [Google Scholar] [CrossRef]
- Thanopoulou, H.; Patera, A.; Moresis, O.; Georgoulis, G.; Lioumi, V.; Kanavos, A.; Papadimitriou, O.; Zervakis, V.; Dagkinis, I. Supporting Informed Public Reactions to Shipping Incidents with Oil Spill Potential: An Innovative Electronic Platform. Sustainability 2023, 15, 15035. [Google Scholar] [CrossRef]
- Yildiz, S.; Tonoğlu, F.; Uğurlu, Ö.; Loughney, S.; Wang, J. Spatial and Statistical Analysis of Operational Conditions Contributing to Marine Accidents in the Singapore Strait. J. Mar. Sci. Eng. 2022, 10, 2001. [Google Scholar] [CrossRef]
- Chou, C.-C.; Wang, C.-N.; Hsu, H.-P.; Ding, J.-F.; Tseng, W.-J.; Yeh, C.-Y. Integrating AIS, GIS and E-Chart to Analyze the Shipping Traffic and Marine Accidents at the Kaohsiung Port. J. Mar. Sci. Eng. 2022, 10, 1543. [Google Scholar] [CrossRef]
- Yeo, S.; Jeong, B.U.; Lee, W.J. Improved formal safety assessment methodology using fuzzy TOPSIS for LPG-fueled marine engine system. Ocean Eng. 2023, 269, 113536. [Google Scholar] [CrossRef]
- Lee, M.; Park, Y.; Park, S.; Lee, E.; Park, M.; Kim, N. Application of Collision Warning Algorithm Alarm in Fishing Vessel’s Waterway. Appl. Sci. 2021, 11, 4479. [Google Scholar] [CrossRef]
- Yukun, W.; Wangyang, L.; Jing, Z.; Dayong, L. Safety risk assessment of concealed and false declaration of dangerous goods in port transference. In Proceedings of the International Conference on Management Science and Software Engineering (ICMSSE), Chengdu, China, 9–11 July 2021; pp. 306–309. [Google Scholar] [CrossRef]
- Şahin, B.; Chan, Y. Risk assessment of the Istanbul Strait by using Ports and Waterways Safety Assessment (PAWSA) method. Pamukkale Univ. J. Eng. Sci. 2018, 24, 730–738. [Google Scholar] [CrossRef]
- Kang, W.S.; Park, Y.S. A Study on the Design of Coastal Fairway Width Based on a Risk Assessment Model in Korean Waterways. Appl. Sci. 2022, 12, 1535. [Google Scholar] [CrossRef]
- Kang, W.S.; Park, Y.S.; Lee, M.K.; Park, S.W. Design of Fairway Width Based on a Grounding and Collision Risk Model in the South Coast of Korean Waterways. Appl. Sci. 2022, 12, 4862. [Google Scholar] [CrossRef]
- Nguyen, T.X.; Park, Y.S.; Smith, M.V.; Aydogdu, V.; Jung, C.H. A Comparison of ES and PARK Maritime Traffic Risk Assessment Models in a Korean Waterway. J. Korean Soc. Mar. Environ. Saf. 2015, 21, 246–252. [Google Scholar] [CrossRef]
- Kim, M.-K.; Kim, J.-H.; Yang, H. Optimal Route Generation and Route-Following Control for Autonomous Vessel. J. Mar. Sci. Eng. 2023, 11, 970. [Google Scholar] [CrossRef]
- Fu, S.; Goerlandt, F.; Xi, Y. Arctic shipping risk management: A bibliometric analysis and a systematic review of risk influencing factors of navigational accidents. Saf. Sci. 2021, 139, 105254. [Google Scholar] [CrossRef]
- Amorim, B.d.S.P.; Firmino, A.A.; Baptista, C.d.S.; Júnior, G.B.; Paiva, A.C.d.; Júnior, F.E.d.A. A Machine Learning Approach for Classifying Road Accident Hotspots. ISPRS Int. J. Geo-Inf. 2023, 12, 227. [Google Scholar] [CrossRef]
- Lee, J.; Yoon, T.; Kwon, S.; Lee, J. Model Evaluation for Forecasting Trac Accident Severity in Rainy Seasons Using Machine Learning Algorithms: Seoul City Study. Appl. Sci. 2020, 10, 129. [Google Scholar] [CrossRef]
- Xu, Y.; Park, Y.; Park, J.D.; Sun, B. Predicting Nurse Turnover for Highly Imbalanced Data Using the Synthetic Minority Over-Sampling Technique and Machine Learning Algorithms. Healthcare 2023, 11, 3173. [Google Scholar] [CrossRef]
- Imani, M.; Arabnia, H.R. Hyperparameter Optimization and Combined Data Sampling Techniques in Machine Learning for Customer Churn Prediction: A Comparative Analysis. Technologies 2023, 11, 167. [Google Scholar] [CrossRef]
- Farooqi, A.H.; Akhtar, S.; Rahman, H.; Sadiq, T.; Abbass, W. Enhancing Network Intrusion Detection Using an Ensemble Voting Classifier for Internet of Things. Sensors 2023, 24, 127. [Google Scholar] [CrossRef] [PubMed]
- Kubat, M.; Matwin, S. Addressing the curse of imbalanced training sets: One-sided selection. In Proceedings of the 14th International Conference on Machine Learning, Nashville, TN, USA, 8–12 July 1997; Volume 97, p. 179. [Google Scholar]
- Chawla, N.V.; Bowyer, K.W.; Hall, L.O.; Kegelmeyer, W.P. SMOTE: Synthetic minority over-sampling technique. J. Artif. Intell. Res. 2002, 16, 321–357. [Google Scholar] [CrossRef]
- Zhou, Z.-H. Ensemble Methods—Foundations and Algorithms; CRC Press: Boca Raton, FL, USA, 2012. [Google Scholar]
- Breiman, L. Random forests. Mach. Learn. 2001, 45, 5–32. [Google Scholar] [CrossRef]
- Witten, I.H.; Frank, E.; Hall, M.A. Data Mining: Practical Machine Learning Tools and Techniques; Elsevier Science & Technology: San Francisco, CA, USA, 2016. [Google Scholar]
- Karlberg, J.; Axen, M. Binary Classification for Predicting Customer Churn; Umeå University: Umeå, Sweden, 2020. [Google Scholar]
- Wu, T.; Fan, H.; Zhu, H.; You, C.; Zhou, H.; Huang, X. Intrusion detection system combined enhanced random forest with SMOTE algorithm. EURASIP J. Adv. Signal Process. 2022, 2022, 39. [Google Scholar] [CrossRef]
- Ishaq, A.; Sadiq, S.; Umer, M.; Ullah, S.; Mirjalili, S.; Rupapara, V.; Nappi, M. Improving the Prediction of Heart Failure Patients’ Survival Using SMOTE and Effective Data Mining Techniques. IEEE Access 2021, 9, 39707–39716. [Google Scholar] [CrossRef]
- Zhao, Z.; Bai, T. Financial Fraud Detection and Prediction in Listed Companies Using SMOTE and Machine Learning Algorithms. Entropy 2022, 24, 1157. [Google Scholar] [CrossRef]
Figure 1.
Overview of MTSA.
Figure 1.
Overview of MTSA.
Figure 2.
Procedural steps.
Figure 2.
Procedural steps.
Figure 3.
Overview of Data U set composition.
Figure 3.
Overview of Data U set composition.
Figure 4.
Classification of “MTSA-related route” and “MTSA-unrelated routes” and derivation of sailing information.
Figure 4.
Classification of “MTSA-related route” and “MTSA-unrelated routes” and derivation of sailing information.
Figure 5.
MTSA-related route and MTSA-unrelated route.
Figure 5.
MTSA-related route and MTSA-unrelated route.
Figure 6.
Process of deriving MTSA-related accidents by route.
Figure 6.
Process of deriving MTSA-related accidents by route.
Figure 7.
Distribution range of related/unrelated accidents.
Figure 7.
Distribution range of related/unrelated accidents.
Figure 8.
Related accidents.
Figure 8.
Related accidents.
Figure 9.
Illustration of SMOTE process and distribution of the classes.
Figure 9.
Illustration of SMOTE process and distribution of the classes.
Figure 10.
Illustration of feature importance.
Figure 10.
Illustration of feature importance.
Figure 11.
Illustration of probability distribution.
Figure 11.
Illustration of probability distribution.
Table 1.
Summary of MTSA scope (Enforcement Decree of the Maritime Safety Act).
Table 1.
Summary of MTSA scope (Enforcement Decree of the Maritime Safety Act).
| Category | Scope of Projects Subject to MTSA |
|---|
| Designation, notification, or modification of routes or anchorage areas | In cases of designating, notifying, or modifying waterway facilities such as routes or anchorage areas in waters navigated by vessels over 100 m long |
| Construction, establishment, or maintenance of facilities such as bridges, tunnels, or cables installed in waterways | - -
When establishing or repairing bridges or tunnels in waters navigated by vessels over 100 m long
|
| Development or redevelopment of ports or docks | - -
The establishment or modification of berthing facilities used by vessels over 100 m long
|
Table 2.
Classification of MTSA-related accidents based on the location of marine accidents.
Table 2.
Classification of MTSA-related accidents based on the location of marine accidents.
| Classification | Discrimination Criteria |
|---|
| Common | The distance from the marine development project site or land structures is within 3 NM |
| Collision | The accident occurred in front of the project site |
| Minor collision | Direct contact with the project site or nearby navigational marks |
| Grounding | The accident occurred owing to non-dredging shallow waters near the project site |
| Buoy fouling | The accident occurred because of unremoved hazards near the project site |
| Navigation obstruction | The accident occurred because of non-dredging shallow waters near the project site |
| Submersion | Submersion occurred at or near the project site |
| Damage to steering gear | There was steering gear failure at or near the project site |
Table 3.
Columns from data for MTSA scheme.
Table 3.
Columns from data for MTSA scheme.
| Column | Description |
|---|
| code | Code for classification by MTSA project, e.g., 10,000, 20,000, etc. |
| project | Name of MTSA project |
| year/month | Date of occurrence in format yyyy/mm, e.g., 2011.03 |
| location | Longitude and latitude in format N 00°00′00.00″, E 00°00′00.00″ |
Table 4.
Major columns from data for coastal passenger ship operation and accidents.
Table 4.
Major columns from data for coastal passenger ship operation and accidents.
| Column | Description |
|---|
| sailing year | Year of operation of passenger ship, e.g., 2017, 2018, etc. |
| operation distance | Represents distance travelled by the passenger ship during operation |
| regional office | Regional office in area for passenger ship |
| gross tonnage | Gross tonnage of passenger ship |
| capacity | Passenger capacity |
| number of ports | Total number of ports |
| operating minutes | Operating minutes per sea route |
| operation number | Total number of operations per year |
| maritime route | Regional maritime route for coastal passenger ship, e.g., C, M, etc. |
| position_ship | Position of a ship per unit of time in format N 00°00′00.00″,
E 00°00′00.00″ (longitude and latitude) |
| accident date | Date of occurrence in format yyyy/mm/dd, e.g., 2020/12/01 |
| position_accident | Position of an accident in format N 00°00′00.00″, E 00°00′00.00″ (longitude and latitude) |
| accident_classification | Classification according to the type of accident, e.g., Collision |
| maritime route_accident ship | Regional maritime route for a ship that has been involved in an accident, e.g., C, M, etc. |
Table 5.
Features of each maritime route.
Table 5.
Features of each maritime route.
| Category | Number |
|---|
| MTSA-related route | 94 |
| MTSA-unrelated sea route | 31 |
| Total | 125 |
Table 6.
Number of MTSA-related/unrelated accidents.
Table 6.
Number of MTSA-related/unrelated accidents.
| Category | Number |
|---|
| MTSA-related accidents | 47 |
| MTSA-unrelated accidents (exclude) | 599 |
| Total | 646 |
Table 7.
Characteristic distribution of the extracted variables in the Data U set.
Table 7.
Characteristic distribution of the extracted variables in the Data U set.
| | Original Data | SMOTE |
|---|
| Characteristic | Accident
occurrence | Accident
occurrence | Accident
occurrence | Accident
occurrence |
| Yes (N = 975, 96.34%) | No (N = 37, 3.66%) | Yes (N = 975, 50.00%) | No (N = 975, 50.00%) |
| Categorical Variables | Count | Percentage | Count | Percentage | Count | Percentage | Count | Percentage |
| Year |
| 2017 | 171 | 17.54% | 5 | 13.51% | 171 | 17.54% | 98 | 10.05% |
| 2022 | 155 | 15.90% | 10 | 27.03% | 155 | 15.90% | 62 | 6.36% |
| Annual sailing distance |
| Less than 50 km | 611 | 62.67% | 29 | 78.38% | 611 | 62.67% | 809 | 82.97% |
| 50 km to 100 km | 139 | 14.26% | 1 | 2.70% | 139 | 14.26% | 38 | 3.90% |
| More than 100 km | 225 | 23.08% | 7 | 18.92% | 225 | 23.08% | 128 | 13.13% |
| Passenger ship |
| Ship managed by B regional office | 3 | 0.31% | 1 | 2.70% | 3 | 0.31% | 1 | 0.10% |
| Ship managed by Y regional office | 118 | 12.10% | 5 | 13.51% | 118 | 12.10% | 21 | 2.15% |
| Gross tonnage |
| Less than 300 tons | 512 | 52.51% | 15 | 40.54% | 512 | 52.51% | 370 | 37.95% |
| 300 Ton to 500 tons | 261 | 26.77% | 6 | 16.22% | 261 | 26.77% | 212 | 21.74% |
| More than 500 tons | 202 | 20.72% | 16 | 43.24% | 202 | 20.72% | 393 | 40.31% |
| Passenger capacity |
| Less than 200 people | 353 | 36.21% | 12 | 32.43% | 355 | 36.41% | 280 | 28.72% |
| 200 to 400 people | 373 | 38.26% | 9 | 24.32% | 374 | 38.36% | 338 | 34.67% |
| More than 400 people | 249 | 25.54% | 16 | 43.24% | 246 | 25.23% | 357 | 36.62% |
| Number of port calls per sea route |
| Less than 3 | 230 | 23.59% | 7 | 18.92% | 230 | 23.59% | 192 | 19.69% |
| 3 to 5 | 478 | 49.03% | 20 | 54.05% | 478 | 49.03% | 507 | 52.00% |
| More than 5 | 267 | 27.38% | 10 | 27.03% | 267 | 27.38% | 276 | 28.31% |
| Operating minutes per sea route |
| Less than 60 | 300 | 30.77% | 18 | 48.65% | 300 | 30.77% | 386 | 39.59% |
| 60 to 120 | 288 | 29.54% | 12 | 32.43% | 288 | 29.54% | 410 | 42.05% |
| More than 120 | 387 | 39.69% | 7 | 18.92% | 387 | 39.69% | 179 | 18.36% |
| Number of operations per year |
| Less than 800 | 347 | 35.59% | 7 | 18.92% | 347 | 35.59% | 139 | 14.26% |
| 800 to 1600 | 257 | 26.36% | 5 | 13.51% | 257 | 26.36% | 167 | 17.13% |
| More than 1600 | 371 | 38.05% | 25 | 67.57% | 371 | 38.05% | 669 | 68.62% |
| Regional sea route |
| D sea routes | 103 | 10.56% | 8 | 21.62% | 103 | 10.56% | 314 | 32.21% |
| Q sea routes | 37 | 3.79% | 1 | 2.70% | 37 | 3.79% | 1 | 0.10% |
Table 8.
Characteristic distribution of the extracted variables in the 2022 MTSA-related route information.
Table 8.
Characteristic distribution of the extracted variables in the 2022 MTSA-related route information.
| Characteristic | Data | Characteristic | Data |
|---|
| Categorical Variables | Count | Percentage | Categorical Variables | Count | Percentage |
|---|
| Year |
| 2022 | 101 | 100.00% | |
| Annual sailing distance | Number of operations per year |
| Less than 50 km | 56 | 55.45% | Less than 800 | 36 | 35.64% |
| 50 km to 100 km | 13 | 12.87% | 800 to 1600 | 27 | 26.73% |
| More than 100 km | 32 | 31.68% | More than 1600 | 38 | 37.62% |
| Operating minutes per sea route | Number of port calls per sea route | |
| Less than 60 | 23 | 22.77% | Less than 3 | 22 | 21.78% |
| 60 to 120 | 36 | 35.64% | 3 to 5 | 57 | 56.44% |
| More than 120 | 42 | 41.58% | More than 5 | 22 | 21.78% |
| Passenger capacity | Gross tonnage | |
| Less than 200 people | 30 | 29.70% | Less than 300 tons | 46 | 45.54% |
| 200 to 400 people | 40 | 39.60% | 300 tons to 500 tons | 34 | 33.66% |
| More than 400 people | 31 | 30.69% | More than 500 tons | 21 | 20.79% |
| Passenger ship | Regional sea route | |
| Ship managed by C regional office | 12 | 11.88% | D sea routes | 15 | 14.85% |
| Ship managed by P regional office | 5 | 4.95% | L sea routes | 13 | 12.87% |
Table 9.
Results of validation on the SMOTE Data U set for ML RF model.
Table 9.
Results of validation on the SMOTE Data U set for ML RF model.
| | Acc | Pr | Rc | F1 |
|---|
| 0.0 | | 0.98 | 0.97 | 0.98 |
| 1.0 | | 0.97 | 0.98 | 0.98 |
| Macro avg | 0.98 | 0.98 | 0.98 | 0.98 |
Table 10.
Results of evaluation on the original Data U set for ML RF model.
Table 10.
Results of evaluation on the original Data U set for ML RF model.
| | Acc | Pr | Rc | F1 |
|---|
| 0.0 | | 0.71 | 1.00 | 0.83 |
| 1.0 | | 1.00 | 0.60 | 0.75 |
| Macro avg | 0.80 | 0.86 | 0.80 | 0.79 |
Table 11.
Predicted number of accident cases.
Table 11.
Predicted number of accident cases.
| Number (i) | Predicted Values (P) | Correction Factor (C) | BNi |
|---|
| 1 | 0 | | |
| 2 | 0.01 | | |
| 51 | 0.04 | | |
| 101 | 0.16 | | |
| Total | 2.51 | 0.80 | 2.01 |
Table 12.
Annual number of cases of MTSA-related accidents after application of MTSA (ANA).
Table 12.
Annual number of cases of MTSA-related accidents after application of MTSA (ANA).
| | 2017 | 2018 | 2019 | 2020 | 2021 | 2022 | Mean |
|---|
| Number of accidents | 4 | 1 | 1 | 2 | 1 | 1 | 1.66 |
Table 13.
Calculation result of the MTSA-related accident reduction rate.
Table 13.
Calculation result of the MTSA-related accident reduction rate.
| BNA | ANA | Calculation Result (%) |
|---|
| 2.01 | 1.66 | 17.41% |
| Disclaimer/Publisher’s Note: The statements, opinions and data contained in all publications are solely those of the individual author(s) and contributor(s) and not of MDPI and/or the editor(s). MDPI and/or the editor(s) disclaim responsibility for any injury to people or property resulting from any ideas, methods, instructions or products referred to in the content. |
© 2024 by the authors. Licensee MDPI, Basel, Switzerland. This article is an open access article distributed under the terms and conditions of the Creative Commons Attribution (CC BY) license (https://creativecommons.org/licenses/by/4.0/).


