Article

Weak Magnetic Fields Regulate the Ability of High Dilutions of Water to Enhance ROS Production by Neutrophils

by
Evgeny E. Fesenko
,
Elena V. Yablokova
and
Vadim V. Novikov
*
Institute of Cell Biophysics of the Russian Academy of Sciences, 142290 Pushchino, Russia
*
Author to whom correspondence should be addressed.
Appl. Sci. 2024, 14(8), 3290; https://doi.org/10.3390/app14083290
Submission received: 6 March 2024 / Revised: 10 April 2024 / Accepted: 11 April 2024 / Published: 13 April 2024

Abstract

:
The influence of magnetic fields on the physico–chemical properties of water and aqueous solutions is well known. We have previously shown that weak combined magnetic fields with a 60 µT static component and a 100 nT (at 12.6 Hz) variable component are able to activate neutrophils, both directly and indirectly, through water pre-incubated in these fields. The ability to influence the activity of neutrophils was retained in serial dilutions of water, but only when a mechanical effect (shaking) was applied at each dilution step. Here, we confirm that combined magnetic fields are required for the formation of the stimulatory activity of water on ROS production by neutrophils. For the first time, we determined the threshold values of a constant magnetic field (at least 350–550 nT) necessary to maintain this activity in a series of successive dilutions. Additionally, the biophysical properties of various dilutions appeared to be not identical. This confirms that the number of technological steps (successive dilutions with physical influence) is a key factor that determines the activity of highly diluted samples.

1. Introduction

Recently, there has been a growing interest in the study of the properties of highly diluted aqueous solutions [1], as well as water exposed to weak and strong physical factors [2,3,4,5]. The preparation of highly diluted substances is accompanied by serial (tenfold or centesimal) dilution with vigorous shaking at each dilution step [6]. Such high dilutions (HDs) can affect various physico–chemical and biological parameters in experimental models, although the initial substance in them is contained in extremely low concentrations or is nearly absent [7,8]. This implies the presence of a physical mechanism responsible for the observed effects. The pronounced physical component in the physico–chemical action of HDs of specific substances changes under conditions of a weak magnetic or electromagnetic field (EMF). It has been shown that during the preparation of HDs, different EMFs (with a frequency of 7.85 Hz and an amplitude of 48, 24, and 12 A/m) have different effects on the formation of nanoassociates [9], which do not form at near-zero magnetic fields [10]. In this regard, it seems promising to study such a physical mechanism in conditions where the initial substance is not added at all, and the effect of only a physical factor (for example, electromagnetic radiation or a magnetic field) on a solvent (water) is being investigated.
In order to conduct such studies, it was necessary to find an experimental model that clearly relates the change in biological activity under the influence of water subjected to a physical exposure (for example, after incubation in a magnetic field). We have previously shown that combined magnetic fields (CMF) with a 60 µT static component and a collinear variable component with an amplitude of 100 nT at a frequency of 12.6 Hz at one hour exposure stimulate the chemiluminescent response of neutrophils to the administration of the respiratory burst activator, the bacterial peptide N-formyl-Met-Leu-Phe (fMLF) [11]. Purified water (MilliQ water) subjected to the same magnetic treatment and subsequently added to a concentrated balanced salt solution and then to a suspension of these cells as an isotonic solution exerted a similar and even more pronounced stimulating effect compared to intact water (stored under geomagnetic field (GMF) conditions). Moreover, magnetically pre-treated water, subjected to multiple serial dilutions with vigorous shaking at each dilution step, retained its neutrophil-stimulating properties. At the same time, performing serial dilutions of magnetically pre-treated water, but at a near-zero magnetic field (inside a permalloy shielding chamber with a residual field of ~10 nT) led to a complete loss of the ability to activate neutrophils. The stimulating properties were also demonstrated for diluted water that was pre-incubated in an artificial CMF (comparable with the GMF) generated inside the magnetically shielded chamber [11]. All these results indicate the critical role of the magnetic environment in the generation and retention of this biological activity in water.
An important aim of this work was to demonstrate the dual role of the magnetic field during the preparation of HDs. Firstly, the magnetic field “sets” (forms) the defined activity in an aqueous solution, and secondly, it “maintains” this activity in the process of serial dilutions. In this paper, we will focus mainly on the second aspect, as well as on the issue of whether different dilutions with a dilution level of the initial substance exceeding 1024 are equivalent to each other.
Thus, this work does not examine a chemical whose concentration would decrease during the dilution process. We studied water after magnetic field treatment, and we conditionally called the process of mixing it with untreated water “dilution”. It can be assumed that when diluting chemicals, a similar physical mechanism is realized; however, this phenomenon is more convenient to study in a system where solvent and solute molecules are identical. Additionally, this approach, in comparison with the study of a specific substance, allows us to address more substantively changes in the properties of water and the possibility of transmitting its effects in a series of dilutions using a physical mechanism.
The results of this study will contribute to a better understanding of this phenomenon and can be useful for further research into the physico–chemical and biological properties of HDs. From a biological point of view, neutrophil granulocytes are one of the main types of cells that provide the first-line defense against pathological microorganisms, mainly through the phagocytosis and production of antimicrobial agents, including ROS, which can be detected using physico-chemical methods. Treatments based on dilutions of water pre-incubated in a magnetic field may be beneficial for normalizing the functional activity of neutrophils (in our case, increasing the production of ROS) during various pathophysiological conditions, including bacterial infections.

2. Materials and Methods

2.1. Reagents

Zymosan A from Saccharomyces cerevisiae and N-formyl-Met-Leu-Phe (fMLF) were purchased from Sigma (St. Louis, MO, USA), and luminol solution from Enzo Life Sciences, (New York, NY, USA). Ultrapure water (specific resistance of 18.2 MOhm·cm at 25 °C at the time of purification) was obtained using a Milli-Q Integral 5 water purification system (Merck, Darmstadt, Germany). Water was stored in 1 L laboratory glass jars with tightfitting lids.

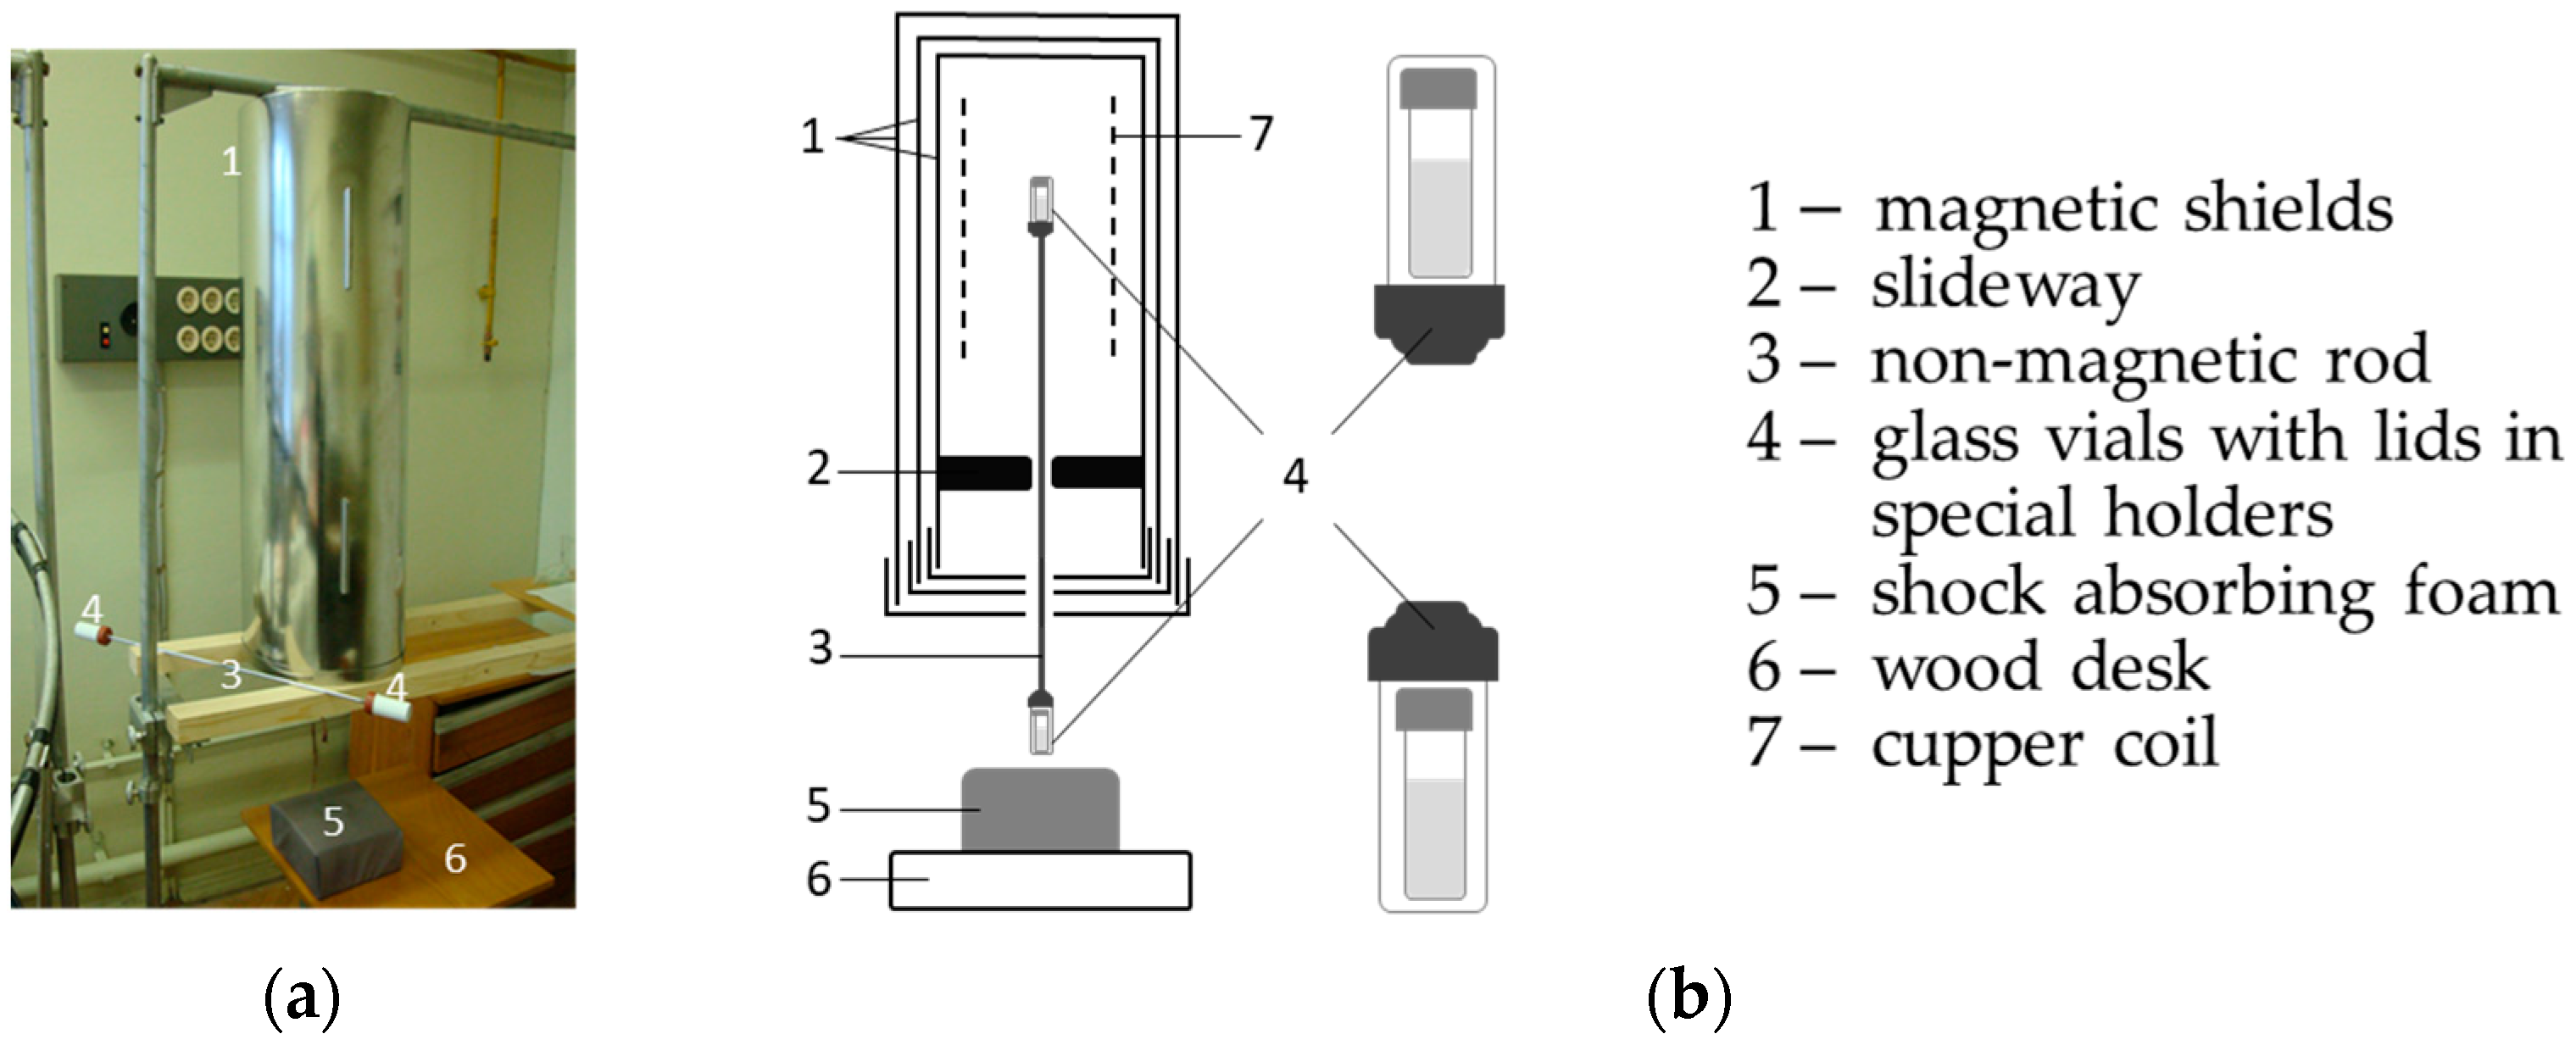
2.2. Generation of Magnetic Fields and Processing of Water Samples

The experiments were conducted utilizing relatively weak magnetic fields, with a strength either less than or similar to those of the geomagnetic field (GMF), which typically vary between 30 and 65 µT. To ensure consistency and minimize the dependence on external conditions, we employed specialized research equipment, specifically a pair of cylindrical devices designed to create a hypomagnetic environment: one was located horizontally, and another one was located vertically (Figure 1).
The treatment of water samples using a CMF was conducted in a hypomagnetic environment device (similar to the one shown in Figure 1 and in [11]). This device reduced the external geomagnetic field (GMF) by up to 5000 times, ensuring the residual static field did not exceed 10 nT. Moreover, it substantially minimized alternating anthropogenic noise to a single-digit nT level, as confirmed via measurements. The device comprised three coaxially arranged cylindrical permalloy magnetic shields, each with walls of 1 mm thickness. These shields were nested within each other and equipped with closures featuring inlet ports for connecting the device to measurement equipment. The innermost shield measured 22 cm in diameter and 42 cm in length.
The residual fields within the hypomagnetic environment device were precisely measured using a Mag-03MS100 fluxgate magnetometer (Bartington, Witney, UK). A specialized electromagnetic induction coil, or solenoid, was positioned inside the device to experimentally induce a CMF. The solenoid was linked to a current source, producing a static magnetic field (SMF) of 60 µT, and to a low-frequency alternating signal source, creating the alternating field component with a frequency of 12.6 Hz and an amplitude of 50 nT (utilized for pre-incubating water samples). The coil specifications were as follows: 18 cm in diameter, 36 cm in length (constructed from a 720-turn, 1 mm diameter copper wire), and a resistance of 7.5 Ohm.
The solenoid was used to create a uniform area of a weak CMF within the shielding unit, where the test samples were incubated.
The CMF alternating component frequency was equivalent to the frequency of ion cyclotron resonance for complex hydronium ions in their hydrated form H3O+ (3 H2O) (as previously shown in [11]). Water samples were exposed to a CMF in the horizontal hypomagnetic environment device in 22.5 mL optic glass spectrophotometric cubic cuvettes (Hellma Analytics, Müllheim, Germany, Cat. No. 704-001-30-10) closed with lids at room temperature (23–24 °C). An aliquot of a pre-treated water sample was added to a balanced salt solution (5× concentrated Hanks’ solution) and then to a suspension of intact neutrophils, incubated for 20 min at 37 °C at the GMF, and the intensity of cell chemiluminescence was measured as described below (see Section 2.4).
The remaining part of the sample was subjected to further processing, including dilution and shaking procedures. For this, the second hypomagnetic environment device (similar to the first one but located vertically) was used. Inside this device, only an SMF was generated using a direct current source in the induction range of 10–20,000 nT. In different experiments the magnetic field strength varied: 10 nT (background near-zero field—the current source of the solenoid is turned off), as well as when current is applied to the solenoid, corresponding to the field of 200, 350, 550, 900, 1500, 2500, 5000, and 20,000 nT.
Glass vials with samples were placed in special holders connected to each other using a non-magnetic rod (as shown in Figure 1b). The shaking of the samples was carried out inside (with the defined parameters of the magnetic field) and simultaneously outside (at the GMF) of the hypomagnetic device. The procedure of serial centesimal dilution was always carried out under the GMF conditions. It is important to note that the samples inside and outside the hypomagnetic device were shaken identically since they were interconnected by a rigid non-magnetic rod (Figure 1b).
Control water samples were subjected to similar processing (shaking and dilution) but without pre-exposure to the CMF. Samples of the initial water were used as one of the controls in each series of experiments. Samples of the 12th, 30th, and 50th dilutions were tested (the first dilution was tenfold, the others were centesimal).
Prior to the incubation, water samples were placed in cubic cuvettes, as previously mentioned. Subsequently, these samples underwent a serial consecutive dilution procedure in 20 mL glass vials, each equipped with a lid (Glastechnik Grafenroda, Geratal, Germany). The method employed was that of serial consecutive dilutions, incorporating vigorous shaking at each dilution step.
To prepare the first dilution, a pair of vials were filled with 4.5 mL of water each. Next, 0.5 mL of the sample, which had been pre-incubated under either CMF or control conditions, was introduced into each vial, resulting in a 1:10 dilution ratio. Finally, the vials were securely sealed with the lids, placed onto a non-magnetic rod (duralumin) 56 cm long, and simultaneously vigorously shaken at two different magnetic fields (inside the hypomagnetic device, with a certain magnitude of a residual SMF, and outside). The mechanical effect was also constantly monitored using a strain gauge built into a shock absorber exposed to strokes during shaking. The stroke amplitude was about 10 cm, with a frequency of ~4 Hz and a force of ~300 g. For each dilution, 21 strokes were performed. The consistency of shaking was assessed using a TenzometryUnit online monitoring software developed based on the Laboratory Virtual Instrumentation Engineering Workbench (LabVIEW, 2019).
The process involving the unit’s disassembly and reassembly, along with the positioning of two vials on a non-magnetic rod, took about 1 min. The second and all succeeding dilutions were made by introducing a 50 µL aliquot from the preceding dilution into a vial containing 4.95 mL of water (resulting in a 1:100 dilution). This operation was repeated 49 times. The 12th, 30th, and 50th dilutions were named ‘C12’, ‘C30’, and ‘C50’, correspondingly. Thus, the dilution level corresponds to 10012 (C12), 10030 (C30), 10050 (C50) times. To measure the activities of C12, C30, and C50 dilutions, an aliquot was taken, and the procedure of serial dilution was continued. The total duration of the dilution and shaking processes was about 1 h.

2.3. Obtaining Neutrophil Suspension

Male Balb/c mice weighing 22–25 g were received from the breeding facility of the Shemyakin-Ovchinnikov Institute of Bioorganic Chemistry, Russian Academy of Sciences. Neutrophils were isolated in accordance with the standard procedure described in [11].
Briefly, 150 µL of opsonized zymosan (Zymosan A, derived from Saccharomyces cerevisiae, Sigma-Aldrich, St. Louis, Missouri, USA) suspension (5 mg/mL) were injected peritoneally in mice. After 15 h, the mice were euthanized through cervical dislocation, and their abdominal cavities were washed with 4 mL of cooled, calcium-free Hanks solution. The peritoneal cell suspension was mixed by pipetting and centrifuged for 5 min at 600× g. Neutrophils were stored at 4 °C. For chemiluminescence analysis, a neutrophil suspension with a minimum viability of 98% was diluted with an in-house prepared, modified Hanks medium (138 mM NaCl, 6 mM KCl, 1 mM MgSO4, 1 mM Na2HPO4, 5 mM NaHCO3, 5.5 mM glucose, 1 mM CaCl2, and 10 mM HEPES, pH 7.4; all reagents obtained from Sigma-Aldrich, St. Louis, MI, USA).
The animal studies were performed in accordance with the Guidelines for Ethical Conduct in the Care and Use of Animals and were approved by the institutional animal care and use committee (number 57, dated 30 December 2011) at the Institute of Cell Biophysics, Russian Academy of Sciences.

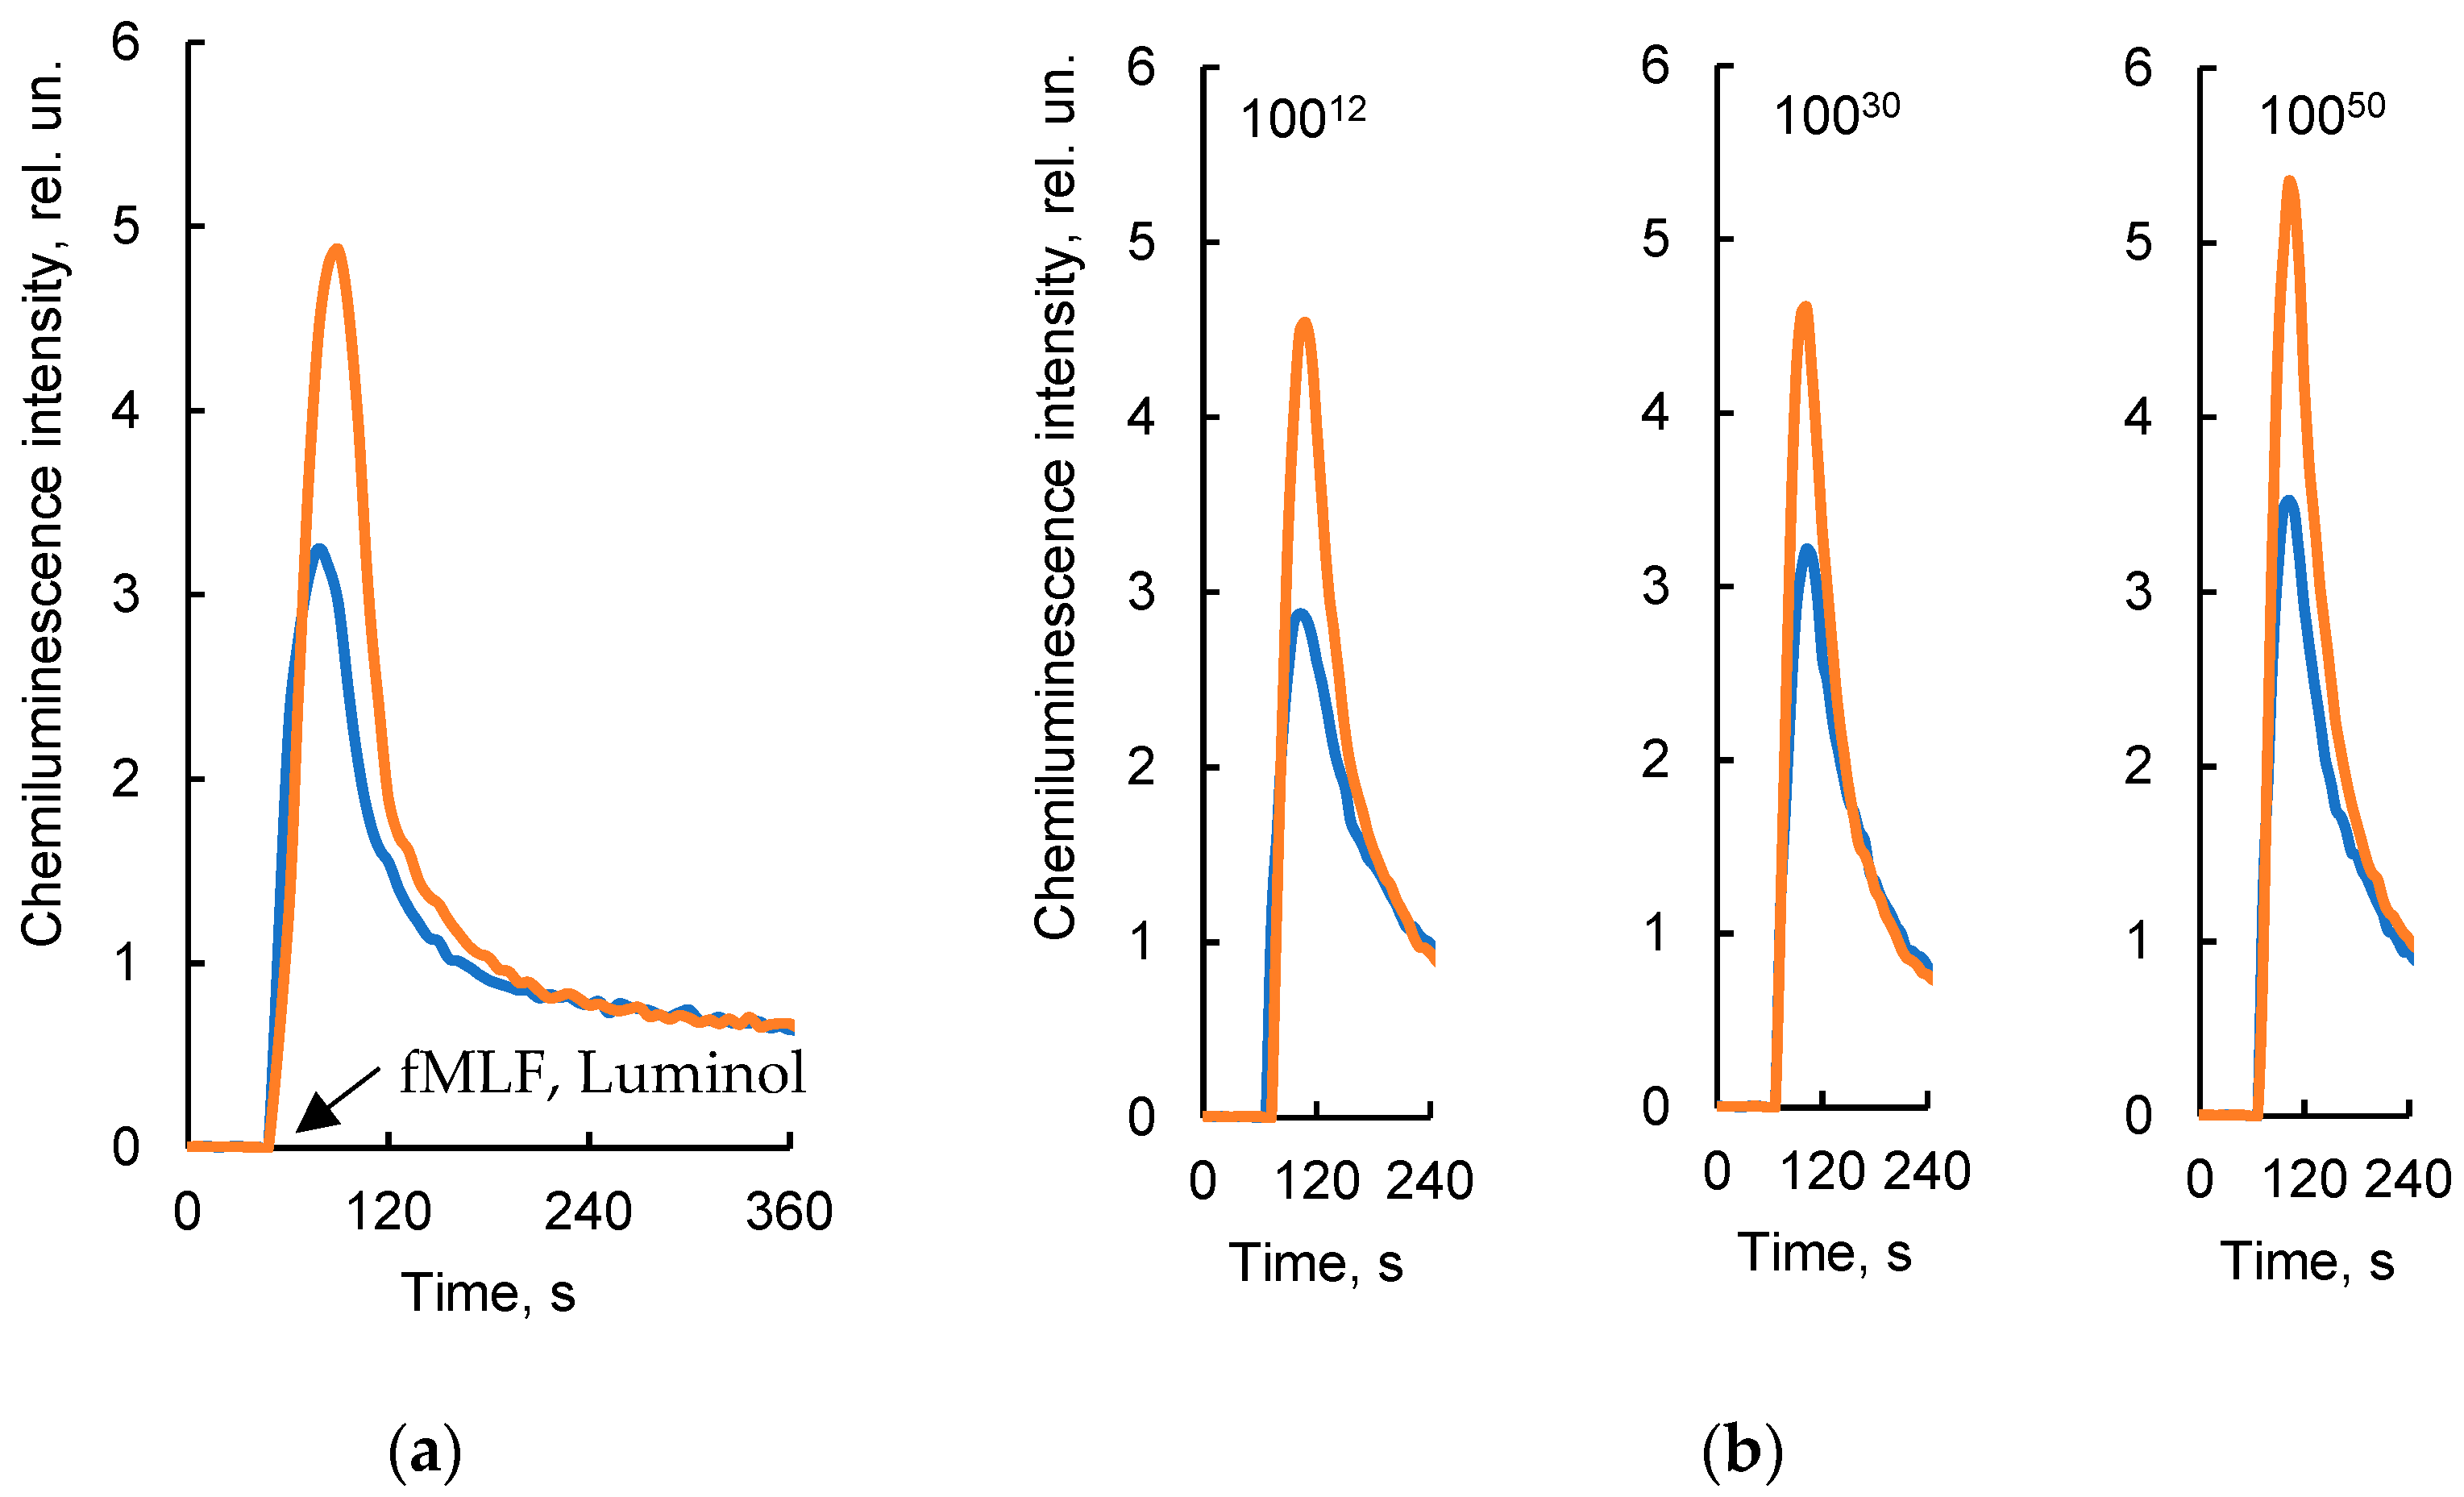
2.4. Testing the Activity of Solutions Using Chemiluminescence Analysis of Cells

An aliquot of the water sample was combined with a concentrated Hanks solution, maintaining a 5:1 ratio, to create an isotonic solution. To this solution, a suspension of neutrophils was introduced, achieving a final concentration of 106 cells per milliliter in a volume of 0.25 mL. Then, the cells were incubated at 37.0 ± 0.2 °C for 20 min. This process was carried out in round bottom polystyrene cuvettes (1.2 cm in diameter and 5.5 cm in height, Sarstedt, Numbrecht, Germany). The incubation occurred under GMF conditions. The constant temperature was maintained using a UH 4 circulation thermostat (MLW, Medingen, Germany).
After incubation and just prior to the measurement, a luminol solution (Enzo Life Sciences, Lauzen, Switzerland) at a final concentration of 0.35 mM and fMLF (Sigma-Aldrich, St. Louis, MI, USA) an activator of ROS production in neutrophils, at a final concentration of 2 μM were added to all samples. The chemiluminescence kinetics was recorded using a Lum-1200 chemiluminometer (OOO “DISoft”, Moscow, Russia) and data were analyzed with PowerGraph software (ver. 3.3.12, OOO “DISoft”, Moscow, Russia).
The results of the measurements of chemiluminescence intensity are presented in relative units, but for correct comparison between various samples, all values were converted into a normalized format. Normalized chemiluminescence was calculated by dividing the maximum chemiluminescence value measured for a particular sample by the maximum value obtained for water. The value of chemiluminescence for the “Water” sample (Control) was taken as 100%. The representative kinetic curves are shown in Figure 2.

2.5. Statistical Analysis

The statistical analysis was conducted using R (version 4.2.2, R Foundation for Statistical Computing, Vienna, Austria). The data are presented as Mean ± Standard deviation. Group comparisons were made using the Student/Welch t-test and the Mann–Whitney u-test. The normality of the distribution was assessed with the Shapiro–Wilk test, while the homogeneity of the variances was evaluated using the Bartlett test. Statistical significance was set at a p-value less than 0.05.

3. Results

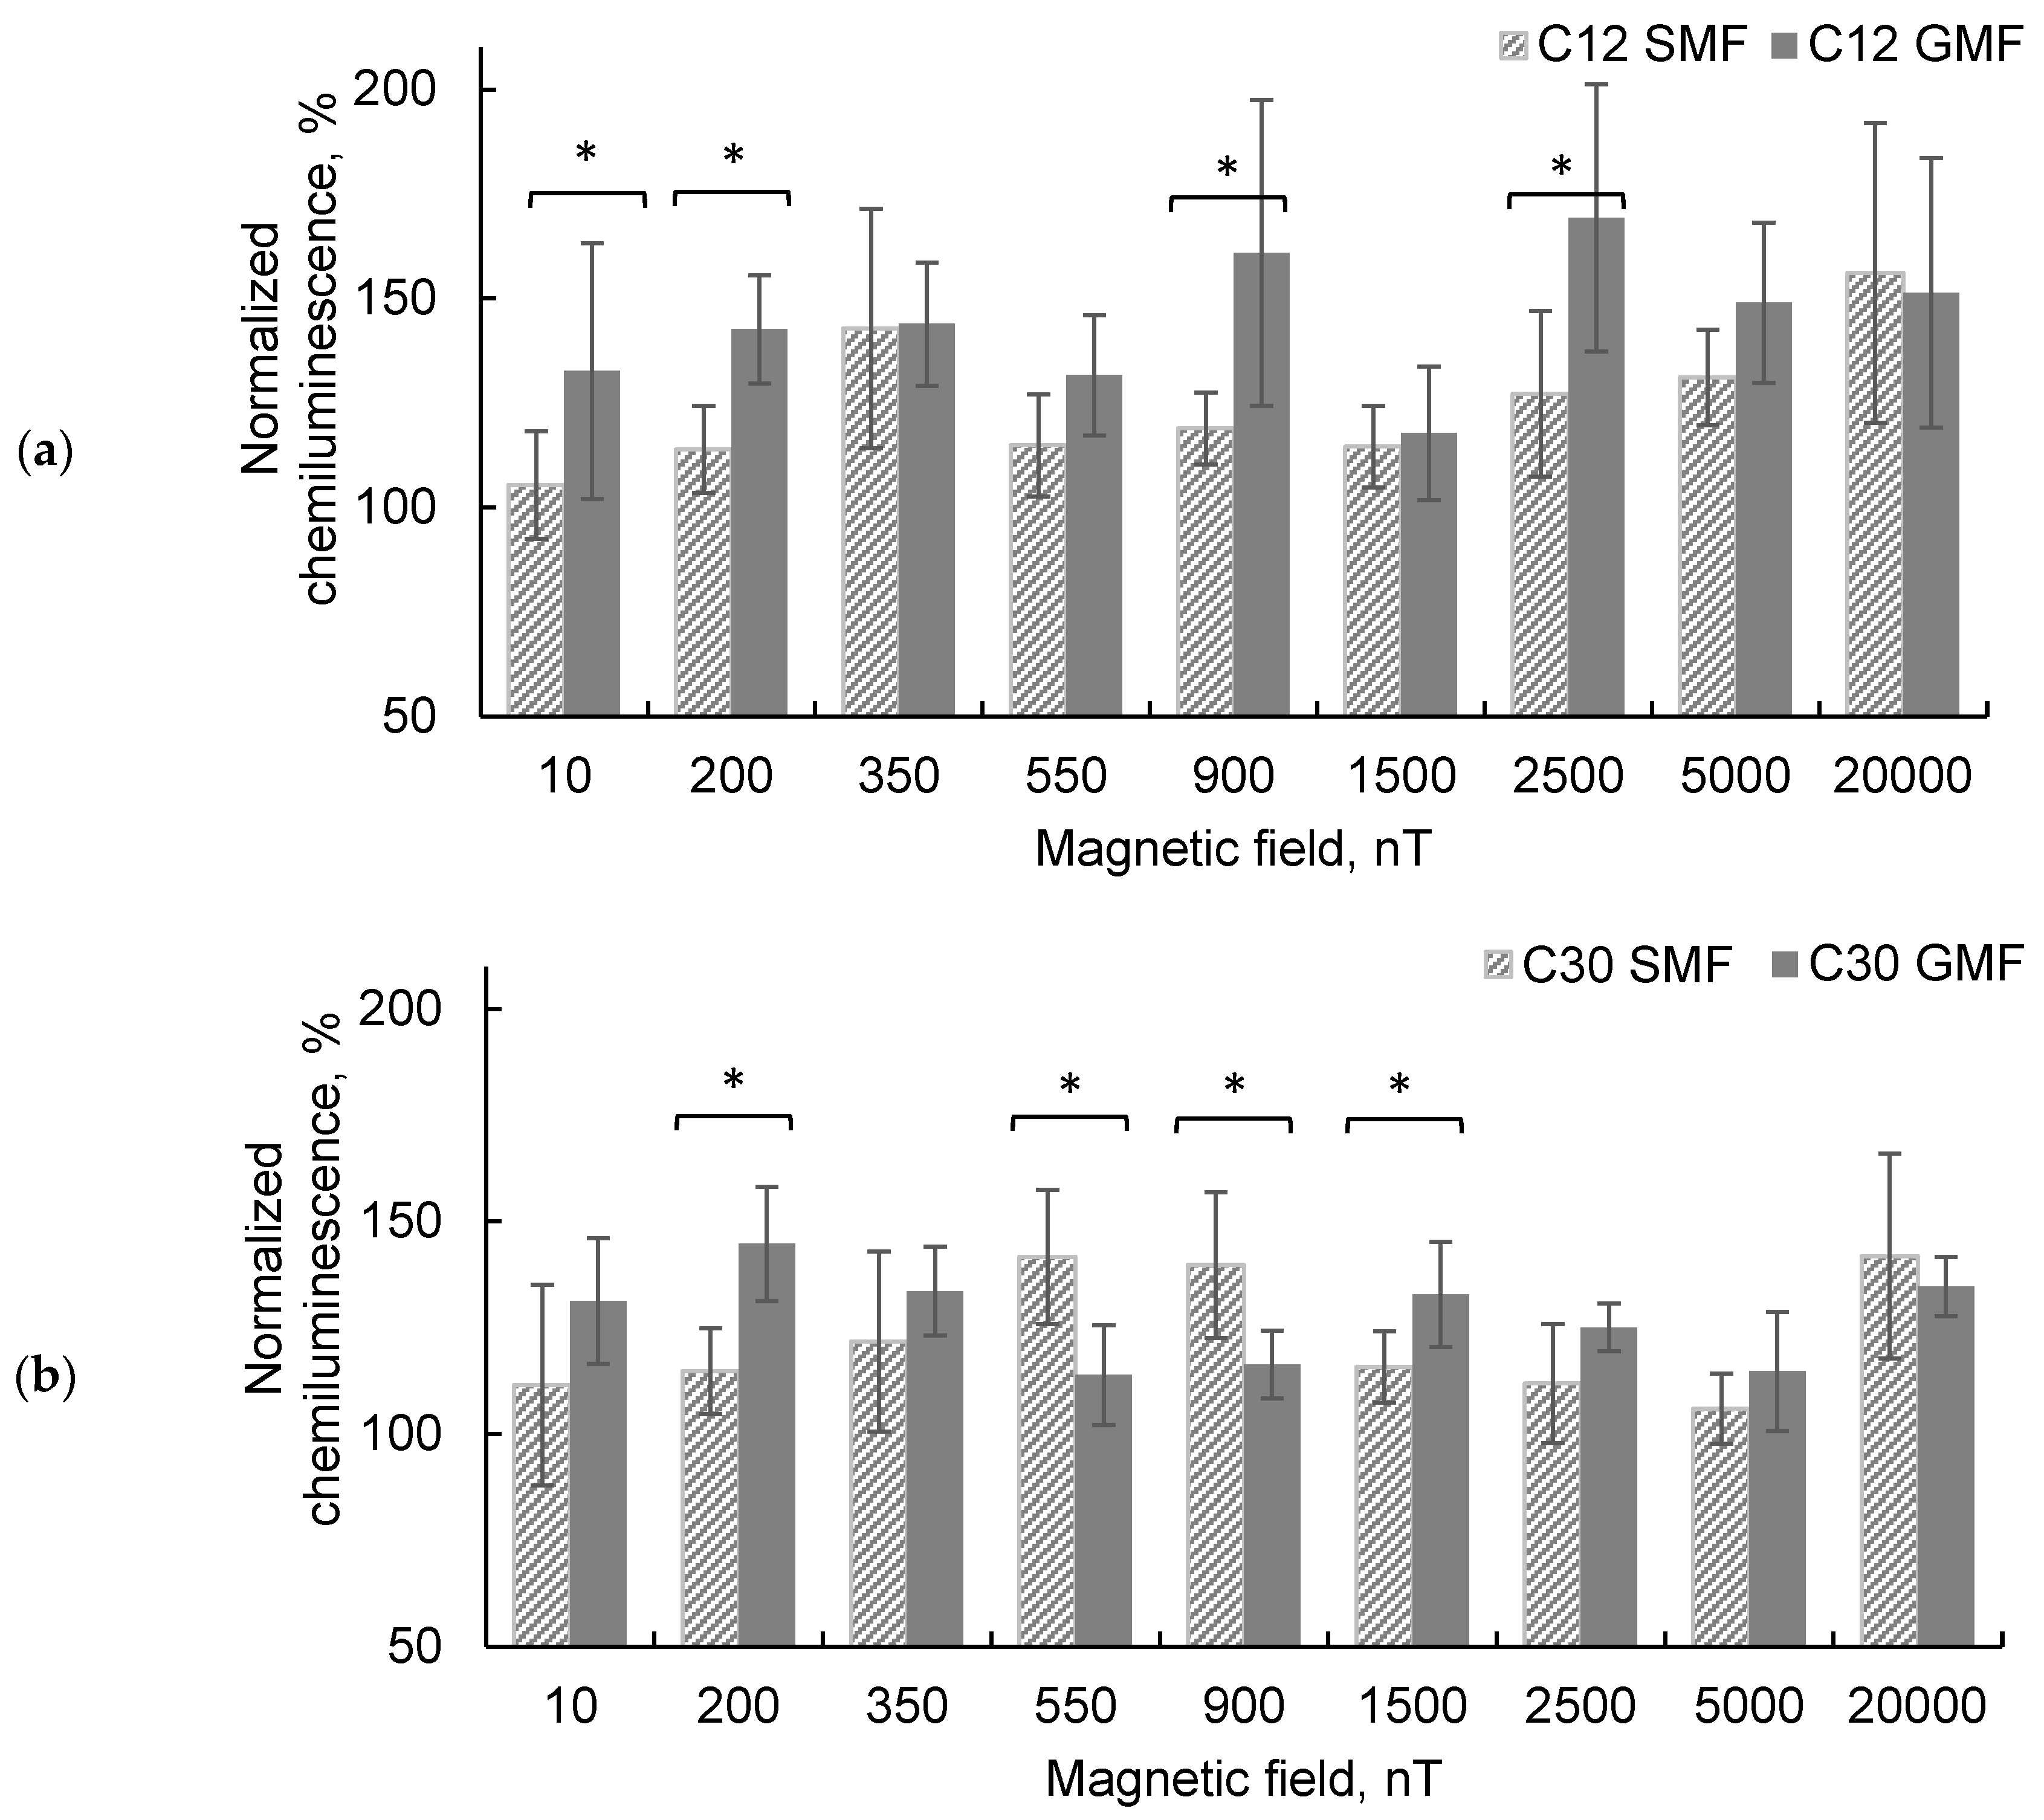
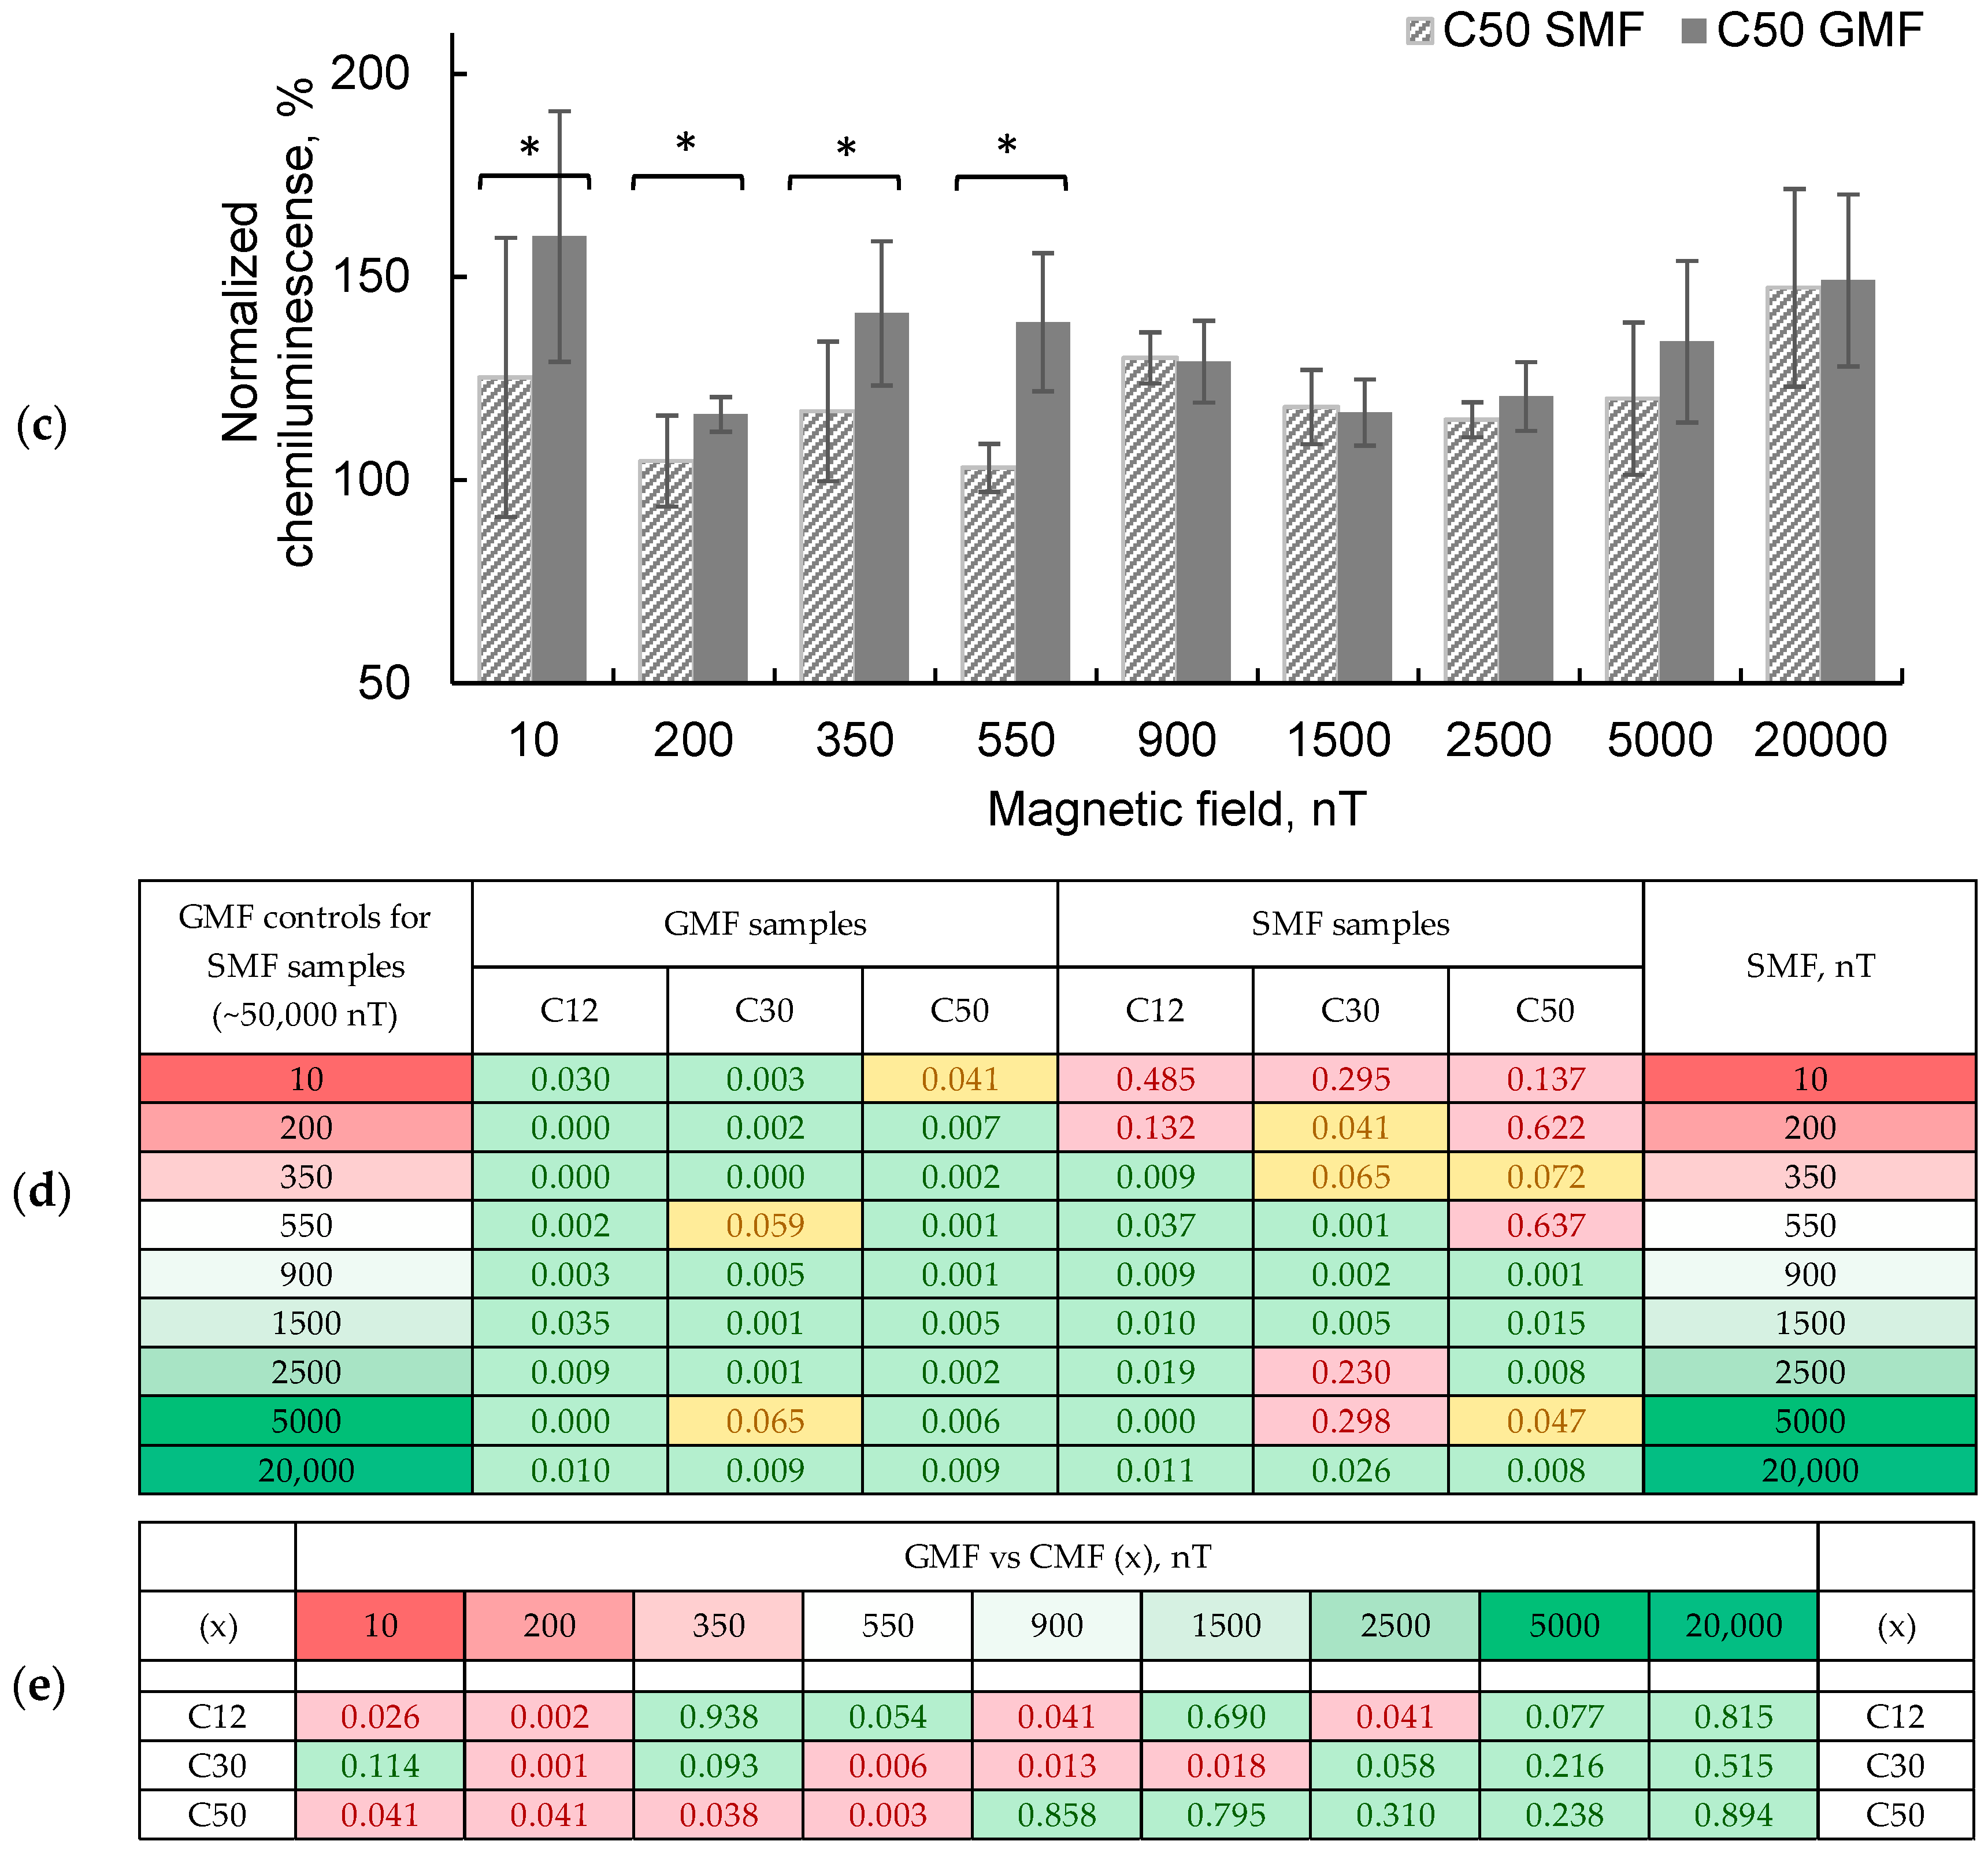
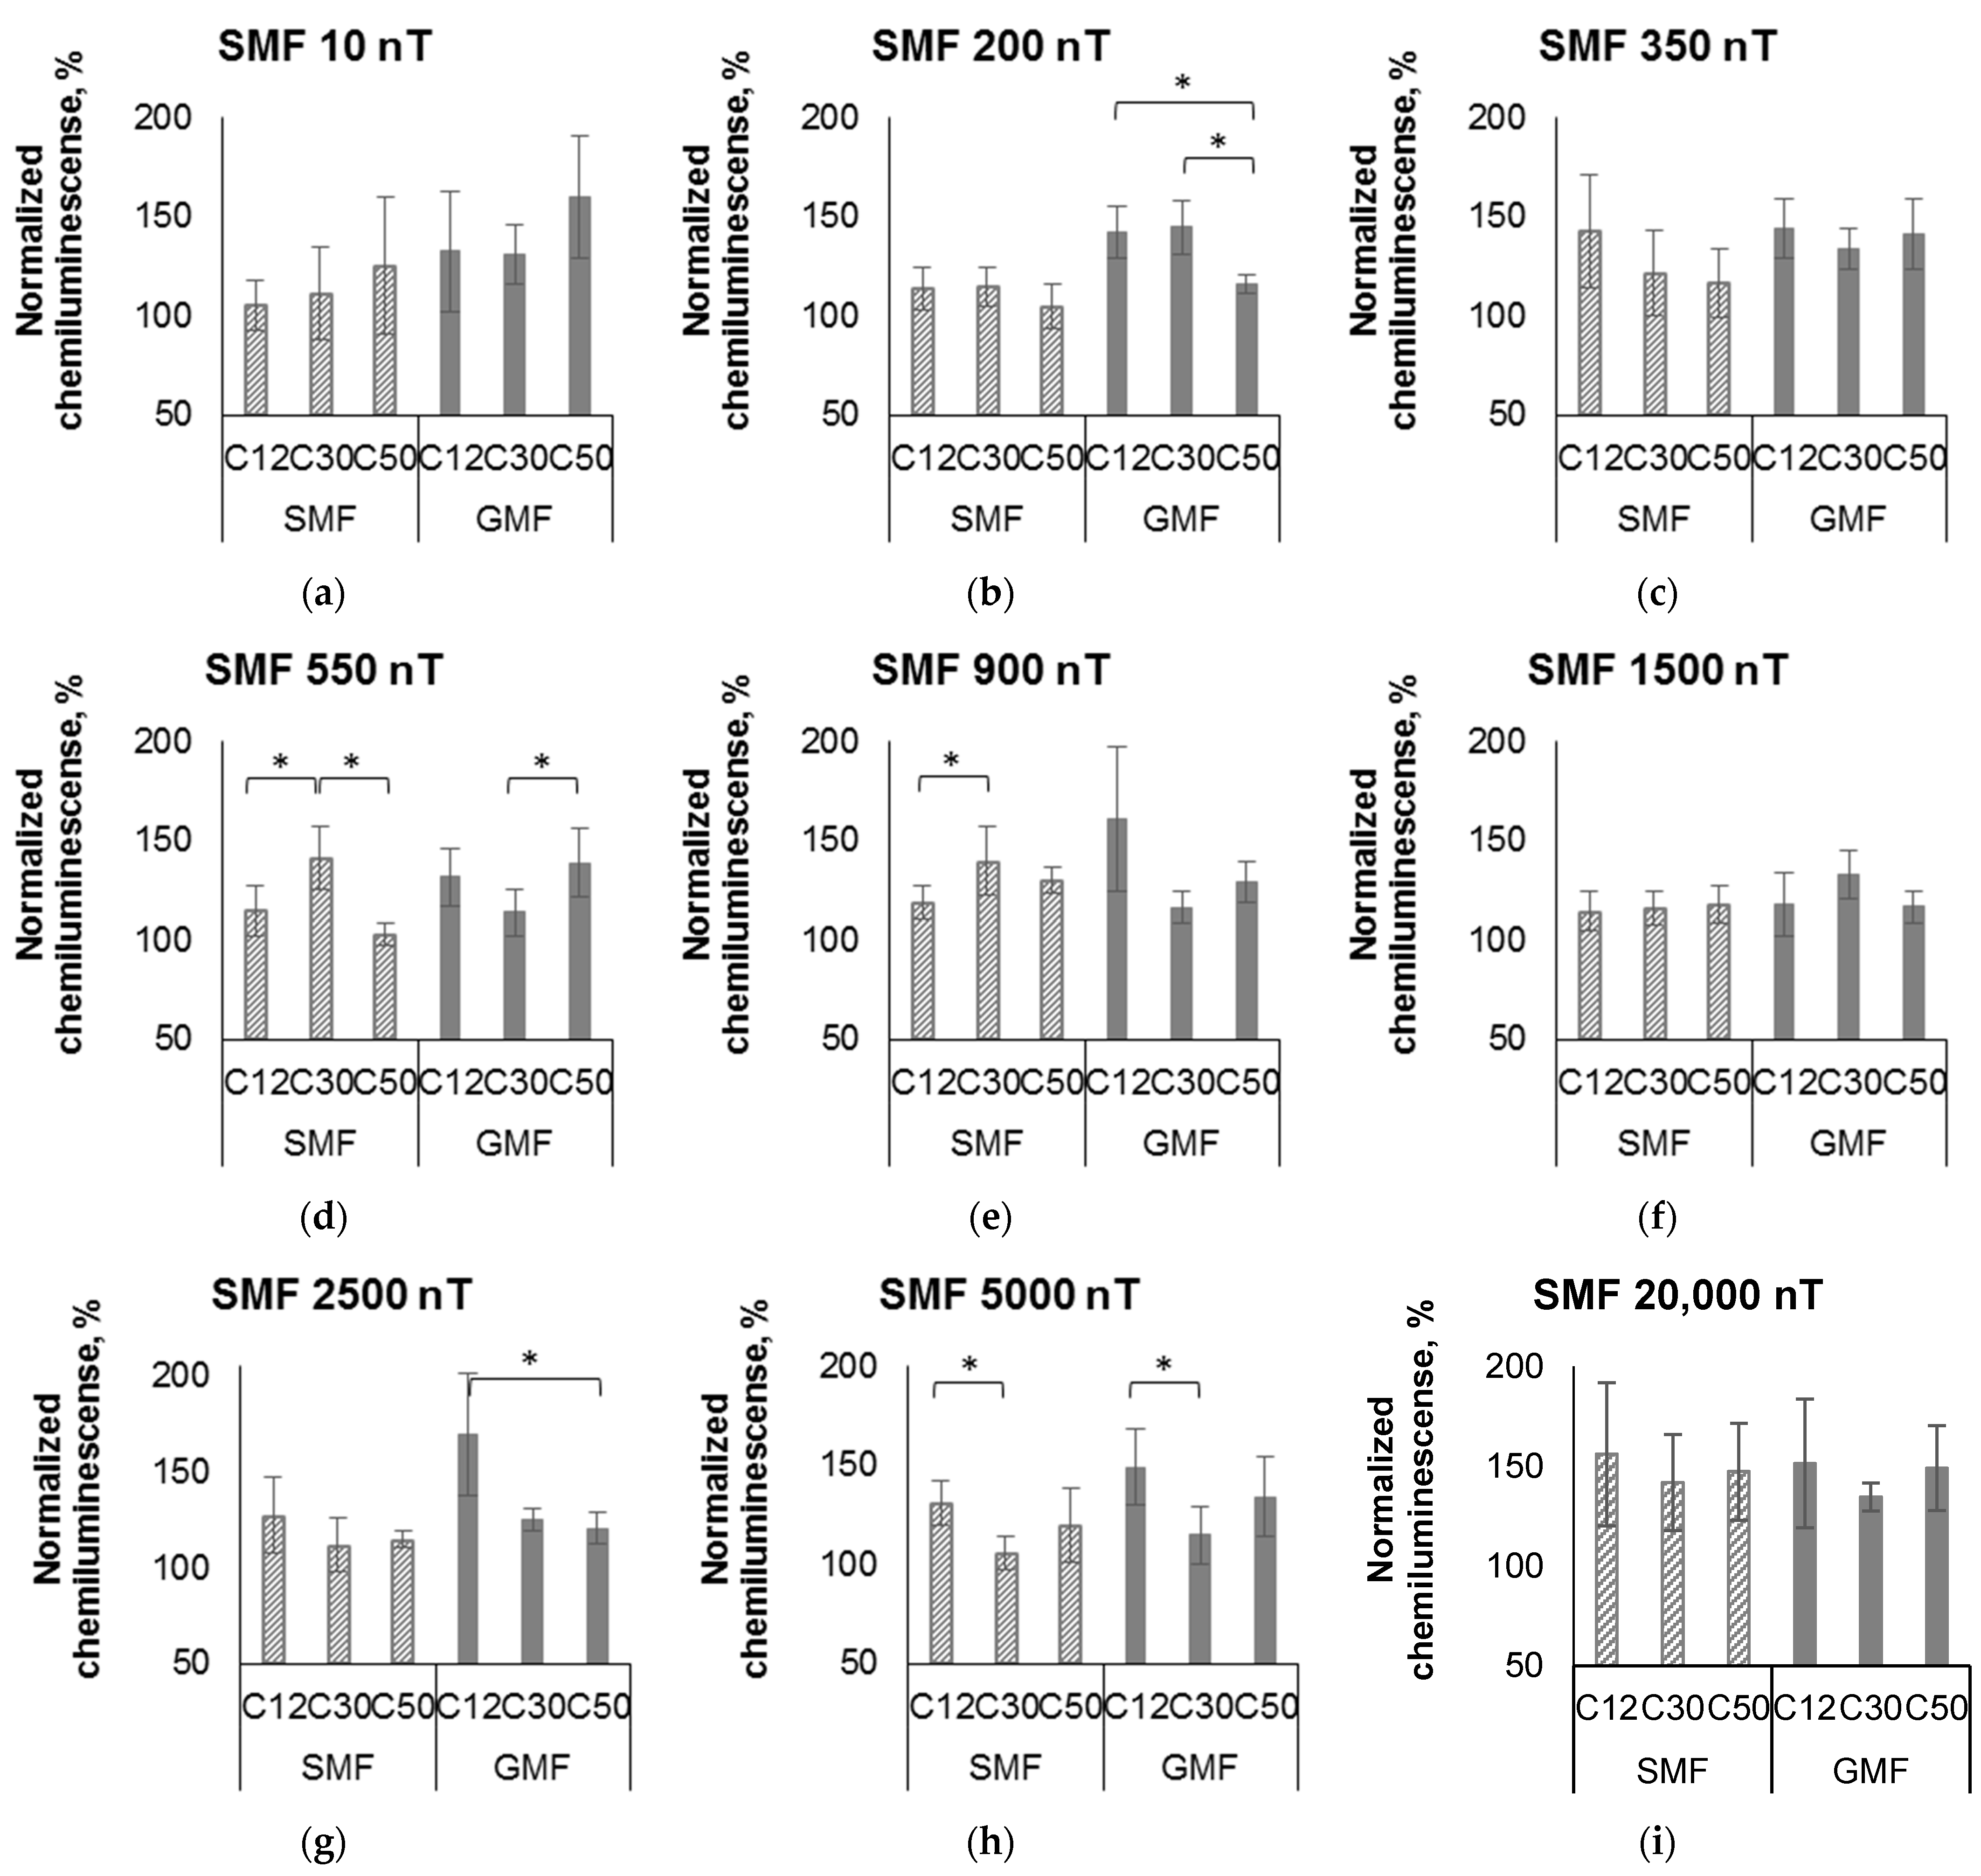
3.1. SMF Regulates the Ability of HD Water Pre-Exposed to a Magnetic Field to Enhance ROS Production by Neutrophils

Weak and ultra-weak magnetic fields have pronounced biophysical effects, associated with the formation of free radicals and respiratory burst [12,13,14,15]. Earlier, we showed that the treatment of water with a CMF (SMF of 60 µT, AMF of 150 nT, and the variable component frequency of 12.6 or 48.5 Hz) affects the ability of these samples to regulate the activity of neutrophils to produce ROS in different ways. This ability persists even if this water is diluted to the C50 level, but disappears if dilutions are prepared in a near-zero magnetic field or without vibration between dilution steps [11]. However, it has remained unexplored how the ability of water to activate neutrophils after exposure to a magnetic field depends on the level of dilution of water and, most importantly, on the parameters of the static component of the magnetic field, at which a series of dilutions is prepared. This dependence was investigated in the current study using luminol-enhanced cellular chemiluminescence. First, it was necessary to show the stability of the stimulating effect of water treated with a CMF (SMF of 60 µT, AMF of 50 nT, and a frequency of a variable component of 12.6 Hz) in terms of its ability to activate the production of ROS by neutrophils.
Table 1 shows data from four independent series of experiments on the reproducibility of this effect; the experiments were conducted on different days.
Pre-treatment of water with the CMF for 90 min followed by its addition to concentrated Hanks solution and further to the neutrophil suspension resulted in the stimulation of the response of these cells to the respiratory burst activator fMLF by approximately 40–50%, compared to the addition of water kept under ambient conditions (at the GMF). The reproducibility of the results in general indicates the stability of the stimulating effect of water pre-treated with the CMF on ROS production by neutrophils. It is important to note that the testing of water samples in these series of experiments began no later than 30 min after the end of their exposure to the CMF.
An additional control was tested to confirm the effect of the CMF on the ability of water to enhance ROS production by neutrophils. When water was incubated under GMF conditions (i.e., instead of the sample pre-exposed to the CMF, as shown above), it did not exert a stimulating effect (only 102.2± 7.4%) and did not differ (p = 0.5) in this parameter from the intact (and control—100 ±16.4%) water.
If the effect on aqueous solutions is more of a physical nature, it should depend on time. To account for the time factor, subsequent experiments with serial dilution and vigorous shaking of samples took exactly 90 min (from the beginning of sample preparation to measurement). It was shown that 90 min after the end of the exposure of water to the CMF, the extent of the effect decreased only slightly (by about 5%) relative to the same value after 30 min.
After confirming the ability of the CMF to induce in water new biophysical properties, i.e., to influence ROS production by neutrophils, we investigated the dependencies of the preservation of this activity within a range of serial dilutions and when the static component of the combined magnetic field was changed. C12, C30, and C50 dilutions were selected from the set of 50 centesimal serial dilutions, since these dilution levels showed a significant effect in previous studies [11,16]. The parameters of the SMF component in the CMF varied from the minimum possible value (about 10 nT) to 20,000 nT (20 µT) (Figure 3).
As seen in Figure 3, all tested dilutions (‘C12’, ‘C30’, and ‘C50’), which were prepared in the GMF, exert a significant effect on the chemiluminescence intensity (ROS production by neutrophils). The differences from the control samples (intact water) range from 30 to 60% (p < 0.05) (gray bars in Figure 3a–c and statistics in Figure 3d for GMF samples). At the same time, the group of samples prepared at a near-zero magnetic field (~10 nT) does not have such activity; all measurement results do not differ from the controls (hatched bars in Figure 3a–c and statistics in Figure 3d for SMF samples). Next, when examining similar samples with a gradual increase in the field induction (from 10 nT to 20,000 nT), at which samples were prepared, the p-values decreased (Figure 3d), and the differences in normalized chemiluminescence varied from about a 5–10% increase at 10 nT (p > 0.05) to a 42–56% increase at 20,000 nT (p < 0.05).
Importantly, C12, C30, and C50 dilutions of water prepared under different magnetic fields (at GMF or SMF of various induction) exert different effects on the chemiluminescence intensity of neutrophils. As expected, when the SMF parameter approaches the GMF level, the differences become insignificant (p > 0.05) and amount to about 1–7% (right parts of Figure 3a–c); when the SMF is set to 10 nT or 200 nT, and, therefore, differs significantly from the GMF, one can observe significant differences around 11–35% (p < 0.05) (left parts of Figure 3a–c and statistics Figure 3e).
An additional control experiment was carried out with a water sample pre-treated with the CMF, but was subjected to dilution and intensive shaking procedures outside the hypomagnetic device, and away (at a distance of 2 m) from ferromagnetic structures (preparation of the test sample at the GMF conditions after pre-incubation of water in the CMF). The experiment revealed similar changes in the activity detected in samples that were located on an amagnetic rod, but outside the hypomagnetic device (see Figure 1). For example, for the C50 dilution the activity increased by 128.4 ± 11.1% (p = 0.0047) compared to the control (water without any magnetic pre-incubation).
It was also shown that the preparation of water dilutions (C12, C30, or C50) in different SMF conditions lead to different results. The differences were most significant in the following groups of samples:
  • C12: 10 nT and 20,000 nT (p = 0.018 *),
  • C30: 550 nT and 5000 nT (p = 0.036 *),
  • C50: 900 nT and 200 nT (p = 0.045 *); 900 nT and 5500 nT (p < 0.001 *); 900 nT and 2500 nT (p = 0.031 *).
*—statistical comparison of “all-against-all” adjusted for the multiplicity of comparison (Holm correction).
Thus, the results of testing the biophysical activity of serial dilutions prepared with vigorous shaking of water pre-exposed to a certain CMF field (SMF of 60 µT; AMF of 0.05 µT, 12.6 Hz, exposure time of 1.5 h) showed a stable stimulating effect on ROS production by neutrophils when these procedures were performed under conditions of the GMF or artificially created magnetic fields (approximately above 350–550 nT).

3.2. Parameters of the SMF That Regulate the Ability of HDs of Water to Affect ROS Production by Neutrophils

The effect of high dilution technology is more pronounced only when the initial substance concentration is minimal. After some threshold (number of dilutions), the physico–chemical effects reach a plateau and do not change regardless of the number of additional technological procedures performed. For example, it has been shown that when serial dilutions are prepared, reactive oxygen species are formed, the concentration of which actually reaches a plateau after approximately six dilutions [3]. The formation of ROS in serial dilutions has already been explained theoretically when creating a physical model where changes in the frequency of vibrations can provide an additional occupancy of the singlet energy level of molecular oxygen. This model explains the process of overcoming the quantum exclusion principle in the transition of oxygen from a triplet to a singlet state [17].
However, despite the molecular and theoretical explanation of the processes occurring when performing serial dilution technology, it remained unclear whether the biophysical properties of HDs (i.e., the ability to affect ROS production by neutrophils) could depend on the number of dilution steps, as well as on the SMF parameters under which HDs were prepared. At the next stage, we investigated the activity of HD samples at different levels of dilution (C12, C30, and C50) using luminol-enhanced cellular chemiluminescence. The results are presented in Figure 4 and Table A1.
For all tested water dilutions (C12, C30, and C50 prepared under the CMF conditions with a different SMF component (from 10 nT to 20,000 nT)), the differences between the samples varied. At minimum and maximum values of the SMF, the measurement results are as expected: at 10 nT, water samples at C12, C30, and C50 dilutions differ minimally from the control (intact water) and do not differ from each other (p > 0.05); at 20,000 nT, the differences in the samples from the control are much more pronounced (above 50%) (Figure 4i, all values around 150%), but all three samples (C12, C30, C50) similarly affect the intensity of cellular chemiluminescence (p > 0.53).
Thus, one of the main results is that the biophysical properties of water samples at C12, C30, and C50 dilutions prepared under the intermediate SMF component (varying from 500 nT to 900 nT) significantly differ between each other (p < 0.05).

4. Discussion

This is a continuation of a previous study that clearly showed changes in the biophysical properties of water, which are determined through the effect of a CMF [11]. That study demonstrated that water incubated at the CMF enhanced ROS production by neutrophils. To find out which mechanism underlies the action of a magnetic field to change the ability of water samples to stimulate neutrophils to produce ROS (in our case, this is the CMF of 12.6 Hz 50 nT along with the SMF of 60 µT), additional experiments were required.
Currently, there are different opinions on this issue: the ability of water after exposure to the CMF to enhance ROS production by neutrophils can be associated with “cyclotron” resonance [18] or be the consequence of the correspondence of the AMF frequency to the magnetic moments of protons in molecules [13,19,20], in clusters or hydrated ions, or other general physical mechanisms [21,22,23]. This assumption is supported by works on changes in the refractive index under conditions of weak magnetic fields [24], as well as studies defining water as a tunable oscillator [18]. Naturally, to confirm this hypothesis, in addition to the assessment of biological response, measurement of corresponding physical characteristics will also be required. However, it seems that the form of experimental dependence of ROS production by neutrophils from parameters of the SMF (frequency or the magnitude), as well as the dependence of the effect on the magnitude of the variable component of the magnetic field, may be decisive in determining the activity of water incubated under such magnetic fields.
In this work, we show that the presence of magnetic fields is necessary for maintaining the ability of water dilutions to enhance ROS production by neutrophils. At values close to the GMF, namely at an SMF of 20,000 nT, the measurement results did not differ from those at the GMF. At the same time, when the SMF component was changed to near-zero values, the activity of samples pre-exposed at this field did not differ from the controls (intact water). For example, in the case of C12, samples with minimum or maximum values of the SMF (10 nT and 20,000 nT) differed the most. The C50 samples showed more pronounced differences at medium fields of about 900 nT. This means that the different dilutions are not identical in terms of biophysical properties. Thus, the experimentally determined values of the “maintaining” magnetic field (in our case, it is the SMF in the range of a weak “hypomagnetic” field) can be useful for determining specific magnetic moments involved in the formation and retention of the activity assessed.
It has been established that the dynamics of a single magnetic moment relative to a selected direction set by its local chemical environment can be altered using an external magnetic field [21,22,23]. The most significant changes in the dynamics of magnetic moments can occur exactly at the “zero” magnetic field conditions, when the energy between the split Zeeman sublevels of magnetic moments becomes extremely small [21,22,23]. There are a few possible targets possessing a magnetic moment: an electron (with spin and orbital magnetic moments), the magnetic moment of a proton, and other magnetic nuclei (e.g., C13, N15, etc.). The gyromagnetic ratio and lifetime of all these potential targets of the magnetic field effect differ significantly and are often known for different molecular environments. The experimental dependence of ROS production by neutrophils at a near-zero magnetic field, which we documented in detail, may be sufficient for the successful calculation and determination of the field target responsible for the specific magnetic effect we identified. It is possible that the patterns discovered in our work are also applicable to HDs of not only water but also various substances in low concentrations.
It is known that physical influences (mechanical shaking coupled with a weak magnetic field with the frequency of cyclotron resonance of water), which are applied during the procedure of successive dilutions of antibodies to interferon gamma, change the infrared emission of the resulting solutions [25]. In addition, it was shown that the shaking of the water leads to an increase in its energy, which is relaxed in the form of blue emission [2] with the formation of long-lived (about a week) inhomogeneities in solutions [26]. Experiments using the shaking and dilution of water also demonstrated an increase in ROS concentration [27]. These changes in physical properties have already been explained using models of theoretical physics. These models describe the complexation of particles in the medium [28] and the formation of ROS [29]. The physical properties of HD water, which was pre-incubated in magnetic fields, can be evaluated in future studies using the same physical parameters, such as emission in the visible and infrared parts of the spectrum, the formation of inhomogeneities, etc.
For future studies, it is also necessary to propose possible biological targets for the action of samples obtained after the pre-incubation of water in a magnetic field and the implementation of serial dilution technology. Neutrophil priming is more dependent on the rate of phosphorylation of the molecular components of NADPH oxidase than on the effect on receptors for fMLF or mechanoreceptors [30]. However, more research is needed to provide a more definitive answer on the role of NADPH oxidase or mechanoreceptors in the identified effect.

5. Conclusions

In this study, we repeatedly confirmed that water, after magnetic exposure, exerts a stimulating effect on ROS production by neutrophils, and this ability was retained after multiple serial dilutions. This effect has already been described by us, and we know that a combination of two factors is required to retain HD activity: a mechanical effect (shaking) and the presence of a magnetic field in the area where the mechanical effect is exerted.
However, the dependencies on the dilution level and the parameters of the magnetic field for retaining HD’s activity have been investigated only in the current study. We show that the ability of HDs of water pre-exposed to the CMF to enhance ROS production by neutrophils depends on the parameters of the magnetic field at which the dilutions are prepared. At fields close to 10 nT, the ability of HD samples to activate neutrophils was completely lost but reached its maximum at fields approximately above 1 µT. In addition, within a range of serial dilutions, their ability to activate ROS production by neutrophils also differed between various dilutions, which indicates that the physical properties of highly diluted water samples are nonequivalent.

Author Contributions

Conceptualization, V.V.N. and E.E.F.; methodology, V.V.N. and E.V.Y.; data analysis, V.V.N. and E.V.Y.; writing, V.V.N. and E.E.F. All authors have read and agreed to the published version of the manuscript.

Funding

This research was partially funded by state task (075-00609-24-01 for 2024-2026). The APC was funded by OOO “NPF “Materia Medica Holding”.

Institutional Review Board Statement

The study was conducted in accordance with the Declaration of Helsinki and approved by the Institutional Review Board at the Institute of Cell Biophysics (protocol number 57, date 30 December 2011).

Informed Consent Statement

Not applicable.

Data Availability Statement

Dataset available on request from the authors. The raw data supporting the conclusions of this article will be made available by the authors on request.

Acknowledgments

Authors express their sincere gratitude to all the staff at the Institute of Cell Biophysics of the Russian Academy of Sciences, and to Nikolay E. Shvirst and Vasily M. Vershinin for engineering assistance.

Conflicts of Interest

The authors declare no conflicts of interest. The APC was funded by OOO “NPF “Materia Medica Holding”. OOO “NPF “Materia Medica Holding” had no role in the design of the study; in the collection, analyses, or interpretation of data; in the writing of the manuscript; or in the decision to publish the results.

Appendix A

Table A1. The chemiluminescence intensity of the neutrophil suspension after adding dilutions of water pre-exposed to the CMF to the culture medium. Samples were prepared under GMF and SMF conditions from 10 to 20,000 nT (n = 6); the results are presented as Mean ± SD.
SMF ValuesNumber of Dilution, CChemiluminescence Intensity, V
GMFSMF
ControlExperimentpControlExperimentp
SMF 10 nT122.98 ± 0.233.95 ± 0.910.03033.17 ± 0.503.34 ± 0.410.4848
100 ± 7.7%132.6 ± 30.5%100 ± 15.8%105.4 ± 12.4%
303.01 ± 0.173.95 ± 0.200.00273.29 ± 0.313.67 ± 0.780.2951
100 ± 5.6%131.2 ± 6.6%100 ± 9.4%111.6 ± 23.7%
503.09 ± 0.184.94 ± 0.950.04113.33 ± 0.384.05 ± 1.110.1373
100 ± 5.8%159.9 ± 30.7%100 ± 11.4%121.6 ± 33.3
SMF 200 nT123.91 ± 0.495.58 ± 0.510.00024.39 ± 0.795.00 ± 0.460.1319
100 ± 12.5%142.7 ± 13.0%100 ± 18.0%113.9 ± 10.5%
303.21 ± 0.724.64 ± 0.430.00194.13 ± 0.494.65 ± 0.330.0411
100 ± 22.4%144.6 ± 13.4%100 ± 11.9%112.6 ± 8.0%
503.95 ± 0.434.58 ± 0.170.00693.70 ± 0.733.88 ± 0.410.6218
100 ± 10.9%116.0 ± 4.3%100 ± 19.7%104.9 ± 11.1%
SMF 350 nT122.41 ± 0.313.45 ± 0.370.00022.39 ± 0.353.41 ± 0.690.0085
100 ± 12.9%143.2 ± 15.4%100 ± 14.6%142.7 ± 28.9%
302.37 ± 0.263.17 ± 0.250.00032.41 ± 0.362.93 ± 0.510.0649
100 ± 11.0%133.8 ± 10.6%100 ± 14.9%121.6 ± 21.2%
501.98 ± 0.322.79 ± 0.350.00182.41 ± 0.272.79 ± 0.350.0721
100 ± 16.2%140.9 ± 17.7%100 ± 11.2%115.8 ± 14.5%
SMF 550nT124.44 ± 0.585.94 ± 0.650.00244.75 ± 0.425.45 ± 0.580.0365
100 ± 13.1%133.8 ± 14.6%100 ± 8.8%114.7 ± 12.2%
304.28 ± 0.454.87 ± 0.500.0593.85 ± 0.565.46 ± 0.610.0008
100 ± 10.5%113.8 ± 11.7%100 ± 14.5%141.8 ± 15.8%
504.02 ± 0.445.58 ± 0.680.000854.14 ± 0.584.27 ± 0.250.6368
100 ± 10.9%138.8 ± 16.9%100 ± 14.0%103.1 ± 6.1%
SMF 900 nT122.39 ± 0.333.85 ± 0.870.003343.36 ± 0.223.99 ± 0.290.0087
100 ± 13.8%161.1 ± 36.4%100 ± 6.6%118.8 ± 8.6%
303.37 ± 0.263.92 ± 0.270.00463.10 ± 0.464.34 ± 0.530.0016
100 ± 7.7%116.3 ± 8.0%100 ± 14.8%140.0 ± 17.1%
502.58 ± 0.273.33 ± 0.260.00063.02 ± 0.423.93 ± 0.190.0007
100 ± 10.5%129.1 ± 10.1%100 ± 13.9%130.1 ± 6.3%
SMF 1500 nT124.12 ± 0.324.86 ± 0.660.03483.76 ± 0.224.31 ± 0.370.0103
100 ± 7.8%118.0 ± 16.0%100 ± 5.9%114.6 ± 9.8%
303.31 ± 0.454.40 ± 0.410.00133.55 ± 0.234.11 ± 0.300.0046
100 ± 13.6%132.9 ± 12.4%100 ± 6.5%115.8 ± 8.5%
503.78 ± 0.314.41 ± 0.310.00533.71 ± 0.444.38 ± 0.340.0148
100 ± 8.2%116.7 ± 8.2%100 ± 11.9%118.1 ± 9.2%
SMF 2500 nT123.10 ± 0.855.24 ± 0.990.00873.42 ± 0.864.35 ± 0.450.0187
100 ± 27.4%169.0 ± 31.9%100 ± 25.1%127.2 ± 13.2%
303.50 ± 0.454.37 ± 0.200.00153.33 ± 0.593.72 ± 0.470.2297
100 ± 12.8%124.9 ± 5.7%100 ± 17.7%111.8 ± 14.1%
503.37 ± 0.234.06 ± 0.290.00223.72 ± 0.384.28 ± 0.160.0077
100 ± 6.8%120.5 ± 8.6%100 ± 10.2%115.1 ± 4.3%
SMF 5000 nT125.98 ± 0.638.91 ± 0.510.00035.99 ± 0.427.86 ± 0.680.0002
100 ± 10.5%150.0 ± 8.5%100 ± 7.0%131.2 ± 11.4%
305.54 ± 0.456.36 ± 0.200.06496.46 ± 0.686.84 ± 0.530.2981
100 ± 8.1%114.8 ± 3.6%100 ± 10.5%105.9 ± 8.2%
504.66 ± 0.656.22 ± 0.930.00646.59 ± 0.447.91 ± 1.230.0469
100 ± 14.0%133.5 ± 29.0%100 ± 6.7%120.0 ± 18.7%
SMF 20,000 nT123.07 ± 0.294.65 ± 0.990.012.97 ± 0.244.63 ± 1.060.0113
100 ± 9.4%151.5 ± 32.2%100 ± 8.1%155.9 ± 35.7%
303.40 ± 0.714.58 ± 0.240.00873.29 ± 0.764.67 ± 0.790.026
100 ± 20.9%134.7 ± 7.1%100 ± 23.1%141.9 ± 24.0%
503.13 ± 0.664.67 ± 0.660.00863.65 ± 0.915.38 ± 0.890.0077
100 ± 21.1%149.2 ± 21.1%100 ± 24.9%147.4 ± 24.4%

References

  1. Epstein, O. The Supramolecular Matrix Concept. Symmetry 2023, 15, 1914. [Google Scholar] [CrossRef]
  2. Gudkov, S.V.; Penkov, N.V.; Baimler, I.V.; Lyakhov, G.A.; Pustovoy, V.I.; Simakin, A.V.; Sarimov, R.M.; Scherbakov, I.A. Effect of Mechanical Shaking on the Physicochemical Properties of Aqueous Solutions. Int. J. Mol. Sci. 2020, 21, 8033. [Google Scholar] [CrossRef] [PubMed]
  3. Gudkov, S.V.; Lyakhov, G.A.; Pustovoy, V.I.; Shcherbakov, I.A. Influence of Mechanical Effects on the Hydrogen Peroxide Concentration in Aqueous Solutions. Phys. Wave Phenom. 2019, 27, 141–144. [Google Scholar] [CrossRef]
  4. Astashev, M.E.; Serov, D.A.; Sarimov, R.M.; Gudkov, S.V. Influence of the Vibration Impact Mode on the Spontaneous Chemiluminescence of Aqueous Protein Solutions. Phys. Wave Phenom. 2023, 31, 189–199. [Google Scholar] [CrossRef]
  5. Shcherbakov, I.A.; Baimler, I.V.; Gudkov, S.V.; Lyakhov, G.A.; Mikhailova, G.N.; Pustovoy, V.I.; Sarimov, R.M.; Simakin, A.V.; Troitsky, A.V. Influence of a Constant Magnetic Field on Some Properties of Water Solutions. Dokl. Phys. 2020, 65, 273–275. [Google Scholar] [CrossRef]
  6. Lobyshev, V.I. Water as a Sensor of Weak Impacts on Biological Systems. Biophys. Rev. 2023, 15, 819–832. [Google Scholar] [CrossRef]
  7. Bunkin, N.F.; Shkirin, A.V.; Ninham, B.W.; Chirikov, S.N.; Chaikov, L.L.; Penkov, N.V.; Kozlov, V.A.; Gudkov, S.V. Shaking-Induced Aggregation and Flotation in Immunoglobulin Dispersions: Differences between Water and Water–Ethanol Mixtures. ACS Omega 2020, 5, 14689–14701. [Google Scholar] [CrossRef]
  8. Tarasov, S.A.; Gorbunov, E.A.; Don, E.S.; Emelyanova, A.G.; Kovalchuk, A.L.; Yanamala, N.; Schleker, A.S.S.; Klein-Seetharaman, J.; Groenestein, R.; Tafani, J.-P.; et al. Insights into the Mechanism of Action of Highly Diluted Biologics. J. Immunol. 2020, 205, 1345–1354. [Google Scholar] [CrossRef]
  9. Konovalov, D.A.; Murtazina, L.I.; Ryzhkina, I.S.; Konovalov, A.I. Effect of Weak Electromagnetic Fields on Self-Organization of Highly Diluted Solutions of Alkylated p-Sulfonatocalix[6]Arene. Dokl. Phys. Chem. 2015, 463, 154–157. [Google Scholar] [CrossRef]
  10. Ryzhkina, I.S.; Murtazina, L.I.; Kiseleva, Y.V.; Konovalov, A.I. Self-Organization and Physicochemical Properties of Aqueous Solutions of the Antibodies to Interferon Gamma at Ultrahigh Dilution. Dokl. Phys. Chem. 2015, 462, 110–114. [Google Scholar] [CrossRef]
  11. Novikov, V.V.; Yablokova, E.V.; Fesenko, E.E. The Role of Water in the Effect of Weak Combined Magnetic Fields on Production of Reactive Oxygen Species (ROS) by Neutrophils. Appl. Sci. 2020, 10, 3326. [Google Scholar] [CrossRef]
  12. Novikov, V.V.; Yablokova, E.V.; Fesenko, E.E. Stimulation and Inhibition of Respiratory Burst in Neutrophils as a Result of Action of Weak Combined Magnetic Fields Adjusted to ICR of Protonated Water Forms. Electromagn. Biol. Med. 2020, 39, 364–373. [Google Scholar] [CrossRef]
  13. Barnes, F.S.; Greenebaum, B. The Effects of Weak Magnetic Fields on Radical Pairs. Bioelectromagnetics 2015, 36, 45–54. [Google Scholar] [CrossRef]
  14. Lai, H. Exposure to Static and Extremely-Low Frequency Electromagnetic Fields and Cellular Free Radicals. Electromagn. Biol. Med. 2019, 38, 231–248. [Google Scholar] [CrossRef] [PubMed]
  15. Mattsson, M.-O.; Simkó, M. Grouping of Experimental Conditions as an Approach to Evaluate Effects of Extremely Low-Frequency Magnetic Fields on Oxidative Response in in Vitro Studies. Front. Public Health 2014, 2, 132. [Google Scholar] [CrossRef] [PubMed]
  16. Novikov, V.V.; Yablokova, E.V. Interaction between Highly Diluted Samples, Protein Solutions and Water in a Controlled Magnetic Field. Appl. Sci. 2022, 12, 5185. [Google Scholar] [CrossRef]
  17. Lyakhov, G.A.; Manko, V.I.; Suyazov, N.V.; Shcherbakov, I.A. Impact of Classical Vibrations on Quantum Objects. Collect. Proc. Conf. Phys. Aqueous Solut. 2023, 2023, 133. [Google Scholar]
  18. Liboff, A.R.; Poggi, C.; Pratesi, P. Weak Low-Frequency Electromagnetic Oscillations in Water. Electromagn. Biol. Med. 2017, 36, 154–157. [Google Scholar] [CrossRef] [PubMed]
  19. Barnes, F.; Freeman, J.E.R. Some Thoughts on the Possible Health Effects of Electric and Magnetic Fields and Exposure Guidelines. Front. Public Health 2022, 10, 994758. [Google Scholar] [CrossRef]
  20. Barnes, F.; Greenebaum, B. Role of Radical Pairs and Feedback in Weak Radio Frequency Field Effects on Biological Systems. Environ. Res. 2018, 163, 165–170. [Google Scholar] [CrossRef]
  21. Binhi, V.N.; Prato, F.S. Biological Effects of the Hypomagnetic Field: An Analytical Review of Experiments and Theories. PLoS ONE 2017, 12, e0179340. [Google Scholar] [CrossRef] [PubMed]
  22. Binhi, V.N.; Prato, F.S. A Physical Mechanism of Magnetoreception: Extension and Analysis. Bioelectromagnetics 2017, 38, 41–52. [Google Scholar] [CrossRef] [PubMed]
  23. Binhi, V.N. Primary Physical Mechanism of the Biological Effects of Weak Magnetic Fields. Biophysics 2016, 61, 170–176. [Google Scholar] [CrossRef]
  24. D’Emilia, E.; Ledda, M.; Foletti, A.; Lisi, A.; Giuliani, L.; Grimaldi, S.; Liboff, A.R. Weak-Field H3O+ Ion Cyclotron Resonance Alters Water Refractive Index. Electromagn. Biol. Med. 2017, 36, 55–62. [Google Scholar] [CrossRef] [PubMed]
  25. Penkov, N.V. Influence of the Combined Magnetic Field and High Dilution Technology on the Intrinsic Emission of Aqueous Solutions. Water 2023, 15, 599. [Google Scholar] [CrossRef]
  26. Penkov, N.V. Temporal Dynamics of the Scattering Properties of Deionized Water. Phys. Wave Phenom. 2020, 28, 135–139. [Google Scholar] [CrossRef]
  27. Shcherbakov, I.A. Specific Features of the Concentration Dependences of Impurities in Condensed Media. Phys. Wave Phenom. 2020, 28, 83–87. [Google Scholar] [CrossRef]
  28. Shapovalov, A.V. On Equivalence between Kinetic Equations and Geodesic Equations in Spaces with Affine Connection. Symmetry 2023, 15, 905. [Google Scholar] [CrossRef]
  29. Lyakhov, G.A.; Man’ko, V.I.; Suyazov, N.V.; Shcherbakov, I.A.; Shermeneva, M.A. Physical Mechanisms of Activation of Radical Reactions in Aqueous Solutions under Mechanical and Magnetic Effect: Problem of Singlet Oxygen. Phys. Wave Phenom. 2022, 30, 174–181. [Google Scholar] [CrossRef]
  30. El-Benna, J.; Dang, P.M.-C.; Gougerot-Pocidalo, M.-A. Priming of the Neutrophil NADPH Oxidase Activation: Role of P47phox Phosphorylation and NOX2 Mobilization to the Plasma Membrane. Semin. Immunopathol. 2008, 30, 279–289. [Google Scholar] [CrossRef]
Figure 1. Vertical unit for vigorous shaking of water under various magnetic conditions (GMF, near-zero magnetic field, or CMF): (a) general view; (b) schematic drawing [11].
Applsci 14 03290 g001
Figure 2. Kinetic curves of the chemiluminescent response of neutrophil suspension after adding luminol and fMLF. (a) The effect of water preincubated in a magnetic field; (b) the action of water pre-incubated in a magnetic field and subjected to the procedure of serial dilutions. Before chemiluminescence measurements neutrophils were pre-incubated with: 1. intact water (control)—blue curve in panels (a,b); 2. water pre-treated with a CMF—orange curve in panel (a); 3. water pre-treated with a CMF, but then subjected to the procedure of serial dilutions to 10012 (C12), 10030 (C30), and 10050 (C50)—orange curves in panel (b). SMF of 60 µT; AMF of 50 nT, 12.6 Hz, exposure time of 1.5 h. PowerGraph software (OOO “DISoft”, Moscow, Russia) was used to assess the maximum chemiluminescence intensity. The results are presented in relative units.
Applsci 14 03290 g002
Figure 3. Testing the properties of water after treatment with the CMF (alternating field 12.6 Hz, 50 nT; static field 60 µT), followed by serial dilution and intense shaking at different values of the residual SMF. All samples were tested after dilution: panel (a) C12—(10012 times dilution); panel (b) C30—(10030 times dilution); panel (c) C50—(10050 times dilution). The measurements of normalized chemiluminescence are presented as Mean ± Standard deviation. Normalized chemiluminescence was calculated by dividing the maximum chemiluminescence value measured for a particular sample by the maximum value obtained for control water. The value of chemiluminescence for “Water” sample (Control) was taken as 100% (not shown on the graph). * p < 0.05 (calculated values for each comparison presented on section (e). (d,e)—p-values obtained during statistical comparison of the results shown in (ac) using the Student/Welch t-test and Mann–Whitney test. A comparison was made between the chemiluminescence intensity indicated for: (d)—C12, C30, C50 dilutions (designations are provided at the top of each column) and control water taken as 100%; p-values marked in red—no differences from control water (negative control), yellow—borderline values, green—there are differences from control water. (e)—C12, C30, C50 dilutions (designations are provided at the top of each column) made at the SMF (has different values) and the identical sample, but prepared at the GMF; p-values marked in red—there are differences from a similar sample prepared at the GMF (positive control), green—no differences from a similar sample prepared at the GMF.
Applsci 14 03290 g003aApplsci 14 03290 g003b
Figure 4. The effect of water samples previously incubated at different magnetic field parameters on ROS production by neutrophils. Pre-incubation of water samples was performed under the geomagnetic field (GMF) conditions, but on different days (panels (ai), 3 right bars) or under static magnetic field (SMF) conditions from 10 to 20,000 nT (panels (ai), 3 left bars). The measurements of normalized chemiluminescence are presented as Mean ± Standard deviation. Normalized chemiluminescence was calculated by dividing the maximum chemiluminescence value measured for a particular sample by the maximum value obtained for water. The value of chemiluminescence for “Water” sample (Control) was taken as 100% (not shown on the graph). * p < 0.05 (t-test with Holm correction for multiple comparisons).
Applsci 14 03290 g004
Table 1. Chemiluminescence intensity of neutrophil suspension after addition of water pre-treated with the CMF (SMF of 60 µT; AMF of 50 nT, 12.6 Hz; exposure time of 1.5 h) to the culture medium. n = 6 for each experiment. The measurements of the maximum of chemiluminescence intensity are presented as Mean ± Standard deviation, and additionally, in the brackets results of normalized chemiluminescence are presented. Normalized chemiluminescence was calculated by dividing the maximum chemiluminescence value measured for a particular sample by the maximum value obtained for water. The value of chemiluminescence for the “Water” sample (Control) was taken as 100%.
Experiment No.Chemiluminescence Intensity, V
ControlTestp-Value
I5.17 ± 0.37 (100 ± 7.2%)7.16 ± 0.84 (138.5 ± 16.2%)0.00034
II5.34 ± 0.75 (100 ± 14.0%)7.51 ± 0.86 (140.6 ± 16.1%)0.00216
III4.26 ± 0.85 (100 ± 19.9%)5.99 ± 0.79 (140.6 ± 18.5%)0.00420
IV3.30 ± 0.25 (100 ± 7.6%)4.96 ± 0.81 (150.3 ± 24.5%)0.00320
Disclaimer/Publisher’s Note: The statements, opinions and data contained in all publications are solely those of the individual author(s) and contributor(s) and not of MDPI and/or the editor(s). MDPI and/or the editor(s) disclaim responsibility for any injury to people or property resulting from any ideas, methods, instructions or products referred to in the content.

