Article

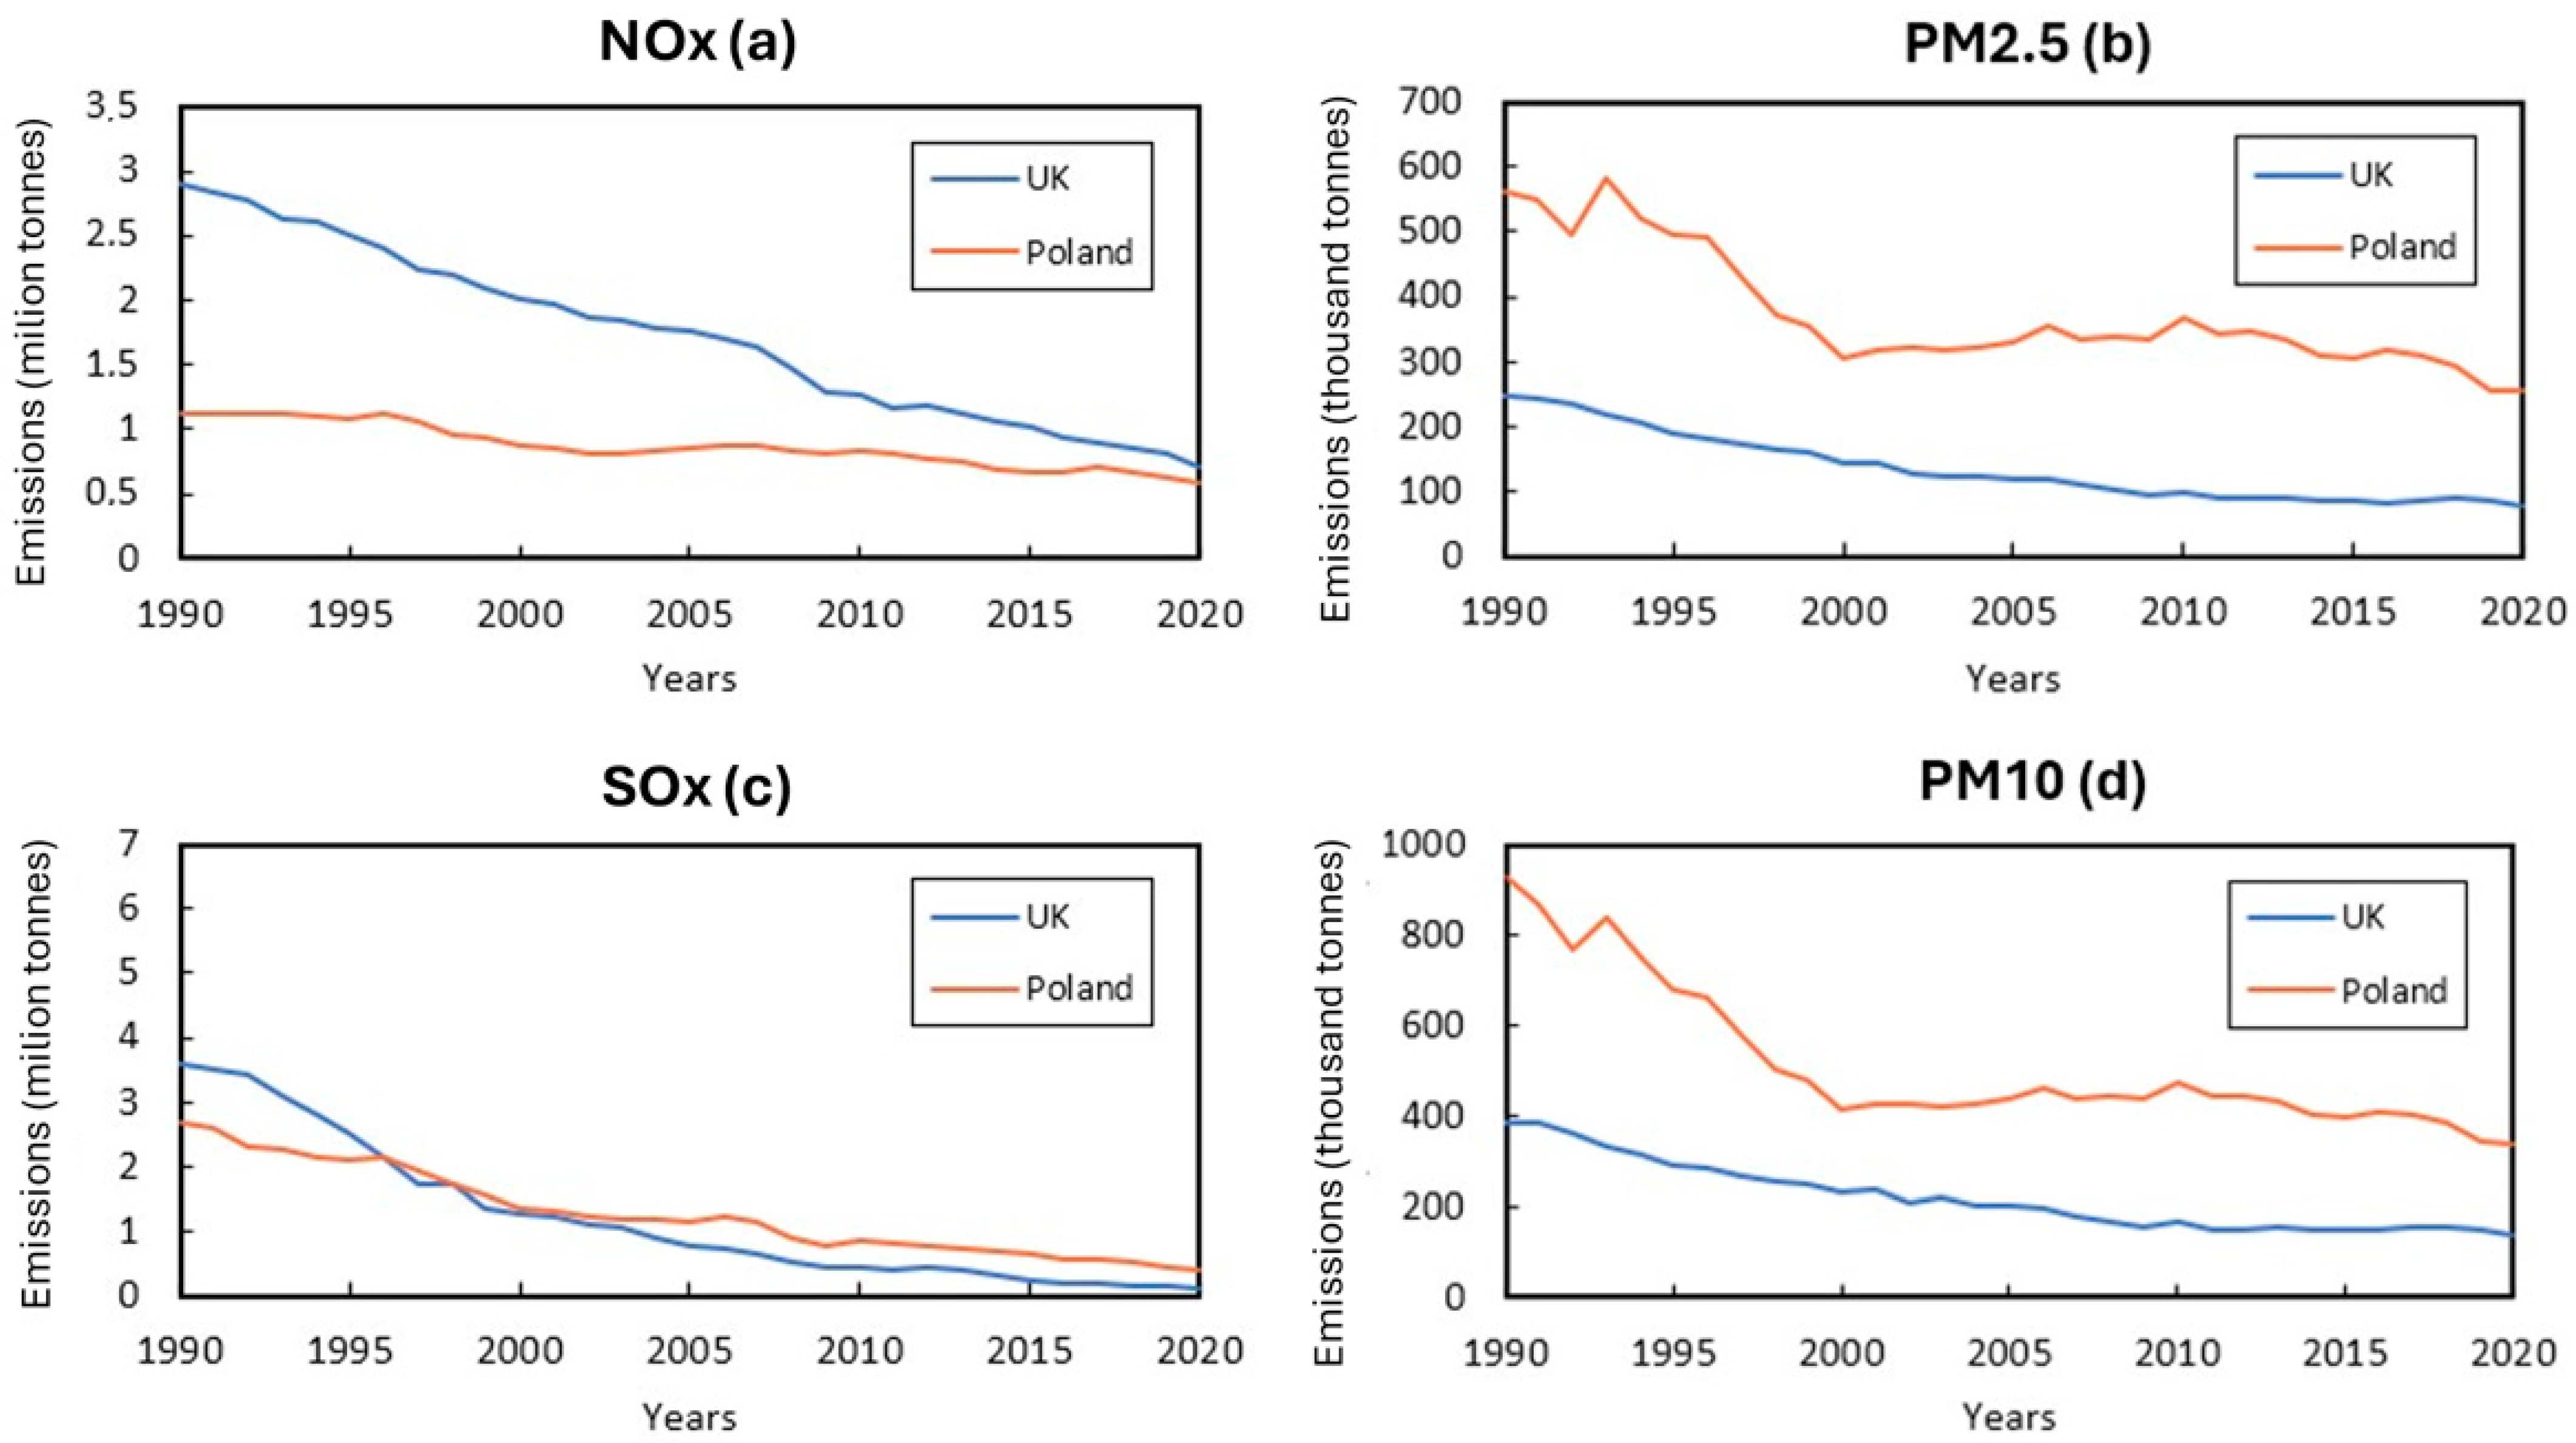
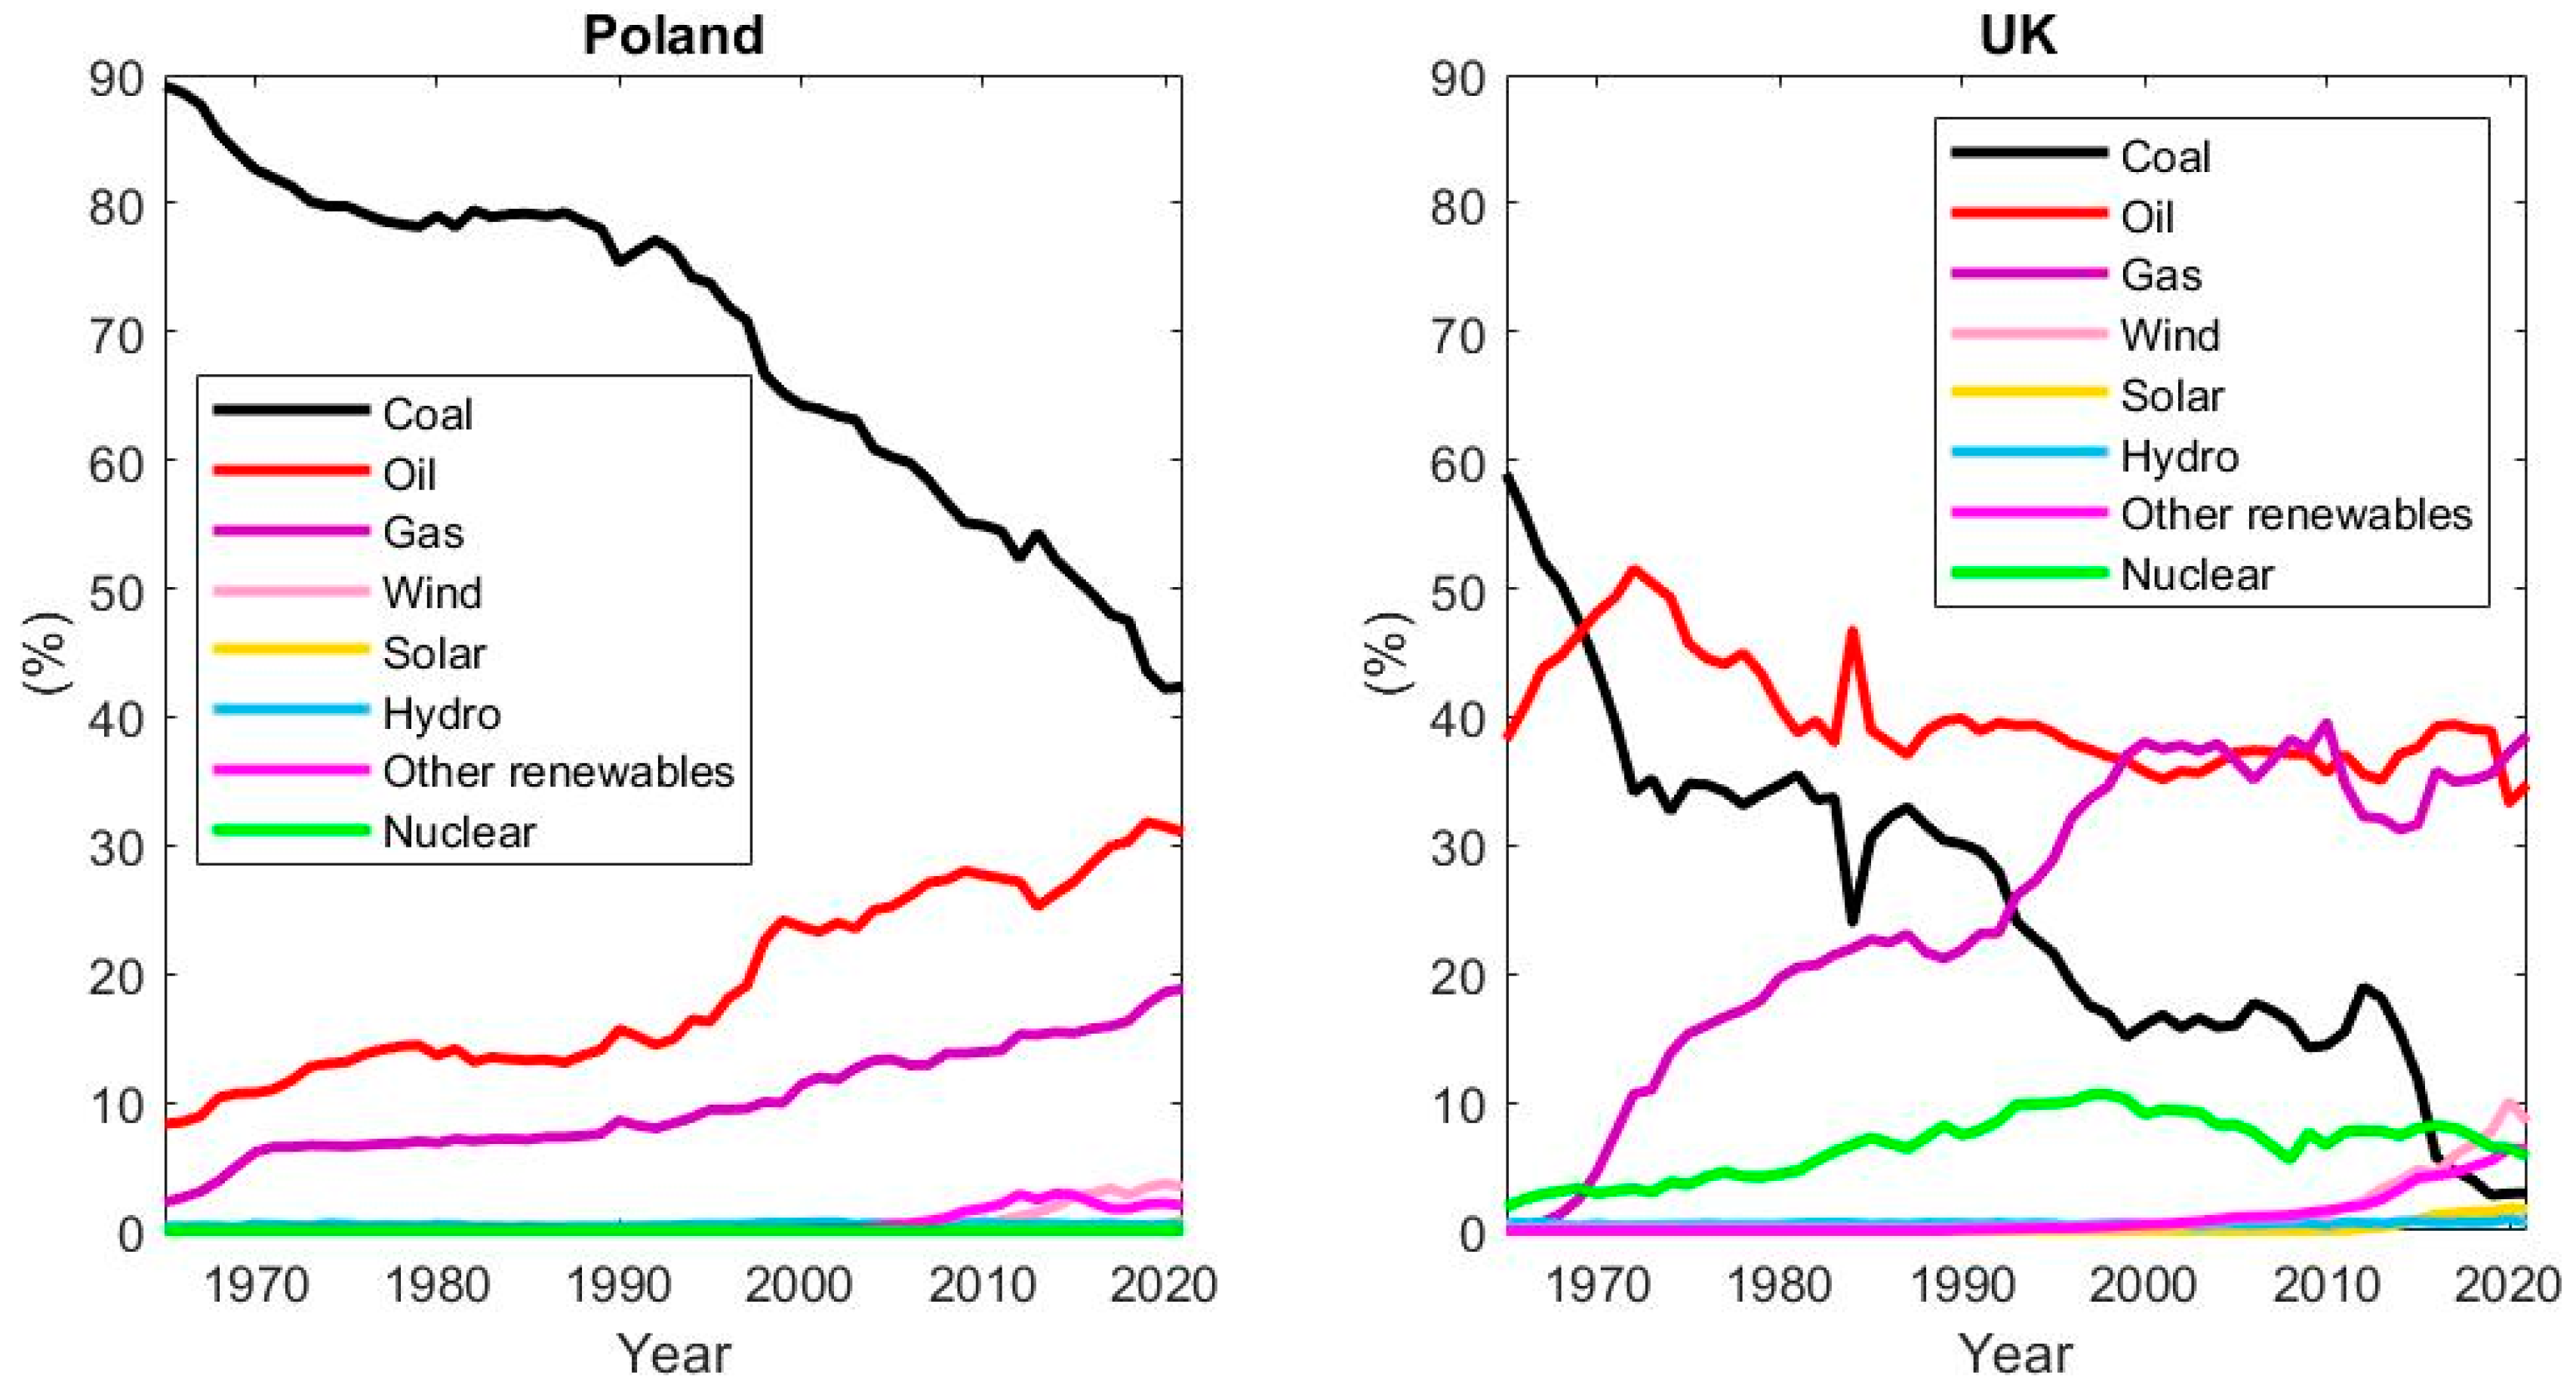
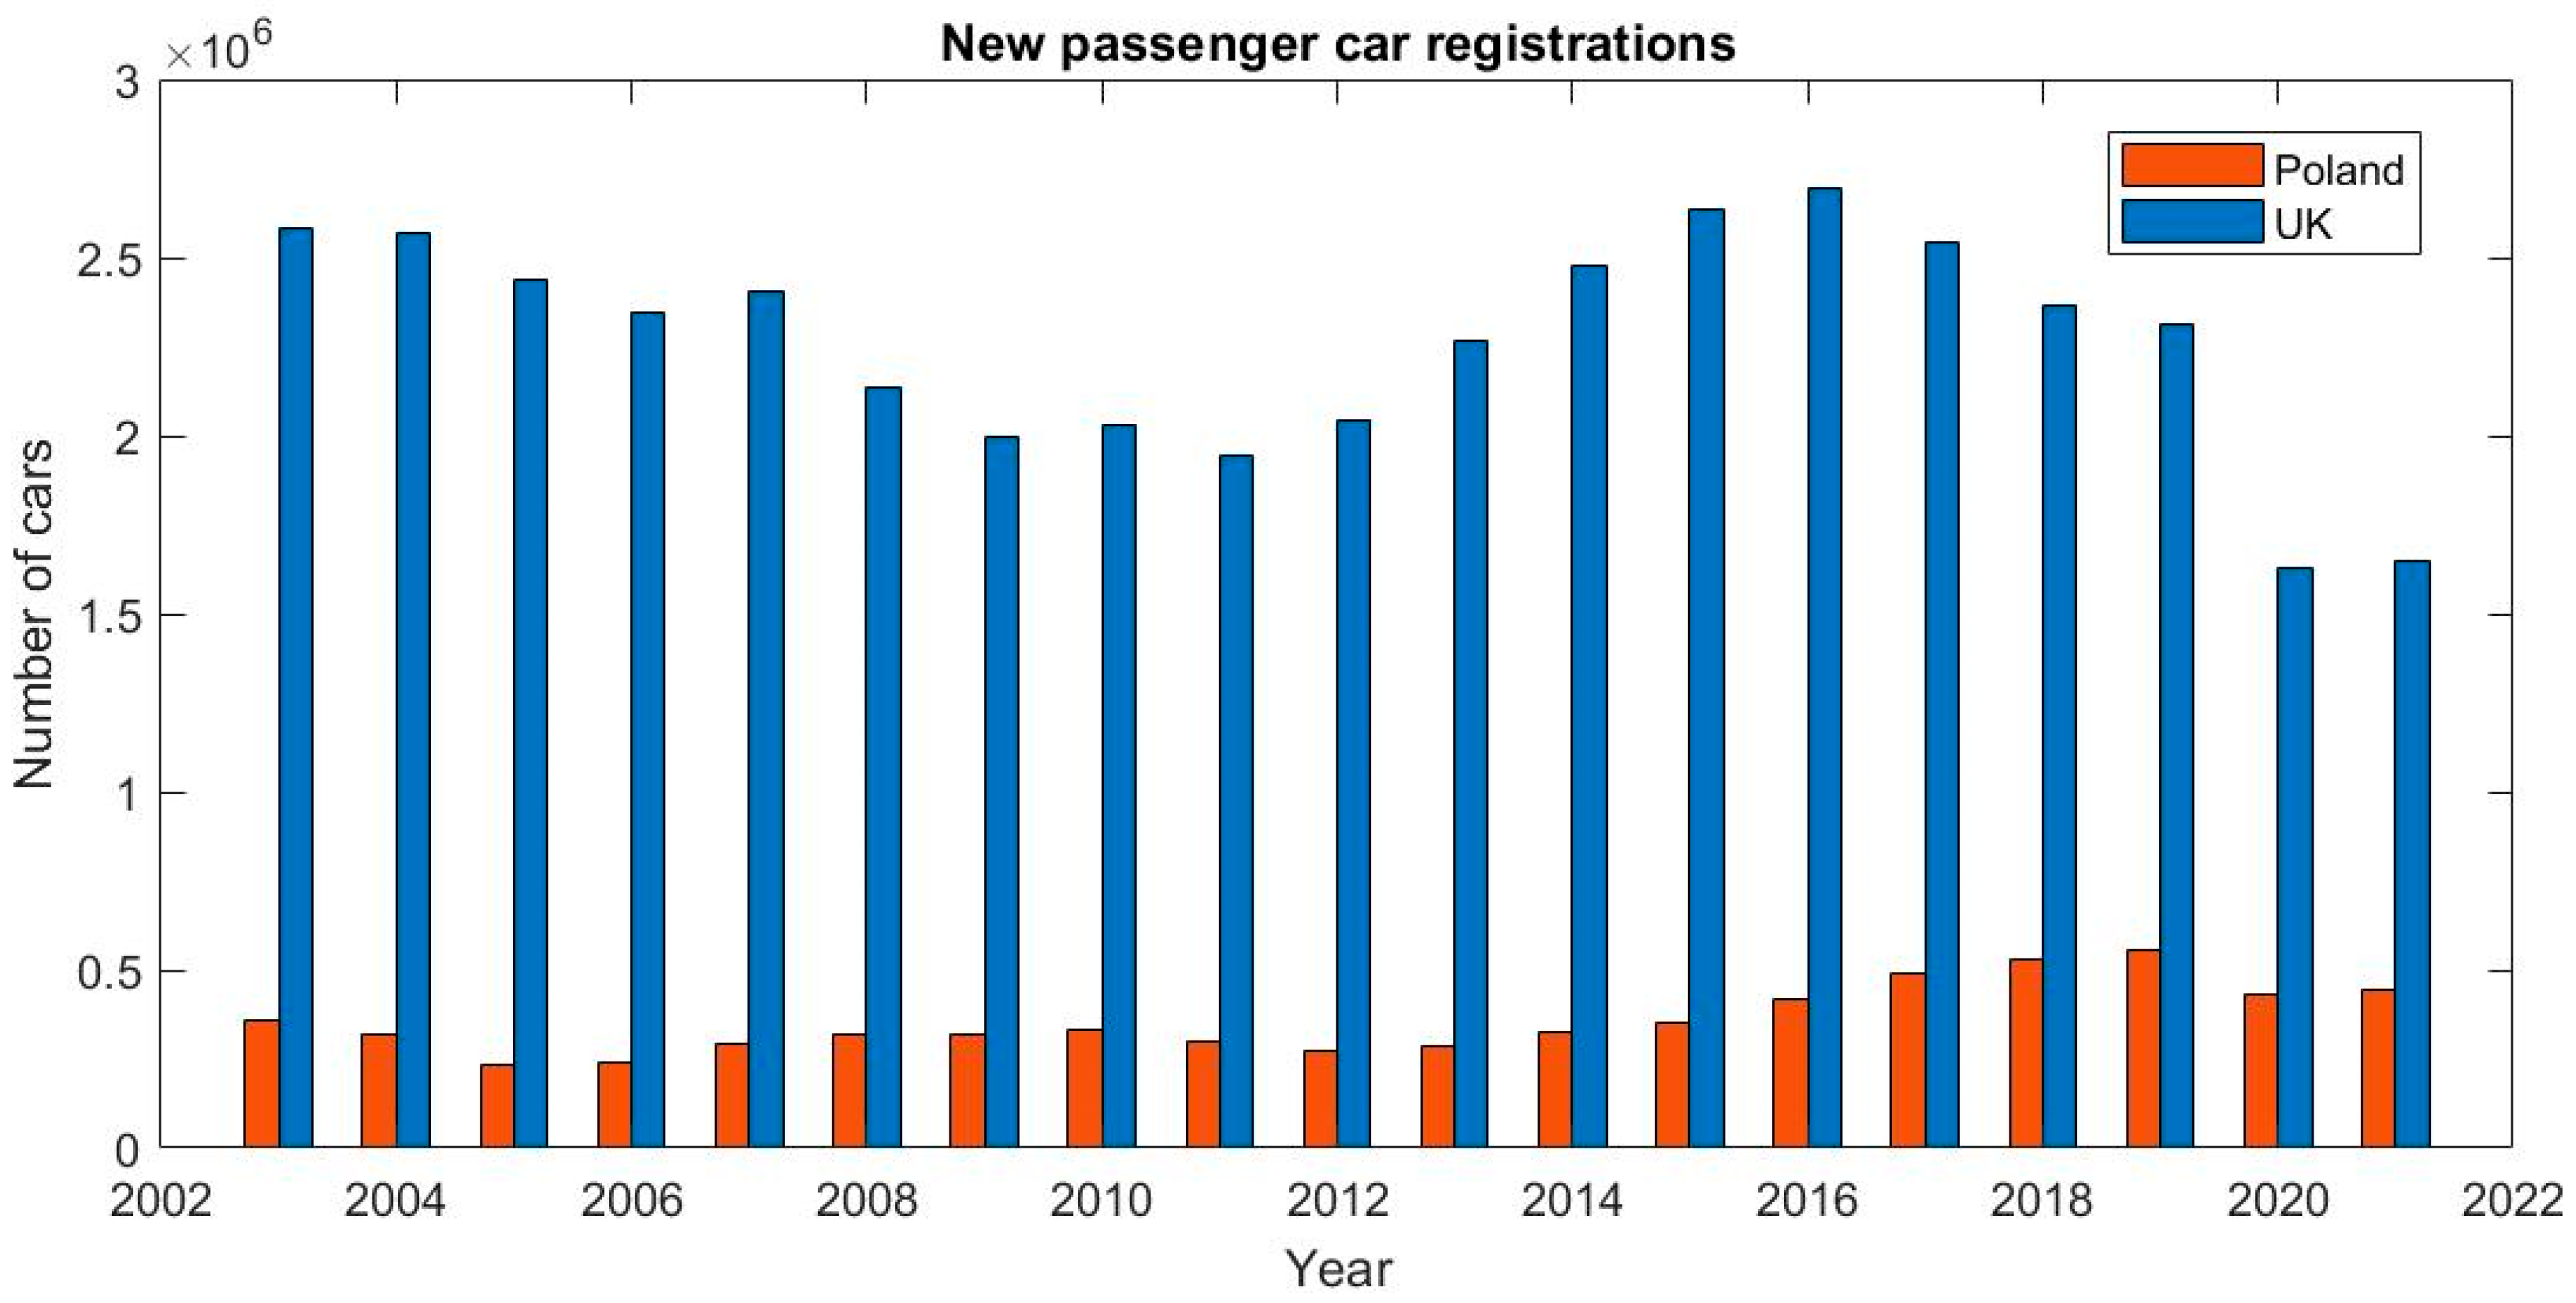
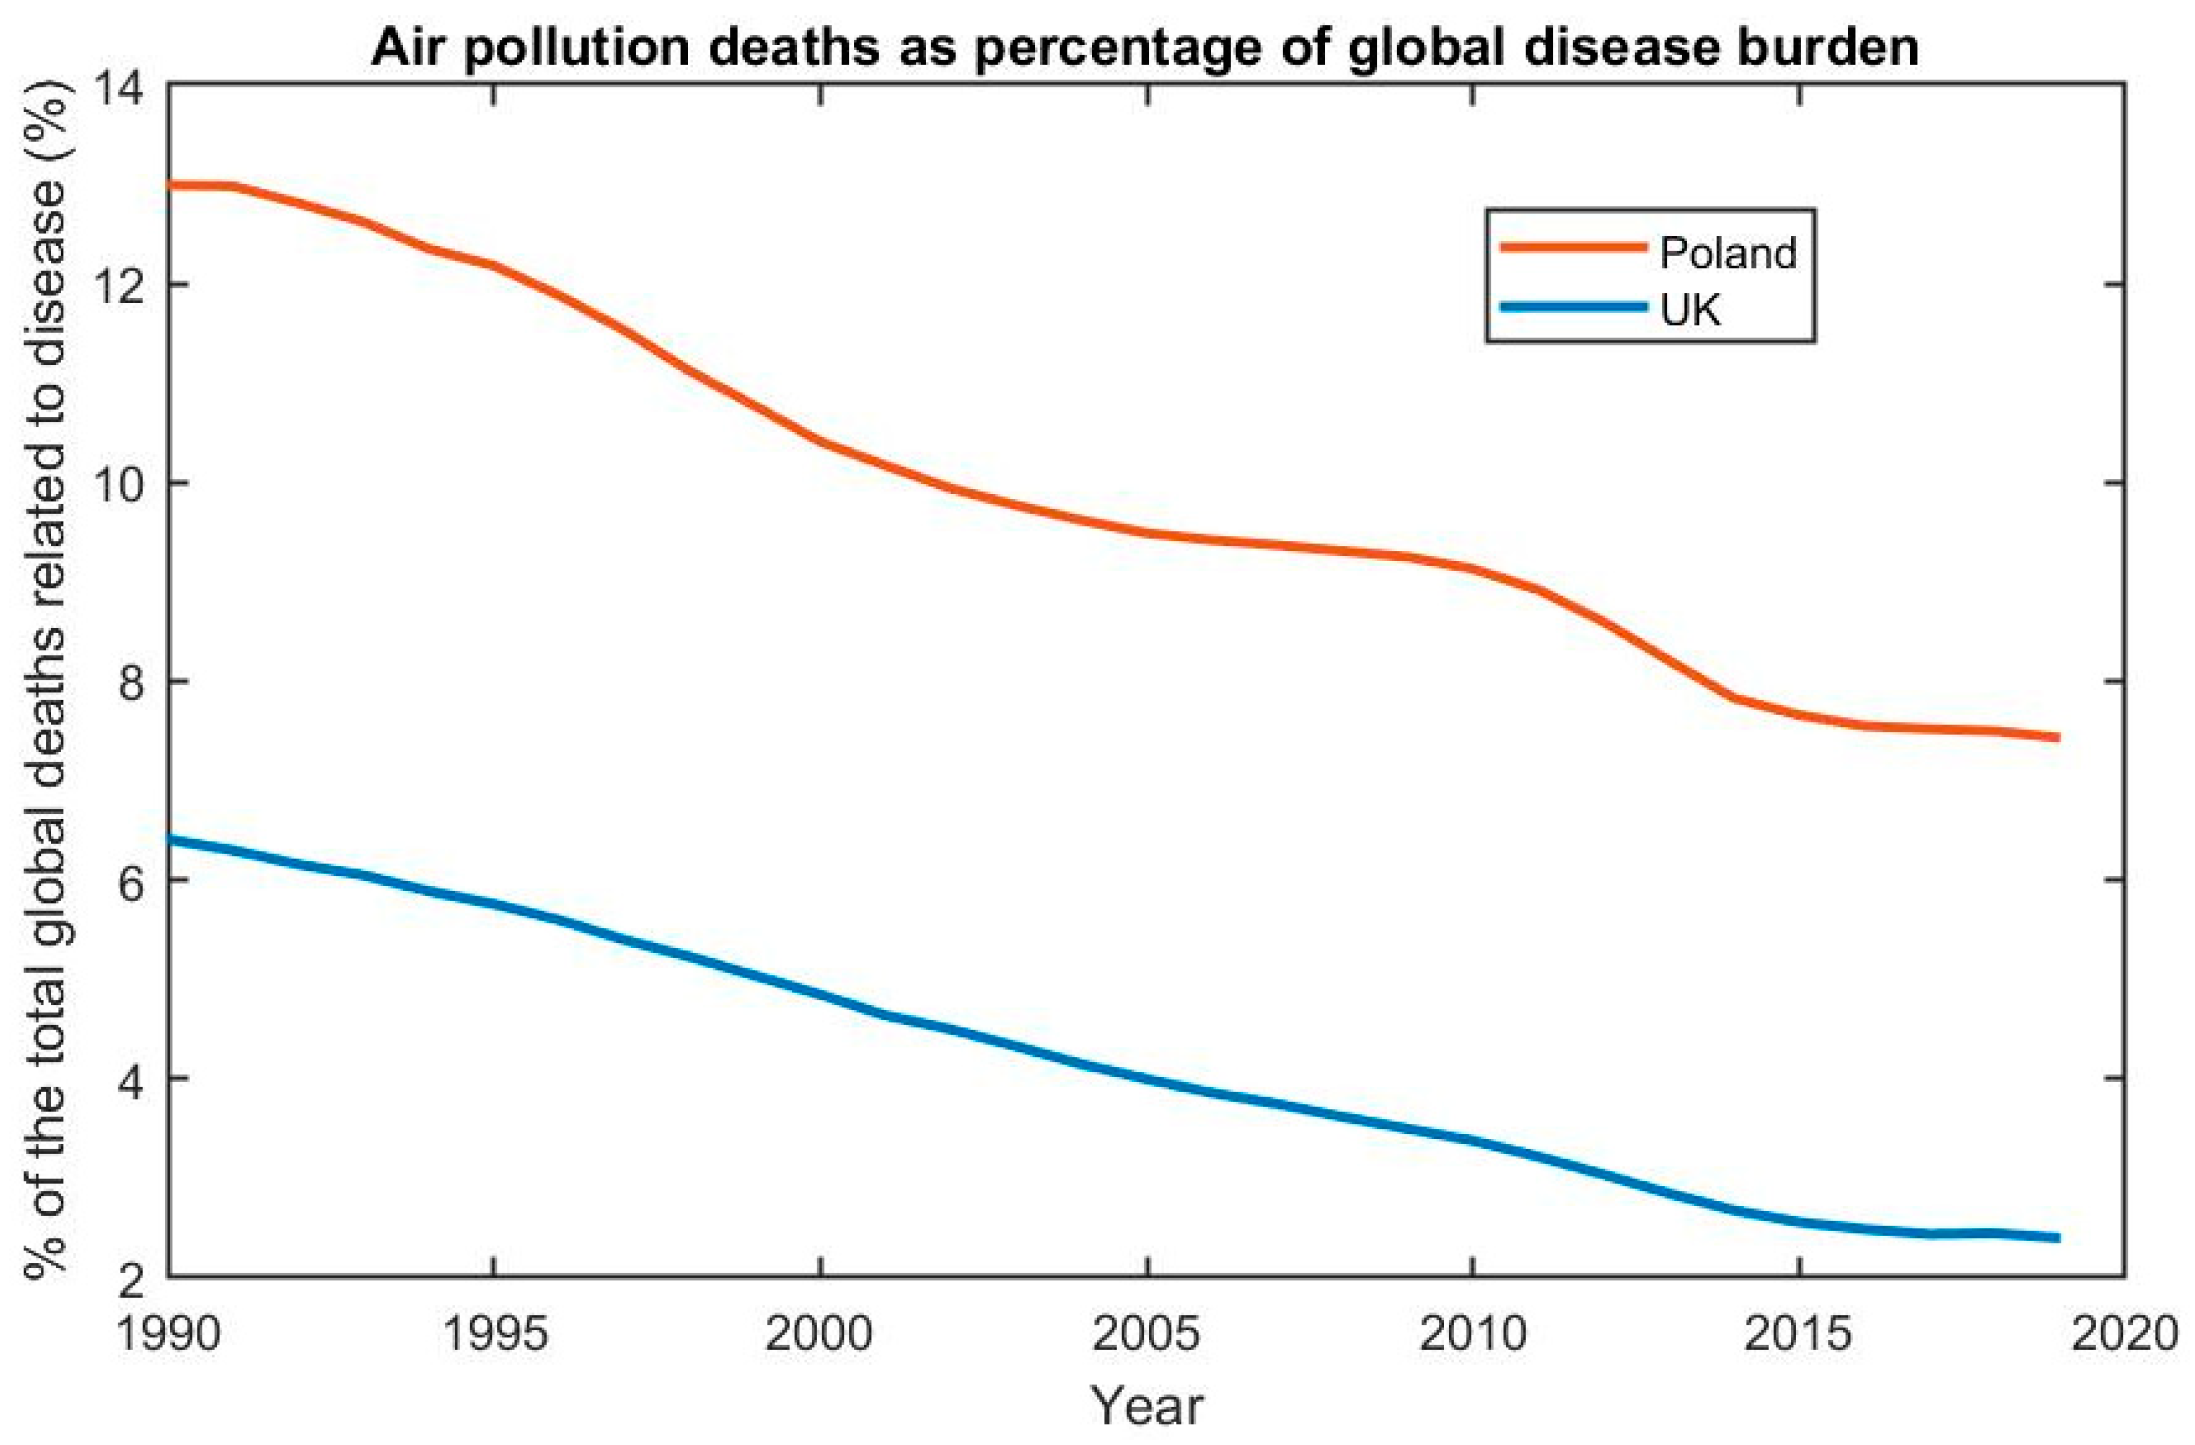
A Comparative Study of SOx, NOx, PM2.5 and PM10 in the UK and Poland from 1970 to 2020

by
Zofia Syrek-Gerstenkorn
1,2,
Berenika Syrek-Gerstenkorn
1 and
Shiladitya Paul
1,3,*
1
Materials Innovation Centre, School of Engineering, University of Leicester, Leicester LE1 7RH, UK
2
Faculty of Management, University of Gdańsk, 80-309 Gdańsk, Poland
3
Materials Performance and Integrity Group, TWI, Cambridge CB21 6AL, UK
*
Author to whom correspondence should be addressed.
Appl. Sci. 2024, 14(8), 3292; https://doi.org/10.3390/app14083292
Submission received: 3 January 2024 / Revised: 8 April 2024 / Accepted: 9 April 2024 / Published: 13 April 2024
(This article belongs to the Section Environmental Sciences)

Abstract

:
Presently, there is growing discourse surrounding climate change, global warming, and the possibility of urban smog. Daily, we encounter air pollutants unwittingly, often oblivious to the substantial adverse impacts they may impart on our health. This manuscript furnishes a thorough examination of the shifts in the concentrations of distinct air pollutants, namely, sulphur oxides (SOx), nitrogen oxides (NOx), and particulate matter PM2.5 and PM10, within the contexts of the United Kingdom (a country progressively transitioning to alternative energy sources) and Poland (a country in the EU with the second lowest climate policy evaluation in the climate change performance index or CCPI) from 1970 to 2020. This comparative study between the two countries clearly showed the importance of the transition to clean energy sources. The UK’s efforts towards cleaner energy sources have led to reduced emissions of sulphur oxides (SOx) and particulate matter. In contrast, Poland’s heavy dependence on energy primarily from coal over the years has resulted in elevated pollution levels, notably in the concentration of pollutants such as particulate matter. This study also revealed that changes in emissions predominantly stem from technological advancements and economic activities. Additionally, political regulations and the gradual phase-out of specific fuels or energy-rich substances and their substitution with alternative energy sources have also imparted considerable influence.

1. Introduction

We encounter various pollutants on a daily basis, many of which are invisible to the naked eye, but pose threats to human health and the environment. Even a slight alteration in their presence in the atmosphere can lead to grave repercussions. The issue of air pollution stands as a significant public health concern, exerting a profound impact on the well-being and survival of human communities worldwide [1]. Both outdoor and indoor air pollutants contribute significantly to respiratory and other illnesses, serving as a notable cause of morbidity and mortality [2,3,4,5,6]. According to data from the World Health Organization (WHO), nearly the entire global population (99%) inhales air surpassing WHO guideline limits, containing elevated levels of pollutants. This predicament is particularly pronounced in low- and middle-income countries, where the highest levels of exposure are observed [1]. Before the modern era, natural processes such as volcanic eruptions, forest fires, lightning, and the decomposition of organic substances were the only sources of pollution [7]. These processes produced carbon monoxide, nitrogen oxides (NOx), methane, ash, and volcanic gases, including carbon dioxide [7,8].
The proliferation of motorised transport and industrialisation has heightened the demand for energy derived from fossil fuels, such as oil, natural gas, and coal [9,10,11,12,13,14,15,16,17,18,19,20,21,22,23,24]. The combustion of these in air gives rise to the formation of oxides of carbon, sulphur, and nitrogen. The quality of the air we breathe is intricately connected to the Earth’s climate and global ecosystems [25,26,27]. Many factors driving air pollution, notably, the combustion of fossil fuels, are also significant contributors to greenhouse gas emissions [28]. Consequently, initiatives aimed at mitigating air pollution present a mutually beneficial strategy addressing both climate concerns and public health [29,30,31]. By reducing the burden of diseases linked to air pollution, such policies contribute to both the immediate and long-term efforts to alleviate the impacts of climate change [1]. Therefore, in recent years, environmental economists have been relentless in their efforts to gain a more comprehensive understanding of the relationship between industrial activities and pollution [32].
This paper focuses on the air pollution dynamics in the UK from 1970 and 2020, aiming to elucidate the factors driving these changes and establish correlations with industrial characteristics. Specifically focusing on sulphur dioxide, nitrogen dioxide, PM2.5, and PM10—key air pollutants—this paper delves into various factors influencing changes in pollutant concentrations. These factors include the intensity of industrial production, the utilisation of diverse energy sources, and the interplay between temperature and traffic intensity. In addition, regional and international regulations put in place by the authorities to prevent an increase in pollution are analysed. The analysis extends to a comparative study between the UK and Poland, the latter being a country grappling with significant air pollution in Europe, particularly due to its reliance on coal for energy. In contrast, the UK has been progressively transitioning to alternative energy sources. This shift is reflected in differing pollutant concentrations linked to the energy sources employed by these countries. Unlike many previous studies that often focused on individual pollutants or those overlooked in recent years, this article undertakes a comprehensive analysis considering recent data. Additionally, it draws comparisons with another European Union country, fostering discussions on the observed differences.

2. Characteristics and Impacts of Air Pollution

2.1. Main Pollutants

2.1.1. Sulphur Dioxide (SO2)

Sulphur dioxide (SO2) is an inorganic chemical compound from the group of sulphur oxides. It is a colourless gas with a pungent and suffocating odour, highly irritating to the respiratory tract, poisonous to humans, animals, and harmful to plants. When oxidised to sulphur trioxide (SO3) and combined with water, it forms sulphuric acid, which is the main cause of acid rain, which contributes to the acidification of water bodies and soils, causing a decrease in their fertility [2]. This precipitation, known as acid rain, results from the amalgamation of water droplets with absorbed gases from the air or atmosphere, including sulphur oxide, nitrogen oxide, carbon dioxide, hydrogen chloride, and other environmentally harmful substances. Such pollutants impede plant growth and contribute to plant mortality. However, the issue extends beyond rain alone, encompassing other atmospheric phenomena such as acid fog and acid snow.
Environmental contamination through acid precipitation poses a threat not only to the flora but also to the fauna inhabiting the affected areas, including humans, leading to various health problems. Exposure to these compounds can cause irritation of the upper respiratory tract, throat irritation, coughing, and may contribute to the development of inflammation and diseases such as bronchitis. Prolonged exposure to air pollution amplifies the risk of respiratory and cardiovascular diseases. Children, the elderly, and individuals with conditions such as asthma and those with cardiovascular issues are particularly susceptible to the adverse effects of sulphur dioxide.
The impact of acid precipitation is not confined to living organisms; it also extends to building infrastructures and various materials. The acceleration of corrosion in metal structures and building materials, including steel, copper, and zinc, is a notable consequence of acid rain, affecting the integrity of structures and materials over time.

2.1.2. Nitrogen Oxides

Oxides of nitrogen are present in the atmosphere at various oxidation levels. Nitrogen dioxide (NO2), however, is one of the most hazardous substances to human health and is mostly formed by the oxidation of nitric oxide (NO). Nitrogen dioxide is an inorganic compound from the nitrogen oxides group. It is a highly toxic gas, is non-flammable, with a strong odour and a brownish-red colour [2]. It is due to this gas that smog takes on an unsightly brown colour. This gas is the main cause of photochemical smog in cities with the highest car traffic. In addition, like sulphur dioxide, it contributes to the formation of acid rain, albeit due to the formation of nitrous and nitric acids, which acidifies the soil and produces harmful compounds that permeate into plants. Nitrogen oxides are among the more hazardous components contaminating the atmosphere. Their toxicity is many times greater than that of carbon monoxide or sulphur dioxide [2]. Like sulphur dioxide, nitrogen dioxide irritates the respiratory system, causing attacks of shortness of breath, irritation of the mucous membranes, and stabbing pains in the chest. Short-term exposure to concentrations of NO2 can also increase susceptibility to respiratory infections and allergens [3]. Exposure to particulates and nitrogen dioxide is linked to around 40,000 early deaths in the UK each year [4].

2.1.3. Particulate Matter (PM)

PM is a complex mixture of extremely small particles and liquid droplets consisting of acids, organic chemicals, metals, salts, and soil or dust particles that vary in size [5]. PM can include, for example, carbon compounds, sulphates, nitrates, and trace metals. PM is categorised by size; therefore, PM10 (less than or equal to 10 μm in diameter), PM2.5 (less than or equal to 2.5 μm in diameter), and PM0.1 (less than or equal to 0.1 μm in diameter) are the most common. In addition, researchers define particles with a diameter between 2.5 and 10 μm (PM2.5–10) as “coarse”, less than 2.5 μm as “fine”, and less than 0.1 μm as “ultrafine” particles [5]. Exposure to particulate matter (PM) poses significant health risks, particularly for individuals who are elderly or have respiratory issues. The small size of certain particles enables certain compounds to enter the human body, resulting in various adverse effects. The severity of the symptoms depends very much on the concentration of dust in the air and the length of exposure. Populations consistently exposed to particulate matter have significantly higher rates of cardiovascular incidents and mortality in the long term. Sufficient evidence has accumulated to support a causal relationship between exposure to traffic-related air pollution and the exacerbation of asthma. Further evidence has been found to be suggestive of a causal relationship with the onset of childhood asthma, non-asthma respiratory symptoms, impaired lung function, total and cardiovascular mortality, and cardiovascular morbidity [6].

2.2. The Main Sources of Sulphur Oxides, Nitrogen Oxides, and Particulate Matter

2.2.1. Sulphur Oxides

Although oxides of sulphur can enter the atmosphere through natural sources such as volcanic eruptions (which emit huge quantities of this substance), soil erosion, or fires, the air registers significantly more hazardous and elevated concentrations of sulphur oxides due to human activity. It can be seen from Figure 1 [7] that the predominant source of SO2 in the UK was the energy industry until 2018. In 2019 and 2020, however, the highest level of SO2 emission (28% and 32%, respectively) emanated from domestic combustion.
Sulphur is abundant in fossil fuels such as coal, natural gas, and oil, and in renewable sources such as biomass. Upon the combustion of these raw materials, the sulphur present reacts with oxygen (from air) to form sulphur oxides, predominantly in the form of SO2.

2.2.2. Nitrogen Oxides

Nitrogen oxides are mainly formed due to combustion processes, partly from nitrogen compounds in the fuel, but more significantly by the direct combination of atmospheric oxygen and nitrogen at flame temperatures. For everyday purposes, most of the nitrogen oxides we are exposed to are from road transport [7]. However, in addition to road transport, air transport, water transport, and other heavy machinery are also responsible for emissions of these compounds. After transport, the main cause of high concentrations of nitrogen oxides is the energy and manufacturing industries, and construction (Figure 2). NO2 accounts for only 5–10% of directly emitted nitrogen oxides, the remainder being NO. However, the cooling of flue gases and the supply of oxygen promotes the oxidation of NO to NO2. Nitrogen oxides, together with other compounds in the atmosphere, are involved in chemical transformations leading to particulate matter and ozone depletion.

2.2.3. Particulate Matter

Particulate matter (PM) can stem directly from either anthropogenic (human-made) or natural sources, known as primary PM. Alternatively, PM can be formed in the atmosphere through the transformation of gaseous combustion by-products such as volatile organic compounds (VOCs), ammonia (NH3), sulphur oxides (SOx), and nitrogen oxides (NOx), referred to as secondary PM. Human-induced origins of PM encompass combustion in mechanical and industrial processes, vehicle emissions, and tobacco smoke. On the other hand, natural sources include volcanic activity, fires, dust storms, and aerosolized sea salt [5].
One of the main sources of PM emissions is road transport. However, diesel vehicles emit a higher mass of particulate matter per vehicle-kilometre than petrol vehicles. Emissions are not only dependent on the type of car engine, but also stem from wear on brakes and tires [8]. Historically, domestic coal combustion has been a primary contributor to particulate emissions in the UK. Although coal is still utilized for domestic combustion in certain smaller towns or villages, its use has been regulated by the Clean Air Acts, leading to other sources becoming more significant at the national level [8]. Apart from road transport and combustion, industrial processes also contribute to particulate emissions through the production of materials such as metals, cement, chemicals, construction, and mining. The UK’s contribution to the annual average PM2.5 concentrations is estimated to be at least 50% and as high as 60%. A small proportion of the concentrations of PM that people in the UK are exposed to come from naturally occurring sources (about 15%). Another (21–30%) is transported to the UK from other European countries [9].

3. Overall Evolution of Emissions of SOx, NOx, and PM in the UK between 1970 and 2020

Like most highly developed countries, the UK has witnessed a reduction in air pollutant emissions in recent years (Figure 3). Before this, however, an increase was evident (Figure 4), particularly during the Industrial Revolution, a period marked by significant technological, economic, and social changes. At the beginning of the 20th century, the UK was the largest producer of coal in Europe. In 1913, UK coal production peaked at 292 million metric tons. By 1920, the coal industry employed some 1.2 million people, constituting roughly 1 in 20 of the UK’s workforce [10]. The use of coal-burning steam engines greatly increased the demand for coal. People at this time relied on coal to fuel industry, transport, and the economy [11]. In recent decades, however, increasingly stringent air pollution control policies, the implementation of new regulations, and advancements in fuels and pollution control technologies have collectively contributed to a general decrease in emissions in high-income countries.
SO2 emissions in the UK have been significantly reduced in recent decades as a result of sulphur restrictions on fuels and the closure of coal-fired power stations. Reductions in the emissions from the power generation sectors have been the strongest driver of the long-term trend of emission reductions, along with the move away from high-sulphur fuels (i.e., coal) to low-sulphur fuels (including a shift to low-sulphur natural gas) and the installation of flue gas desulphurisation at the remaining coal-fired power stations in the power sector. The decline in SO2 emissions in recent years has been due to the closure or conversion to biomass fuel of many coal-fired power plants, which has significantly reduced the overall coal combustion capacity [12].
The emissions of nitrogen oxides increased between 1984 and 1989 due to an increase in road traffic. After one year, the downward trend in these oxides was caused by the introduction of stricter regulations and catalytic converters in newer vehicles. The overall decrease in nitrogen oxides since 1970 has been caused by reduced coal consumption in power plants and the modernisation of road transport. The emissions from power stations and industrial combustion plants have decreased significantly, reflecting the long-term trend away from coal and oil towards natural gas and renewable energy sources [13].

4. Changes in Air Pollution in the UK Since the 1970s

4.1. Emissions of Sulphur Oxides over the Years

It can be seen from Figure 5 that the emissions of sulphur oxides have exhibited a steady decline since the 1970s, except for minor peaks in 1973 and 1979, attributed to harsh winters in those years [14], and a brief period in the late 1980s when emissions were relatively constant. This stability can be linked to heightened coal and energy usage for home heating during colder winter temperatures. Notably, this resulted in a sudden increase in sulphur dioxide (SO2) emissions, accompanied by elevated levels of nitrogen oxides (NOx) and particulate matter (PM2.5 and PM10). Furthermore, there is observable evidence indicating a slight reduction in total SO2 emissions between 1997 and 1998. This reduction is attributable to the fact that the substantial decreases in emissions from the power generation sector were not as pronounced during the transition from 1997 to 1998 [8].
Sulphur dioxide emissions have experienced a remarkable 98% decrease since 1970, reaching 136,000 tonnes in 2020 (see Figure 6). The year 2020 saw a 13% reduction in emissions compared to 2019, marking the lowest level in the entire time series. This decline was attributed to a decrease in coal utilization in power stations, aligning with the ongoing trend of diminishing emissions from this particular source [15]. In addition, the implementation of more stringent limits on the sulphur content of liquid fuels contributed to the long-term reduction in emissions [12].
The primary contributors to sulphur oxide emissions are solid fuels and petroleum products. Notably, the decline in emissions from petroleum use can be attributed to the reduced consumption of fuel oil and the lowering of sulphur content in diesel. An essential focus is on decreasing the sulphur content of gas oil, especially in sectors like domestic heating, commercial heating, and off-highway sources where gas oil is extensively employed. Power plants stand out as one of the largest sources of SO2 emissions [16]. It is worth noting that, in 1984, during a miners’ strike, there was a substantial decrease in coal-based electricity production. Consequently, this led to a decline not only in SO2 emissions (Figure 6) but also in particulate matter, as depicted in Figure 5 for PM2.5 and PM10.
Although historically UK has been reliant on coal, there has been a notable shift towards alternative fuels and power plants that produce fewer harmful substances over the past 50 years. Between 1970 and 1990, this shift resulted from a gradual increase in the utilization of nuclear power plants and improvements in efficiency. Subsequent to 1990, the decline accelerated due to a higher proportion of electricity generated in nuclear plants, alongside the adoption of Combined Cycle Gas Turbine (CCGT) stations and other gas-fired plants. CCGT plants, renowned for their efficiency, emit negligible amounts of SO2 compared to conventional coal- and oil-fired plants [17].
It is essential to highlight that industrial SO2 emissions stem from the combustion of coal and oil, certain refinery processes, and other chemical activities. The decline observed between 1970 and 1985 correlates with reductions in energy-intensive industries such as iron and steel, alongside a shift from coal and oil to natural gas. Despite the increase in road vehicles between 1970 and the early 1990s, emissions from road transport decreased as the sulphur content in diesel road vehicles declined.
In the course of economic and industrial development, new emission standards were introduced, prompting the improvement or closure of outdated plants and incinerators. Recent years have seen a significant decline in SO2 emissions, with UK emissions dropping by 70% between 2012 and 2020. This decline is attributed to the closure or conversion to biomass fuel of numerous coal-fired power stations, resulting in a substantial reduction in the overall coal burning capacity [12].

4.2. Emissions of Nitrogen Oxides over the Years

In the UK, there has been a noticeable reduction in emissions of air pollutants, such as SOx, NOx, and PM over the years. Emissions of nitrogen oxides have fallen by 76% since 1970, to 702 thousand tonnes in 2020 (Figure 7) [13]. From 1990 to 1984, emissions of nitrogen oxides were relatively consistent with small peaks in 1973 and 1979, which were due to cold winters in those years. From 1984 onwards, emissions started to rise due to increased traffic. Nevertheless, since 1989, the overall emissions have decreased, driven by reductions in power station emissions and a decline in road transport emissions [8]. Road-related emissions showed a steady increase from 1970 to 1989, mirroring the overall rise in road traffic across the UK (Figure 7).
Since 1989, there has been a steady decline in emissions due to the introduction of catalytic converters in passenger cars and stricter regulations on truck emissions (Figure 7). Starting in 1988, electricity generators initiated a gradual retrofitting program for their 500 MWe (megawatt electric) coal-fired units, incorporating low-NOx burners. The subsequent acceleration in emission reduction, particularly since 1992, can be attributed to the widespread adoption of cars equipped with three-way catalytic converters [18]. In 1993 and 1994, the enforcement of emission limits on diesel cars and light goods vehicles further contributed to this decline. Recent advancements include the increased utilization of nuclear power and the implementation of Combined Cycle Gas Turbine (CCGT) power plants, which burn natural gas and have led to additional reductions in NOx emissions [19]. The ongoing shift from coal to gas and electricity usage has also played a role in lowering NOx emissions (Figure 6). There is currently only one coal-fired power station in the UK, Uniper’s Ratcliffe-on-Soar plant in Nottinghamshire, which is expected to close in 2024 [20].
Nowadays, emissions originating from power stations and industrial combustion plants have experienced a substantial reduction. This decline is indicative of the sustained shift away from coal and oil towards natural gas and renewable energy sources. Specifically, annual nitrogen oxide emissions from the energy industry have witnessed a notable decrease of 71% between 2005 and 2020. This decline can be attributed to the closure or conversion to biomass fuel of coal-fired power plants [13].
It would appear that the combination of technological advances and regulations allowed for the reduction in emissions over the years. Some of the regulations are shown in the schematic below (Figure 8):

5. Comparison between Air Pollution in the UK and Poland

Figure 9 shows a comparison of the evolution of various air pollutants between 1990 and 2020. It is evident that, during this period, the level of air pollution decreased in both countries, albeit at different rates. Additionally, noteworthy observations include the significantly higher levels of PM2.5 and PM10 in Poland compared to the UK, while the level of NOx was higher in the UK. Up until 1996, the level of SO2 was higher in the UK, but between 1996 and 2020, the level of SOx in Poland surpassed that of the UK.
The higher levels of SO2, PM10, and PM2.5 observed in Poland can be attributed to the heavy reliance on coal for energy, as opposed to the UK’s gradual transition to alternative energy sources. This distinction is clearly shown in Figure 10, depicting the changing share of energy consumption in both countries from 1960 to 2020. The data reveal that the combustion of coal and oil has been the primary source of energy in Poland, leading to elevated levels of SO2 and PM emissions. Conversely, the UK has been actively reducing coal usage and increasing reliance on natural gas, known for emitting extremely low levels of SO2 and negligible amounts of PM.
It should be noted that natural events, such as volcano eruptions or natural dust blown, for example, from deserts, can also influence the level of air pollution. In 2010, the eruption of Eyjafjallajökull volcano took place in Iceland. During the eruption, high levels of gases, such as SO2 and CO2, were released into the atmosphere together with volcanic ashes. It can be noted from Figure 9 that the volcanic event in 2010 did not have a huge influence on the SOx level neither in the UK or Poland. However, it can be noted that the level of PM10 and PM2.5 was elevated in 2010 in both countries.
The higher level of NOx in the UK can be attributed to the higher level of traffic in the country. Figure 11 shows the number of new cars registered in the UK and Poland between 2003 and 2021. More cars were registered in the UK, which indicates a higher likely level of traffic. Since the main source of NOx emission is hydrocarbon-based transportation (Figure 2), the higher concentration of NOx in the UK is not surprising.
The overall air pollution levels in Poland remain significantly higher than those in the UK, with unfortunate consequences reflected in the number of air pollution-related deaths. Figure 12 illustrates air pollution-related deaths as a percentage of global disease deaths from 1990 to 2019, indicating consistently higher levels of air pollution-related mortality in Poland compared to the UK during this period [21,22]. In 2019, only 2.4% of disease deaths were attributed to air pollution in the UK, whereas in Poland, this figure was notably higher, at 7.4%.
Curiosity may arise about how the air quality situation in Poland and the UK compares to that in other European countries. Figure 13 depicts the level of PM2.5 pollution across various European nations. Notably, in 2021, Poland ranked as the seventh most polluted country in Europe, surpassing WHO guidelines for PM2.5 (5 µg/m3) by 3 to 5 times [23]. In contrast, the UK’s PM2.5 levels exceeded the guidelines only by 1 to 2 times during the same period [24].
It should be mentioned that the new Ambient Air Quality Directive (AAQD) will aim to reduce air pollution in the EU to zero air pollution by 2050. To achieve this, stringent guidelines will be imposed, such as that of the annual limit of PM2.5.
There are significant changes afoot in the EU when it comes to air quality. A new Air Quality Directive prepared by the European Union suggests several changes [37]. The updated regulations introduce stricter EU air quality standards for 2030, with both limit and target values aligning more closely with those of the WHO guidelines. This revised directive encompasses various air-polluting substances, such as fine particles (PM2.5 and PM10), nitrogen dioxide (NO2), sulphur dioxide (SO2), benzene, arsenic, lead, nickel, and others. Notably, the annual limit values for PM2.5 and NO2, identified as having significant impacts on human health, would decrease from 25 µg/m3 to 10 µg/m3 and from 40 µg/m3 to 20 µg/m3, respectively (in comparison to the WHO guideline values of 5 µg/m3 for PM2.5 and 10 µg/m3 for NO2).
The directive aims to strike a delicate balance by upholding the primary goal of enhancing air quality standards within the EU and aligning with the overarching aim of achieving zero pollution by 2050. Simultaneously, it introduces a degree of flexibility for member states in implementing the directive. However, the ultimate impact of this decision on the lives of individuals and pollution levels across Europe will only become evident with the passage of time.

6. Summary

An analysis spanning five decades, from 1970 to 2020, scrutinises the trajectory of air pollutants in the United Kingdom and Poland, highlighting the adverse effects of air pollution and the influencing factors behind these changes. It is imperative to underscore that air pollution constitutes a formidable global health challenge, contributing significantly to respiratory and other diseases and exerting a substantial impact on public health. While natural sources such as volcanic eruptions and forest fires have historically contributed to pollution, the advent of industrialisation and motorisation, powered by fossil fuels, has resulted in the emission of harmful pollutants like carbon monoxide, and sulphur and nitrogen oxides. The intricate relationship between air quality, climate, and ecosystem health underscores the dual benefits of addressing air pollution, as actions taken for mitigation contribute to both health and climate amelioration.
This comparative study between the UK and Poland reveals stark differences in their energy consumption profiles. The UK’s gradual shift away from coal towards cleaner energy sources has led to diminished emissions of sulphur oxides (SOx) and particulate matter. In contrast, Poland’s heavy reliance on coal for energy generation has resulted in elevated pollution levels, notably in the concentration of pollutants such as particulate matter (PM), for which Poland consistently exhibits higher levels than the UK.
A thorough examination of the role of regulations and policies in reducing pollution levels highlights the pivotal contribution of stringent regulations, technological advancements, and economic progress. The evidence indicates that transitioning to cleaner energy sources, including the closure of coal-fired power plants, adopting cleaner fuels, and implementing rigorous regulations to combat air pollution, is instrumental in safeguarding public health and the environment.

Author Contributions

Conceptualization, S.P.; Methodology, Z.S.-G. and B.S.-G.; Validation, B.S.-G.; Formal analysis, Z.S.-G. and B.S.-G.; Investigation, Z.S.-G.; Resources, B.S.-G. and S.P.; Data curation, Z.S.-G. and B.S.-G.; Writing—original draft, Z.S.-G.; Writing—review & editing, B.S.-G. and S.P.; Visualization, B.S.-G.; Supervision, B.S.-G. and S.P.; Project administration, S.P. All authors have read and agreed to the published version of the manuscript.

Funding

This research received no external funding.

Institutional Review Board Statement

Not applicable.

Informed Consent Statement

Not applicable.

Data Availability Statement

The raw data supporting the conclusions of this article will be made available by the authors on request. These data were derived from the following resources available in the public domain: Annual emissions of SO2 in the UK. https://assets.publishing.service.gov.uk/media/65c5f51ccc433b000ca90b0f/sulphur_dioxide_key_emission_sources_2022.csv/ (accessed on 1 October 2023). Annual emission of nitrogen oxides in the UK. https://assets.publishing.service.gov.uk/media/65c5f3be9c5b7f0012951bac/nitrogen_oxides_annual_emissions_2022.csv/preview (accessed on 1 October 2023). Emissions of air pollutants in the UK- Particulate matter (PM10 and PM205). https://www.gov.uk/government/statistics/emissions-of-air-pollutants/emissions-of-air-pollutants-in-the-uk-particulate-matter-pm10-and-pm25 (accessed on 1 October 2023). European Air Quality Index. European Environmental Agency. https://airindex.eea.europa.eu/AQI/index.html (accessed on 29 March 2024). Air pollution in London. https://ourworldindata.org (accessed on 1 October 2023). Poland—air pollution country fact sheet. European Environmental Agency. https://www.eea.europa.eu/themes/air/country-fact-sheets/2023-country-fact-sheets/poland-air-pollution-country (accessed on 29 March 2024). UK Coal Production 1913–2022. https://www.statista.com/statistics/1125925/historic-coal-production-in-the-united-kingdom/ (accessed on 1 October 2023) World’s most polluted countries and regions. https://www.iqair.com/world-most-polluted-countries (accessed on 29 March 2024).

Conflicts of Interest

Author Shiladitya Paul was employed by the company TWI Ltd. The remaining authors declare that the research was conducted in the absence of any commercial or financial relationships that could be construed as a potential conflict of interest.

References

  1. Air Pollution. Available online: https://www.who.int/health-topics/air-pollution (accessed on 31 August 2023).
  2. Zawadzka, M.; Szafrańska, A.; Łukawska, U.; Krzemińska, M.; Wachowiec, A.; Olczyk, B.; Rozmaryn, D.; Pawłowski, A.; Śledź, M. Stan Środowiska W Województwie Łódzkim Raport 2020; Główny Inspektorat Ochrony Środowiska: Łódź, Poland, 2020.
  3. Nitrogen Dioxide (NO2). Available online: https://www.gov.uk/government/statistics/air-quality-statistics/ntrogen-dioxide (accessed on 31 August 2023).
  4. Holgate, S.; Grigg, J.; Agius, R.; Ashton, J.R.; Cullinan, P.; Exley, K.; Fishwick, D.; Fuller, G.; Gokani, N.; Griffiths, C.; et al. Every Breath We Take: The Lifelong Impact of Air Pollution; Royal College of Physicians: London, UK, 2016; ISBN 978-1-86016-568-9. [Google Scholar]
  5. Anderson, J.O.; Thundiyil, J.G.; Stolbach, A. Clearing the Air: A Review of the Effects of Particulate Matter Air Pollution on Human Health. J. Med. Toxicol. 2012, 8, 166–175. [Google Scholar] [CrossRef]
  6. Harrison, R.M.; Hester, R.E.; Querol, X.; Vilardell, M.G.; Donahue, N.; Chow, J.; Hopke, P.; Roekens, E.; Zheng, M.; Khare, M.; et al. Airborne Particulate Matter: Sources, Atmospheric Processes and Health; Springer: Singapore, 2016; pp. P001–P004. [Google Scholar]
  7. Emissions of Air Pollutants—GOV.UK. Available online: https://www.gov.uk/government/statistical-data-sets/env01-emissions-of-air-pollutants (accessed on 1 October 2023).
  8. Dore, C.J.; Goodwin, J.W.L.; Watterson, J.D.; Murrells, T.P.; Passant, N.R.; Hobson, M.M.; Haigh, K.E.; Baggott, S.L.; Pye, S.T.; Coleman, P.J.; et al. UK Emissions of Air Pollutants 1970 to 2001; Department for Environment, Food and Rural Affairs: London, UK, 2003.
  9. Mitigation of United Kingdom PM2.5 Concentrations. Air Quality Expert Group to the Department for Environment, Food and Rural Affairs; Scottish Government; Welsh Government; and Department of the Environment in Northern Ireland. Available online: https://uk-air.defra.gov.uk/assets/documents/reports/cat11/1508060903_DEF-PB14161_Mitigation_of_UK_PM2.5.pdf (accessed on 1 October 2023).
  10. UK Coal Production 1913–2022. Available online: https://www.statista.com/statistics/1125925/historic-coal-production-in-the-united-kingdom/ (accessed on 1 October 2023).
  11. Thorsheim, P. Inventing Pollution: Coal, Smoke, and Culture in Britain since 1800; Ohio University Press: Athens, OH, USA, 2006; pp. 1–9. [Google Scholar]
  12. Emissions of Air Pollutants in the UK—Sulphur Dioxide (SO2). Available online: https://www.gov.uk/government/statistics/emissions-of-air-pollutants/emissions-of-air-pollutants-in-the-uk-sulphur-dioxide-so2 (accessed on 31 August 2023).
  13. Emissions of Air Pollutants in the UK—Nitrogen Oxides (NOx). Available online: https://www.gov.uk/government/statistics/emissions-of-air-pollutants/emissions-of-air-pollutants-in-the-uk-nitrogen-oxides-nox (accessed on 1 October 2023).
  14. Lopez, T.M. The Winter of Discontent: Myth, Memory, and History; Liverpool University Press: Liverpool, UK, 2014; Available online: https://www.jstor.org/stable/j.ctt1gn6f3z (accessed on 31 October 2023).
  15. Mollo, M.; Kolesnikov, A.; Makgato, S. Simultaneous reduction of NOx emission and SOx emission aided by improved efficiency of a Once-Through Benson Type Coal Boiler. Energy 2022, 248, 123551. [Google Scholar] [CrossRef]
  16. Asghar, U.; Rafiq, S.; Anwar, A.; Iqbal, T.; Ahmed, A.; Jamil, F.; Khurram, M.F.; Akbar, M.M.; Farooq, A.; Shah, N.S.; et al. Review on the progress in emission control technologies for the abatement of CO2, SOx and NOx from fuel combustion. J. Environ. Chem. Eng. 2021, 9, 106064. [Google Scholar] [CrossRef]
  17. Rao, A.D. Combined Cycle Systems for Near-Zero Emission Power Generation; Woodhead Publishing: Sawston, UK, 2012; ISBN 978-0-85709-013-3. [Google Scholar]
  18. Kritsanaviparkporn, E.; Baena-Moreno, F.M.; Reina, T.R. Catalytic Converters for Vehicle Exhaust: Fundamental Aspects and Technology Overview for Newcomers to the Field. Chemistry 2021, 3, 630–646. [Google Scholar] [CrossRef]
  19. Dirik, M. Prediction of NOx emissions from gas turbines of a combined cycle power plant using an ANFIS model optimized by GA. Fuel 2022, 321, 124037. [Google Scholar] [CrossRef]
  20. Primore, O. New Plans for Future of Nottinghamshire’s Last Coal-Fired Power Station. NottinghanshireLive. Available online: https://www.nottinghampost.com/news/local-news/new-plans-future-nottinghamshires-last-8770694 (accessed on 3 January 2024).
  21. Cakaj, A.; Lisiak-Zielińska, M.; Khaniabadi, Y.O.; Sicard, P. Premature deaths related to urban air pollution in Poland. Atmos. Environ. 2023, 301, 119723. [Google Scholar] [CrossRef]
  22. Khomenko, S.; Cirach, M.; Pereira-Barboza, E.; Mueller, N.; Barrera-Gómez, J.; Rojas-Rueda, D.; de Hoogh, K.; Hoek, G.; Nieuwenhuijsen, M. Premature mortality due to air pollution in European cities: A health impact assessment. Lancet Planet. Health 2021, 5, E121–E134. [Google Scholar] [CrossRef] [PubMed]
  23. Pérez Velasco, R.; Jarosińska, D. Update of the WHO global air quality guidelines: Systematic reviews—An introduction. Environ. Int. 2022, 170, 107556. [Google Scholar] [CrossRef] [PubMed]
  24. National Statistics. Air Quality Statistics in the UK, 1987 to 2022—Particulate Matter (PM10/PM2.5). 27 April 2023. Available online: https://www.gov.uk/government/statistics/air-quality-statistics/concentrations-of-particulate-matter-pm10-and-pm25#trends-in-concentrations-of-pm25-in-the-uk-2009-to-2022 (accessed on 3 January 2024).
  25. Kopel, J.; Brower, G.L. Impact of fossil fuelemissions and particulate matter on pulmonary health. Proc. Bayl. Univ. Med. Cent. 2019, 32, 636–638. [Google Scholar] [CrossRef] [PubMed]
  26. Munawer, M.E. Human health and environmental impacts of coal combustion and post-combustion wastes. J. Sustain. Min. 2018, 17, 87–96. [Google Scholar] [CrossRef]
  27. Manisalidis, I.; Stavropoulou, E.; Stavropoulos, A.; Bezirtzoglou, E. Environmental and Health Impacts of Air Pollution: A Review. Front. Public Health 2020, 8, 14. [Google Scholar] [CrossRef] [PubMed]
  28. Kirkinen, J.; Palosuo, T.; Holmgren, K.; Savolainen, I. Greenhouse Impact Due to the Use of Combustible Fuels: Life Cycle Viewpoint and Relative Radiative Forcing Commitment. Environ. Manag. 2008, 42, 458–469. [Google Scholar] [CrossRef]
  29. Sofia, D.; Gioiella, F.; Lotrecchiano, N. Mitigation strategies for reducing air pollution. Environ. Sci. Pollut. Res. 2020, 27, 19226–19235. [Google Scholar] [CrossRef] [PubMed]
  30. Quarmby, S.; Santos, G.; Mathias, M. Air Quality Strategies and Technologies: A Rapid Review of the International Evidence. Sustainability 2019, 11, 2757. [Google Scholar] [CrossRef]
  31. Khan, A.A.; Kumar, P.; Gulia, S.; Khare, M. A critical review of managing air pollution through airshed approach. Sustain. Horiz. 2024, 9, 100090. [Google Scholar] [CrossRef]
  32. Setioningtyas, W.P.; Illes, C.B.; Dunay, A.; Hadi, A.; Wibowo, T.S. Environmental Economics and the SDGs: A Review of Their Relationships and Barriers. Sustainability 2022, 14, 7513. [Google Scholar] [CrossRef]
  33. EC Directive 70/220/EEC, 72/306/EEC, 80/779/EEC. On the Approximation of the Laws of the Member States Relating to Measures to Be Taken against Air Pollution by Gases from Positive-Ignition Engines of Motor Vehicles. Council of the European Union. Official Journal of the European Communities, L76/1, 6.4.70. Available online: https://eur-lex.europa.eu/eli/dir/1970/220/oj (accessed on 29 March 2024).
  34. CLRTAP Sulphur Protocol. Protocol for Further Reduction of Sulphur Emissions. 05 August 1998. Available online: https://unece.org/environment-policy/air/protocol-further-reduction-sulphur-emissions (accessed on 29 March 2024).
  35. The Air Quality Standards Regulation. UK Statutory Instruments, 2010, Number 1001. 11 June 2010. Available online: https://legislation.gov.uk/uksi/2010/1001/regulation/1/made (accessed on 29 March 2024).
  36. The Environment Act. UK Public General Acts. 2021. Available online: https://legislation.gov.uk/ukpga/2021/30/contents/anacted (accessed on 29 March 2024).
  37. Proposal for a Directive of the European Parliament and of the Council on Ambient Air Quality and Cleaner Air for Europe (Recast). Available online: https://data.consilium.europa.eu/doc/document/ST-15236-2023-INIT/en/pdf (accessed on 29 March 2024).
Figure 1. Annual emissions of SO2 in the UK.
Applsci 14 03292 g001
Figure 2. Annual emissions of NOx in the UK.
Applsci 14 03292 g002
Figure 3. The evolution of air pollution in the UK between 1970 and 2020. Data taken from https://www.gov.uk (accessed on 1 October 2023).
Applsci 14 03292 g003
Figure 4. Air pollution in London. Data reproduced from https://ourworldindata.org (accessed on 1 October 2023).
Applsci 14 03292 g004
Figure 5. Correlation between the mean air temperature and pollution level.
Applsci 14 03292 g005
Figure 6. Correlation between the electricity production and SO2 emission.
Applsci 14 03292 g006
Figure 7. NOx pollution levels over the years.
Applsci 14 03292 g007
Figure 8. Schematic showing evolution of regulations over the years. Further information on the Directives and Protocols can be found in the references [33,34,35,36].
Applsci 14 03292 g008
Figure 9. Comparison of the level of emissions of NOx (a), PM2.5 (b), SOx (c), and PM10 (d) in the UK and Poland.
Applsci 14 03292 g009
Figure 10. Comparison of share of energy consumption (by source) in Poland and the UK.
Applsci 14 03292 g010
Figure 11. Comparison of the number of new passenger car registrations in Poland and the UK.
Applsci 14 03292 g011
Figure 12. Air pollution-related deaths as percentage of global disease deaths.
Applsci 14 03292 g012
Figure 13. European countries with the highest concentration of PM2.5. Graph reproduced based on IQAir report.
Applsci 14 03292 g013
Disclaimer/Publisher’s Note: The statements, opinions and data contained in all publications are solely those of the individual author(s) and contributor(s) and not of MDPI and/or the editor(s). MDPI and/or the editor(s) disclaim responsibility for any injury to people or property resulting from any ideas, methods, instructions or products referred to in the content.

