Article

Selected Physical and Mechanical Properties of Subfossil Oak (Quercus spp.) Compared to Aged Oak and Recent Oak

by
Ruxandra Nedelcu
*,
Maria Cristina Timar
*,
Mihaela Porojan
and
Emanuela Carmen Beldean
Faculty of Furniture Design and Wood Engineering (FDMIL), Transilvania University of Brașov, 500036 Brașov, Romania
*
Authors to whom correspondence should be addressed.
Appl. Sci. 2024, 14(8), 3294; https://doi.org/10.3390/app14083294
Submission received: 6 March 2024 / Revised: 28 March 2024 / Accepted: 9 April 2024 / Published: 13 April 2024

Abstract

:
Subfossil oak (SO) wood material, originating from three different buried trunks discovered in recent years by excavations in riverbanks on Romanian territory, was analysed in this research. Aged oak recovered from constructions (AO_C) and recent/new oak wood material (NO) were also investigated to provide comparative data for the SO. The oven-dry density and the basic density, the total volumetric and linear swelling and shrinkage coefficients and the compression strength parallel to the grain were the selected physical and mechanical properties considered. The experimental results showed a lower density of SO compared to NO and AO_C tested by up to about 19–20%, alongside a trend of increased dimensional instability, with variability among the tested assortments. The compression strength parallel to the grain was reduced by 19–31% compared to NO. The properties of AO-C were closer to those of NO, but differences between wood materials from different sources and of different ages were registered. A positive linear correlation was found between compression strength parallel to grain and the basic density for all types of material and assortments tested. These comparative results have to be considered by designers and engineers in the valorisation of SO in furniture design and other applications.

1. Introduction

Subfossil wood is a material that has come under the attention of researchers more seriously in the last decade due to both scientific reasons and its economic potential as an unconventional natural resource. Subfossil wood is an unfossilized wood which has been deposited in anaerobic conditions in rivers, swamps, or moraine sediments for hundreds to thousands of years [1,2,3,4]. Subfossil wood is also known as bog wood and abonos wood [5]. The sub-fossilisation process in burial conditions is accompanied by microstructural and chemical changes. Studies in the field revealed an apparent increase in lignin content due to the prevalent degradation of polysaccharides, especially hydrolysis of hemicelluloses. A decrease or even a slight increase in cellulose, alongside a decrease in its crystallinity index, were reported by different authors, depending on the subfossil wood analysed, conditions of burial and age, though this was found to be not a statistically significant factor. Sub-fossilisation also results in a significant increase in ash content due to the minerals penetration into the wood structure during the long-term anoxic ageing process in specific burial conditions [1,2,3,4,5,6].
Due to its natural durability related to the high content of tannins, oak (Quercus spp.) is one of the most common wood species that has been preserved in such conditions, rendering it a grey-to-black colour as a result of the formation of iron–tannin complexes, and a very beautiful appearance that could be valorised in design projects [5,6].
Aged wood is considered the wood exposed to aerobic conditions for long periods of time, prevalent in wooden buildings or wooden objects [1,7]. The conditions for wood storage have a significant effect on the ageing process, generally defined as a slow, gradual and irreversible alteration of the chemical and physical structure of the material under the action of environmental factors. When wood has been stored indoors, in dry air, where no significant variation in temperature, UV radiation or water contact were present, the ageing effect on the structure and wood properties is minimal if no biodegradation was present. Contrarily, if the wood has been exposed outdoors, complex chemical degradation by UV radiation, thermal degradation, erosion and biological deterioration may occur [7]. Different chemical processes are responsible for the ageing of external surfaces and sub-surfaces, with an important contribution of light, especially UV radiation causing lignin degradation, compared to inner bulk wood in the absence of light, where hemicelluloses are the most affected [8]. Nevertheless, chemical and properties changes are not limited to the surface of wood (e.g., colour, roughness), but mechanical properties can also be affected by ageing in oxic conditions under variable conditions of temperature and relative humidity. Interest in recovering and valorisation of aged wood from constructions in innovative furniture design has grown in recent years, so acknowledging the changes in properties compared to recent wood is important.
Discovering subfossil buried wood during excavation work in riverbeds or riverbanks, or archaeological work in various sites, has raised scientific interest, leading to intensified research in this field [9]. Subfossil wood might be also found as archaeological wood, raising the scientific interest of both restorers in the field of Cultural Heritage and wood scientists in direct relation to its historical significance, specific properties and conservation challenges [6,9,10,11,12].
Regarding the study of subfossil wood worldwide, a rather limited number of papers were published before 2000. Some of them focused on defining and understanding the phenomena of ageing and fossilization of wood or material dating by dendrochronology [1], while others referred to the physical and mechanical properties of the material [13,14]. The interest in subfossil wood has continuously grown in conjunction with the progress of investigation methods and equipment. The vast majority of studies after 2000 focused on the dating of subfossil wood by dendrochronology and other methods [15,16] or dating in conjunction with material characterisation [17,18,19].
The most investigated species of subfossil wood were as follows: oak, elm, ash, pine, fir, etc. Oak (Quercus spp.) seems to be the prevalent subfossil wood discovered and studied in Europe, especially in East and Central Europe [2,4,9,10,11,17,18,20,21,22,23]. A particular interest in subfossil oak has been evident in research carried out in the Czech Republic [2,3,4,17,18,24], Poland [9,15], Serbia [21], Bosnia Herzegovina [5], Italy [22,23], Austria [16], and Germany [14].
The complex physical and chemical modifications, in terms of loss of structural chemicals or tissue integrity [24], occurring in wood during the long sub-fossilisation process are reflected in changes in the physical and mechanical properties compared to recent wood [2,3,4,5,6].
Density is a physical property of wood largely investigated in correlation with anatomical structure and mechanical properties due to its practical importance for processing and treating technologies. Several researchers reported slightly reduced values of the basic density of subfossil oak compared to recent wood (e.g., 91% of the value of recent wood according to [22]). It was also observed that density does not necessarily decrease with the age of subfossil oak, but it depends on the location of burial, condition of deposition and degree of degradation of wood components [2,13]. When archaeological oak excavated from fluvial terraces was investigated, a higher density than contemporary wood was obtained, and the author explained that this result is due to a strong supersaturation of wood with mineral compounds [20]. Values of basic density almost equal to those for recent oak, without noticeable differences between internal and external areas of the subfossil trunk, were reported for subfossil oak from Italy [23]. The oven-dry density reported by different authors varied in the ranges of 544–667 kg/m3 for new wood [25] and 526–668 kg/m3 for subfossil oak [3].
Increased dimensional instability was reported for subfossil oak. Double values of shrinkage and swelling compared to recent oak and the fact that these values did not change with the age of subfossil wood were reported [2]. Similarly, an increased affinity for water and almost double swelling values compared with recent oak were found by other researchers [4,24]. The same increasing trend of wood shrinkage with double radial values or even triple tangential values compared to recent wood was registered in another research [23].
In terms of mechanical properties, it was stated that compression strength parallel to the grain of subfossil oak does not exceed the value of 40 MPa, being approx. 25–50% lower than the strength of recent wood [2,3,14,20]. A similar trend, but with a lower decrease of about 10–23%, was also reported [23].
Despite all these general trends, the properties of subfossil oak wood are highly variable, depending on the burial conditions, composition of the environmental sediments and age of the material, though this seems to be not the most relevant influencing factor. Therefore, chemical investigation of subfossil wood is necessary to explain the changes in properties [2,4,24].
In Romania, subfossil wood is almost unknown to users. However, researchers have recently studied subfossil wood of various species discovered on Romanian territory, focusing mainly on dendrochronological evaluation [26,27,28] or some specific chemistry-related characteristics [6,10,11,29]. Subfossil oak from the Suceava region was investigated by dendrochronology [28], while chemometric characteristics of historical/archaeological oak from the 14th century, wood–water relationship and biological degradation of subfossil oak were also research topics [6,10,11].
The physical and mechanical properties and their relationship were less studied on subfossil oak/wood material from Romania. Therefore, the present study aims to fill some lack of information in this field, contributing to the enrichment of the available database on subfossil oak and its properties.
The aim of the research presented in this paper was to comparatively investigate some relevant physical and mechanical properties of subfossil oak originating from three buried trunks excavated from riverbanks in different locations in Romania. Aged wood recovered from construction and new wood were included in this research as comparison reference samples. Density, swelling, shrinkage and compression parallel to grain were selected in this research as relevant properties for furniture and interior design elements.

2. Materials and Methods

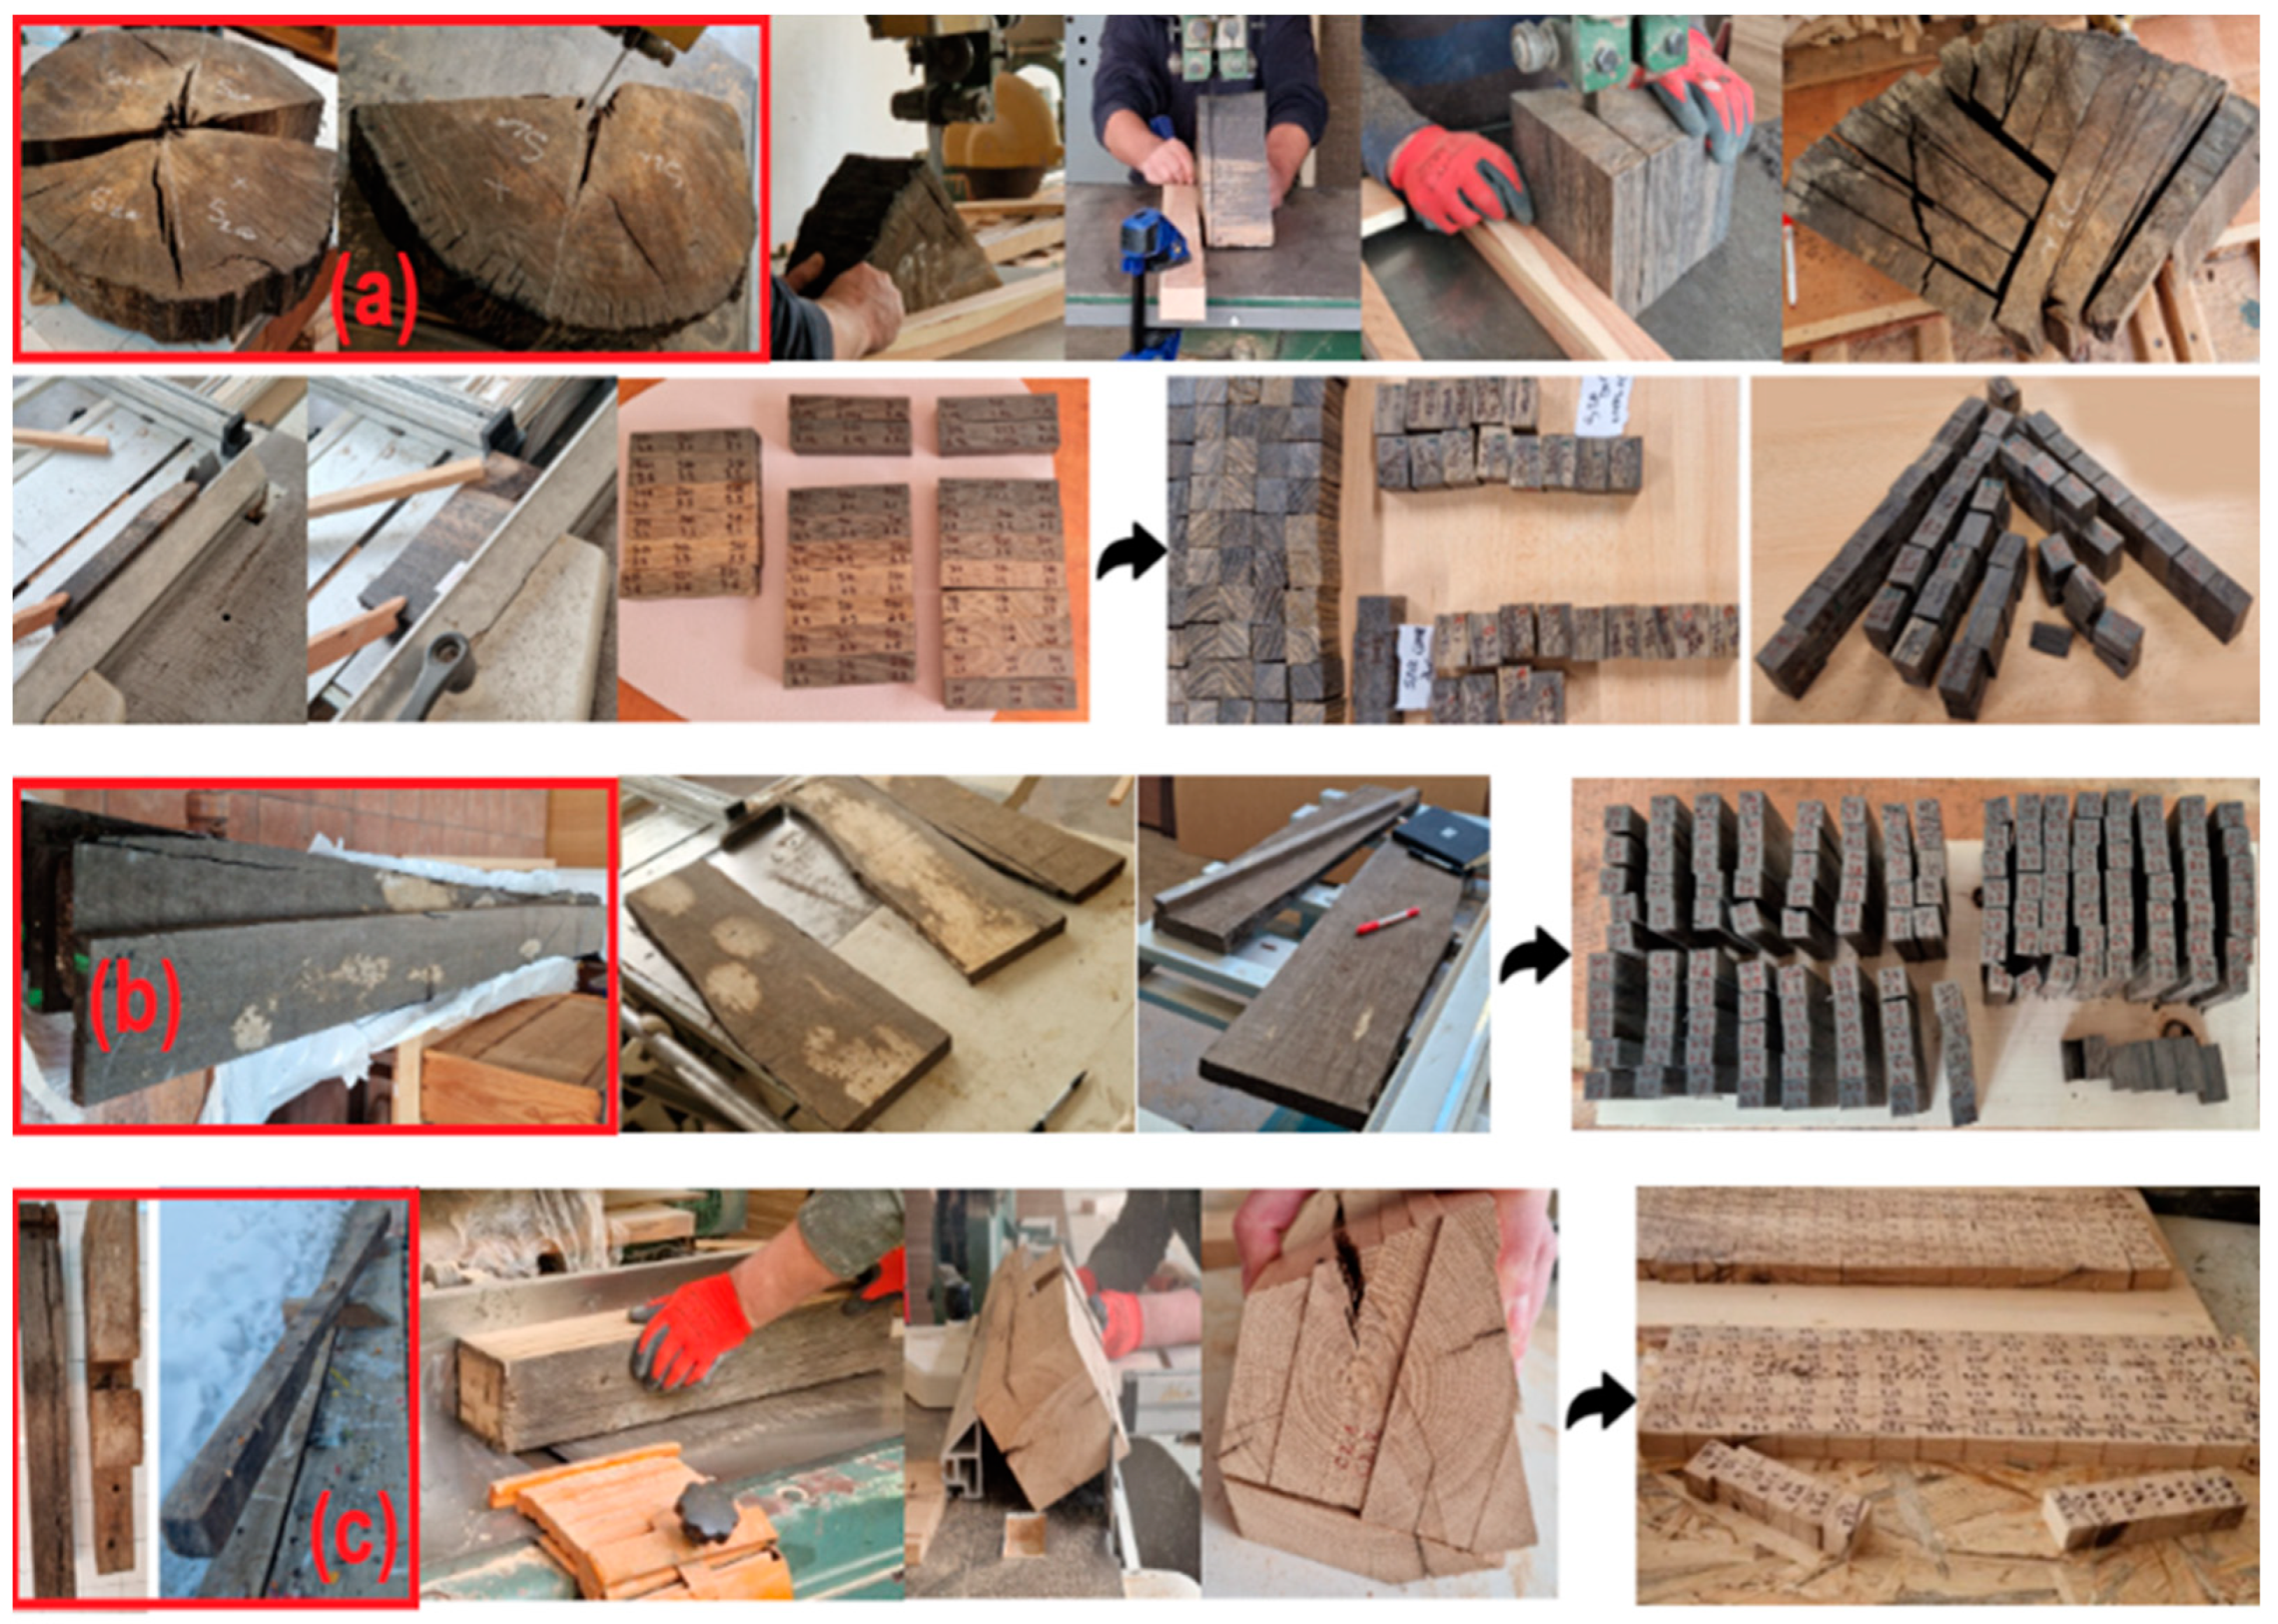
2.1. Wood Material and Test Samples

Three types of oak wood material, namely subfossil oak (SO), aged oak (AO) and recent (new) oak (NO) were employed in this research. The SO material originated from three buried trunks (S1, S2, S3) accidentally discovered in riverbeds in three locations in Romania, as presented in Figure 1, alongside their GPS coordinates. The SO wood material provided to our faculty for testing was in various forms: air-dried timber pieces (S1, S3) or crosscut log sections (S2). Two such pieces (100 mm thick discs), one cut from the base of the trunk (S2a) and the second cut at 6 m height from the base (S2b), were investigated. Wood elements recovered from constructions on the occasion of their demolition or rehabilitation were used as sources of AO material. There were two elements (C1, C2), namely a beam and a pillar from the traditional porch of a house built around 1930 in Valea Mare-Bratia, Argeș County and one beam (C3) from the roof structure of a house built around 1970 in Codlea, Brasov County. An approximate age of 90 years in the conditions of use class 3 (UC 3) according to [30] could be considered for AO_C1-C2, while 30 years in service in UC 2, followed by 25 years storage in conditions of UC 3+ (outdoors, covered, near soil contact), should be acknowledged for AO_C3. Four pieces of recent oak timber (50 mm thick) from the workshop of the Faculty of Furniture Design and Wood Engineering were employed as NO material for comparison.
Prismatic test samples with dimensions of (30 × 20 × 20) in (mm × mm × mm) on the (L × Ra × Tg) directions were prepared by careful mechanical processing from the air-dried wood material of all the presented assortments. This type of samples was employed in this research to determine all the selected physical and mechanical properties, namely density, coefficients of swelling and shrinkage, and the compression parallel to grain.
Depending on the form of the available material (timber pieces, wooden log cross sections, elements recovered from constructions), adequate processing phases and cutting schemes were applied (Figure 1). Special attention was paid to preliminary cuttings to remove all obviously degraded material (AO) and/or sapwoodby-case basis. Then, cuttings in the radial direction were carried out to ensure obtainment by further adequate processing of intermediary baguettes (scantlings) with cross sections of 20 × 20 (mm × mm) in the Ra and Tg directions, respectively. The annual rings were parallel to one of the cross section sides. The final test samples resulted from crosscutting at 30 mm lengthin the longitudinal direction.
All the samples were coded and numbered during the whole mechanical processing steps so that their location in the original material could be clearly understood and traceability ensured. Numbering of the intermediary baguettes/scantlings started from the bark/outer part of un-edged timber inwards. The first two scantlings were considered sapwood, while heartwood was considered from scantling four inwards. Core wood (pith) was eliminated (when present) in all cases. Only samples following standard conditions were used for testing.
The codes of the sample series corresponding to the three types of oak wood material (SO, AO, NO), respectively the seven different assortments, alongside the total number of samples investigated for each assortment (mentioned as figures in brackets) were as follows: SO_S1 (37), SO_S2a (35), SO_S2b (37), SO_S3 (32), AO_C1_C2 (63), AO_C3 (43), NO (64).

2.2. Experimental Methods

2.2.1. Density and FSP

The oven-dried density (ρ0) and basic density (ρc) were calculated considering the ratio between the oven-dried mass of the sample (m0) and its oven-dried volume (V0), respectively, and maximum volume (Vmax) at fibre saturation point (FSP) or above, according to Equations (1) and (2).
Drying of samples was achieved in a laboratory oven at 103 ± 2 °C until constant weight. They were weighed with an analytical balance with precision 0.001 g and measured by calliper with an accuracy of 0.01 mm.
ρ 0 = m 0 / V 0 , kg / m 3
ρ c = m 0 / V m a x , kg / m 3
The experimentally determined values of oven-dried and basic densities were then employed to calculate the FSP based on their mathematical correlation [31,32], according to Equation (3).
FSP = 1000 ρ c 1000 ρ 0 × 100 , %

2.2.2. Swelling and Shrinkage

Methods adapted from relevant standards in force were applied [33,34,35,36] to determine swelling and shrinkage properties.
For the total swelling coefficients, αmax, the samples were oven-dried until a constant mass, and the dimensions (l) were measured on the three directions L, Ra, Tg with 0.01 mm accuracy. The specimens were then completely immersed in distilled water and reweighed and measured after 72, 96 and 324 h, when they reached maximum constant dimensions.
The total swelling coefficients on the longitudinal, radial, tangential directions and volumetric swelling were calculated according to Equations (4) and (5).
α ( L , R a , T g ) max = l ( L , R a , T g ) max l ( L , R a , T g ) 0 l ( L , R a , T g ) 0 · 100 , %
α V   max = V max V 0 V 0 · 100 , %
where
l ( L , R a , T g ) max = the maximum dimensions (at FSP or above) in longitudinal, radial, and tangential directions, respectively, [mm];
l ( L , R a , T g ) 0 = the oven-dry dimensions in the longitudinal, radial, and tangential directions, respectively, [mm];
V max = the maximum volume (at FSP or above), [mm3];
V 0 = oven-dry volume, [mm3].
The same samples were then employed to determine the total shrinkage coefficients βmax. For this purpose, the wet samples from immersion phase were air conditioned for a few days and then dried in a laboratory oven at 103° ± 2 °C until a constant mass. The dimensions were measured after 30 min of cooling in desiccator and the total linear and volumetric shrinking coefficients were calculated according to Equations (6) and (7).
β ( L , R a , T g ) max = l ( L , R a , T g ) max l ( L , R a , T g ) 0 l ( L , R a , T g ) max · 100 , %
β V   max = V max V 0 V max · 100 , %
where
l ( L , R a , T g ) max = the maximum dimensions (at FSP or above) in longitudinal, radial, and tangential directions, respectively, [mm];
l ( L , R a , T g ) 0 = the oven-dried dimensions in the longitudinal, radial, and tangential directions, respectively, [mm];
V max = the maximum volume at FSP or above [mm3];
V 0 = the oven-dried volume, [mm3].
The linear and volumetric swelling and shrinkage coefficients for 1% moisture content variation (Kα and Kβ) were then calculated with Equations (8) and (9), respectively.
K α = α max F S P
K β = β max FSP

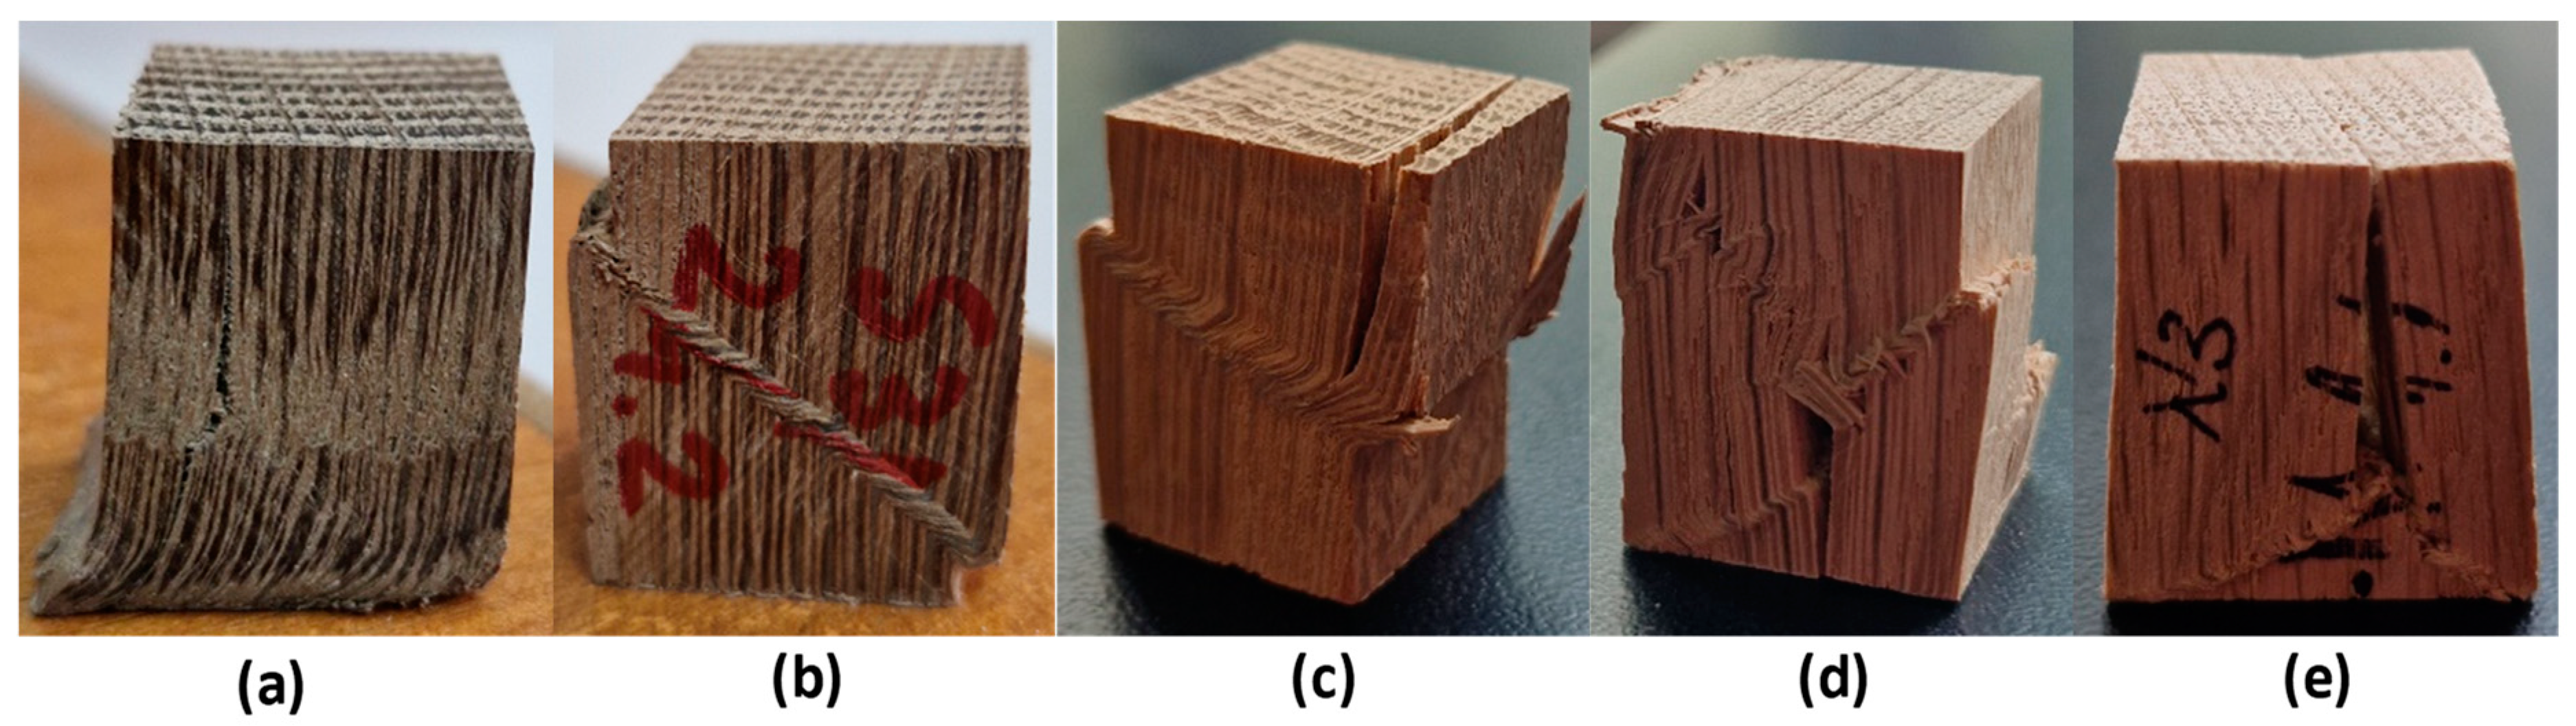
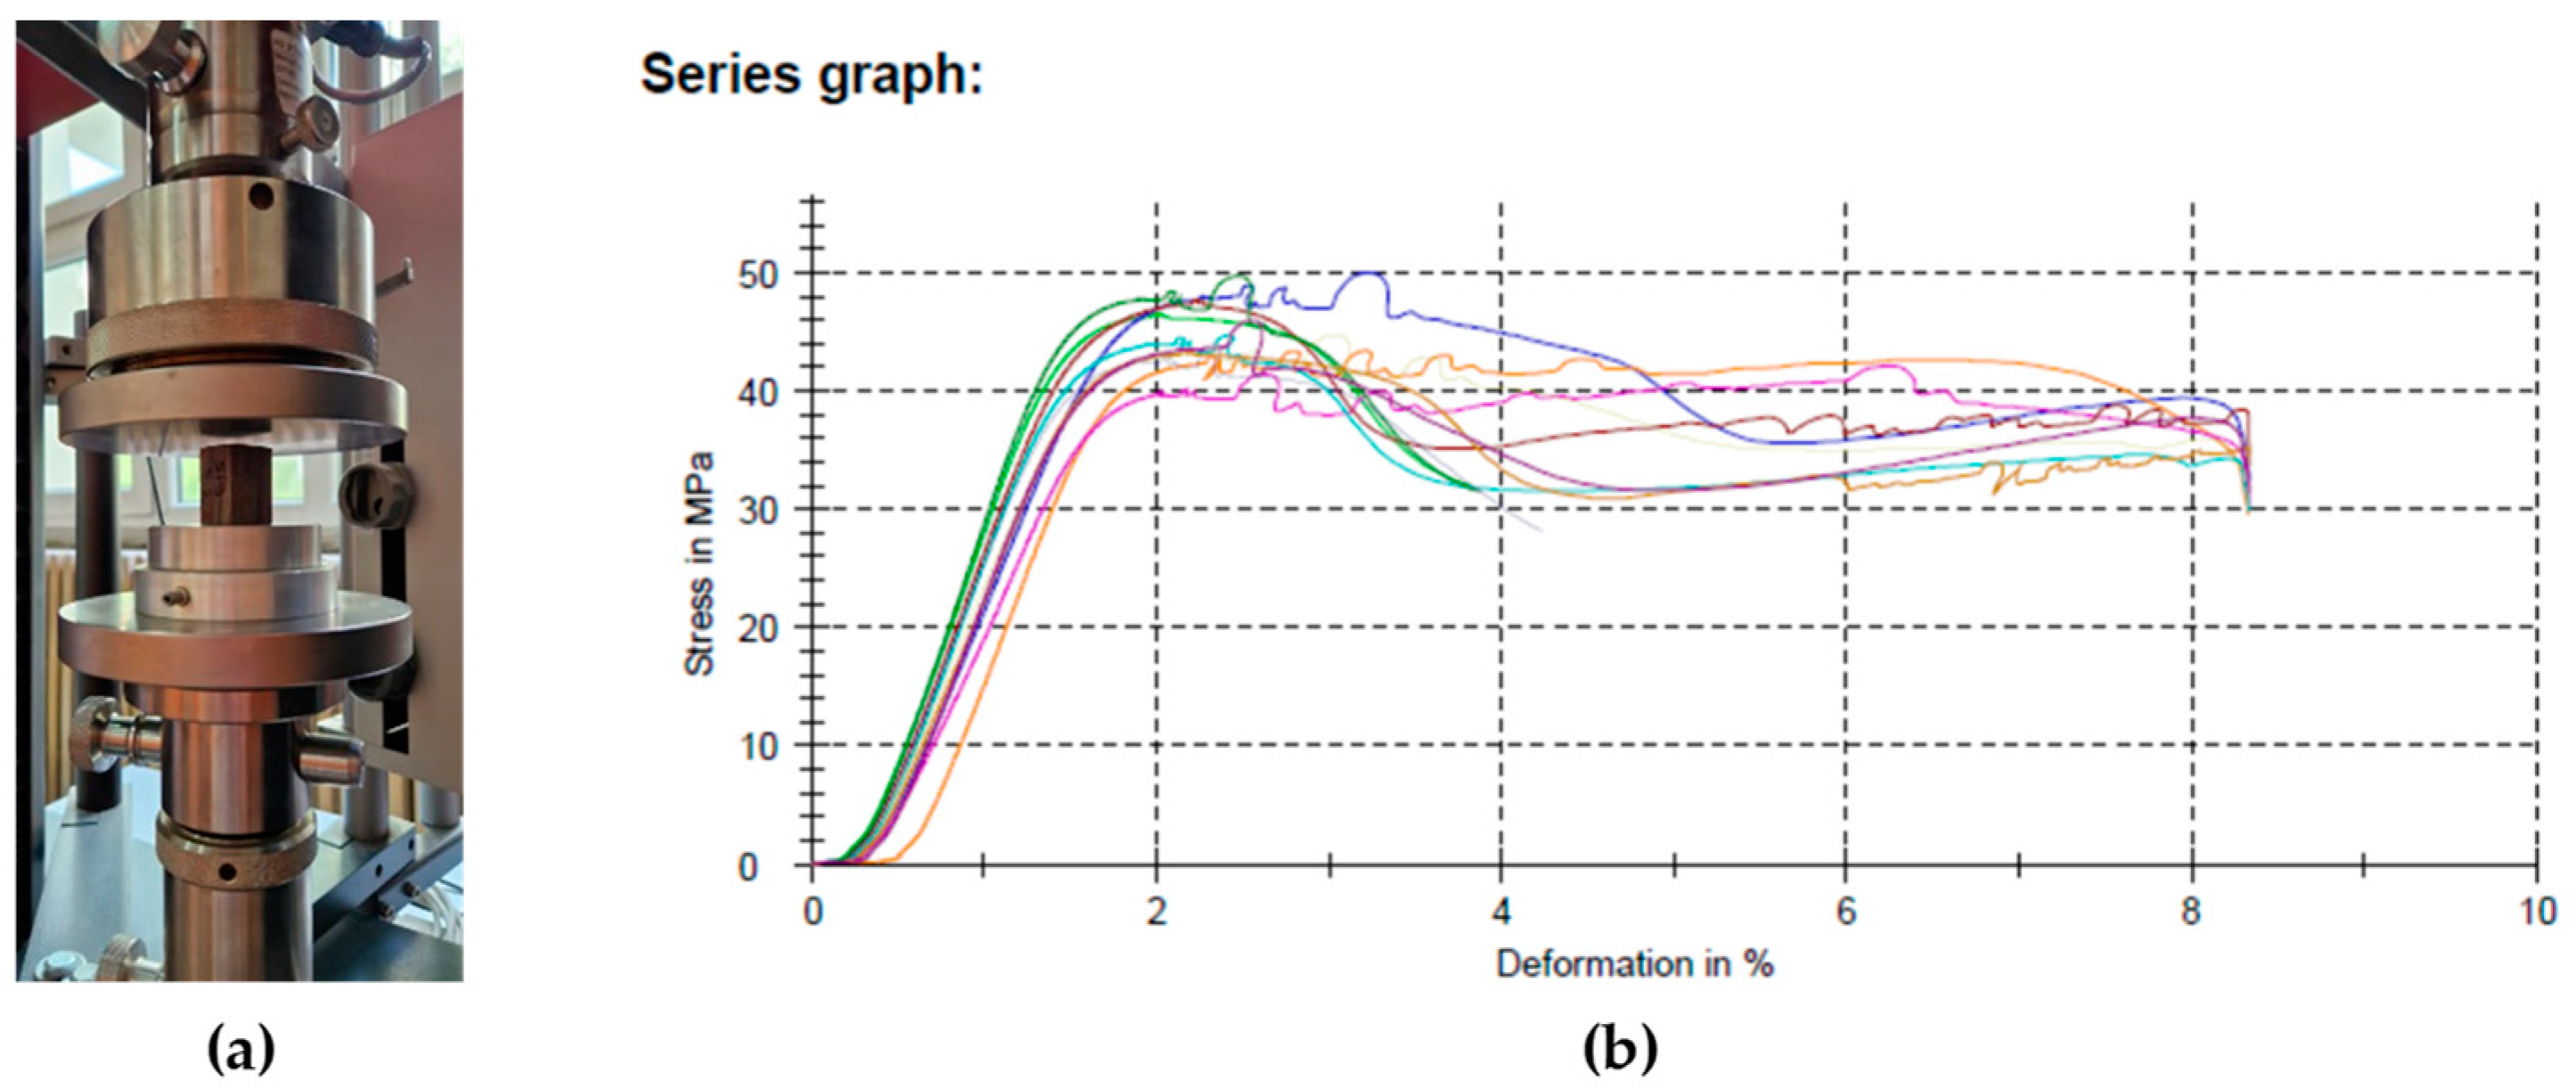
2.2.3. Compression Strength (Ultimate Stress in Compression Parallel to Grain)

The ultimate stress in compression (compression strength) parallel to grain was determined according to [37]. The test was performed by means of a ZWICK/ROELL universal testing machine (type BT1FB050TN.D30/2007, produced in Ulm Germany), endowed with a device (support) for positioning the specimen and a device for applying the load. The compression test (Figure 2) consisted of measuring the maximum load required to break the specimen under a static load applied parallel to grain. The machine software automatically recorded and displayed all measured data and the calculated value of compression strength. A data correction depending on the real moisture content of tested samples (W, %) was performed in order to assess compression strength at a 12% moisture content (σc,12).
σ c , W = P max b × h , N / m m 2
where
σ c = ultimate stress in compression parallel to grain at the actual moisture content (W) of tested sample, [N/mm2];
P max = maximum breaking force of the sample, [N];
b × h = cross section area of the test sample (Ra × Tg), [mm2].
σ c , 12 = σ c , W · 1 + α · W 12 , N / m m 2
where
α = correction coefficient of compression strength for 1% MC difference, equal to 0.04
W = moisture content of the tested sample [%].
Figure 2. Determination of compression strength: (a) detail of ZwickRoell universal machine equipped with compression device; specimen positioned for testing; (b) examples of stress–deformation diagrams automatically registered (different colours represent different samples).
Applsci 14 03294 g002

2.3. Statistical Analysis

Experimental data were statistically analysed employing Minitab 17.1.0 statistic software. Statistical analysis consisted of calculation of the mean, median and standard deviation values of each set of data. Box plot graphs were employed to better highlight the variation in the studied properties among the types of investigated samples and variability of experimental data for each assortment. Null hypothesis tests were applied to check if the differences between the data sets/mean values of multiple samples (one-way ANOVA) were significantly different or not at a confidence level of 95% (α = 0.05).

3. Experimental Results

3.1. Physical Properties of Subfossil Oak in Comparation with Aged Oak from Construction and Recent Oak
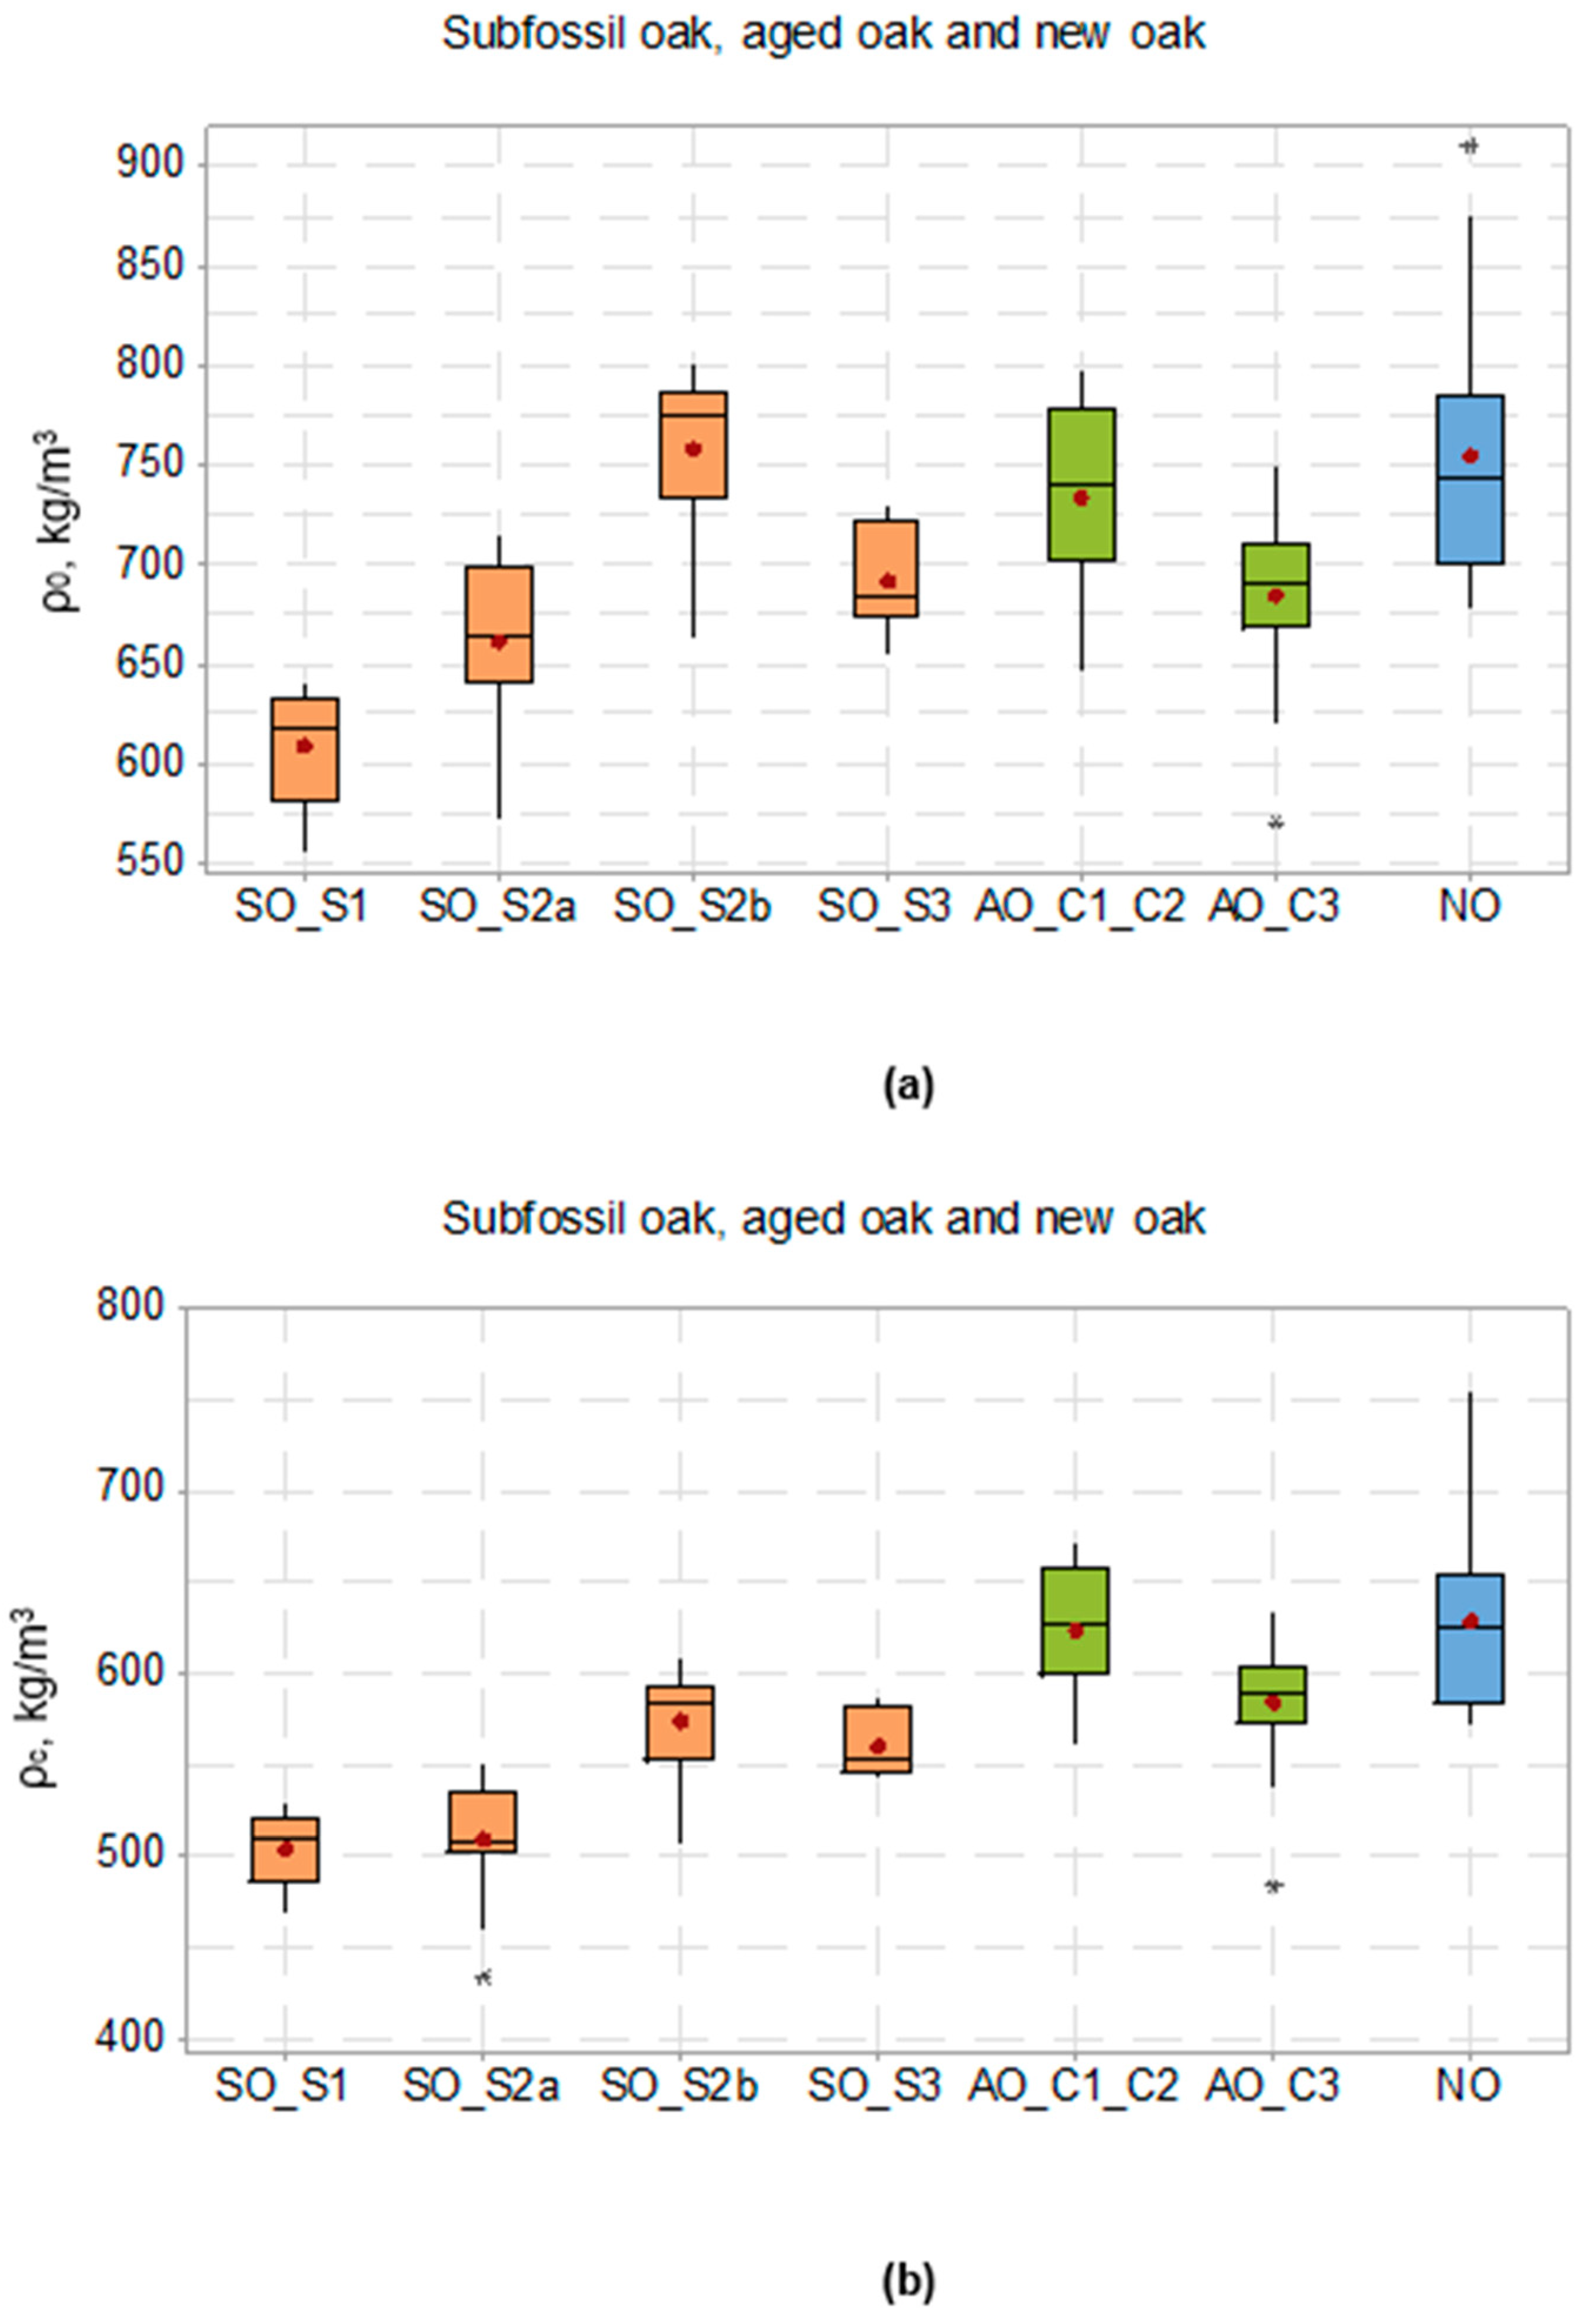
3.1.1. Wood Density

The oven-dry and basic densities of all the seven assortments from the three types of oak wood material (SO, AO, NO) are summarized in Table 1 and graphically illustrated by the box plots in Figure 3.
It can be observed that average values of oven-dry density, ρ0, for the SO assortments varied between 609 ± 28 kg/m3 (SO_S1) and 752 ± 47 kg/m3 (SO_S2b). For the two AO assortments, the average values were 685 ± 39 kg/m3 (AO_C3) and 733 ± 47 kg/m3 (AO_C1_C2). All these values were slightly lower than the experimental average value 755 ± 63 kg/m3 for NO.
The obtained results are supported by the literature data. According to [38], the oven-dry density of Quercus Robur and Petraea (NO) can vary between 390 and 930 kg/m3 with an average of 650 kg/m3, while values of about 618–696 kg/m3 were reported by [2]. The reported values for SO varied in the range of about 526–734 kg/m3 [3]. Also, lower density values for SO compared to NO were previously reported in the literature, e.g., [14,22].
Statistical analysis of our experimental data showed that there were no statistically significant differences between the SO_S2a and SO_S3 assortments and between NO and SO_S2b and AO_C1-C2 assortments in terms of oven-dry density. On the other hand, there was a statistically significant difference in oven-dry density of about 93 kg/m3 between SO_S2a and SO_S2b samples originating from the same log but from different positions on the trunk length (base and 6m from the base), with a 14% higher density in the upper position. This higher value was statistically similar to that determined for NO.
Usually, wood in the trunks of oak (ring-porous) trees shows a maximum density at the base of the trunk, then decreases to remain constant over a relatively large height, and then increases again under the crown. Also, the density of ring-porous wood material is correlated positively with the width of the annual rings respective to the higher proportion of latewood [31,39]. Our results showed, however, an axial increase in oven-dry density for SO_S2 over the value at the base at approximately 2/3 height of the 9 m trunk. Presence of tension wood might be an explanation.
In terms of basic density (ρc), it can be observed that the average value for NO was the highest (629 ± 49 kg/m3), followed by the average values of AO (585–623 kg/m3) and lower average values for the SO assortments (504–568 kg/m3). Similar values for basic densities of SO were previously reported: 521.7 kg/m3 [22] and 530 kg/m3 [23].
To conclude the density investigation, the experimental data showed, in good accordance with the literature, that the density of sub-fossil oak varied among assortments from different locations and in the same log, being generally lower (with up to 19.3–19.9%) compared to new oak, while the density of aged oak may be comparable or slightly lower. A slight decrease in basic density could be attributed partially to a minimal decomposition of the cell walls and partially to the extraction of water-soluble substances as a result of leaching in a burial environment [40]. Also, the variability of density among the wood material from various assortments and the data dispersion for each assortment, due to several particularities of wood structure (e.g., the width of the annual rings, other anatomical features, wood extractives content, absorption of other components), as reflected by the boxplots in Figure 3, should be acknowledged.

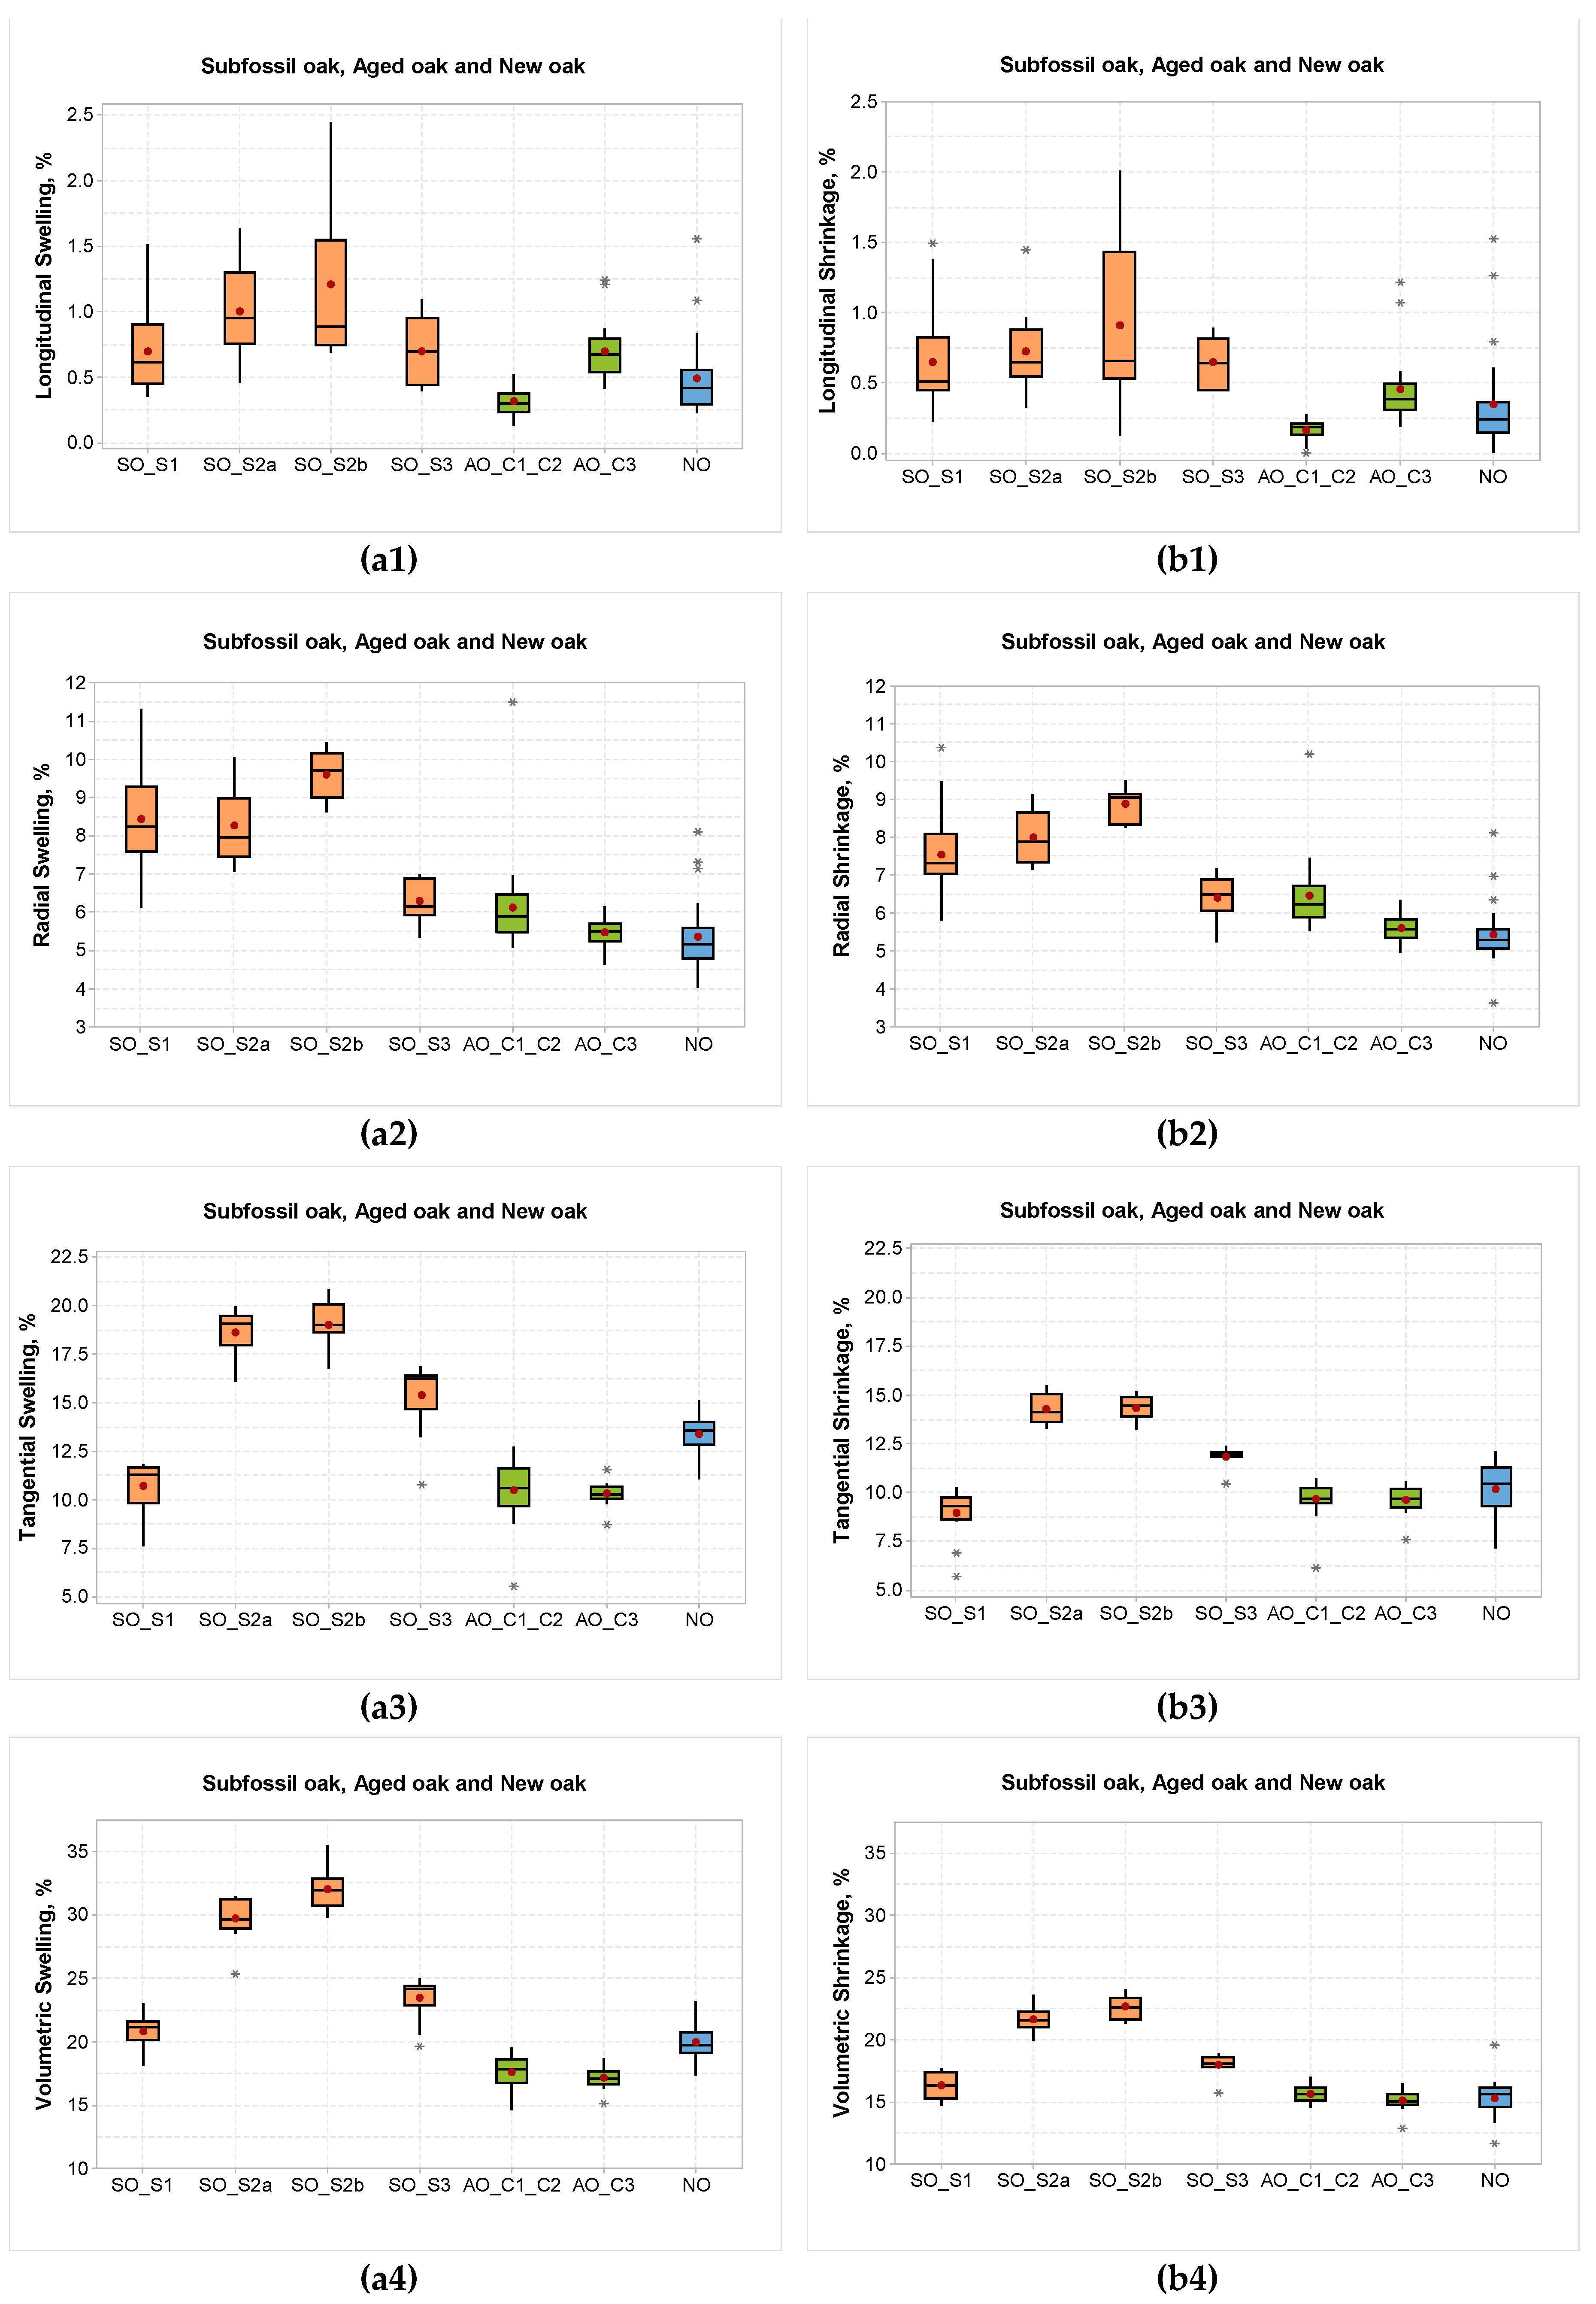
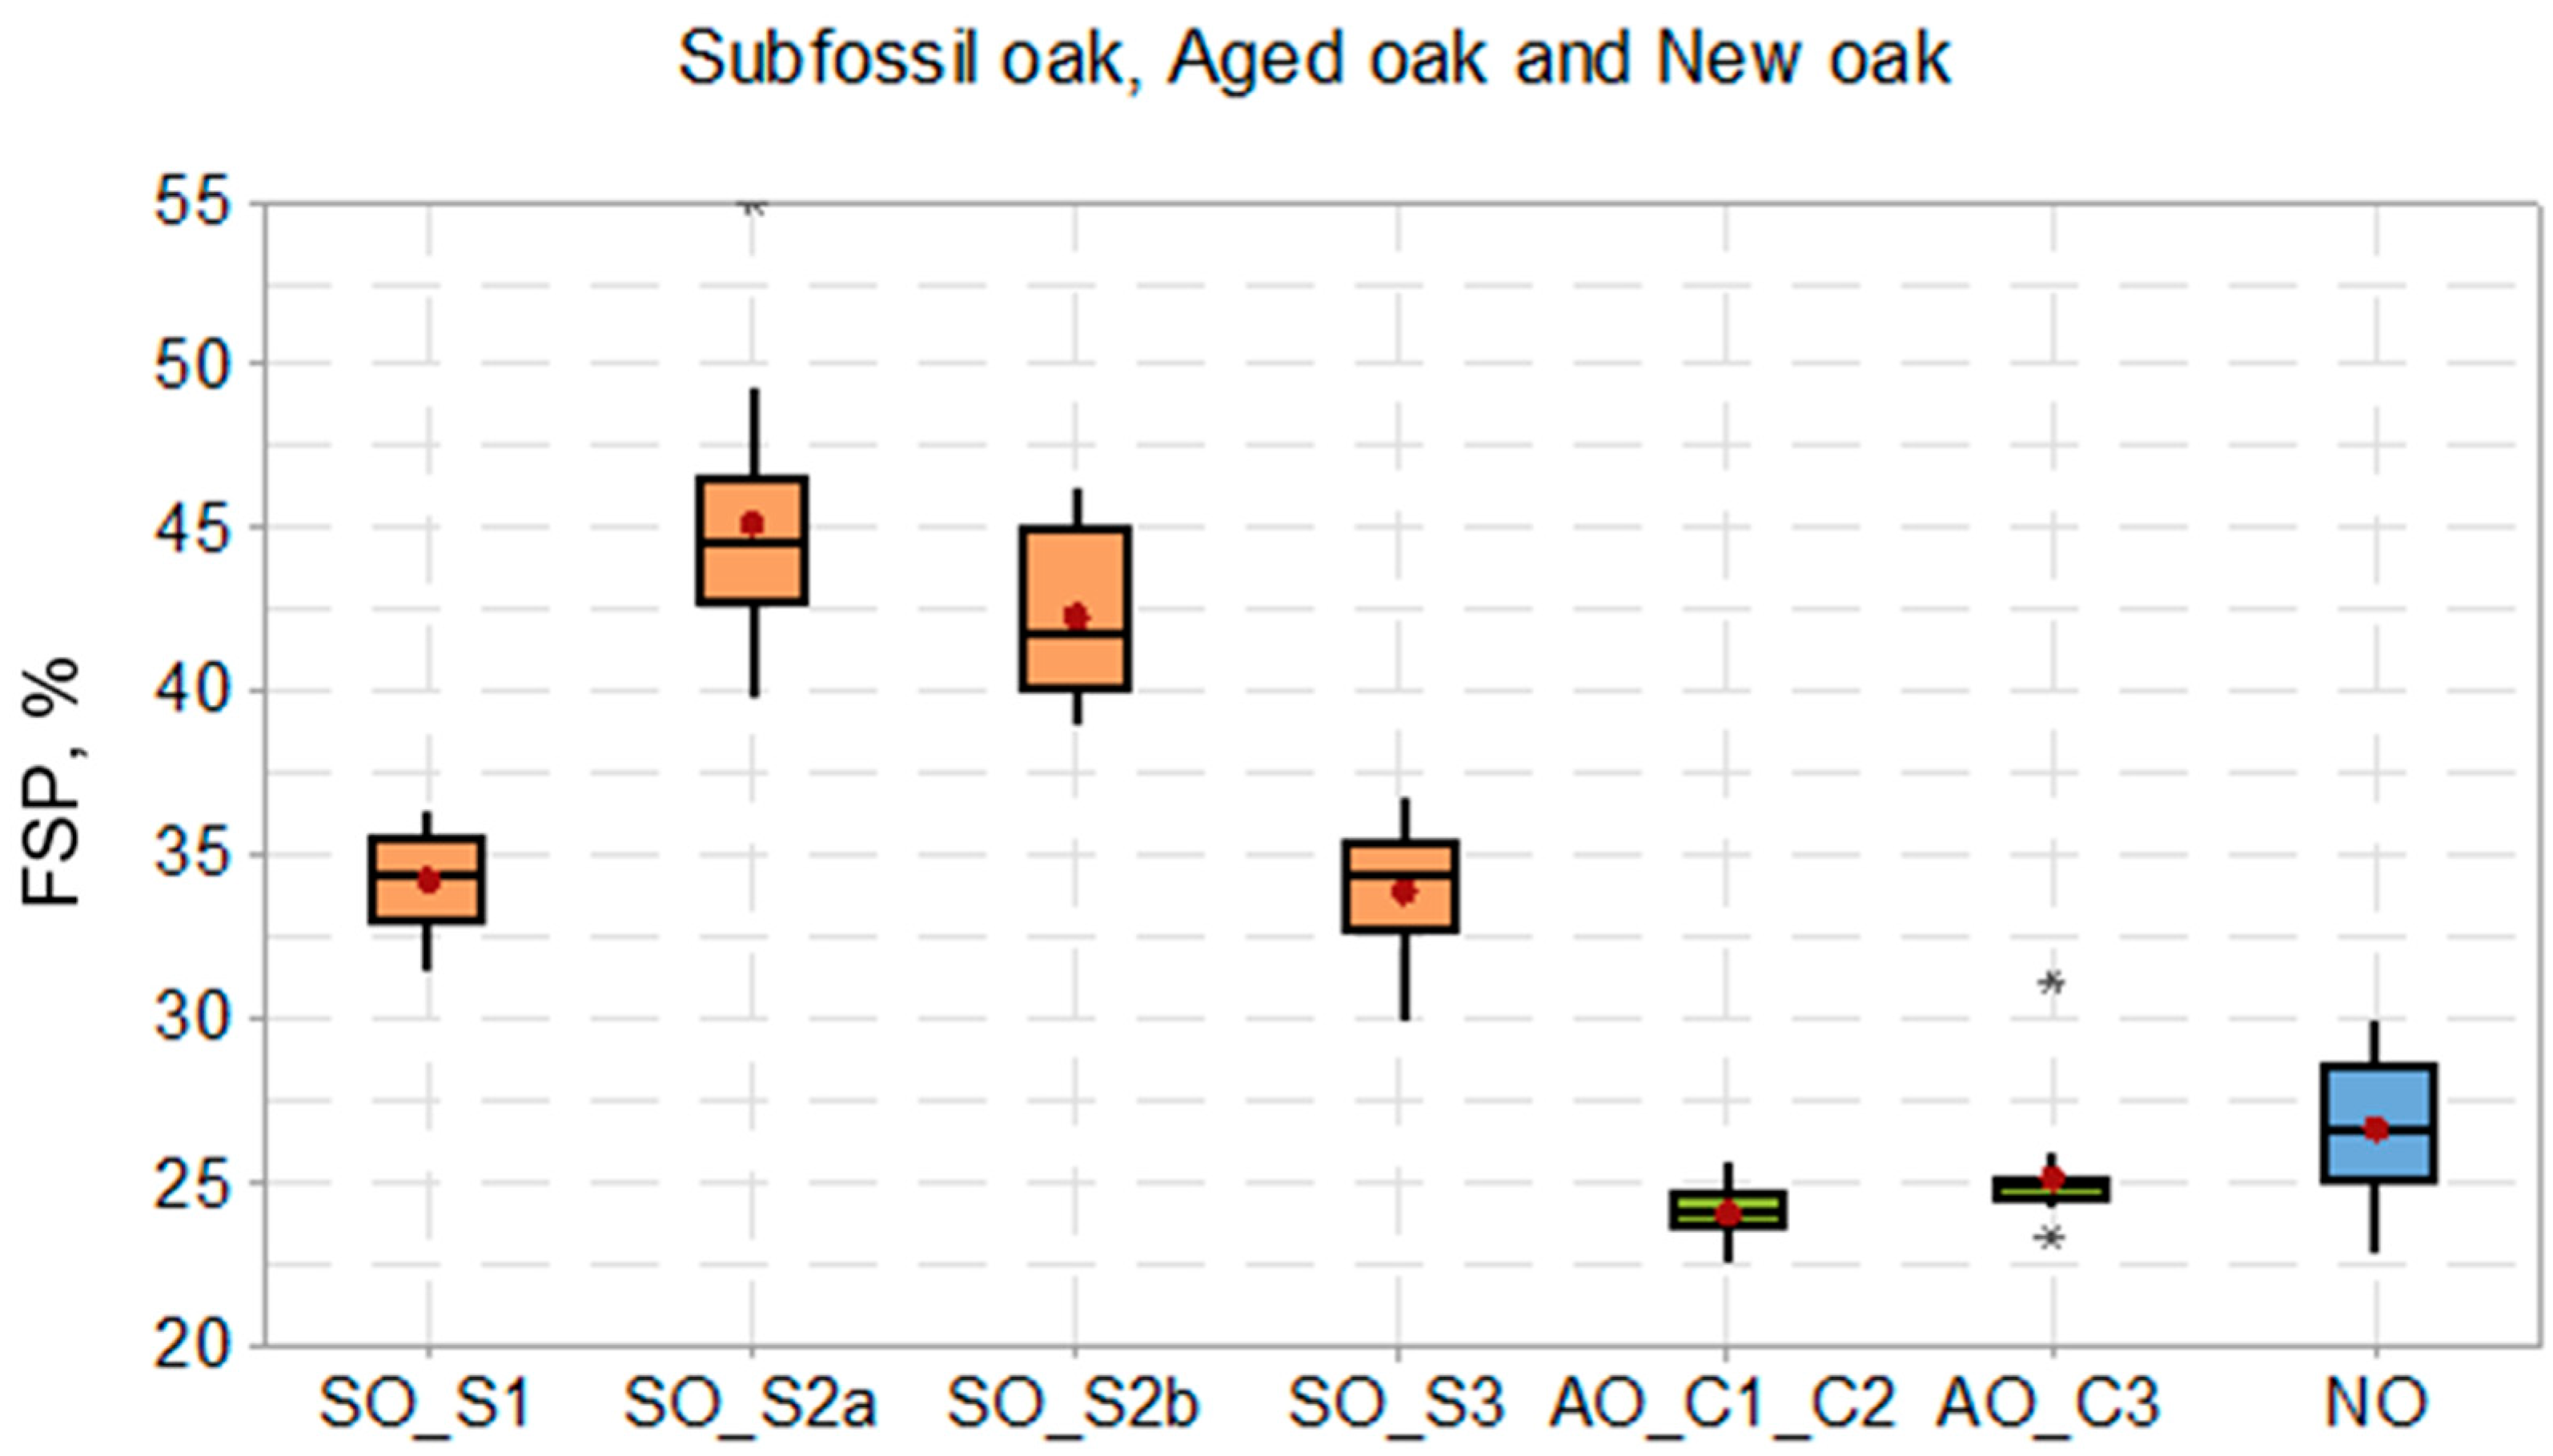
3.1.2. Swelling and Shrinkage, Anisotropy and FSP

The total linear and volumetric swelling and shrinkage coefficients are presented in Table 2 and graphically illustrated by the box plots in Figure 4.
It could be observed that, generally, higher total swelling and shrinking coefficients were determined for SO compared to NO. The average values of the total swelling coefficients determined for the different SO assortments varied in the ranges 20.9–32.4% (V), 6.4–9.4% (Ra) and 10.7–19.5% (Tg), with maximum values for the SO_S2b samples, which also presented the higher density. The corresponding values for NO were 20.0% (V), 5.4% (Ra) and 13.4% (Tg), respectively. The smaller tangential swelling and shrinkage coefficients for the SO_S1 assortment compared to recent oak NO must be also noted, which might be correlated with the higher density of the NO wood specimens investigated in this research. The total swelling and shrinkage coefficients of AO samples were close to those for recent oak.
The values of total shrinkage obtained in this research, higher for SO compared to NO, as similarly reported in the literature, e.g., [2,3,4,13], were situated in the characteristic intervals presented in [38] for subfossil oak and new oak. Some exceptions could be noted: slightly lower values of radial and tangential shrinkage for new oak and a single higher value of longitudinal shrinkage for SO.
A remark has to be made on the high longitudinal swelling and shrinking coefficients of SO, especially the assortments SO_S2b (αL max = 1.2, βL max = 0.9) and SO_S2a (αL max = 1.0, βL max = 0.7), compared to NO (αL max = 0.5, βL max = 0.4). They might indicate the presence of tension wood [41]. The direct relationships between anatomical pattern, density and local swelling of oak wood were demonstrated [42].
The increased swelling of SO compared to recent oak could probably be due to the “leaching of degradation products or inorganic compounds stored in wood during the fossilization process” and chemical analysis of leaching water would be necessary in order to find out which compounds are responsible for the distinct swelling if subfossil oak is immersed in water [4].
The coefficient of anisotropy calculated as ratios between the total tangential and radial swelling were situated in the range of 1.3–2.4 for the SO assortments and 1.7–1.9 for AO_C assortments, being slightly lower than the value of 2.5 calculated for the NO employed in this research. The same trend was observed for shrinking. To conclude, the experimental data in this research indicate that increased swelling and shrinking could be expected for SO compared to NO, though the anisotropy of dimensional changes might be slightly reduced. These aspects are important in the design of furniture and other wood products.
The values of FSP calculated based on Equation (3) and swelling and shrinking coefficients for 1% variation in the MC, calculated based on the total swelling and shrinking coefficients and corresponding FSP values, are cumulated in Table 3.
It can be observed that SO presents higher FSP values (34–45%) compared to NO (27) and AO (24–25). The variation in this property for all the studied assortments and variability and dispersion of individual data within each group is highlighted by the boxplots in Figure 5.
According to [3,4] and literature cited herein, an increase in affinity to water might be attributed to a higher amount of the amorphous part of cellulose in subfossil oak and “freer bonding sites in cellulose” due to hydrolysis of hemicelluloses. FTIR investigations of our samples (not included in this paper) highlighted the prevalent degradation of hemicelluloses in subfossil wood so the above explanation might apply. However, it has to be highlighted that the calculation method employed was conceived for recent wood and might not be fully applicable for subfossil or aged woods due to the chemical changes in the cell walls.

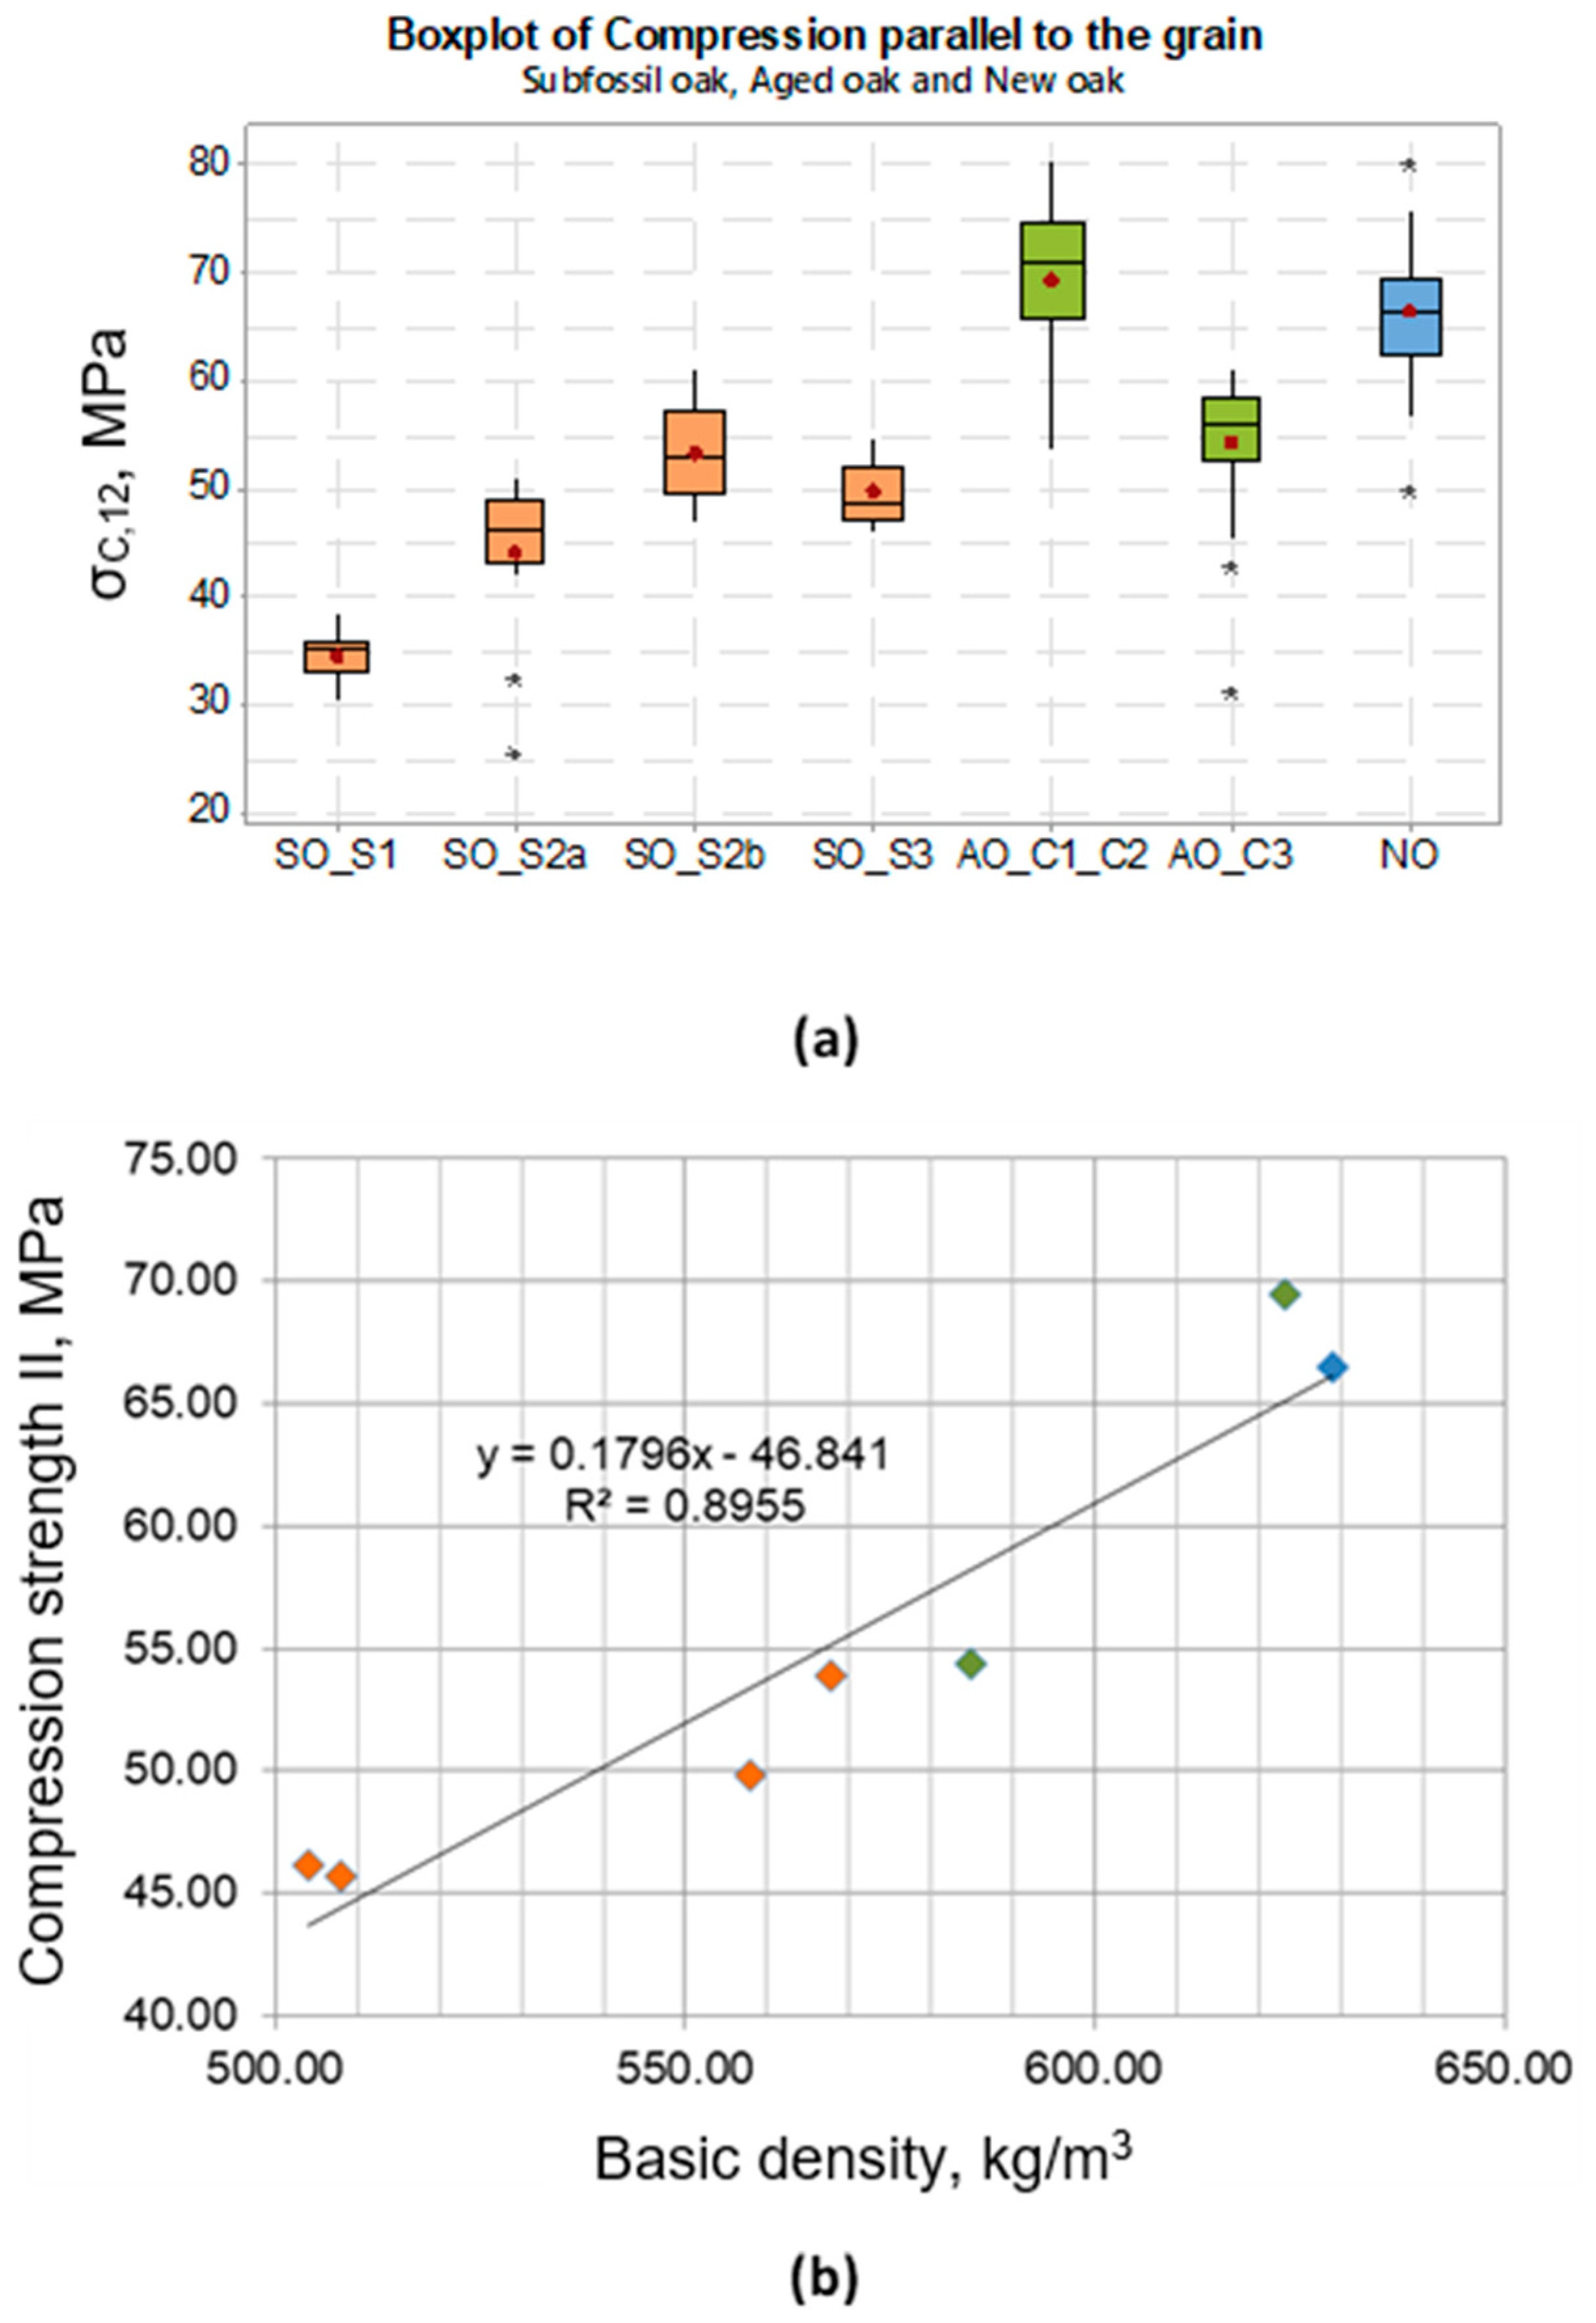
3.2. Mechanical Properties of Subfossil Oak Compared with Aged Oak from Construction and Recent Oak

The results of compression tests parallel to grain are summarised in Table 4, while the variation in this mechanical property among the different assortment of oak wood and its correlation with the basic density is illustrated in Figure 6.
An average ultimate compression stress value of 66 ± 6 MPa was obtained for the tested recent oak material (NO). This value is in good accordance with the reference literature data indicating an interval of variation of 54–76 MPa for Quercus robur, with an average of 61 MPa, while the corresponding values for Quercus petraea are 48–65–70 MPa [38]. The different assortments of subfossil oak presented compression strengths significantly lower (by 20–30%) compared to NO, in the range 46–54 MPa, which agrees with reference literature 33–38–52 MPa [38] The values for the two assortments of aged oak recovered from construction were significantly different, being either by 18% lower compared to NO (54 ± 7 MPa for AO_C3), or similar with NO (AO-C1-C2 with average 69 ± 7 MPa, statistically not different to NO). Despite this variability of the average values of compression strength parallel to grain among the studied oak wood assortments (Figure 6a), all values correlated well with the basic density of the wood material (Figure 6b). A linear positive correlation with a high correlation factor (R2 = 0.8955) was obtained for the experimental results of this research.
The average values of modulus of elasticity varied in the range 3523–4144 MPa for the assortments of SO, being 15–30% lower than the average value of 4887 MPa determined for NO. Average values of modulus of elasticity varying in the range of 4490–10,342 MPa for subfossil oak from various sources and of different ages compared to 12,351 MPa for recent oak were previously reported [3].
The fact that the mechanical properties of subfossil wood are lower than those of recent wood has been a common conclusion of several researchers, though differences in the actual values reported were present. Compression strength parallel to the grain for subfossil oak was found to vary in the range of 50–80% of that of recent oak according to [3] and the literature cited therein. Variations in density and decreases in ultimate compression stress of subfossil oak compared to recent wood were associated with chemical changes occurring during the sub-fossilisation process, including some degradation of the main wood components and settlements of some minerals into the wood structure. These changes seem to depend more on the environment during fossilisation than on time. Linear positive correlations between compression strength and density were determined for both subfossil and recent oak, with a higher correlation of variables for the latter [3]. However, it was also highlighted that the chemical changes occurring in subfossil oak are the key factors determining its properties: a lower content of cellulose, a relatively low content of lignin and a high proportion of ash may explain low compression strength for samples with high density [3].
The samples were also analysed to assess the failure patterns by compression parallel to the grain. Under the action of the compression force, the anatomical elements tend to separate from each other and buckle individually. The specimens break along a radial plane of minimum resistance by sudden detachment or by sliding and shearing along a plane oblique to the axis or by combining these two phenomena. For most of the samples, the break occurred along one or several planes of minimum resistance, sometimes accompanied by longitudinal cracks, as exemplified in Figure 7b–e. There were no notable differences among the subfossil oak, recent oak, and aged oak samples in terms of failure patterns or prevalence of a certain pattern, except for failure by fibre sliding (Figure 7a) observed only for SO, especially SO_S2.

4. Conclusions

Subfossil oak (SO) wood material originating from three different buried trunks recently excavated from riverbanks on Romanian territory was analysed in this research in comparison with aged oak recovered from constructions (AO_C) and recent/new oak wood material (NO).
The experimental results showed a high variability of the properties of SO from different trunks and from the same trunk as a function of axial position and significant differences when compared with NO and AO. A lower density (by up to 20%), increased hygroscopicity and dimensional instability, but slightly lower swelling anisotropy were the main physical characteristics of SO compared to NO. At the same time, ultimate compression stress parallel to the grain and the corresponding modulus of elasticity were also reduced (by 20–30%). By comparison, only slight changes in the tested physical and mechanical properties were determined for the assortments of AO when compared to NO, though some significant differences were registered among the two assortments as a function of age and service/storage conditions.
The physical and mechanical properties tested and the differentiating features of NO, SO and AO are important for interior furniture with artistic valences and decorative woodwork and contribute to understanding the scientific and commercial value of this material.

Author Contributions

Conceptualization, R.N. and M.C.T.; methodology, R.N. and M.C.T.; supervision, M.C.T.; preparation of test samples, R.N.; investigations: R.N., M.C.T., M.P. and E.C.B., software/statistics, R.N.; validation, M.C.T. and M.P.; writing—original draft preparation, R.N., M.C.T., M.P. and E.C.B.; writing—review and editing, R.N., M.C.T., M.P. and E.C.B.; visualization, M.C.T. All authors have read and agreed to the published version of the manuscript.

Funding

This research received no external funding.

Institutional Review Board Statement

Not applicable.

Informed Consent Statement

Not applicable.

Data Availability Statement

The original contributions presented in the study are included in the article, further inquiries can be directed to the corresponding authors.

Acknowledgments

This work is part of a budget-funded PhD research program undertaken by the first author within the Interdisciplinary Doctoral School of the Transilvania University of Brasov, Romania. Special thanks are addressed to Eng Adrian Baban for making this research possible by providing the subfossil oak material SO_S1 and SO_S2 analyzed within this research. The authors are extremely grateful to the technical staff of the workshop of the Faculty of Furniture Design and Wood Engineering of Transilvania University, especially to Eng. Valeriu Budulan and Eng. Martin Szakacs for their dedicated effort in the preparation of test samples. The authors also acknowledge the PRO-DD structural funds project (POS-CCE, O.2.2.1., ID 123, SMIS 2637, no. 11/2009) for providing the infrastructure used in this work at the ICDT Research Institute of the Transilvania University of Brasov-Romania.

Conflicts of Interest

The authors declare no conflicts of interest. The founders had no role in the design of the study in the collection analysis or interpretation of data in the righting of the manuscript or in the decision to publish the results.

References

  1. Fengel, D. Aging and fossilisation of wood and its components. Wood Sci. Tehnol. 1991, 25, 153–177. [Google Scholar] [CrossRef]
  2. Kolář, T.; Rybníček, M. Phisical and mechanical properties of subfossil oak (Quercus, sp.) wood. Acta Univ. Agric. Silvic. Mendel. Brun. 2010, 58, 123–134. [Google Scholar] [CrossRef]
  3. Kolar, T.; Rybnícek, M.; Strelcová, M.; Hedbávný, J.; Vít, J. The changes in chemical composition and properties of subfossil oak deposited in holocene sediments. Wood Res. 2014, 59, 149–166. [Google Scholar]
  4. Baar, J.; Nevrly, O. Swelling of subfossil oak under different conditions. In Proceedings of the Iaws Plenary Meeting—Eco-Efficient Resource Wood with Special Focus on Hardwoods, Sopron, Hungary, 15–18 September 2014. [Google Scholar] [CrossRef]
  5. Rede, V.; Sara Essert, S.; Kocijan, M.; Dubravac, T. Influence of Ageing on Abrasion Volume Loss, Density, and Structural Components of Subfossil Oak. Appl. Sci. 2022, 12, 1814. [Google Scholar] [CrossRef]
  6. Ghavidel, A.; Hofmann, T.; Bak, M.; Sandu, I.; Vasilache, V. Comparative archaeometric characterization of recent and historical oak (Quercus spp.) wood. Wood Sci. Technol. 2020, 54, 1121–1137. [Google Scholar] [CrossRef]
  7. Kránitz, K.; Sonderegger, W.; Bues, C.T.; Niemz, P. Effects of aging on wood: A literature review. Wood Sci. Technol. 2016, 50, 7–22. [Google Scholar] [CrossRef]
  8. Liu, X.Y.; Timar, M.C.; Varodi, A.M.; Sawyer, G. An investigation of accelerated temperature induced ageing of four wood species: Colour and FTIR. Wood Sci. Technol. 2017, 51, 357–378. [Google Scholar] [CrossRef]
  9. Zisi, A. Forest Wood through the Eyes of a Cultural Conservator. Forests 2021, 12, 1001. [Google Scholar] [CrossRef]
  10. Ghavidel, A.; Bak, M.; Hofmann, T.; Vasilache, V.; Sandu, I. Evaluation of some wood-water relations and chemometric characteristics of recent oak and archaeological oak wood (Quercus robur) with archaeometric value. J. Cult. Herit. 2021, 51, 21–28. [Google Scholar] [CrossRef]
  11. Ghavidel, A.; Jorbandian, A.; Bak, M.; Gelbrich, J.; Morrell, J.J.; Sandu, I.; Hosseinpourpia, R. Degradation assessment of archaeological oak (Quercus spp.) buried under oxygen-limited condition. Holzforschung 2023, 77, 198–207. [Google Scholar] [CrossRef]
  12. Lisuzzo, L.; Hueckel, T.; Cavallaro, G.; Sacanna, S.; Lazzara, G. Pickering Emulsions based on Wax and Halloysite Nanotubes: An Ecofriendly Protocol for the Treatment of Archaeological Woods. CS Appl. Mater. Interfaces 2021, 13, 1651–1661. [Google Scholar] [CrossRef] [PubMed]
  13. Borgin, K.; Tsoumis, G.; Passialis, G. Density and shrinkage of old wood. Wood Sci. Tehnol. 1979, 13, 49–57. [Google Scholar] [CrossRef]
  14. Schwab, E. Holzeigenschaften einer Subfossile Eiche. Holz Als Roh-Und Werkst. 1994, 52, 210. [Google Scholar] [CrossRef]
  15. Krapiek, M. Holocene Dendrochronological standards for subfossil oaks from the area of Southern Poland. Stud. Quat. 2001, 18, 47–63. [Google Scholar]
  16. Klusek, M.; Pavelczyk, S. Stable carbon isotope analysis of subfossil wood from Austrian Alps. Geochronometria 2014, 41, 400–408. [Google Scholar] [CrossRef] [PubMed]
  17. Kolář, T. Oak Wood Properties Change on Ana Example of Subfossil Trunks. Dissertation, Mendel University, Brno, Czech Republic, 31 January 2012. [Google Scholar]
  18. Kolář, T.; Gryc, V.; Rybníček, M.; Vavrčík, H. Anatomical analysis and species identification of subfossil oak wood. Wood Res. 2012, 57, 251–264. [Google Scholar]
  19. Baar, J.; Paschová, Z.; Hofmann, T.; Kolář, T.; Koch, G.; Saake, B.; Rademacher, P. Natural durability of subfossil oak: Wood chemical composition changes through the ages. Holzforschung 2020, 74, 47–59. [Google Scholar] [CrossRef]
  20. Mañkowski, P.; Kozakiewicz, P.; Drodek, M. The selected properties of fossil oak wood from medieval burgh in P£oñsk. Wood Res. 2016, 61, 287–298. [Google Scholar]
  21. Veizović, M.; Popović, Z.; Todorović, N.; Milić, G. Drying quality and colour of subfossil oak from Central Serbia. Glasnik Sumarskog fakulteta 2018, 2018, 157–172. [Google Scholar] [CrossRef]
  22. Urso, T.; Martinelli, N.; Pignatelli, O.; Scortegagna, T. The subfossil trunk of Chiarano (TV). Conserv. Sci. Cult. Herit. 2018, 15, 41–52. [Google Scholar] [CrossRef]
  23. Meneghello, C. Bog Oak: Physico-mechanical and Chemical Characterization of Two Logs from Venetian Plan. In Proceedings of the XI Congresso Nazionale AIAr, Napoli, Italy, 28–30 July 2021. [Google Scholar] [CrossRef]
  24. Sinkovic, T.; Govorcin, S.; Dubravac, T.; Roth, V.; Sedlar, T. Comparison some physical and mechanical properties of abonos and recent oak (Quercus robur L.). Šumarski List 2009, 891, 605–611. [Google Scholar]
  25. Giagli, K.; Baar, J.; Fajstavr, M.; Gryc, V.; Vavrcik, H. Tree-ring width variation of wood density in Fraxinus excelsior L. and Quercus robur L. growing in Floodplain Forests. BioResources 2018, 13, 804–819. [Google Scholar] [CrossRef]
  26. Arvai, M.; Popa, I.; Mîndrescu, M.; Nagy, B.; Kern, Z. Dendrochronological assessment and radiocarbon dating of subfossil coniferous macroremains excavated from a peat bog, Maramures Mts, Romania. In Proceedings of the Late Pleistocene and Holocene Climatic Variability in the Carpathian Balkan Region, Cluj/Kolozsvár, Romania, 6–9 November 2014; Stefan cel Mare University Press: Suceava, Romania, 2014. [Google Scholar]
  27. Radoane, M.; Nechita, C.; Chiriloaei, F.; Rădoane, N.; Popa, I.; Roibu, C.; Robu, D. Late Holocene fluvial activity and correlations with dendrochronology of subfossil trunks: Case studies of north-eastern Romania. Geomorphology 2015, 239, 142–159. [Google Scholar] [CrossRef]
  28. Kern, Z.; Popa, I. Dendrochronological and radiocarbon analyses of subfossil oaks from the foothills of the Romanian Carpathian. Geochronometria 2016, 543, 113–120. [Google Scholar] [CrossRef]
  29. Ghavidel, A.; Gelbrich, J.; Ku, A.; Vasilache, V.; Sandu, I. Investigation of Archaeological European White Elm (Ulmus laevis) for Identifying and Characterizing the Kind of Biological Degradation. Heritage 2023, 3, 60. [Google Scholar] [CrossRef]
  30. EN 335:2013; Durability of Wood and Wood-Based Products—Use Classes: Definitions, Application to Solid Wood and Wood-Based Products. BSI Standards Publication: London, UK, 2013.
  31. Filipovici, J. Study of Wood, Vol II; Didactic Publishing House: Bucharest, Romania, 1965. (In Romanian) [Google Scholar]
  32. Deaconu, I.; Porojan, M.; Timar, M.C.; Bedelean, B.; Campean, M. Comparative Research on the Structure, Chemistry, and Physical Properties of Turkey Oak and Sessile Oak Wood. BioResources 2023, 18, 5724–5749. [Google Scholar] [CrossRef]
  33. ISO 13061-13:2016; Physical and Mechanical Properties of Wood. Test Methods for Small Clear Wood Specimens. Part 13: Deter. Determination of Radial and Tangential Shrinkage. ISO: Geneva, Switzerland, 2016.
  34. ISO 13061-14:2016; Physical and Mechanical Properties of Wood. Test Methods for Small Clear Wood Specimens. Part 14: Determination of Volumetric Shrinkage. ISO: Geneva, Switzerland, 2016.
  35. ISO 13061-15:2017; Physical and Mechanical Properties of Wood. Test Methods for Small Clear Wood Specimens. Part 15: Determination of Radial and Tangential Swelling. ISO: Geneva, Switzerland, 2016.
  36. ISO 13061-16:2017; Physical and Mechanical Properties of Wood. Test Methods for Small Clear Wood Specimens. Part 16: Determination of Volumetric Swelling. ISO: Geneva, Switzerland, 2016.
  37. ISO 13061-17:2017; Physical and Mechanical Properties of Wood. Test Methods for Small Clear Wood Specimens. Part 17: Determination of Ultimate Stress in Compression Parallel to Grain. ISO: Geneva, Switzerland, 2016.
  38. Wagenführ, R. Holzatlas (Wood atlas); Fachbuchverlag Leipzig im Carl Hanser Verlag: München, Germany, 2007; pp. 255–264. [Google Scholar]
  39. Kollmann, F.F.P.; Cote, W.A., Jr. Principles of Wood Science and Technology, Vol I. Solid Wood; Springer: Berlin/Heidelberg, Germany; GmbH & Co. KG: Hamburg, Germany, 2012; 592p, ISBN 9783642879302. [Google Scholar]
  40. Lucejko, J.J.; Tamburini, D.; Zborowska, M.; Babiński, L.; Modugno, F.; Colombini, M.P. Oak wood degradation processes induced by the burial environment in the archaeological site of Biskupin (Poland). Herit. Sci. 2020, 8, 44. [Google Scholar] [CrossRef]
  41. Clair, B.; Thibaut, B. Physical and Mechanical Properties of Reaction Wood. The Biology of Reaction Wood; Springer Series in Wood Science; Springer: Berlin/Heidelberg, Germany, 2014; 249p, ISBN 978-3-642-10813-6. [Google Scholar] [CrossRef]
  42. Badel, E.; Bakour, R.; Perre, P. Investigation of the relationships between anatomical pattern, density and local swelling of oak wood. IAWA J. 2006, 27, 55–71. [Google Scholar] [CrossRef]
  43. Jiang, J.; Lu, J.; Zhou, Y.; Zhao, Y.; Zhao, L. Compression strength and modulus of elasticity parallel to the grain of oak wood at ultra-low and high temperatures. BioResources 2014, 9, 3571–3579. [Google Scholar] [CrossRef]
Figure 1. Types of wood material and phases of test samples preparation: (a) log cross sections (SO_S2a, SO_S2b), (b) timber pieces (SO_S1, SO_S3) and (c) elements of aged wood recovered from constructions (AO_C).
Applsci 14 03294 g001
Figure 3. Box plots of oven-dried density (a) and basic density (b) illustrating the variation in these values among the different assortments of oak wood and dispersion of data in each group. Note: Box plots include median value line, mean (average) value (red dot), whiskers for minimum and maximum values and outliers (*).
Applsci 14 03294 g003
Figure 4. Box plots of total swelling (a1a4) and total shrinkage coefficients (b1b4), illustrating the variation in these values among the different assortments of oak wood and dispersion of data in each group. Note: Box plots include median value line, mean (average) value (red point), whiskers for minimum and maximum values and outliers (*).
Applsci 14 03294 g004
Figure 5. Box plots of FSP values, illustrating the variation in this property among the different assortments of oak wood and dispersion of data in each group. Note: Box plots include median value line, mean (average) value (brown point), whiskers for minimum and maximum values and outliers (*).
Applsci 14 03294 g005
Figure 6. Ultimate compression stress parallel to grain: (a) Box plots illustrating variation among the different assortments of oak wood and dispersion of data in each group; (b) linear correlation with basic density. Note: Box plots include median value line, mean (average) value (red point), whiskers for minimum and maximum values and outliers (*); SO—orange colour, AO—green colour and NO—blue colour.
Applsci 14 03294 g006
Figure 7. Exemplification of the main types of wood failure occurring by compression parallel to grain: (a) sliding of fibers; (b,c) break along one plane of minimum resistance, with a longitudinal crack (c); (d,e) break along two or more planes of minimum resistance with longitudinal cracks.
Applsci 14 03294 g007
Table 1. Oven-dry density (ρ0) and basic density (ρc) of subfossil oak (SO) from different sources compared to aged oak recovered from constructions (AO_C) and recent oak (NO)—average values and standard deviations.
Wood
Material
NORρ0,
kg/m3
ρc,
kg/m3
SO_S115609 ± 28504 ± 19
SO_S2a13658 ± 48508 ± 36
SO_S2b12752 ± 47568 ± 32
SO_S310690 ± 29558 ± 19
AO_C1_C225733 ± 47623 ± 34
AO_C320685 ± 39585 ± 32
NO27755 ± 63629 ± 49
Notes: NOR = Number of replicates.
Table 2. Comparative values of total swelling and total shrinkage coefficients of subfossil oak (SO), aged oak (AO_C), and new oak (NO)—average values and standard deviations.
Wood
Material
Total SwellingTotal Shrinkage
σL max,αRa max,αTg max,αV max,βL max,βRa max,βTg max,βV max,
%%%%%%%%
SO_S10.7 ± 0.38.4 ± 1.510.7 ± 1.320.9 ± 1.40.7 ± 0.47.6 ± 1.29.0 ± 1.216.4 ± 1.0
SO_S2a1.0 ± 0.38.5 ± 1.018.4 ± 1.229.6 ± 1.80.7 ± 0.38.0 ± 0.714.3 ± 0.821.7 ± 1.1
SO_S2b1.2 ± 0.79.4 ± 0.719.5 ± 0.832.4 ± 1.70.9 ± 0.68.9 ± 0.514.4 ± 0.622.7 ± 1.0
SO_S30.6 ± 0.36.4 ± 0.615.4 ± 2.123.6 ± 1.80.7 ± 0.26.4 ± 0.611.9 ± 0.518.0 ± 0.9
AO_C1_C20.3 ± 0.16.1 ± 1.310.5 ± 1.517.6 ± 1.40.2 ± 0.16.5 ± 0.99.7 ± 0.915.6 ± 0.7
AO_C30.7 ± 0.25.5 ± 0.410.3 ± 0.617.1 ± 0.80.5 ± 0.35.6 ± 0.49.7 ± 0.715.1 ± 0.8
NO0.5 ± 0.35.4 ± 0.913.4 ± 1.020.0 ± 1.40.4 ± 0.45.4 ± 0.810.2 ± 1.315.3 ± 1.5
Table 3. Fibre saturation point, swelling and shrinkage coefficients for 1% moisture content (W) variation, Kα, Kβ.
Wood
Material
FSP,
%
Swelling Coefficients
for 1% W Variation
Shrinkage Coefficients
for 1% W Variation
Kα,Ra, %Kα,Tg, %Kα,V, %Kβ,L, %Kβ,Ra, %Kβ,Tg, %Kβ,V, %
SO_S1340.250.310.610.020.220.260.48
SO_S2a450.190.410.660.020.180.320.48
SO_S2b430.220.450.750.020.210.330.53
SO_S3340.190.450.690.020.190.350.53
AO_C1_C2240.250.440.730.010.270.400.65
AO_C3250.220.410.680.020.220.380.60
NO270.200.500.750.010.200.380.58
Table 4. Compression parallel to grain for sub-fossil oak (SO) assortments compared to recent oak (RO) and aged oak recovered from constructions (AO_C): ultimate compression stress σc,12 (average values with standard deviations), strain at break point ε (range) and Modulus of elasticity Ec (minimum, mean and average values).
Wood
Material
NORσc,12Strain at Break Point,Modulus of Elasticity, Ec
MinMeanMax
MPamm/mmMPaMPaMPa
SO_S11546 ± 30.020–0.023380641444808
SO_S2a1346 ± 80.020–0.023293737654494
SO_S2b1354 ± 50.023–0.027343235233832
SO_S31250 ± 30.020–0.023319735853708
AO_C1_C23169 ± 70.023–0.030223647065334
AO_C32054 ± 70.020–0.033159438544579
NO_N2966 ± 60.020–0.033468048875114
Notes: NOR = Number of replicates; σc,12 = ultimate compression stress parallel to grain corrected for W 12%; Ec modulus of elasticity calculated for Min = minimum; Mean and Max = maximum values of σc,12 employing the experimental stress–strain diagrams on the elastic domain (between 10% and 40% of the maximum breaking load), according to [43].
Disclaimer/Publisher’s Note: The statements, opinions and data contained in all publications are solely those of the individual author(s) and contributor(s) and not of MDPI and/or the editor(s). MDPI and/or the editor(s) disclaim responsibility for any injury to people or property resulting from any ideas, methods, instructions or products referred to in the content.

