Abstract
This paper concentrates on the elevator passenger detection task, a pivotal element for subsequent elevator passenger tracking and behavior recognition, crucial for ensuring passenger safety. To enhance the accuracy of detecting passenger positions inside elevators, we improved the YOLOv8 network and proposed the SC-YOLOv8 elevator passenger detection network with soft-pooling and attention mechanisms. The main improvements in this paper encompass the following aspects: Firstly, we transformed the convolution module (ConvModule) of the YOLOv8 backbone network by introducing spatial and channel reconstruction convolution (SCConv). This improvement aims to reduce spatial and channel redundancy in the feature extraction process of the backbone network, thereby improving the overall efficiency and performance of the detection network. Secondly, we propose a dual-branch SPP-Fast module by incorporating a soft-pooling branch into the YOLOv8 network’s SPP-Fast module. This dual-branch SPP-Fast module can preserve essential information while reducing the impact of noise. Finally, we propose a soft-pooling and multi-scale convolution CBAM module to further enhance the network’s performance. This module enhances the network’s focus on key regions, allowing for more targeted feature extraction, thereby further improving the accuracy of object detection. Additionally, the attention module enhances the network’s robustness in handling complex backgrounds. We conducted experiments on an elevator passenger dataset. The results show that the precision, recall, and mAP of our improved YOLOv8 network are 94.32%, 91.17%, and 92.95%, respectively, all surpassing those of the original YOLOv8 network.
1. Introduction
With rapid urbanization and the continuous development of architectural structures, elevators, as indispensable modes of transportation in modern society, play a crucial role in connecting various floors. However, in the day-to-day functioning of elevator systems, ensuring passenger safety and service quality has consistently been a crucial concern necessitating attention and improvement. Object detection technology within elevators, as an essential means to enhance elevator operational efficiency and ensure passenger safety, has garnered widespread research and application attention [1,2]. Due to the rapid advancement of computer vision and deep learning technologies, object detection techniques have found widespread applications in diverse fields. However, object detection within elevators still faces a series of challenges compared to other fields due to the unique environment and complex scenes. Detecting objects in elevator scenes presents several challenges. Firstly, elevators typically have complex backgrounds, including walls, floors, and ceilings, which can interfere with accurate object detection. Secondly, lighting conditions may vary from dim to bright, impacting algorithm performance. Moreover, during peak elevator usage, there can be a high density of objects, leading to overlapping targets and increased difficulty in identification [3,4]. Therefore, addressing these challenges requires comprehensive consideration and tailored algorithm design to enhance accuracy and stability in object detection within elevator environments.
With the rise of deep learning, object detection algorithms based on deep learning have become mainstream. These algorithms leverage neural networks for end-to-end learning and processing. Object detection algorithms based on deep learning can be broadly classified into two categories: two-stage detection algorithms and one-stage detection algorithms.
Two-stage algorithms, exemplified by the region-based convolutional neural network (R-CNN) series [5], were among the earliest object detection algorithms based on deep learning. R-CNN utilizes selective search to generate candidate regions, followed by convolutional neural network feature extraction for each region and, finally, employs a classifier for object detection. Fast R-CNN [6] optimized R-CNN by introducing a region of interest pooling layer, thereby achieving higher computational efficiency. Faster R-CNN [7] further introduced the region proposal network, enabling end-to-end learning in object detection. While these methods exhibit high detection accuracy, their detection speed is relatively slow, resulting in reduced efficiency.
One-stage algorithms, exemplified by the Single Shot Multibox Detector (SSD) and the You Only Look Once (YOLO) network, adopt a different approach. SSD [8] predicts target boxes and categories at different scales on feature maps of various levels. This design enables SSD to achieve a faster detection speed at the potential expense of some detection accuracy. YOLO [9] is another one-stage algorithm that divides the image into a grid and performs object detection directly on each grid, outputting bounding boxes and categories. The YOLO series also exhibits fast detection speed but with relatively lower detection accuracy.
In summary, deep learning algorithms have made significant progress in the field of object detection. Nevertheless, these algorithms are continuously evolving and improving to strike a balance between detection accuracy, speed, and efficiency.
This paper utilizes the YOLOv8 network as the baseline model for implementing the elevator passenger detection task and proposes improvements upon the YOLOv8 network. The main contributions of this study are as follows:
- (1)
- An SCConv improved ConvModule (SC-ConvModule) is proposed by incorporating a spatial and channel reconstruction convolution (SCConv) onto the ConvModule in the YOLOv8 backbone network. This modification aims to alleviate spatial and channel redundancy among features in the convolutional neural network, resulting in model compression and improved performance.
- (2)
- A dual-branch SPP-Fast module is proposed based on the SPP-Fast module in the YOLOv8 network by introducing a soft-pooling technique. The smoothness of the soft-pooling branch enables the dual-branch SPP-Fast module to better preserve information in the feature map, reducing information loss and contributing to improved accuracy in object detection. Additionally, soft-pooling exhibits less sensitivity to the specific position of the target, enhancing the model’s generalization ability to adapt better to variations in target positions.
- (3)
- The soft-pooling and multi-scale convolution CBAM (SPM-CBAM) module proposed in this paper is embedded in the backbone network of YOLOv8, which further enhances the ability of the YOLOv8 network to perceive features at different scales.
2. Related Work
In 2016, Joseph Redmon et al. [9] proposed the YOLOv1 network. This network significantly improved real-time performance and accuracy by unifying the object detection task into a regression problem. Since then, the YOLO series of algorithms have undergone multiple iterations and improvements, becoming a significant presence in the field of object detection.
The innovation of the YOLOv1 network lies in the integration of the object detection task into a single feedforward neural network. In contrast to traditional two-stage detection methods, YOLOv1 adopts an end-to-end approach by simultaneously predicting the bounding box coordinates and class probabilities of the targets within a single network. This not only enhances the real-time performance of object detection but also simplifies the entire detection process. However, YOLOv1 encountered challenges in detecting small objects and background misclassifications, which became focal points for improvement in subsequent versions. To address the issues present in YOLOv1, YOLOv2 [10] introduced the concept of anchor boxes. These predefined bounding box sizes help to better adapt to targets of varying sizes and proportions. Additionally, YOLOv2 adopted a deeper Darknet-19 network architecture and supported multi-scale predictions, enabling the algorithm to better accommodate targets of different sizes. YOLOv3 [11] further improved upon YOLOv2. Firstly, it adopted the deeper Darknet-53 network, enhancing the capability of feature extraction. Secondly, it introduced multi-scale predictions by performing object detection at different levels, thereby improving the algorithm’s adaptability to targets of varying sizes. Additionally, YOLOv3 utilized smaller-sized anchor boxes, significantly enhancing the detection performance for small objects. YOLOv4 [12] represents another significant advancement in the YOLO series, introducing a range of new modules to further enhance performance. The introduction of the cross stage partial network [13] structure optimized feature fusion, the spatial attention module [14] strengthened attention to spatial information, and the path aggregation network contributed to better aggregation of features from different levels. Ref. [15] proposed YOLOX in 2021, consisting of seven versions. Here, we will primarily focus on the improvements made in YOLOX-Darknet53. In the input section, data augmentation is achieved using mosaic and mixup techniques. The neck section employs a feature pyramid network (FPN) for feature fusion. In the prediction section, three decoupled heads are used to enhance accuracy and expedite convergence. The model adopts anchor-free methods to reduce the parameter count. During label assignment, positive samples are initially filtered based on the center point and target box. Subsequently, fine filtering is performed using SimOTA. The loss function is then utilized to calculate the discrepancy between the target box and the predicted box for positive samples.
In addition to major updates in YOLO, many researchers have delved into the study of each version of YOLO. Cao et al. [16] replaced the backbone network of the YOLOv5 network with the GhostConv network. This network successfully reduced the number of network parameters by half without reducing the accuracy of target detection. Niu et al. [17] merged YOLOv8 with context-guided network and residual network (ResNet) structures with multiple branches to enhance the model’s ability to learn deep ResNet features. Su et al. [18] replaced the original YOLOv5 backbone network with the lightweight ShuffleNetv2 to reduce parameters and computational requirements. Additionally, they integrated BiFPN as the feature fusion layer, enhancing the model’s detection capability across various object scales. Furthermore, they employed a CARAFE lightweight upsampling factor to improve the model’s perception of details and small-sized objects and the EIOU loss function to expedite model convergence.
3. Method
3.1. SC-YOLOv8 Network with Soft-Pooling and Attention Mechanism
Building upon the strengths inherited from the previous YOLO series networks, the YOLOv8 network significantly improves the overall detection performance through further optimization of the network structure. It has gained widespread application in various object detection tasks due to its efficient real-time processing and network architecture. The overall structure of the YOLOv8 network can be divided into three parts: the backbone network, the neck network, and the detection head.
The backbone network functions as the feature extraction component, aiming to perform preliminary feature extraction on the input image and generate three different scales of feature maps for subsequent use.
The neck network is located between the backbone network and the detection head, and its role is to combine the feature information of the three feature maps extracted by the backbone network to realize the retention of features and extract more detailed information, and the neck network will output three new feature maps.
The detection head employs the features extracted by the preceding networks to make predictions, producing the final output of the YOLOv8 network.
This paper aims to optimize the feature extraction process of the YOLOv8 backbone network, and consequently, the enhancements to the YOLOv8 network are primarily focused on the backbone network. The modified YOLOv8 network structure proposed in this paper is depicted in Figure 1.

Figure 1.
Structure of SC-YOLOv8 network with soft-pooling and attention.
First, we propose an SC-ConvModule, which reduces spatial and channel redundancy between features during convolution operations by replacing the standard convolution of the ConvModule in the YOLOv8 backbone network with SCConv. Simultaneously, improvements are proposed for the SPP-Fast module in the YOLOv8 network. In the original SPP-Fast module, the use of max-pooling operations may lead to partial loss of local information. To solve this problem, we introduce soft-pooling branches to build a dual-branch SPP-Fast module to fully extract feature information. To further enhance the network performance, we embedded a newly designed SPM-CBAM module in the YOLOv8 backbone network. We improve the CBAM (convolutional block attention mechanism) module by combining a multi-scale depth-separable convolutional kernel and soft-pooling techniques to more effectively regulate channel attention and spatial attention. This innovation aims to enhance the model’s adaptability to different scales and features, thus improving the accuracy and robustness of target detection. In summary, this paper is dedicated to optimizing the feature extraction and attention mechanism of the YOLOv8 network through several module and technique improvements, aiming to achieve a higher level of performance.
3.2. Spatial and Channel Reconstruction Convolution
The background of elevator surveillance images is complex, and the standard convolutional kernel has limitations in processing elevator surveillance images because the standard convolutional kernel operates on the entire input image and fails to focus on specific regions and channels effectively. This convolutional operation suffers from redundancy of spatial and channel information in complex scenes, which, in turn, leads to degradation of model performance. Specifically, the standard convolutional kernel is unable to differentiate between important and minor regions in the image, and is also unable to effectively identify which channels are critical in the image. This results in the model consuming a large amount of computational resources to process unnecessary information when processing elevator surveillance images. Therefore, in this paper, we propose SC-ConvModule by replacing the standard convolution of the ConvModule of the YOLOv8 network using SCConv. As shown in Figure 2, SCConv [19] consists of a spatial reconstruction unit (SRU) and a channel reconstruction unit (CRU). The SRU separates features with rich information from those with less information, then reconstructs them to enhance representative features and reduce spatial redundancy in the input features. On the other hand, CRU employs a split–transform–fuse method to reduce channel redundancy. The combination of SRU and CRU in the SCConv module aims to enhance the adaptability and generalization performance of the YOLOv8 network, particularly in dealing with the challenging background and various interference factors present in elevator surveillance images.
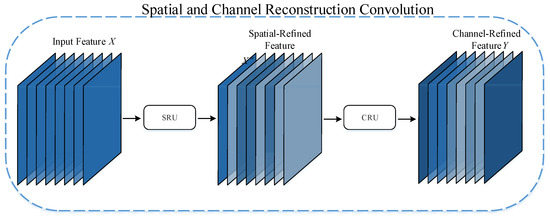
Figure 2.
The architecture of SCConv.
As shown in Figure 3, the SRU reduces spatial redundancy in the input features through separation and reconstruction. The purpose of the separation operation is to separate those feature maps that are rich in spatial information from those with less spatial information. SRU begins by utilizing the scaling factor in the group normalization (GN) layer to assess the information content of different feature maps. The specific calculation of the GN layer is shown in Equation (1).
where X represents the input feature map, and and represent the mean and standard deviation of the feature map X, respectively. is a small positive constant added for the stability of the division. and are trainable affine transformations.

Figure 3.
The architecture of the spatial reconstruction unit.
The trainable parameter in the GN layer is used to measure the spatial pixel variance for each batch and channel. The more spatially rich the information, reflecting larger spatial pixel changes, the larger becomes. The normalized correlation weight of is used to represent the importance of different feature maps, calculated in Equation (2).
where C is the number of channels in the input feature map.
Afterwards, the re-weighted feature map values by are mapped through the sigmoid function to the range and filtered by a threshold. We set weights higher than the threshold to 1 to obtain informative weights . Additionally, weights higher than the threshold are set to 0 to obtain non-informative weights . The specific calculation of is as shown in Equation (3).
Finally, the input feature map X is multiplied by both and , respectively, resulting in the separation of the input feature map X into an information-rich feature map and a redundant feature map with almost no information. The computation of feature maps and is as shown in Equation (4).
where, ⊗ represents element-wise multiplication.
The reconstruction operation involves using a cross-reconstruction method to obtain features maps and by combining an information-rich feature map with an information-poor feature map . Then, the feature maps and are concatenated to obtain the spatially refined feature map . The specific calculations for the reconstruction operation are as shown in Equation (5).
where, represents the split operation along the channel. ⊕ represents element-wise summation. ∪ represents concatenation. and are the feature maps obtained by splitting along the channels, while and are the feature maps obtained by splitting along the channels.
As shown in Figure 4, the CRU is implemented through three operations: split, transform, and fuse. For the feature map processed by SRU, the channels of are first divided into two parts, namely, the channel and the channel, where . Then, a convolution is applied to compress the channels of the feature map. At this point, the feature map is divided into the feature map and the feature map .

Figure 4.
The architecture of the channel reconstruction unit.
For , group convolution and pointwise convolution are employed, and the outputs are summed to obtain the feature map . The specific calculations are as in Equation (6).
where represents the group convolution, and represents the pointwise convolution.
Group convolution can significantly reduce the number of model parameters and the amount of computation [20], but it will cut off the flow of information between channel groups. The cutting off of channel groups causes the network to lose some context information when learning features. To compensate for this loss of information, pointwise convolution is introduced to promote the flow of information between feature channels [21]. Pointwise convolution performs convolution operations on feature channels at each location, which is conducive to the global information transmission between features.
For the feature map , a pointwise convolution is applied to generate a feature map with shallow hidden details. Subsequently, the generated feature map is concatenated with the feature map to obtain the feature map . The specific calculations are as Equation (7).
Next, global average-pooling is used to process and to collect global spatial information with channel statistics. The calculation method is as Equation (8).
where H represents the length of the feature maps and , and W represents the width of the feature maps and .
Then, is stacked with , and a channel-wise soft attention operation is applied to generate the feature importance vectors and . Finally, feature and features are combined to obtain the channel refinement feature Y, guided by the feature importance vectors and . The calculation method is as Equation (9).
3.3. SC-ConvModule
The SC-ConvModule consists of a sequential combination of SCConv, the batch normalization layer, and the sigmoid linear unit (SiLU) activation function, as depicted in Figure 5.
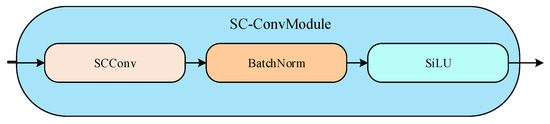
Figure 5.
SC-ConvModule. In SC-ConvModule, the feature map first passes through an SCConv layer for feature extraction and transformation. Immediately after that, the BatchNorm submodule performs batch normalization on the output of the SCConv layer to adjust the distribution of the data, making the model training more stable and efficient. Subsequently, the normalized data enter the SiLU activation function to perform a nonlinear transformation to further increase the expressive power of the model.
SCConv reduces the storage space and computational cost of the YOLOv8 network by reducing the spatial and channel redundancy between features in the convolutional neural network, while improving the accuracy and generalization of the YOLOv8 network for object detection tasks.
SC-ConvModule further improves the stability and convergence speed of the network through the batch normalization layer. Batch normalization improves the stability of model training by performing a normalization operation on the inputs of each batch, i.e., each input is subtracted from the mean of the inputs of that batch and divided by the standard deviation, which keeps the distribution of inputs of each layer of the network small, helps prevent excessive growth or reduction in the gradient, and improves the stability of model training. In addition, batch normalization also reduces the sensitivity to the initialization parameters, making it easier for the neural network to converge to a suitable solution.
SC-ConvModule introduces nonlinear factors through the SiLU activation function layer to enhance the expressive power of the network.The unboundedness and smoothing of the SiLU function prevents the problem of vanishing gradients in neural networks, allowing the network to be more flexible in adapting to different features. In addition, the non-monotonicity of the SiLU function enables it to handle more complex feature mappings, thus helping the network to learn more complex feature representations [22].
The CSP_2Conv module is the result of an improvement to the C3 module of the YOLOv5 network, and the key to this improvement is the introduction of extended efficient layer aggregation networks (ELANs) to effectively avoid the problem of deterioration in the network’s convergence during model scaling. As illustrated in Figure 6, the ELAN structure is a layer-aggregation architecture with an effective gradient propagation path [23]. It optimizes the gradient length of the entire network by utilizing a stack structure within the computation block. When the features are input into the CSP_2Conv module, they first undergo a convolution operation for channel integration, and the integrated feature map has a richer representation. The CSP_2Conv module incorporates parallel bottleneck layer structures, which diverge different dimensional feature map information and then merge them at the end of the module. Consequently, the CSP_2Conv module can obtain richer gradient information, and the backpropagation gradients can be more effectively transmitted to shallower feature maps. This enhances the feature extraction capability of the convolutional neural network while reducing the time consumption of memory access. As the ConvModule is also present within the CSP_2Conv module, it is replaced with the SC-ConvModule. The modified CSP_2Conv module is referred to as the SC-CSP_2Conv module, and its specific structure is illustrated in Figure 7.
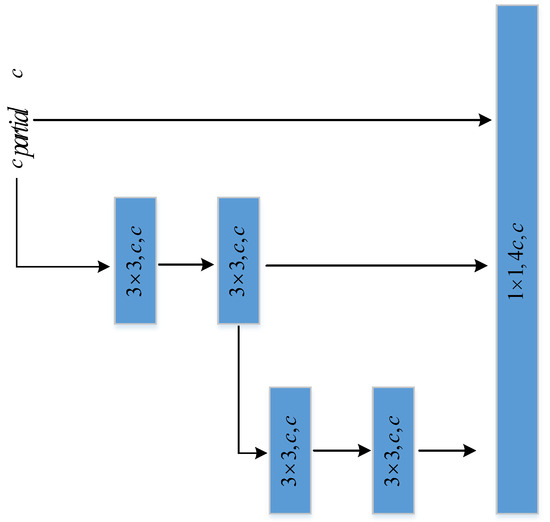
Figure 6.
Structure of ELAN.

Figure 7.
SC-CSP_2Conv module. The feature maps fed into the SC-CSP_2Conv module are first processed by the SC-ConvModule for feature extraction. Subsequently, the feature map processed by SC-ConvModule enters the Split layer, which is divided into multiple parallel channels. The data in these channels are processed by four consecutive SC-Bottleneck layers, and all the output feature maps from SC-Bottleneck are recombined in the Concat layer to form a feature map with multi-channel information. Finally, this merged feature map passes through an SC-ConvModule again for final feature extraction and transformation to obtain the output of the SC-CSP_2Conv module.
In YOLOv8, the bottleneck within the CSP_2Conv module consists of two ConvModules and is augmented with a skip connection, as illustrated in Figure 8a. The primary function of the bottleneck is to propagate low-level feature information [24], enabling effective learning and convergence during the training process, even in the case of a deep network model. It leverages the residual concept, conducting two convolutional operations on the original input to extract features, followed by element-wise addition with the original input. The advantage of the residual concept lies in its ability to preserve the essential features of the original input and mitigate the vanishing gradient problem. The bottleneck employs multiple small convolutional kernels to replace a large convolutional kernel, deepening the network and simultaneously reducing the number of parameters compared to the original structure. This not only enhances the depth of the network but also decreases the overall parameter count. This paper replaces the ConvModule in the bottleneck with the SC-ConvModule. The transformed bottleneck is referred to as the SC-Bottleneck, as illustrated in Figure 8b.

Figure 8.
Bottleneck and SC-Bottleneck.
3.4. Dual-Branch SPP-Fast Module
The SPP-Fast module is an important feature extraction module in the YOLOv8 backbone network, and is called the SPP-Fast module because of its computational speed advantage over the spatial pyramid pooling (SPP) module. The SPP-Fast module is optimized from the SPP module and uses a serial approach to the max-pooling operation and splices the outputs from each location when the last max-pooling is complete. The SPP-Fast module extracts features using only the max-pooling operation, which can lead to the loss of some local information. In the elevator scene, noise adversely affects the local information in the image, while uneven illumination leads to changes in the global features. To address this problem this paper proposes a dual-branch SPP-Fast module by introducing soft-pooling branches in the SPP-Fast module. This modification aims to enhance feature extraction by merging the soft-pooling operations, thus mitigating the potential loss of local information.
In the dual-branch SPP-Fast module, the soft-pooling operation selectively preserves pixels based on the pixel weights in the feature map [25]. Soft-pooling achieves this by obtaining normalized results through the SoftMax function, and then retaining pixels according to the weights of the features. This ensures that more crucial features contribute more significantly, addressing the issue of information loss often associated with max-pooling. Soft-pooling enables the thorough utilization of any activation factor within the pooling kernel, while incurring only a lesser additional computational cost. It not only enhances the network model’s ability to discriminate between similar feature information but also preserves feature information across the entire receptive field during soft-pooling operations. This helps minimize feature information loss during the pooling process, thereby improving the detection accuracy of the algorithm. During backpropagation, soft-pooling accumulates activations in an exponentially weighted manner, facilitating continuous updates to gradient values. The calculation method for soft-pooling is outlined in Equations (10) and (11).
where represents the weight of the candidate region, a represents the weight of the activation mapping, and represents the feature map obtained by multiplying and adding weight with activation mapping . The significance of weights lies in the fact that a larger value indicates a more crucial pixel, increasing the likelihood of its retention. The advantage of soft-pooling lies in its ability to effectively preserve image information even when the number of features is reduced.
As shown in Figure 9, the dual-branch SPP-Fast module proposed in this paper can be divided into two parts: one part comprises the max-pooling branch, while the other part consists of the soft-pooling branch. The specific calculation process is detailed in Equations (12)–(14).
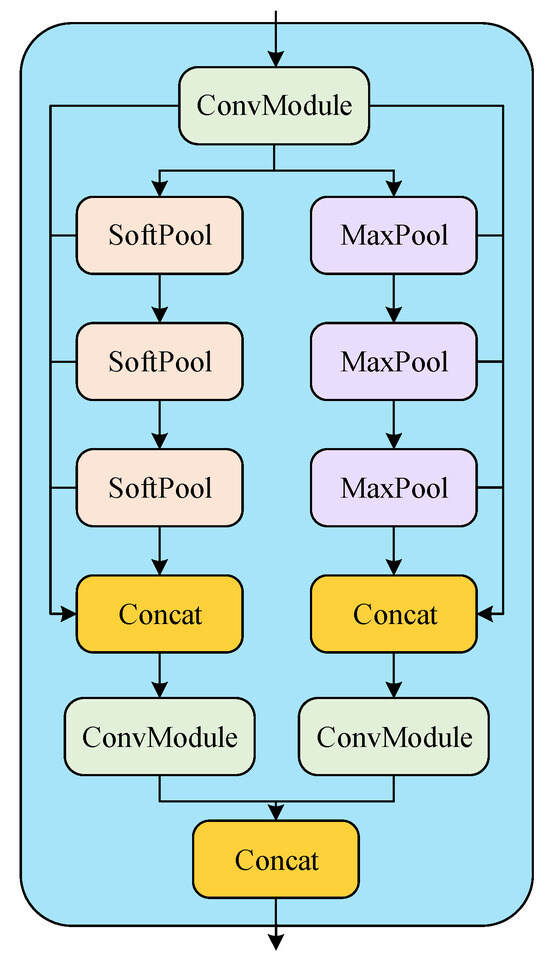
Figure 9.
Structure of dual-branch SPP-Fast.
Here, and represent the outputs of the max-pooling branch and the soft-pooling branch, respectively. represents the output after max-pooling, and represents the output after soft-pooling. represents the standard convolution operation.
3.5. Soft-Pooling and Multi-Scale Convolution CBAM
The visual attention mechanism has significant advantages in the elevator passenger detection task, which can dynamically weight the features of the input image, and, therefore, can help to localize and identify the objects in the image in the object detection task. The CBAM attention mechanism is a typical hybrid attention mechanism that sequentially applies channel attention mechanism (CAM) and spatial attention mechanism (SAM) modules. Compared to using channel attention or spatial attention independently, CBAM can achieve better results [26]. As illustrated in Figure 10, the CBAM attention mechanism takes a given intermediate feature map as input. First, the CAM module aggregates the spatial information of the feature map through operations like average-pooling and max-pooling. Subsequently, the spatial information is processed through a shared multilayer perceptron (Share MLP) to generate a one-dimensional channel attention map . is then element-wise multiplied with the input feature map F, and the channel attention values are broadcast along the spatial dimension to obtain refined features with channel attention. The SAM module processes to generate a spatial attention map . The final output feature is obtained by element-wise multiplication of and . The convolutional module receives the spatial attention map for channel mixing. Finally, the refined features are obtained as output by element-wise multiplication of the channel mixing result with channel priors, as detailed in Equations (15) and (16).
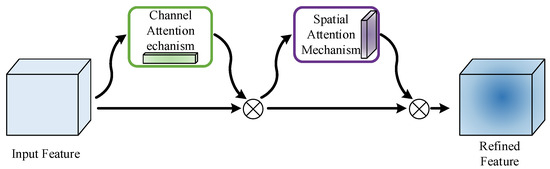
Figure 10.
CBAM attention.
In the CAM module, the processing of the feature map involves the use of average-pooling and max-pooling operations to aggregate spatial information. However, the max-pooling operation overlooks the influence of other elements in the pooling region on the result and, thus, may result in the loss of useful information. On the other hand, the average-pooling operation, while capable of preserving more information of the feature map, can result in the loss of discriminative information due to mutual cancellation of positive and negative activation values. To retain more useful information from the feature map, as shown in Figure 11, this paper introduces soft-pooling operations into the CAM module. This addition aims to preserve more useful information. Assuming the input feature map to the CAM module proposed in this paper is denoted as , the expression for the channel attention feature vector of dimension generated by the CAM module is as Equation (17).
where represents the max-pooling operation, represents the soft-pooling operation, stands for the average-pooling operation, stands for the sigmoid activation function, and stands for the Share MLP operation.
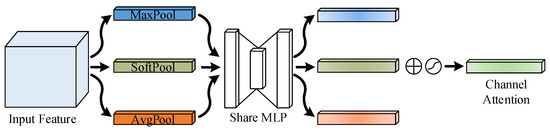
Figure 11.
Channel attention module with soft-pooling.
As depicted in Figure 12, in the SAM module, this paper also incorporates soft-pooling operations. Considering that the SAM module employs a convolutional kernel for feature map processing, which may lead to a uniform spatial attention weight distribution among channels, this paper addresses this by using multi-scale depth-wise separable convolutions instead of the convolutional kernel in the SAM module. The calculation of spatial attention can be described as Equation (18).
where represents depthwise separable convolution, and represents standard convolution.

Figure 12.
Spatial attention module with soft-pooling and multi-scale depth-wise separable convolutions.
4. Experiments
4.1. Experiment Dataset
For the experiments on the elevator passenger detection network, the data samples utilized in this paper primarily originate from a self-constructed elevator passenger dataset. This dataset encompasses individuals of varying ages and genders, dressed in diverse attire. In total, it comprises 6259 images. The dataset is randomly split into training and testing sets in an 8:2 ratio. The training set consists of 5007 image samples, while the testing set comprises 1252 image samples. Some examples of images from the dataset are illustrated in Figure 13.

Figure 13.
Partial example of elevator passenger dataset.
Before training the model, the target objects in the image need to be manually annotated. The data annotation tool used in this article is Labellmg. “person” is used as the annotation name for annotation, and the annotation results are exported as xml files. Xml is a label file, containing label name and label box information. The labellmg annotation interface is shown in Figure 14, and the xml label file style is shown in Figure 15.
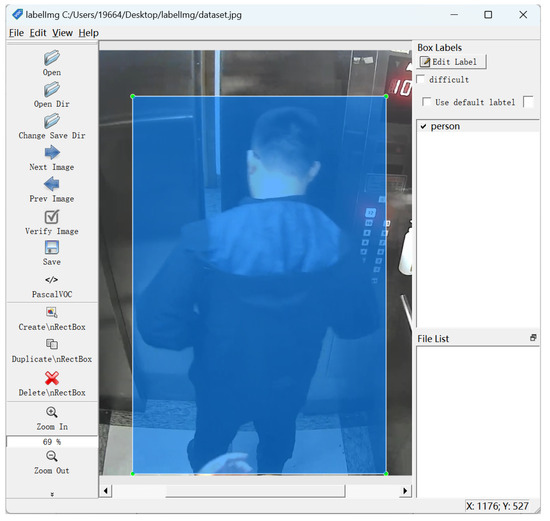
Figure 14.
LabelImg marking interface.
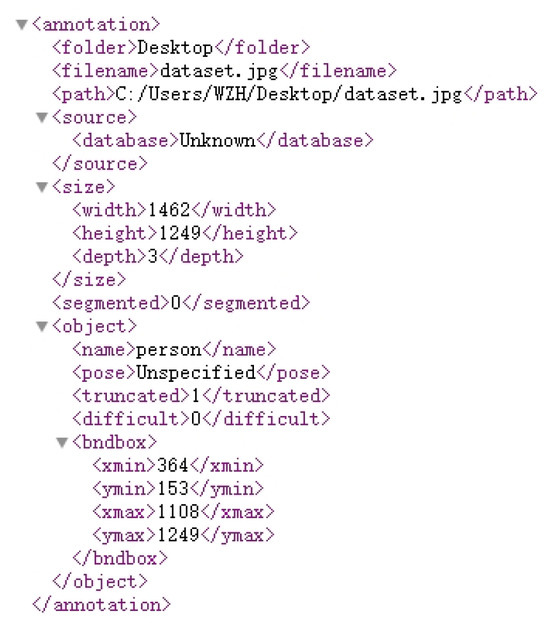
Figure 15.
Tag file format of xml.
In order to enhance the diversity of the dataset and improve the model’s generalization capability, this paper employed data augmentation techniques. The goal was to generate more varied training data, thereby improving the distribution of the data and making the training data more representative. Data augmentation involves various transformations applied to the original data, generating diverse samples that help deep learning models better understand and generalize to different input scenarios, enhancing the model’s adaptability to diverse scenes and complex transformations. This paper utilized various data augmentation techniques, including flipping, brightness variation, contrast variation, adding noise, and image blur. Figure 16 illustrates example images after undergoing the mentioned data augmentation operations, clearly demonstrating the impact of various transformations on the appearance of the images.

Figure 16.
Example of data augmentation.
Flipping is a simple and effective data augmentation method. By horizontally flipping the image, samples with mirror-symmetry to the original image can be generated, allowing the model to better adapt to objects appearing in different orientations. This is particularly useful for handling scenarios such as lens inversion or backlight, enhancing the model’s adaptability to various perspectives. Brightness and contrast variation are two commonly used data augmentation methods. By introducing random brightness and contrast changes to the image, simulations of different lighting conditions are created.The random brightness gain range is 0.3∼2, and the random contrast gain range is −30∼30. This enhances the model’s robustness, enabling accurate object detection under varying lighting environments. This is crucial for addressing situations with significant lighting variations in practical applications. To simulate noise present in real-world scenarios, a data augmentation method involving the addition of noise was introduced. By adding Gaussian noise to the image, the model becomes more robust, capable of handling common interference factors in real-world scenes, improving the model’s generalization performance. The mean value of Gaussian noise is randomly selected between −10 and 10, and the standard deviation is randomly selected between 0 and 30. Image blur can simulate factors such as fast motion, changes in lighting, or suboptimal shooting conditions, helping improve the model’s tolerance to noise by alleviating the impact of noise on the image. We use Gaussian blur technology to blur the dataset, where the blur kernel size is randomly selected among 3, 5, 7, and 9. A larger blur kernel will result in a stronger blur effect, while a smaller blur kernel will produce a slight blur effect. By using blurred images alongside clear images, the data augmentation strategy can significantly increase the quantity of training data, effectively preventing overfitting. This approach is beneficial for enhancing the model’s robustness in different lighting or capture devices, making it more adaptive and resilient.
4.2. Experimental Environment and Parameter Settings
To overcome the massive parameter size and computational demands of deep learning algorithms, we opted for the NVIDIA GeForce RTX 3060 graphics card with 12 GB of video memory. GPU acceleration is achieved through the CUDA parallel computing architecture. In this paper, PyTorch is employed as the deep learning framework, making full use of its flexibility and robust support for GPU-accelerated computations. The experimental environment is shown in Table 1.

Table 1.
Experimental environment.
Considering the limitation of GPU memory, this paper set the batch size for input images to 16. In order to effectively explore the performance of the model, the study selected 250 epochs as the training iteration count. The optimizer of choice was the stochastic gradient descent (SGD) optimizer. The specific experimental parameters are shown in the Table 2. Cosine annealing [27] was employed for learning rate adjustment, starting with an initial learning rate of 0.01 and decaying to a minimum learning rate of 0.0001. Cosine annealing is a way of simulating a cosine function to adjust the learning rate. It is based on the changing law of the cosine function and gradually reduces the learning rate during the training process to achieve better training results. The core idea of this method is to use a relatively large learning rate in the early stages of training in order to converge to a relatively suitable area faster. In the later stages of training, the learning rate is gradually reduced in order to adjust the model parameters more finely to achieve higher accuracy.
Table 2.
Experimental parameter settings.
4.3. Experimental Evaluation Index
This paper evaluated the performance of the object detection model using precision (P), recall (R), and the mean average precision (mAP) as standards. These evaluation metrics provide a comprehensive understanding of the model’s capabilities, allowing for a more thorough assessment of its effectiveness in the object detection task.
Precision refers to the ratio of correctly predicted positive samples to all samples predicted as positive by the model. Its mathematical expression is as Equation (19).
represents true positive, indicating the number of samples correctly predicted as positive by the model, and represents false positive, indicating the number of samples incorrectly predicted as positive by the model. By calculating precision, we can assess the model’s precision in recognizing targets.
Recall is another key evaluation metric used to describe the ratio of correctly predicted samples among all actual positive samples in the entire dataset. Its mathematical expression is as Equation (20).
represents false negative, indicating the number of positive samples that the model failed to predict correctly. Through the evaluation of recall, we gain insight into the model’s coverage of true targets, i.e., its ability to discover all positive samples.
The mean average precision is a comprehensive metric that assesses the model’s ability to predict and locate targets, considering performance differences between different categories. Its calculation method is as Equation (21).
where C represents the number of target categories, and is the average precision for each category. The average precision (AP) is obtained by calculating the area under the precision-recall (P-R) curve. Specifically, for each category, the P-R curve is plotted, and the area under the curve is computed as the average precision for that category. Finally, the mAP is the average of the average precisions for all categories. Introducing mAP allows for a more comprehensive evaluation of the model’s performance in multi-class object detection tasks, considering differences between different categories. This helps in gaining a deeper understanding of the model’s real-world performance, guiding further improvement and optimization.
4.4. Experiment Results
This paper trained the YOLOv8 network and the improved YOLOv8 network on the elevator passenger dataset. The performance of these models was compared through training curves. The red curve in Figure 17 represents the training process of the original YOLOv8 network, while the blue curve represents the model after the proposed improvements. After the initial 75 training epochs, the performance metrics of the improved model were consistently superior to those of the original YOLOv8 model. This indicates that the enhanced network structure can learn task features more quickly and effectively within the same number of training epochs, achieving better performance.

Figure 17.
Training results for YOLOv8 and our network.
As shown in Figure 18, the loss curve during the training process of the improved YOLOv8 network indicates that, in the initial stages of model training, the improved model demonstrates higher learning efficiency with a rapid decrease in the loss curve. As training progresses, the slope of the loss curve gradually decreases, and around 200 training iterations, the model’s learning efficiency tends to saturate. At this point, the loss curve fluctuate slightly around 0.001. Ultimately, the loss curves during training and validation exhibit a stable and accompanying state, indicating that the improved YOLOv8 network demonstrates relatively good performance in terms of parameter adjustment and generalization capabilities. This is particularly beneficial for object detection tasks in practical applications where robustness and precision are crucial. Overall, the proposed improvement strategy effectively enhances the training and generalization performance of the YOLOv8 model.

Figure 18.
Loss curve.
This paper conducted a comparative analysis of the detection performance of the improved YOLOv8 network against advanced object detection networks, such as Faster-RCNN, YOLOv3, YOLOv5, and YOLOv8. The results are presented in Table 3, and the experimental findings indicate that the proposed improved YOLOv8 network achieves a precision of 94.32%. This represents an improvement of 3.9%, 5.18%, 3.96%, and 2.55% over Faster-RCNN, YOLOv3, YOLOv5, and YOLOv8, respectively. The recall and mAP values are 92.17% and 92.95%.
Table 3.
Comparative experiments on the elevator passenger dataset.
Figure 19 and Figure 20 present visualizations of the partial detection results during the testing process. In some selected samples, mutual occlusion among passengers is observed. Both the original YOLOv8 network and the improved YOLOv8 network proposed in this paper accurately regress the bounding boxes of passengers inside the elevator cabin when there is no occlusion, with no instances of missed detections, as shown in the first and second image of the first row. Upon closer inspection, it becomes apparent that the proposed improved network demonstrates more accurate detection under conditions of moderate occlusion, as illustrated in the third image in the first row. In scenarios of severe occlusion and blur, as shown in the first and second image of the second row, the original YOLOv8 network may fail to detect passengers, while the algorithm proposed in this paper continues to perform well in detecting passengers even under heavy occlusion. In summary, applying the proposed improved YOLOv8 network for accurate multi-object detection of passengers in elevator scenarios is feasible. This lays a solid foundation for subsequent tasks, such as passenger tracking and anomaly behavior recognition within elevator cabins.

Figure 19.
YOLOv 8 network visualization results.

Figure 20.
Our network visualization results.
This paper conducted ablation experiments to investigate the contributions of different improvement modules to the performance of the enhanced network model. The results are presented in Table 4. From the experimental findings, it can be observed that introducing the SCConv and the dual-branch SPP-Fast structures into the original YOLOv8 architecture led to certain precision improvements, with increases of 1.09% and 0.32%. Notably, incorporating attention mechanisms resulted in a significant precision improvement, with a gain of 1.14%. This substantiates the effectiveness of the proposed network in this paper.
Table 4.
Comparison of evaluation of each module in the ablation experiment.
To validate the generalization ability of the improved YOLOv8 network in different scenarios, experiments were conducted using the publicly available CrowdHuman dataset [28], which focuses on dense pedestrian scenes. The detailed experimental results are presented in Table 5. From the observations in Table 5, it is evident that the improved YOLOv8 network maintains excellent performance in bounding box regression for pedestrian detection in dense scenes. Compared to Faster-RCNN, YOLOv3, YOLOv5, and YOLOv8, the improved YOLOv8 network exhibits superior performance, highlighting its significant advantage in pedestrian detection within dense scenes.
Table 5.
Comparative experiments on the CrowdHuman dataset.
“Params” and “FLOPs” are two important metrics used in deep learning to evaluate the complexity and computational requirements of neural network models. “Params” typically refers to the number of parameters in a neural network model. The number of parameters is a measure of the complexity of the model and indicates how much information the model can store. “FLOPs” stands for floating point operations, and it measures the computational complexity of a neural network model. FLOPs represent the number of floating-point arithmetic operations that the model performs when processing input data. Params quantify the number of learnable parameters in the model, while FLOPs quantify the computational workload of the model. As shown in Table 6, the proposed improved YOLOv8 network exhibits an increase of 2.3 M parameters and 5.4 B FLOPs relative to the YOLOv8 network. This is primarily attributed to the additional parameters and computational load introduced by the attention mechanism and soft-pooling technique.
Table 6.
Comparison experiment of Params and FLOPs.
5. Conclusions
To achieve precise detection of passengers in elevator scenarios, this paper proposes an SC-YOLOv8 object detection network incorporating soft-pooling and attention mechanisms. By replacing the ConvModule in the YOLOv8 backbone network with SCConv, this network aims to reduce spatial and channel redundancy among features in the convolutional neural network, leading to model compression and enhancing its performance. Additionally, addressing the potential loss of partial local information in the YOLOv8 network’s SPP-Fast module due to relying solely on max-pooling operations, this paper introduces a soft-pooling branch to construct a dual-branch SPP-Fast module. Furthermore, this research embeds the proposed soft-pooling and multi-scale convolution CBAM in the YOLOv8 network, improving the CBAM module by using multi-scale depthwise separable convolution kernels and soft-pooling technology.
Finally, this paper established an elevator passenger dataset and utilized data augmentation techniques to preprocess the dataset. The experiments in this paper were conducted on an elevator passenger dataset, and the results demonstrate that the proposed improved YOLOv8 network achieved an accuracy of 94.32%. The recall rate and mAP (mean average precision) values were 91.17% and 92.95%, respectively. In terms of the “Params” and “FLOPs” metrics, the improved YOLOv8 network values proposed in this paper are 50.4 M and 174.6 B, respectively. These metrics are not significantly increased compared to the YOLOv8 network. In conclusion, the SC-YOLOv8 network based on soft-pooling and attention shows excellent performance in the elevator scenario, providing an effective solution for accurate detection of elevator passengers.
Author Contributions
Data curation, D.F.; funding acquisition, J.C., P.Y., B.F. and D.F.; investigation, Z.W. and J.C.; methodology, Z.W. and J.C.; project administration, P.Y.; resources, J.C. and P.Y.; software, Z.W.; validation, P.Y.; visualization, B.F.; writing—original draft, Z.W.; writing—review and editing, J.C. All authors have read and agreed to the published version of the manuscript.
Funding
This work was substantially supported by the Scientific Research Plan Project of the Zhejiang Provincial Market Supervision Administration:ZC2023080, the Scientific Research Plan Project of the Zhejiang Provincial Market Supervision Administration: ZC2021B075, and the Key Research and Development Program Project of the Huzhou Science and Technology Bureau: 2023ZD2017.
Institutional Review Board Statement
Not applicable.
Informed Consent Statement
Not applicable.
Data Availability Statement
The data are not publicly available due to privacy.
Conflicts of Interest
Da Feng was employed by the company Su Xun Elevator Co., Ltd. The remaining authors declare that the research was conducted in the absence of any commercial or financial relationships that could be construed as a potential conflict of interest.
Abbreviations
The following abbreviations are used in this manuscript:
| ConvModule | Convolution Module |
| SCConv | Spatial and Channel Reconstruction Convolution |
| R-CNN | Region-based Convolutional Neural Network |
| SSD | Single-Shot Multibox Detector |
| YOLO network | You Only Look Once Network |
| SC-ConvModule | SCConv Improved ConvModule |
| SRU | Spatial Reconstruction Unit |
| CRU | Channel Reconstruction Unit |
| CSP_2Conv | Cross Stage Partial Bottleneck With Two Convolutions Module |
| ResNet | Residual Network |
| FPN | Feature Pyramid Network |
| GN layer | Group Normalization |
| SiLU | Sigmoid Linear Unit |
| ELAN | Extended Efficient Layer Aggregation Networks |
| SPP | Spatial Pyramid Pooling |
| CBAM | Convolutional Block Attention Module |
| CAM | Channel Attention Mechanism |
| SAM | Spatial Attention Mechanism |
| SGD | Stochastic Gradient Descent |
| Share MLP | Shared MultiLayer Perceptron |
| P | Precision |
| R | Recall |
| mAP | Mean Average Precision |
| AP | Average Precision |
| P-R curve | Precision-Recall curve |
References
- Chandirasekeran, P.; Shridevi, S. Smart Elevator Obstruction Detection System using Image Classification. Int. J. Adv. Comput. Sci. Appl. 2022, 13, 248654325. [Google Scholar] [CrossRef]
- Zhu, D.; Fang, Y.; Min, Z.; Ho, D.; Meng, M.Q.H. Ocr-rcnn: An accurate and efficient framework for elevator button recognition. IEEE Trans. Ind. Electron. 2021, 69, 582–591. [Google Scholar] [CrossRef]
- Zhao, Z.; Li, S.; Wu, C.; Wei, X. Research on the Rapid Recognition Method of Electric Bicycles in Elevators Based on Machine Vision. Sustainability 2023, 15, 13550. [Google Scholar] [CrossRef]
- Wu, D.; Wu, S.; Zhao, Q.; Zhang, S.; Qi, J.; Hu, J.; Lin, B. Computer vision-based intelligent elevator information system for efficient demand-based operation and optimization. J. Build. Eng. 2024, 81, 108126. [Google Scholar] [CrossRef]
- Girshick, R.; Donahue, J.; Darrell, T.; Malik, J. Rich feature hierarchies for accurate object detection and semantic segmentation. In Proceedings of the IEEE Conference on Computer Vision and Pattern Recognition, Columbus, OH, USA, 3–28 June 2014; pp. 580–587. [Google Scholar]
- Girshick, R. Fast r-cnn. In Proceedings of the IEEE International Conference on Computer Vision, Santiago, Chile, 7–13 December 2015; pp. 1440–1448. [Google Scholar]
- Ren, S.; He, K.; Girshick, R.; Sun, J. Faster r-cnn: Towards real-time object detection with region proposal networks. Adv. Neural Inf. Process. Syst. 2015, 28, 1137–1149. [Google Scholar] [CrossRef] [PubMed]
- Liu, W.; Anguelov, D.; Erhan, D.; Szegedy, C.; Reed, S.; Fu, C.Y.; Berg, A.C. Ssd: Single shot multibox detector. In Proceedings of the Computer Vision—ECCV 2016: 14th European Conference, Amsterdam, The Netherlands, 11–14 October 2016; Proceedings, Part I 14. Springer: Berlin/Heidelberg, Germany, 2016; pp. 21–37. [Google Scholar]
- Redmon, J.; Divvala, S.; Girshick, R.; Farhadi, A. You only look once: Unified, real-time object detection. In Proceedings of the IEEE Conference on Computer Vision and Pattern Recognition, Las Vegas, NV, USA, 27–30 June 2016; pp. 779–788. [Google Scholar]
- Redmon, J.; Farhadi, A. YOLO9000: Better, faster, stronger. In Proceedings of the IEEE Conference on Computer Vision and Pattern Recognition, Honolulu, HI, USA, 21–26 July 2017; pp. 7263–7271. [Google Scholar]
- Redmon, J.; Farhadi, A. Yolov3: An incremental improvement. arXiv 2018, arXiv:1804.02767. [Google Scholar]
- Bochkovskiy, A.; Wang, C.Y.; Liao, H.Y.M. Yolov4: Optimal speed and accuracy of object detection. arXiv 2020, arXiv:2004.10934. [Google Scholar]
- Wang, C.Y.; Liao, H.Y.M.; Wu, Y.H.; Chen, P.Y.; Hsieh, J.W.; Yeh, I.H. CSPNet: A new backbone that can enhance learning capability of CNN. In Proceedings of the IEEE/CVF Conference on Computer Vision and Pattern Recognition Workshops, Seattle, WA, USA, 14–19 June 2020; pp. 390–391. [Google Scholar]
- Zhao, X.; Chen, Y.; Guo, J.; Zhao, D. A spatial-temporal attention model for human trajectory prediction. IEEE CAA J. Autom. Sin. 2020, 7, 965–974. [Google Scholar] [CrossRef]
- Ge, Z.; Liu, S.; Wang, F.; Li, Z.; Sun, J. Yolox: Exceeding yolo series in 2021. arXiv 2021, arXiv:2107.08430. [Google Scholar]
- Cao, J.; Bao, W.; Shang, H.; Yuan, M.; Cheng, Q. GCL-YOLO: A GhostConv-Based Lightweight YOLO Network for UAV Small Object Detection. Remote Sens. 2023, 15, 4932. [Google Scholar] [CrossRef]
- Niu, Y.; Cheng, W.; Shi, C.; Fan, S. YOLOv8-CGRNet: A Lightweight Object Detection Network Leveraging Context Guidance and Deep Residual Learning. Electronics 2024, 13, 43. [Google Scholar] [CrossRef]
- Qin, B.; Zeng, Y.; Wang, X.; Peng, J.; Li, T.; Wang, T.; Qin, Y. Lightweight DB-YOLO Facemask Intelligent Detection and Android Application Based on Bidirectional Weighted Feature Fusion. Electronics 2023, 12, 4936. [Google Scholar] [CrossRef]
- Li, J.; Wen, Y.; He, L. SCConv: Spatial and Channel Reconstruction Convolution for Feature Redundancy. In Proceedings of the IEEE/CVF Conference on Computer Vision and Pattern Recognition, Vancouver, BC, Canada, 17–24 June 2023; pp. 6153–6162. [Google Scholar]
- Su, Z.; Fang, L.; Kang, W.; Hu, D.; Pietikäinen, M.; Liu, L. Dynamic group convolution for accelerating convolutional neural networks. In Proceedings of the Computer Vision—ECCV 2020: 16th European Conference, Glasgow, UK, 23–28 August 2020; Proceedings, Part VI 16. Springer: Berlin/Heidelberg, Germany, 2020; pp. 138–155. [Google Scholar]
- Mazumder, P.; Singh, P.; Namboodiri, V. CPWC: Contextual Point Wise Convolution for Object Recognition. In Proceedings of the ICASSP 2020—2020 IEEE International Conference on Acoustics, Speech and Signal Processing (ICASSP), Barcelona, Spain, 4–8 May 2020; pp. 4152–4156. [Google Scholar] [CrossRef]
- Tanaka, M. Weighted sigmoid gate unit for an activation function of deep neural network. Pattern Recognit. Lett. 2020, 135, 354–359. [Google Scholar] [CrossRef]
- Bao, Q.; Liu, Y.; Gang, B.; Yang, W.; Liao, Q. SCTANet: A spatial attention-guided CNN-transformer aggregation network for deep face image super-resolution. IEEE Trans. Multimed. 2023, 25, 8554–8565. [Google Scholar] [CrossRef]
- Hou, Q.; Zhou, D.; Feng, J. Coordinate attention for efficient mobile network design. In Proceedings of the IEEE/CVF Conference on Computer Vision and Pattern Recognition, Nashville, TN, USA, 20–25 June 2021; pp. 13713–13722. [Google Scholar]
- Stergiou, A.; Poppe, R.; Kalliatakis, G. Refining activation downsampling with SoftPool. In Proceedings of the IEEE/CVF International Conference on Computer Vision, Montreal, QC, Canada, 10–17 October 2021; pp. 10357–10366. [Google Scholar]
- Wang, W.; Tan, X.; Zhang, P.; Wang, X. A CBAM based multiscale transformer fusion approach for remote sensing image change detection. IEEE J. Sel. Top. Appl. Earth Obs. Remote Sens. 2022, 15, 6817–6825. [Google Scholar] [CrossRef]
- Cazenave, T.; Sentuc, J.; Videau, M. Cosine annealing, mixnet and swish activation for computer Go. In Advances in Computer Games; Springer: Berlin/Heidelberg, Germany, 2021; pp. 53–60. [Google Scholar]
- Shao, S.; Zhao, Z.; Li, B.; Xiao, T.; Yu, G.; Zhang, X.; Sun, J. Crowdhuman: A benchmark for detecting human in a crowd. arXiv 2018, arXiv:1805.00123. [Google Scholar]


Disclaimer/Publisher’s Note: The statements, opinions and data contained in all publications are solely those of the individual author(s) and contributor(s) and not of MDPI and/or the editor(s). MDPI and/or the editor(s) disclaim responsibility for any injury to people or property resulting from any ideas, methods, instructions or products referred to in the content. |
© 2024 by the authors. Licensee MDPI, Basel, Switzerland. This article is an open access article distributed under the terms and conditions of the Creative Commons Attribution (CC BY) license (https://creativecommons.org/licenses/by/4.0/).