Article

Bounding Volume Hierarchy-Assisted Fast SAR Image Simulation Based on Spatial Segmentation

1
Institute of Geospatial Information, Information Engineering University, Zhengzhou 450001, China
2
Henan Jingwei Beidou Navigation Technology Co., Ltd., Zhengzhou 450001, China
*
Author to whom correspondence should be addressed.
Appl. Sci. 2024, 14(8), 3340; https://doi.org/10.3390/app14083340
Submission received: 10 March 2024 / Revised: 29 March 2024 / Accepted: 2 April 2024 / Published: 16 April 2024
(This article belongs to the Special Issue Advances in Radar Imaging and Signal Processing)

Abstract

:
In order to improve the simulation efficiency under the premise of ensuring the fidelity of synthetic aperture radar (SAR) simulation images, we propose a BVH-assisted fast SAR image simulation method based on spatial segmentation. The beam scanning model is established based on RD imaging geometric relation, and the bounding volume hierarchy (BVH) algorithm is used to assist in obtaining the time-varying latticed radiation and shadow areas within the radar beam, combining them with the real-time position of the sensors to complete the simulation of the electromagnetic (EM) wave transmission. The ray tracing algorithm is used to calculate the multiple backscatter fields of EM waves, including various material properties of the target surface. The SAR spatial traversal is adopted to spatially segment the latticed radiation area, and the compute unified device architecture (CUDA) kernel function is designed using the echo matrix cell method to make each cell of the target echo matrix as a subfield of the backscattering field, and the position of the echo matrix cell is traversed to obtain the target backscattering field. The target simulated echo is processed by the range Doppler (RD) imaging algorithm to obtain the SAR-simulated image. The simulation results show that compared with a CPU single-thread simulation, the simulation speed of the proposed method is significantly improved, and the SAR simulation image has high structural similarity with the real image, which fully verifies the effectiveness of the proposed method.

1. Introduction

SAR is an active and high-resolution microwave imaging sensor that has been widely used in military and civilian applications [1,2]. At present, it is time consuming and laborious to obtain some typical target SAR images by actual measurement means, and with the help of SAR image simulation technology, SAR simulated images with different imaging parameters can be obtained in a computerized virtual environment, which has a very high application value [3].
Current SAR image simulation methods can be broadly categorized into two types: physical mechanism-driven forward simulation and data-driven inverse simulation-based. The physical mechanism-driven forward simulation method builds a SAR image simulation model based on the scattering mechanism and signal propagation of radar, which can simulate the SAR image of a real target or scene, but the computational complexity is high and requires more computational resources. Stefan Auer et al. developed a SAR image simulator for 3D targets that effectively modeled the effects of multiple scattering of EM waves occurring with complex targets or scenes, which is still widely used today [4,5,6]. Franceschetti’s team proposed a series of SAR image simulation methods for urban building targets, achieved better simulation results, and developed a set of 3D target SAR image simulators [7,8,9]. Lu et al. used the GPU multi-threaded parallel to transmit EM waves into the simulation scene and utilized ray tracing algorithms to map the 3D target directly to the SAR slant range coordinate system to quickly generate the target SAR simulation image [10]. Xia et al. proposed a SAR image simulation method for urban structures based on incremental length diffraction coefficients (ILDCs) and shooting and bouncing rays (SBRs) and performed SAR image simulation for building models with sloped and flat roofs, respectively [11]. Dong et al. used a combination of physical optics (POs), geometrical optics (GOs), and the physical theory of diffraction (PTD) for target backscatter field calculations, which were then combined with the frequency domain pulsed coherence method for echo simulation and imaging processing [12]. Drozdowicz open-sourced a basic echo-based SAR image simulation infrastructure designed to facilitate collaboration on SAR image simulator development among interested researchers [13]. Chiang et al. combined POs and GOs to carry out the target multiple backscatter field calculation, combined them with the frequency domain echo model to generate the original echo signals, acquired the tank SAR data set by focusing imaging processing, and achieved better simulation results [14]. Wu et al. based on the physical illumination model of high-frequency ray theory, carried out the echo-based SAR image simulation on a typical military target to achieve some good simulation results, and then a fast simulation architecture based on the CUDA was established to effectively improve the efficiency of the SAR image simulation [15,16]. Balz et al. utilized an improved physical illumination model to simulate the SAR image of a 3D scene and used the GPU to simulate the multiple scattering effects of the EM wave in multi-thread parallel, achieving a good result and better simulation results [17].
Compared with the physical mechanism-driven forward simulation method, the data-driven inverse simulation method simplifies the backscatter field calculation process to a certain extent, mostly utilizing the existing SAR image data as a known backscatter coefficient matrix to participate in the echo simulation and then performing two-dimensional focusing imaging processing on the generated echo signal. The phase of the echo signals generated by this type of method is misaligned, and most of the existing studies have been carried out to improve the simulation efficiency based on the inverse simulation method. Some representative studies have been presented successively. Zhang et al. based on the CUDA platform used multi-thread parallel echo simulations on the targets constituting scene lattices and simultaneously generated master and slave images to obtain interferometric SAR raw data [18]. Zhu et al. proposed an effective simulation method for the raw echo signals of missile-borne SAR, which splits the scene into a number of data blocks along the azimuthal trajectory, and then uses GPU multi-threads to simulate each data block in parallel, which greatly accelerates the simulation speed of the raw echo signals [19]. Chen et al. proposed an airborne bistatic SAR echo simulator based on multi-GPUs, which effectively improves the simulation echo simulation speed [20]. Sheng et al. used the existing SAR amplitude image as a backscatter coefficient matrix to bring it into the echo model and based it on the CUDA platform to implement the parallel echo simulation task for the used discrete units and subsequently proposed a local optimization algorithm to further improve the simulation efficiency [21,22]. Zhang et al. proposed a time domain SAR raw data simulation method based on multi-GPUs, which cannot only simulate a large area of raw data through task division and scheduling but also improve the efficiency of current GPU-based algorithms through access conflict optimization and fine-grained parallel pipelines [23]. Xu et al. designed and implemented a multi-FPGA parallel computing-based SAR real-time echo simulator to verify the correctness of the validity through the natural scene target imaging results of point targets [24]. Zhang et al. proposed a CPU/GPU collaborative SAR raw data simulation method in the time domain and conducted CPU/GPU collaborative simulation fine-grained task partitioning and scheduling experiments, which obtained a better-accelerated simulation result [25]. Zhang et al. briefly introduced the multi-mode synthetic aperture radar simulation framework and proposed a SAR raw data simulation method to assist the development strategy of the Gaofen-3 and its ground processing system [26].
Most of the above proposed methods are centered around a single aspect of SAR image simulation efficiency or fidelity and have achieved good simulation results. Most of the existing fast SAR image simulation methods choose to default the target backscatter coefficient to a fixed value within the corresponding synthetic aperture time under the plane wave assumption. Using the incident plane at the beam center as the phase reference plane cannot generate the real azimuthal Doppler phase history, which still needs to be phase corrected, but the amplitude of the fixed backscatter coefficient does not match the corrected phase. In addition, the methods mentioned above cannot effectively record the sidelobe signal within the 3db beamwidth and do not fully consider the SAR phase reference system characteristics, simplifying the SAR echo simulation process, and can only meet the needs of low- or medium-resolution SAR image simulation applications. For high-resolution SAR image simulation, the Doppler bandwidth is large, the synthetic aperture time during the process of the target from entering the radar beam to leaving becomes longer, the azimuth angle of the incident EM wave changes, and the information contained in the echo signal, such as the amplitude, phase, polarization, frequency, and so on, is also changing all the time, and it increases the difficulty of reproducing the time-varying backscatter coefficient of the target that are dynamically recorded by pulse repetition time. Improving the simulation efficiency under the premise of ensuring the fidelity of SAR simulation images is still an urgent problem and a hot issue for never-ending iterative research.
To address the aforementioned limitations, we propose a BVH-assisted fast SAR image simulation method based on spatial segmentation, which can effectively meet these demands. The method takes into account the time varying of the target backscatter coefficient within the corresponding synthetic aperture time and builds a fast simulation architecture, including the EM wave transmission simulation and multiple backscatter field computation. Based on the spatial segmentation theory and using the echo matrix cell method to design an efficient CUDA kernel function, each echo matrix cell is regarded as a subfield of the total backscatter field, and the two-dimensional envelope window corresponding to each cell is used as a constraint to remove the incoherent lattices in each latticed block, which can effectively reduce the workload of each thread to perform the task. Based on the CUDA platform, the target backscatter field can be quickly obtained by traversing the full echo matrix cell in parallel, and the simulated echo is processed by the RD imaging algorithm to obtain the target SAR simulated image.
The main contributions of this paper are as follows:
(1)
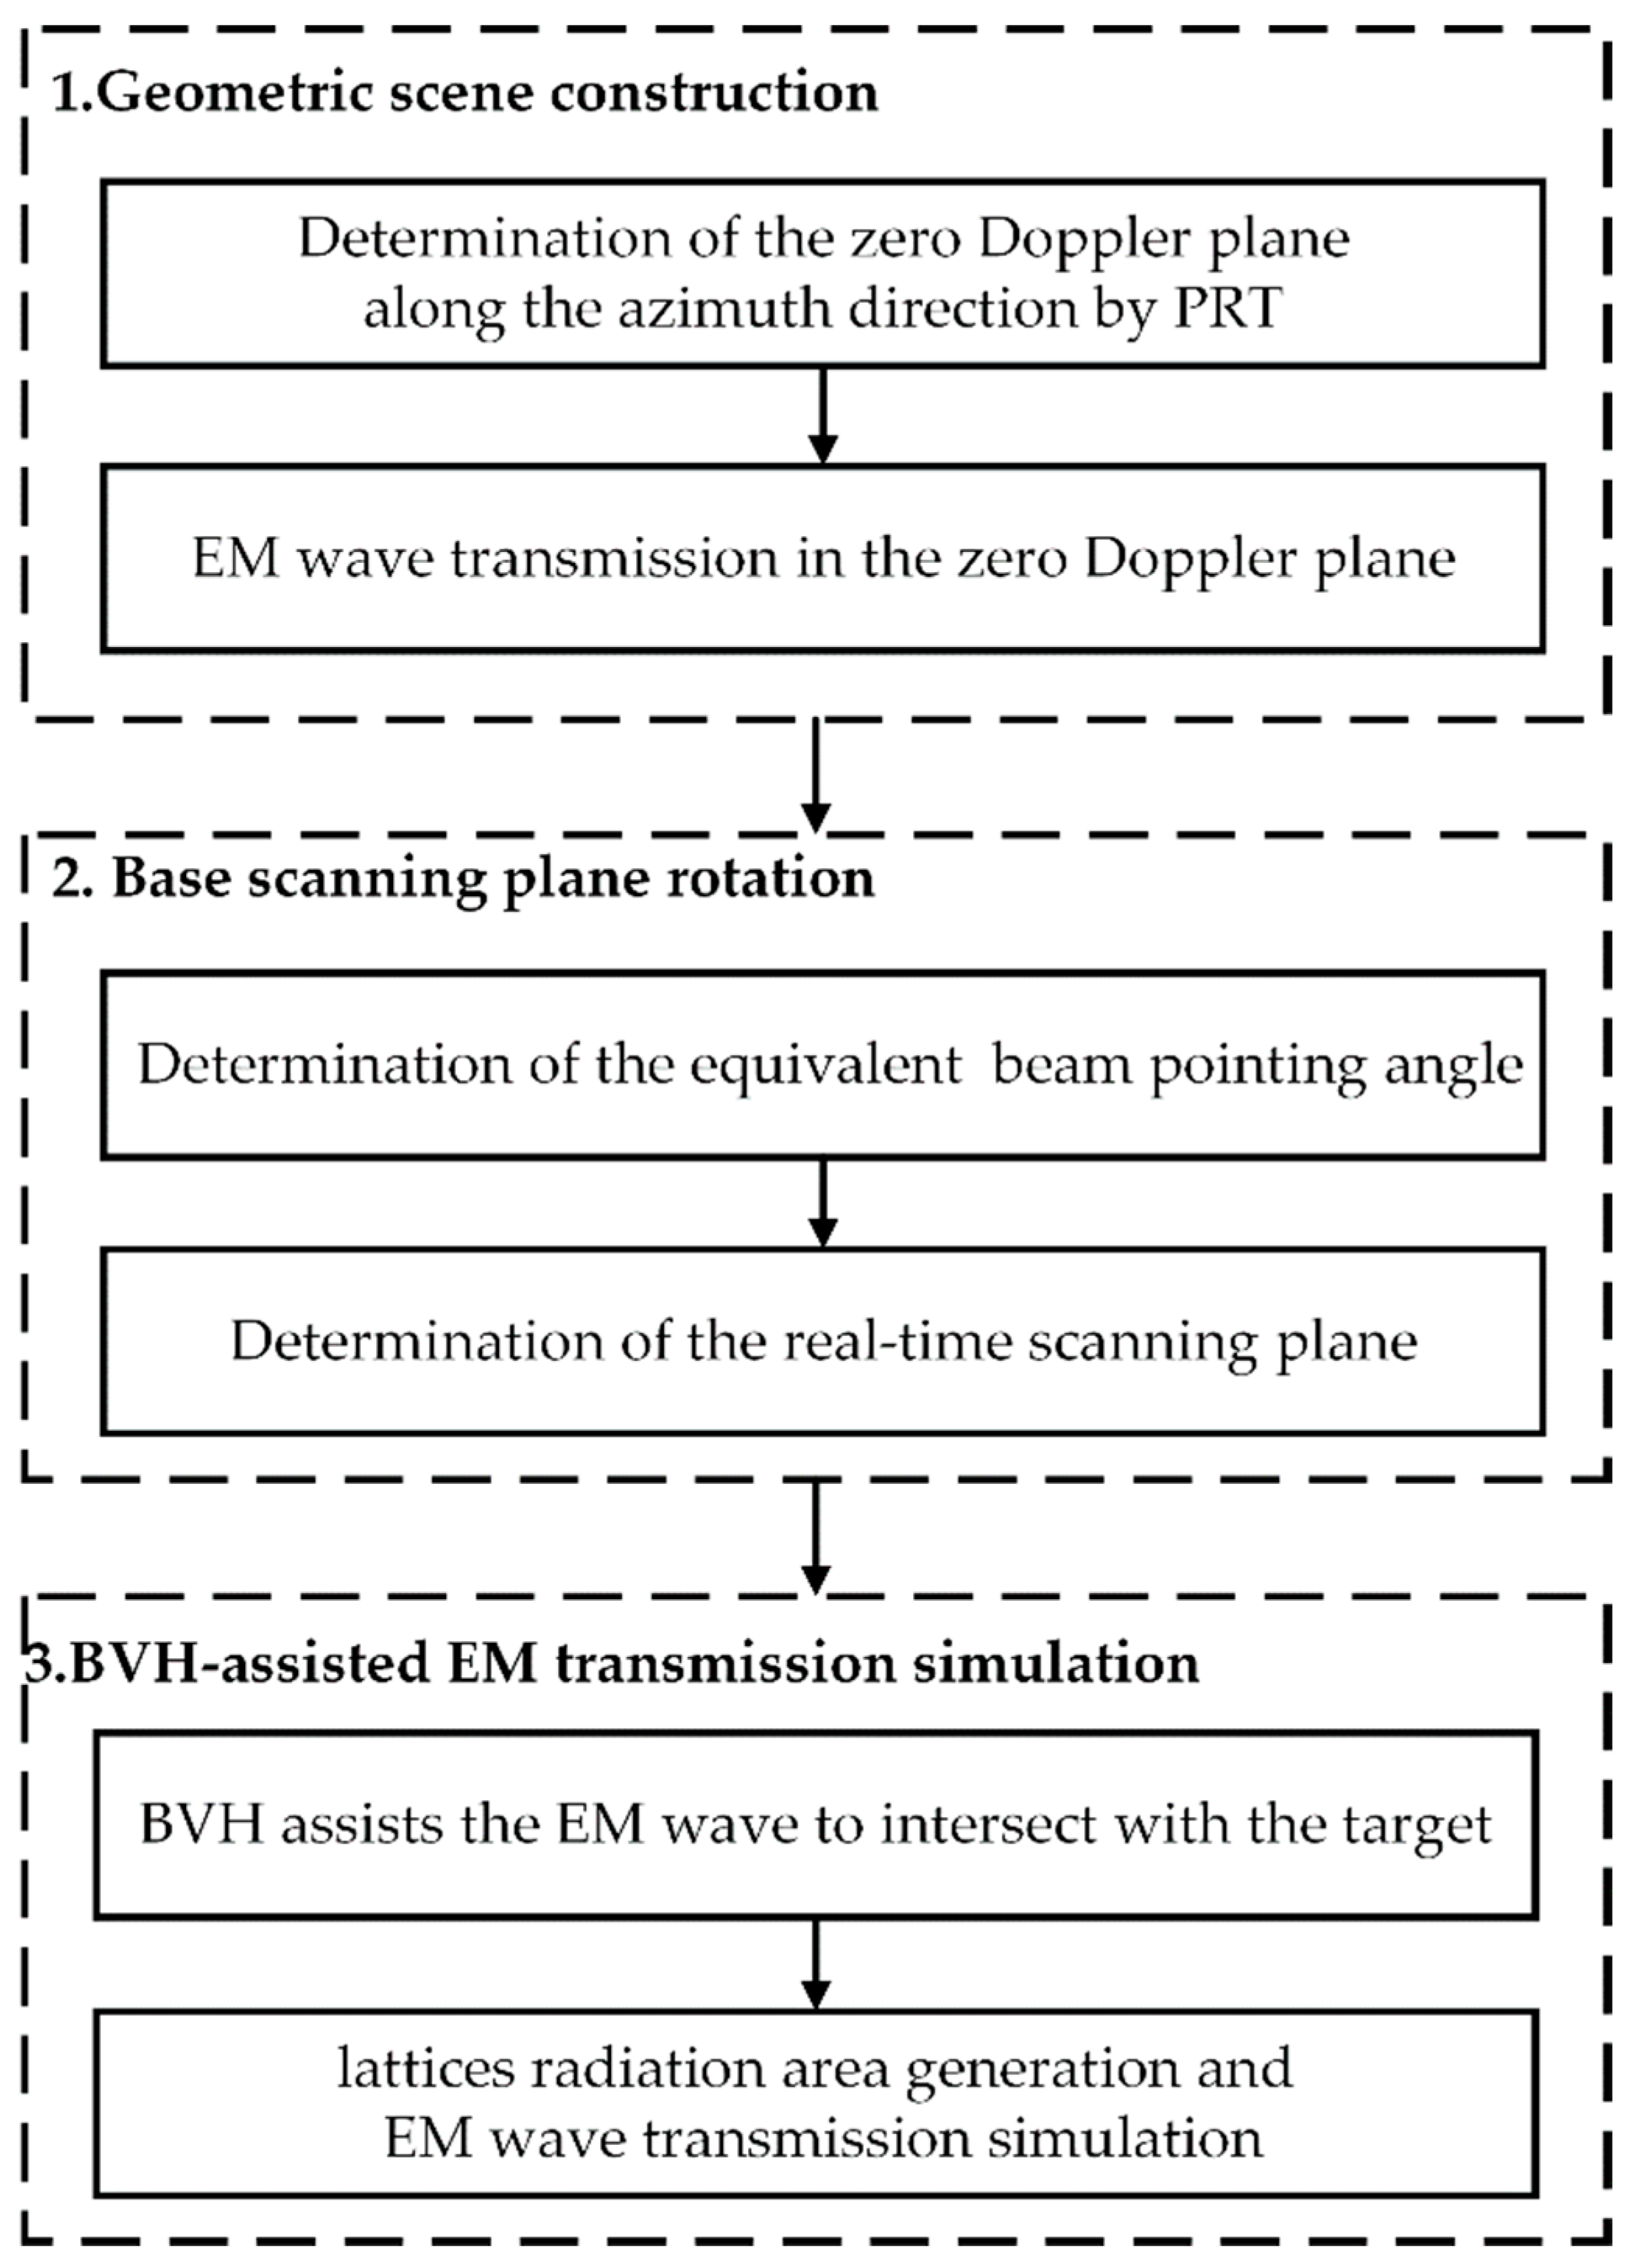
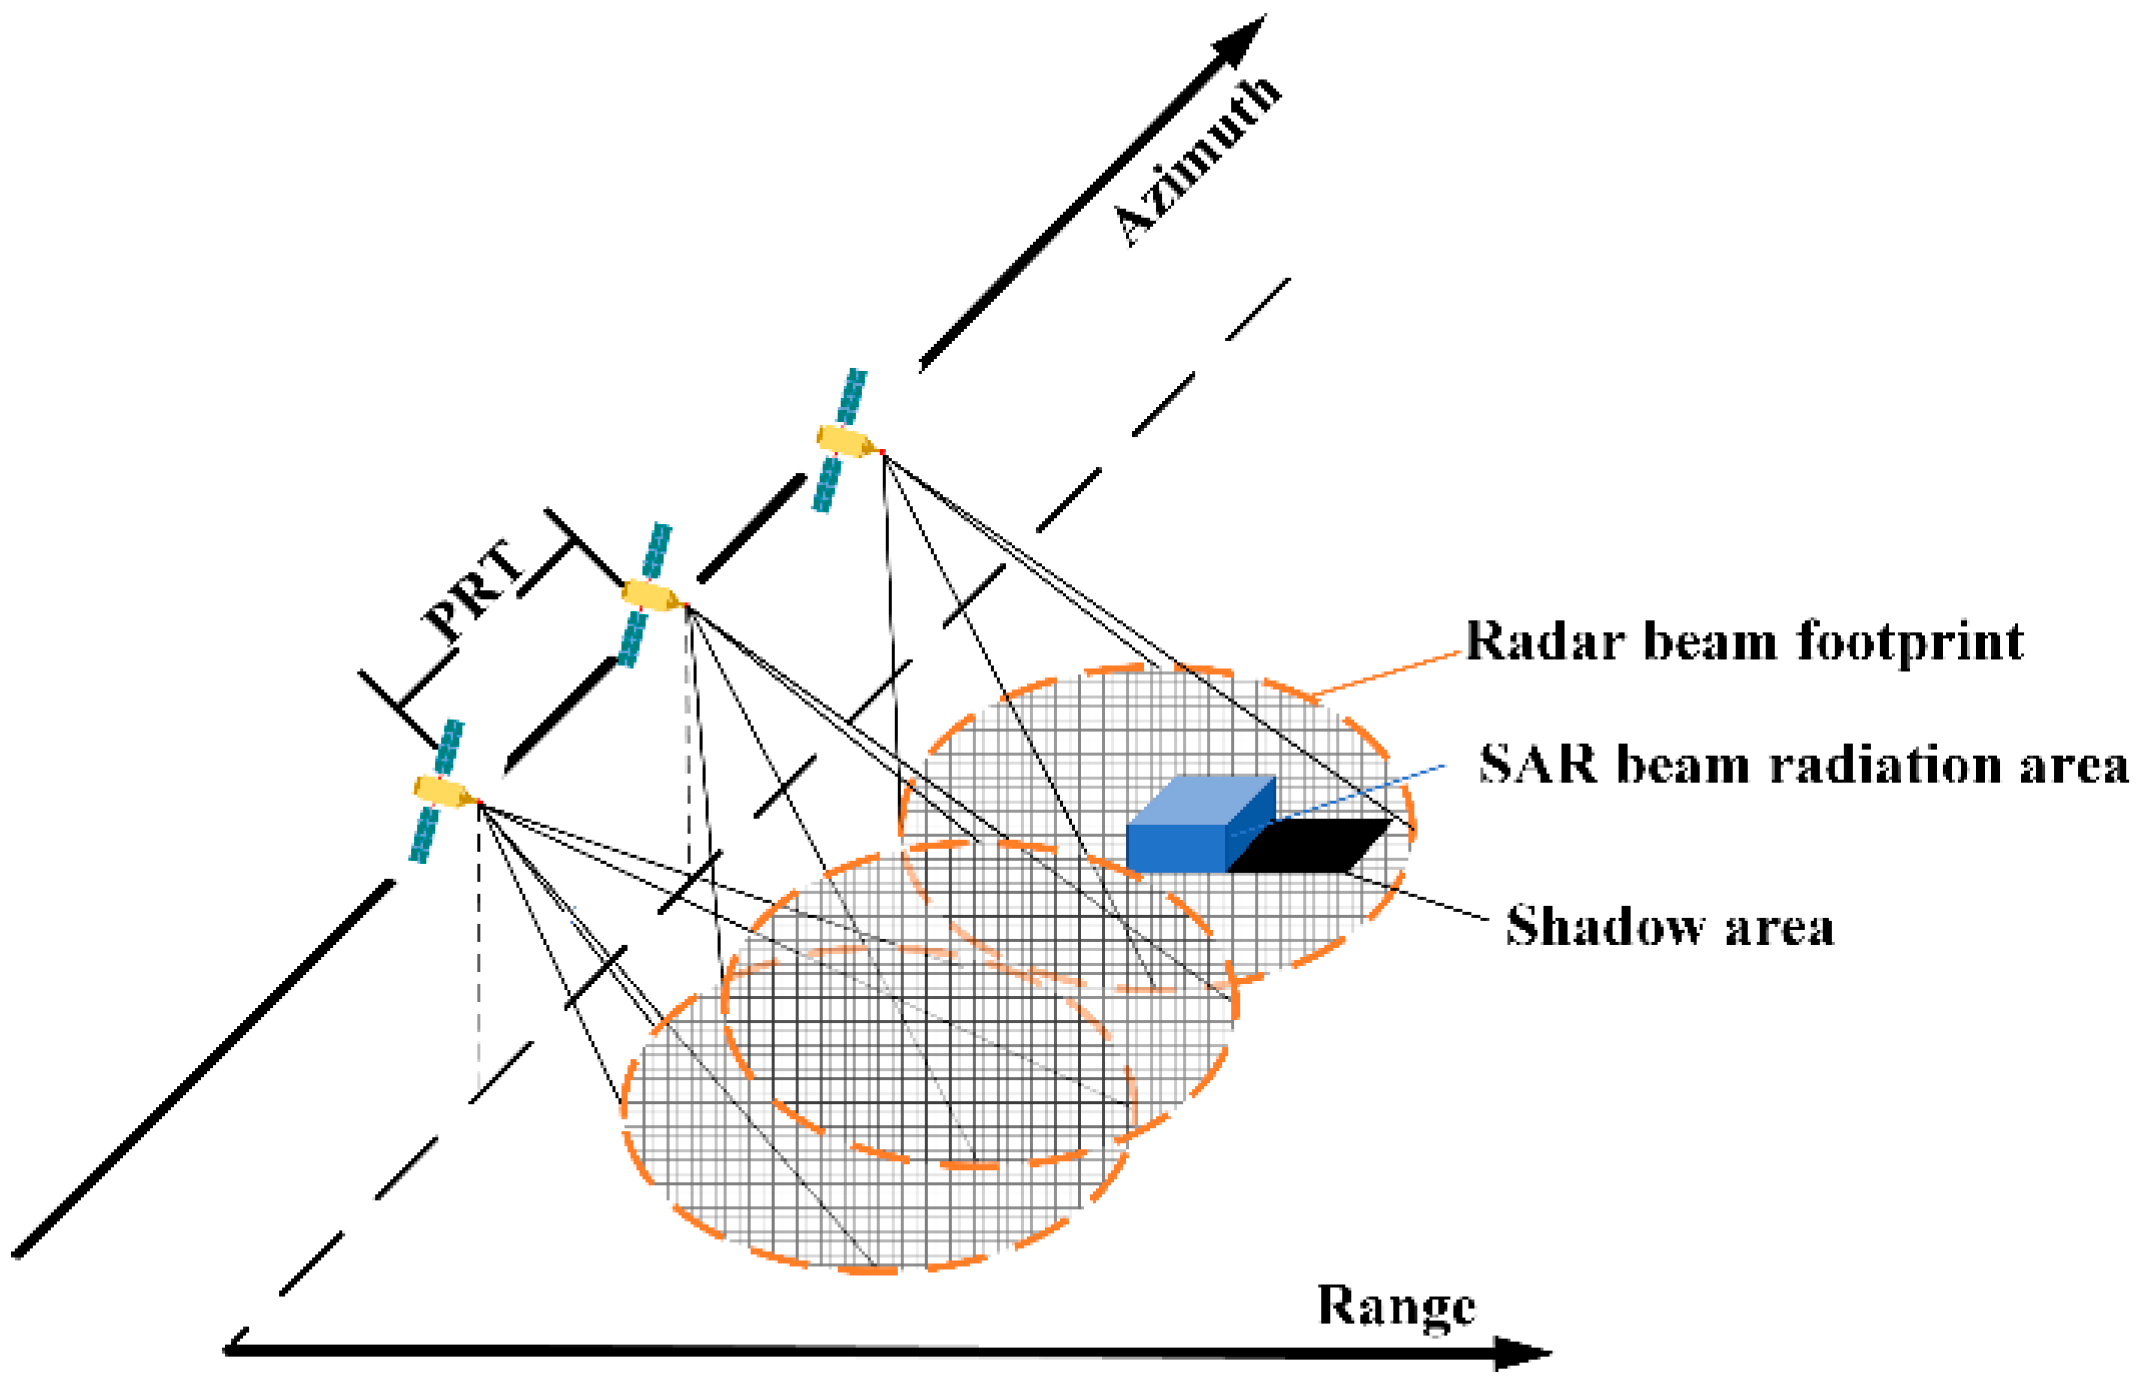
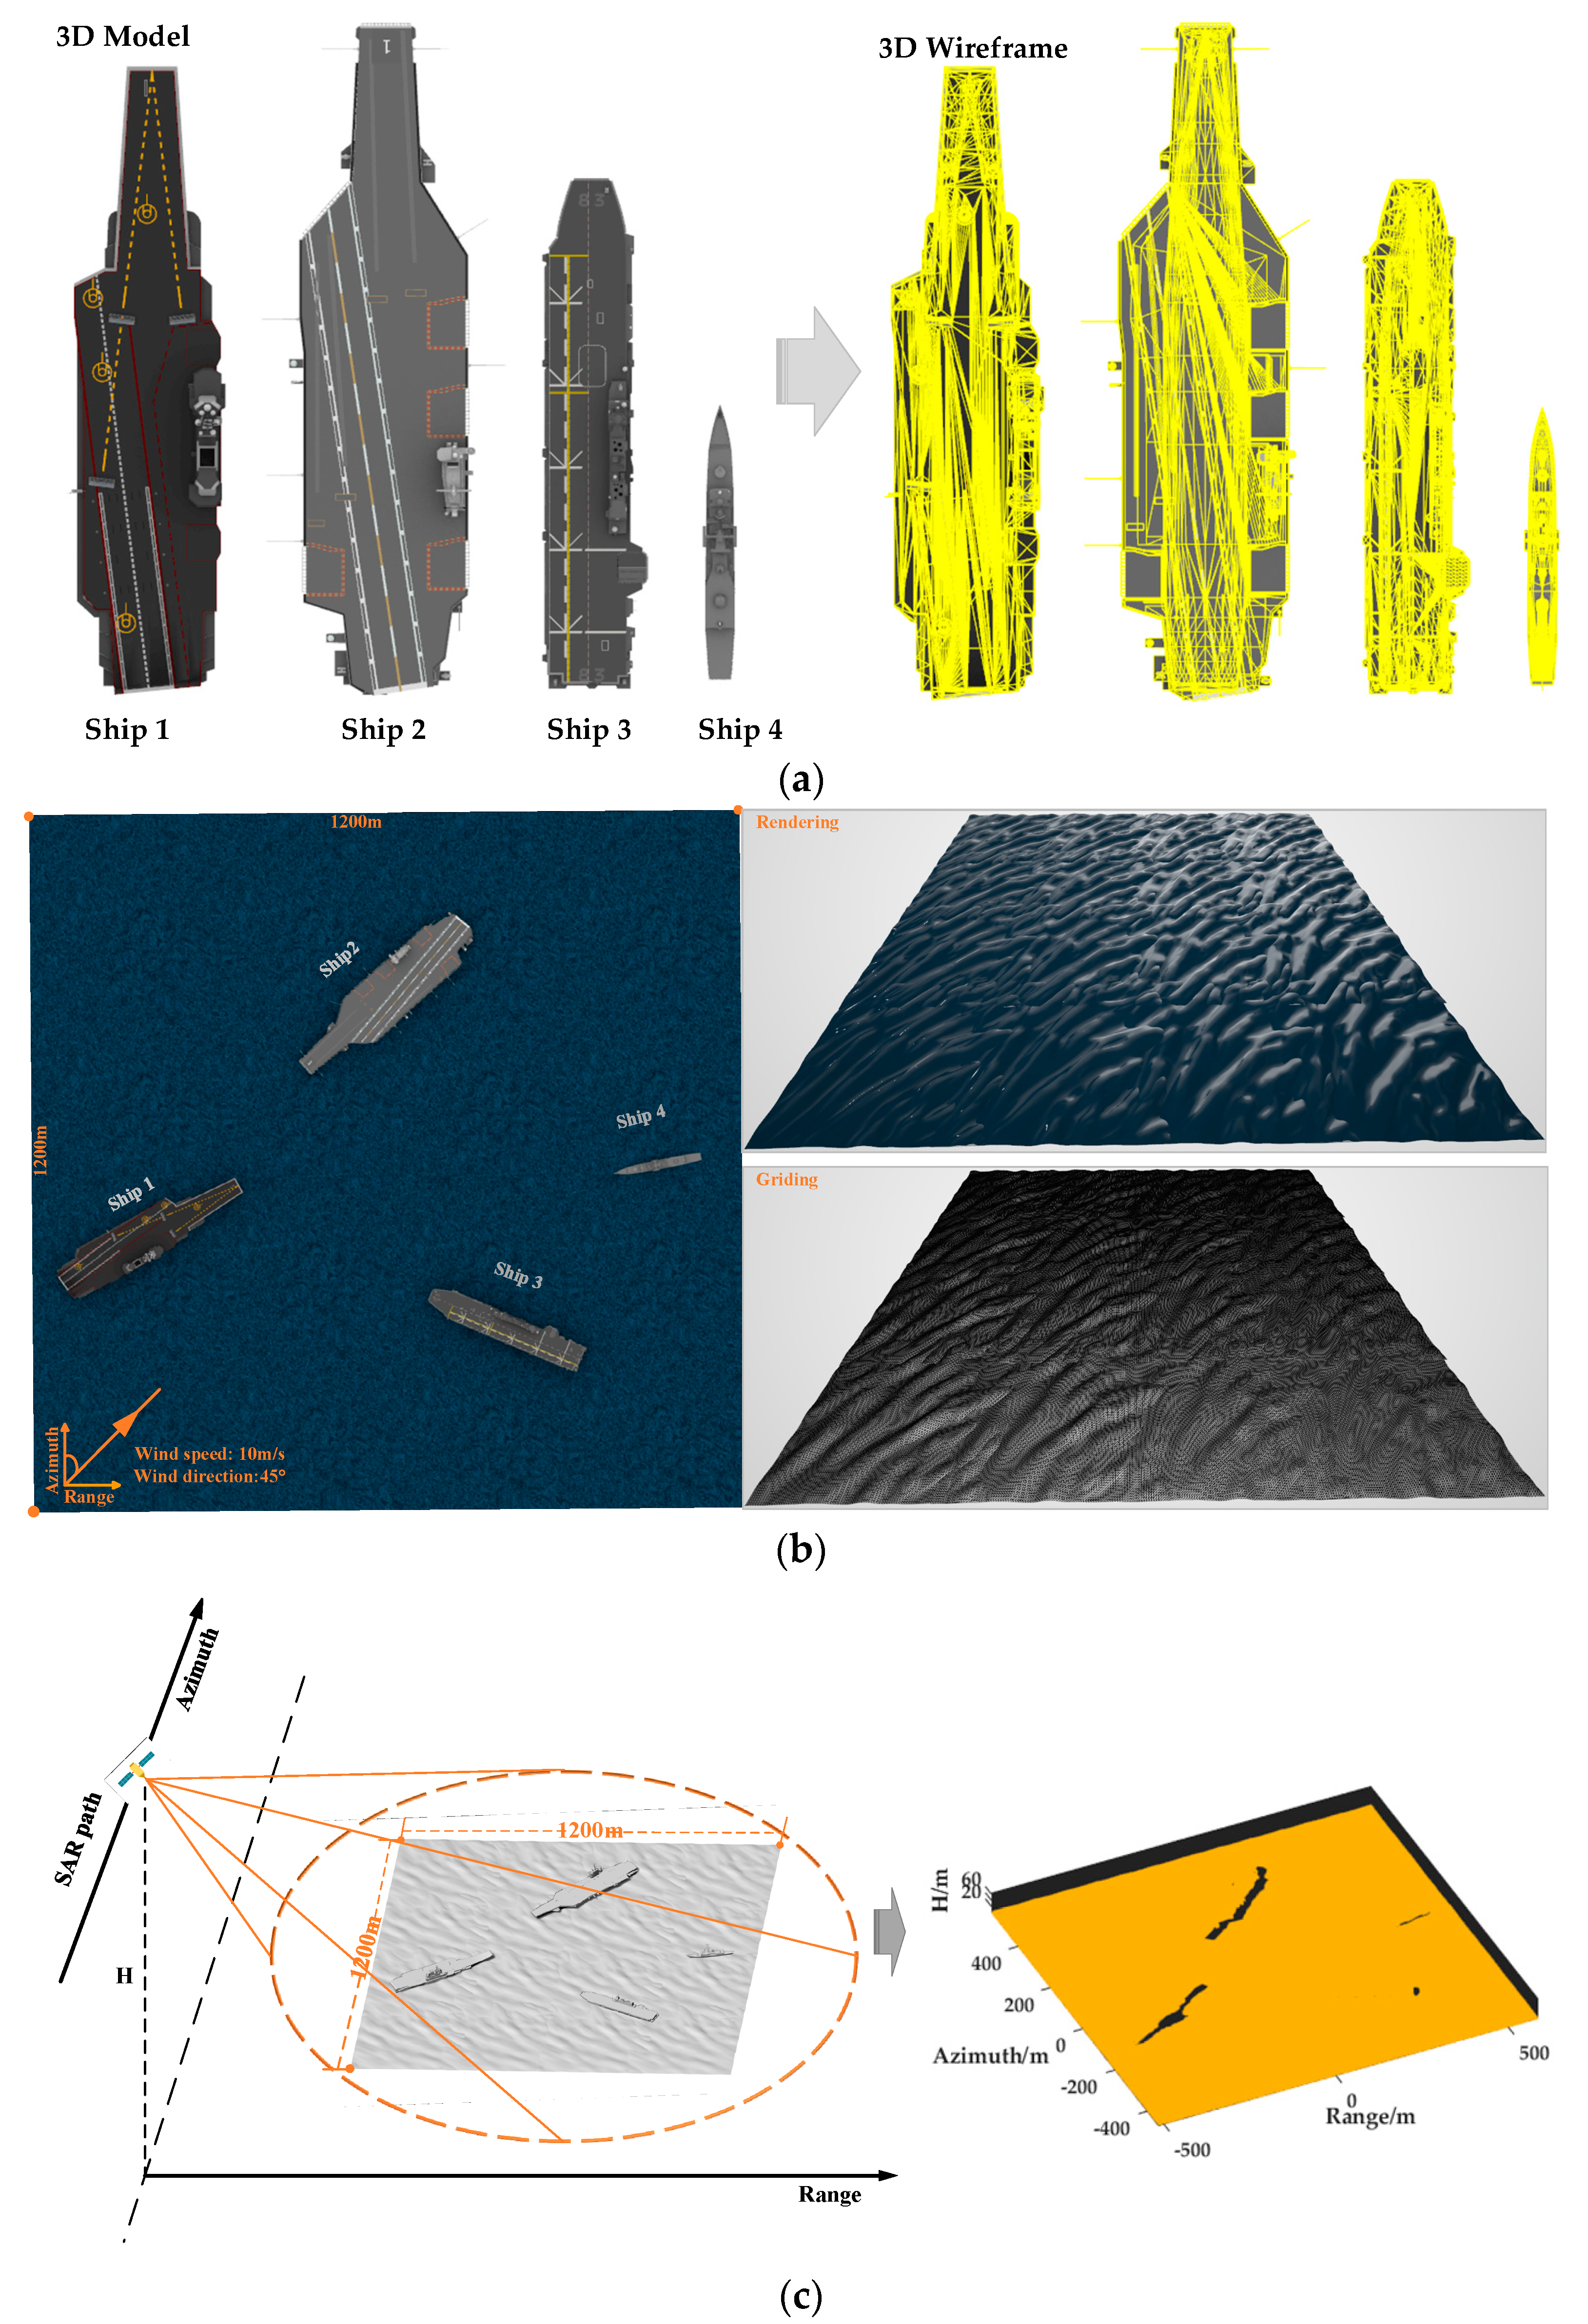
A novel EM wave transmission simulation method based on RD imaging geometry relation is designed. The method utilizes the scanning mode of SAR spatial traversal and the BVH algorithm to assist in the generation of the latticed radiation area and EM wave transmission simulations, considering the time-varying characteristics of the latticed radiation area and shadow area.
(2)
A novel fast SAR image simulation method based on spatial segmentation is proposed. The method integrates the idea of spatial segmentation into the echo matrix cell method based on the CUDA platform, including the time-varying characteristics of the target backscatter coefficient and multiple scattering. It is applicable to distributed composite scenes.
This paper is organized as follows. Section 2 introduces the BVH-assisted computation of the target multiple backscatter field, mainly involving the content of the kernel function to be designed. Section 3 introduces the workflow of fast SAR image simulation based on spatial segmentation, mainly including the CUDA thread organization and the detailed workflow of echo generation and imaging. Section 4 carries out some simulation tests on some typical target models, and the simulation results are compared and analyzed quantitatively and qualitatively to verify the effectiveness of the proposed method. Section 5 presents the conclusions.

2. BVH-Assisted Computation of the Target Multiple Backscatter Field

The main task of the target backscatter field calculation is to dynamically record the amplitude and phase of the multiple backscattering that occur between the EM wave and the target in real time. We utilize the RD imaging geometry relation and adopt the SAR spatial traversal mode to simulate beam scanning within beamwidth. Then, the intersection lattices of the EM waves with the target surface are obtained to complete the effective representation of the time-varying radiation and shadow areas within the SAR beams. In this process, we use the BVH algorithm to reduce the intersection complexity between EM waves and target model facets as a whole. Then, the task of EM wave transmission simulation can be accomplished by transmitting discrete EM waves only to the latticed radiation area at each sampling moment along the azimuth direction. On the basis of EM wave transmission simulation, the ray tracing algorithm is used to dynamically record the amplitude and phase of multiple scattering of EM waves, including various scattering mechanisms and material properties of the target surface.

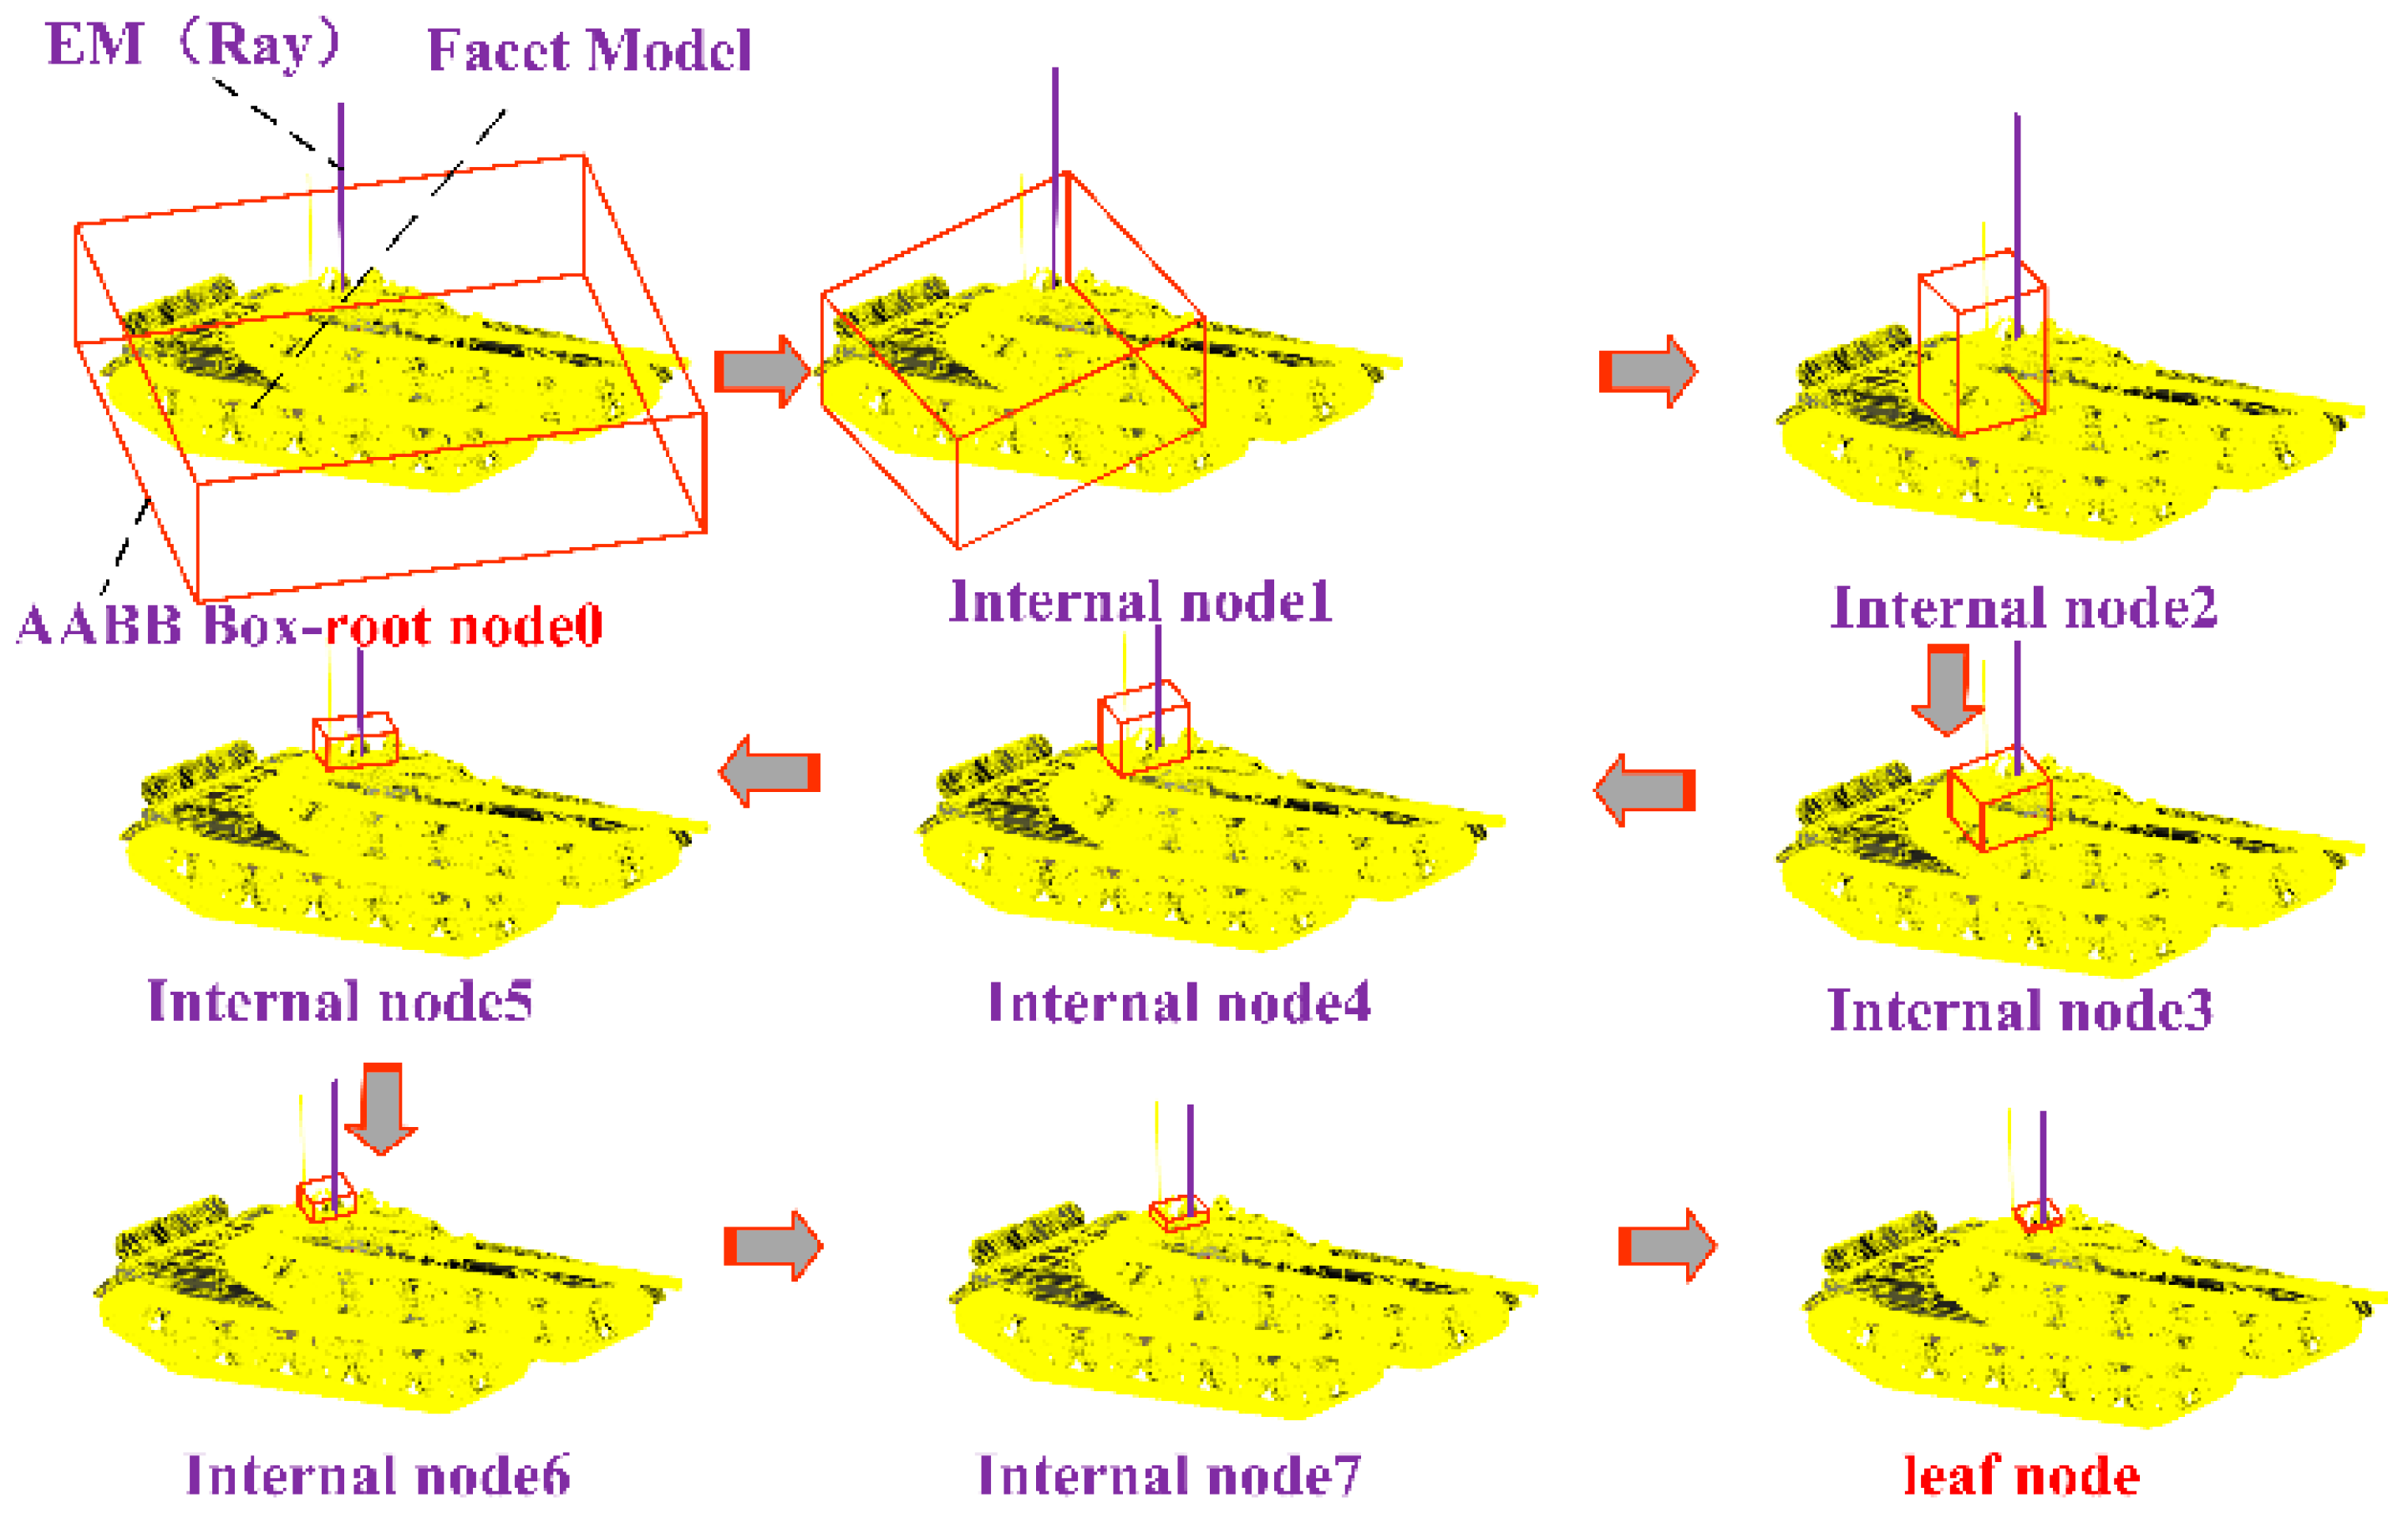
2.1. BVH-Assisted Simulation of Electromagnetic Wave Transmission

EM wave transmission simulation is the first task of target backscatter field calculation. The workflow of BVH-assisted EM wave transmission is shown in Figure 1. The method uses the geometric relationship between the real-time slant range and incidence angle in the zero Doppler plane of the radar beam, adopts the SAR space traversal mode, discretizes the target model surface facets in the real-time radiation area of the radar beam along the azimuthal direction of each sampling moment into lattices, and takes the value of the lattice spacing in line with the requirements of Nyquist’s sampling law so as to effectively store the total radiation area of the radar beam in the form of lattices, while its shadow area has no corresponding lattices. Then, combined with the BVH algorithm to simulate the backscatter field, the beam radiation area of the radar beam can be effectively stored in the form of lattices, while its shadow area has no corresponding lattices. Combined with the real-time position of the radar sensor, only discrete EM waves are launched to all the real-time point-matrix targets that are kept in the line of sight so as to complete the task of simulating the EM wave launching and reproduce the time-varying radiation area of the radar beam and the corresponding shadow area. The BVH algorithm is used to accelerate the intersection of each EM wave with the target model in the process of latticing the target model in the real-time radiation area of the radar beam. This method can reproduce the time-varying characteristics of the radar beam radiation and shadow area and also provides the basic conditions for the target multiple backscatter field calculation.
(1) Geometric scene construction. Using the RD geometric imaging model, the SAR spatial traversal mode is adopted to determine the zero Doppler plane by the pulse repetition time (PRT). Then, the real-time slant range is obtained through the range gate within the pulse, and the real-time incidence angle is calculated by combining it with the platform flight height to complete the simulation of EM wave transmission in the Doppler plane and determine the base scanning plane. The specific process is as follows.
(a) The SAR spatial traversal model is adopted to determine the position of the zero Doppler plane by PRT and then obtain the instantaneous slant range by each preset range gate within the pulse. Combined with the platform flight height, the instantaneous incidence angle can be calculated. Then, the EM wave transmission simulation within the zero Doppler plane can be carried out to determine the beam scanning reference. The radar transmits pulses continuously by PRT, and the transmitted discrete pulse train can be regarded as the discrete zero Doppler plane set. Then, according to the range of the simulation scene, pulse duration, and range sampling frequency, the range gate position in the pulse is divided. In order to ensure the quality of the echo simulation signal, the distance gate size is smaller than the sampling interval and the sampling interval is smaller than the theoretical resolution, according to the Nyquist sampling theorem. Instantaneous slant range can be calculated from the slant range gate within the pulse. Finally, the instantaneous incidence angle is calculated by combining the instantaneous slant range and the platform height.
M = x max x min ρ a N = R max R min ρ r R min = H tan θ + y min 2 + H 2 R max = H tan θ + y max 2 + H 2 R J = R min + j ρ r θ j = arccos ( H / R J ) j N v 0 = 0 , sin θ j , cos θ j
where M and N are the number of azimuthal sampling points and slant range gates in corresponding SAR slant range image, respectively; x max and x min are the azimuthal coordinates of the scene; R min and R max are the near range and far range, respectively; y max and y min are the ground range coordinate of the scene; H is the platform height; ρ r is the slant range sampling space; R J is the instantaneous slant range within the zero Doppler plane; θ j is the instantaneous incidence angle within the zero Doppler plane; and v 0 is the instantaneous incidence direction within the zero Doppler plane.
(b) According to the azimuthal range of the scene, the flight speed of the platform, and pulse repetition frequency, the instantaneous position of the sensor within the zero Doppler plane is determined. Then, the instantaneous incidence direction can be determined by combining it with the incidence angle of EM waves. The number of slant range gates corresponds to the number of discrete EM waves within the zero Doppler plane. The ray casting theory is used to detect the collision between the EM waves and the target surface, and the intersection facets and intersection point coordinates are recorded. The process of determining the scanning reference is essentially the process of simulating the discrete EM wave transmission and recording the intersection point within the zero Doppler plane.
S = x i , H tan θ , H x i = i * ρ a + x min P = S + t * v 0 P P ^ N = 0 i M
where S is the sensor position within the zero Doppler plane; x i is the sensor azimuthal coordinate; ρ a is the azimuthal sampling space; θ is the incidence angle; P is the intersection point on the target surface; t is the propagation distance of the EM wave; P ^ is the coordinate of an arbitrary point on the target surface; and N is the normal vector of the facet on the target surface.
(2) Base scanning plane rotation. As shown in Figure 2, the zero Doppler plane scanning does not take into account the dynamic occlusion relationship between the target and the sensor within the corresponding synthetic aperture time and has not yet been able to reproduce the time-varying characteristic of the radar beam radiation area and the shadow area, so only the zero Doppler plane is used as the base scanning plane here. According to the beam pointing rotation characteristics in different SAR modes, the SAR equivalent beam rotation angle is calculated, the zero Doppler plane is used as the base scanning plane, and then the base scanning plane is rotated using the line between the sensor and the nadir point as the center axis to determine the real-time scanning plane. The specific process is as follows:
(a) Considering the rotational characteristics of beam pointing in different SAR modes and the time-varying characteristics of the EM wave transmission direction within the beamwidth, we uniformly take half of the beamwidth corresponding to the synthetic aperture as the equivalent rotation angle. According to the calculated equivalent angle, the determined base scanning surface will be rotated forward or backward, which is essentially the overall rotation of the discrete EM wave within the base scanning surface. This can be expressed by Equation (3).
θ s = arctan L s / R 0 / 2 θ s s t r i p = 0.886 λ / D a / 2
where θ s is the equivalent rotation angle; L s is the synthetic aperture length; R 0 is the slant range of scene center; θ s s t r i p is the beamwidth with stripmap mode; λ is the wavelength; and D a is the azimuthal length of real aperture.
(b) As shown in Figure 2, the zero Doppler scanning plane does not consider the dynamic occlusion relationship between the target and the sensor within the corresponding synthetic aperture time and has not yet been able to reproduce the time-varying radar beam radiation area and the shadow area. According to beam pointing characteristics in different SAR imaging modes, the SAR equivalent beam rotation angle can be calculated using the synthetic aperture length and slant range of the scene’s center. Then, the zero Doppler plane is used as the scanning reference plane. The platform flight direction is taken as the positive direction, and the connection line between the sensor and the nadir point is taken as the central axis ST. The half of the equivalent beam rotation angle is taken as the positive or negative angle to rotate the scanning reference plane and coincide with the beam’s front or backward edge. The equivalent beam front and backward edge planes and zero Doppler planes generated by each PRT are taken as the beam scanning plane set.
F v = v 0 cos θ s sin θ s 0 sin θ s cos θ s 0 0 0 1 M v = v 0 1 0 0 0 1 0 0 0 1 B v = v 0 cos θ s sin θ s 0 sin θ s cos θ s 0 0 0 1
where F v is the beam’s front edge; M v is the zero Doppler plane; and B v is the beam’s backward edge.
(3): BVH-assisted EM wave transmission simulation. The main idea of the BVH algorithm is that if the EM wave cannot hit the bounding box of a node, then it must not hit the facets inside the box, and the invalid facets in the corresponding bounding box of the node can be directly eliminated. If the EM wave does not hit the outermost bounding box corresponding to the root node, it means that the EM wave has no direct interaction with the target model. The construction process of the bounding box is to generate a binary tree by dividing the root node from top to bottom, as shown in Figure 3. The internal node does not contain facet information but provides spatial boundary information, and only the leaf node contains a few facets.
(a) BVH assists the EM wave to intersect with the target model. As shown in Figure 3, according to the spatial boundary relationship between EM waves and internal nodes at all levels, the direction of the corresponding branches of nodes at all levels in the binary tree is determined step by step, and the internal nodes containing the intersecting surface facet are constantly hit. The leaf node contains only a small number of facets, which is the last level node, and the calculation amount of traversing the facets of the leaf node is small. The more compact the space of the bounding box corresponding to the internal nodes of the same level, the smaller the overlap degree, which can reduce the calculation cost of traversing the bounding box, corresponding to the nodes of the same level.
The key points of BVH that assist the EM wave to intersect with the target model are as follows. The axis-aligned bounding box ( A A B B ) is used for efficiently handling query operations on a large number of internal nodes. Then, the center coordinates of the target model surface facets are arranged in ascending order, and the surface facets can be sorted along the three spatial axes X ,   Y , Z of the current node. Then, we perform continuous spatial segmentation one by one and then compare the computational costs of all the segmentation positions and take the position with the lowest computational cost as the optimal segmentation position among the three axes. Take the X -axis as an example, generate a surface facet set X s t a r ,   X e n d according to the size of the center coordinates of the model surface facets, and choose the method of successive dissections by surface facets x X s t a r ,   X e n d . The spatial surface area corresponding to the left box L X s t a r ,   i and the right box R i + 1 ,   X e n d can be calculated in real time and then brought into the SAH computational cost equation. Then, we can determine the dissecting position of the surface facet x i X s t a r ,   X e n d corresponding to the smallest computational cost as the optimal position of the dissecting along the X -axis. The other Y / Z -axes also follow this rule to calculate these optimal profile positions and computational costs. The actual profile location with the smallest computational cost among the three axes is selected as the final actual profile location. Taking the x-axis as an example, the surface area S of a node corresponding to A A B B can be expressed as follows:
S = 2 * [ ( X 1 X 2 ) ( Y 1 Y 2 ) + ( Y 1 Y 2 ) ( Z 1 Z 2 ) + ( X 1 X 2 ) ( Z 1 Z 2 ) ]
where X 1 , Y 1 , Z 1 and X 2 , Y 2 , Z 2 are the spatial coordinates of the bounding box vertices A and B, respectively. Using Equation (5), calculate the surface area of the left and right child nodes corresponding to the bounding boxes A and B after the arbitrary dissection of a node, and then the cost equation of SAH calculation can be specifically expressed by Equation (6).
Cos t ( A , B ) = S A S C N A δ + S B S C N B δ + G Cos t Cos t ( X ) = min [ Cos t ( A , B ) ] F Cos t = min [ Cos t ( X ) Cos t ( Y ) Cos t ( Z ) ]
where Cos t ( A , B ) is the cost of dividing a node; Cos t ( X ) is the minimum division cost along the X axis; δ is the cost of intersecting a single surface cell, which can be set to unit 1; S A is the surface area of the left child node corresponding to the bounding box A ; S B is the surface area of the right child node corresponding to the bounding box B ; S C is the total area of the bounding box corresponding to the node to be divided; N A is the number of surface facets contained in the bounding box A ; N B is the number of surface facets contained in the bounding box B ; and G Cos t is the cost of constructing a binary tree, which can be set to a fixed value. Similarly, the minimum cost Cos t ( Y ) and Cos t ( Z ) of the Y and Z axes are calculated sequentially to find the optimal location of the minimum cost F Cos t , and the internal nodes of the binary tree are constructed recursively by this division method.
(b) Lattice radiation area generation and EM wave transmission simulation. As shown in Figure 4, the SAR beam radiation area can be quickly discriminated against with the assistance of the BVH algorithm, and the target facets within the radiation area are converted into lattices. According to the real-time complementary and time-varying characteristics of the radiation area and the shadow area, the real-time shadow area is generated by automatic removal of the beam occluded area or the target parts outside the beam scanning range. The total lattice radiation area can be obtained by a union of the lattice radiation areas determined by the beam scanning plane set. Finally, the task of EM wave transmission simulation can be accomplished by transmitting EM waves only to the latticed radiation area at each sampling moment along the azimuth direction.

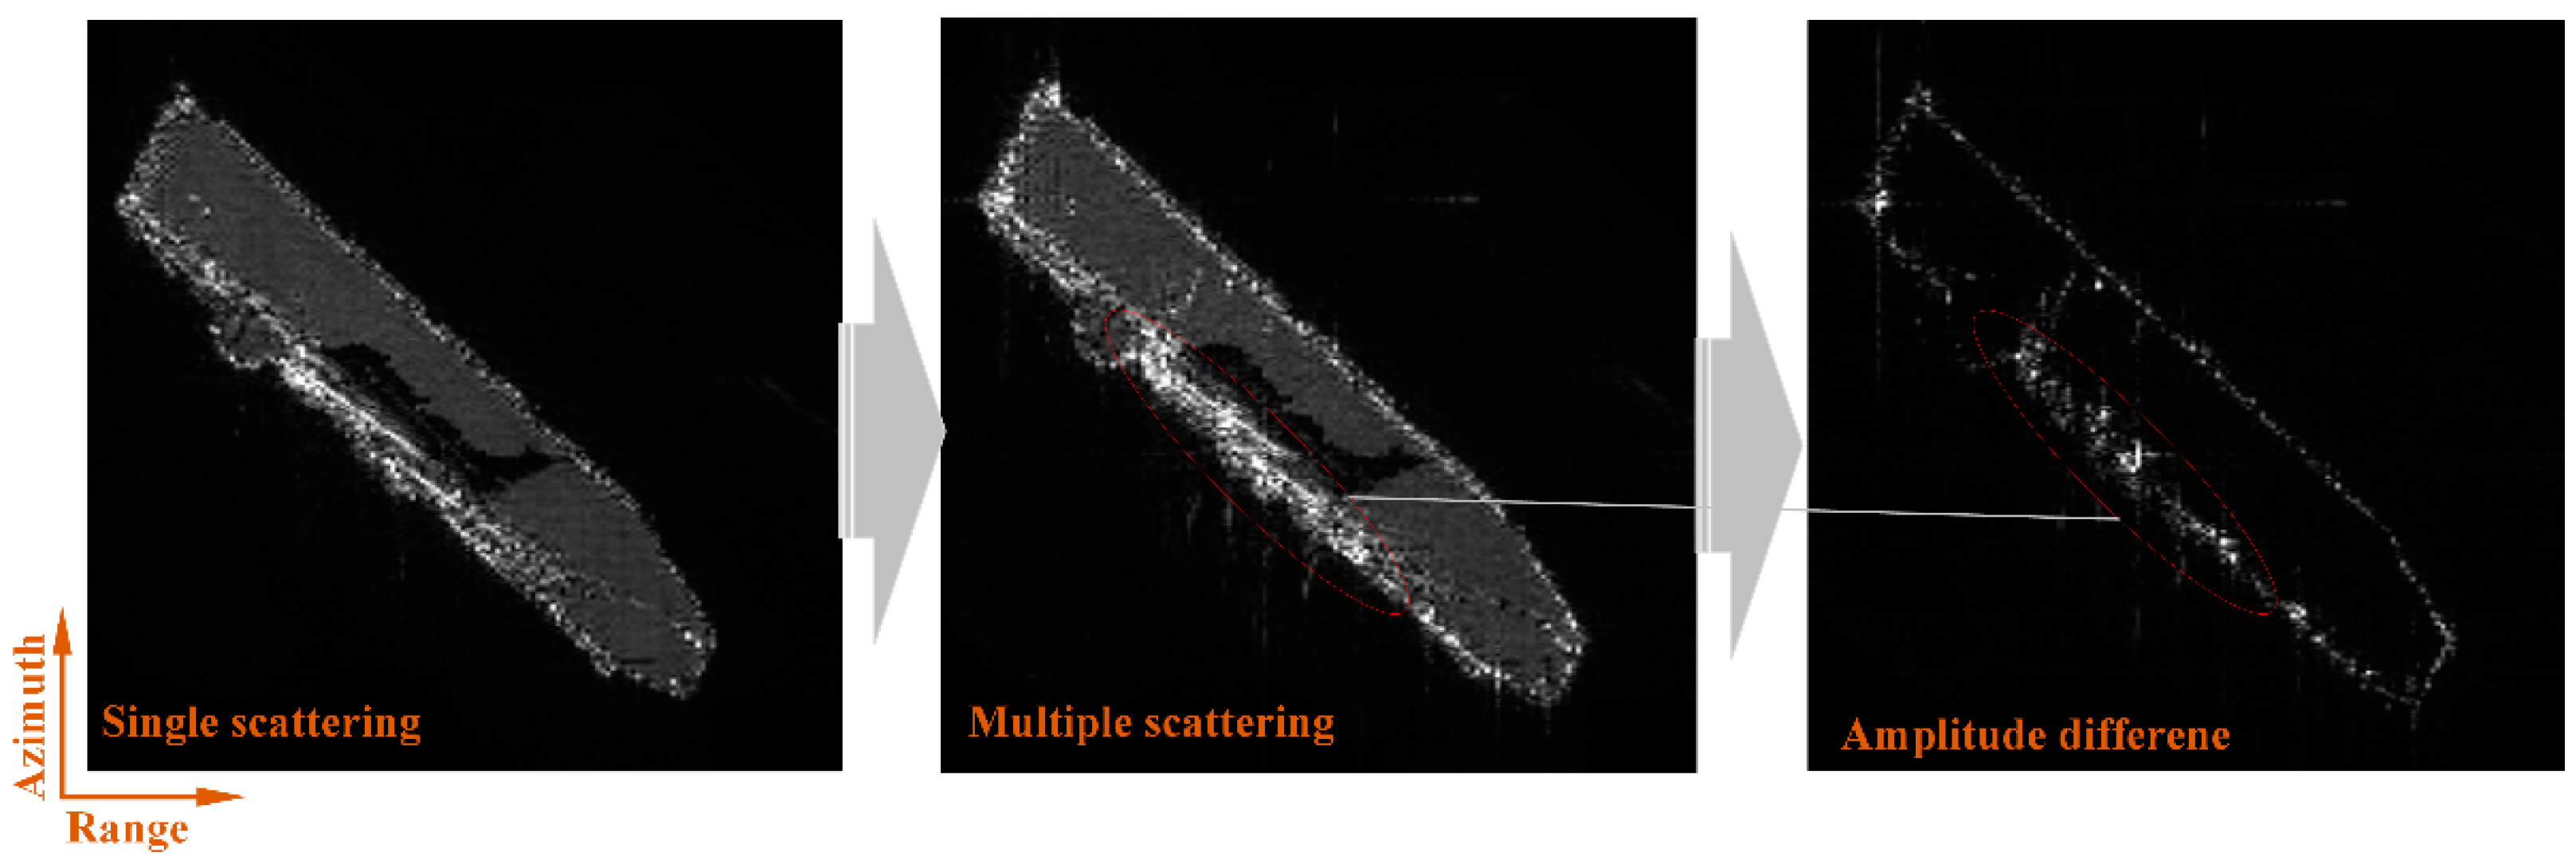
2.2. Calculation of the Multiple Backscatter Field

The basic scattering model of EM wave is the GO model, and according to the high-frequency ray theory, Fermat’s theorem can be used to simulate the incidence and reflection of EM waves, in which the main contributions to the scatter field of an electrically large-size-distributed target are geometrically optically direct and reflected waves. We combine the bidirectional reflectance distribution function (BRDF) and the high-frequency ray theory with the ideal specular reflection of microfacets as the starting point for the scattering mechanism analysis, and according to the statistics of the orientation distribution of the normal vectors of the microfacets, the macroscopic scattering mechanism can be subdivided into diffuse, directional specular reflection, sub-surface scattering, diffraction, and absorption. There is a certain overlap degree in the field areas of the various scattering mechanisms mentioned above, which can be reasonably merged.
Time-varying magnetic and electric field excitation produces EM waves transmitting to the target surface. A part of the EM waves enters the dielectric layer in front of the target surface and is then transmitted from the sub-surface scattering emitted from the shallow surface of the dielectric. The sub-surface scattering still belongs to the components of diffuse scattering. While the carrier space of the line and point-like structure surface are too small, the number of microfacets is limited, and the statistics of its normal vector distribution is random. The scattering energy of the incident EM wave tends to be a disk shaped or have conical distribution at the edge of a typical prismatic cleavage structure or sharp structure. The non-directional scatter field listed above has a certain range of overlapping areas with the diffuse reflection field based on the microfacets theory, which is collectively categorized as diffuse scattering in this paper. The wavefront width of the specular reflection depends on the smoothness of the surface of the medium; for a given smooth surface of the medium, the greater the gloss, the narrower the wavefront width, and the more concentrated the forward scattered energy. The value of its projection in the receiving direction of the reflection direction is affected by the angle between the receiving direction and the direction of the specular reflection.
On the basis of the EM wave transmission simulation, we combine the actual properties of the target material with a non-transparent surface in the test and regard the backscatter energy received by the transceiver co-located SAR sensor as the sum of the diffuse and specular energy. The property parameters of the target material include relative permittivity, the specular coefficient, the diffuse coefficient, the specular index, and the energy decay coefficient, which are explained in detail in the following material property assignment session to ensure the fidelity of the target backscatter energy. Finally, the propagation distance attenuation factor is set in conjunction with the classical radar equations to correct the target backscatter field, and the multiple backscatter amplitude of each EM wave can be calculated by Equation (7).
I S ( k ) = K k d π I T ( k ) max ( 0 , v k N k ) + K k f I T ( k ) max ( 0 , v k r k ) K k s δ k = 4 π R k 2 1 R k 4 I s ( k ) I T ( 1 ) ρ ε k r k = v k 2 * max ( 0 , v k N k ) * N k I T ( k ) = I T ( 1 ) ( 1 K l o s 1 ) * ( 1 K l o s 2 ) ( 1 K l o s k ) ( I T ( k ) < I e n d )
The parameter subscript k indicates the instantaneous state of the k -th backward sub-scattering. I S is the backscattering energy, I T is the incident energy, I T ( 1 ) is the initial incident energy of the EM wave, and I T ( k ) is the residual energy value at the k -th scattering. δ is the backscatter coefficient; N is the normal vector of the surface facet; R k is the instantaneous slant range; K d is the diffuse coefficient; K d π indicates the diffuse scattering mechanism to the surrounding area; K f is the specular reflection coefficient; and K s is the specular index and is used to control scattering energy along the receiving direction within the projected range. ρ indicates the polarimetric scatter coefficient, ε is the relative permittivity, v is the direction of EM wave incidence, and r is the direction of EM wave specular reflection. v is the direction of energy reception and K l o s is the energy decay coefficient. I e n d is the is the energy decay threshold, and it can be used to terminate the tracking of the complex multiple scattering path of each discrete EM wave. 1 R 4 is the propagation distance attenuation factor, which is specifically set according to the relationship that the fourth power of the propagation distance of EM waves is inversely proportional to the backscattered energy. We mainly use the ray tracing algorithm to realize the path tracing of multiple scattering of EM waves, and the key points are as follows. When the EM wave is at k -th scattering, the reflection direction and the intersection point of the main energy axis are taken as the new direction of incidence and the launching starting position of k + 1 -th scattering, respectively, so as to complete the scattering simulation of the EM wave in a new round.
In describing the polarization state of EM waves, it is necessary to set up the global and local coordinate systems. Vertical polarization means that the electric field vector of the EM wave is parallel to the incident plane, and horizontal polarization means that the electric field vector of the EM wave is perpendicular to the incident plane. Combined with the small perturbation model theory, the target polarimetric scatter process is regarded as the coordinate conversion process from the incident wave to the scatter wave. Usually, the depolarization effect is generated throughout the multiple scattering processes of the EM wave and the target backscatter field calculation is chosen to be carried out in the local coordinate system, while the target backscatter field in the global coordinate system is recorded by the sensor, and the depolarization effect can be represented in the process of the conversion between the local scattering coordinate system and the global transmitting coordinates. Because the above polarization coordinate system conversion is not the focus of this paper, we only briefly describe the functional relationship between the polarimetric scatter coefficient, the local incident angle, and the relative permittivity; the detailed derivation process can be referred to our previously published article [16]. Parallel or vertically polarized incident waves in the local coordinate system can only produce horizontally or vertically polarized reflective waves, and according to the boundary condition of continuity of the tangential component of the EM field at the interface of the incident and reflective wave components, we can represent the polarization effect in the global coordinate system and express the vertically and horizontally polarized scattering coefficients at the intersection of the first scattering in the local coordinate system by Equation (8).
ρ h h = cos ( v N ) ε sin 2 ( v N ) cos ( v N ) + ε sin 2 ( v N ) ρ v v = ε 1 sin 2 ( v N ) ε 1 + sin 2 ( v N ) ε cos ( v N ) + ε sin 2 ( v N ) 2 ρ h v = 0
where ρ v v is the horizontal polarimetric scatter coefficient, ρ v v is the vertical polarimetric scatter coefficient, and ρ h v is the cross-polarimetric scatter coefficient. In the local coordinate system, v is the direction of EM wave incidence, N is the normal vector of the surface facet, and ε is the relative permittivity of the surface facet.
From the coordinates of the intersection point P k calculated during the multiple scattering processing, the slant range of the corresponding multiple scattering can be found. Then, the slant range of the multiple scattering of the EM wave can be brought into the SAR impulse response signal to obtain the phase, which contains two parts, the Doppler phase and the range phase, which are used in the compression imaging process. The echo signal of the EM wave is limited by two-dimensional azimuthal and range envelopes in real time during the recording process. In the stop-and-go model, the real-time phase of the k-th scattering of the EM wave can be obtained in Equation (9).
R k = S P 0 2 + P 0 P 1 2 + + P k 1 P k 2 + P k S 2 / 2 P h a ( k ) = exp j 4 π f 0 R k ( η ) c exp j π K r τ 2 R k ( η ) c 2
where R k is half of the total distance of multiple scattering of EM wave transmission; S is the instantaneous sensor position; P 0 - P k is the intersection point of multiple scattering; P h a ( k ) is the multiple scattering phase; f 0 and K r are the signal carrier frequency and chirp rate, respectively; τ and η are the fast time and slow time, respectively. Combining Equations (7)–(9) can simultaneously obtain the amplitude and phase of the EM wave when scattering occurs, specifically referring to Equation (10) to vectorially superpose the amplitude and phase of the multiple scattering field to obtain the backscatter field of the EM wave, including multiple scattering.
P h a ( k ) = w r τ 2 R k η / c × w a η η c × P h a ( k ) E s = k = 1 M δ k e P h a ( k ) = k = 1 M δ k cos ( P h a ( k ) ) + i δ k sin ( P h a ( k ) )
where E s is the backscatter field of the EM wave; δ k and P h a ( k ) are the amplitude and phase of the EM wave after two-dimensional envelope constraints when the k -th scattering occurs, respectively; and M is the total number of scattering.

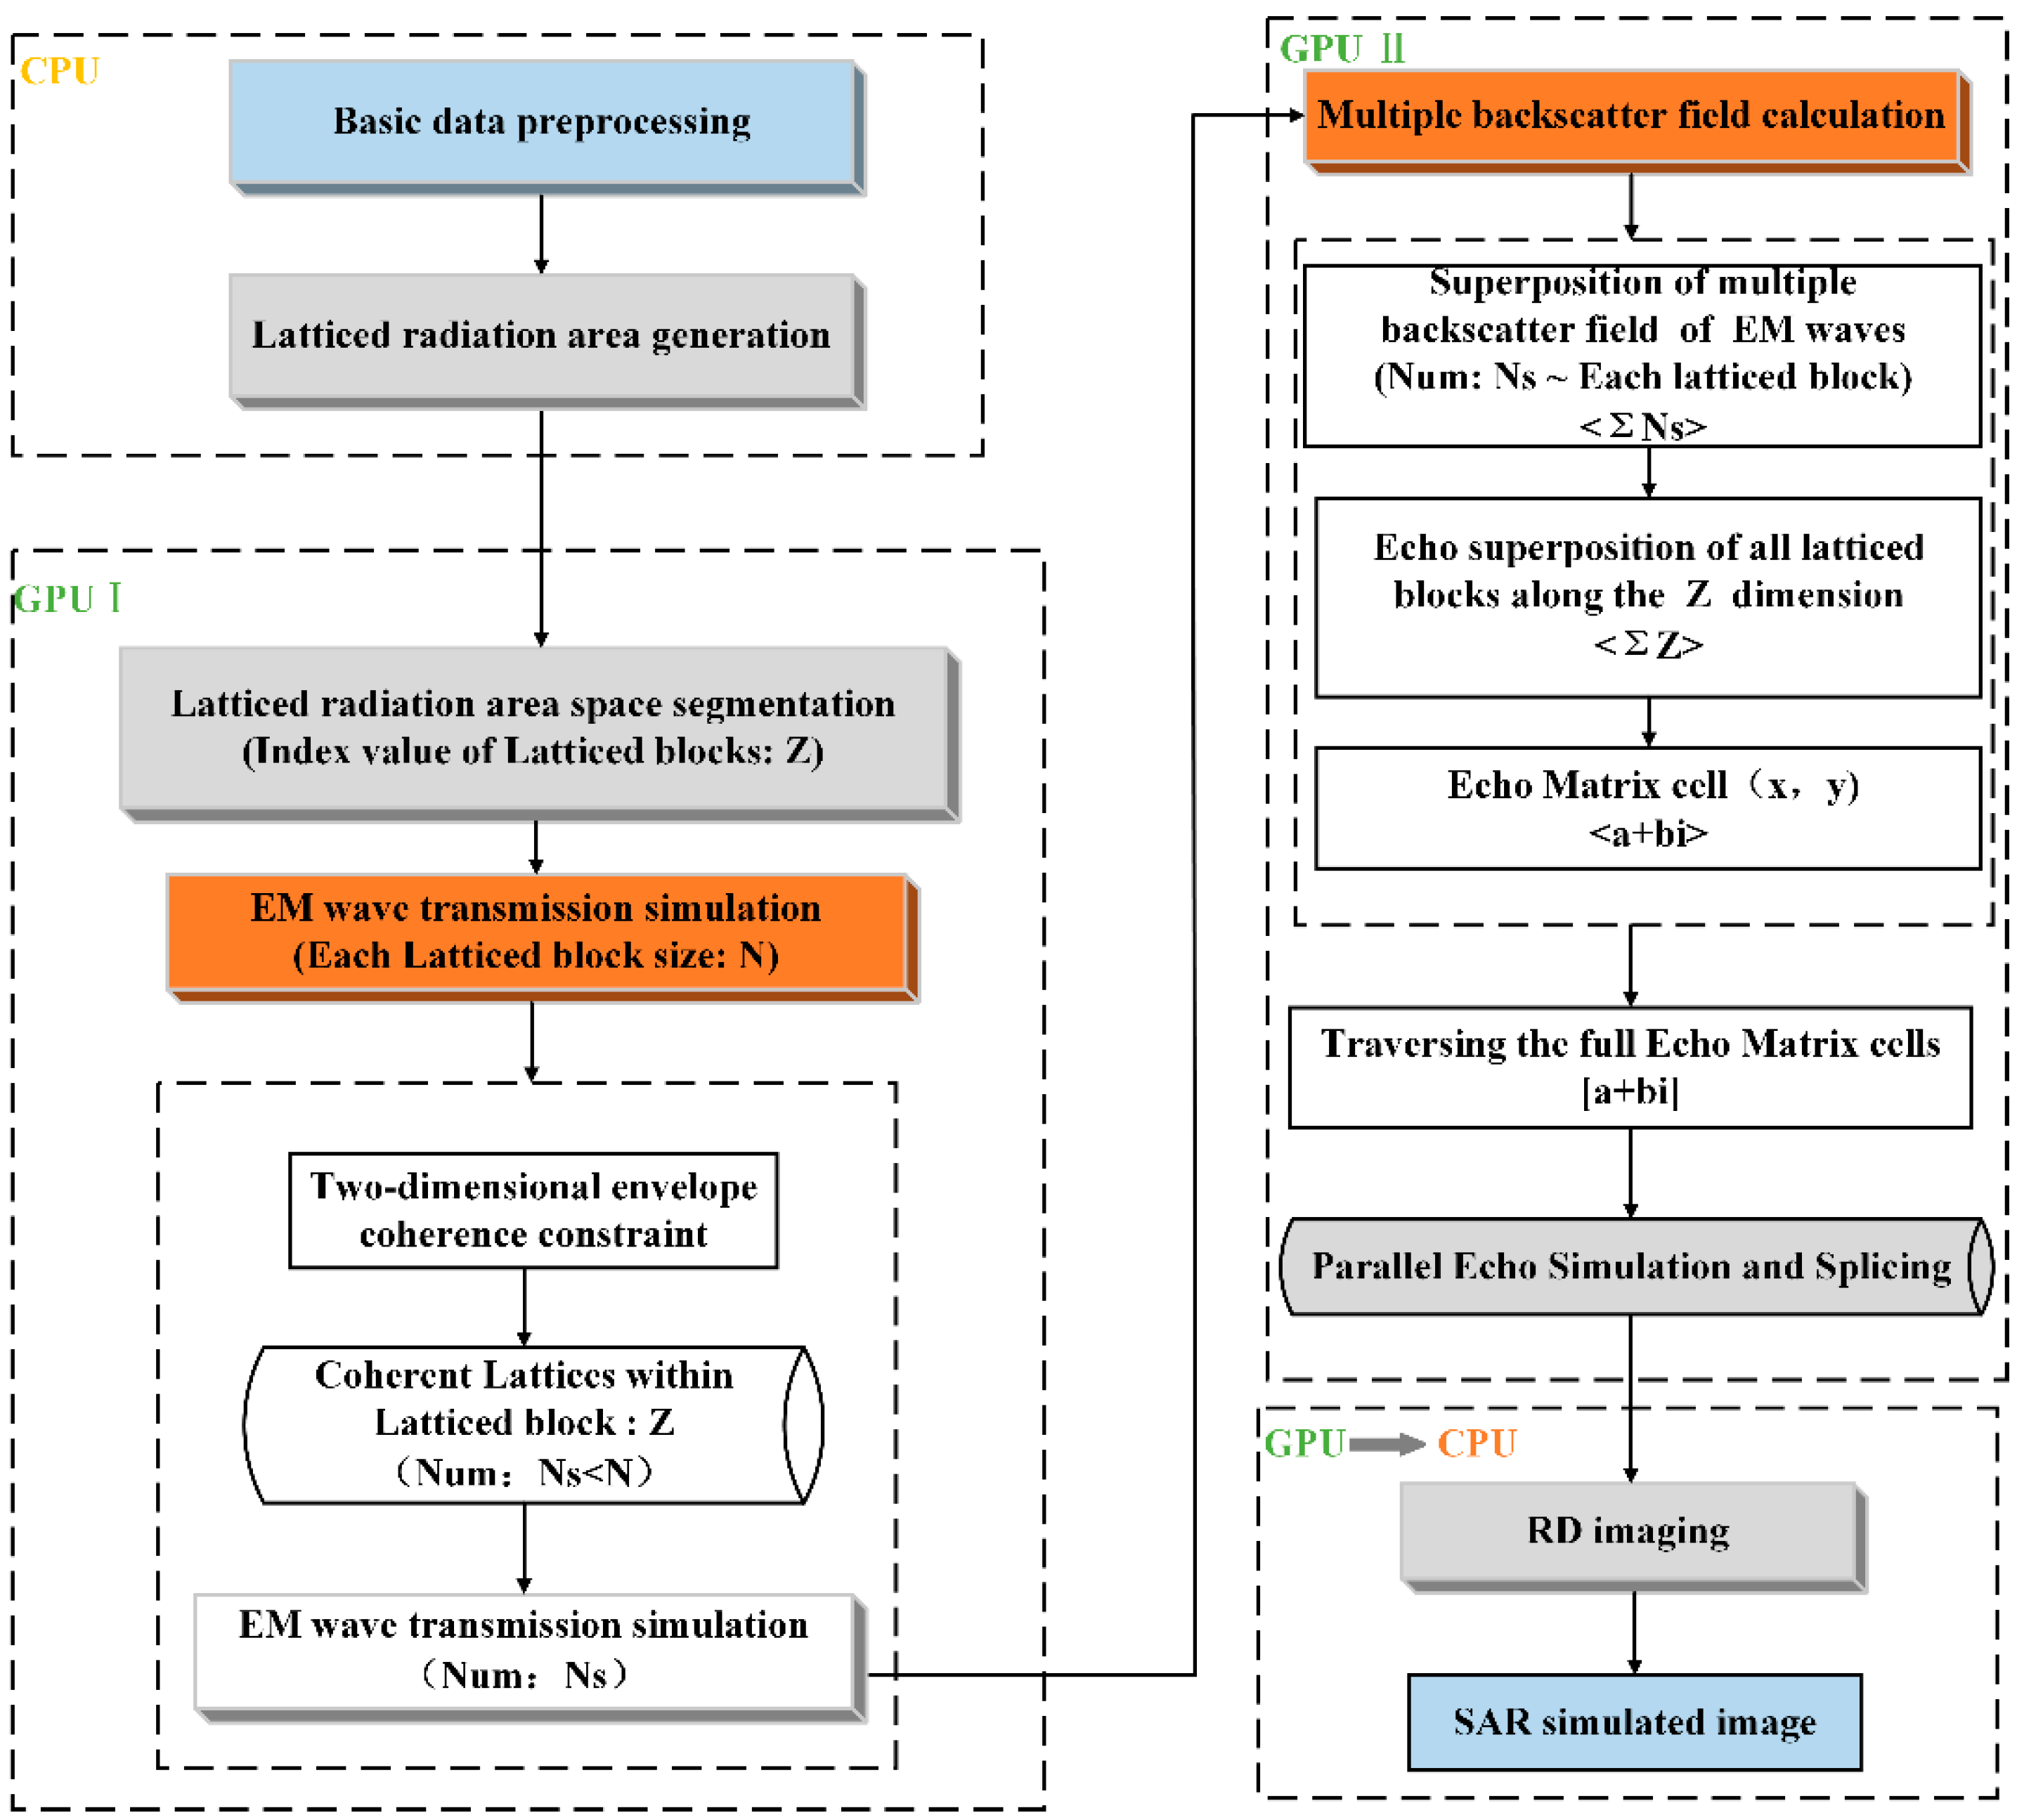
3. Fast SAR Image Simulation Based on Spatial Segmentation

The specific workflow of fast SAR image simulation based on spatial segmentation flow is shown in Figure 5. Firstly, the basic data preprocessing mainly includes the 2D sampling time axis, mode facet set, and target latticed radiation area at the host side CPU, and the basic data are imported into the GPU device side. Then, the spatial segmentation processing is completed by dividing the latticed radiation area into a number of latticed blocks, and each latticed block is denoted by P z , z < Z . The echo generation between the latticed blocks has parallelizability. The azimuth and range positions of the target echo matrix correspond to the thread index X , Y in the planar dimension of the 3D Grid, and the position of the segmented latticed blocks corresponds to the thread index Z along the longitudinal dimension ( Z -axis) of the 3D Grid, respectively.
On this basis, the CUDA kernel function design is completed by integrating the EM wave transmission simulation and backscatter field calculation in Section 2. Each thread executes the same CUDA kernel function, which contains the two modules of GPU I (EM wave transmission simulation) and GPU II (backscatter field calculation) in Figure 5. Each thread deals with each latticed block P z , z < Z using the echo matrix cell method to set the target echo matrix cell as a subfield of the target backscatter field. We use the echo matrix cell x , y position to determine the two-dimensional sampling moments, and then construct a two-dimensional envelope window to select the coherent lattices in the current latticed block P z , z < Z . Then, we can transmit the discrete EM waves for the coherent lattices and calculate the multiple backscatter field of each discrete EM wave using the method in Section 2.2. All the multiple backscatter fields of EM waves for the coherent lattices are superimposed as the backscatter field of the current latticed block P z , z < Z . The whole target SAR echo simulation task is packaged into the CUDA platform support mode, and all the threads execute the CUDA kernel function. After all the threads have finished executing the task, the backscattered field of all the latticed blocks along the longitudinal dimension ( Z -axis) of the 3D Grid is vectorially superimposed to obtain the raw echo matrix. Finally, the RD algorithm is used to focus the target simulation echo signal to obtain the target SAR simulated image.

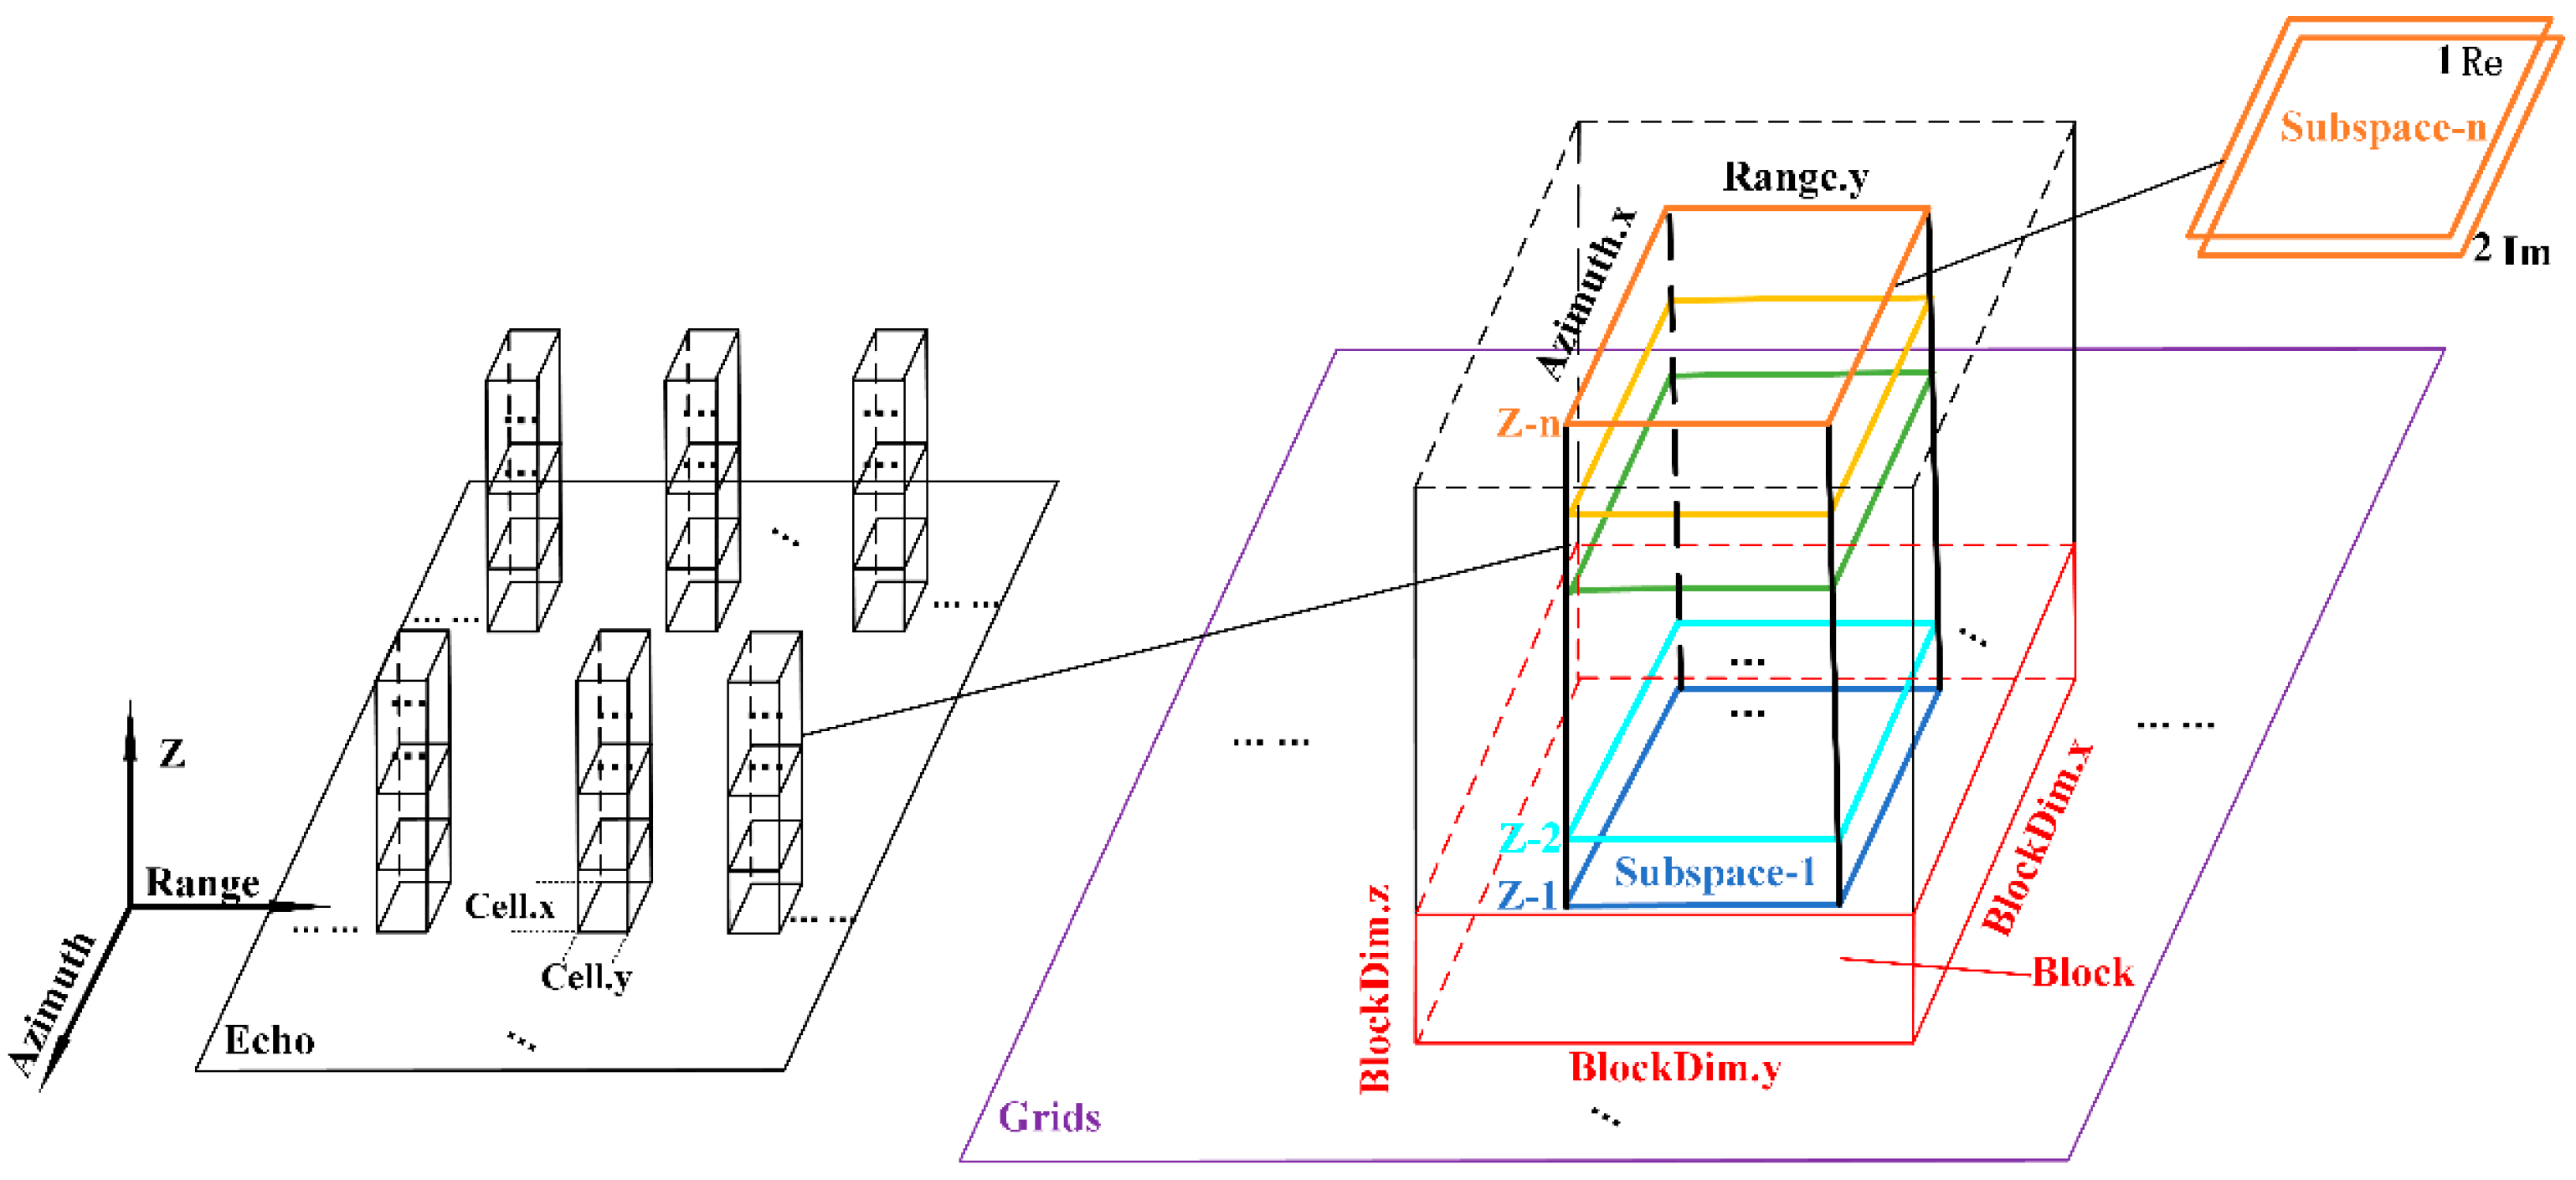
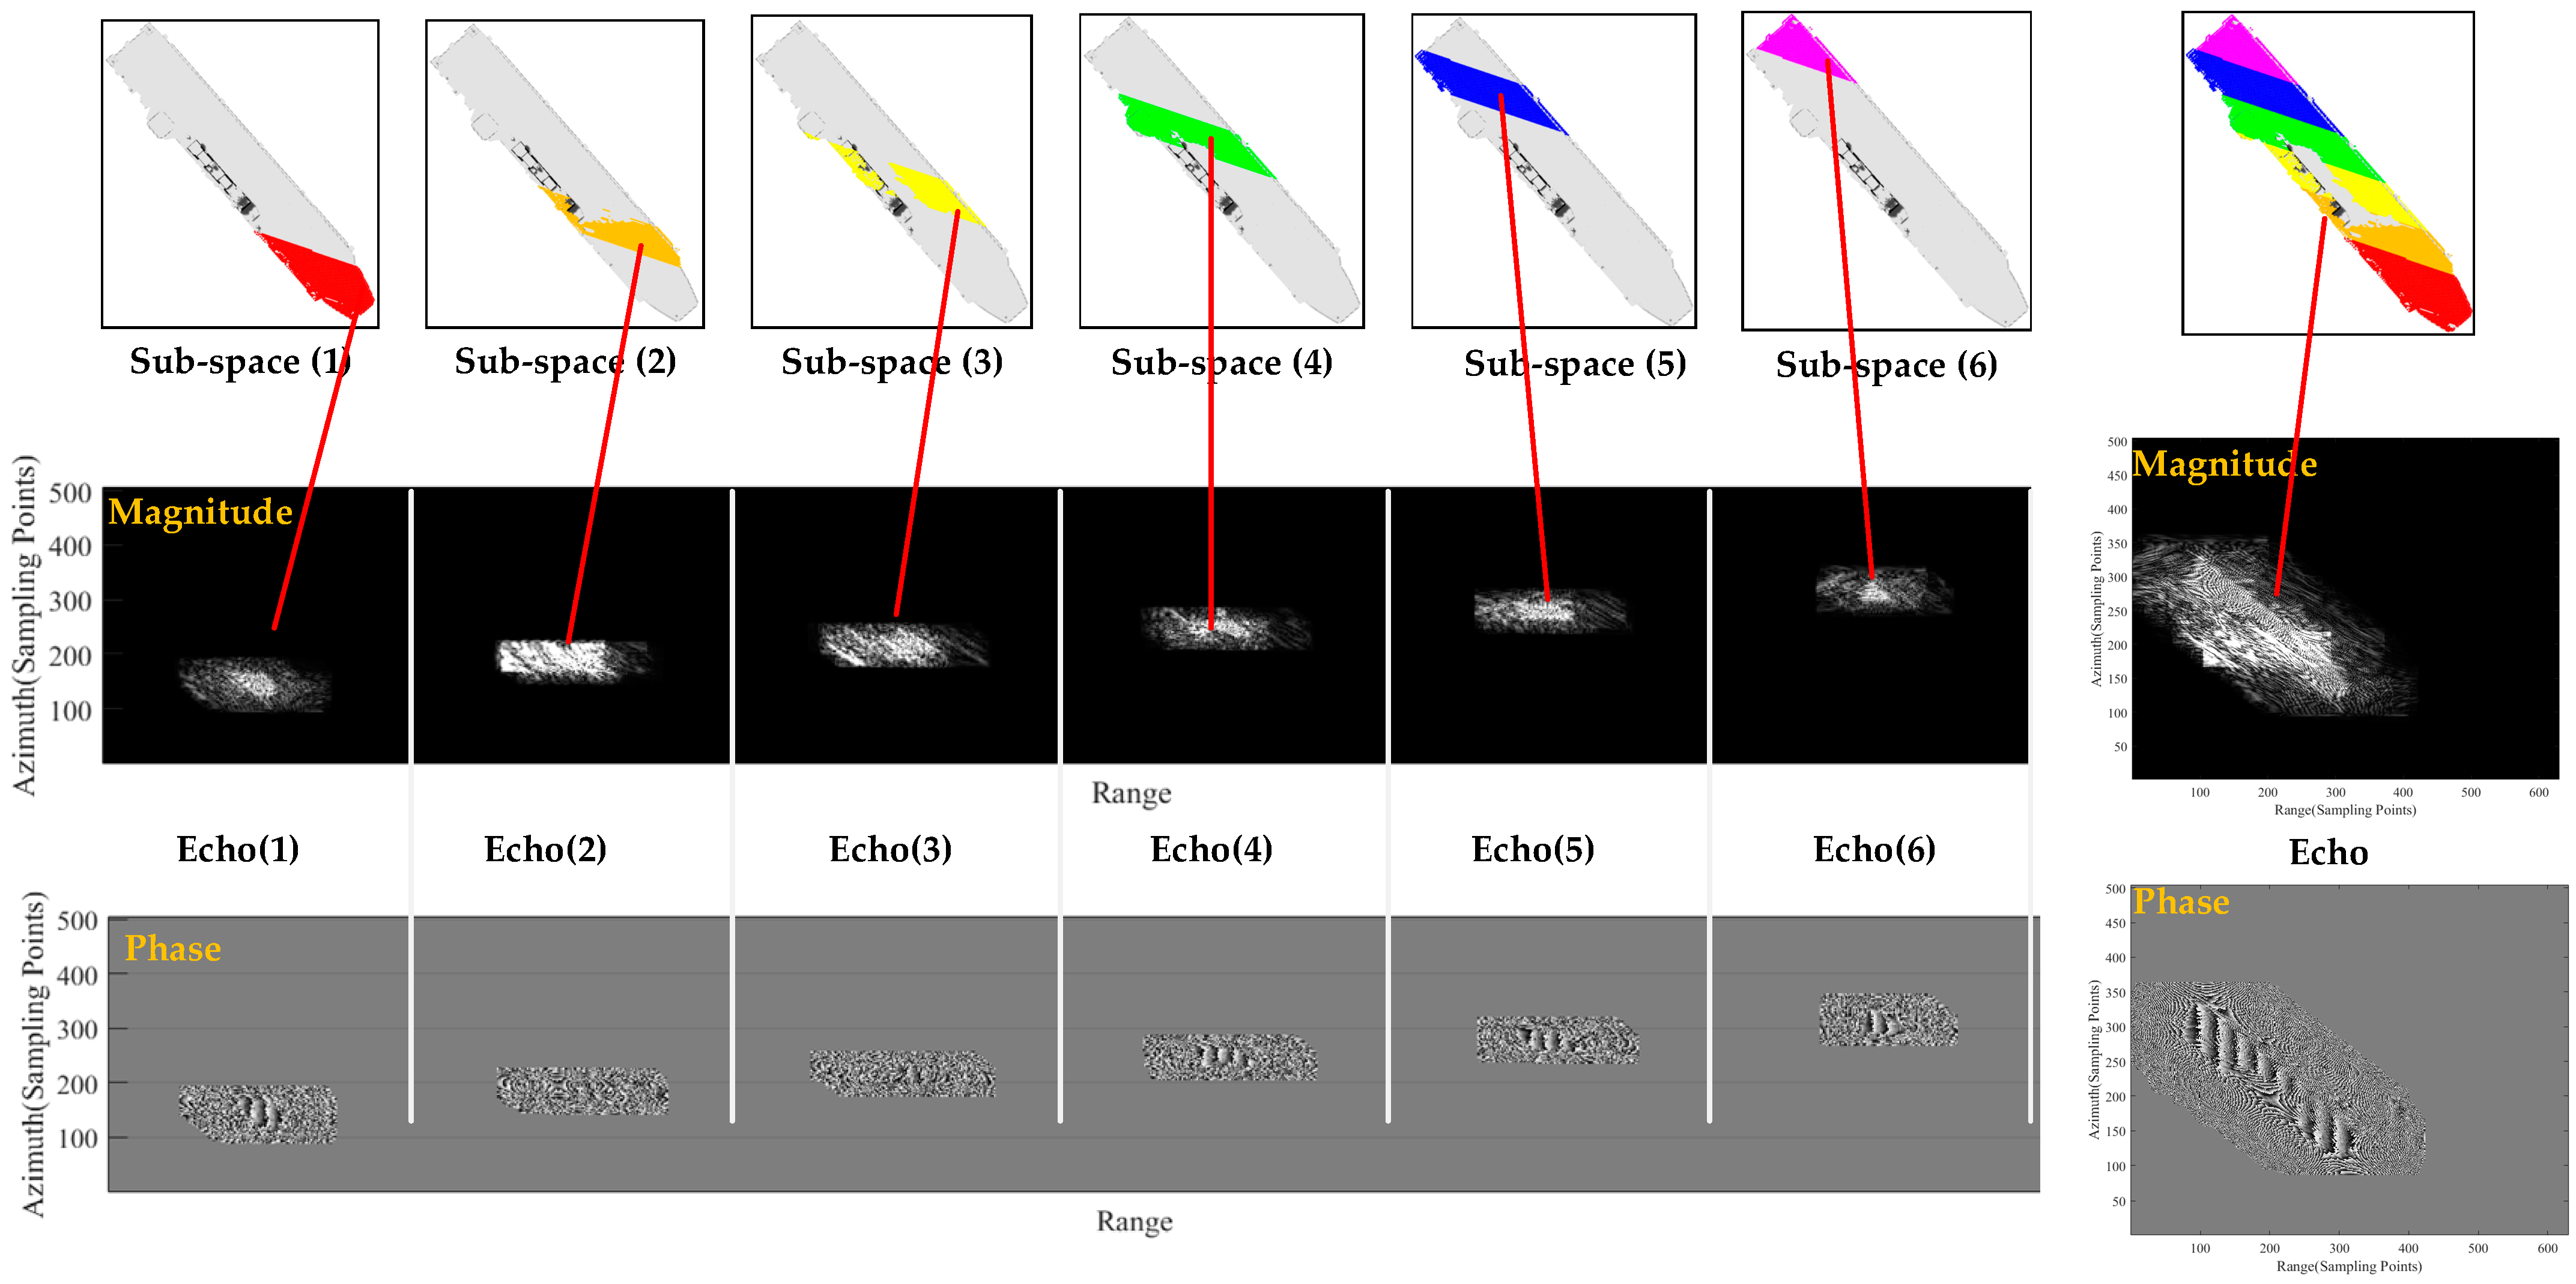
3.1. CUDA Thread Organization Based on Spatial Segmentation

Combining the design characteristics of the CUDA kernel function and the characteristics of the SAR phase reference system, we encode the correspondence between each echo matrix cell and the thread index of the CUDA 3D Grid and design a thread organization architecture that is compatible with the CUDA kernel function, as shown in Figure 6. The azimuthal and range direction of the echo matrix are divided into grids corresponding to the thread index X , Y of the planar dimension of the 3D Grid, respectively; the position of the spatial segmentation processed latticed blocks corresponds to the thread index Z of the longitudinal dimension of the 3D Grid, and the number of the latticed blocks determines the size of the longitudinal dimension ( Z -axis) of the 3D Grid.
We give specific constraints among the size of the lattice radiation area, the number of latticed blocks, the size of the 3D thread grid, the size of the 3D thread block, and the actual configuration parameters of the computer, controlling the parameters of the CUDA software into a reasonable range to ensure the effective operation of the CUDA program. The constraints can be expressed in Equation (11).
sum _ segs = ( P z + sub _ seg 1 ) / sub _ seg gridDim . z = ( sum _ segs + blockDim . z 1 ) / blockDim . z gridDim . x = ( echo . cols + blockDim . x 1 ) / blockDim . x gridDim . y = ( echo . rows + blockDim . y 1 ) / blockDim . y blockDim . x blockDim . y blockDim . z maxThreadsPerBlock gridDim . x gridDim . y gridDim . z   maxBlocksPerGrid
where sub _ seg is e size of the latticed block; sum _ segs   is e number of latticed blocks; P z   denotes the number of lattice radiation areas; blockDim and gridDim denote the size of the 3D thread grid and 3D thread block, respectively; and maxThreadsPerBlock and maxBlocksPerGrid denote the capacity size of the thread block and the thread net, respectively. echo . cols   and echo . rows are the number of sampling points along the azimuth and range directions of the target echo matrix, respectively. The index value of the planar dimension of the thread grid corresponds to each cell of the target echo matrix, and the number of rows and columns of the echo matrix is determined by the parameters of the SAR system and the area of the simulation scene, which can be referred to in Equation (12).
L s = 0.886 λ / D a R 0 N a = ( x max x min + L s ) / V r P R F N r = 2 R min / c 2 R max / c + T r F r
where L s is the synthetic aperture length; N a and N r are the number of azimuthal and range sampling points, matching with the number of rows and columns of the echo matrix; λ is the wavelength; D a is the azimuthal length of real aperture; R 0 is the shortest slant range in the scene; x max and x min are the azimuthal maxima and minima of the simulation scene, respectively; V r is the effective radar velocity; P R F is the pulse frequency; R max and R min are the near and far slant range, respectively; c is the light speed; T r is the pulse width; and F r is the range sampling frequency.
In order to further reduce the workload of each thread, each echo matrix cell matching with the two-dimensional envelope window is utilized to select the coherent lattices in each latticed block, and only a small number of coherent lattices falling into the two-dimensional envelope window are launched with EM waves and tracked for their multiple scattering paths. This step substantially reduces the amount of computation in each thread and accomplishes the local optimization of the CUDA kernel function. Each 2D envelope window is mainly created based on the 2D sampling time axis. The CUDA thread organization architecture based on the spatial segmentation we designed effectively coordinates the relationship among the SAR phase reference system characteristics, the echo matrix cells, and the hardware resources of the CUDA platform. The echo matrix cell method with regard to the target 2D echo matrix cell x , y is used as the subfield of the target backscatter field, which is equivalent to assigning each thread to each echo matrix cell, and each thread handles one latticed block P z , z < Z . This provides the basic conditions for the CUDA platform to efficiently call the GPU multi-threads to execute the SAR echo simulation task in parallel.

3.2. SAR Echo Generating and Imaging

After each thread finishes the task of executing the designed kernel function, the echo signal of the corresponding latticed blocks can be obtained, as shown in Figure 7, which is stored in two matrices with a real part and an imaginary part, respectively. The number of latticed blocks placed in each echo matrix cell x , y is matched with the number of threads in the longitudinal dimension ( Z -axis) of the 3D Grid, and the echo signal of the latticed blocks along the Z -axis in parallel are vectorially superimposed to obtain the echo matrix cell x , y information. The target echo matrix can be obtained by traversing the full cell positions of the echo matrix. The target SAR-simulated image can be obtained by focusing on the target echo matrix using the RD imaging algorithm.
The specific steps for generating echo signals and imaging based on the CUDA platform using each thread to execute the CUDA kernel function in parallel are as follows:
(1)
Based on the current position of the echo matrix cell x N a y N r , the sampling moments along the azimuthal and range directions can be locked, as determined by the divided azimuthal and range directions of the time axis;
(2)
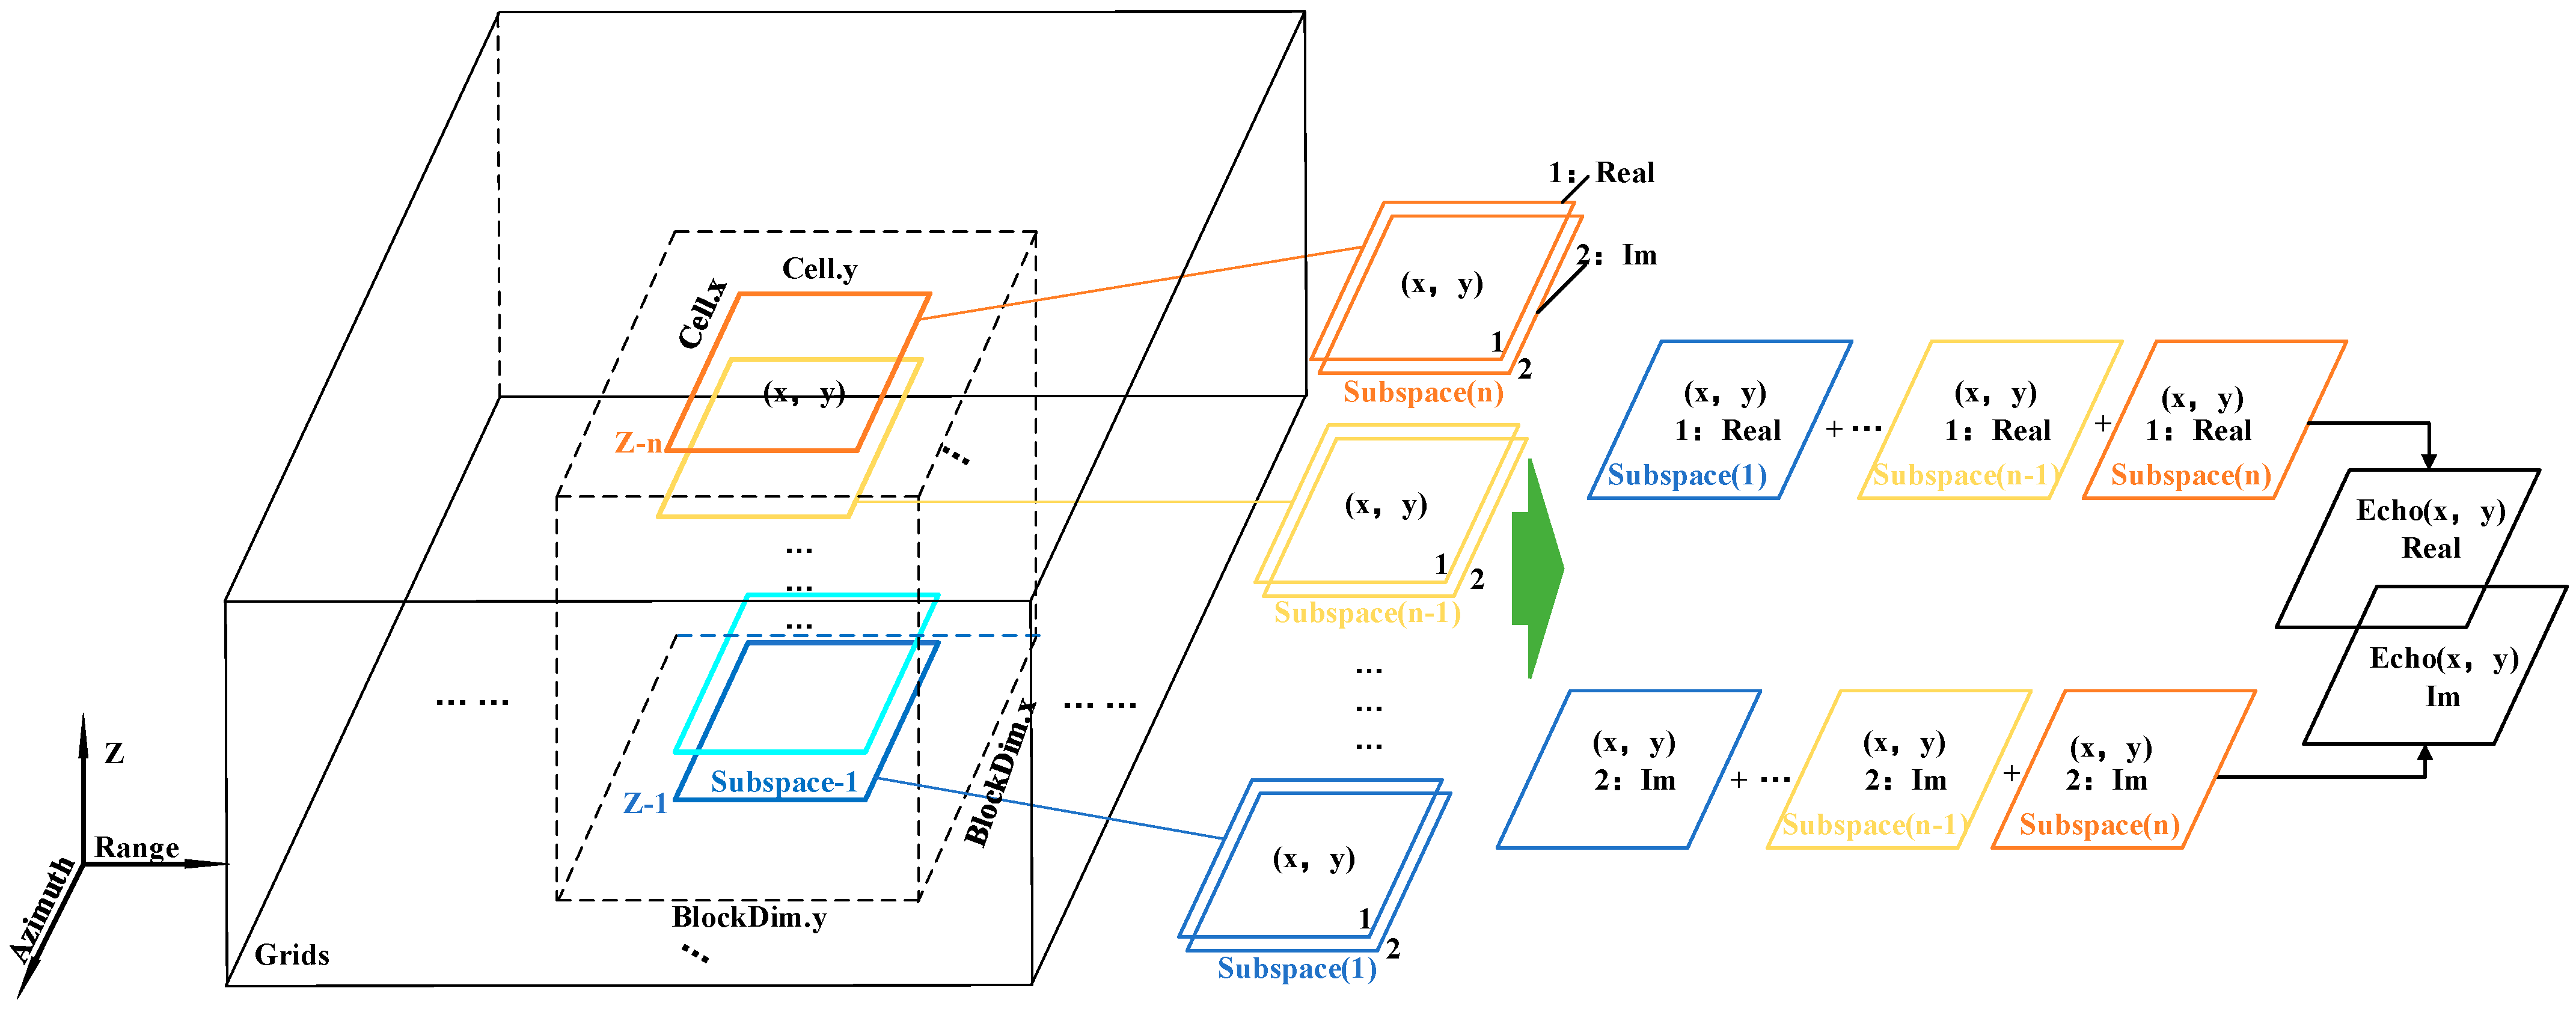
Each thread directly deals with the EM waves transmitted by each latticed block. The azimuthal and range envelope constraints on the echo matrix cell x , y are used to select the coherent lattices P z , P z N s < N in the current latticed block P z , z Z P z N . Then, the discrete EM waves for the coherent lattice target are transmitted. Multiple scattering path tracking of the transmitted EM waves is carried out, and the EM waves correspond to the coherent lattices P z i in turn. Using the multiple backscatter field calculation method in Section 2.2, the backscatter coefficient amplitude σ k i of the EM wave corresponds to the coherent lattices, and P z i is obtained; at the same time, the corresponding phase information P h a k i is obtained from the real-time slant range R k i of P z i . By multiplying the amplitude σ k i by the sine or cosine of the phase P h a k i , the real part a k i and the imaginary part b k i j of the corresponding echo signal can be obtained, respectively; the echo emulation signals for each latticed block are recorded as follows: E c h o z = k = 1 K i = 1 N s σ k i P h a k i = k = 1 K a k i k = 1 K b k i j .
(3)
By superimposing the echo matrix cell x , y corresponding to the echo of the latticed blocks along the longitudinal dimension Z of the grid, the echo matrix cell x , y can be denoted as E c h o x , y = z = 1 Z E c h o z ;
(4)
Each thread executes steps (2) to (3) independently. Traversing the positions of all the cells of the target echo matrix in parallel can quickly complete the echo simulation task. The raw echo matrix E c h o T = x = 1 N a y = 1 N r E c h o x , y is obtained and stored as complex numbers [ a + b i ] ;
(5)
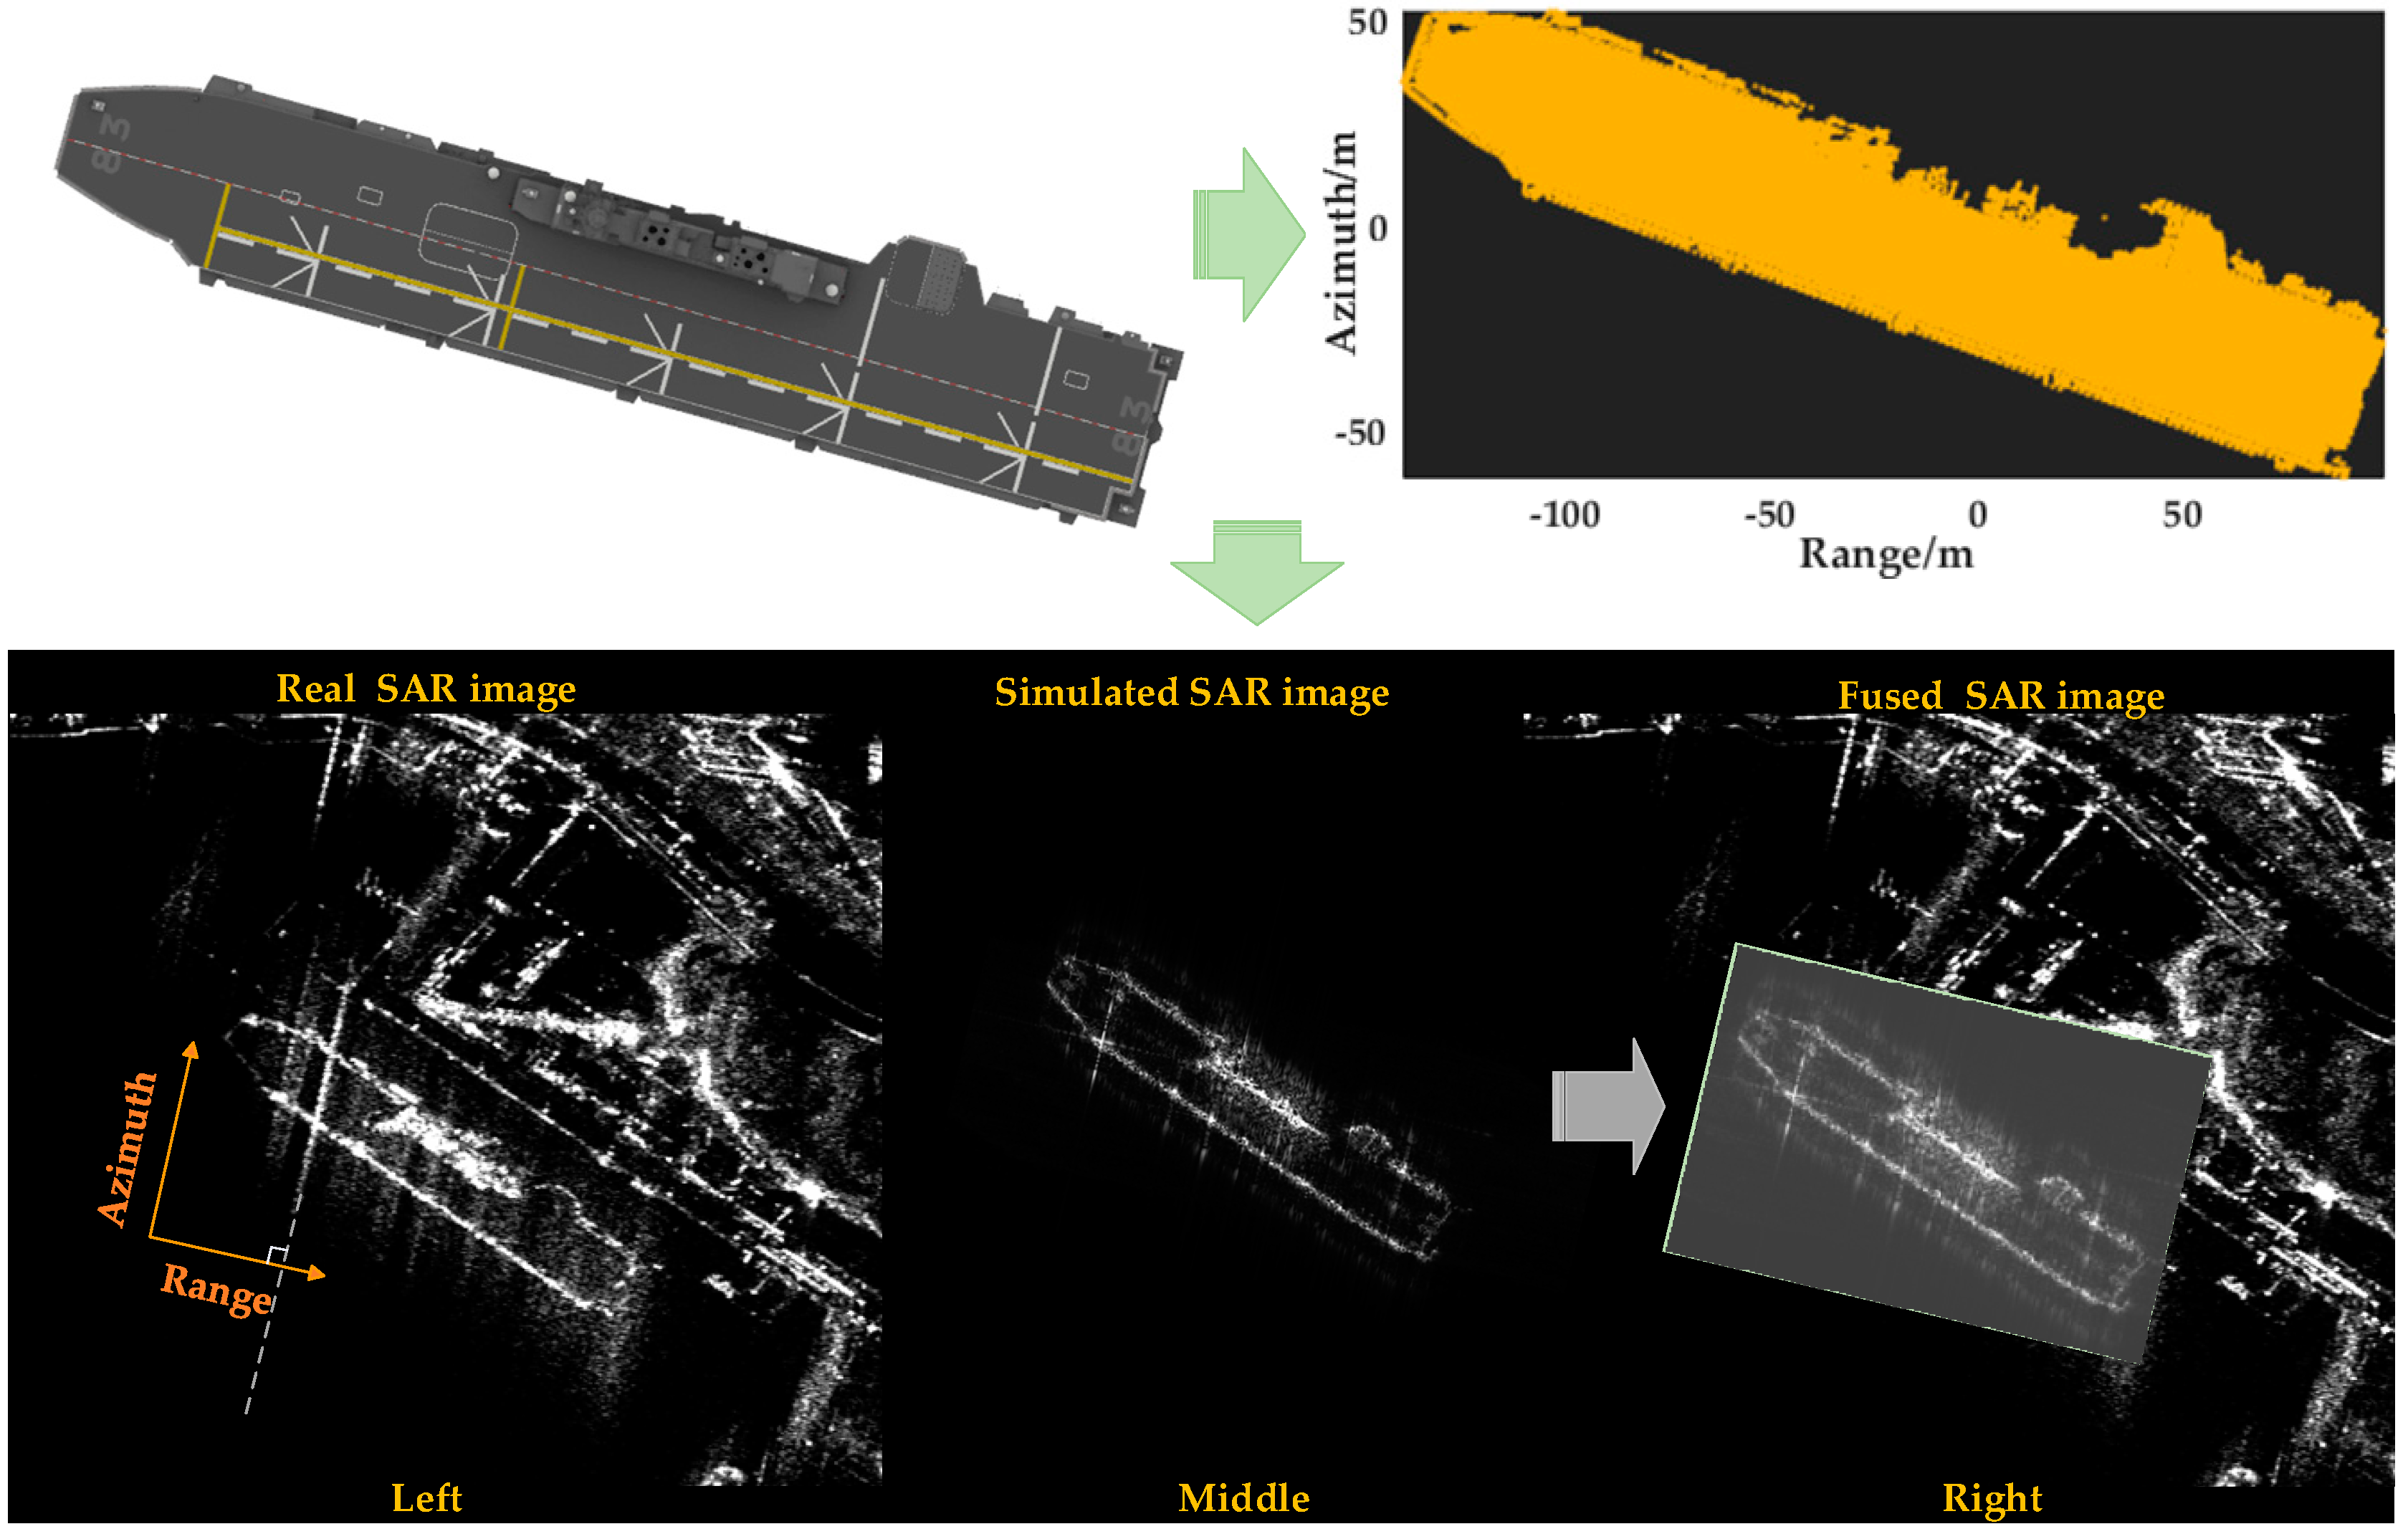
Finally, the raw echo matrix is downloaded from the GPU to the CPU. The RD imaging algorithm is used to focus the simulated echo matrix in two dimensions to obtain the simulated SAR image of the target, and the process of SAR echo imaging can be equated to the two-dimensional deconvolution process of reconstructing the backscatter coefficient of the target.
The proposed method utilizes the parallel computing advantage of the CUDA platform, integrating the SAR phase reference system and spatial segmentation theory. It adopts the echo matrix cell method to regard each target echo matrix cell as a subfield of the backscatter field to configure the 3D Grid planar dimensional index. Then, it segments the radar beam lattice radiation area into several latticed blocks to configure the 3D Grid longitudinal dimensional index and finally packages the entire target echo simulation task into the CUDA 3D Grid support mode. Finally, the whole target echo simulation task is packaged into the CUDA 3D Grid support mode, and the parallel echo simulation result of each latticed block is then spliced, which can quickly obtain the target SAR simulation echo signal. Meanwhile, the fast SAR image simulation architecture based on the CUDA platform designed in this paper can effectively reproduce the complete working process of the radar from transmitting the EM wave to receiving an echo, taking into account the time-varying characteristics of the target backscatter coefficient within the corresponding synthetic aperture time and overcoming the defects of the simulation with a fixed target backscatter coefficient under the assumption of a plane wave.

4. Discussion of Simulation Results

We select aircraft carrier targets and airplane targets, respectively, to carry out a SAR image simulation. The material property parameters can be flexibly configured according to the actual situation. In order to fully verify the validity of the method in this paper, the single and multiple scattering simulation results of the aircraft carrier target are compared, which are used to verify the reliability of the multiple backscatter field computation method proposed in Section 2.2 of this paper. The simulation results are compared with the real SAR images to verify the fidelity of the simulation results. The simulation test is carried out for the composite scenario of the multi-ships and the sea surface, and the simulation time consumption is given, which verifies the high efficiency of the proposed method. In order to further validate the generality of the proposed method, the simulation test of a small airplane target is added and compared with its real SAR image. After the above comprehensive testing and analysis, the effectiveness of the proposed method can be fully verified.

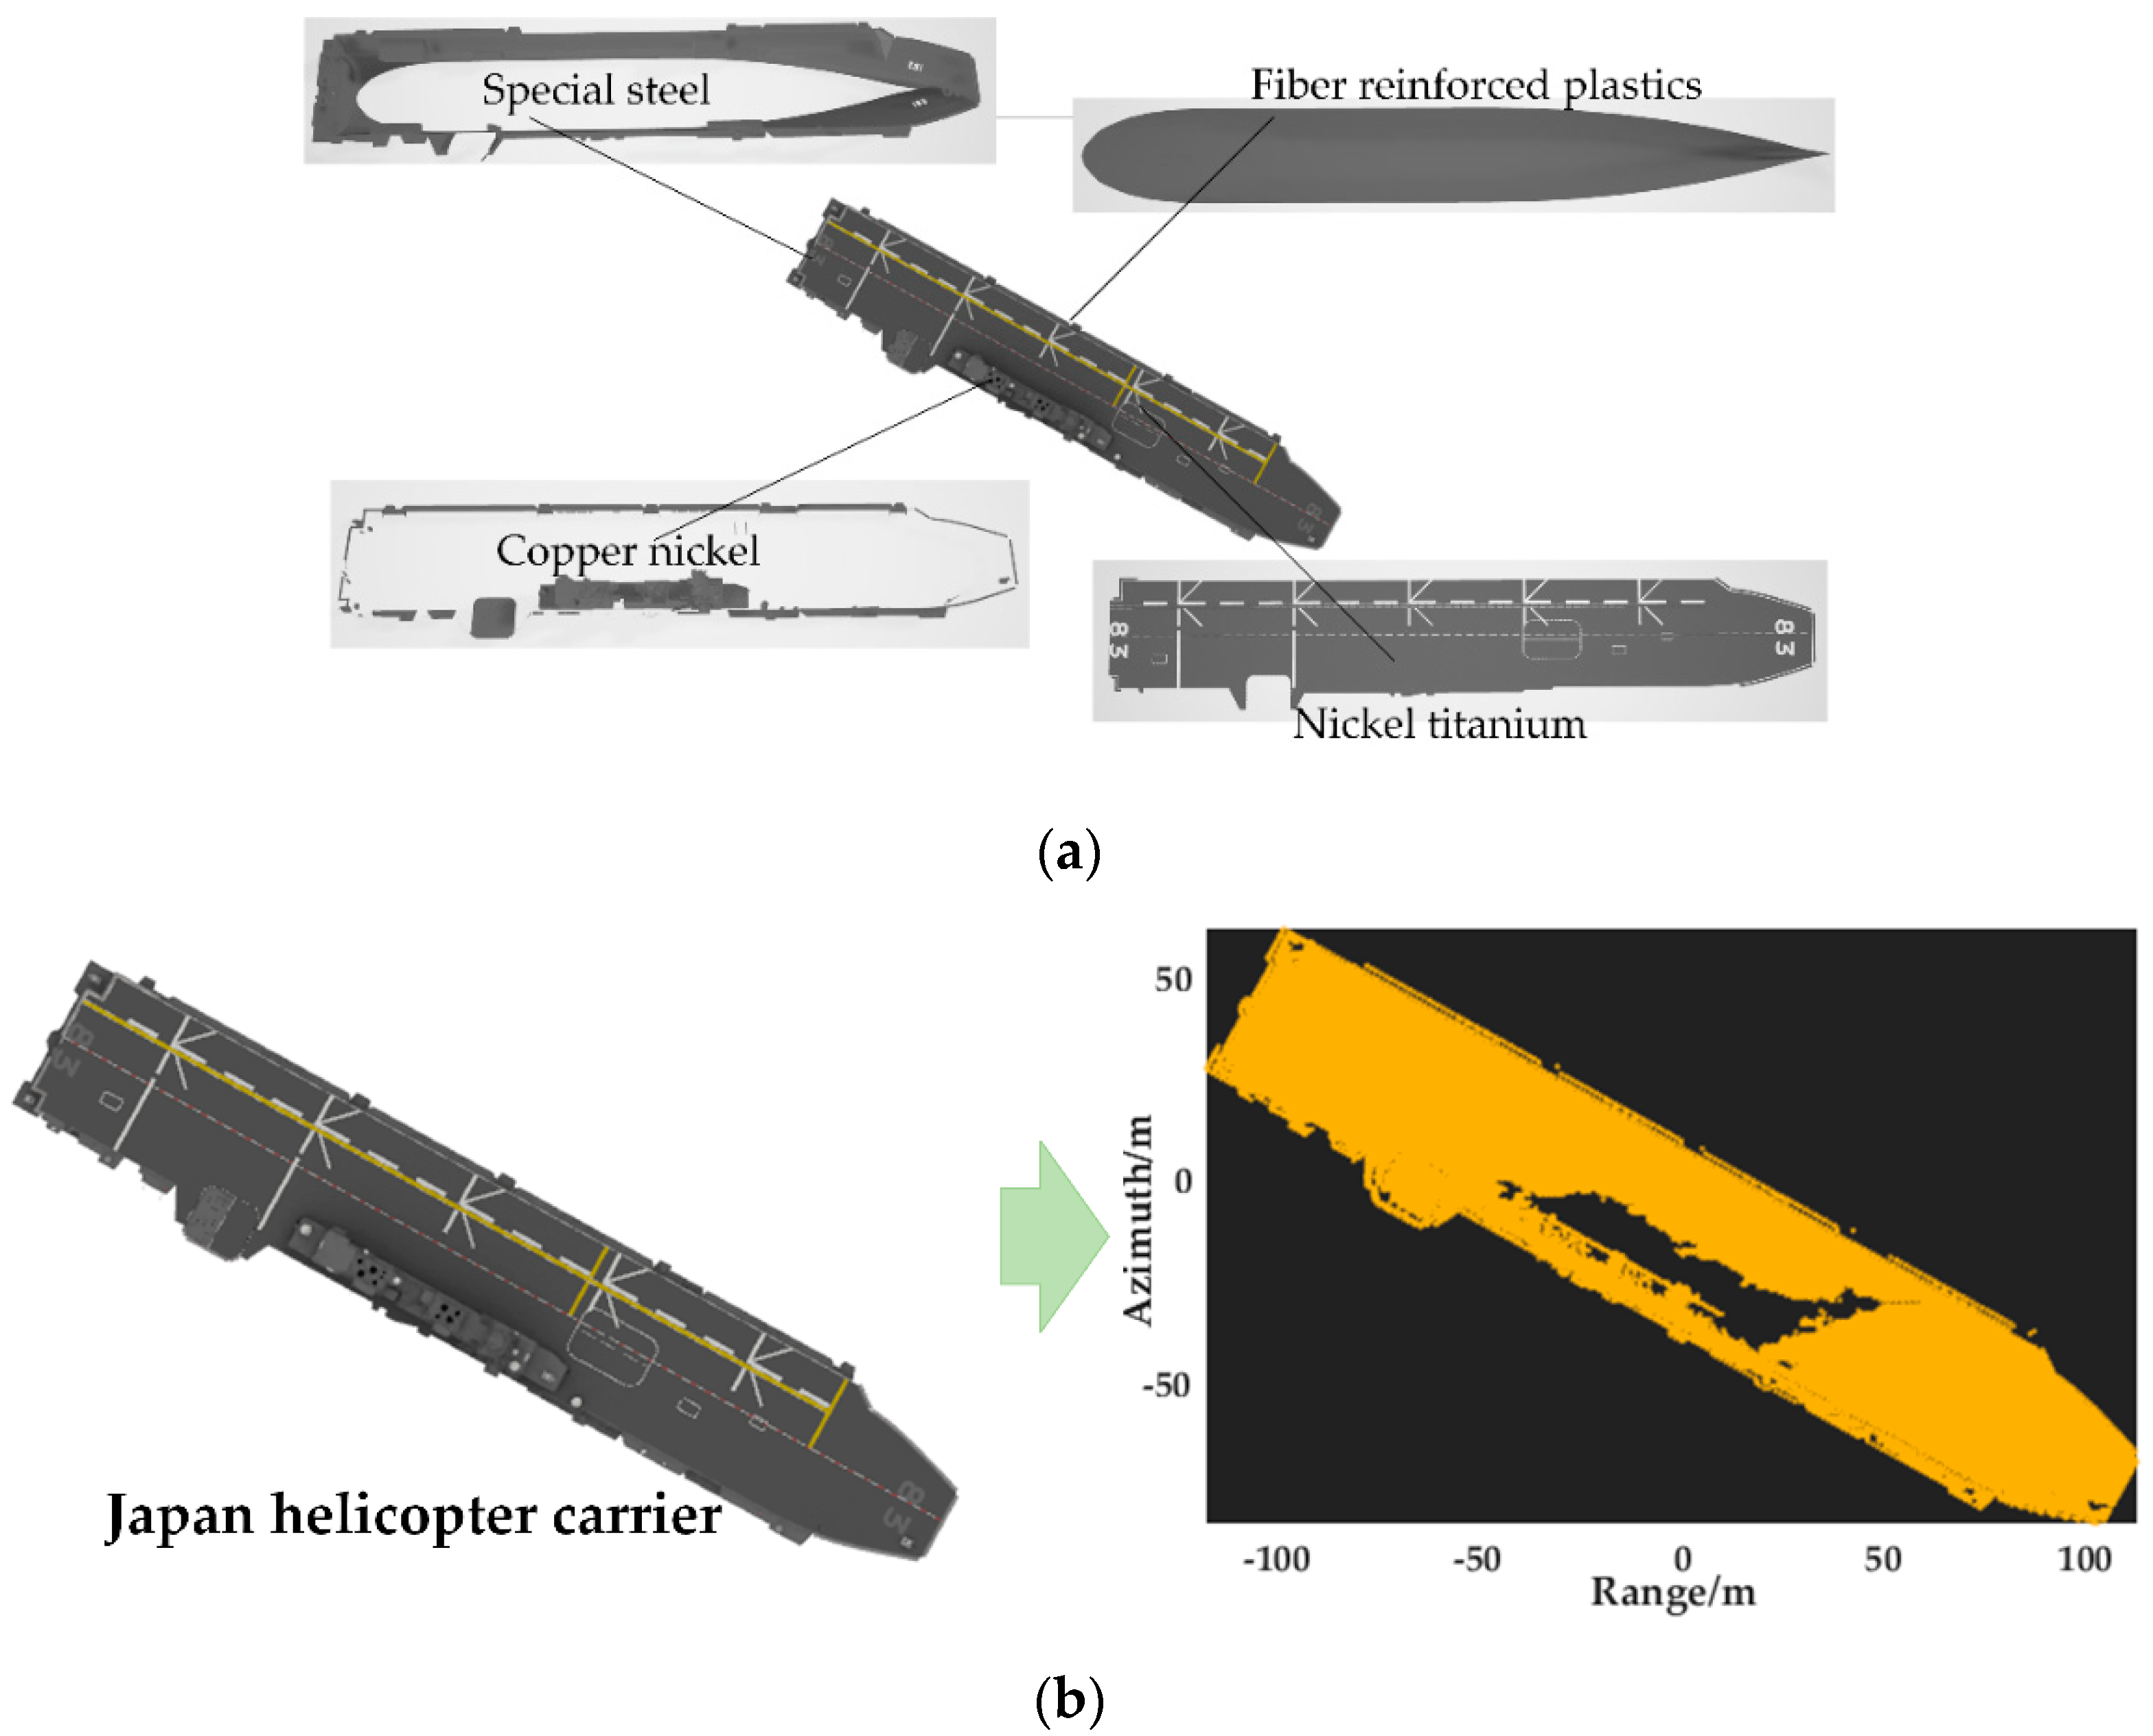
4.1. Test Parameters

Table 1 gives the basic SAR system parameters of the test. The CUDA configuration parameters are as follows: CUDA version 10.0. The shared memory size is 49,152 bytes. The number of registers per block is 65,536. The dimensions of the block are 1024, 1024, and 64. The dimensions of the Grid are 2147, 483,647, 65,535, and 65,535. The GPU clock rate is 1.70 GHz, see Table 2 for details.
The property parameters of the main components of the materials used in the test are shown in Table 3, which can be flexibly changed according to different application requirements. Usually, it is necessary to sample the materials on the surfaces of the target components and conduct comprehensive physical tests to obtain the material property parameters. Since the selected test target is non-cooperative, we set the material property parameters of the main material composition of the target surface reasonably based on objective experience. These material property parameters can be flexibly changed according to the actual situation, and the closer the material properties of the parameter are to the actual value, the more realistic the simulation results. The vacuum relative permittivity is usually set to 1, and the relative permittivity of metal materials is larger than that of the vacuum, which is used to quantify the influence of different materials on the polarimetric scatter intensity. the reflection coefficient is related to the anisotropy of the material microfacet normal vector distribution: when the diffuse coefficient is 1, and it indicates that the distribution of the microfacet normal vectors is completely anisotropic in all aspects. When the specular reflection coefficient is 1, it indicates that the distribution of the microfacet normal vectors is completely homogeneous in all aspects. The reflection index is used to constrain the specular surface distribution. The reflectance index is used to constrain the projection range of specular reflected energy in the receiving direction. The surface of a natural object is usually complex with a certain degree of roughness and gloss, and the diffuse coefficient and specular reflection coefficient are between 0 and 1, which are used to regulate the proportion of the normal vector distribution of the microfacet. When EM waves are incident with the surface, some of the energy will be absorbed, and the energy decay coefficient is used to quantify the wave-absorbing capacity of different materials, thus controlling the number of recurrences of multiple scatterings of EM waves.

4.2. Analysis of Simulation Results

The test first takes the Japanese helicopter aircraft carrier model as an example and refers to the material parameter list in Table 3 to assign values to the surface material parameters of the target’s main functional parts in turn. This test is mainly based on the actual geometric structure of the target and the amount of information related to the material. It then disassembles, assigns parameters, and splices the target in a refined way. As shown in Figure 8a, the test disassembles the Japanese helicopter carrier into four main functional parts. The target model is in OBJ file format, and its surface cell size is dual scale. Large surface facets are used for planar structure components and small surface facets are used for curved structure components, which not only ensures that the target has a detailed geometric texture but also effectively prevents the surface facets from being overdivided, which reduces the complexity of the calculation of the target multi-backscatter field. The total number of target model facets (length 166 m × width 22 m × height 57 m) is 204,362, according to the sampling rate in Table 1 (No. I). The interval of lattices is set to half the system sampling space, in compliance with the Naquist sampling law. The number of target lattices is 125,972.
As shown in Figure 9, in order to facilitate the demonstration of the process of fast SAR image simulation based on spatial segmentation proposed in this paper, the target latticed radiation area is initially segmented into six latticed blocks, and the located subspaces are labeled with different colors. The CUDA kernel function designed is executed in parallel on the CUDA platform to quickly obtain the amplitude and phase of the echo signal corresponding to each latticed block. The simulation time consumption of the test is detailed in Table 4, and compared with the CPU simulation time, the acceleration ratio can reach 210 times.
In order to better demonstrate the amplitude difference between single and multiple scattering, the amplitude difference of both is taken. In Figure 10, it can be visualized that multiple scattering is mainly concentrated in the command tower, secondary scattering mainly occurs at the edge of the hull enclosure, and single scattering mainly occurs on the flight deck, and the flight deck is also arranged with a number of dihedral angular of the catapult and the flame plate, which can be a secondary scattering. After the above comparative analysis, the reliability of the calculation method of multiple backscatter fields proposed in Section 2.2 of this paper can be effectively verified.
The real SAR image of the Japanese helicopter carrier is shown in Figure 11 (left), with the theoretical resolution of 1 m, and other system parameters as shown in Table 1 (No. I). The simulation results obtained by the method proposed in this paper are linearly stretched in amplitude to highlight the target silhouette; see Figure 11 (middle). As shown in Figure 11 (right), both geometric features can almost be fit together, and the amplitude distribution is generally consistent, with some local differences in details.
Meanwhile, Table 5 gives some common structural similarity metrics including the normalized correlation coefficient, mean hash similarity, and cosine similarity, indicating that there is a high degree of structural similarity between the simulation results and the real SAR images. Through the above qualitative and quantitative comprehensive analysis, it can be effectively verified that the target simulation results obtained using the proposed method have good fidelity.
Based on the above simulation test of the Japanese helicopter carrier, the simulation study of the composite scenario of multiple ships and the sea surface proceeded, as shown in Figure 12a, by selecting the ship 1 (length 305 m × width 75 m × height 60 m, 53,499 surface facets), the ship 2 (length 200 m × width 120 m × height 30 m, 127,443 surface facets), the ship 3 (length 167 m × width 22 m × height 57 m, 204,362 surface facets), and ship 4 (length 127 m × width 16 m × height 40 m, 48,766 surface facets) for sea surface posture simulation. As shown in Figure 12b, we use a directional spectrum of the sea wave made up of the JONSWAP spectrum and Donelan directional extension function to construct the 3D sea surface background [27,28]. The sea area is set to 1200 m × 1200 m, the wind speed is 10 m/s, the wind direction is 45°, and the number of sea surface facets is 289,040, which can be flexibly replaced according to different sea conditions and application requirements. The test selects the parameters in Table 1 (No. II). The total facet number in the composite model of the multi-ships targets and sea surface is 723,110. The interval of lattices is set to half the system sampling space, which is less than the theoretical resolution and higher than the requirement of the Naquist sampling law; the latticed radiation area is shown in Figure 12c, and the number of lattices is 3,928,125.
Figure 13 shows the SAR image simulation results of the composite model of the sea surface and ships. Usually, there is a “four-path” scattering phenomenon between the sea surface and the ships, including the single and multiple scattering of the ship self-body, the second scattering from the sea surface to the ship, the second scattering from the ship to the sea surface, and the multiple scattering among the sea surface, ship, and sea surface. The backscatter field of the composite scene is the vector superposition of the “four paths” backscatter field. As shown in Figure 13, the geometry of the carrier’s command tower on the sea surface is more complex and prone to multiple scattering, with stronger backscatter and higher display brightness. The flight deck is mostly a planar structure with only single scattering occurring, and it is relatively darker. The flight deck is also arranged with multiple catapults, flame arresters, and dihedral angle structures, displaying some sporadic bright spots. The dihedral scattering between the sea surface and the carrier’s side occurs on the edges of the ship. For the flight deck of the ship 1 carrier, the head geometry is obviously elevated, the local incidence angle becomes smaller, and the position shows slightly brighter. The ship 4 is relatively small in size, the tower geometry is stepped, the backscatter is stronger, and the amplitude is brighter. The simulation time consumption of the test is detailed in Table 6, and the comparison results with the CPU single-threaded simulation time consumption are given. The overall simulation details are more realistic and consistent with the microwave scattering theory, which can effectively verify the effectiveness of the proposed method.
In order to further verify the generality of the proposed method, the simulation test on a small airplane target is added. As shown in Figure 14a, we select the Quest Kodiak 100 model (the model size is 11 × 14 × 5 m, the number of surface facets is 13,765). The test selects the parameters in Table 1 (No. I). The simulation results are shown in Figure 14b. Comparing the simulation results with the real SAR images, the distribution of geometric and radiometric features is still approximately the same. The main reasons for the amplitude differences in local details are as follows. (1) The geometric and material parameters of the constructed target model have errors with the real target; (2) some system parameters of the open dataset are unknown, which are different from the parameters in Table 1 used in the test; (3) and the specific position of the target model with respect to the scene center is shifted from the real situation, and there is a difference in the local incidence angle.
Comprehensively analyzing the simulation time in Table 4, Table 6 and Table 7 shows that the proposed method can effectively improve the simulation efficiency of SAR images. After a comprehensive comparison and analysis of the above comprehensive test results, it can be fully proved that the proposed method can effectively improve the simulation efficiency under the premise of ensuring the fidelity of SAR simulation images.

5. Conclusions

We propose a BVH-assisted fast SAR image simulation method based on spatial segmentation and build a simulation architecture to realize fast SAR image simulation of distributed complex targets, including the simulation of EM wave transmission and the calculation of a multiple backscatter field The method utilizes the BVH algorithm to assist the EM wave transmission simulation and then adopts the ray tracing method for backward multiple scattered field calculation. Then, an efficient CUDA kernel function is designed based on the spatial segmentation theory and the echo matrix cell method, regarding each cell as a subfield of the total backscatter field. The corresponding two-dimensional envelope window of each cell is used as a constraint, effectively reducing the workload of the single-thread execution task. Finally, based on the CUDA platform, the target backscatter field is quickly obtained by traversing the positions of all cells of the echo matrix in parallel, and the simulated echo is processed by the RD imaging algorithm to obtain the target SAR simulated image. The test results show that the method proposed in this paper can effectively improve the simulation efficiency under the premise of ensuring the fidelity of the simulated SAR image. With the rapid development of the hardware acceleration platform, the following research will be carried out based on a high-performance parallel hardware platform and integrated spatial iterative segmentation, which will further improve the practical value of SAR image simulation technology.

Author Contributions

Conceptualization, K.W. and G.J.; methodology, K.W.; software, K.W.; validation, K.W.; formal analysis, K.W. and G.J.; investigation, K.W.; resources, G.J.; data curation, K.W. and G.J.; writing—original draft preparation, K.W.; writing—review and editing, K.W. and X.X.; visualization, K.W.; supervision, G.J.; project administration, G.J.; funding acquisition, G.J. and Q.S. All authors have read and agreed to the published version of the manuscript.

Funding

This work was supported in part by the National Natural Science Foundation of China under Grant 42201492 and the 2022 Transportation Research Funding Plan of Henan under Grant 2022-3-2.

Institutional Review Board Statement

Not applicable.

Informed Consent Statement

Not applicable.

Data Availability Statement

The original contributions presented in the study are included in the article, further inquiries can be directed to the corresponding author.

Acknowledgments

The authors would like to express their sincere thanks to the members of the editorial team and the anonymous reviewers for their guidance and valuable comments on this article.

Conflicts of Interest

Author Quanjie Shi was employed by the company Henan Jingwei Beidou Navigation Technology Co., Ltd. The remaining authors declare that the research was conducted in the absence of any commercial or financial relationships that could be construed as a potential conflict of interest.

References

  1. Holtzman, J.C.; Frost, V.S.; Abbott, J.L.; Kaupp, V.H. Radar image simulation. IEEE Trans. Geosci. Electron. 1978, 16, 296–303. [Google Scholar] [CrossRef]
  2. Chen, K.S. Principles of Synthetic Aperture Radar Imaging: A System Simulation Approach; CRC Press: Boca Raton, FL, USA, 2015. [Google Scholar]
  3. Brown, W.M. Synthetic aperture radar. IEEE Trans. Aerosp. Electron. Syst. 1967, 2, 217–229. [Google Scholar] [CrossRef]
  4. Auer, S.; Hinz, S.; Bamler, R. Ray Tracing for Simulating Reflection Phenomena in SAR Images. In Proceedings of the Geoscience and Remote Sensing Symposium, 2008 IEEE International-IGARSS, Boston, MA, USA, 6–11 July 2008. [Google Scholar]
  5. Auer, S.; Hinz, S.; Bamler, R. Ray-tracing simulation techniques for understanding high-resolution SAR images. IEEE Trans. Geosci. Remote Sens. 2009, 48, 1445–1456. [Google Scholar] [CrossRef]
  6. Auer, S.; Bamler, R.; Reinartz, P. RaySAR-3D SAR simulator: Now open source. In Proceedings of the IEEE International Geoscience and Remote Sensing Symposium (IGARSS), Beijing, China, 10–15 July 2016. [Google Scholar]
  7. Franceschetti, G.; Iodice, A.; Riccio, D.; Ruello, G. SAR raw signal simulation for urban structures. IEEE Trans. Geosci. Remote Sens. 2003, 41, 1986–1995. [Google Scholar] [CrossRef]
  8. Franceschetti, G.; Iodice, A.; Riccio, D.; Ruello, G. Efficient simulation of hybrid stripmap/spotlight SAR raw signals from extended scenes. IEEE Trans. Geosci. Remote Sens. 2004, 42, 2385–2396. [Google Scholar] [CrossRef]
  9. Franceschetti, G.; Guida, R.; Iodice, A.; Riccio, D.; Ruello, G.; Stilla, U. Simulation Tools for Interpretation of High Resolution SAR Images of Urban Areas. In Proceedings of the IEEE Urban Remote Sensing Joint Event, Paris, France, 11–13 April 2007. [Google Scholar]
  10. Liu, T.; Wang, K.; Liu, X. SAR simulation for large scenes by ray tracing technique based on GPU. In Proceedings of the 2013 IEEE International Geoscience and Remote Sensing Symposium-IGARSS, Melbourne, VIC, Australia, 21–26 July 2013; pp. 1131–1134. [Google Scholar]
  11. Xia, W.; Wei, X. SAR image simulation and verification for urban structure. Int. J. Electron. 2016, 103, 247–260. [Google Scholar] [CrossRef]
  12. Dong, C.; Guo, L.; Meng, X. An Accelerated Algorithm Based on GO-PO/PTD and CWMFSM for EM Scattering from the Ship over a Sea Surface and SAR Image Formation. IEEE Trans. Antennas Propag. 2020, 68, 3934–3944. [Google Scholar] [CrossRef]
  13. Drozdowicz, J. The Open-Source Framework for 3D Synthetic Aperture Radar Simulation. IEEE Access 2021, 9, 39518–39529. [Google Scholar] [CrossRef]
  14. Chiang, C.; Chen, K.; Yang, Y. SAR Image Simulation of Complex Target including Multiple Scattering. Remote Sens. 2021, 13, 4854. [Google Scholar] [CrossRef]
  15. Wu, K.; Jin, G.; Xiong, X.; Zhang, H.; Wang, L. SAR Image Simulation Based on Effective View and Ray Tracing. Remote Sens. 2022, 14, 5754. [Google Scholar] [CrossRef]
  16. Wu, K.; Jin, G.; Xiong, X.; Zhang, H.; Wang, L. Fast SAR Image Simulation Based on Echo Matrix Cell Algorithm Including Multiple Scattering. Remote Sens. 2023, 15, 3637. [Google Scholar] [CrossRef]
  17. Balz, T.; Stilla, U. Hybrid GPU-based single-and double-bounce SAR simulation. IEEE Trans. Geosci. Remote Sens. 2009, 47, 3519–3529. [Google Scholar] [CrossRef]
  18. Zhang, F.; Wang, B.; Xiang, M. Accelerating InSAR raw data simulation on GPU using CUDA. In Proceedings of the IEEE International Geoscience and Remote Sensing Symposium, Honolulu, HI, USA, 25–30 July 2010. [Google Scholar]
  19. Zhu, H.; Xu, H.; Feng, L. Application of GPU for missile-borne SAR raw signal simulation. In Proceedings of the International Conference on Artificial Intelligence, Management Science and Electronic Commerce (AIMSEC), Zhengzhou, China, 8–10 August 2011. [Google Scholar]
  20. Chen, H.; Huang, Y.; Yang, J. Airborne bistatic SAR echo simulator based on Multi-GPU platform. In Proceedings of the 2011 IEEE CIE International Conference on Radar, Chengdu, China, 24–27 October 2011; pp. 1–5. [Google Scholar]
  21. Sheng, H.; Zhou, M.; Wang, K.; Liu, X. SAR echo simulation from numerous scattering cells based on GPU. In Proceedings of the IET International Radar Conference 2013, Xi’an, China, 14–16 April 2013; pp. 1–5. [Google Scholar] [CrossRef]
  22. Sheng, H.; Wang, K.; Liu, X.; Li, J. A fast raw data simulator for the stripmap SAR based on CUDA via GPU. In Proceedings of the 2013 IEEE International Geoscience and Remote Sensing Symposium—IGARSS, Melbourne, VIC, Australia, 21–26 July 2013; pp. 915–918. [Google Scholar]
  23. Zhang, F.; Hu, C.; Li, W.; Hu, W. Accelerating time-domain SAR raw data simulation for large areas using multi-GPUs. IEEE J. Sel. Top. Appl. Earth Observ. Remote Sens. 2014, 7, 3956–3966. [Google Scholar] [CrossRef]
  24. Xu, Y.; Zeng, D.; Yan, T.; Xu, X. A real-time SAR echo simulator based on FPGA and parallel computing. Telkomnika 2015, 13, 806–812. [Google Scholar]
  25. Zhang, F.; Hu, C.; Li, W.; Hu, W.; Wang, P.; Li, H. A Deep Collaborative Computing Based SAR Raw Data Simulation on Multiple CPU/GPU Platform. IEEE J. Sel. Top. Appl. Earth Obs. Remote Sens. 2017, 10, 387–399. [Google Scholar] [CrossRef]
  26. Zhang, F.; Yao, X.; Tang, H.; Yin, Q.; Hu, Y.; Lei, B. Multiple Mode SAR Raw Data Simulation and Parallel Acceleration for Gaofen-3 Mission. IEEE J. Sel. Top. Appl. Earth Obs. Remote Sens. 2018, 11, 2115–2126. [Google Scholar] [CrossRef]
  27. Hasselmann, D.; Dunckel, M.; Ewing, J.A. Directional Wave Spectra Observed during JONSWAP 1973. J. Phys. Ocean. 1980, 10, 1264–1280. [Google Scholar] [CrossRef]
  28. Neumann, G. On Ocean Wave Spectra and a New Method of Forecasting Wind-Generated Sea; Beach Erosion Board, Corps of Engineering, Technical Memorandum: Washington, DC, USA, 1953; p. 43. [Google Scholar]
Figure 1. The workflow of BVH-assisted EM wave transmission.
Applsci 14 03340 g001
Figure 2. Beam scanning model.
Applsci 14 03340 g002
Figure 3. Process of hitting leaf node assisted by BVH.
Applsci 14 03340 g003
Figure 4. EM wave transmission simulation.
Applsci 14 03340 g004
Figure 5. The workflow of fast SAR image simulation based on spatial segmentation.
Applsci 14 03340 g005
Figure 6. CUDA thread organization based on spatial segmentation.
Applsci 14 03340 g006
Figure 7. Parallel SAR echo simulation.
Applsci 14 03340 g007
Figure 8. Japanese helicopter carrier model and latticed radiation area. (a) Assignment of the material property parameter. (b) Latticed radiation area of the Japanese helicopter carrier.
Applsci 14 03340 g008
Figure 9. Splicing of the latticed block echo signal.
Applsci 14 03340 g009
Figure 10. Amplitude difference between single scattering and multiple scattering.
Applsci 14 03340 g010
Figure 11. Comparison between simulation result and real SAR image of Japanese helicopter carrier.
Applsci 14 03340 g011
Figure 12. Composite model and lattices of sea surface and multi-ships. (a) Multi-ships models. (b) Composite model of the sea surface and multi-ships. (c) Latticed radiation area of the composite model.
Applsci 14 03340 g012
Figure 13. Simulation results of the composite model of the sea surface and ships.
Applsci 14 03340 g013
Figure 14. Simulation results of the Quest Kodiak 100. (a) Quest Kodiak 100. (b) Comparison of simulated and real SAR images of the Quest Kodiak 100.
Applsci 14 03340 g014
Table 1. System parameters.
System ParametersNo. INo. II
Bandwidth180 MHz180 MHz
Pulse duration1.0 µs1.0 µs
Range sample space0.68 m0.75 m
Incidence angle60°45°
Center frequency15 GHz15 GHz
Platform height2.0 km2.0 km
Effective radar velocity300 m/s300 m/s
Doppler bandwidth400 Hz200 Hz
PRF450 Hz250 Hz
Azimuth sample space0.66 m1.20 m
Table 2. Configuration parameters.
GPU
Version
CUDA VersionGraphics MemoryCompiler EnvironmentCPU
Version
Total MemoryOperation System
NVIDIA GeForce RTX306010.06GVS201911th Gen Intel(R) Core (TM) i7-11800H16 GWindows 10
Table 3. Material property parameters.
Material
(Main Component)
Relative
Permittivity
Diffuse
Coefficient
Specular
Coefficient
Specular
Index
Energy Decay
Coefficient
Aluminum8.000.750.8050.000.20
Fiber-reinforced plastics8.500.800.6050.000.10
Special steel9.500.650.8030.000.25
Copper–nickel12.000.700.5050.000.15
Inconel10.500.750.4030.000.10
Nickel–titanium15.000.650.7040.000.20
Table 4. Time consumption.
ModelSAR Image Size
( H H )
Lattice
Number
CPU TimeGPU TimeSpeedup
Rate
Japanese
helicopter carrier
Azimuth680
samples
125,97265.14 h0.31 h210.1×
Range796
samples
Table 5. Quantitative evaluation of simulation results.
Reference ImageNormalized
Cross-Correlation
Mean Hash
Similarity
Cosine
Similarity
Real SAR image0.890.910.93
Table 6. Time consumption.
ModelSAR Image Size ( H H )Lattice
Number
CPU TimeGPU TimeSpeedup
Rate
Composite model of the sea and shipsAzimuth1021
samples
3,928,125242.51 h0.92 h263.6×
Range1319
samples
Table 7. Time consumption.
ModelSAR Image Size
( H H )
Rotation
Angle
Lattices
Number
CPU TimeGPU TimeSpeedup
Rate
Quest Kodiak 100Azimuth355
samples
699656.96 min0.29 min196.4×
60°924473.70 min0.32 min230.3×
Range577
samples
120°922977.79 min0.38 min204.7×
180°662346.60 min0.21 min221.9×
Disclaimer/Publisher’s Note: The statements, opinions and data contained in all publications are solely those of the individual author(s) and contributor(s) and not of MDPI and/or the editor(s). MDPI and/or the editor(s) disclaim responsibility for any injury to people or property resulting from any ideas, methods, instructions or products referred to in the content.

