Article

Development of Gluten-Free Bread Based on Maize and Buckwheat and Enriched with Aromatic Herbs and Spices

by
Laura Ruiz-Aceituno
1,
Natalia Casado
2,
Emma Arriero-Romo
2,
Sonia Morante-Zarcero
2,
Almudena Lázaro
1,* and
Isabel Sierra
2,3,*
1
Centro de Innovación Gastronómica de la Comunidad de Madrid, Instituto Madrileño de Investigación y Desarrollo Rural, Agrario y Alimentario (IMIDRA), Calle Goya 5-7, 28001 Madrid, Spain
2
Departamento de Tecnología Química y Ambiental, Escuela Superior de Ciencias Experimentales y Tecnología (ESCET), Universidad Rey Juan Carlos, C/Tulipán s/n, 28933 Móstoles, Spain
3
Instituto de Investigación de Tecnologías para la Sostenibilidad, Universidad Rey Juan Carlos, C/Tulipán s/n, 28933 Móstoles, Spain
*
Authors to whom correspondence should be addressed.
Appl. Sci. 2024, 14(8), 3348; https://doi.org/10.3390/app14083348
Submission received: 11 March 2024 / Revised: 9 April 2024 / Accepted: 12 April 2024 / Published: 16 April 2024
(This article belongs to the Special Issue Advanced Food Processing Technologies and Food Quality)

Abstract

:
This work aimed to develop high-quality gluten-free bread based on maize and buckwheat with good palatability and texture properties. Different aromatic herbs and spices were incorporated as ingredients to evaluate whether their addition could influence the acceptability of consumers by improving the sensory properties of the final product. The bread formulation was first optimized through a response surface methodology. Accordingly, high specific volume, high springiness, and low hardness provided the best theoretical bread quality. However, when developing the product, some sensory defects were detected. Therefore, the addition of other ingredients (e.g., oil, sugar, and yeast) was tested. Finally, five different gluten-free bread with different combinations of aromatic herbs and spices were obtained. They were nutritionally characterized and subjected to sensory analysis by a panel of 140 consumers. The chemical composition of all bread was very similar, with only slight differences among them. Likewise, all of them received acceptable sensory scores (>5) from consumers, and some combinations of herbs and spices obtained scores higher than in the control bread (without herbs and spices). Overall, the gluten-free bread formulated with the combination of basil and oregano was the one that consumers significantly liked the most.

1. Introduction

In the last decade, the development and demand for gluten-free products have experienced an important increase within the food industry. This is mainly due to the increasing prevalence and greater awareness of celiac disease, non-celiac gluten sensitivity (NCGS), and wheat allergies. Likewise, a large number of consumers have the social perception that a gluten-free diet is healthier because of the relationship between gluten and inflammation of the gastrointestinal tract and caloric intake [1]. Accordingly, there has been increasing demand for substituting wheat in foodstuffs with other gluten-free alternatives, such as maize, sweet potato, and rice bran flour, among others. However, despite the wide variety of gluten-free products currently available on the market, many of them do not meet the nutritional and sensory requirements of these consumers. Hence, consumers in general show dissatisfaction with these products, since many of them have little nutritional value, different taste, bad texture, bad appearance, short shelf life, etc. For instance, the study carried out by Alencar et al. (2021) about the perception of celiac consumers towards gluten-free products revealed that flavor and texture are among the main sensory properties that should be improved in them, as they are not like those in the gluten-containing products [2]. For this reason, efforts are still needed within the food industry to improve the characteristics of gluten-free products.
Among the different products, the development of gluten-free bread with suitable sensory acceptance is one of the main challenges within the food industry. Bread is a basic food worldwide. The main ingredients in bread making are flour, water, and, optionally, yeast and salt [3]. It is generally made with flours from cereals that contain gluten (wheat, rye, oats, and barley) since the gluten allows for the creation of a three-dimensional network, which is essential in the baking and dough preparation processes. This network improves the texture and flavor, retains water and fats, preserves the air incorporated during kneading, and improves adhesiveness [4]. For this reason, the preparation of gluten-free bread is not easy due to the absence of the three-dimensional network and the viscoelastic properties provided by gluten. Moreover, it is worth highlighting that the methodology followed to prepare gluten-free bread is different from the conventional bread-making process. For instance, gluten-free doughs need to be placed in baking molds and undergo longer fermentation and baking times than conventional bread due to the higher water content [4]. Additionally, it is necessary to add ingredients that help to replace the gluten properties to achieve characteristics similar to those of conventional bread. Thus, hydrocolloids, such as xanthan gum and psyllium husk, are normally used to replace gluten since they help to improve the structure, viscosity, and elasticity of the gluten-free dough [5]. On the other hand, to avoid flours from cereals containing gluten, gluten-free cereal flour mixtures in different proportions are normally employed. Among these gluten-free flours, the most common are those from maize, rice, and buckwheat [6]. However, despite the industry’s efforts to improve processes, the resulting final product does not usually have much sensory acceptability by consumers compared to conventional bread [7].
Accordingly, different strategies have been carried out to improve bread quality. For instance, different flours from cereals and pseudocereals (spelt, quinoa, amaranth), oilseeds (chia, sunflower, flaxseed, pumpkin), tubers (sweet potato, tiger nuts), fibers (fructans), fruits (blueberry, apple, and grapefruit), herbs (spearmint, oregano, thyme, satureja), spices (fennel seeds, cinnamon, clove), and even yogurt and kefir have been added as ingredients in bread formulation [8,9,10,11,12,13,14,15,16,17,18,19,20,21,22]. These studies have revealed that these types of modifications in bread formulation can lead to unexpected changes in the physicochemical and sensory properties of the final product. Hence, the incorporation of some ingredients in the breadmaking process, such as aromatic herbs and spices, could significantly change and improve the final sensory properties (i.e., flavor, odor, appearance, etc.) of bread and thus have an influence on the acceptability and consumers’ choice. Moreover, the addition of aromatic herbs and spices as bread ingredients may increase the nutritional quality of the final product and contribute to the intake of phytochemicals with health benefits for consumers [22].
In this context, the aims of the present study were to develop and formulate high-quality gluten-free bread based on maize and buckwheat flours with good physical, nutritional, and palatability properties and to evaluate whether the addition of aromatic herbs and spices could influence the acceptability of consumers by improving the sensory properties of the final product.

2. Materials and Methods

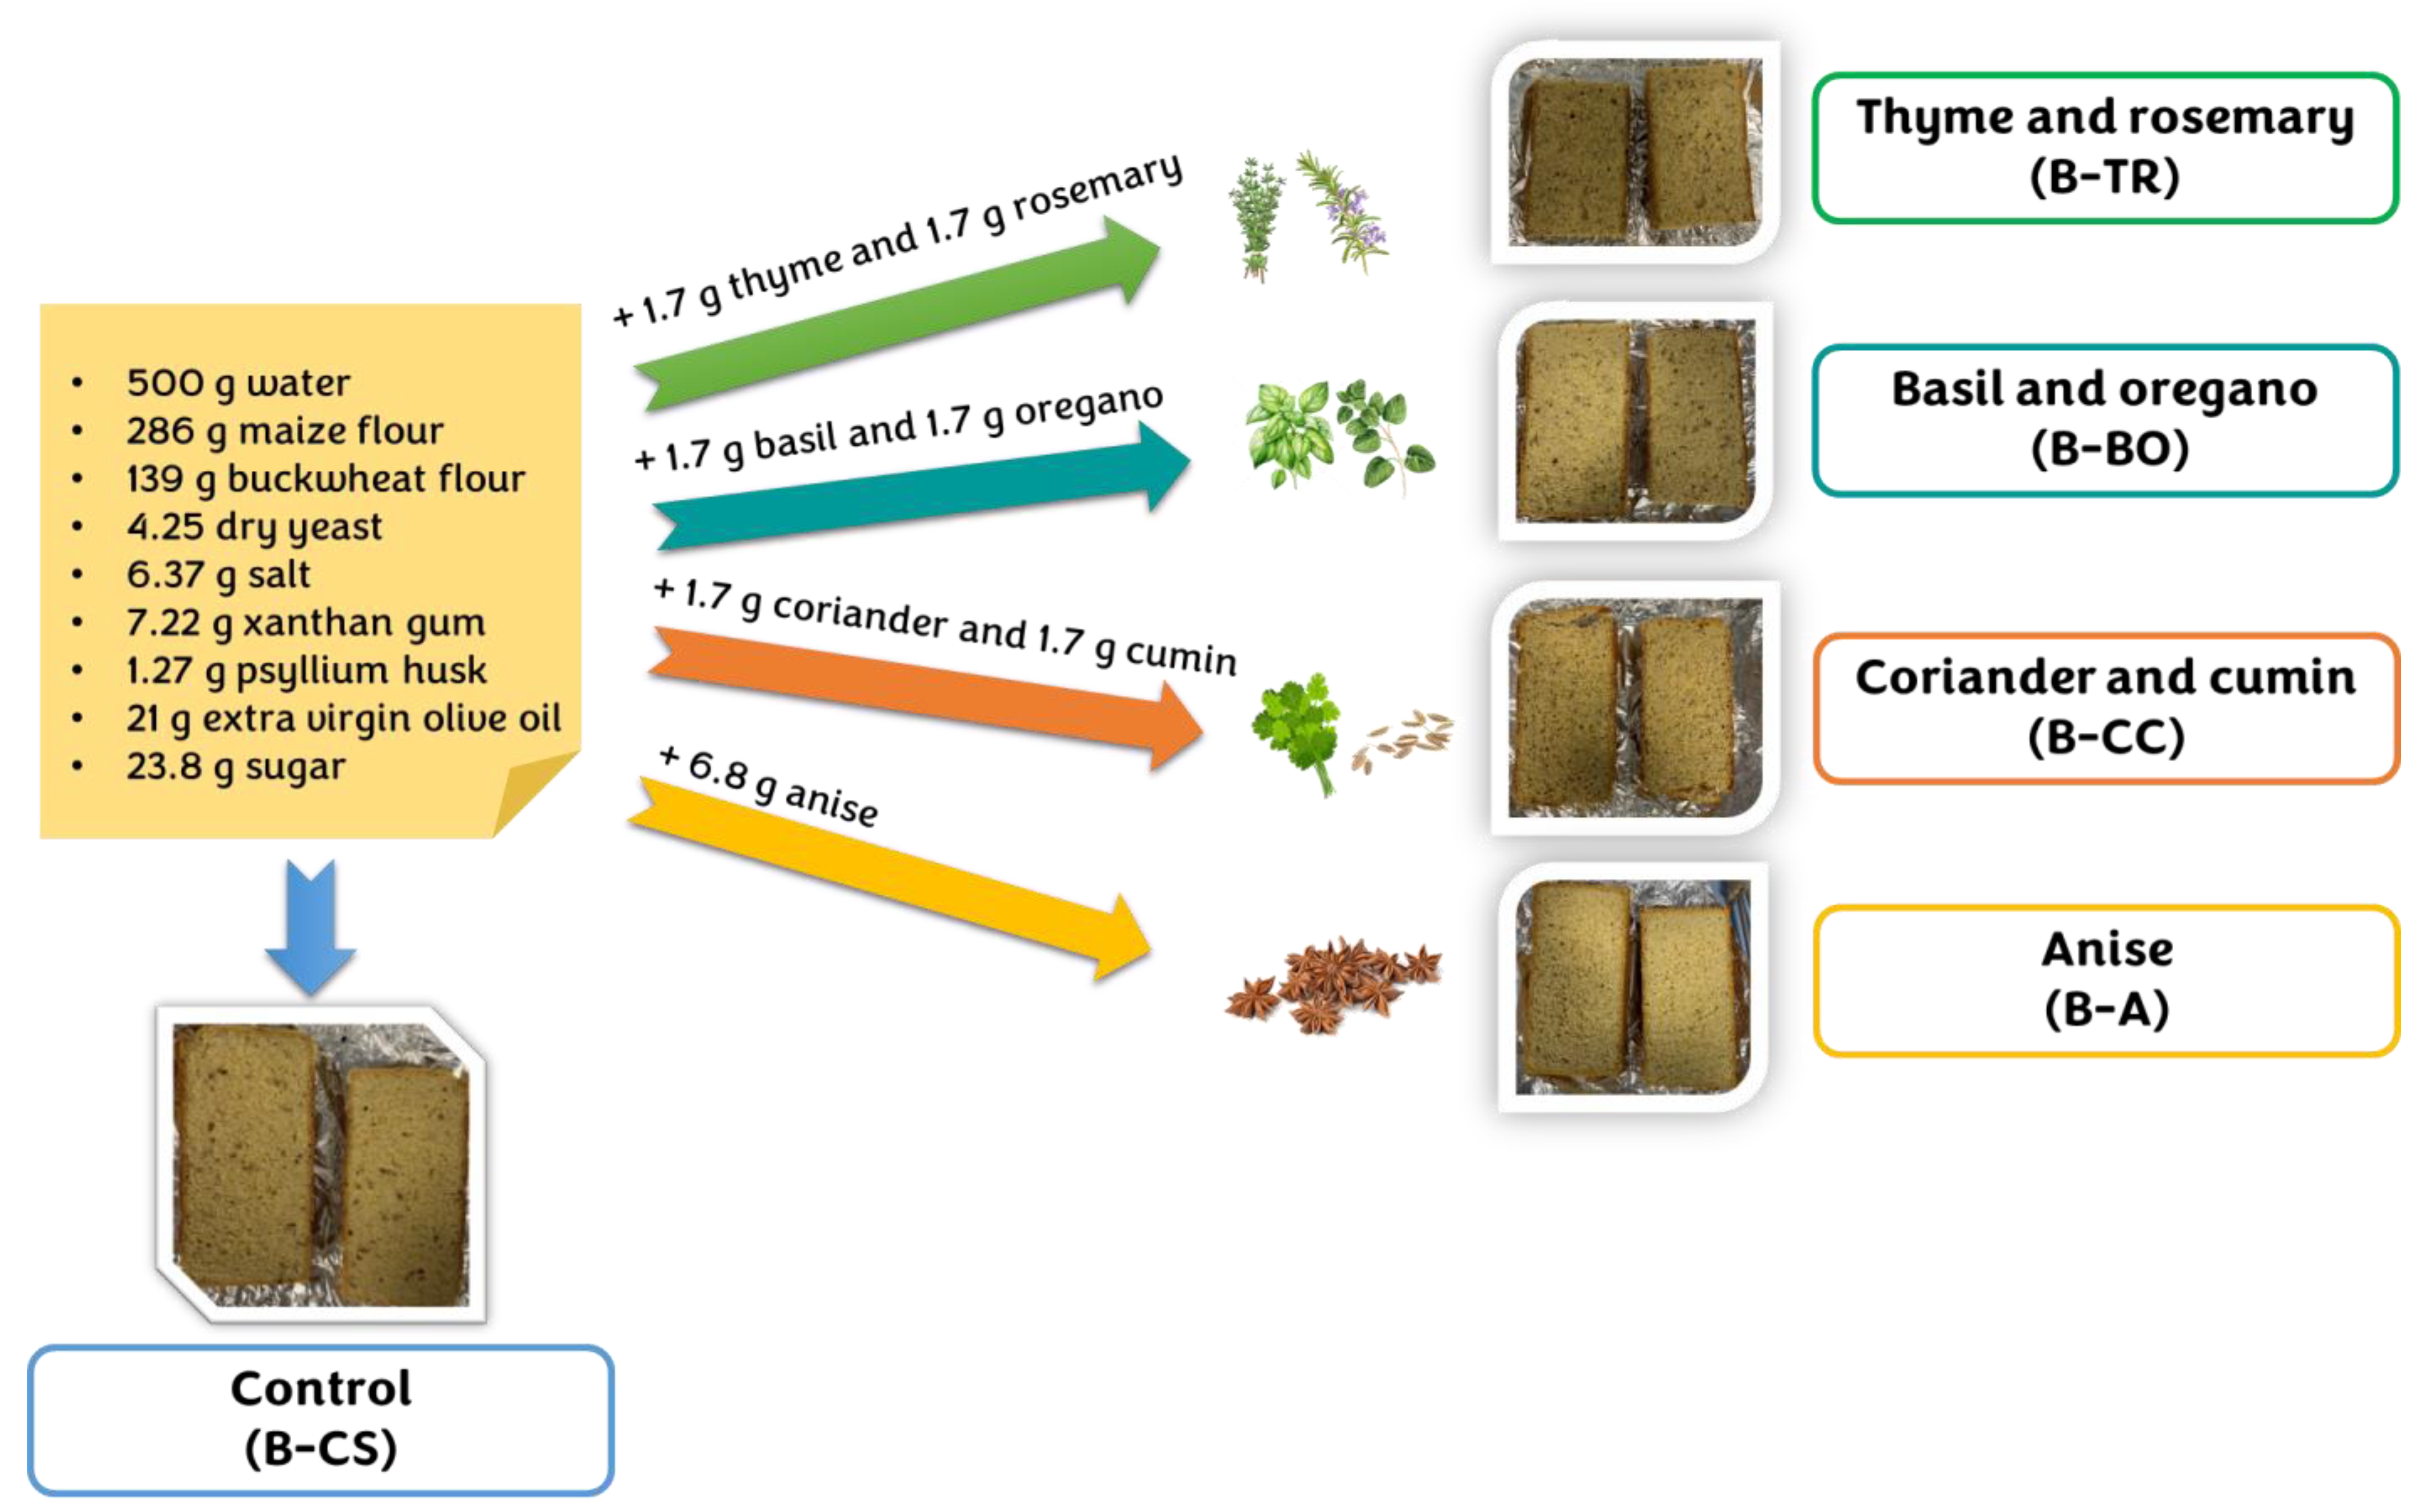
2.1. Bread Ingredients

All bread were prepared with gluten-free and vegan maize flour (Adpan, Asturias, Spain), gluten-free and organic buckwheat flour (Biorganic Natural Food SL, Toledo, Spain), salt (Sal Costa SLU, Barcelona, Spain), sugar (Azucarera AB Sugar Company, Madrid, Spain), gluten-free yeast (Maizena Unilever, London, UK), gluten-free and 100% natural xanthan gum (Biorganic Natural Food SL, Toledo, Spain), gluten-free psyllium husk (Biorganic Natural Food SL, Toledo, Spain), and extra virgin olive oil (EVOO, Aceites Coosur SA, Jaén, Spain). Moreover, different combinations of aromatic herbs (thyme, rosemary, basil, oregano, coriander) and spices (cumin, anise) were used to prepare the gluten-free bread. These aromatic herbs and spices were acquired from Mercadona (Valencia, Spain). All ingredients were purchased and stored at room temperature until use.

2.2. Experimental Design for Bread Formulation

The response surface methodology (RSM) is a collection of techniques that allow for the inspection of a response that can be displayed as a surface when the experiments investigate the effect of varying quantitative factors on the values that a dependent variable or response takes [23]. Accordingly, the bread formulation was first optimized through an RSM in which the effect of independent variables (proportion of gluten-free flours, X1; proportion of hydrocolloids, X2; and hydration percentage, X3) was evaluated to determine the most appropriate ratio of ingredients to obtain a gluten-free bread with desirable physical characteristics. For this purpose, a Box–Behnken Design (B-BD) was carried out. The Box–Behnken design is a response surface which designs place points on the midpoints of the edges of the cubical design region, as well as points at the center, circumscribed on a sphere. This design can be applied for the optimization of various chemical and physical processes, where the number of experiments is determined according to the requirements of the process [23]. Thus, experiments, performed in triplicate, were conducted using B-BD (Table 1) with three factors (X1, X2, and X3) at three levels (low (−1), medium (0) and high (+1)), as follows: X1: 60% (−1), 80% (0), 100% (+1); X2: 0% (−1), 50% (0), 100% (+1); X3: 70% (−1), 95% (0), and 120% (+1). The dependent variables studied in the 13 experiments were the specific volume and several instrumental parameters (hardness, adhesiveness, springiness, cohesiveness, chewiness, resilience, and color). To prepare the bread for these experiments, the flour weight was used as a reference, considering this weight as 100%. Accordingly, a 1.5% (based on flour weight) of both yeast and salt was set, while the percentages of flour, hydrocolloids, and water varied depending on the experiment since they were the factors evaluated in the experimental design.
A multi-response optimization was accomplished using a desirability function provided by XLSTAT Statistical Software for Microsoft Excel version 2021.1 (Addinsoft, Paris, France). Desirability analysis was employed to assess if a combination of variables satisfied the goal that was defined for the response, using a scale ranging from 0.0 (undesirable) to 1.0 (highly desirable), and finally, the design space of responses was predicted using the regression model equation [24,25]. Experimental data were fitted to the quadratic model using a second-order polynomial model. Coefficients (linear, quadratic, and interaction) were determined by least squares regression. Analysis of variance (ANOVA) was used to determine the significance and interactions of the factors (p < 0.05). The experimental data obtained were optimized considering the higher specific volume and springiness and the lower hardness, as these are key parameters influencing the quality of bread [26].
A second-order polynomial model provided by the Box–Behnken design relating the responses to factors X1, X2, and X3 was used to optimize the responses, as follows:
Y = a0 + a1X1 + a2X2 + a3X3 + a1,2X1X2 + a1,3X1X3 + a2,3X2X3 + a1,1X12 + a2,2X22 + a3,3X32
where Y = response value, a = constant coefficients, and X = independent variable.
The variables individually considered to evaluate the best formulation of gluten-free bread were used as the response (Yi): Y1, specific volume; Y2, springiness; and Y3, hardness. The experimental conditions that independently maximized Y1 and Y2, and minimized Y3 were obtained from the fitted models.
Table 1. Box–Behnken experimental design with a three-level full-factorial subset of experiments.
ExperimentRun OrderFlour
Proportion (X1) 1
Hydrocolloids
Proportions (X2) 2
Hydration
Percentage (X3) 3
1160095
211800120
3810050120
461005070
5410010095
636010095
713805095
81280100120
9108010070
1076050120
115605070
122100095
13980070
1 Proportion of flours (maize and buckwheat flours), maize flour as reference (60, 80, and 100%) based on flour weight. 2 Proportion of hydrocolloids (0, 50, and 100%), based on xanthan gum weight. 3 Hydration percentage (70, 95, and 120%) based on flour weight. The ranges used for hydration were selected based on the amounts used in another study [26].

2.3. Bread-Making Procedure and Gluten-Free Bread Prepared

Once the gluten-free bread formulation was optimized through RSM, the final gluten-free breadmaking procedure was as follows: dry ingredients (maize and buckwheat flours, sugar, aromatic herbs, and spices) were first weighed and carefully placed in a bowl. Then, liquid ingredients (water and EVOO) were weighed and incorporated into the dry ingredients. Finally, the hydrocolloids (xanthan gum and psyllium husk), the yeast, and the salt were weighed and added to the rest of the ingredients in that order. The ingredients and proportions used are indicated in Figure 1. The amount of aromatic herbs and spices was selected by an optimization performed in the laboratory, resulting in 1.7 g of each herb and spice to achieve enough flavor. However, in the case of anise, a larger amount was required to be added to the bread formulation (6.8 g) in order to appreciate the flavor of this particular spice in the product. A kneader-mixer (KitchenAid 5KPM5, Whirlpool Corporation, Benton Harbor, MI, USA) was used to combine dry ingredients (Speed 1 for 1 min) and to subsequently mix all the ingredients (Speed 2 for 6 min) to obtain the bread dough. Afterward, the dough was allowed to rest for 15 min and was placed into the baking molds. Then, for the rising step, the baking molds were placed in an Anova PrecisionTM Smart oven (Anova Culinary, San Francisco, CA, USA) at a relative humidity of 70% and 30 °C for 45 min. Finally, the dough was baked at 190 °C for 40 min. At the end of the baking process, the resulting bread was cooled at room temperature for 1 h before analysis. For chemical composition analysis, the loafs were packaged in freezer zip bags and stored at −20 °C until further analysis.
In total, five different gluten-free bread were prepared (Figure 1), denoted as B-CS (bread control), B-TR (bread with thyme and rosemary), B-BO (bread with basil and oregano), B-CC (bread with coriander and cumin), and B-A (bread with anise). All of them were prepared in the same way, following the same bread-making procedure, and only the combination of aromatic herbs and spices added to their composition changed among them. The selection of aromatic herbs and spices was based on their bioactive properties and because they are frequently used in European countries. On the other hand, their combination was based on their compatibility when used together in some culinary dishes without causing displeasure (e.g., basil and oregano are frequently used in Italian dishes, sometimes even jointly).

2.4. Physical Properties of Gluten-Free Bread

Different physical properties were determined in the bread prepared, such as the specific volume, textural parameters, and color analysis. All assays were performed in triplicate for each bread formulation.

2.4.1. Specific Volume

Bread volume was determined by using the seed displacement method [27,28]. Accordingly, a 2 L test tube was filled with flax seeds, and then the bread was submerged. The volumetric difference observed before and after the bread submersion was measured and corresponded to the bread volume. Afterwards, the specific volume was calculated according to the following equation:
Specific volume (cm3/g) = bread volume/bread weight

2.4.2. Textural Parameters

Texture profile analysis (TPA) is a common test for determining the textural properties of food [29,30]. Accordingly, a TPA was carried out on bread slices of 20 mm and 30 × 30 mm in size using a 25 mm cylindrical probe. The bread textural parameters (hardness, adhesiveness, springiness, cohesiveness, chewiness, and resilience) were measured with a texture analyzer (TA-XT2 Stable Micro Systems, Godalming, United Kingdom). Test conditions were established according to Belorio et al. [26]: deformation 50%, test speed 1 mm/s, and time between compression 10 s. Textural parameters were calculated from the force–time curve generated by the test using the manufacturer’s software and standard equations [29,30] (Supplementary Figure S1).

2.4.3. Color Analysis

The crumb color of the bread was determined with a colorimeter (CR-400 Konika Minolta, Tokyo, Japan). For this purpose, the L*a*b* color dimensions defined by the Commission Internationale de l’Eclairage (CIE) were used. Accordingly, the L* coordinate indicates the lightness (ranging from 0 value (black) to 100 value (white)), a* coordinate corresponds the redness/greenness (positive values indicate red, whereas negative values indicate green), and b* coordinate indicates the yellowness/blueness (positive values indicate yellow, whereas negative values indicate blue) [31].

2.5. Proximate Chemical Composition

The moisture, dry matter, ash, free lipid fraction, crude fiber, and protein contents were determined in all the final gluten-free bread samples prepared (B-C, B-TR, B-BO, B-CC, B-A) using the standard methods established by AOAC [32,33,34], as described by previous authors [35,36]. Accordingly, moisture and dry matter were determined by gravimetry after an oven-drying process. Ashes were also determined by gravimetry, but after dry mineralization using a muffle furnace. The free lipid fraction was determined gravimetrically with the Randall method based on a hot extraction with petroleum ether. The crude fiber content was determined by performing two consecutive acid and basic hydrolysis. The protein content was estimated as Kjeldahl N x 5.70 (nitrogen conversion factor for cereals) [32,33,34]. The carbohydrate content was estimated by difference (subtracting from 100 g the sum of lipids, proteins, and ashes) [36]. All values (except moisture) were adjusted for dry matter. Each parameter was measured in triplicate in each bread sample.

2.6. Sensory Evaluation by Consumer Panelists

Sensory evaluation was carried out to assess consumer acceptance of the different final gluten-free bread formulations (B-C, B-TR, B-BO, B-CC, B-A). Accordingly, sensory analysis was performed by a total of 140 panelists, of which 55% were women and 45% were men with different age ranges (91% between 18 and 30 years, 3% between 31 and 42 years, 4% between 43 and 56 years, and 2% between 57 and 70 years). These panelists were recruited both from the database of the Gastronomic Innovation Center of the Community of Madrid (Spain) and from among the students and staff of the Universidad Rey Juan Carlos (Móstoles, Spain). Accordingly, 81% of them were students, 12% were workers, and 6% were both students and workers. All participants were declared to be regular bread consumers. Likewise, all of them were informed about the test and provided their informed consent to participate. The sensory tests were exempt from ethical committee review. Sensory evaluation of the baked loaves was carried out following cooling to room temperature. The bread loaves of each of the five bread formulations were cut into 30 × 30 mm slices, including crumb and crust. The samples were coded with a random digit code. All formulations were presented at the same time to the panelists along with water (Figure S2). Panelists were asked to evaluate each slice for appearance, odor, taste, texture, and overall liking through a nine-point scale: dislike extremely (1), dislike very much (2), dislike moderately (3), dislike slightly (4), neither like nor dislike (5), like slightly (6), like moderately (7), like very much (8), and like extremely (9). Values ≥5 indicated that panelists accepted the product, while values between 1 and 4 indicated that panelists rejected the product. Additionally, the panelists were asked to sort the bread samples based on their preference, placing the bread they liked the most in the first place and the one they liked the least in the last place. The questionnaire presented to the panelists to collect their answers was created with the Sensesbit software (Tastelab, Spain), so they could access it through their mobile phones with a QR code. Thus, the answers provided by the panelists were collected digitally through this software.

2.7. Data Processing and Statistical Analysis

Statistical analysis of the data obtained from the proximate chemical composition and sensory evaluation was performed using SPSS 28.0.1.0 software (IBM, Chicago, IL, USA). One-way analysis of variance (ANOVA), post hoc Tukey, and post hoc Duncan multiple range tests were conducted to determine significant differences among samples. The significant level was established at p ≤ 0.05.

3. Results and Discussion

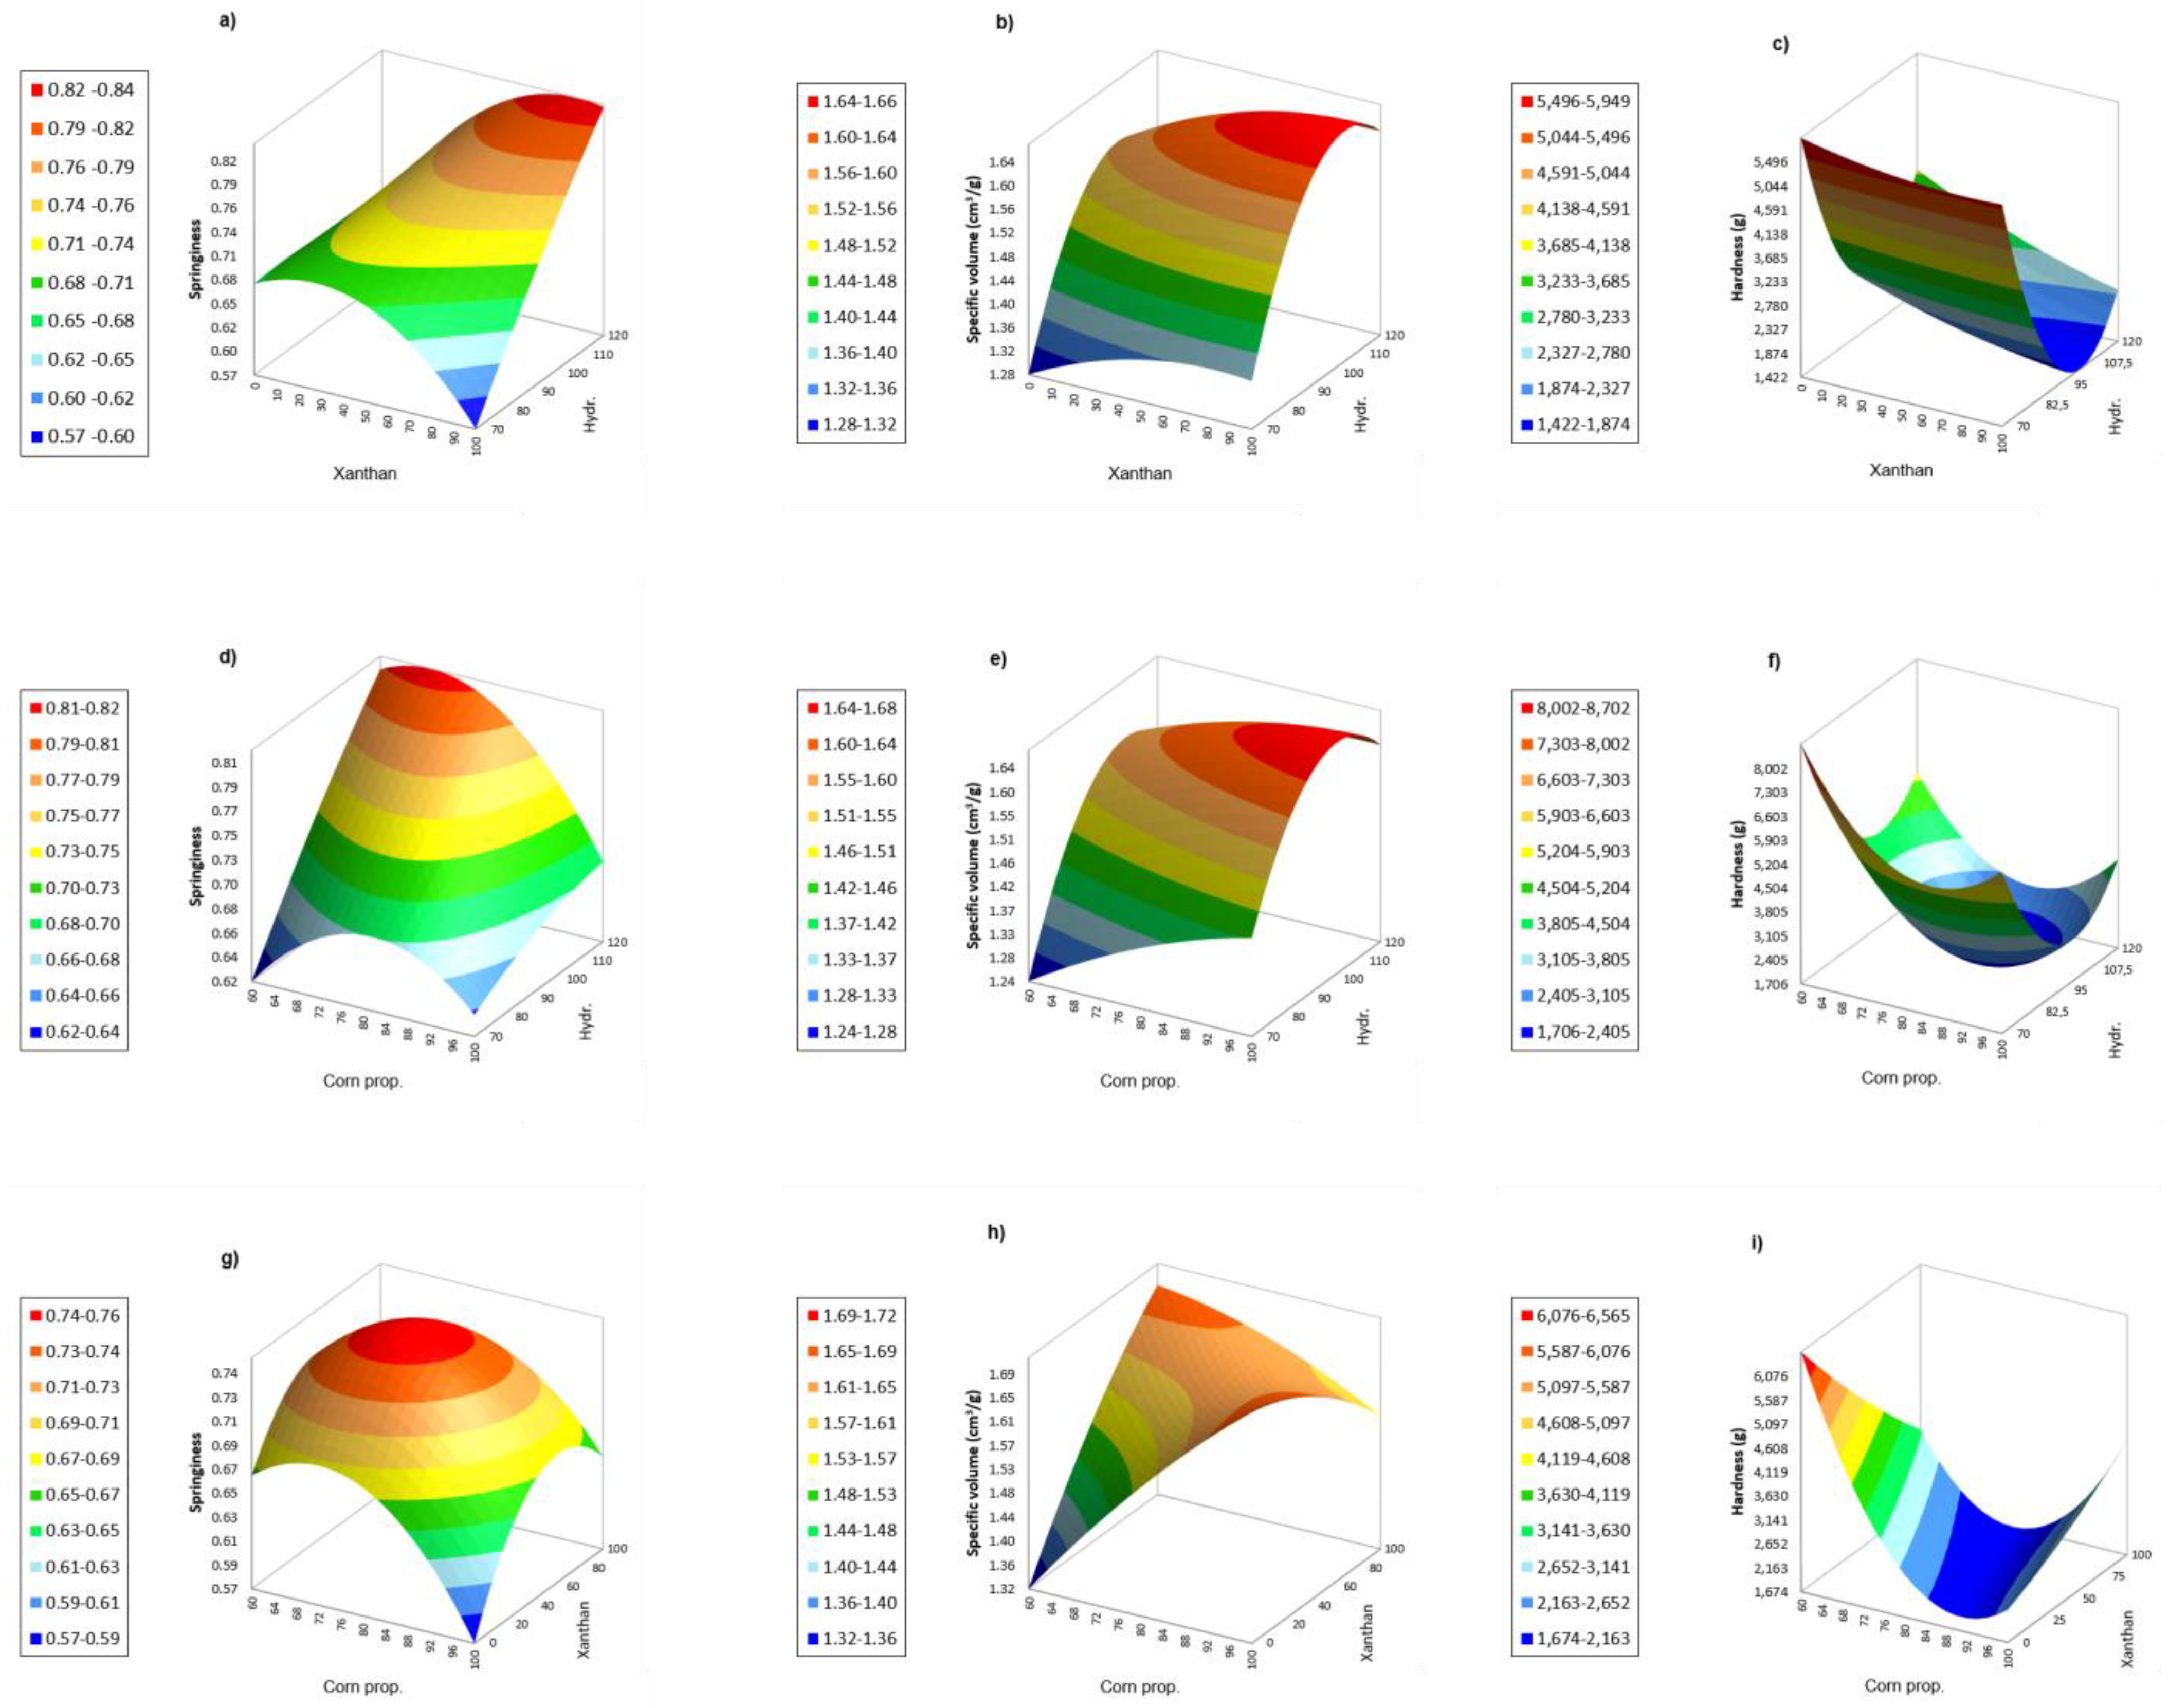
3.1. Physical Properties of Bread and Optimization of the Bread Formulation through Experimental Design

Textural parameters and specific volume values obtained for the different bread prepared according to the experimental design are shown in Table S1. It is observed that the conditions of experiment 2 (80% maize flour, 20% buckwheat flour, 0% xanthan gum, 100% psyllium husk, and 120% hydration) obtained the highest specific volume value. These conditions presented the lowest hardness value, although they did not show significant differences with the conditions of experiment 13. The conditions of experiment 7 (80% maize flour, 20% buckwheat flour, 50% xanthan gum, 50% psyllium husk, and 95% hydration) provided the highest springiness values.
The regression model analysis was applied to analyze the experimental data regarding the specific volume and textural parameters (in Table S1) and to evaluate the relationship between the responses (specific volume, springiness, and hardness) and the independent variables, which are represented by the following second-order polynomial equations:
Y1 (specific volume) = 1.62 + 6.58X1 − 0.02X2 + 4.75X3 + 0.12X12 − 2.2X1X2 − 0.13X1X3 − 2.67X12 − 0.02X22 + 8.33X2X3 − 0.14X32
Y2 (springiness) = 0.8 + 0.03X1 + 0.02X2 + 0.06X3 − 0.06X12 + 0.02X1X2 − 0.04X1X3 − 0.06X22 + 0.07X2X3 − 0.009X32
Y3 (hardness) = 1980 − 852X1 − 422X2 − 1353X3 + 1911X12 + 1261X1X2 + 296X1X3 + 138X22 − 254X2X3 + 2310X32
Regarding Y1 (specific volume) and Y2 (springiness) models, the most significant coefficients (p < 0.05) were hydration and maize proportion. On the other hand, hydration, maize proportion, and xanthan proportion were the most significant (p < 0.05) for Y3 (hardness). These adjusted models explained 70%, 73%, and 97% of the variability of Y1, Y2, and Y3, respectively.
Figure 2 presents the results of fitting the experimental data to the model of Equation (2) for Y1, Equation (3) for Y2, and Equation (4) for Y3. The three-dimensional response surface graphs outlined the combined effect of the independent variables (proportion of maize and buckwheat as gluten-free flours, proportion of xanthan, and hydration percentage) on the dependent variables studied. The plots are constructed as a function of two variables while keeping the third variable constant (at the central value). Figure 2a shows that springiness values were higher at higher hydration and higher xanthan proportions, with similar results found for specific volumes (Figure 2b). However, hardness decreased as the hydration percentage increased, and it can be observed that there was no significant change as the xanthan percentage increased (Figure 2c). The interactions of maize flour and hydration at 50% xanthan are shown in Figure 2d–f. Springiness increased with low to intermediate maize proportion values and with high hydration levels (Figure 2d). Specific volume increased as maize proportion increased and also with high to intermediate hydration values (Figure 2e). Hardness decreased with both maize proportion and hydration intermediate values (Figure 2f). Regarding the effect of maize and xanthan percentage, springiness increased with intermediate values (Figure 2g), specific volume increased with a high maize proportion and high and low values for xanthan (Figure 2h). Hardness decreased as the maize proportion increased, and very small changes were observed with the xanthan proportion (Figure 2i). In general, springiness and specific volume values were higher at higher hydration levels, while hardness was higher at lower hydration levels.
Table 2 shows the results of the optimization of the variables (specific volume, springiness, and hardness) by desirability function. The maximum predicted response for specific volume was 1.728 using 100% maize, 100% psyllium husk, and 102.41% hydration, with a desirability of 0.844, while the predicted responses for springiness and hardness were 0.841 and 1561.066, respectively, both with a desirability of 1.
At those optimum formulations, the theoretical or predicted values of all dependent variables were estimated using the second-order polynomial equations developed (Table 2). The average values obtained experimentally for the specific volume were 1.45 cm3/g, springiness had a mean value of 0.73, and hardness presented 2944 g. A variation of 16, 13, and 88% was observed between the predicted maximum value and the experimental maximum for these variables, respectively. The results for specific volume and springiness had some agreement with respect to the predicted values from the optimization analysis using the desirability function. However, in the case of hardness, they did not confirm the adequacy of the response model, and it did not achieve the expected optimization. Based on these results, the final conditions that allowed the production of bread with greater springiness were selected, since this was the variable that presented the lowest percentage of error. In this sense, based on the results obtained from the optimization of the experimental design, the final bread formulation selected was the following: 67% maize flour, 33% buckwheat flour, 87% xanthan gum, 13% psyllium husk, and 118% hydration (Table 2). This formulation was called B-ED.
However, despite obtaining gluten-free bread with good springiness, some sensory defects were detected that could affect the acceptability of the product. Therefore, the formulation was modified in order to obtain the best springiness based on the information described by other authors [13], which revealed that many gluten-free bread products are also formulated with other ingredients, such as oil and sugar, as well as with a higher percentage of yeast than that initially used in the first experiments (1.5%). Therefore, two new bread formulations were proposed: oil bread control formulation (B-CO), including EVOO (5%) and a greater amount of yeast (increasing the content from 1.5 to 3%), and sugar bread control formulation (B-CS), including EVOO (5%), sugar (5.6%), and a greater amount of yeast (increasing the content from 1.5 to 3%). These two new formulations were carried out experimentally and analyzed in triplicate. Afterward, the physical properties of the original formulation (the one obtained with the experimental design, called B-ED) and the two new formulations (B-CO and B-CS) were statistically compared (values in Table 3). As can be observed, no significant differences were found for springiness or specific volume. On the other hand, B-CO and B-CS formulations presented better results for hardness (lower values) without significant differences among them. However, B-CS obtained the highest specific volume and the lowest hardness, so this formulation was finally selected as the optimal formulation to produce gluten-free bread. Other physical properties of these formulations were also determined (Table 3). Regarding the color properties, parameter b* values indicated that the yellow color continued to predominate in B-CS and B-CO (Table 3), although in a lower intensity than in the previous experiments evaluated (Table S2), possibly due to the lower percentage of maize flour in B-CS and B-CO. On the other hand, higher luminosity values (L*) and lower a* values were observed in B-CS and B-CO compared to B-ED (Table 3), but they were similar to those obtained in the rest of the bread made during the experimental design (Table S2).
Hence, based on the results described above, once the bread formulation B-CS was selected as optimal, different types of gluten-free bread were prepared using this formulation, including the combination of different aromatic herbs and spices, as indicated in Figure 1, in order to evaluate the effect that the addition of these ingredients can have on the chemical composition and the organoleptic characteristics of the product. The amount of aromatic herbs and spices added was selected by testing different proportions. First, 0.8% based on the flour weight of each herb/spice was added, but it was observed that this amount was too much when mixing all the ingredients, and the flavor was excessive. Therefore, lower percentages (0.6 and 0.4%) were evaluated. A 0.6% was still too much, but a 0.4% was fine when all the ingredients were mixed and a suitable flavor was achieved. Therefore, this percentage (0.4%, corresponding to 1.7 g) was finally selected for the addition of herbs and spices. However, in the case of anise, a larger amount was required. It was observed that by adding the same amount of anise as other herbs and spices (1.7 g), no flavor of anise was detected in the bread when tasting it. Therefore, the amount was first doubled (3.4 g), but it was still not enough to achieve a suitable flavor. Thus, it was necessary to add 4 times more anise (6.8 g) than the other herbs and spices to appreciate the flavor of this particular spice.

3.2. Proximate Analysis of Gluten-Free Bread Prepared with Aromatic Herbs and Spices

The chemical composition of the gluten-free bread prepared with the optimal formulation and including aromatic herbs and spices is shown in Table 4.
The results obtained were very similar among the different bread samples, with slight differences. The moisture content of the samples ranged from 40 to 47%, which are values comparable with the published data for other gluten-free bread [37]. No significant differences were found in this parameter among the different bread, except between B-TR and B-A. On the other hand, carbohydrates were the main nutrient in the bread samples, followed by proteins, fats, and ashes in terms of dry matter. No differences were observed in the content of carbohydrates, and the values were similar to the ones reported by other authors [35,38]. Within carbohydrates, the content of crude fiber ranged from 0.529 to 0.596%, being significantly higher in the case of B-TR. These variations could probably be attributed to differences in the aromatic herbs and spices used. Nonetheless, the values were in the range of those reported in other works [35,36]. Regarding the protein content, no differences were observed among the bread samples. However, the average value was 9%, which is lower than the data reported for other gluten-free bread made with other pseudocereal flours (e.g., teff, amaranth, quinoa) [37]. One possible reason for these results is that amaranth and quinoa seeds have more proteins in their chemical composition than buckwheat [39]. On the other hand, the fat content was also very similar among the bread samples, with only slight differences observed between samples B-BO and B-A. The fat values were higher than the ones reported by previous authors [35,37]. This was mainly attributed to the addition of EVOO as an ingredient in the bread formulation. Finally, the ash content varied from 2.51 to 2.8%, with slight differences among the samples that were attributed to the aromatic herbs and spices used. Nonetheless, these values were comparable to those reported in previous works by other authors [35,36].

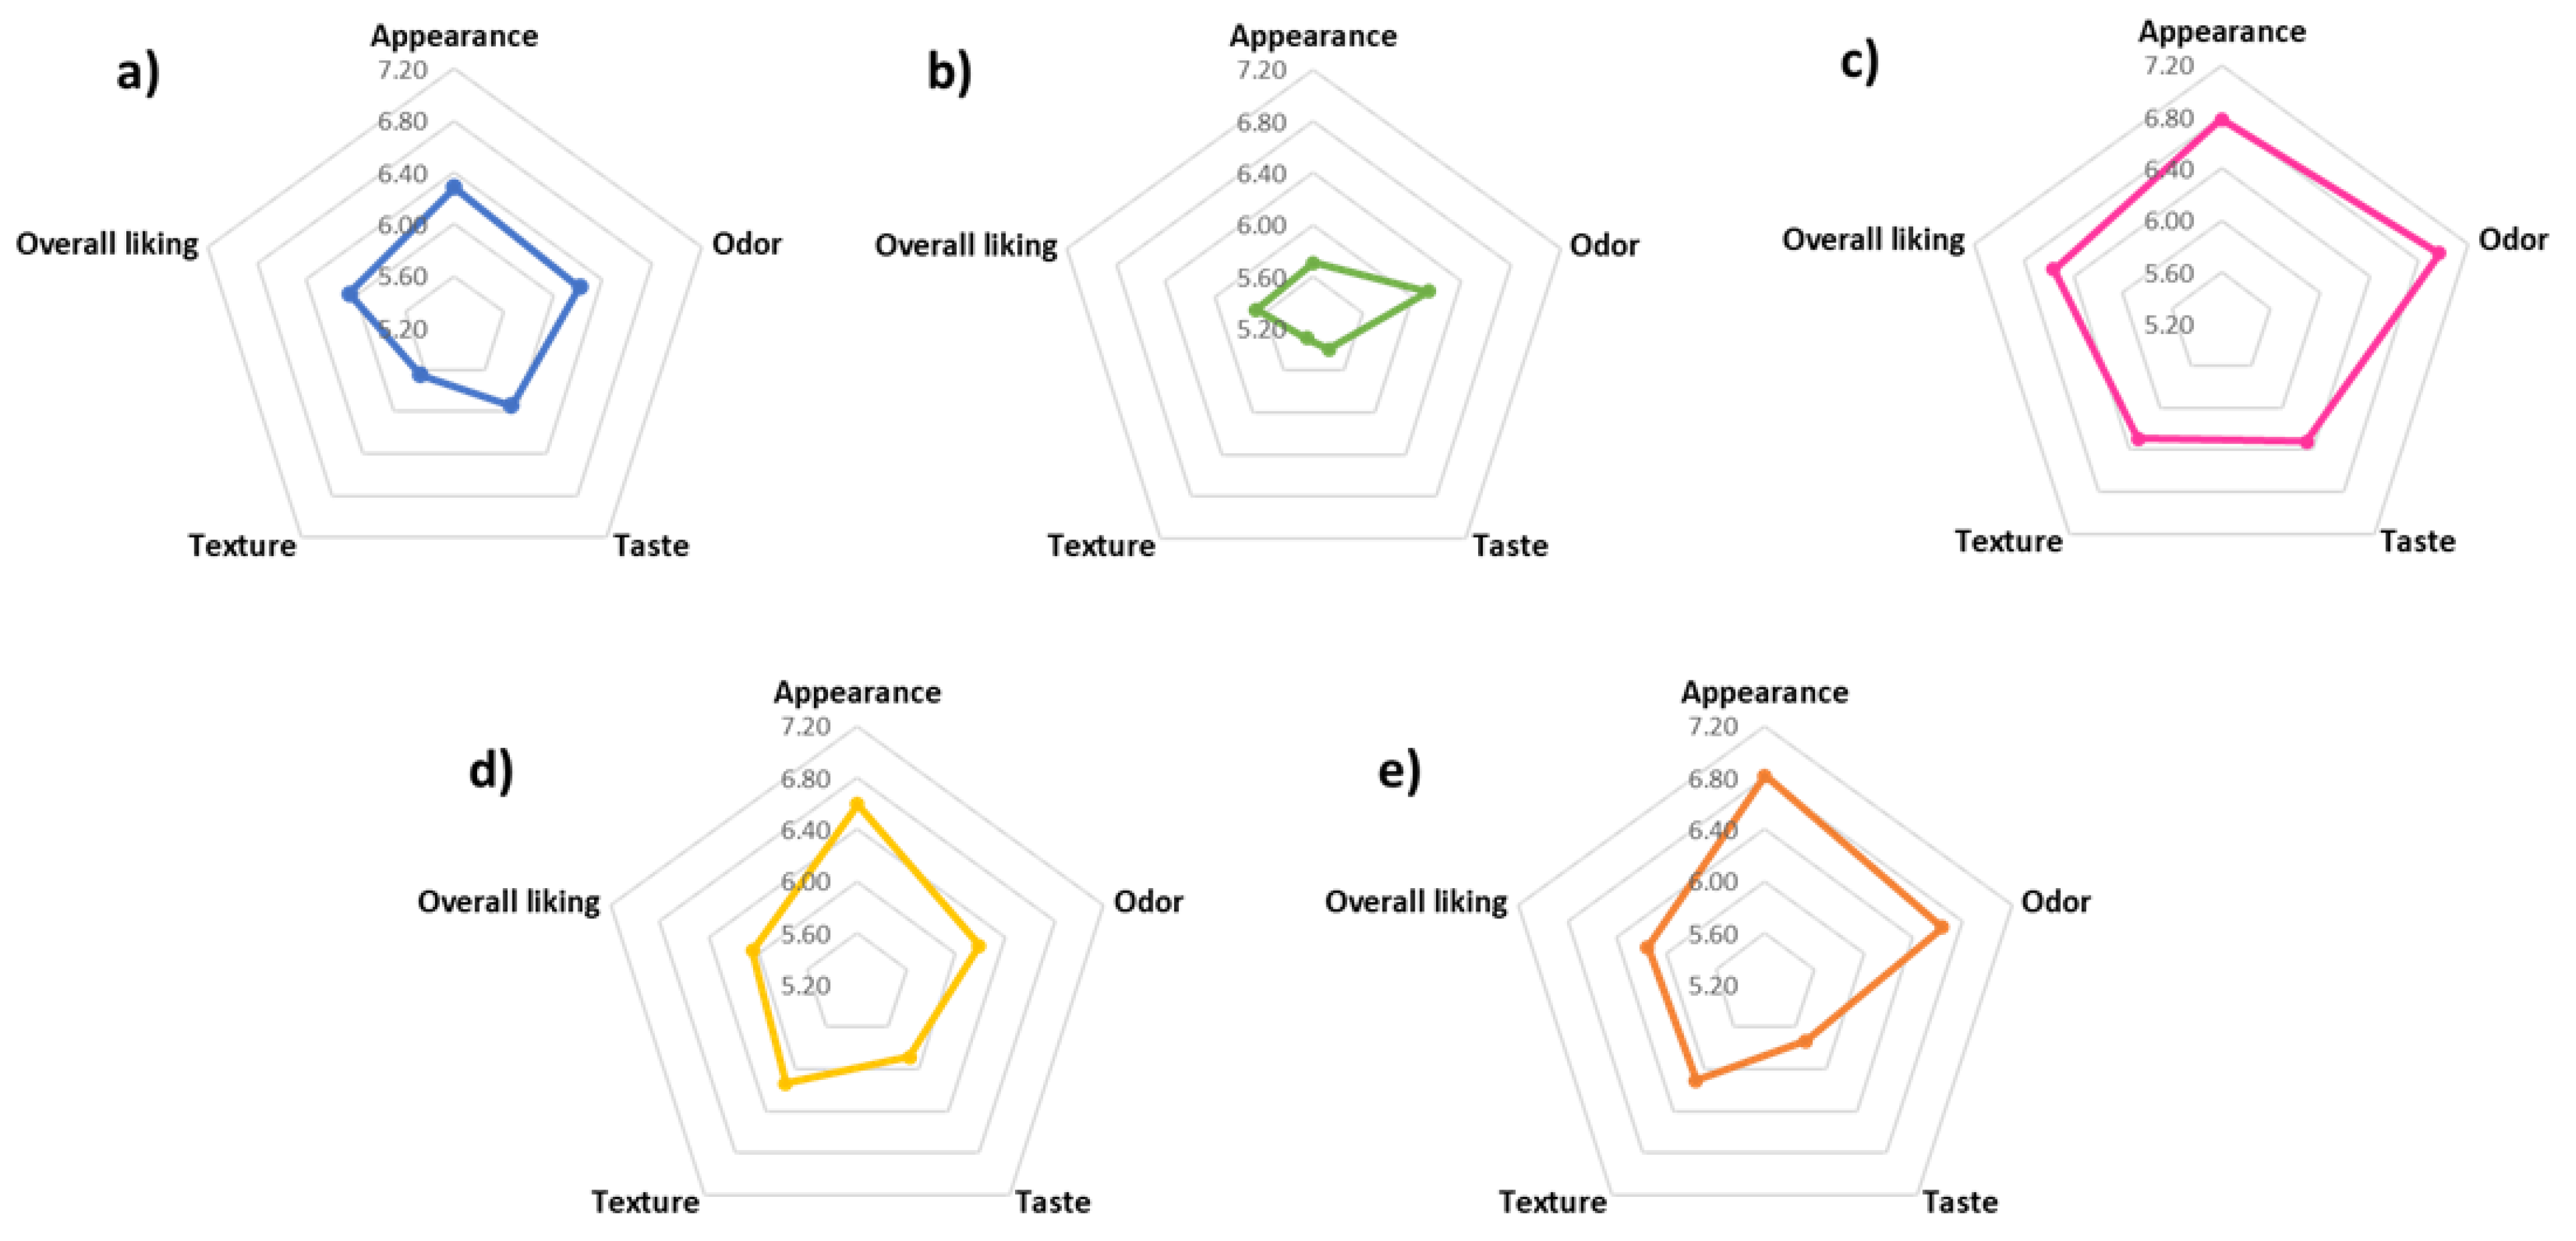
3.3. Sensory Evaluation of Gluten-Free Bread Prepared with Aromatic Herbs and Spices

The sensory profiles obtained through the affective hedonic scale test of the different gluten-free bread prepared with the optimal formulation and including aromatic herbs and spices are shown in Figure 3. As can be observed, all the sensory attributes evaluated in the bread samples (appearance, odor, taste, and texture) received mean scores above 5. Therefore, these results indicated that the panelists accepted all the bread formulations prepared. In general, both appearance and odor were the sensory attributes best valued in the five types of gluten-free bread evaluated, of which B-BO and B-A bread were the best rated for these attributes. Regarding the different bread formulations, appearance was best rated in the B-CC and B-A bread, while odor was the attribute best valued in the B-TR and B-BO bread. In the control (B-CS sample), both appearance and odor were the attributes best rated. Nonetheless, it is worth noting that sensory scores for odor, taste, and texture were higher in the bread formulations with aromatic herbs and spices (except bread B-TR) than in the bread control. This suggests that the incorporation of aromatic herbs and spices improves some of the sensory aspects of gluten-free bread, as predicted by the panelists. On the other hand, the texture was the lowest sensory attribute valued in B-CS, B-TR, and B-BO bread, whereas in B-CC and B-A, the taste was the attribute with the lowest score. It is worth highlighting that all bread received similar ratings regarding the taste attribute, except the B-BO, which significantly stood out, obtaining the highest score, while the B-TR bread received the lowest score in the taste attribute. In fact, the B-BO bread obtained the highest score in all the sensory attributes evaluated (except appearance). Accordingly, the results obtained for the global assessment suggested that the B-BO bread was the one that the panelists liked the most as a whole, followed by the B-CC and B-CS samples, which received the same overall liking score, and then the B-A bread. For the latter, it should be noted that most of the panelists indicated that, due to the anise, the product reminded them more of a sponge cake than of bread since the odor and taste suggested sweet sensations. On the other hand, the B-TR was the formulation that the panelists liked least.
Likewise, the results obtained in the affective test of preference ordering agreed with the ones obtained in the affective hedonic scale test. The preference order was as follows: B-BO > B-CC > B-CS > B-A > B-TR. According to this ordering test, the bread that the panelists liked the most was the B-BO, while the B-BR was the one the panelists liked the least. These results were subjected to an ANOVA test (p > 0.05) to determine if there were significant differences in the preference of the gluten-free bread prepared. The F statistic value was 8.86, which was larger than the critical F value (2.38), so there were sample averages significantly different from each other, and these differences could not reasonably be due to random chance alone. Therefore, the results were statistically significant, but the test did not specify among which samples these significant differences occurred. Thus, a post hoc Duncan multiple range test was conducted to determine significant differences among samples. The results obtained indicated that the B-BO sample was significantly preferred by consumers over the rest of the bread evaluated. However, no significant preference differences were observed between the B-CC, B-CS, and B-A samples. It was confirmed that the B-TR was the bread least preferred among the panelists, although no significant differences were observed in terms of their preference compared to the B-A bread. Overall, it can be concluded that the gluten-free bread formulated with the combination of basil and oregano was the one that most sensibly pleased consumers. Therefore, the incorporation of these aromatic herbs during breadmaking can be a useful approach to developing more appealing gluten-free bread that are attractive to consumers. Moreover, the addition of these aromatic herbs can contribute to the incorporation of phytochemicals with antioxidant properties that provide health benefits to consumers, as reported in previous works [22,40].

4. Conclusions

In this study, different gluten-free bread with good palatability and texture properties were successfully prepared and evaluated. The experimental design carried out allowed to obtain an optimal formulation to prepare a gluten-free bread based on maize and buckwheat with good quality and nutritional value. Significantly better bread quality was observed by using higher percentages of hydration, leading to higher specific volume, greater springiness of the crumb, and lower crumb hardness in bread. The proximate chemical composition of the gluten-free bread prepared was very similar, with only slight differences among them that only could be attributed to the different aromatic herbs and spices used in their formulation. In terms of dry matter, carbohydrates were the main nutrient in the bread samples, followed by proteins, fats, and ashes. Regarding the sensory evaluation, all the sensory attributes evaluated in the bread samples (appearance, odor, taste, texture, and overall liking) received mean scores above 5, indicating that the panelists accepted all the gluten-free bread prepared. The gluten-free bread formulated with a combination of basil and oregano was the one that consumers significantly liked the most. This combination (basil and oregano), along with that of cumin and coriander, received higher sensory scores than those obtained in the control bread (without herbs and spices). Thus, these results suggest that the incorporation of these aromatic herbs and spices as bread ingredients can significantly change some sensory properties and contribute to improving consumer acceptance of gluten-free bread by making them more appealing and attractive to consumers.

Supplementary Materials

The following supporting information can be downloaded at: https://www.mdpi.com/article/10.3390/app14083348/s1, Figure S1: The force–time curve obtained from the TPA test for control gluten-free bread; Figure S2: Presentation of the codified gluten-free bread samples for sensory analysis; Table S1: Specific volume and textural parameters values obtained from the experimental design; Table S2: Color parameters values obtained from the experimental design.

Author Contributions

Conceptualization, L.R.-A., N.C. and I.S.; methodology, L.R.-A., N.C. and E.A.-R.; software, L.R.-A., N.C. and E.A.-R.; validation, L.R.-A., N.C. and E.A.-R.; formal analysis, L.R.-A., N.C. and E.A.-R.; investigation, L.R.-A., N.C. and E.A.-R.; resources, L.R.-A., N.C., S.M.-Z., A.L. and I.S.; data curation, L.R.-A. and N.C.; writing—original draft preparation, L.R.-A. and N.C.; writing—review and editing, N.C., S.M.-Z., A.L. and I.S.; visualization, L.R.-A. and N.C.; supervision, A.L. and I.S.; project administration, L.R.-A., N.C. and I.S.; funding acquisition, L.R.-A., N.C. and I.S. All authors have read and agreed to the published version of the manuscript.

Funding

This research was funded by MCIN/AEI /10.13039/501100011033 / FEDER, UE, grant number PID2022-137278OB-I00, the call Proyectos de Impulso a la Investigación para Jóvenes Doctores de la Universidad Rey Juan Carlos, project PROCESALK ref. M2984, and by the Community of Madrid through project FP22-PANSALUDABLE.

Informed Consent Statement

Informed consent was obtained from all subjects involved in the study.

Data Availability Statement

Data is contained within the article.

Conflicts of Interest

The authors declare no conflicts of interest. The funders had no role in the design of the study; in the collection, analyses, or interpretation of data; in the writing of the manuscript; or in the decision to publish the results.

References

  1. Estévez, V.; Araya, M. La dieta sin gluten y los alimentos libres de gluten. Rev. Chil. Nutr. 2016, 43, 428–433. [Google Scholar] [CrossRef]
  2. Alencar, N.M.M.; de Araújo, V.A.; Faggian, L.; da Silveira Araújo, M.B.; Capriles, V.D. What about gluten-free products? An insight on celiac consumers’ opinions and expectations. J. Sens. Stud. 2021, 36, e12664. [Google Scholar] [CrossRef]
  3. Benítez, V.; Esteban, R.M.; Moniz, E.; Casado, N.; Aguilera, Y.; Mollá, E. Breads fortified with wholegrain cereals and seeds as source of antioxidant dietary fibre and other bioactive compounds. J. Cereal Sci. 2018, 82, 113–120. [Google Scholar] [CrossRef]
  4. Sciarini, L.S.; Steffolani, M.E.; Leon, A.E. El rol del gluten en la panificación y el desafío de prescindir de su aporte en la elaboración de pan. Agriscientia 2016, 33, 61–74. [Google Scholar] [CrossRef]
  5. Mariotti, M.; Pagani, M.A.; Lucisano, M. The role of buckwheat and HPMC on the breadmaking properties of some commercial gluten-free bread mixtures. Food Hydrocoll. 2013, 30, 393–400. [Google Scholar] [CrossRef]
  6. Sanchez, H.D.; Gonzalez, R.G.; Osella, C.A.; Torres, R.E.T.; De La Torre, M.L. Elaboración de pan sin gluten con harinas de arroz extrudidas elaboration of bread without gluten from extruded rice flours. Soc. Mex. Nutr. Tecnol. Aliment. 2008, 6, 109–116. [Google Scholar] [CrossRef]
  7. Greene, J.L.; Bovell-Benjamin, A.C. Macroscopic and sensory evaluation of bread supplemented with sweet-potato flour. J. Food Sci. 2004, 69, SNQ167–SNQ173. [Google Scholar] [CrossRef]
  8. Filipčev, B.; Bodroža-Solarov, M.; Pestorić, M.; Šimurina, O. Breadmaking performance and textural changes during storage of composite breads made from spelt wheat and different forms of amaranth grain. Food Sci. Technol. Int. 2017, 23, 235–244. [Google Scholar] [CrossRef]
  9. See, E.F.; Wan Nadiah, W.A.; Noor Aziah, A.A. Physico-chemical and sensory evaluation of breads supplemented with pumpkin flour. Int. Food Res. J. 2007, 14, 123–130. [Google Scholar]
  10. Angioloni, A.; Collar, C. Nutritional and functional added value of oat, Kamut®, spelt, rye and buckwheat versus common wheat in breadmaking. J. Sci. Food Agric. 2011, 91, 1283–1292. [Google Scholar] [CrossRef]
  11. Lorusso, A.; Verni, M.; Montemurro, M.; Coda, R.; Gobbetti, M.; Rizzello, C.G. Use of fermented quinoa flour for pasta making and evaluation of the technological and nutritional features. LWT 2017, 78, 215–221. [Google Scholar] [CrossRef]
  12. Capriles, V.D.; Arêas, J.A. Effects of prebiotic inulin-type fructans on structure, quality, sensory acceptance and glycemic response of gluten-free breads. Food Funct. 2013, 4, 104–110. [Google Scholar] [CrossRef] [PubMed]
  13. De Lamo, B.; Gómez, M. Bread enrichment with oilseeds. A review. Foods 2018, 7, 191. [Google Scholar] [CrossRef] [PubMed]
  14. Betoret, E.; Rosell, C.M. Enrichment of bread with fruits and vegetables: Trends and strategies to increase functionality. Cereal Chem. 2020, 97, 9–19. [Google Scholar] [CrossRef]
  15. Aguilar, N.; Albanell, E.; Miñarro, B.; Guamis, B.; Capellas, M. Effect of tiger nut-derived products in gluten-free batter and bread. Food Sci. Technol. Int. 2015, 21, 323–331. [Google Scholar] [CrossRef] [PubMed]
  16. Santiago, D.M.; Matsushita, K.; Tsuboi, K.; Yamada, D.; Murayama, D.; Kawakami, S.; Shimada, K.; Koaze, H.; Yamauchi, H. Texture and structure of bread supplemented with purple sweet potato powder and treated with enzymes. Food Sci. Technol. Res. 2015, 21, 537–548. [Google Scholar] [CrossRef]
  17. Gordún, E.; del Valle, L.J.; Ginovart, M.; Carbó, R. Comparison of the microbial dynamics and biochemistry of laboratory sourdoughs prepared with grape, apple and yogurt. Food Sci. Technol. Int. 2015, 21, 428–439. [Google Scholar] [CrossRef]
  18. Mantzourani, I.; Plessas, S.; Saxami, G.; Alexopoulos, A.; Galanis, A.; Bezirtzoglou, E. Study of kefir grains application in sourdough bread regarding rope spoilage caused by Bacillus spp. Food Chem. 2014, 143, 17–21. [Google Scholar] [CrossRef]
  19. Shori, A.B.; Kee, L.A.; Baba, A.S. Total phenols, antioxidant activity and sensory evaluation of bread fortified with spearmint. Arab. J. Sci. Eng. 2021, 46, 5257–5264. [Google Scholar] [CrossRef]
  20. Dhillon, G.K.; Kaur, A.; Bhise, S.; Ahluwalia, P. Synergistic Effect of Spices and Herbs on Rheological and Bread Making Properties of Wheat Flour. J. Pure Appl. Microbiol. 2016, 10, 1099. [Google Scholar]
  21. Das, L.; Raychaudhuri, U.; Chakraborty, R. Herbal fortification of bread with fennel seeds. Food Technol. Biotechnol. 2013, 51, 434. [Google Scholar]
  22. Skendi, A.; Irakli, M.; Chatzopoulou, P.; Papageorgiou, M. Aromatic plants of Lamiaceae family in a traditional bread recipe: Effects on quality and phytochemical content. J. Food Biochem. 2019, 43, e13020. [Google Scholar] [CrossRef] [PubMed]
  23. Myers, R.; Montgomery, D.; Anderson-Cook, C. Response Surface Methodology: Process and Product Optimization Using Designed Experiments; Wiley: Hoboken, NJ, USA, 2009; pp. 78–83. [Google Scholar]
  24. Abd-El-Aziz, N.M.; Hifnawy, M.S.; El-Ashmawy, A.A.; Lotfy, R.A.; Younis, I.Y. Application of Box-Behnken design for optimization of phenolics extraction from Leontodon hispidulus in relation to its antioxidant, anti-inflammatory and cytotoxic activities. Sci. Rep. 2022, 12, 8829. [Google Scholar] [CrossRef]
  25. Ahmad, A.; Alkharfy, K.M.; Wani, T.A.; Raish, M. Application of Box–Behnken design for ultrason-ic-assisted extraction of polysaccharides from Paeonia emodi. Int. J. Biol. Macromol. 2015, 72, 990–997. [Google Scholar] [CrossRef] [PubMed]
  26. Belorio, M.; Gómez, M. Effect of hydration on gluten-free breads made with hydroxypropyl methylcellulose in comparison with psyllium and xanthan gum. Foods 2020, 9, 1548. [Google Scholar] [CrossRef] [PubMed]
  27. Sahin, S.; Sumnu, S.G. Physical Properties of Foods; Springer Science & Business Media: New York, NY, USA, 2006. [Google Scholar]
  28. Cauvain, S.P.; Young, L.S. Technology of Breadmaking; Springer: New York, NY, USA, 2007. [Google Scholar]
  29. Pons, M.; Fiszmaw, S.M. Instrumental texture profile analysis with particular reference to gelled systems. J. Texture Stud. 1996, 27, 597–624. [Google Scholar] [CrossRef]
  30. Bourne, M.C. Food Texture and Viscosity: Concept and Measurement; Academic Press: Cambridge, MA, USA, 2002. [Google Scholar]
  31. Gil-Humanes, J.; Pistón, F.; Altamirano-Fortoul, R.; Real, A.; Comino, I.; Sousa, C.; Rosell, C.M.; Barro, F. Reduced-gliadin wheat bread: An alternative to the gluten-free diet for consumers suffering gluten-related pathologies. PLoS ONE 2014, 9, e90898. [Google Scholar] [CrossRef] [PubMed]
  32. Baur, F.J.; Ensminger, L.G. The Association of Official Analytical Chemists (AOAC). J. Am. Oil Chem. Soc. 1977, 54, 171–172. [Google Scholar] [CrossRef]
  33. AOAC. Official Methods of Analysis, 17th ed.; The Association of Official Analytical Chemists: Gaithersburg, MD, USA, 2000. [Google Scholar]
  34. AOAC. Official Methods of Analysis, 15th ed.; Association of Official Analytical chemists: Washington, DC, USA, 2007. [Google Scholar]
  35. El-Sohaimy, S.A.; Shehata, M.G.; Mehany, T.; Zeitoun, M.A. Nutritional, physicochemical, and sensorial evaluation of flat bread supplemented with quinoa flour. Int. J. Food Sci. 2019, 2019, 4686727. [Google Scholar] [CrossRef]
  36. Alsuhaibani, A.M. Rheological and nutritional properties and sensory evaluation of bread fortified with natural sources of calcium. J. Food Qual. 2018, 2018, 8308361. [Google Scholar] [CrossRef]
  37. Rybicka, I.; Doba, K.; Bińczak, O. Improving the sensory and nutritional value of gluten-free bread. Int. J. Food Sci. Technol. 2019, 54, 2661–2667. [Google Scholar] [CrossRef]
  38. Matos Segura, M.E.; Rosell, C.M. Chemical composition and starch digestibility of different gluten-free breads. Plant Foods Hum. Nutr. 2011, 66, 224–230. [Google Scholar] [CrossRef] [PubMed]
  39. Alvarez-Jubete, L.; Arendt, E.K.; Gallagher, E. Nutritive value and chemical composition of pseudocereals as gluten-free ingredients. Int. J. Food Sci. Nutr. 2009, 60 (Suppl. S4), 240–257. [Google Scholar] [CrossRef] [PubMed]
  40. El-Refai, A.A.; Ghoniem, G.A.; El-Boraey, N.A.; Shetti, S.H. Chemical, sensory and biological evaluation of bread prepared using some herbs as source of bioactive compounds. J. Food Dairy Sci. 2015, 6, 481–499. [Google Scholar] [CrossRef]
Figure 1. Gluten-free bread formulations prepared using different combinations of aromatic herbs and spices.
Applsci 14 03348 g001
Figure 2. 3D response surface graphs of the effect of hydration and xanthan percentage on (a) springiness, (b) specific volume, (c) hardness; effect of maize proportions and hydration on (d) springiness, (e) specific volume, (f) hardness; effect of maize proportions and xanthan percentage on (g) springiness, (h) specific volume, (i) hardness.
Applsci 14 03348 g002
Figure 3. Sensory evaluation of gluten-free bread: (a) control, (b) thyme and rosemary, (c) basil and oregano, (d) cumin and coriander, and (e) anise. Scale: dislike extremely (1), dislike very much (2), dislike moderately (3), dislike slightly (4), neither like nor dislike (5), like slightly (6), like moderately (7), like very much, (8) like extremely (9). Although it is a 1-to-9-point scale, the figure only shows the scale adjusted to the range of 5.20–7.20 points due to the great similarity of the results obtained among the different bread, so that the differences between the samples could be better appreciated and discussed.
Applsci 14 03348 g003
Table 2. Optimization of variables (specific volume, springiness, and hardness) by desirability function.
ParameterX1
(Maize Flour
Proportion)
X2
(Xanthan Gum
Proportion)
X3
(Hydration
Percentage)
DesirabilityPredicted ResponseExperimental Values% Error *
Specific volume (cm3/g)100.000.00102.410.841.731.45 ± 0.0716%
Springiness67.2386.60117.661.000.840.73 ± 0.0213%
Hardness (g)75.1178.3398.891.0015612944 ± 10988%
* %Error = 100 × (experimental value-predicted value)/predicted value.
Table 3. Physical properties of the gluten-free bread formulations (B-ED, B-O and B-S).
Bread
Formulation
Specif. Vol. (cm3/g)Hard. (g)Adh. (g.s)Spring. *Cohesiv. *Chew. *Res. *L **a **b **
B-ED1.80 ± 0.01 a1788 ± 130 a−160 ± 48 a0.72 ± 0.02 a0.47 ± 0.02 a605 ± 51 a0.19 ± 0.01 a56 ± 2 b1.9 ± 0.3 b27.4 ± 0.5 a
B-CO1.99 ± 0.01 a949 ± 200 b−27 ± 27 a1.2 ± 0.8 a0.44 ± 0.04 a539 ± 391 a0.19 ± 0.02 a62 ± 1 b1.6 ± 0.2 b27.8 ± 0.4 a
B-CS2.11 ± 0.02 a860 ± 19 b−66 ± 41 a1.0 ± 0.7 a0.5 ± 0.1 a485 ± 426 a0.3 ± 0.1 a62.8 ± 0.9 a1.0 ± 0.3 b26.4 ± 0.9 a
Specific volume (Specif. Vol.); Hardness (Hard); Adhesiveness (Adh.); Springiness (Spring.); Cohesiveness (Cohesiv.); Chewiness (Chew.); Resilience (Res). * Dimensionless. ** Results are the means ± standard deviation. Values in the same column with different superscript letters are significantly different (p ≤ 0.05) (post hoc Tukey test). B-ED: Bread formulation from the experimental design, B-CO: oil bread formulation, B-CS: sugar bread formulation.
Table 4. Proximate composition of gluten-free bread samples.
Bread
Formulation
Moisture
(%)
Protein *
(%)
Fat *
(%)
Ash *
(%)
Fiber *
(%)
Carbohydrate *
(%)
B-CS44 ± 4 ab9.06 ± 0.01 a4.4 ± 0.2 ab2.8 ± 0.2 c0.562 ± 0.002 a84 ± 5 a
B-TR40 ± 4 a9.0 ± 0.1 a4.6 ± 0.3 ab2.7 ± 0.1 abc0.596 ± 0.001 b84 ± 2 a
B-BO43 ± 4 ab9.0 ± 0.2 a3.97 ± 0.05 a2.6 ± 0.1 ab0.572 ± 0.001 a84 ± 2 a
B-CC43 ± 4 ab8.89 ± 0.01 a4.11 ± 0.05 ab2.51 ± 0.04 a0.58 ± 0.02 ab84 ± 2 a
B-A47 ± 4 b8.9 ± 0.2 a4.5 ± 0.6 b2.8 ± 0.1 bc0.529 ± 0.003 a84 ± 2 a
Mean scores in columns with the same superscript letter are not significantly different (p < 0.05), as determined by Duncan’s multiple range test. * Data expressed on dry weight basis (DM).
Disclaimer/Publisher’s Note: The statements, opinions and data contained in all publications are solely those of the individual author(s) and contributor(s) and not of MDPI and/or the editor(s). MDPI and/or the editor(s) disclaim responsibility for any injury to people or property resulting from any ideas, methods, instructions or products referred to in the content.

