Abstract
The addition of ground olive stones in the manufacture of mortar bricks reduces their thermal conductivity coefficient and increases heat exchange insulation. So, it can improve energy efficiency and reduce the energy demand of buildings. This research analyzes, from other points of view, the economic, social and environmental impacts of the doping of GERO mortar bricks with ground olive stone in a percentage between 5% and 15% by volume of fine aggregate for use in building construction. The study focuses mainly on the region of Andalusia, Spain, where large quantities of olive stones are collected as waste from olive oil production. The economic analysis shows how the use of ground olive stones as a partial replacement of fine aggregate in mortar can generate significant savings and economic returns in the medium term (10–20 years) by reducing conventional energy consumption in heating and air conditioning installations. Finally, the Environmental Life Cycle Analysis shows that the use of ground olive stones in GERO perforated bricks reduces environmental impacts in the medium term. In summary, the research concludes that the doping of mortar bricks with ground olive stones can have a positive impact on the economy, society and the environment, and represents a sustainable and cost-effective alternative for the construction industry.
1. Introduction
The construction sector is an ideal environment to implement the concept of the circular economy [1], since it is possible to develop mixed materials doped with waste from other processes (sometimes outside the sector) but whose addition improves some of the properties of the final product. In fact, at the European level, several rules and regulations have already been established that overlap with the previous objective regarding waste management, such as the directives on the energy efficiency of buildings [2] which promotes the use of sustainable techniques and materials, the waste directive [3] which establishes the objectives to reduce waste production and promote its reuse and recycling, and the construction products directive [4] which establishes the requirements for the environmental assessment and environmental declaration of construction products, including mortars. In addition, the European Union’s Strategy for Sustainability in Construction [5] establishes a framework for improving sustainability in building construction and encourages the use of sustainable techniques and materials. But how can the sustainability of materials be achieved? The answer may lie in the use of doping.
The doping of construction materials is a technique used to improve the properties of materials and increase their energy efficiency, strength, durability, fire resistance, corrosion resistance, or simply as a substitute for traditional raw materials such as cement or aggregates. Doping is the addition of small amounts of chemical elements to materials to modify their physical properties and improve their performance. Doped materials can help reduce heat loss and the amount of energy required to heat or cool a building. Among the current materials for the doping of mortar are the wastes from industrial and agricultural processes of human activity. In this way, it is possible to give a new use to those elements that in a traditional way would have been disposed of in landfills without any kind of previous treatment.
Several studies have been carried out on the doping of mortars with residues. For instance, plastics of different origins and compositions have been used [6,7]; The recycling of end-of-life tires [8,9], through the creation of crumb rubber to replace fine aggregate in bricks and hollow bricks. This reduces the temperature gradient by 5.6% between inside and outside [8]; Wastes from blast furnace [10]; Sludge generated by the pulp and paper industry [11], highlighting that the incorporation of 10% of the waste in soil–cement blocks reaches the minimum technical requirements demanded by the regulations; Ceramic waste bricks, tiles and roof tiles from the demolition of buildings [12], improving the compressive strength over that of natural aggregate. Additional examples are agricultural residues such as: barley fibers [13], banana leaf ashes and fibers [14], peanut shells [15], cork particles [16], sawdust ashes [17], sugar cane bagasse ashes [18], rice husk ashes [19], olive ashes [20] and rice husks [21]. In the last case, it is noted that replacing 7% of the sand with rice husks reduces the thermal conductivity by 12%.
Once the great projection for the future in the incorporation of waste from industrial and agricultural activities has been explained, it is evaluated for the specific case of Spain, where a waste with great potential from the food industry, such as ground olive stone, is used. This has already been evaluated by previous researchers, where they show its mechanical viability as a substitute for fine aggregate in mortars [22,23,24]. For instance, the research by Ferreiro et al., studied the mechanical properties of mortars in which ground olive stones is used as a substitute for fine aggregate in percentages from 0% to 50% and even up to 100% substitution, in increments of 5%. Their results show significant decreases in the mechanical properties (compression and flexural) of the mortars as the percentage of use of ground olive stone increases. However, Ferreiro et al., highlight an acceptable range of use, which is 0–30% when high-strength cements such as 42.5R or 52.5R are used. In these cases, the decreases in the characteristics’ strength of the mortar are not significant and are acceptable for application in, e.g., prefabricated mortar elements [23]. Once its mechanical properties were defined, its thermal properties and the application of this mortar doped with ground olive stone in a facade for a new building were determined [24]. San Vicente et al., defined the thermal conductivity coefficient (λ) of mortars using ground olive stone as a substitute for fine aggregate in percentages of 0–30% (mechanically viable). Their results show that for the case of 30% replacement of the fine aggregate by ground olive stone, a 43.94% reduction in the thermal conductivity coefficient is achieved with respect to a reference mortar. As a result of these reductions in thermal conductivity, the use of this doped mortar in perforated bricks and its installation on the facades of a new building is proposed. The results of the thermal simulation of the building show reductions of up to −0.938 kWh/m2 of the combined heating and cooling demands [24].
Once the mechanical and thermal behaviors of this waste in mortar have been defined, it is noteworthy to be able to characterize them on other aspects such as economic, social and environmental, which is the main novelty of this research, in addition to continuing to add knowledge to the use of ground olive stone as a substitute for natural fine aggregate. With these new results, the sustainability of this waste applied to the construction sector can be evaluated. Of course, another advantage of using olive stones as a doping material is that since they are a by-product of the food industry, their use as a building material would help to promote the concept of the circular economy.
This study aims to evaluate the economic and social profitability as well as its environmental sustainability derived from the use of this ground olive stone in the construction industry; specifically, in its use as a dopant in mortars for the manufacture of perforated bricks applicable to the construction of a facade in a new building. For its economic analysis, the energy savings derived from the decrease in energy demand (heating and air conditioning) through the three traditional energy sources to supply will be compared. These are electricity, natural gas and biomass. In the Social Life Cycle Analysis (S-LCA), the main parameters and positive impacts related to the doping of mortar with olive stones to produce bricks are analyzed. Finally, an Environmental Life Cycle Analysis (E-LCA) is carried out to determine the environmental impacts related to the use of doped bricks in buildings. The aim of this research is to determine whether ground olive stone is economically viable, whether it is socially beneficial for society and the production environment, and to determine its environmental impacts. These methodologies for defining sustainability together with the previous definition of mechanical and thermal properties help to generate knowledge about the use of ground olive stone as a substitute for natural fine aggregate.
2. Current Situation of Olive Stones in Spain
The research uses ground olive stones, a main by-product of the olive oil industry in Spain. It is important to note at this point that this waste is highly conditioned by local climatology, so it is necessary to analyze locally its economic and social feasibility, as well as its environmental sustainability.
Spain was chosen for the analysis, but the final conclusions can be extrapolated to other similar countries in the Mediterranean region that are major olive producers such as Portugal, Italy and Greece, and even to other similar types of by-products such as acai seeds [25,26], cherry stones [27], grape pomace [28].
The cultivation and use of the olive tree and its olives have historically been one of the main agricultural resources in Spain. Although the Phoenicians (4th century B.C.) are credited with promoting the first olive plantations, it was during the Roman period when the olive tree expanded significantly throughout the Mediterranean Sea, turning the peninsula into one of the main exporters of olive oil. From then until now, its importance has never diminished, and it is currently one of the main signs of Spanish identity.
2.1. Olive Cultivation in Spain
According to data provided by the Ministry of Agriculture, Fisheries and Food of the Government of Spain [29] in the yearbook of statistics on agricultural areas and productions [30] that it publishes every year, the area under olive cultivation has increased in the last decade (2010–2020) to currently reach 2,624,000 hectares. Ninety-three percent of this area is used for milling and the subsequent production of olive oil, unbleached pomace and pomace oil, while only 7% is cultivated for olives for consumption as dressing. Final olive production in Spain during the last decade (2010–2020) with data provided by the Ministry of Agriculture, Fisheries and Food of the Government of Spain is represented in Figure 1.
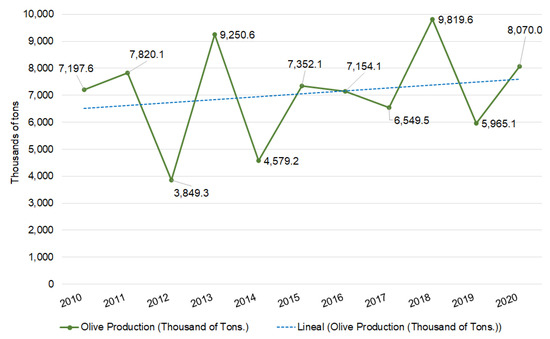
Figure 1.
Total production in Spain (2010–2020) in thousands of tons of olives according to the Government’s Ministry of Agriculture, Fisheries and Food.
Although large sawtooths can be observed in the evolution of final olive production, its linear projection has an upward trend and is currently around 8–109 kg of olives. By autonomous communities, the main percentage of planted area in Spain is located between Andalusia, Castilla-La Mancha and Extremadura. Between the three of them, they have 86.50% of all the current olive groves and 93.38% if we talk about olive production percentages, with the Andalusian Community standing out, above all, for its extension and productivity.
2.2. Energy Potential of the Ground Olive Stone in Spain
In all olive mill production (olive oil, olive pomace, etc.), and in a high percentage of table olives, the olive stone is a waste product generated in the different industrial processes. However, despite the fact that it is a waste product, in all olive-cultivating areas it is already valued as an energy resource of some importance given its possibility of being burned in biomass boilers to obtain thermal energy.
Ground olive stones have a lower calorific value (LCV) of 4489 kWh/kg according to the document “Lower calorific values of the main energy sources” of the IDAE-Spanish Institute for Energy Diversification and Saving [31]. The average density of ground olive stones is 1200 kg/m3, although its apparent density (due to air voids in storage) drops to about 600–650 kg/m3. The percentage by weight of olive stone in the olive’s total varies according to the variety, the type of olive tree and, above all, the percentage of humidity contained in the olives at the time of harvesting. A value between 10 and 20% of the weight (150 g per kilogram of olive) is a good approximation to quantify the average weight of the olive stone over the total. With these values and the production levels detailed above, it is possible to estimate a total annual production in Spain of about 1200 million kilograms of ground olive stone, with the contribution of the Andalusian Autonomous Community being fundamental, which contributes 975 million kilograms (81.27% of the total).
Although, there are other possibilities for the evaluation of olive stones, such as combustion as the main destination, since it has an important performance as a source of thermal energy. In fact, a significant percentage of this olive mill waste in the production of olive oil and olive pomace does not leave the facilities themselves, as it is used for the internal generation of thermal energy and electrical energy (cogeneration). It is also used as a direct fuel for domestic and tertiary biomass boilers to meet the demand for heating and domestic hot water. In other cases, it can also be sent to pellet manufacturing plants where it is compacted in order to standardize its size and thermal properties. All these reasons make olive stone waste a good alternative to the more common and much more polluting fossil fuels (natural gas, diesel, propane, etc.).
A conversion efficiency of 75% of the calorific value of the ground olive stones into useful energy during the combustion process in the boiler can be considered quite prudent, taking into consideration the losses due to unburned stones, as well as in the transport and distribution of heat through the pipes. With an approach of energy recovery of all the olive stones for combustion produced in Spain and with this yield of 75%, a total of 4040 GWh/year of calorific energy could be available, as shown in Table 1.

Table 1.
Potential useful thermal energy from combustion of the entire annual production of olive stone in Spain.
In order to obtain a comparison model to objectively quantify these values of potential useful thermal energy feasible by the combustion of ground olive stone biomass, data from the Study of the distribution of residential energy consumption for heating in Spain are used. This was published by the Spanish Ministry of Public Works in 2017 [32], which in turn emanates from studies carried out by IDAE in the SECH-SPAHOUSEC project (2011) [33] and its subsequent evolution SECH-SPAHOUSEC II (2019) [34].
They quantify a real total energy consumption for heating homes in Spain of 79,982 GWh/year, although this figure is reduced to 70,109 GWh/year when considering only homes that have heating consumption and are not in a situation of energy poverty. The purpose of this is to eliminate homes from the statistics that do not consume because they are uninhabited or because they do not have sufficient income to meet the thermal needs of the home. The energy poverty criterion defined in the document “Poverty, vulnerability and energy inequality” [35] is used, where homes whose expenditure on domestic energy is equivalent to more than 10% of real annual net income are considered as such.
The combustion of all the biomass generated in Spain from the grinding of olive stone residue alone would be capable of satisfying 5% of the thermal energy consumption for heating the country’s entire housing stock. The Autonomous Community of Andalusia has the highest percentage of heated homes in terms of power (677,408 kW, 85.7% of the total) with a capacity to satisfy 34.15% of the heating energy consumption of the entire community.
2.3. Ground Olive Stone Price Evolution
The price of ground olive stone residue in Spain has varied depending on the annual olive production as well as its condition and level of demand. This is a special waste because, while other waste from industrial activities does not usually have a final value (it is usually necessary to pay for its management), the viability of olive stones as a cheap fuel for biomass boilers means that it is in great demand and can be sold on the markets at a certain price. Figure 2 shows the annual evolution of olive stone prices (€cent) per kWh of energy produced according to the Olive Stone Price Index for domestic use in Spain published by AveBiom for the fourth quarter of 2022 [36].

Figure 2.
Average annual price evolution of the price (€cents) of the kWh of olive stones in Spain. * It corresponds to the year of geopolitical tensions of the Ukraine war.
However, 2022 is not a very representative year considering the geopolitical tensions generated by the war in Ukraine and its energy crisis. We can expect that as the current international instability subsides, prices will return to a more natural trend. These average prices to the final consumer include a 21% VAT and an average transport of 200 km in bulk format, for olive stone classes A1 and A2 of the Spanish standard UNE-164003 [37].
Figure 3 shows the evolution of prices per kWh of electricity, natural gas according to regulated tariffs and olive stones. Both gas and electricity incorporate a 21% value-added tax and a 22% increase in fixed costs (energy term) to obtain final consumer values. The 2022 data for electricity and gas are obtained only from the first six months, the latest provided by EUROSTAT in 2022 [38].

Figure 3.
Evolution of average prices in Spain of kWh of primary energy of electricity, gas according to EUROSTAT data and olive stone (period 2017–2022). * It corresponds to the year of geopolitical tensions of the Ukrainian war.
As can be seen, the cost of olive stones is significantly cheaper than either of the other two common energy sources to meet heating demand (electricity in aerothermal and electric radiators and natural gas in boilers).
In general, forecasting an average annual increase in fuel prices, which is necessary for future economic profitability calculations, is very difficult. A conservative option is chosen, and an average annual increase of 3% is forecast for the three energy sources under study: electricity, natural gas and olive stones. The base price calculation for each of the energy sources used is that of the year 2021, as it is also a more conservative value and eliminates the noise generated by the current European energy situation resulting from 2022. Therefore, the energy costs will be 24.27 c€/kWh electricity, 10.31 c€/kWh gas and 3.72 c€/kWh olive stone biomass.
2.4. Previous Samples
Relevant characteristics from previous research are described [23,24]. The ground olive stones have a particle size of 1~4 mm (see Figure 4) and were sieved according to EN 933-1 [39]. Their density is 580.07 kg/m3. Table 2 shows their chemical composition by component and by element.
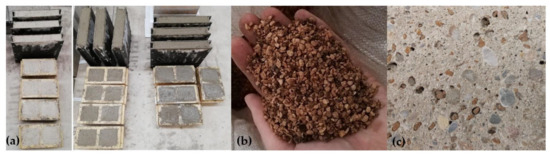
Figure 4.
(a) Mortar specimens doped with ground olive stones. (b) Raw material of ground olive stones. (c) Surface image of the ground olive stone in the mortar specimen.
Table 2.
Chemical analysis of ground olive stones.
Table 3 shows for the tested samples their mechanical compression and flexural results as well as the coefficient of thermal conductivity (λ) and density of the mortars doped with ground olive stones.
Table 3.
Results of mechanical and thermal properties of mortar with ground olive stones.
The use of waste from agricultural activities is being studied by other authors. For instance, in comparison with ground olive stone, acai seed waste (Euterpe oleracea Mart) has been identified. According to Monteiro et al., these acai seeds, like ground olive stone, are a waste product with a large production volume that cannot be reused [26]. This makes its possible use in mortars and cement paste convenient [40]. Monteiro et al., carried out a study of the properties of acai seeds and their incorporation into mortar as a replacement for fine aggregate. Their results show that the incorporation of acai seeds into mortar leads to a reduction in the mechanical performance of the mortar. This similar trend is also identified for the use of ground olive stone mortar (see Table 3). However, Monteiro et al., note that when acai seeds are subjected to a calcination process, they show a small improvement in consistency and water retention, as this prior calcination process mitigates the effect of water absorption due to the presence of lignocellulose [26].
2.5. Economic Cost of Mortar Doped with Olive Stones
Ground olive stones can be used as a mortar doping to reduce the thermal conductivity of the mortar and, consequently, reduce the energy demand for heating and air conditioning by reducing the thermal transmittance of newly constructed buildings. As such, one must bear in mind that increasing the percentage of olive stones also produces a decrease in the mechanical compressive strength that the different mortars are capable of withstanding. These characteristics limit its use in construction, since it is not capable of withstanding great stresses, and for this reason, mechanical specimens are made with a maximum percentage of olive stone of 30% [23].
Similarly, the addition of more than 15% of ground olive stone in the total weight of mortar has also been evaluated as unprofitable. The energy recovery of the incorporated residue exceeds 75 years compared to the energy that could be obtained by burning the stone with a useful yield of 75%. This is too long a period of time for the useful life of a building [24]. However, this period of time for doping between 5% and 15% does find a correct balance between the amount of olive stone provided and the reduction in demand. Thus, the time period for combustion energy recovery was established according to the different climatic zones by the Technical Building Code in Spain [41]:
- Between 30 and 37 years for the 5% doped (mean value 34 years);
- Between 47 and 58 years for the 10% doped (mean value of 53 years);
- Between 59 and 72 years for the 15% doped (mean value of 65 years).
These values, although high, are still within the useful life of a building (75 years), making it a cost-effective measure from an energy point of view. At an economic level, this substitution of materials has repercussions on prices since the price of fine aggregate is usually lower than that of ground olive stone residue. For the calculations, an average price for fine aggregate of 12 €/t (average price for 2021 supply according to the National Association of Aggregates Manufacturers—ANEFA [42]) and 167 €/t for ground olive stone (average price AveBiom 2021 [36]) is used. The price increases per m3 of treated mortar are shown in Table 4.
Table 4.
Increase in the price per m3 of treated mortar with respect to undoped mortar. * Average price of ground olive stone for the year 2021 [36]. ** Average price of fine aggregate for the year 2021 [42].
The m3 of 5% doped mortar is 3.5 €/m3 more expensive than undoped mortar. And this value increases to 7.41 €/m3 for M-10 and 10.72 €/m3 for M-15. It should be borne in mind that a m3 of conventional fine aggregate mortar averages around 60–70 €/m3. To justify its economic viability, this increase in the initial manufacturing cost of the mortar doped with olive stones with respect to that made only with fine aggregate must be offset by the economic savings generated by the reduction in the consumption of conventional fuels, the prices of which are expected to increase at a rate of 3% per year. In short, the availability of perforated bricks in the present time results in economic savings due to the increase in the price of energy sources. This economic feasibility is analyzed below, complementing the study with its Social and Environmental Life Cycle Analysis by justifying the possibility of using this doped mortar as a base material for the manufacture of perforated bricks (GERO bricks, see Figure 5) which have their mass perforated with circular perforations that represent between 25% and 50% of the total volume of the piece (in the case of the study, bricks with a 45% perforated volume are used).
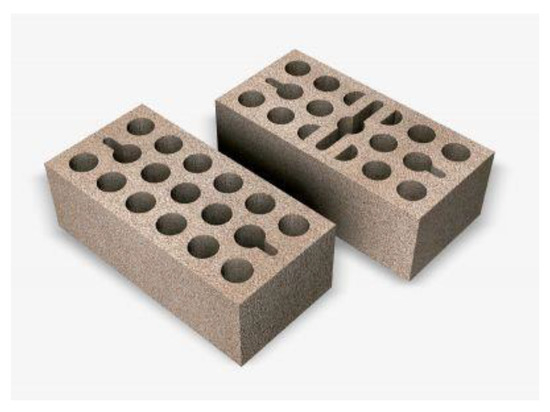
Figure 5.
Example of perforated GERO brick.
2.6. International Situation of the Olive Stone
Spain is, historically, the world’s leading country in the olive oil industry, producing between 40 and 55% of the total. It is followed, but at a considerable distance, by Italy, Greece, Tunisia, Portugal, Syria, Morocco, Algeria, Jordan, Libya and Israel. As can be seen, the production of olive oil and olive stone crushing is highly concentrated on the shores of the Mediterranean Sea, the area where olive trees are originally grown. Only isolated cases such as Chile, Australia and Argentina represent certain volumes of importance outside this area. World olive production has grown gradually and steadily from 1990 to the present day from the producing countries in the European Union, exporting to all parts of the world [43,44].
3. Economic Profitability Analysis of GERO Perforated Bricks with Mortar Doped with Olive Stones
The economic, social and environmental assessment is based on the previous research of San Vicente et al. [24]. This research studies the replacement of two sheets of GERO brick with conventional mortar (11.5 cm thick) for another mortar brick containing ground olive stone as substitute for fine aggregate in percentages of 5% to 15% replacement [24]. The facade is modelled for a newly constructed building, based on a building typology of RESIDENTIAL IN BLOCK recognized in model 6.2 of the document “Energy rating of existing buildings of the IDAE—Institute for diversification and energy saving of Spain” [45]. This building with an exterior facade of 988.50 m2 complies with the current construction requirements of the Technical Building Code in Spain in terms of limiting energy demand for air conditioning. Table 5 shows the energy savings per m2 of facade as a function of the percentage of substitution of ground olive stones as fine aggregate. The results are extracted from the research of San Vicente et al., from the multiple energy simulations in the different climatic zones existing in Spain [24].
Table 5.
Average energy savings per m2 of facade due to the incorporation of olive stone doping.
Considering the average seasonal performance of the air-conditioning machines (300% in aerothermal, 100% in condensing gas boilers, 75% in biomass boilers) which provide the final useful energy required in the building, the heating and cooling demand is calculated as the final energy saved by the consumer per m2 of facade. The results of the energy savings are shown in Table 6.
Table 6.
Energy savings per m2 of facade depending on the air-conditioning system and its stationary coefficient.
The main advantage of these final energy savings is that they occur throughout the life of the building. Thus, each year there will be an economic saving equivalent to the energy saved multiplied by the average price of the energy source paid by the final consumer. On the other hand, taking into account that the data are linked to a 23 cm thick facade, the cost increase per m2 of facade with two sheets of perforated GERO brick (11.5 cm each) is calculated in Table 7. As such, the value of the cost increase that exists when doping 1 m3 of mortar with ground olive stone is used (see Table 4). From this price, we obtain what would be the price increase of 1 m3 for a facade using GERO perforated bricks. And finally, this value is converted to the economic increase for 1 m2 of facade using GERO perforated bricks.
Table 7.
Average cost increase in the manufacture of a facade of two sheets of GERO perforated brick (23 cm).
These values are those that must be recovered in order to achieve amortization of the initial investment. For this purpose, an economic profitability analysis is carried out based on the financial indicators NPV (Net Present Value) and IRR (Internal Rate of Return), which allow the analysis and quantification of the possible return on investment. The NPV is determined by discounting the project’s future income and expense streams, minus the initial investment. The project is viable if the result of this operation is positive. On the other hand, the IRR is defined as the value of the discount rate that equals the NPV to zero for a given investment project. The simulation results are shown in Table 8.
Table 8.
Results of the economic simulation as a function of the percentage of doped brick and the air-conditioning system used.
The results obtained allow us to conclude on the economic feasibility of using bricks made of mortar doped (between 5% and 15%) with olive stones for the construction of new buildings. They are capable of recovering the cost of the energy sources needed to meet the heating energy demand in a period ranging from 10 to 40 years. At 50 years (within the useful life of a building), all options give positive average annual returns (between 1.25% and 11.12%).
4. Social Life Cycle Analysis of GERO Perforated Brick Made of Mortar Doped with Olive Stones
The social assessment of building construction is a challenge that should be encouraged in order to achieve the Sustainable Development Goals (SDGs) by 2030 [46], as the sector has always had a great potential to energize society as a generator of employment and as an economic driver at the local level. It is therefore very important to evaluate, analyze and strengthen all the possible positive social impacts that this sector may have.
It is intended to perform a Social Life Cycle Analysis (S-LCA) of the incorporation of ground olive stone for the manufacture of GERO bricks in building construction according to the methodology of the environmental standards ISO 14040 [47] and ISO 14044 [48], for the life cycle assessment of products. It is based on the development of four stages (scope, inventory, evaluation and interpretation of the results) that will allow us to assess the social scope of this energy alternative in the Autonomous Community of Andalusia (as it is the one with the greatest potential).
In the scope, the aim is to know and identify the main processes of the product life cycle that produce a greater social impact (both negative and positive) and thus have the knowledge that subsequently allows for increasing its social performance according to UNEP/SETAC [49,50,51]. The assessment comprises a cradle-to-grave approach including all impacts related to the doped mortar GERO brick production activities, as well as those arising from the construction and maintenance of each activity. To this end, a set of quantitative criteria are defined.
The agents involved are classified according to the UNEP/SETAC methodology [49] reflected in the document Guidelines for a Life Cycle Analysis in 5 categories according to their interests. Subsequently, impact subcategories are defined according to socially relevant characteristics. Internationally established agreements and standards such as the Universal Declaration of Human Rights [52] are used as a reference to define them, although some of them are modified and discarded to adapt them to the case study. Table 9 shows the selected groups and subcategories.
Table 9.
Agents involved according to the UNEP/SETAC methodology.
The product system is defined by the following phases: waste recycling, brick manufacturing, marketing, use in the construction of new buildings, maintenance and end of life. For its priority determination, the functional unit is defined as the m2 of 23 cm thick facade composed of two sheets of perforated GERO brick (11.5 cm each). Finally, the S-LCA inventory is defined in terms of unit processes using labor hours and value added as the two activity variables that allow the process to be potentially quantified. This list of processes is weighted between 0 and 10, in relation to the set of all phases out of a total of 100. The weightings performed are shown in Table 10.
Table 10.
Social life cycle inventory (S-LCA) with scoring.
Next, the relationship between each process and the different impact subcategories is established (assigning the value “x” to each impact subcategory that each process can influence). Subsequently, each process is weighted according to the life cycle inventory by scoring and aggregation by subprocesses. Figure 6 shows the matrix with the S-LCA results.
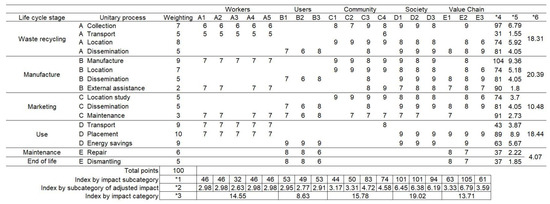
Figure 6.
Results of the S-LCA of the perforate GERO brick. *1: Index by impact subcategory: It is the sum total of each impact subcategory. *2: Index by subcategory of adjusted impact: It is each of the scores multiplied by its significance and divided by the total of 100. *3: Index by category of stakeholder: This is the sum by category of involvement of the indexes by subcategory of adjusted involvement. *4: Index by process: It is the sum total of each process. *5: Adjusted process index: It is each of the scores multiplied by its significance and divided by the total of 100. *6: Index by phase: It is the sum of the rates per adjusted process. From the information obtained from the life cycle analysis matrix, we can conclude the importance that the new product has on the phases of waste recycling, commercialization and, above all, manufacturing.
From the information obtained from the analysis matrix, we can see the importance that the new composite product has on the waste recycling, marketing and, above all, manufacturing phases, which reaffirms the theory of sustainability of the Social Life Cycle Analysis interwoven within the concept of the circular economy. On the other hand, with regard to the categories of those involved, the importance that it has on society as a whole and, to a lesser extent, on the community and on the workers themselves, stands out. This assessment supports the assertion that the use of ground olive stone residue in this new application of GERO brick doping for building would have great benefits and social impacts on the local community, especially those closest to the olive production areas; Andalusia being, in this case, the most benefited community.
From all of the above, it can be concluded the importance that this industry would have in the local community, increasing jobs in relation to the production and preparation of this waste by developing a new format of industry linked to construction.
5. Environmental Analysis of GERO Perforated Brick with Olive Stone Doped Mortar
Finally, an environmental assessment of the GERO-type brick is carried out through an Environmental Life Cycle Analysis (E-LCA). This concludes the three existing analyses for this product. This type of LCA is intended to provide knowledge of the environmental impacts of using GERO bricks in a building, in which the mortar used to manufacture this type of bricks has been doped with ground olive stone in different doping percentages.
5.1. Methodology and Case Study
The E-LCA is governed by ISO 14040 and ISO 14044 standards. These establish the stages and procedures for carrying out the E-LCA. These phases are described in the following sections.
5.1.1. Objectives and Scope
The objective is to evaluate the environmental impacts of using a GERO-type perforated mortar brick in a building, where the mortar used to make the bricks has been doped with ground olive stones in different percentages as a substitute for the fine aggregate. Since it is a constructive element for a building, it was decided to give it a scope of study that encompasses the stages of production of the raw materials that make up the GERO-type brick, manufacturing stages of the bricks themselves and their implementation in the facade of the building.
On the other hand, the assumptions made in this research are as follows. It is assumed that both the perforated bricks of the GERO type without doping and doped with ground olive stone will have a similar behavior in terms of mechanical performance on the facade of the building. Therefore, the maintenance, demolition and demolition phases are assumed to be identical for both kinds of GERO-type perforated bricks, generating no differences between them.
5.1.2. Functional Unit
The functional unit that has been defined in this research corresponds to 1 m2 of facade. This is composed of a total of 80 bricks of mortar, which is equivalent to a total of 0.0715 m3 of mortar. In this way, it will be possible to compare the creation of 1 m2 of facade in which the perforated bricks are manufactured with a mortar doped with various percentages of ground olive stones and will be contrasted with the manufacture of a reference mortar brick (undoped).
5.1.3. System Boundary
The system boundary refers to the limits of the research study. In this case, since the functional unit is composed of a construction element such as GERO bricks, the UNE-EN ISO 14040 and UNE-EN ISO 14044 standards establish a series of stages. The first stages (A1-A2-A3) correspond to the creation of the product (GERO-type brick). Therefore, these stages establish the internal processes for the creation of raw materials, transportation and energy flows necessary to create a total of 80 GERO bricks, corresponding to a 1 m2 facade. Subsequent stages (A4-A5), known as implementation in the building, include the process of transporting the bricks from the manufacturing plant to the construction site, as well as the energy consumption produced by lifting the loads to their final position in the building. Finally, the product use and maintenance phases (B1-B7) are the ones that generate the lowest environmental loads for the functional unit. Moreover, it is at these stages that the functional unit can have a positive impact on the environment. In the case of the research, it is justified given that the GERO-type brick doped with ground olive stones means a reduction in energy demands (heating and cooling) in a building [24]. Therefore, in this research we propose to study these phases and thus add to the results possible environmental advantages obtained in the use phase of the building. Ultimately, the demolition and demolition stages (C1-C4) can be considered practically the same among the various alternatives of the functional unit, so it was decided to exclude them from this research [53]. Figure 7 shows the boundary conditions that have been evaluated in this research.

Figure 7.
System boundary for the production of 1 m2 of facade with GERO perforated bricks. The green boxes represent materials, the gray boxes represent production processes, and the blue-green boxes indicate finished product. The red boxes indicate stages not evaluated in the research. The letter “T” indicates that a transport process of that raw material/product takes place.
5.1.4. Life Cycle Inventory (LCI)
In this section, the LCI is created; that is to say, to collect all the information in terms of material flows, energy, processes involved in the creation of 1 m2 of facade for a building, as well as the data necessary to characterize the olive stone pretreatment process. The software used to perform the E-LCA is SimaPro 9.4. Ecoinvent v.3 was used for the databases [54] and the European Life Cycle Databases (ELCD). In the case of internal processes such as the pretreatment of olive stones for incorporation into the mortar, as well as the creation of GERO-type bricks, recent research was used [55,56].
Materials
GERO bricks are made of conventional mortar doped with ground olive stones. Therefore, the raw materials will be:
- Cement: For the binder, it is modeled through a CEM II/B-M, in which it has a clinker percentage between 65 and 79%. The remaining components are blast furnace slag, fly ash and limestone. The cement has a strength of 42.5 MPa at 28 days.
- Fine aggregate: The fine aggregate has a size range of 0–4 mm with a density of 1634 kg/m3.
- Water: The water is of the conventional type with a pH of 7.9 and 590 ppm without any type of treatment.
- Olive stones: The olive stone has a size of 1 to 4 mm, once pretreated to function as fine aggregate, and a density of 580.07 kg/m3.
Table 11 shows the quantities of raw materials required for the manufacture of mortar for 1 m2 of facade.
Table 11.
Inventory of materials for the mortar alternatives that make up 1 m2 of facade.
- Olive Stone Grinding
In order to use ground olive stones as fine aggregate in the mortar that makes up the GERO-type perforated bricks, they must undergo pretreatment. This process consists of three subprocesses or stages. Firstly, the olive stone from olive oil production contains olive pulp, peel and water attached to it. This mixture is called olive pomace and has a high moisture content. Therefore, the first subprocess will be a drying process to reduce the moisture content, to later submit it to a grinding process to the dimensions of fine aggregate and, finally, a screening process to obtain homogeneous raw material. The machines used consume only electrical energy. The LCI of the olive grinding preparation is obtained from the research conducted by Espadas et al., where they evaluated the use of olive pomace in composite materials [55]. Electricity consumption has been adapted to Spain’s national grid. According to this research and selecting only the processes that affect the production of olive stone grinding, the consumption of 0.21 kWh/kg of olive stone grinding stands out [55].
Transportation
This section justifies the distances between the raw material production site and the point of manufacture of the prepared mortar mix. The unit of transport defined is the tone per kilometer (tkm). Commonly, raw materials are transported with a 16–32-ton truck using a diesel engine. In order to obtain the values of the distances, they are based on the research of Fraga et al., where they evaluate the preparation, transport and placement of concrete in Spain [57].
For fine aggregates, an average range of 15–60 km from the quarry to the preparation plant is established. In this research, a value of 30 km is chosen. In the case of cement, the distance is considerably increased due to the fact that there are not as many cement production plants. Fraga et al., indicate a mean transport range of 50–400 km [57]. Therefore, it was decided to choose the value of 200 km. Finally, the olive stone must travel from its place of production in the oil mill to the mortar production plant. For this purpose, the distance of 30 km is chosen again, the same as for fine aggregate. Table 12 shows the values of the transport variable.
Table 12.
Variable transportation of raw materials necessary for the creation of 1 m2 of facade. * Distance covered by cement: 200 km. ** Distance covered by the fine aggregate: 30 km. *** Distance covered by the olive stone: 30 km.
Production Process
The production process of GERO bricks begins with the creation of the mortar. For this purpose, concrete and mortar production plants have stockpiles of raw materials in silos. The process of creating the mortar is very simple. First, the components are dosed and poured into a mixer where the mixture is homogenized as water is added until the desired result is achieved. As in this first stage of the production process, the scarcity of machinery is evident, electrical consumption is not high. In the case of the investigation, 1 m2 of facade implies the use of 0.0715 m3 of mortar. According to Fraga et al., the average power required for the production of 1 m3 of mortar would be 1.96 kW/m3. This implies a consumption of 1.51 kWh/m3 of electrical energy [57]. Interpolating this value with the previous data yields an electrical energy consumption of 0.108 kWh/m3. To this consumption must be added the energy consumption derived from the olive stone treatment process for its creation as fine aggregate.
Once the mortar is mixed with the raw materials, it must be molded for the production of perforated bricks. For the inventory, we used data from the research conducted by López et al., where they performed an E-LCA of the production of ceramic bricks doped with olive stone [58]. An important aspect is that in this research, the bricks are made of mortar, so they should not be fired. Therefore, only electricity consumption is obtained from the press molder process. In addition, the cost of materials for the brick molds is accounted for. Brick drying is evaluated as a natural ventilation process without any specific machinery. And finally, the packaging of the bricks for distribution is also incorporated into the study. Table 13 shows the inventory used for the production of perforated bricks for a functional unit, specifically for a quantity of 80 bricks. An interpolation and adjustment process with respect to the reference data has been carried out to obtain the data.
Table 13.
Inventory for the manufacture of 80 bricks (1 m2 of facade).
Transport to Construction Site
Once the doped perforated bricks have been produced for the creation of 1 m2 of facade, they must be moved to the construction site. Generally, construction sites are located at various distances from the mortar and concrete plants. However, it is not common to exceed distances greater than 60 km, the most common being 30 km and the least common about 15 km [57]. In this research, a distance of 30 km from the building site was chosen. In other words, the manufactured bricks to be used on site must be transported 30 km.
Commissioning Work
This section quantifies the amount of energy required for the creation of 1 m2 of facade in a building. In the case of bricks, they are usually lifted from the first floor to the reference floor/place by means of a hoist. By carrying out an information process, it is determined that, on average, a hoist consumes a total of 14.16 Wh of electrical energy to lift a load of 400 kg. Therefore, for 1 m2 of facade consisting of 80 bricks it will be approximately 4 Wh. As can be seen, and in support of the above, in the commissioning and construction stages, the consumption of energy and raw materials is negligible compared to previous stages of product production (A1-A2-A3).
5.1.5. Life Cycle Impact Assessment
Prior to obtaining the environmental results of the research, an E-LCA methodology must be chosen. Depending on each E-LCA methodology, different results will be obtained, since each assessment methodology contains specific impact categories that others do not necessarily contain. In addition, the characterization values incorporated in each are different from each other. These serve to transform the values of matter, energy and resource flows identified in the previous stage of the LCI into environmental impacts. In the specific case of construction elements such as in this research, the EPD methodology is generally used. This methodology allows the creation of so-called Environmental Product Declarations (EPD) and thus allows different products to be compared with each other on an environmental level. Table 14 shows the impact categories included in the EPD methodology and their units of measurement.
Table 14.
Impact indicators in the environmental product declaration (EPD) methodology.
5.2. Environmental Results
5.2.1. Production Results 1 m2 of Facade
Figure 8 shows the results obtained for the E-LCA from the cradle to the door of the production of 1 m2 of facade and its implementation in a building. The m2 of the facade is composed of two layers of GERO bricks. The fine aggregate is replaced by a vegetable and residual aggregate such as ground olive stones. The results are assessed for the eight impact categories of the EPD methodology.

Figure 8.
Environmental results of 1 m2 of facade varying the percentage of olive stone doping in the GERO bricks that make up the facade.
As can be seen, as the percentage of olive stones is increased as a substitute for fine aggregate in the mortar, the environmental impacts increase. This is evident in all impact categories except water scarcity. In this category, an inverse behavior is observed, i.e., the greater the amount of olive stone material, the lower the impact. It is justified since the production of natural aggregates involves the use of large quantities of water, used for internal washing processes, to avoid dust production in quarries, filtering, etc. Therefore, reducing the amount of natural aggregate to be used in the mix reduces the associated water consumption. The alternatives with a doping percentage of 15% represent a 7.98% reduction in water consumption, which is equivalent to a saving of 0.61 m3 of water per square meter of facade.
In the global warming potential category, there is an increase in CO2 emissions of 4.68% in the case of a 15% doping, which is equivalent to emitting a value of 0.8 kg CO2/m2 of facade. These increases are a direct consequence of the higher consumption of energy and resources to dope the mortar with ground olive stones. In impact categories directly linked to the production of natural aggregates such as acidification, eutrophication and photochemical oxidation, there are increases of 29.13%, 30.28% and 21.56%, respectively, between the reference alternative and the 15% maximum doping alternative. The justification is due to the fact that the olive stone preparation process requires a certain amount of energy and material consumption (crushing process, transport), the impacts of which are greater than the amount of natural aggregate that prevents it from occurring. The transport process is crucial for the viability of recycled aggregates over natural aggregates. The transportation process generates a series of substances such as nitrogen oxides (NOx) and carbon oxides (COx), as well as the emission of solid particles that affect the ozone layer [59]. This is revealed in the results obtained in the ozone layer depletion category. For example, the alternative with a doping percentage of 15% represents an increase of 8.90%. The transport processes also have a major impact on the abiotic depletion of fossil fuels (ADFF) category. The result was an increase of 8.19% between the 15% doping option and the reference option, equivalent to a value of 6.90 MJ for each square meter of facade to be built.
In general, it is shown that the use of olive stones in mortar products to be used in building facades produces greater environmental impacts than the use of undoped mortars. However, there are small percentage increases of less than 10% in certain impact categories such as GWP 4.68%, abiotic depletion of elements 6.00%, ADFF 8.19% and ozone layer depletion 8.90%. In other categories, the increase in impact is significant and exceeds 20%, as we have seen above. It should be taken into account that the functional unit is 1 m2 of facade, a small value. In the case of a residential building, for example, where the facade surface is considerable (~1000 m2), the environmental impacts would be exponential.
On the other hand, and as indicated above, although in the construction and implementation phases the environmental benefits of ground olive stones are non-existent, this does not imply that in the use phases of the building there is an environmental improvement. Research by San Vicente et al., indicates the following energy savings per square meter of facade per year [24], as shown in Table 5, as a function of the percentage of olive stone doping. As can be seen, the higher the percentage of bricks, the higher the energy savings.
5.2.2. Results in the Use Phase of GERO Bricks in Building Construction
Once you have the final energy savings per m2 of facade, it should be moved to primary energy and CO2 emissions values. For this purpose, the IDAE [60] step factors are used, depending on the type of energy used to cover the building’s energy demand. The most common energy sources to supply the energy demand in buildings are studied. These are electric power, natural gas and diesel. Table 15 shows the various values of energy savings per square meter of facade depending on the type of energy used and the percentage of doping.
Table 15.
Results of energy savings per m2 of facade depending on the percentage of doping. * The step factor for obtaining primary energy is 2.368 for electricity, 1.195 for natural gas and 1.182 for diesel. ** The step factor for CO2 emissions is 0.331 for electricity, 0.252 for natural gas and 0.311 for diesel [60].
The savings over a period of 35 years will be calculated, considering this figure as half of the useful life of the building in Spain (~70 years). Due to the fact that ground olive stones produce energy savings when implemented in a facade, it was decided to choose impact categories related to energy savings. Therefore, it was decided to select the impact categories of ADFF and GWP over a period of 35 years of the use of one square meter of facade with various percentages of doping. The study of environmental impacts on other impact categories is reserved for future research. The results are shown in Figure 9.
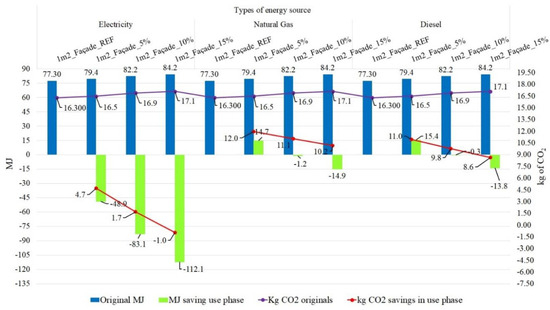
Figure 9.
Comparison of the ADFF and GWP results obtained in the scenario without accounting for the use phase and those obtained as a result of the energy savings resulting from the use of doped GERO bricks in a building. The simulation period is 35 years.
First, we begin by explaining the ADFF category. The blue bars show the MJ of fossil fuel energy obtained from cradle-to-gate E-LCA for the manufacture and implementation of one square meter of facade in a building, using GERO-type bricks for this purpose. As seen above, the higher the doping percentage, the higher the energy consumption. The green bars are the result of subtracting from the blue bars the energy savings arising from the use of a facade doped with ground olive stones, over a period of 35 years. The doped mortar containing the GERO bricks is a more insulating element, resulting in energy savings. This reduces the energy demand (heating and cooling) of the building. In addition, it discriminates according to the type of energy source used to meet the energy demand of the building. The best results are obtained as the percentage of doping is higher, since greater energy savings per year are promoted. Within the maximum doping levels, the electrical power source experiences the most significant results even with negative values. For example, the m2 of facade at 15% doping means avoiding consuming 112.1 MJ of fossil fuels in 35 years. In addition to globally indicating the production of 1 m2 of facade at 15% doping over a 35-year horizon, it represents zero cost of energy consumption in its manufacture. The 84.2 MJ of energy of initial investment required for the creation of 1 m2 of facade is amortized.
If the energy sources are compared for the same type of doping percentage, for example, 15%, it is shown that the results with the best environmental load are produced for electricity (−112.1 MJ), natural gas (−14.9 MJ) and diesel (−13.8 MJ). This is derived from the IDAE pass-through factors.
In terms of CO2 emissions, there is again a tendency to emit less kg of CO2 as the percentage of doping increases. This is evident in the case of an electrical energy source and the maximum percentage of doping (15%), where the square meter of facade means to stop emitting −1.0 kg of net CO2 in a period of 35 years. This is a great result compared to the original value of 17.1 kg CO2/m2. This reduced CO2 emissions by −105.84%. It can be indicated that the production of one square meter of facade with 15% doping has zero CO2 emission for the case of the electric power source. This decreasing trend is applicable to other energy sources such as natural gas, where for the same doping case the reduction with respect to the original is 40.35% of CO2 emissions, And finally, in the case of diesel, a decrease of 49.70%. Extending the study horizon to 70 years, for example, would result in negative CO2 emission values per square meter of facade for all energy sources. In other words, it behaves as a CO2 sink derived from energy savings.
In conclusion, if the framework of study is in the production and implementation of one square meter of facade in a building in which the GERO-type brick whose mortar contains ground olive stones is not environmentally viable, however, if the study frame is extended to the middle of the building’s useful life (35 years), the environmental benefits are evident in categories such as ADFF and GWP. This stems from the fact that ground olive stones have better thermal properties than undoped mortar, thus inducing a number of energy savings. If these energy savings accumulate over time, they can exceed the amounts of energy that were initially used to create the functional unit, even reaching negative values, which means that energy consumption is being avoided. The same results can be extrapolated to CO2 emissions released into the atmosphere.
6. Discussion
The addition of a certain percentage of ground olive stone doping to the mortar (between 5% and 15%) for the manufacture of perforated GERO bricks for the construction and insulation improvement of new building envelopes is an application that combines its energy advantages with waste minimization, fitting perfectly with the European strategic objectives in a circular economy. This option of construction with doped bricks makes it possible to reduce the energy demand of buildings constructed with this material, with a consequent reduction in CO2 emissions. It also analyzes how the recovery of an abundant waste in Spain (mainly Andalusia), such as ground olive stones, can have a very interesting application in construction from an economic, social and environmental sustainability point of view.
The simulation of economic feasibility analysis based on NPV and IRR indicators yields quite encouraging results. In this sense, a return on investment is estimated between 11 and 19 years for mortar bricks doped at 5%, between 20 and 33 years for those doped at 10% and between 26 and 41 years for those doped at 15%. In all cases, the recovery period is less than 50 years, which is the minimum age required for a newly constructed building in Spain. This is due to the fact that the prices of the fuels that generate the energy needed in homes are always on the rise, and with a fairly conservative approach of an annual increase of 3%, the initial investment is amortized reasonably quickly.
Finally, an environmental and S-LCA is performed to determine which phases and categories of stakeholders have the greatest positive impact. This social and environmental assessment of a possible application of the construction sector is a good tool given the importance of this sector in the dynamization of regional economies and its capacity to generate local employment, especially in the Autonomous Community of Andalusia.
The environmental assessment highlights the advantages associated with doping mortars with olive stones. These benefits become evident when prolonged periods of use of doped mortar in buildings are studied. However, limiting the range of study only to the production of doped mortar only provides benefits in certain impact categories such as water scarcity, increasing the impact in other categories such as global warming potential. This is also identified by López et al., where they use olive pomace in ceramic bricks. They highlight increases in climate change potential of up to 63% when 10% olive pomace is used in ceramic bricks compared to the production of ceramic bricks with no additive [58]. A similar situation is observed in the current research, where if the range is from cradle to gate, CO2 emissions increase by 4.98% for a doping rate of 15% per square meter of facade. On the contrary, as the percentage of olive stones increases, these impacts are accentuated. This research demonstrates that many products associated with sustainable construction generate medium- and long-term benefits rather than instant benefits. As demonstrated in this research, over a simulation period of 35 years, the use of mortar doped with 15% ground olive stone in one square meter of facade reduces the emission of 17.1 kg CO2/m2 to a negative value of −1.0 kg CO2/m2. Similar trends are found in research using waste from the olive oil industry. For instance, Espadas, studied the incorporation of olive pomace in bio-composite laths. They established emission values of 20.5 kg CO2 for the olive pomace lath in contrast to a traditional PVC lath where it is 39.6 kg CO2 [55]. This means reducing CO2 emissions by almost half for a service life of 25 years. This demonstrates the high environmental viability of waste derived from the olive industry.
Finally, the research as a whole discusses the application of the circular economy concept and its relation to achieving sustainability in the construction sector [5]. In reference to international legislation and standards, it fits within the sustainable development goals promoted by the United Nations. Specifically, the research would be in line with objective no. 9 (Industry, Innovation and Infrastructure) as well as objective no. 11 (Sustainable Cities and Communities) [46] and at the European level with regulations on the use of waste and its use in construction products [3,4].
It is particularly relevant at this point to argue the importance of proximity in the generation of olive stone crushed to promote economic and social viability, as well as environmental sustainability. The distancing of the raw material for the manufacture of the bricks at greater distances than those proposed in the research would ostensibly reduce the effectiveness of the doping in its life cycle.
7. Conclusions
From the results obtained, it can be concluded that the addition of ground olive stone in 5% of total volume to the composition of the mortar for the manufacture of perforated GERO bricks, which can be used in the construction of facades of new buildings, is the option that generates the greatest economic advantages.
Although higher additions of ground olive stone doping to mortars decrease the thermal conductivity and, therefore, make them more thermally insulating, an excessive amount reduces their mechanical strength in a way that makes it technically unfeasible. In addition, amounts higher than 15% show very high energy recovery times (over 100 years) compared to the energy that could be obtained from olive stone combustion in biomass boilers.
In the case study of a building with two sheets of undoped perforated GERO bricks in the facades and meeting the insulation requirements of the Spanish Technical Building Code, doping rates between 5% and 15% are both technically and energetically feasible since their recovery periods are below the useful life of a new building (less than 75 years).
The most economically viable option after conducting a feasibility study using NPV and IRR is that of doping the 5% perforated GERO brick with ground olive stone where the payback period is lower (11–19 years).
To perform the analysis, an increase in current kWh prices for various energy sources of 3% is proposed, a fairly safe value considering the current energy price fluctuations. The recovery is better compared to the prices linked to electricity supplies because it is currently the most expensive energy.
The S-LCA allows us to affirm the importance that the local exploitation of this waste can have both in the community (close to the origin of waste generation) and in society itself, given the impact it has on energy and the environment.
The determination of the scope of an E-LCA is relevant and decisive. Most research on this topic only focuses on the cradle-to-gate reach. However, studying future applications of the use of mortars in building and assessing their impacts may involve another view. The result of this is the interpretation obtained in this research by incorporating the environmental advantages of phases subsequent to the production of the mortar.
If the cradle-to-gate E-LCA framework is strictly studied, the use of ground olive stones as a substitute for fine aggregate in mortars produces greater impacts in the categories evaluated with the exception of the water scarcity category. It is reduced by 7.98% for the facade alternatives that are doped with 15%. This water saving can be a direct justification for using this type of mortar, since nowadays water is considered a basic and essential commodity.
It has been shown that producing 1 m2 of facade in which the mortar is doped and used in bricks implies long-term environmental advantages of study. In the case of the research over a simulation period of 35 years, there is an evident decrease in impacts in categories such as ADFF and GWP. In cases of 15% doping, and for energy sources such as electricity, the results show that the mortar used in the facade behaves as a sink for CO2 emissions, as well as avoiding the consumption of fossil fuels.
Author Contributions
Conceptualization, J.L.S.-O. and J.F.-C.; Methodology, A.S.V.-N.; Investigation, A.S.V.-N., E.F.-G. and J.F.-C.; Writing—original draft, J.L.S.-O. and E.F.-G.; Writing—review & editing, E.F.-G. All authors have read and agreed to the published version of the manuscript.
Funding
This research was funded by the University of La Rioja, grant number REGI2023/21. Also, the author Jorge Los Santos-Ortega is a predoctoral researcher funded by the University of La Rioja and Banco Santander.
Institutional Review Board Statement
Not applicable.
Informed Consent Statement
Not applicable.
Data Availability Statement
The raw data supporting the conclusions of this article will be made available by the authors on request.
Acknowledgments
The authors are very grateful to the University of La Rioja, and to the company Trujal 5 Valles, for their support.
Conflicts of Interest
The authors declare no conflict of interest.
Abbreviations
Institute for Energy Diversification and Saving (IDAE), Net Present Value (NPV), Internal Rate of Return (IRR), Social Life Cycle Analysis (S-LCA), Environmental Life Cycle Analysis (E-LCA), Cost Life Cycle Analysis (C-LCA), European Life Cycle Databases (ELCD), Abiotic depletion of fossil fuels (ADFF), Global Warming Potential (GWP), Ground Olive Stone (GOS).
References
- Gobierno de España. España Circular 2030. Estrategia Española de Economía Circular. Available online: https://www.miteco.gob.es/content/dam/miteco/es/calidad-y-evaluacion-ambiental/temas/economia-circular/espanacircular2030_def1_tcm30-509532_mod_tcm30-509532.pdf (accessed on 26 February 2024).
- Parlamento Europeo. Directiva (UE) 2018/2002 del Parlamento Europeo y del Consejo de 11 de Diciembre de 2018. Available online: https://www.boe.es/doue/2018/328/L00210-00230.pdf (accessed on 26 February 2024).
- Parlamento Europeo. Directiva (UE) 2018/851 del Parlamento Europeo y del Consejo de 30 de Mayo de 2018. Available online: https://eur-lex.europa.eu/legal-content/ES/TXT/?uri=CELEX%3A32018L0851 (accessed on 26 February 2024).
- Parlamento Europeo. Reglamento (UE) 305/2011 del Parlamento Europeo y del Consejo 2011. Available online: https://industria.gob.es/Calidad-Industrial/seguridadindustrial/productosindustriales/Productos-de-la-Construccion/Paginas/Reglamento-Europeo-Productos-Construccion.aspx (accessed on 26 February 2024).
- Comisión Europea-Secretaría General. Guía Para la Estrategia Europea de Desarrollo Sostenible 2007. Available online: https://www.miteco.gob.es/content/dam/miteco/es/ministerio/planes-estrategias/estrategia-espanola-desarrollo-sostenible/Guia_de_la_Estrategia_Europea_de_desarrollo_sostenible_VE_tcm30-88618.pdf (accessed on 26 February 2024).
- De Melo, A.B.; Silva, E.P. Lightweight concrete blocks with EVA recycled aggregate: A contribution to the thermal efficiency of building external walls. Mater. Constr. 2013, 63, 312. [Google Scholar]
- Yesilata, B.; Isiker, Y.; Turgurt, P. Thermal insulation enhancement in concretes by adding waste PET and rubber prices. Constr. Build. Mater. 2009, 23, 1878–1882. [Google Scholar] [CrossRef]
- García, E.F.; Cabello, J.F.; Giro, M.M.; Navarro, A.S.V. Thermal behaviour of hollow blocks and bricks made of concrete doped with waste tyre rubber. Constr. Build. Mater. 2018, 176, 193–200. [Google Scholar] [CrossRef]
- Úruburu, A.; Cueto, E.P.; Benita, J.R.C.; Meré, J.O. The new challenges of end-of-life tyres management systems: A Spanish case study. Waste Manag. 2013, 33, 679–688. [Google Scholar] [CrossRef]
- Colangelo, F.; Forcina, A.; Farina, I.; Petrillo, A. Life Cycle Assessment (LCA) of different kinds of concrete containing waste for sustainable construction. Buildings 2018, 8, 70. [Google Scholar] [CrossRef]
- Franca, B.R.; Azevedo, A.R.G.; Monteiro, S.N.; Filho, F.D.C.G.; Marvila, M.T.; Alexandre, J.; Zanelato, E.B. Durability of Soil-Cement Blocks with the Incorporation of Limestone Residues from the Processing of Marble. Mater. Res. 2018, 21, e20171118. [Google Scholar] [CrossRef]
- Yanti, E.D.; Mubarok, L.; Subari; Erlangga, B.D.; Widyaningsih, E.; Jakah; Pratiwi, I.; Rinavian, A.; Nugroho, T.; Herbudiman, B. Utilization of various ceramic waste as fine aggregate replacement into fly ash-based geopolymer. Mater. Lett. 2024, 357, 135651. [Google Scholar] [CrossRef]
- Belhadj, B.; Bederina, M.; Montrelay, N.; Houessou, J.; Quéndeudec, M. Effect of substitution of wood shavings by barley straws on the physico-mechanical properties of lightweight sand concrete. Constr. Build. Mater. 2014, 66, 247–258. [Google Scholar] [CrossRef]
- Kanning, R.C.; Portella, K.F.; Braganca, M.O.G.P.; Bonato, M.; dos Santos, J.C.M. Banana leaves ashes as pozzolan for concrete and mortar of Portland cement. Constr. Build. Mater. 2014, 54, 460–465. [Google Scholar] [CrossRef]
- Sada, B.H.; Amartey, Y.D.; Bako, S. An investigation into the use of groundnut shell as fine aggregate replacement. Niger. J. Technol. 2013, 32, 54–60. [Google Scholar]
- Panesar, D.K.; Shindman, B. The mechanical, transport and thermal properties of mortar and concrete containing waste cork. Cem Concr Compos 2012, 34, 982–992. [Google Scholar] [CrossRef]
- Mageswari, M.; Vidivelli, B. The Use of Sawdust Ash as Fine Aggregate Replacement in Concrete. J. Environ. Res. Dev. 2009, 3, 720–726. Available online: https://www.semanticscholar.org/paper/THE-USE-OF-SAWDUST-ASH-AS-FINE-AGGREGATE-IN-Mageswari-Vidivelli/9df66479151661ac0687b9038566d1a915ca29b3 (accessed on 26 March 2024).
- Modani, P.O.; Vyawahare, M.R. Utilization of bagasse ash as a partial replacement of fine aggregate in concrete. Procedia Eng. 2013, 51, 25–29. [Google Scholar] [CrossRef]
- Givi, A.N.; Rashid, S.A.; Aziz, F.N.A.; Salleh, M.A.M. Assessment of the effects of rice husk ash particle size on strength, water permeability and workability of binary blended concrete. Constr. Build. Mater. 2010, 24, 2145–2150. [Google Scholar] [CrossRef]
- Barreca, F.; Fichera, C.R. Use of olive stone as an additive in cement lime mortar to improve thermal insulation. Energy Build 2013, 62, 507–513. [Google Scholar] [CrossRef]
- Mahapatra, D.; Mandav, V.; Puttarangam, A.B.T. Mechanical and dynamic thermal performance evaluation of rice husk blended cement plaster when used with different bricks. J. Build. Eng. 2024, 82, 108120. [Google Scholar] [CrossRef]
- Rodríguez, J.G.; Martínez, F.F.; Santa, J.; Astorqui, C. Viability of using olive stones as lightweight aggregate in construction mortars. Rev. Constr. 2017, 16, 431–438. [Google Scholar]
- Cabello, J.F.; García, E.F.; Espinoza, A.P.; de Pisón, F.J.M. Strength Performance of Different Mortars Doped Using Olive Stones as Lightweight Aggregate. Buildings 2022, 12, 1668. [Google Scholar] [CrossRef]
- Navarro, A.S.V.; Giro, M.M.; Ortega, J.L.S.; García, E.F.; Cabello, J.F.C. Alternative Use of the Waste from Ground Olive Stones in Doping Mortar Bricks for Sustainable Façades. Buildings 2023, 13, 2992. [Google Scholar] [CrossRef]
- Garcez, L.R.; Lima, M.D.S.; Ribas, L.F.; Balestra, C.E.T.; Monteiro, N.B.R.; Filho, J.A.M.; Gil, M.A.R. Characteristics of the açai seed (Euterpe precatoria Martius) after thermal processing and its potential in soil-cement brick. Case Stud. Constr. Mater. 2021, 20, e02816. [Google Scholar] [CrossRef]
- Monteiro, G.P.; Marvila, M.T.; Pedroti, L.G.; de Brito, J.; de Azevedo, A.R.G. Evaluation of coating mortars with addition of açai seed (Euterpe olearacea Mart.) in different processing conditions. J. Build. Eng. 2024, 8, 108459. [Google Scholar] [CrossRef]
- Barbieri, L.; Andreola, F.; Lancellotti, I.; Taurino, R. Management of agricultural biomass wastes: Preliminary study on characterization and valorisation in clay matrix bricks. Waste Manag. 2013, 33, 2307–2315. [Google Scholar] [CrossRef] [PubMed]
- Taurino, R.; Ferretti, D.; Cattani, L.; Bozzoli, F.; Bondioli, F. Lightweight clay bricks manufactured by using locally available wine industry waste. J. Build. Eng. 2019, 26, 100892. [Google Scholar] [CrossRef]
- Ministerio de Agricultura, Pesca y Alimentación. Available online: https://www.mapa.gob.es/es/ (accessed on 15 February 2024).
- Ministerio de Agricultura, Pesca y Alimentación. Anuario de Estadística 2021. Available online: https://www.mapa.gob.es/es/estadistica/temas/publicaciones/anuario-de-estadistica/default.aspx (accessed on 14 February 2024).
- Instituto Para la Diversificación y Ahorro de Energía. Available online: https://www.idae.es/ (accessed on 16 February 2024).
- Fundación Conana. Estudio de la Distribución del Consumo Energético Residencial Para Calefacción en España. Available online: https://www.transportes.gob.es/recursos_mfom/paginabasica/recursos/201804_estudio_distribucion_consumo_energetico_res.pdf (accessed on 20 February 2024).
- Proyecto SECH-SPAHOUSE. Análisis del Consumo Energético del Sector Residencial en España. Available online: https://www.miteco.gob.es/es/cambio-climatico/temas/mitigacion-politicas-y-medidas/edificacion.html (accessed on 5 January 2024).
- IDAE. SPAHOUSEC II: Análisis Estadístico del Consumo de Gas Natural en Las Viviendas Principales con Calefacción Individual. Available online: https://www.idae.es/publicaciones/spahousec-ii-analisis-estadistico-del-consumo-de-gas-natural-en-las-viviendas (accessed on 5 January 2024).
- Asociación de Ciencias Ambientales. Pobreza, Vulnerabilidad y Desigualdad Energética. Available online: https://www.cienciasambientales.org.es/index.php/nuestra-labor/areas-tematicas/transicion-energetica/estudios-y-guias (accessed on 5 January 2024).
- AveBiom. Índice de Precios de Hueso de Aceituna Para Uso Doméstico en España. Available online: https://www.avebiom.org/sites/default/files/ipb/IPB-Indice-precios-HUESO-AVEBIOM.pdf (accessed on 5 January 2024).
- UNE 164003:2014; Biocombustibles Sólidos. Asociación Española de Normalización: Madrid, Spain, 2014. Available online: https://www.une.org/encuentra-tu-norma/busca-tu-norma/norma?c=N0053717 (accessed on 20 January 2024).
- EUROSTAT. Available online: https://ec.europa.eu/eurostat (accessed on 21 January 2024).
- UNE-EN ISO 933-1; Ensayos Para Determinar las Propiedades Geométricas de los Áridos. Asociación Española de Normalización: Madrid, Spain, 2012. Available online: https://www.en.une.org/encuentra-tu-norma/busca-tu-norma/norma?c=N0049638 (accessed on 25 December 2023).
- Azevedo, A.; De Matos, P.; Markssuel, M.; Sakata, R.; Silvestro, L.; Gleize, P.; de Brito, J. Rehology, hydration, and microstructure of portland cement pastes produced with ground açaí fibers. Appl. Sci. 2021, 11, 3036. [Google Scholar] [CrossRef]
- Ministerio de Vivienda y Agenda Urbana. Código Técnico de la Edificación. Available online: https://www.codigotecnico.org/ (accessed on 30 January 2024).
- Asociación Nacional de Fabricantes de Áridos-ANEFA. Available online: https://www.aridos.org/ (accessed on 1 December 2023).
- Statista. Volumen de Aceite de Oliva Producido en España Entre 2011/2012 y 2022/2023. Available online: https://es.statista.com/estadisticas/516683/produccion-de-aceite-de-oliva-en-espana/ (accessed on 10 April 2024).
- FOASTAT. Food and Agriculture Organization of the United Nations. Available online: https://www.fao.org/faostat/en/#home (accessed on 10 April 2024).
- IDAE. Escala de Calificación Energética Edificios Existentes. Available online: https://www.idae.es/uploads/documentos/documentos_11261_EscalaCalifEnerg_EdifExistentes_2011_accesible_c762988d.pdf (accessed on 31 January 2024).
- Naciones Unidas. Informe de los Objetivos de Desarrollo Sostenible. Available online: https://unstats.un.org/sdgs/report/2022/The-Sustainable-Development-Goals-Report-2022_Spanish.pdf (accessed on 5 March 2024).
- UNE-EN ISO 14040; Gestión Ambiental. Análisis de Ciclo de Vida. Asociación Española de Normalización: Madrid, Spain, 2006. Available online: https://www.une.org/encuentra-tu-norma/busca-tu-norma/norma?c=N0038060 (accessed on 14 March 2024).
- UNE-EN ISO 14044; Gestión Ambiental. Análisis de Ciclo de Vida. Asociación Española de Normalización: Madrid, Spain, 2006. Available online: https://www.une.org/encuentra-tu-norma/busca-tu-norma/norma?c=N0038059 (accessed on 14 March 2024).
- Guidelines for Social Life Cycle Assessment of Products and Organisations 2020. Available online: https://wedocs.unep.org/handle/20.500.11822/34554;jsessionid=A2E48A5199358F16CBCFC72EAFB6570D (accessed on 14 March 2014).
- Griebhammer, R.; Benoit, C.; Dreyer, L.C.; Flysjo, A.; Manhart, A.; Mazijn, B.; Méthot, A.L.; Weidema, B. Feasibility Study: Integration of social aspects into LCA. 20 LCA Consult. 2006. Available online: https://www.saiplatform.org/uploads/Library/UNEP-SETACLifeCycleInitiativeTFonSocialIssues-FeasibilityStudy.pdf (accessed on 20 January 2024).
- Jorgenesen, A.; Bocq, A.L.; Nazarkina, L.; Hauschild, M. Methodologies for Social Life Cycle Assessment. Int. J. LCA 2008, 13. Available online: https://saiplatform.org/uploads/Library/Ludmilaetc.pdf (accessed on 20 January 2024). [CrossRef]
- Naciones Unidas. La Declaración Universal de los Derechos Humanos. Available online: https://www.un.org/es/about-us/universal-declaration-of-human-rights (accessed on 27 March 2024).
- Ortega, J.L.S.; García, E.F.; Cabello, J.F. Methodology for the environmental analysis of mortar doped with crumb rubber from end-of-life tires. Constr. Build. Mater. 2023, 399, 132519. [Google Scholar] [CrossRef]
- Ecoinvent v3.0. Available online: https://ecoinvent.org/ (accessed on 27 March 2024).
- Aldana, G.E.; Amaguña, P.G.; Vialle, C.; Belaud, J.P.; Evon, P.; Sablayrolles, C. Life Cycle Assessment of Olive Pomace as a Reinforcement in Polypropylene and Polyethylene Biocomposite Materials: A New Perspective for the Valorization of This Agricultural By-Product. Coatings 2021, 11, 525. [Google Scholar] [CrossRef]
- Rodríguez, M.U.; García, A.B.L.; Maroto, J.M.M.; Ceacero, C.J.C.; Palomino, M.T.C.; García, C.M. Evaluation of the environmental benefits associated with the addition of olive pomace in the manufacture of lightweight aggregates. Materials 2020, 13, 2351. [Google Scholar] [CrossRef]
- Fraga, J.M.; Gochi, A.C.; López, M.C. Sostenibilidad en la preparación y puesta en obra de hormigón en España: Análisis de consumo energético y emisiones de CO2. In Proceedings of the 18th International Congress on Project Management and Engineering, Alcañiz Teruel, Spain, 16–18 July 2014. [Google Scholar]
- López, A.B.; Palomino, T.C.; Rodríguez, M.U.; Maroto, J.M.M.; Ceacero, C.J.C.; Andreola, N.M.; García, C.M. Application of life cycle assessment in the environmental study of sustainable ceramic bricks made with ‘alperujo’ (Olive pomace). Appl. Sci. 2021, 11, 2278. [Google Scholar] [CrossRef]
- Silgado, S.S.S.; Ramón, X.R.; Valdiviezo, L.C. A comparative Life Cycle Assessment between recycled aggregate and natural aggregate. Rev. EIA 2022, 19, 1–15. [Google Scholar] [CrossRef]
- IDAE. Factores de Emisión de CO2 y Coeficientes de Paso a Energía Primaria de Diferentes Fuentes de Energía Final Consumidas en el Sector de Edificios en España. Available online: https://www.miteco.gob.es/content/dam/miteco/es/energia/files-1/Eficiencia/RITE/documentosreconocidosrite/Otros%20documentos/Factores_emision_CO2.pdf (accessed on 4 March 2024).
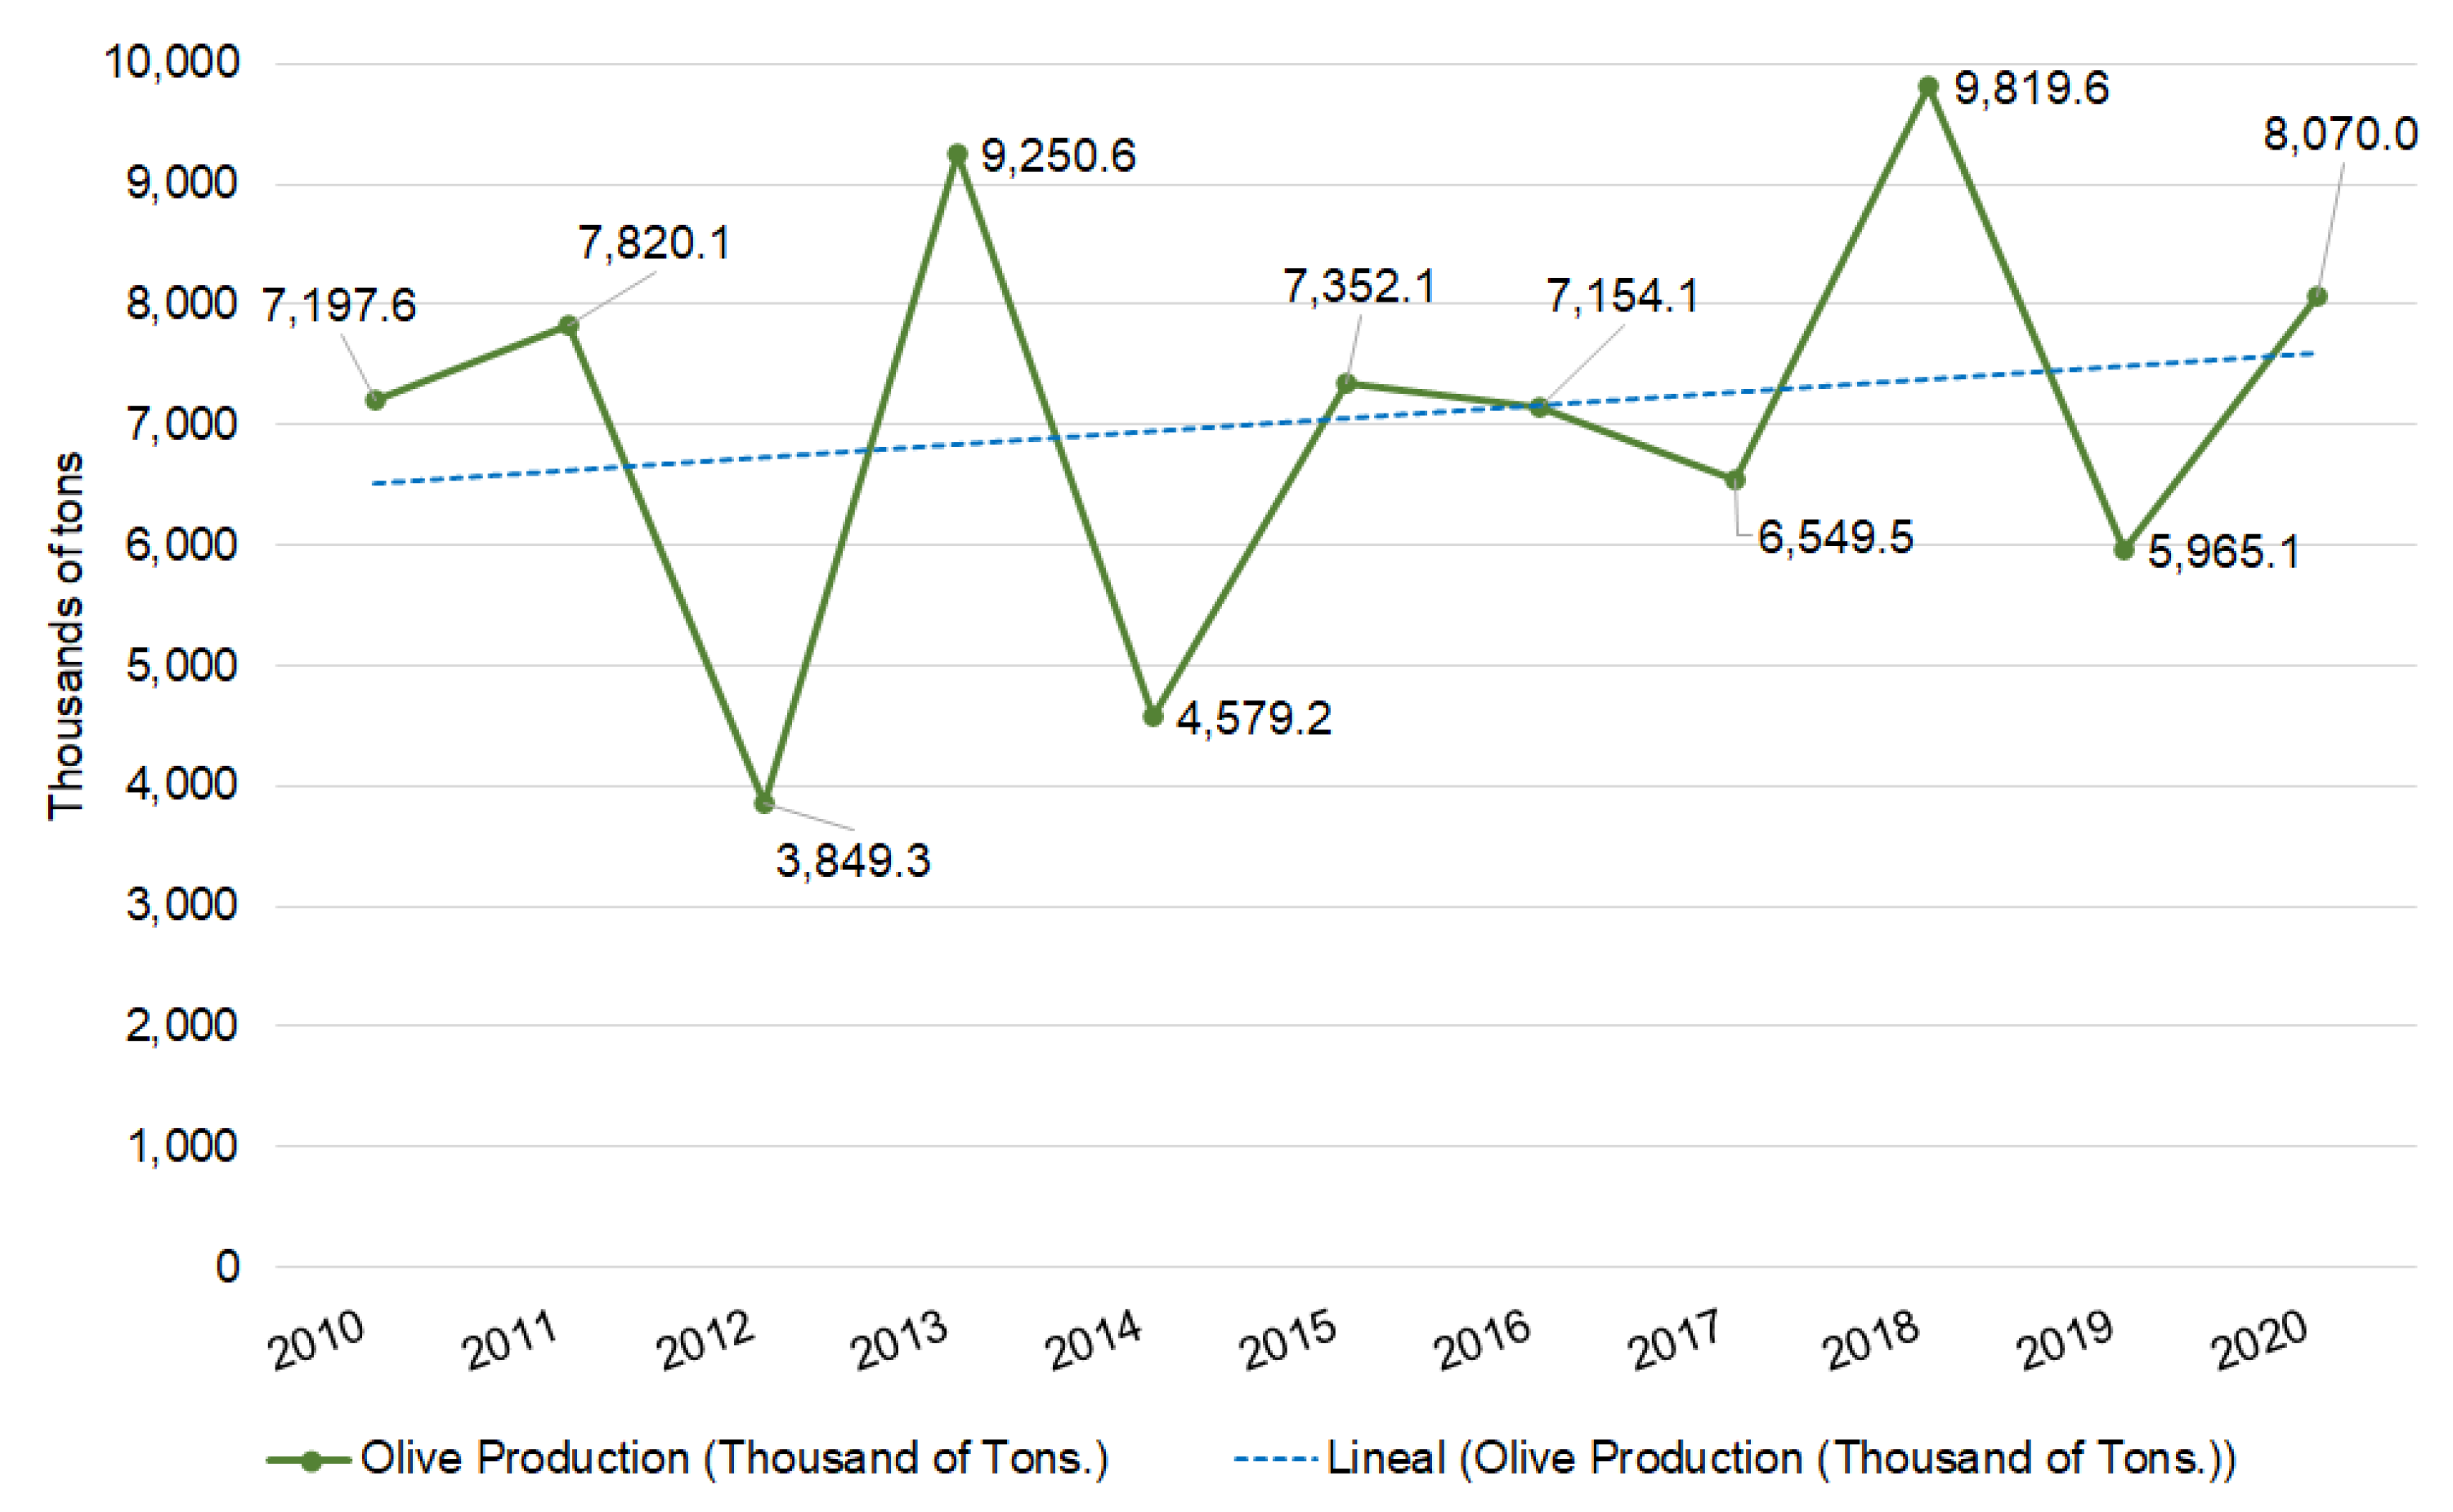
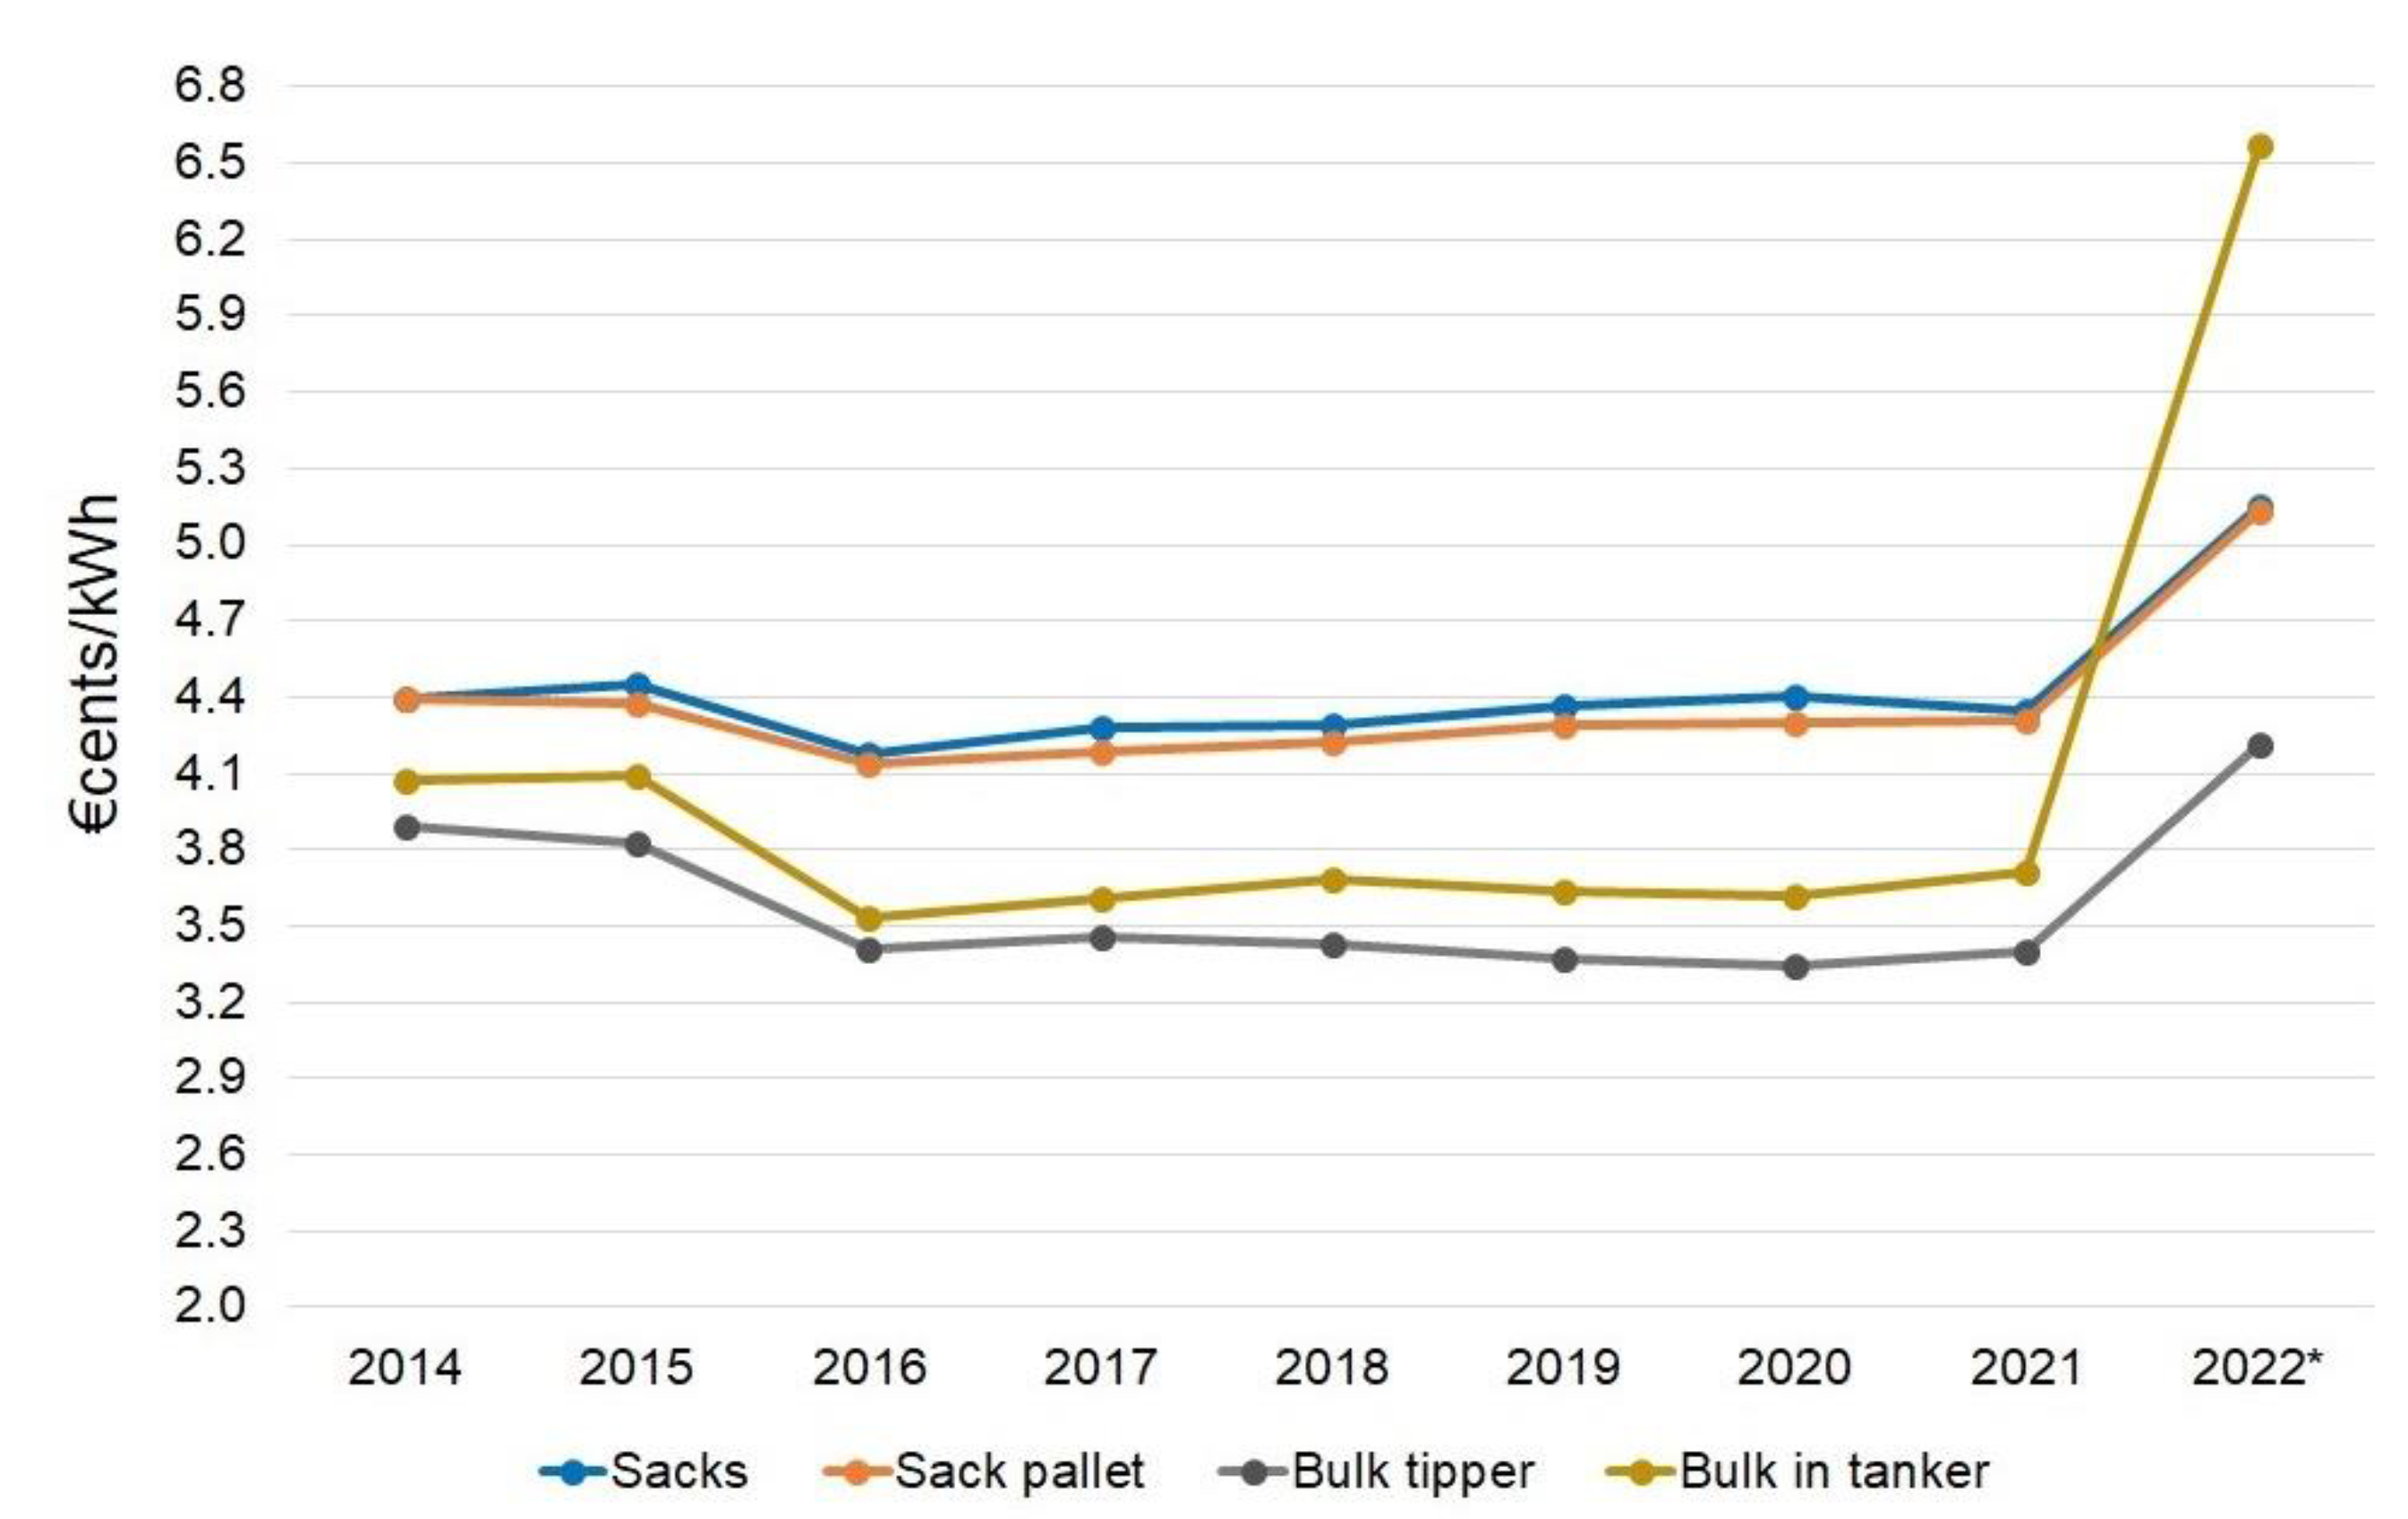
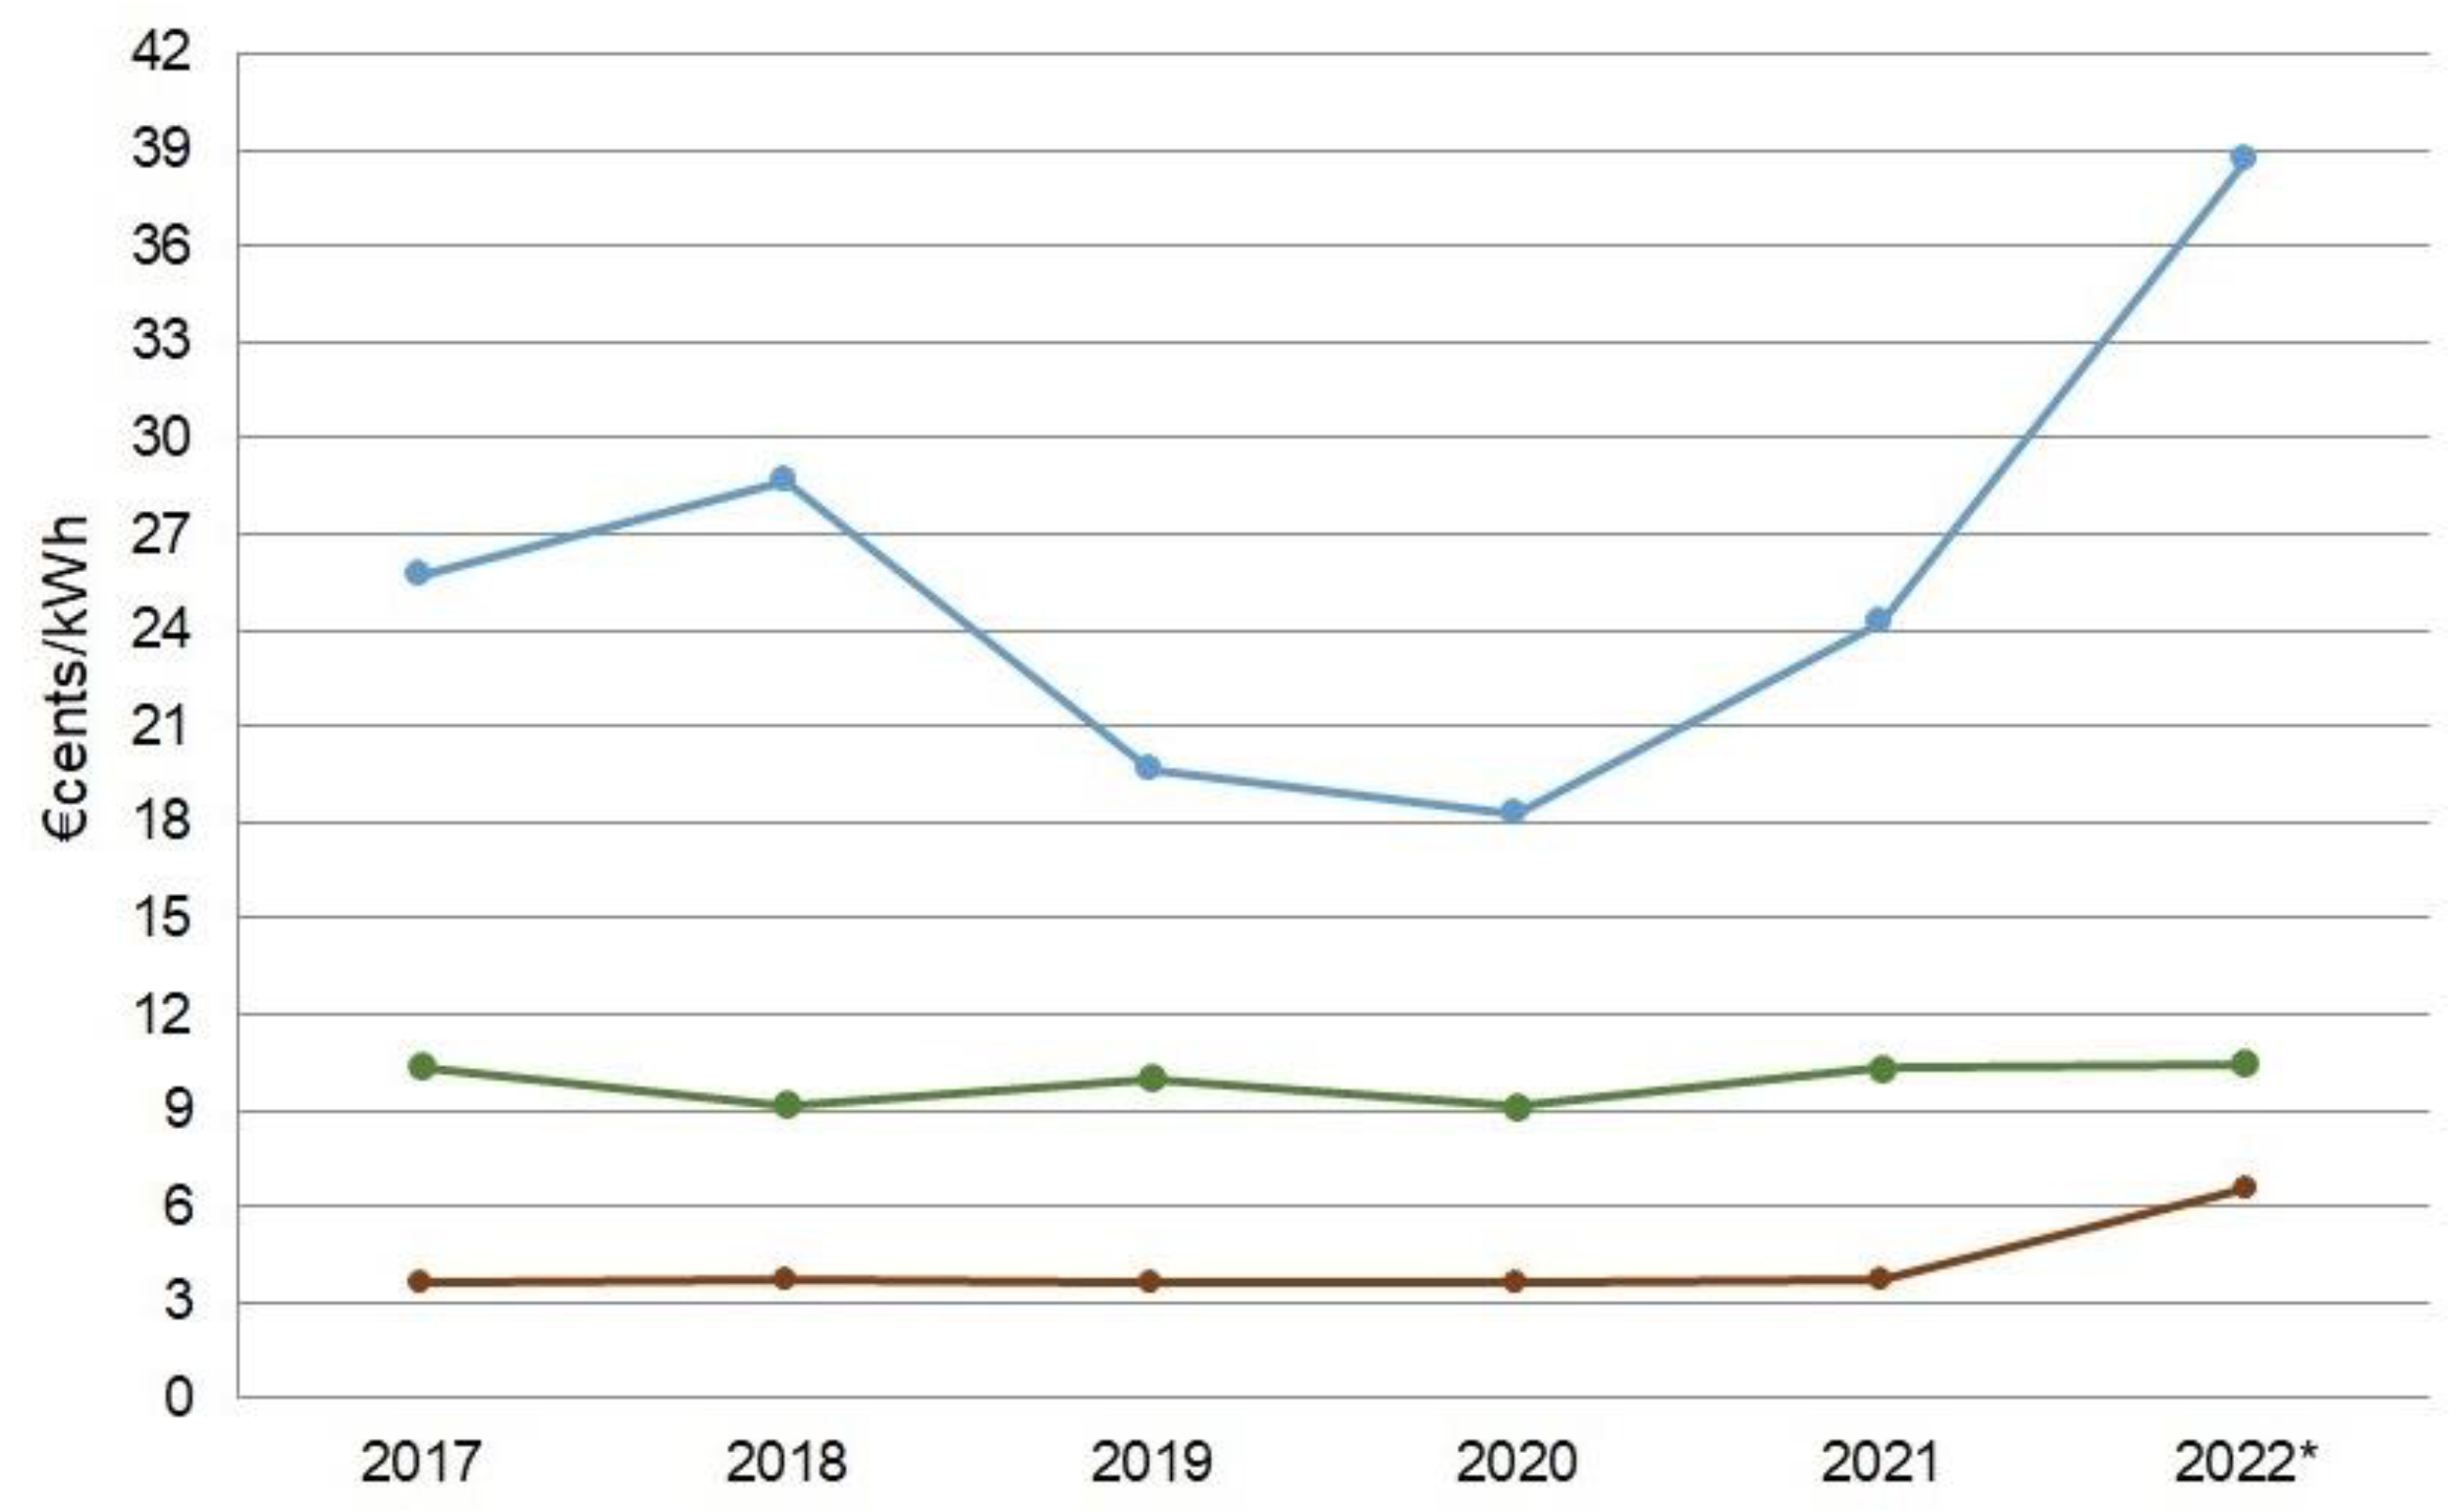
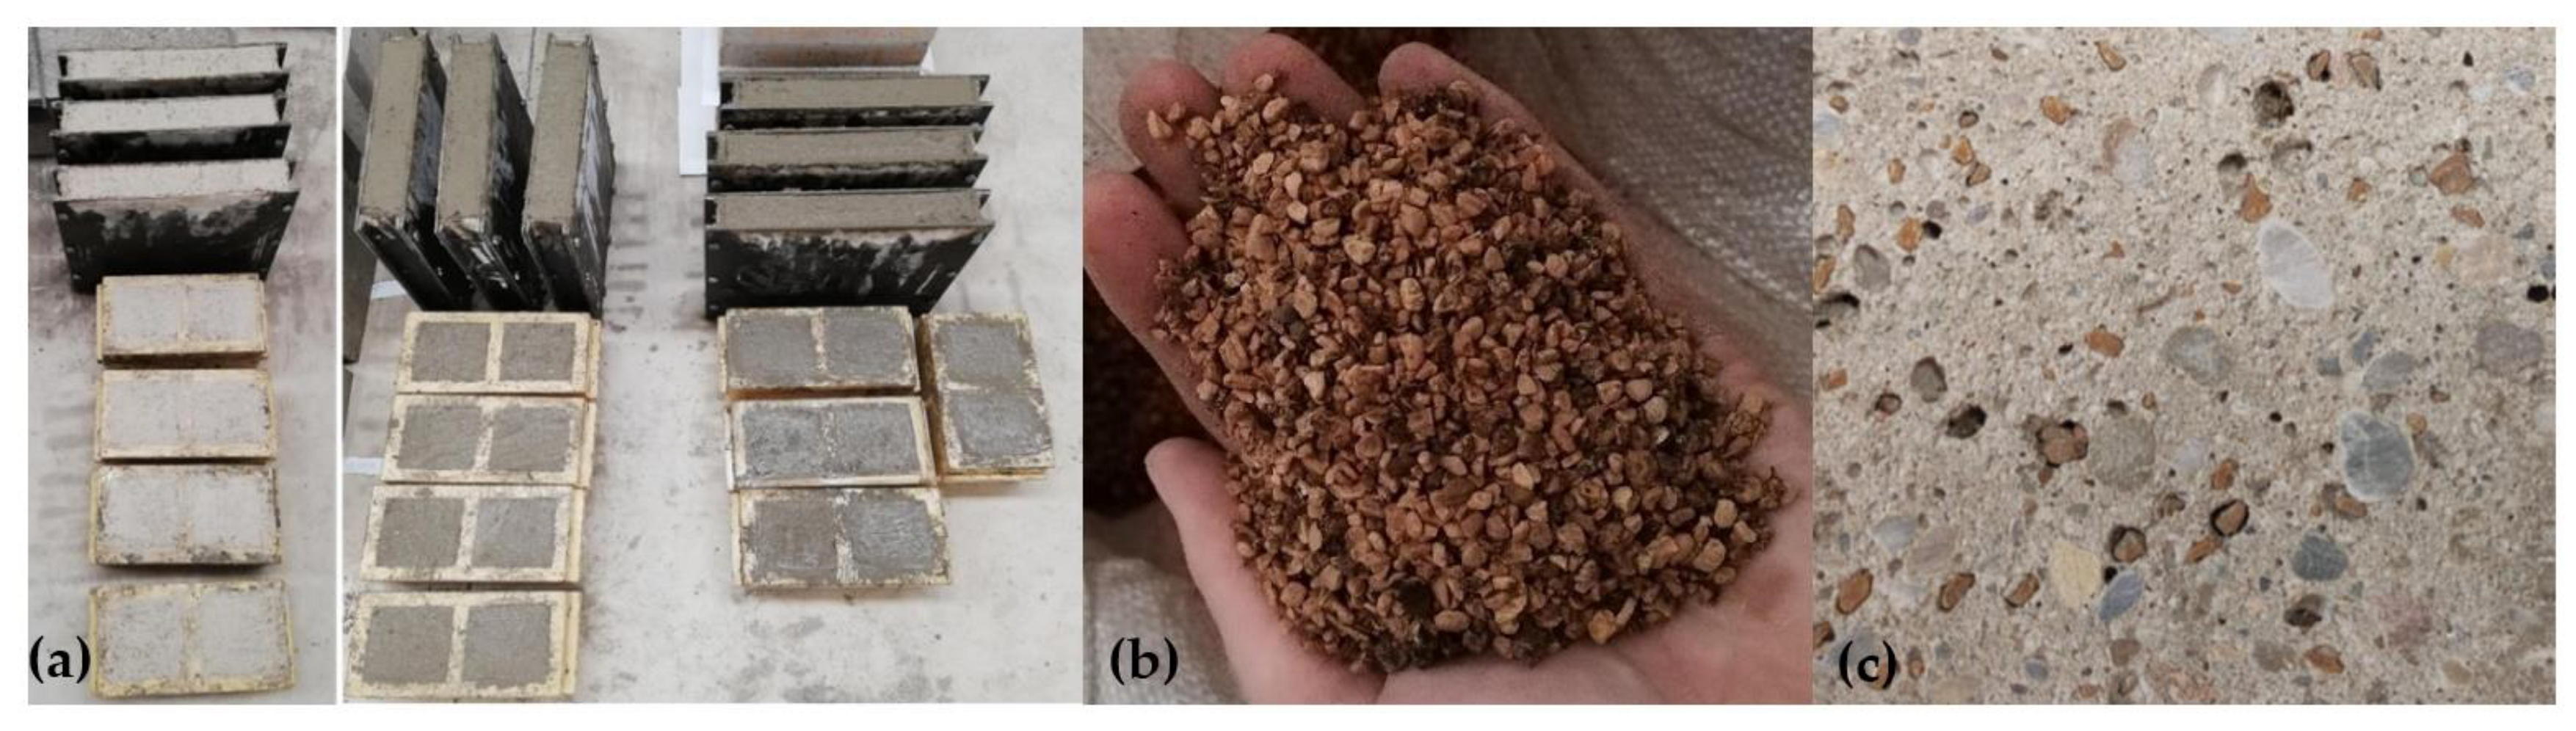

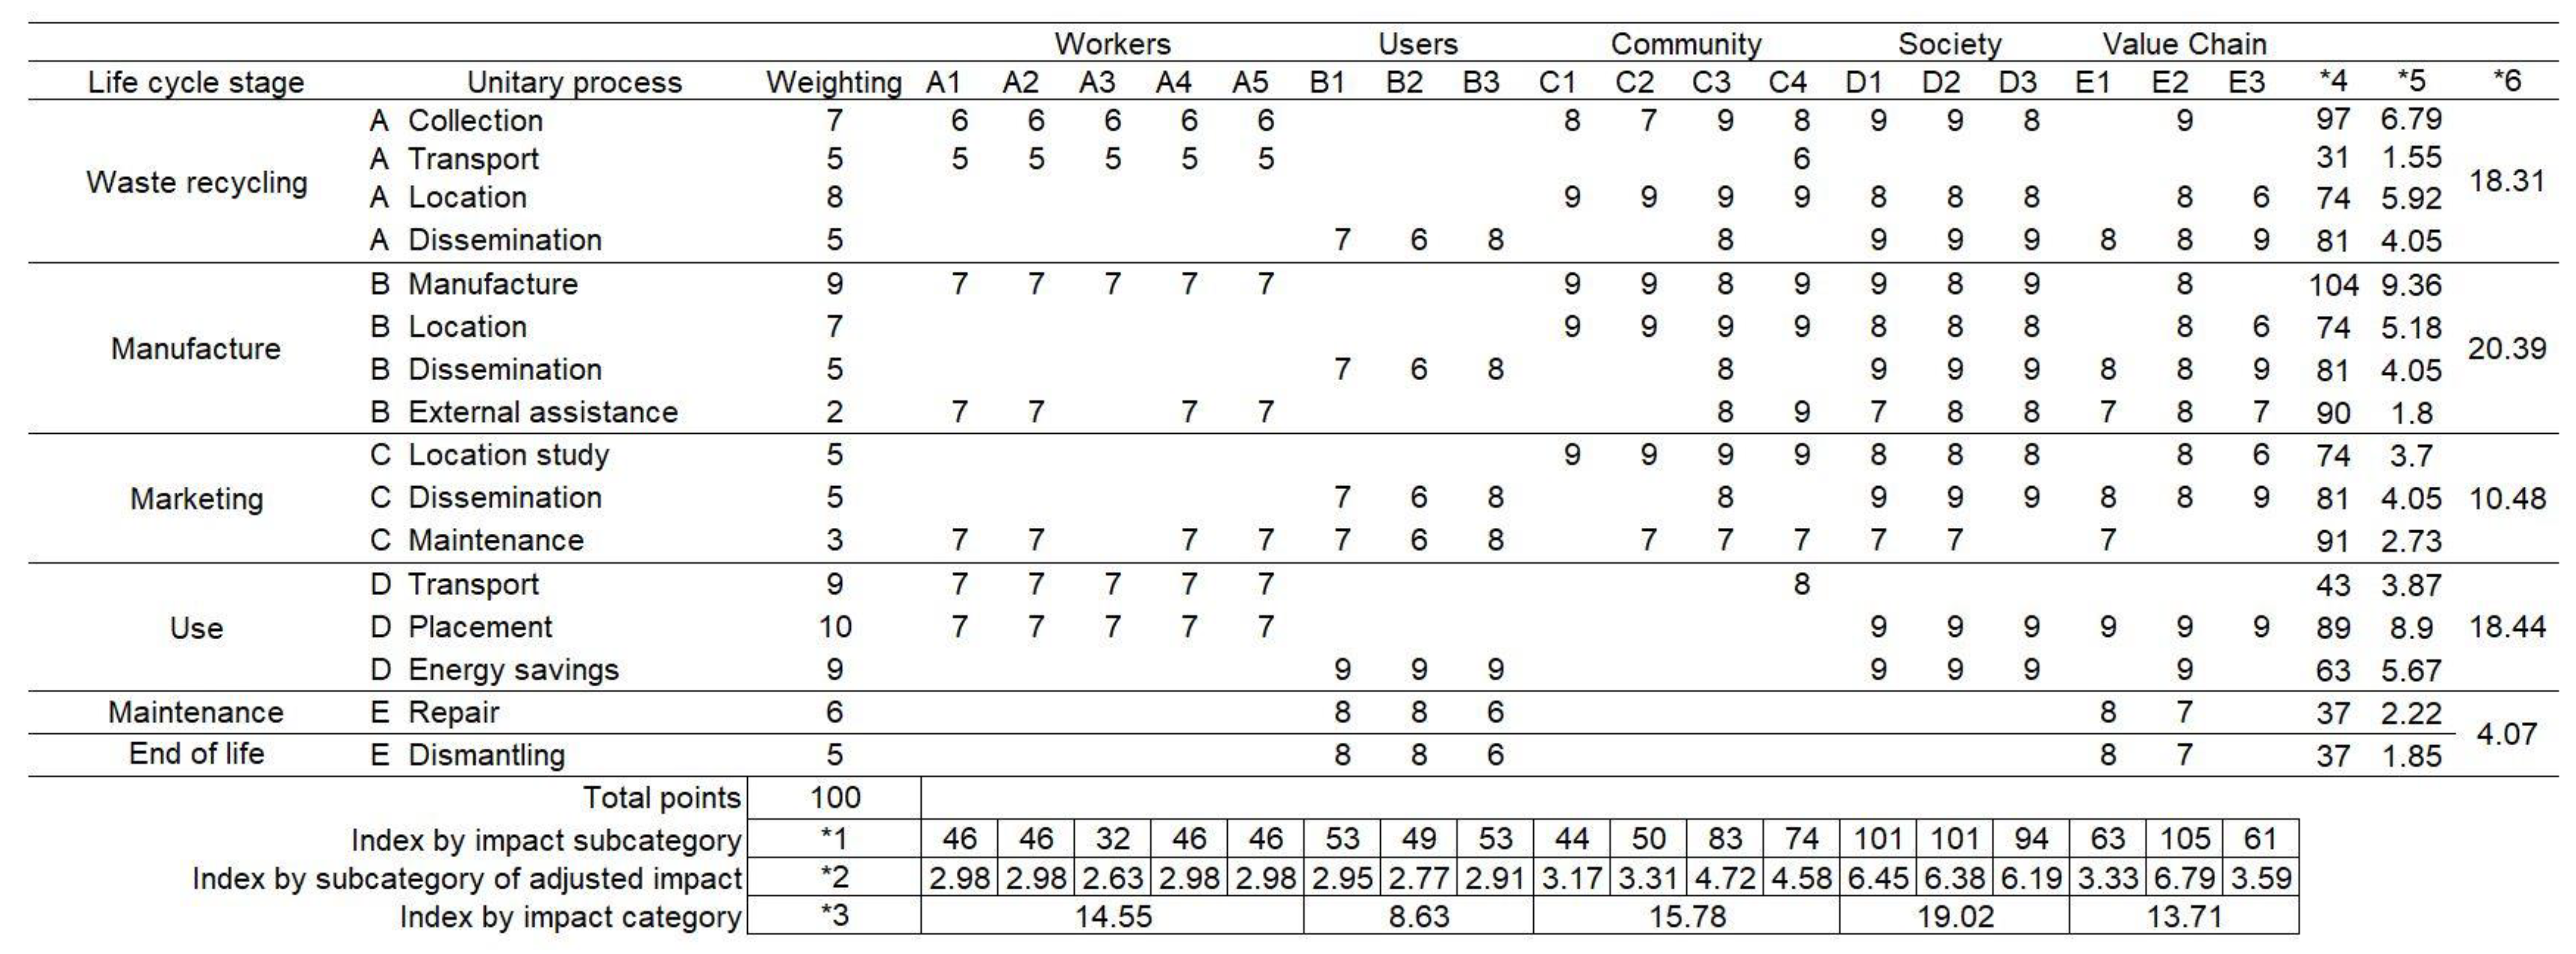
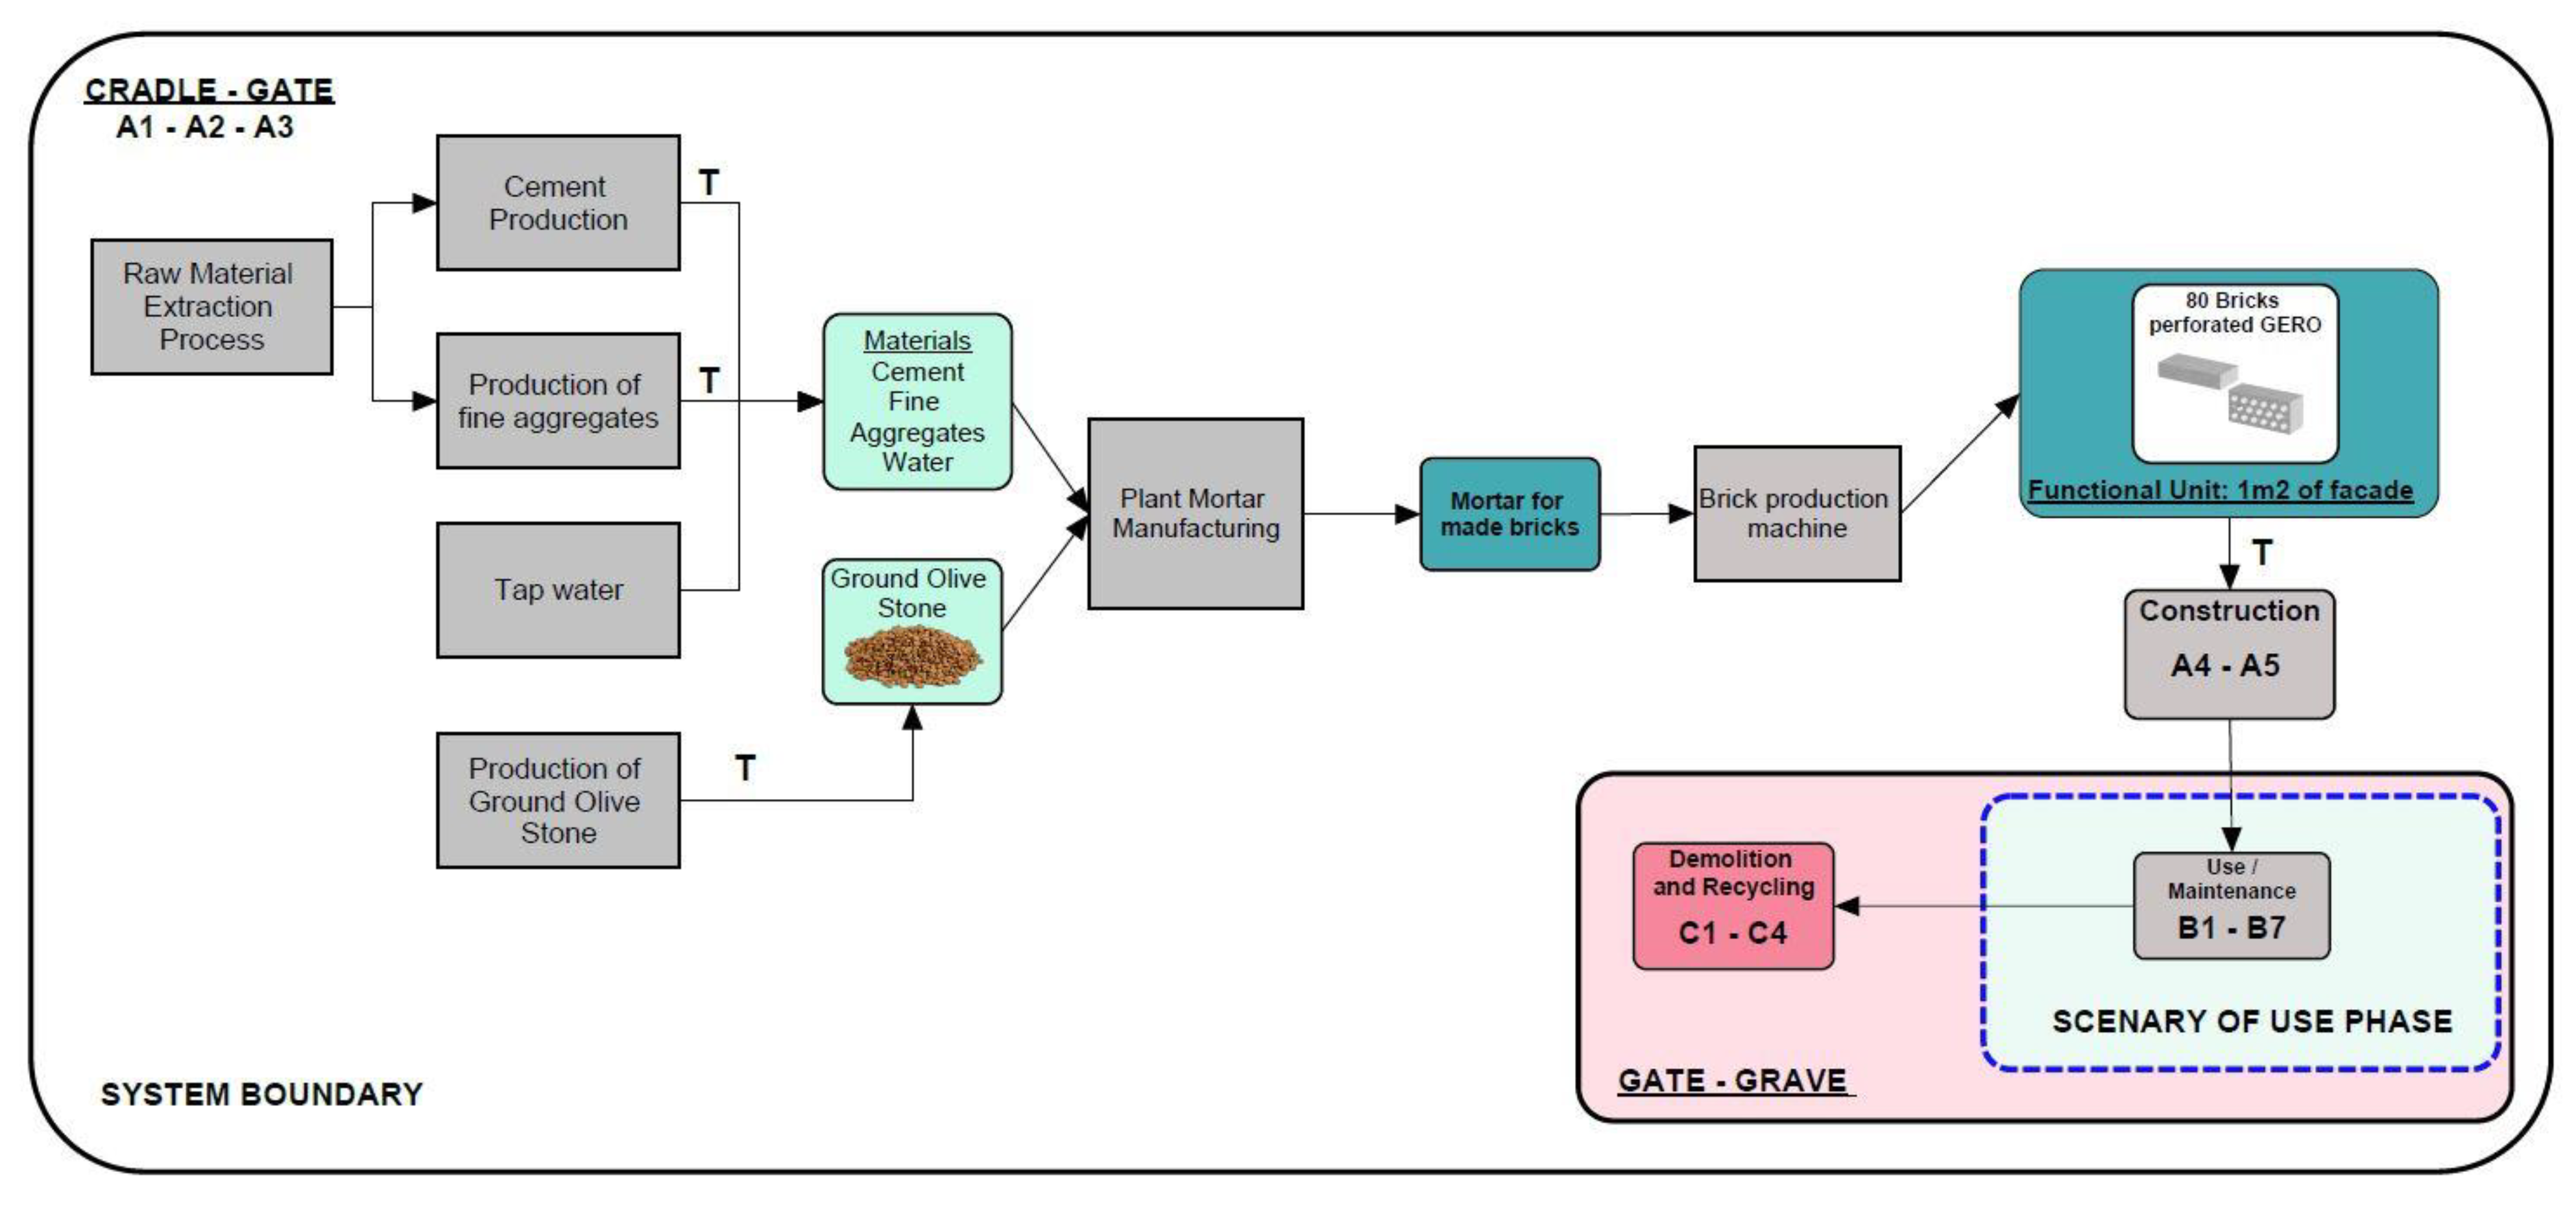
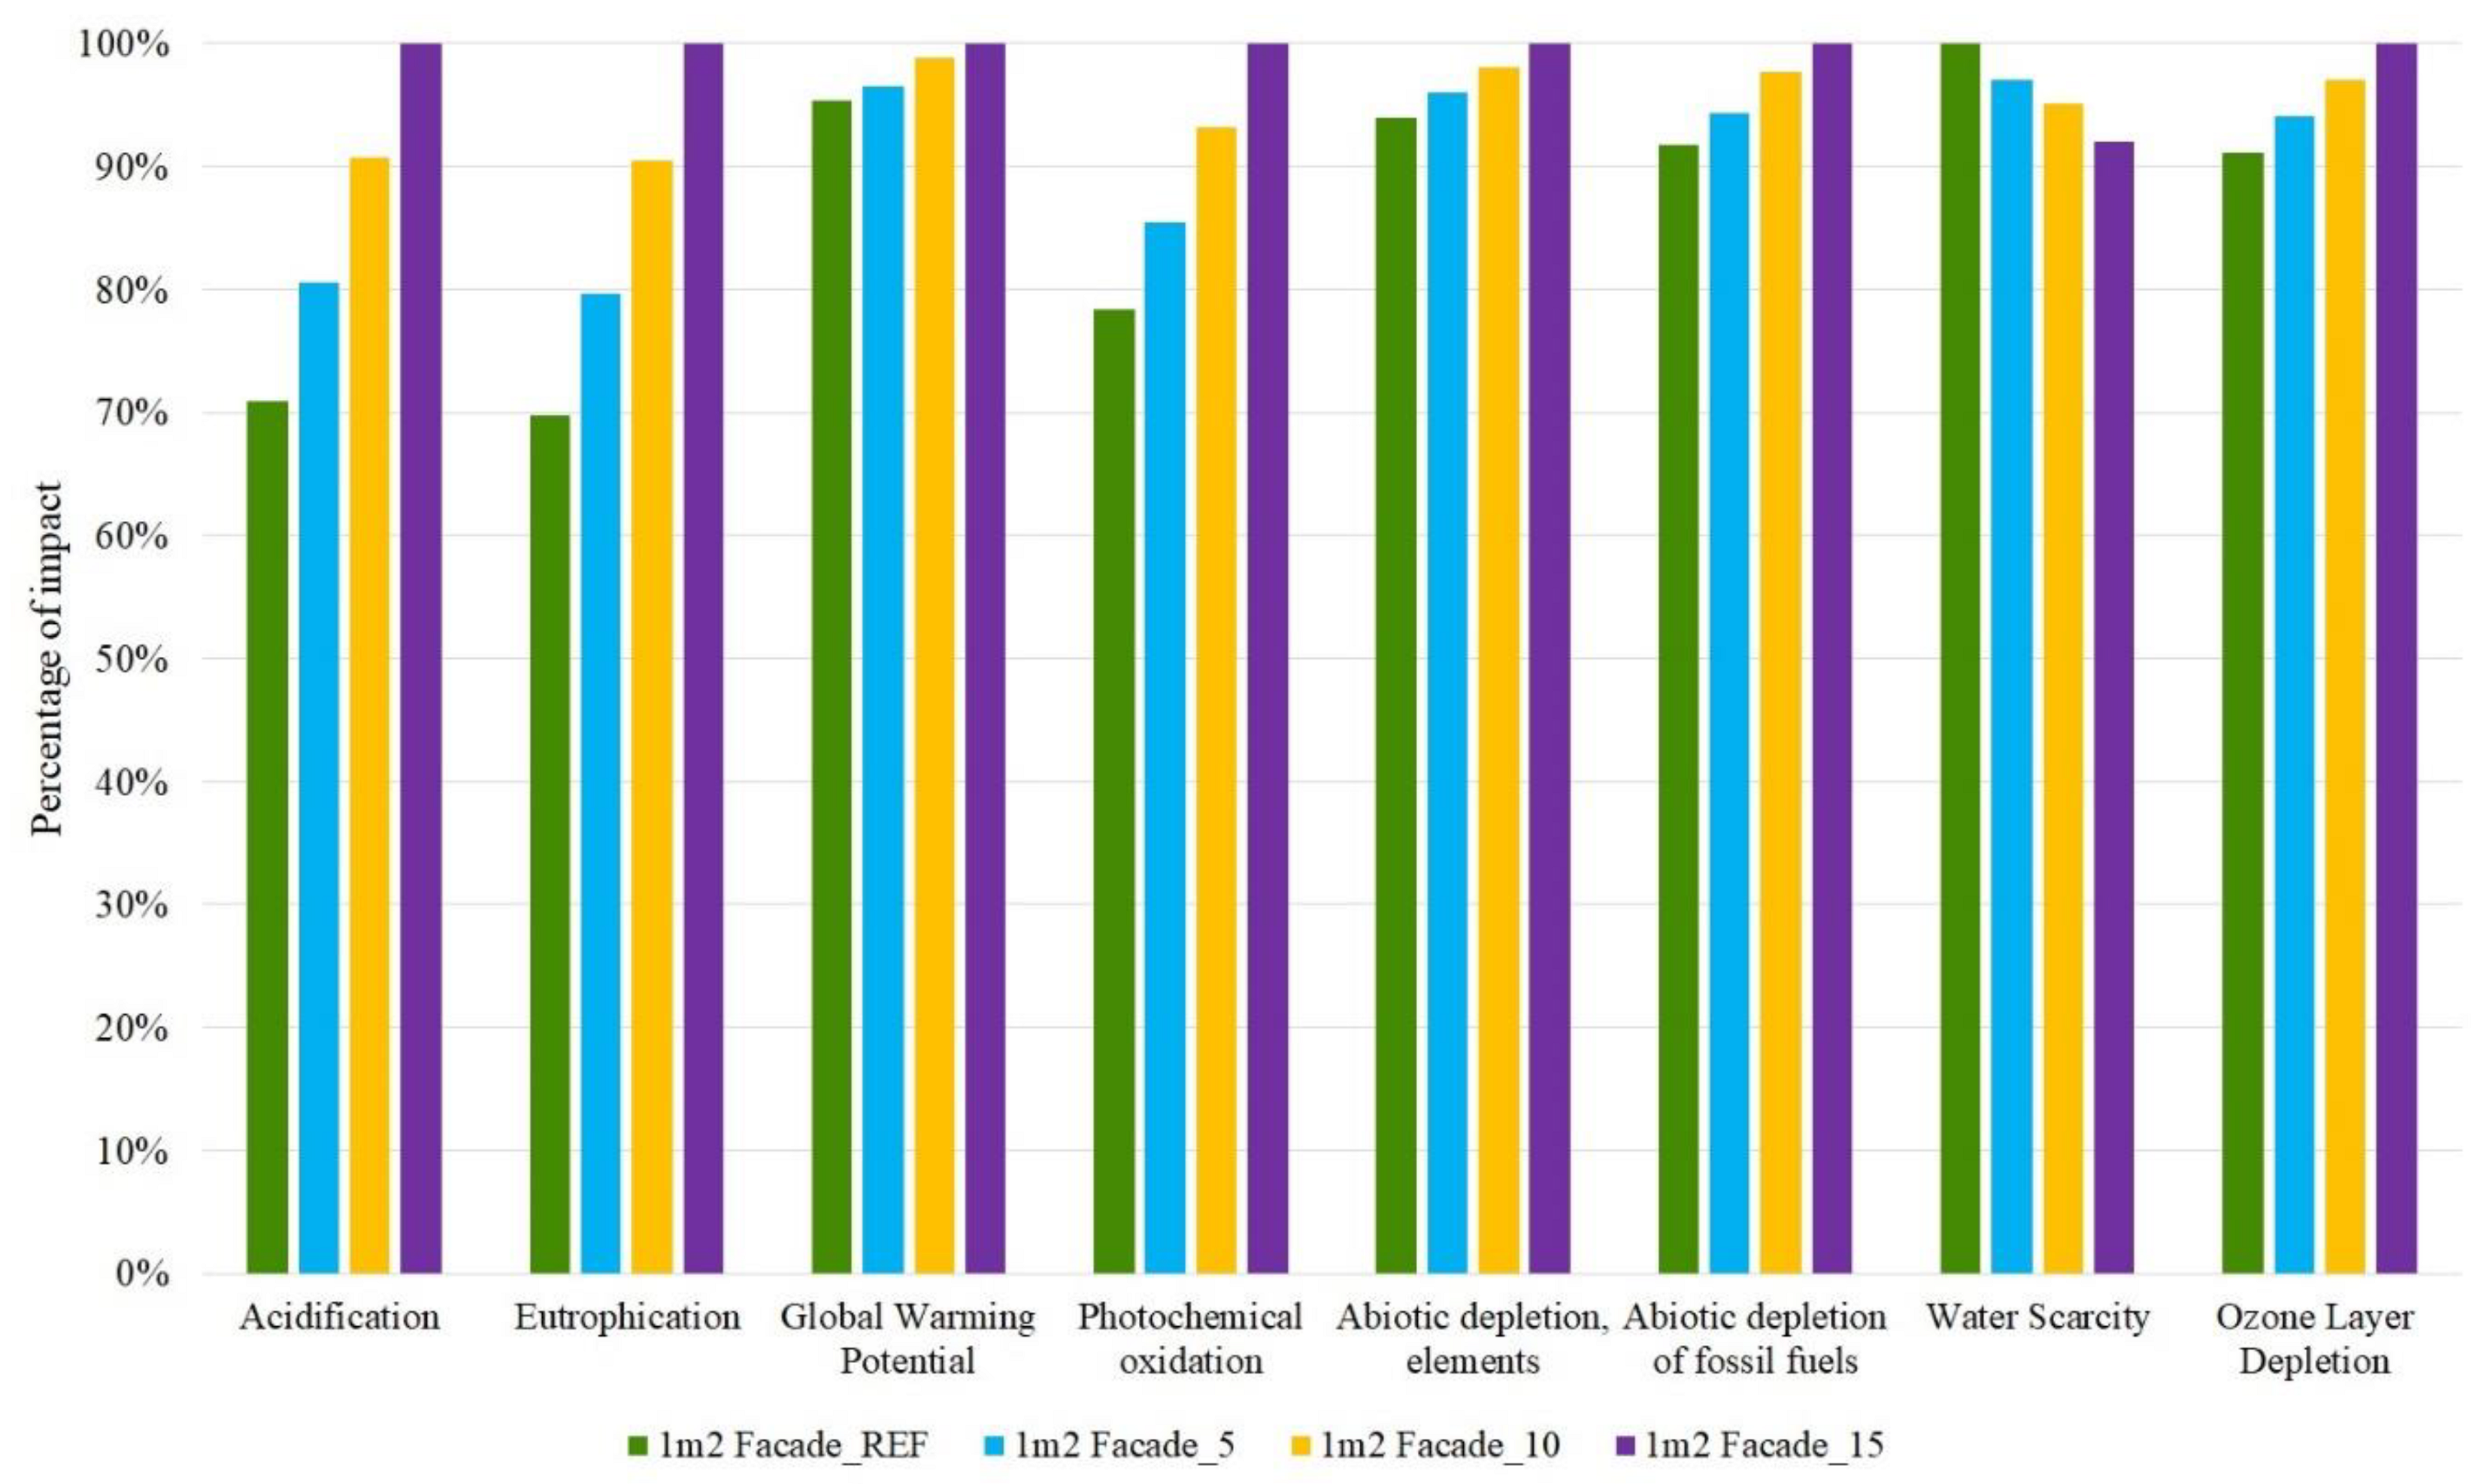
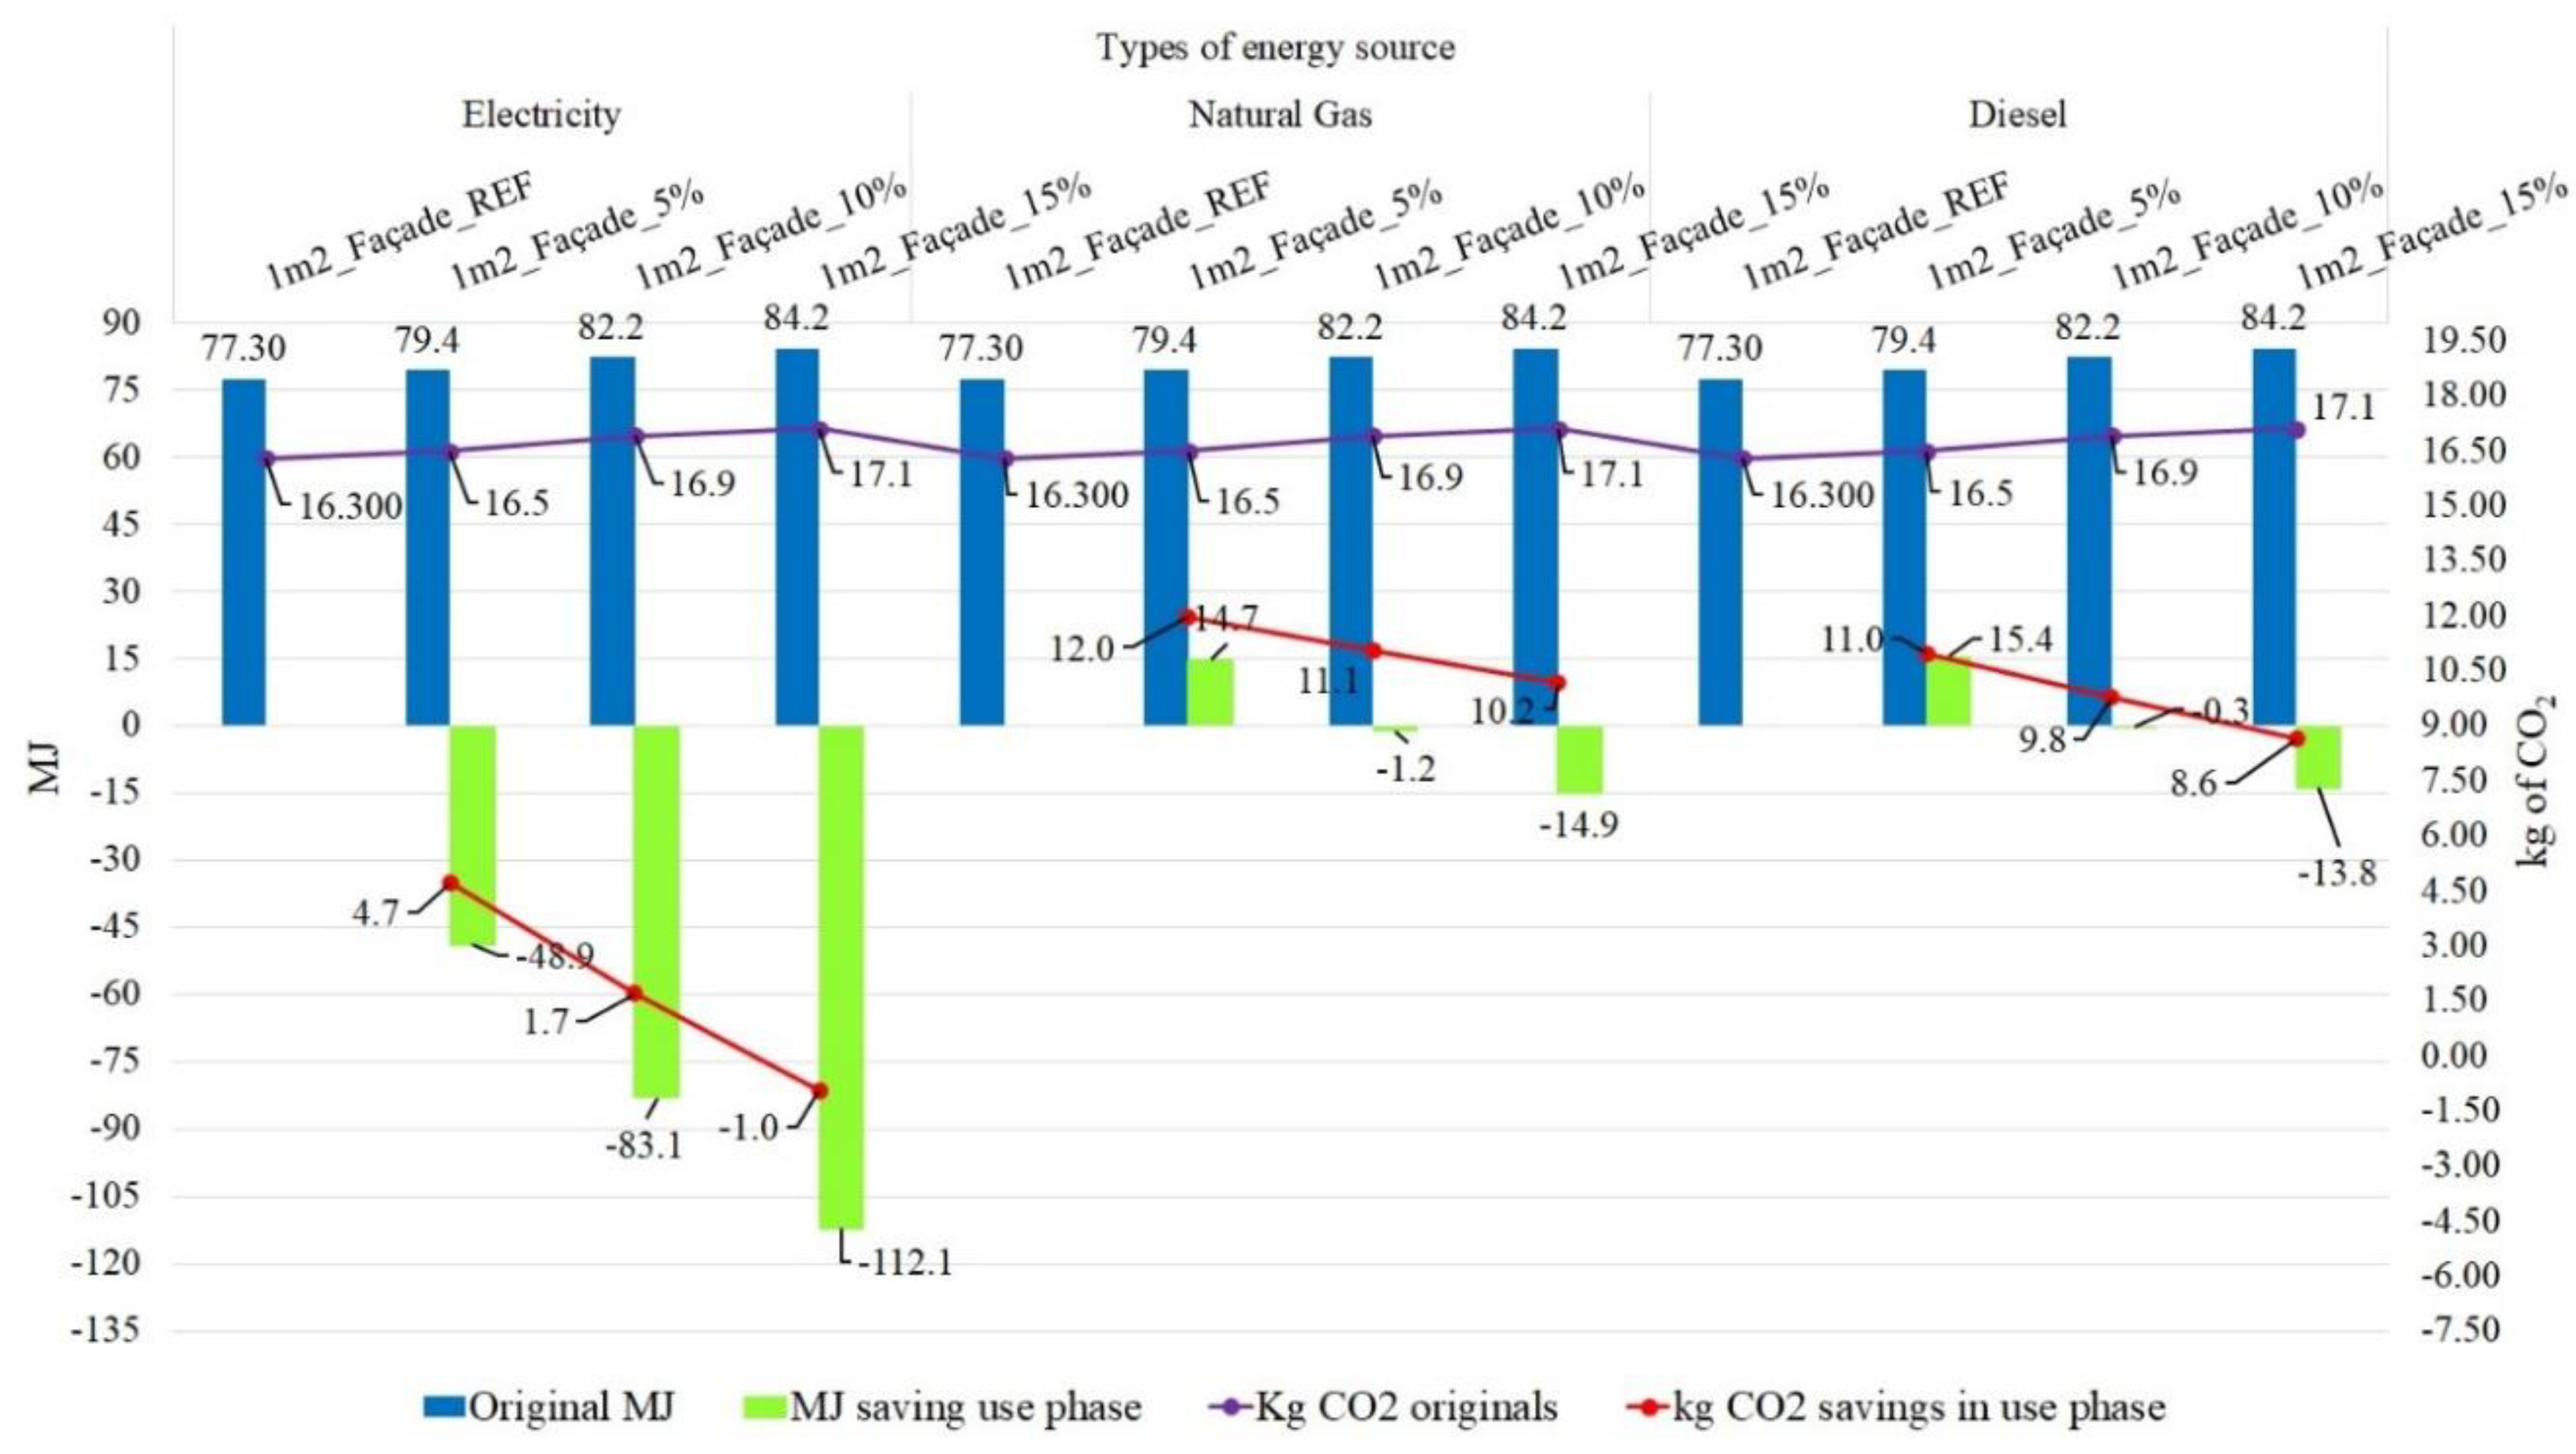
Disclaimer/Publisher’s Note: The statements, opinions and data contained in all publications are solely those of the individual author(s) and contributor(s) and not of MDPI and/or the editor(s). MDPI and/or the editor(s) disclaim responsibility for any injury to people or property resulting from any ideas, methods, instructions or products referred to in the content. |
© 2024 by the authors. Licensee MDPI, Basel, Switzerland. This article is an open access article distributed under the terms and conditions of the Creative Commons Attribution (CC BY) license (https://creativecommons.org/licenses/by/4.0/).