
Adaptation and Validation of Injection Rate Predictive Model for Solenoid Type Injectors with Different Nozzle Geometry

 ,
,  ,
,  and
and 
Abstract
1. Introduction
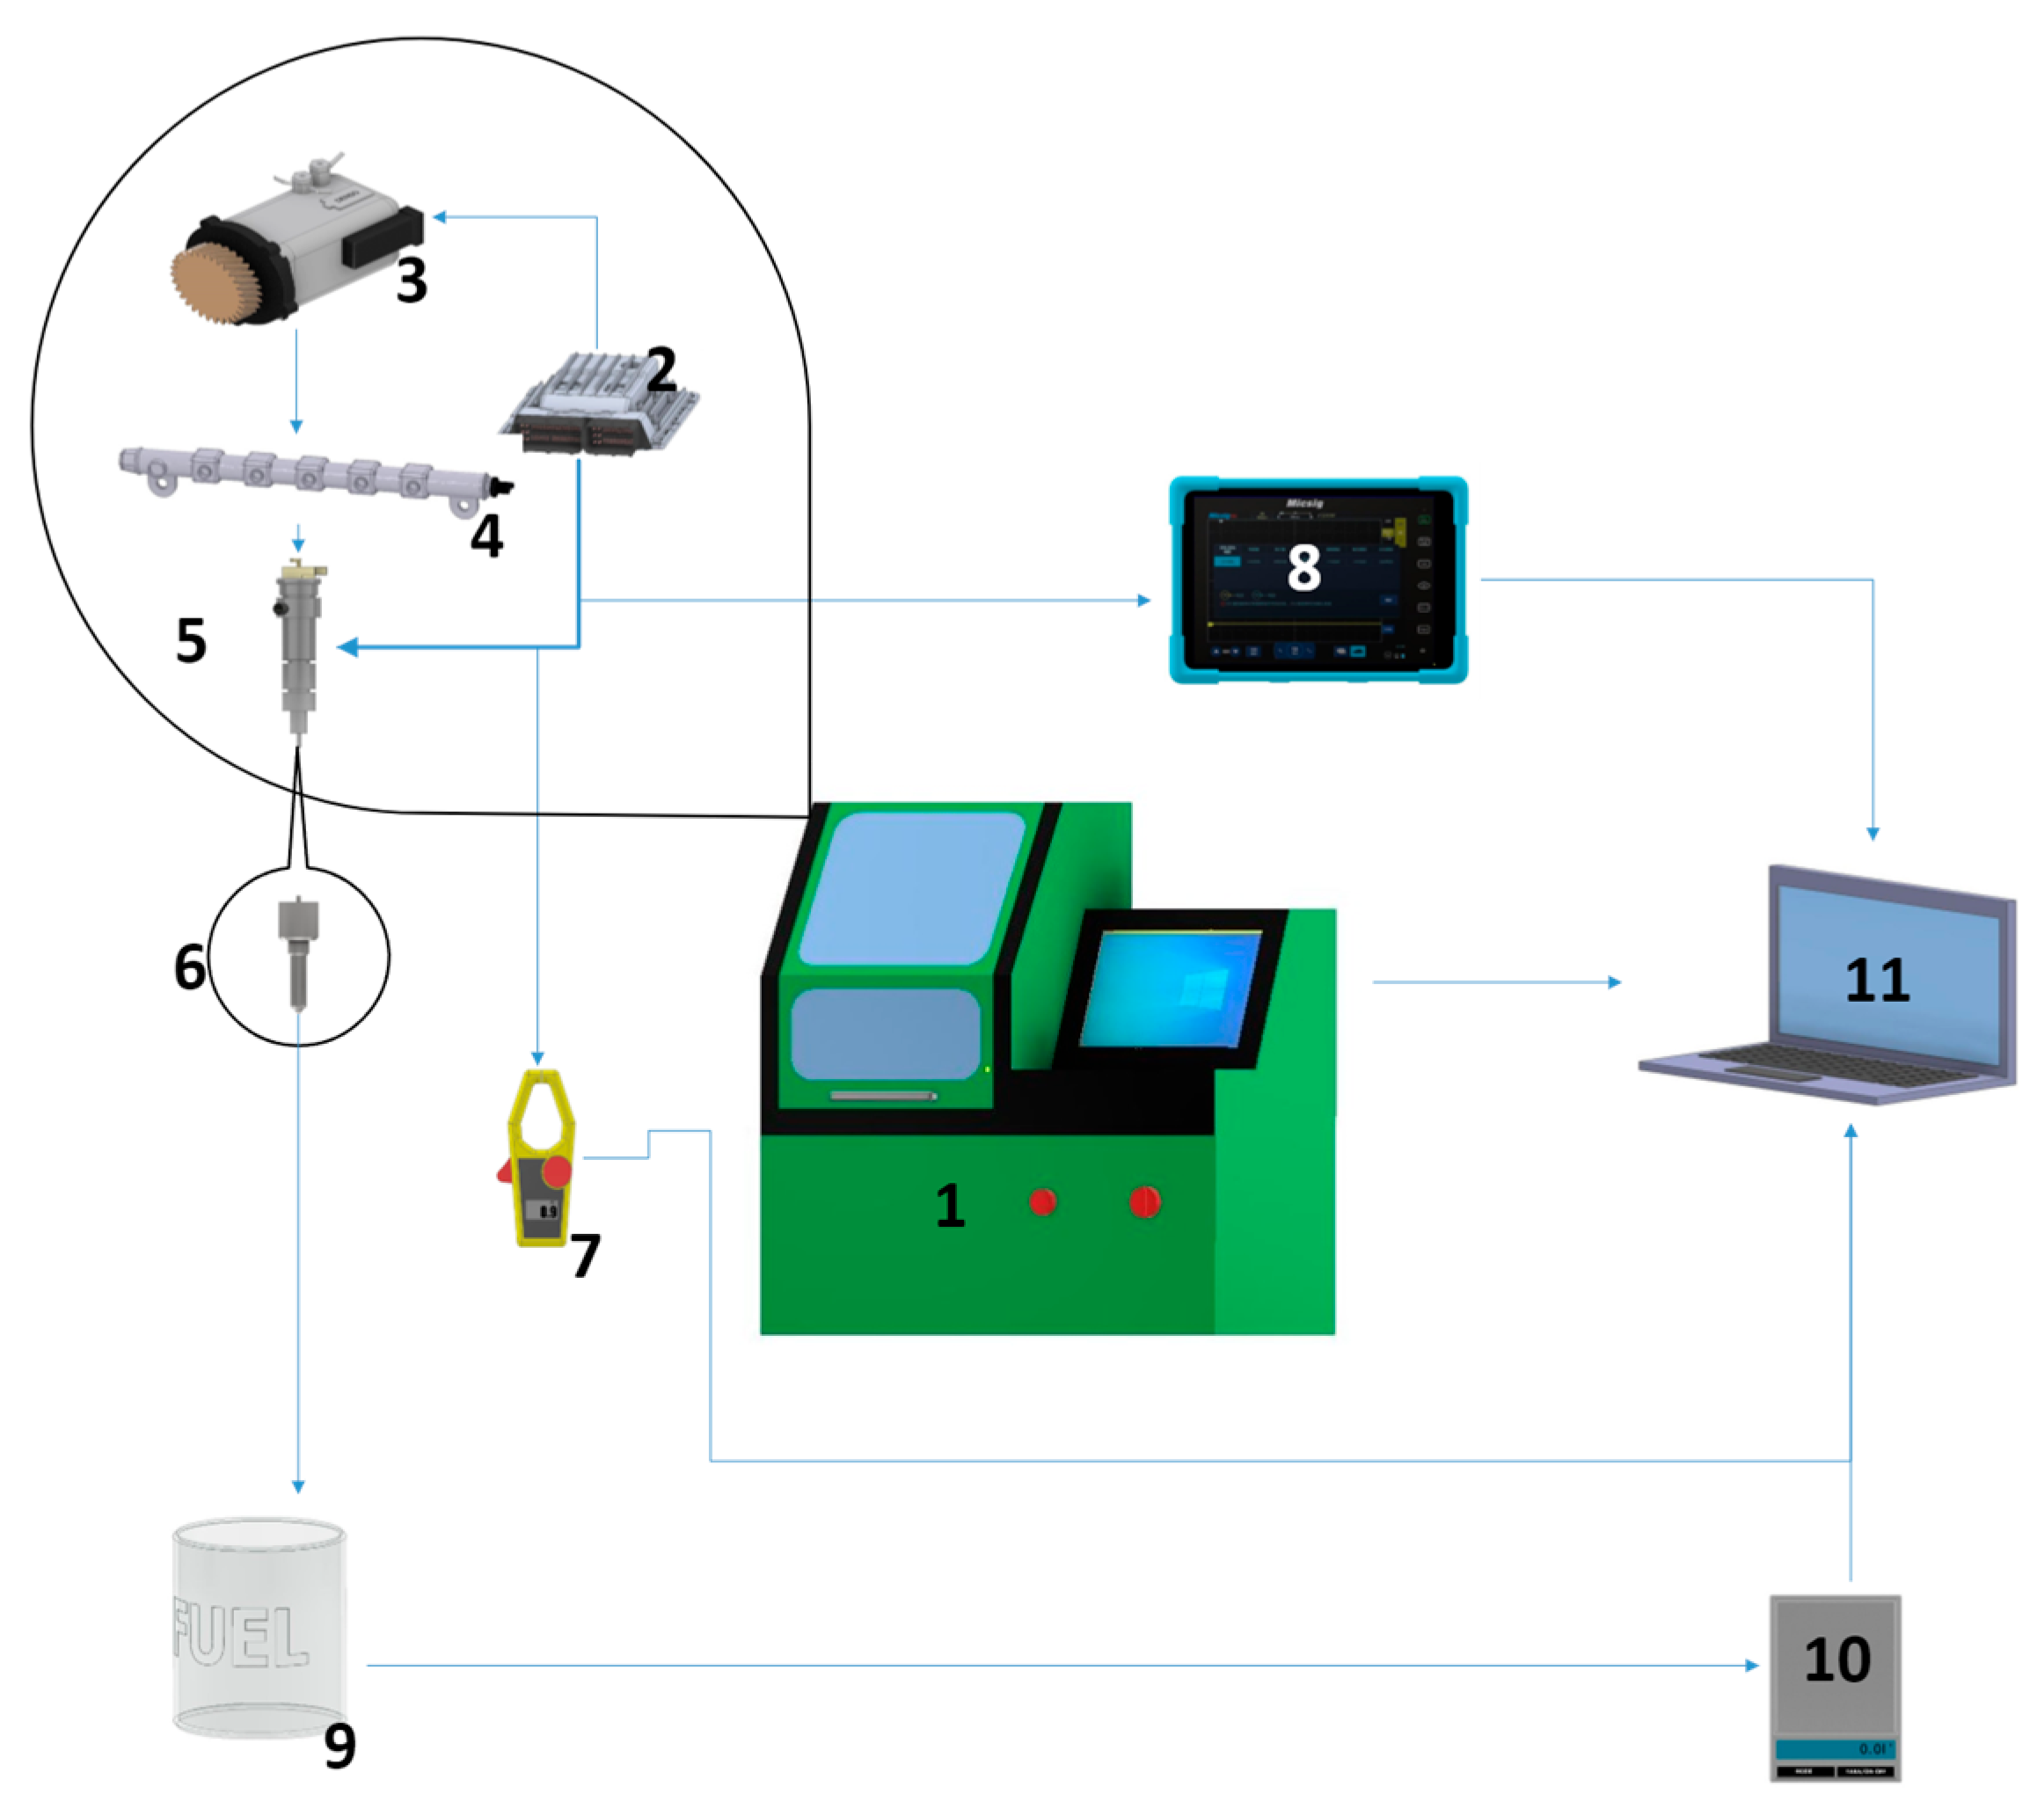
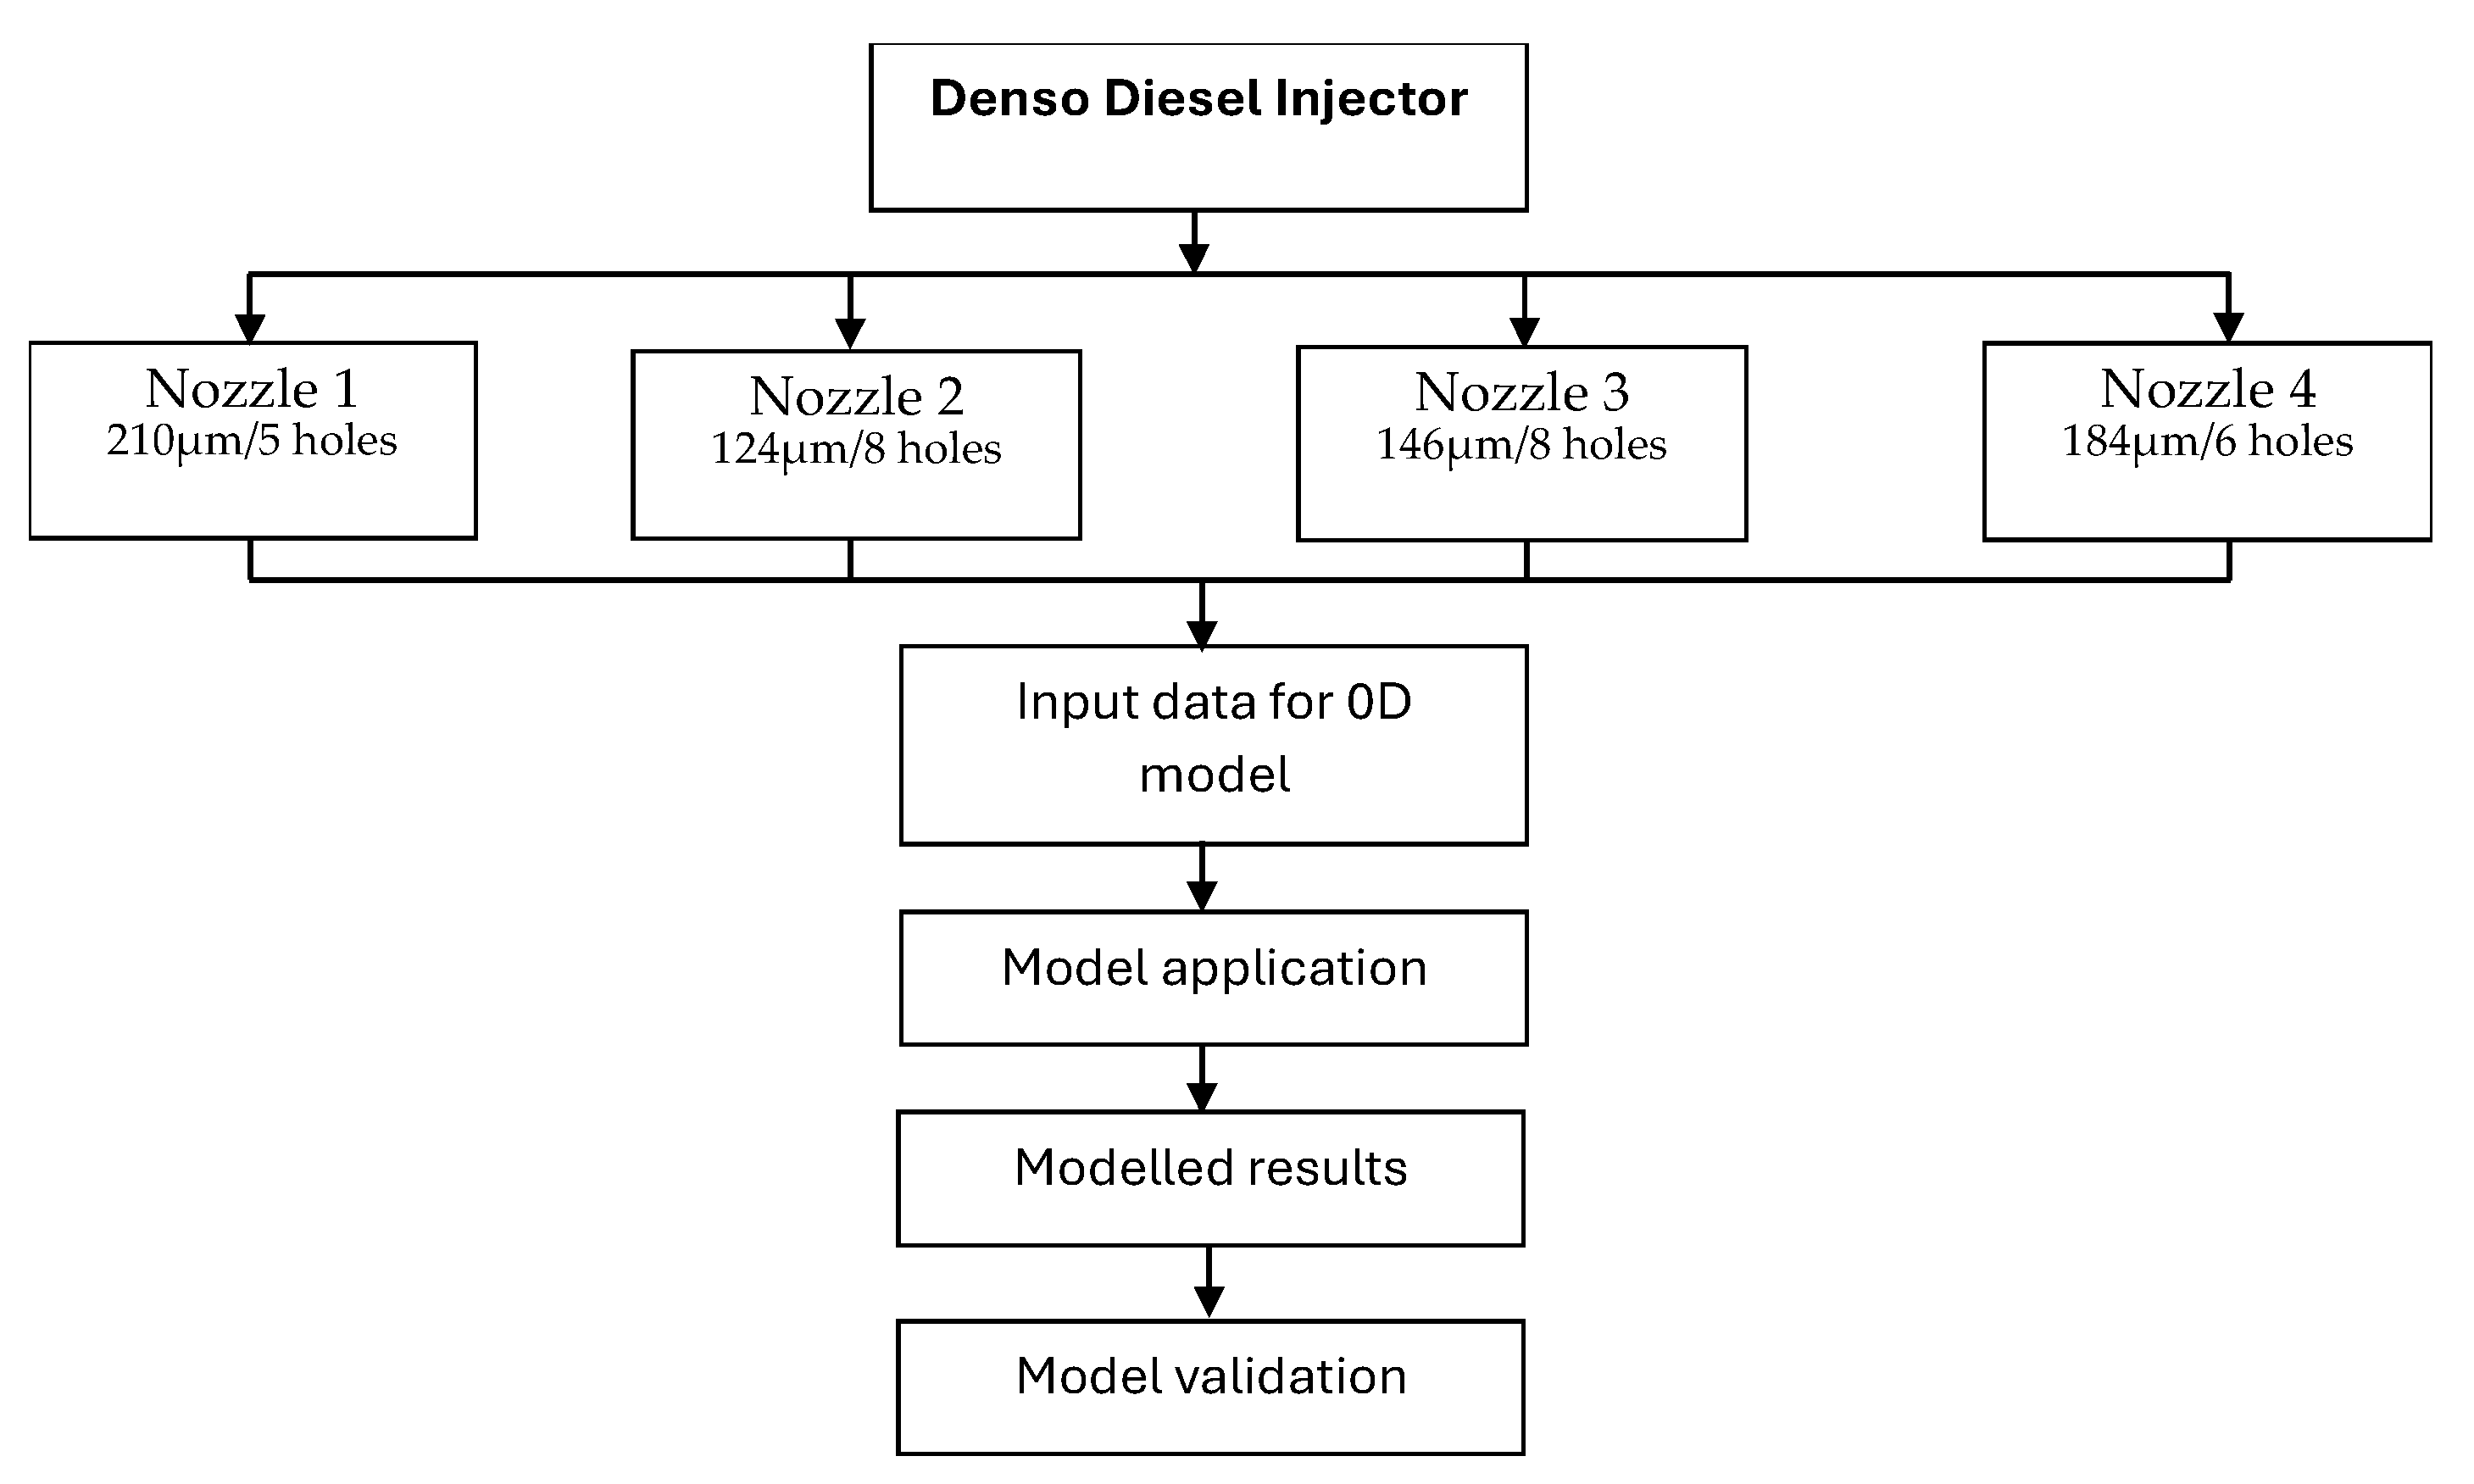
2. Materials and Methods
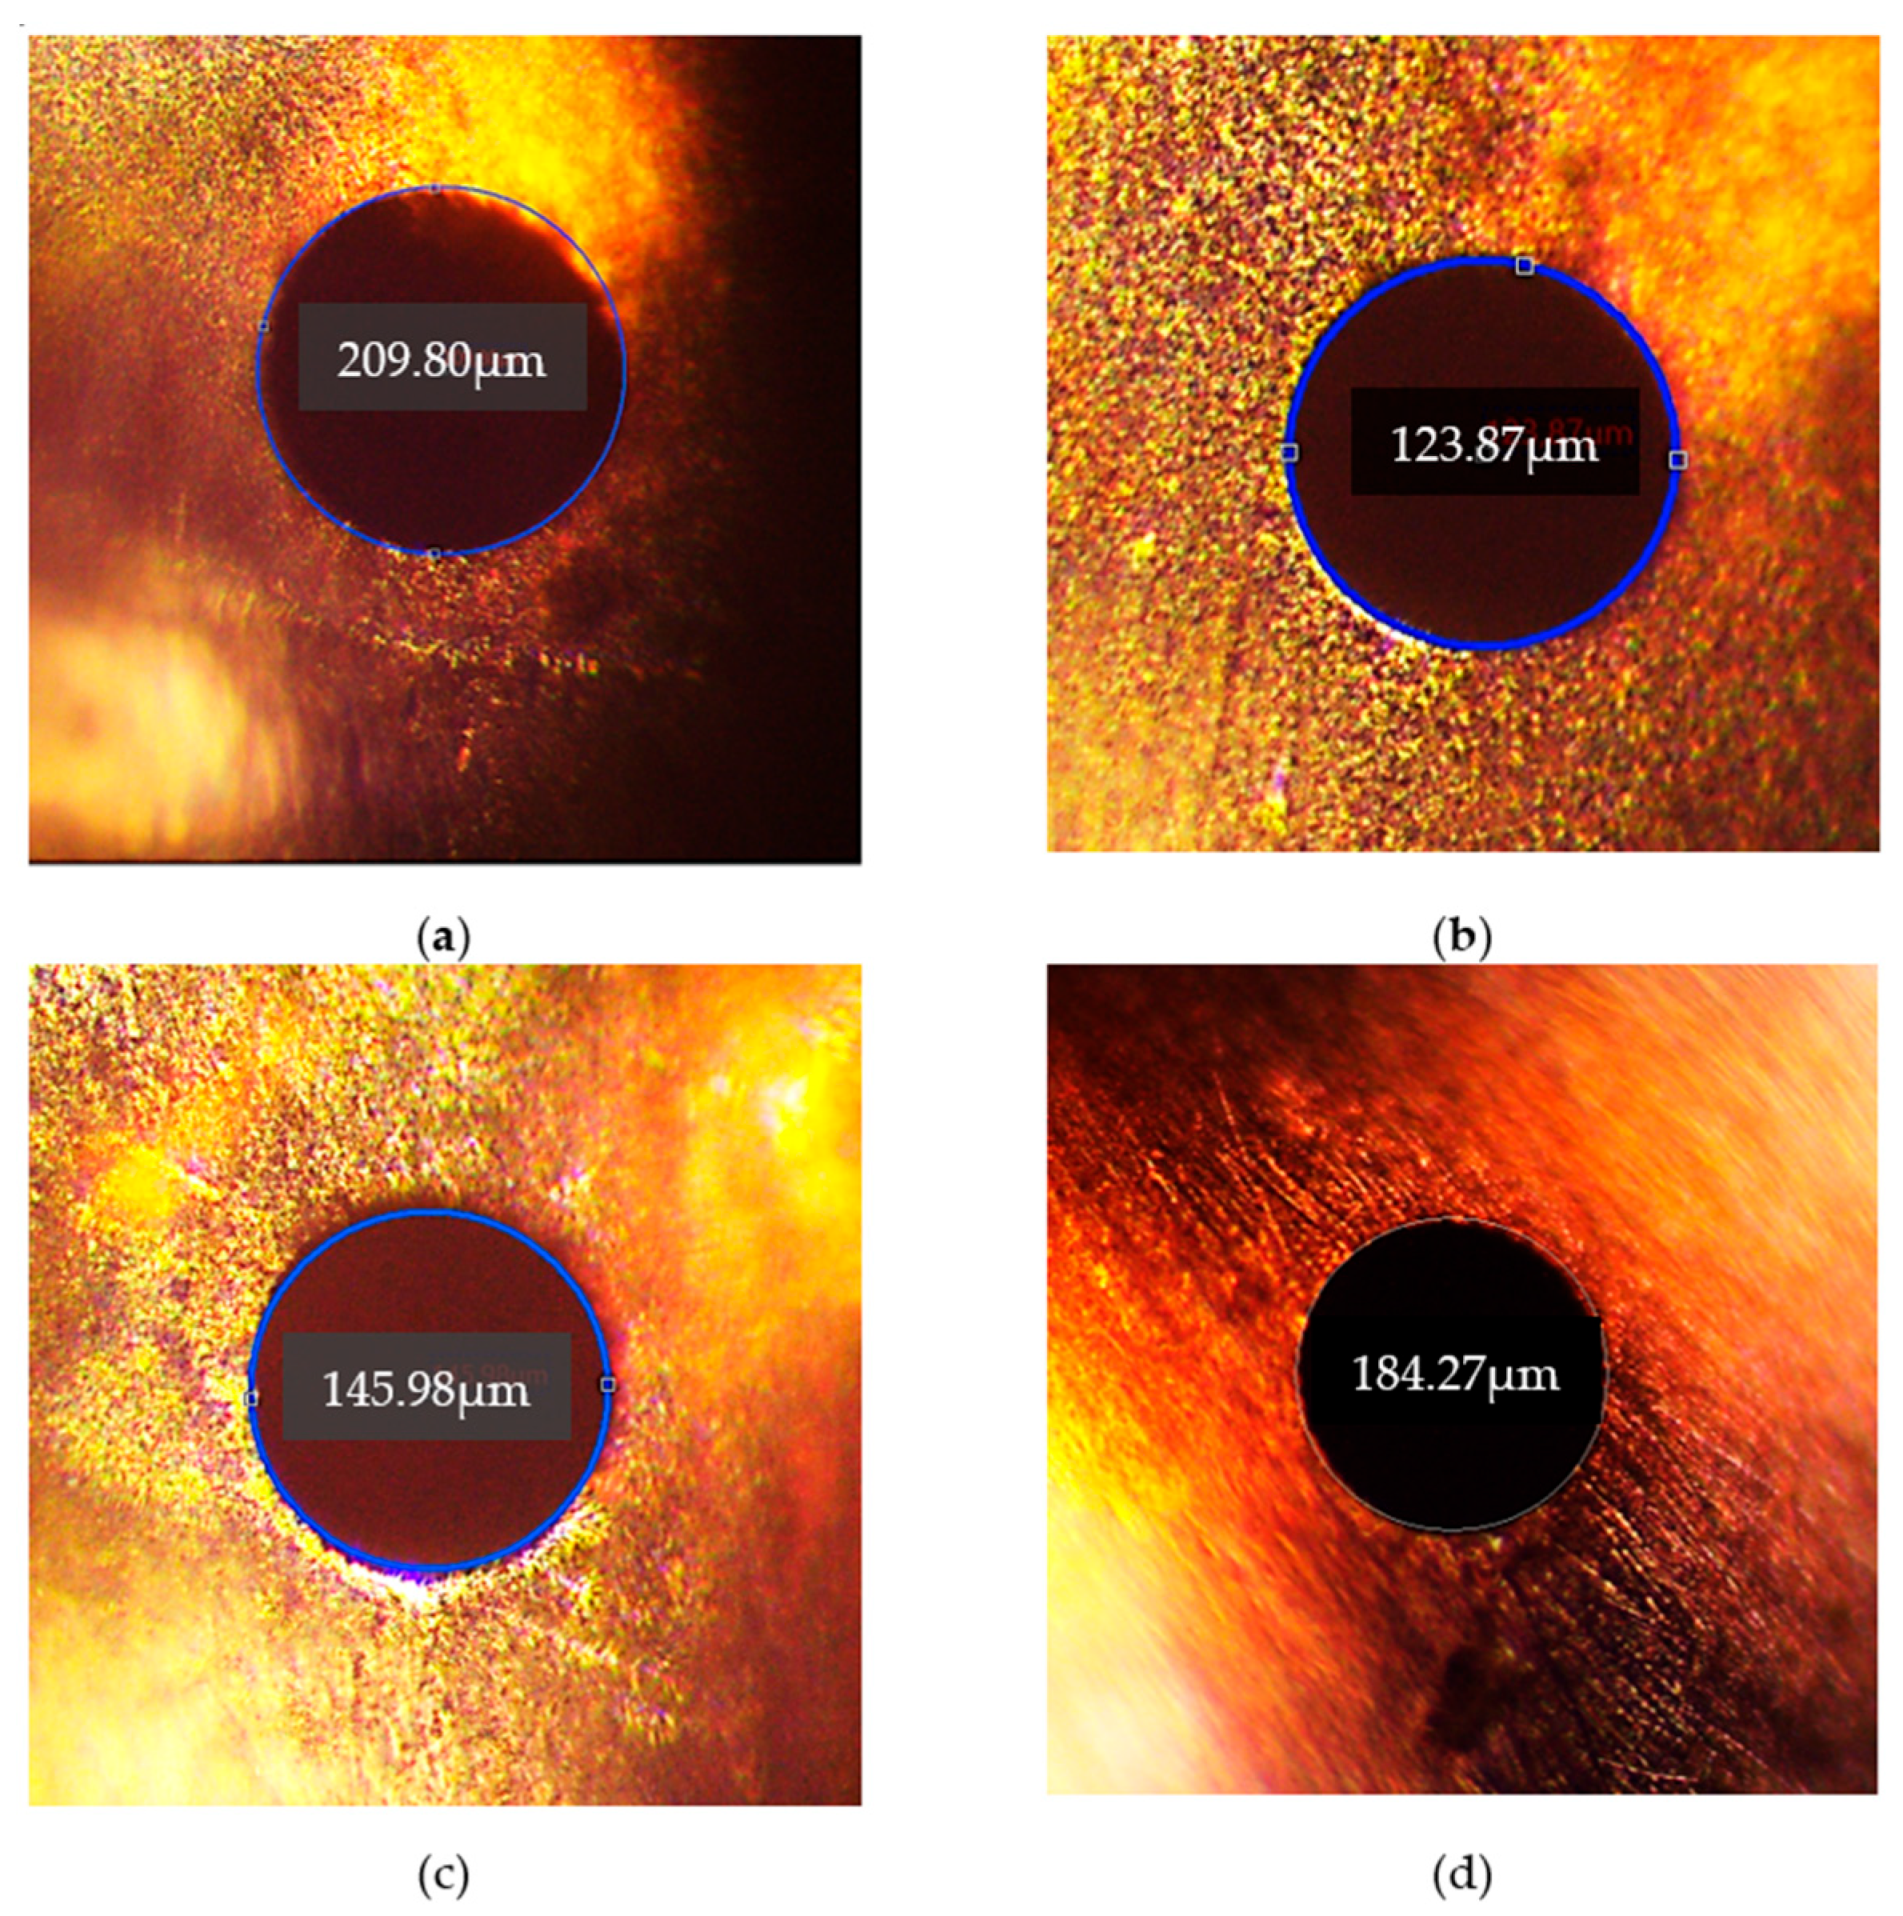
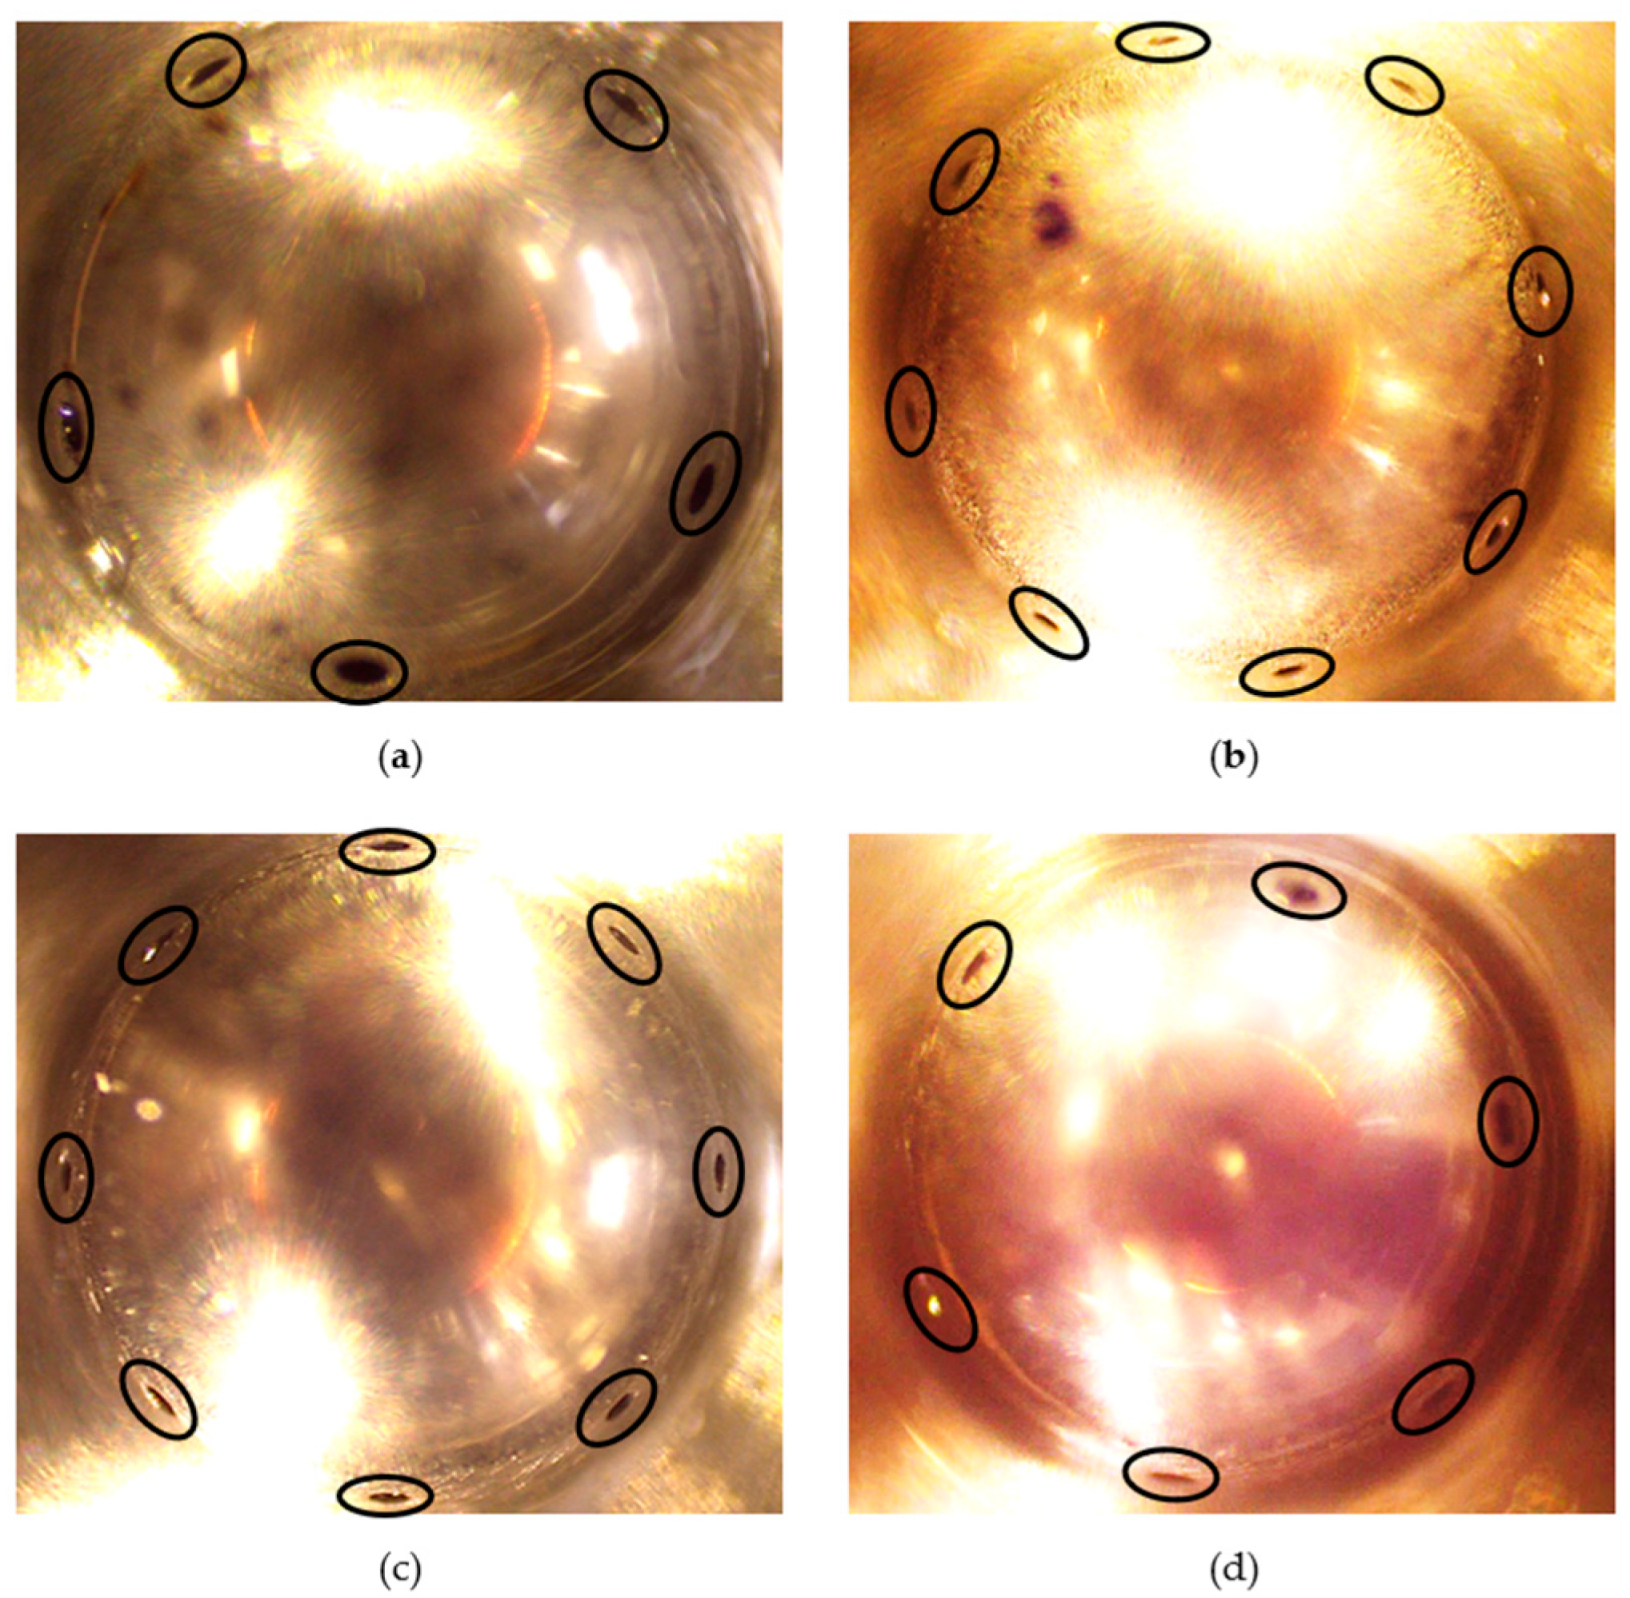
2.1. Materials
2.2. Methodology
2.3. Data Processing
3. Results
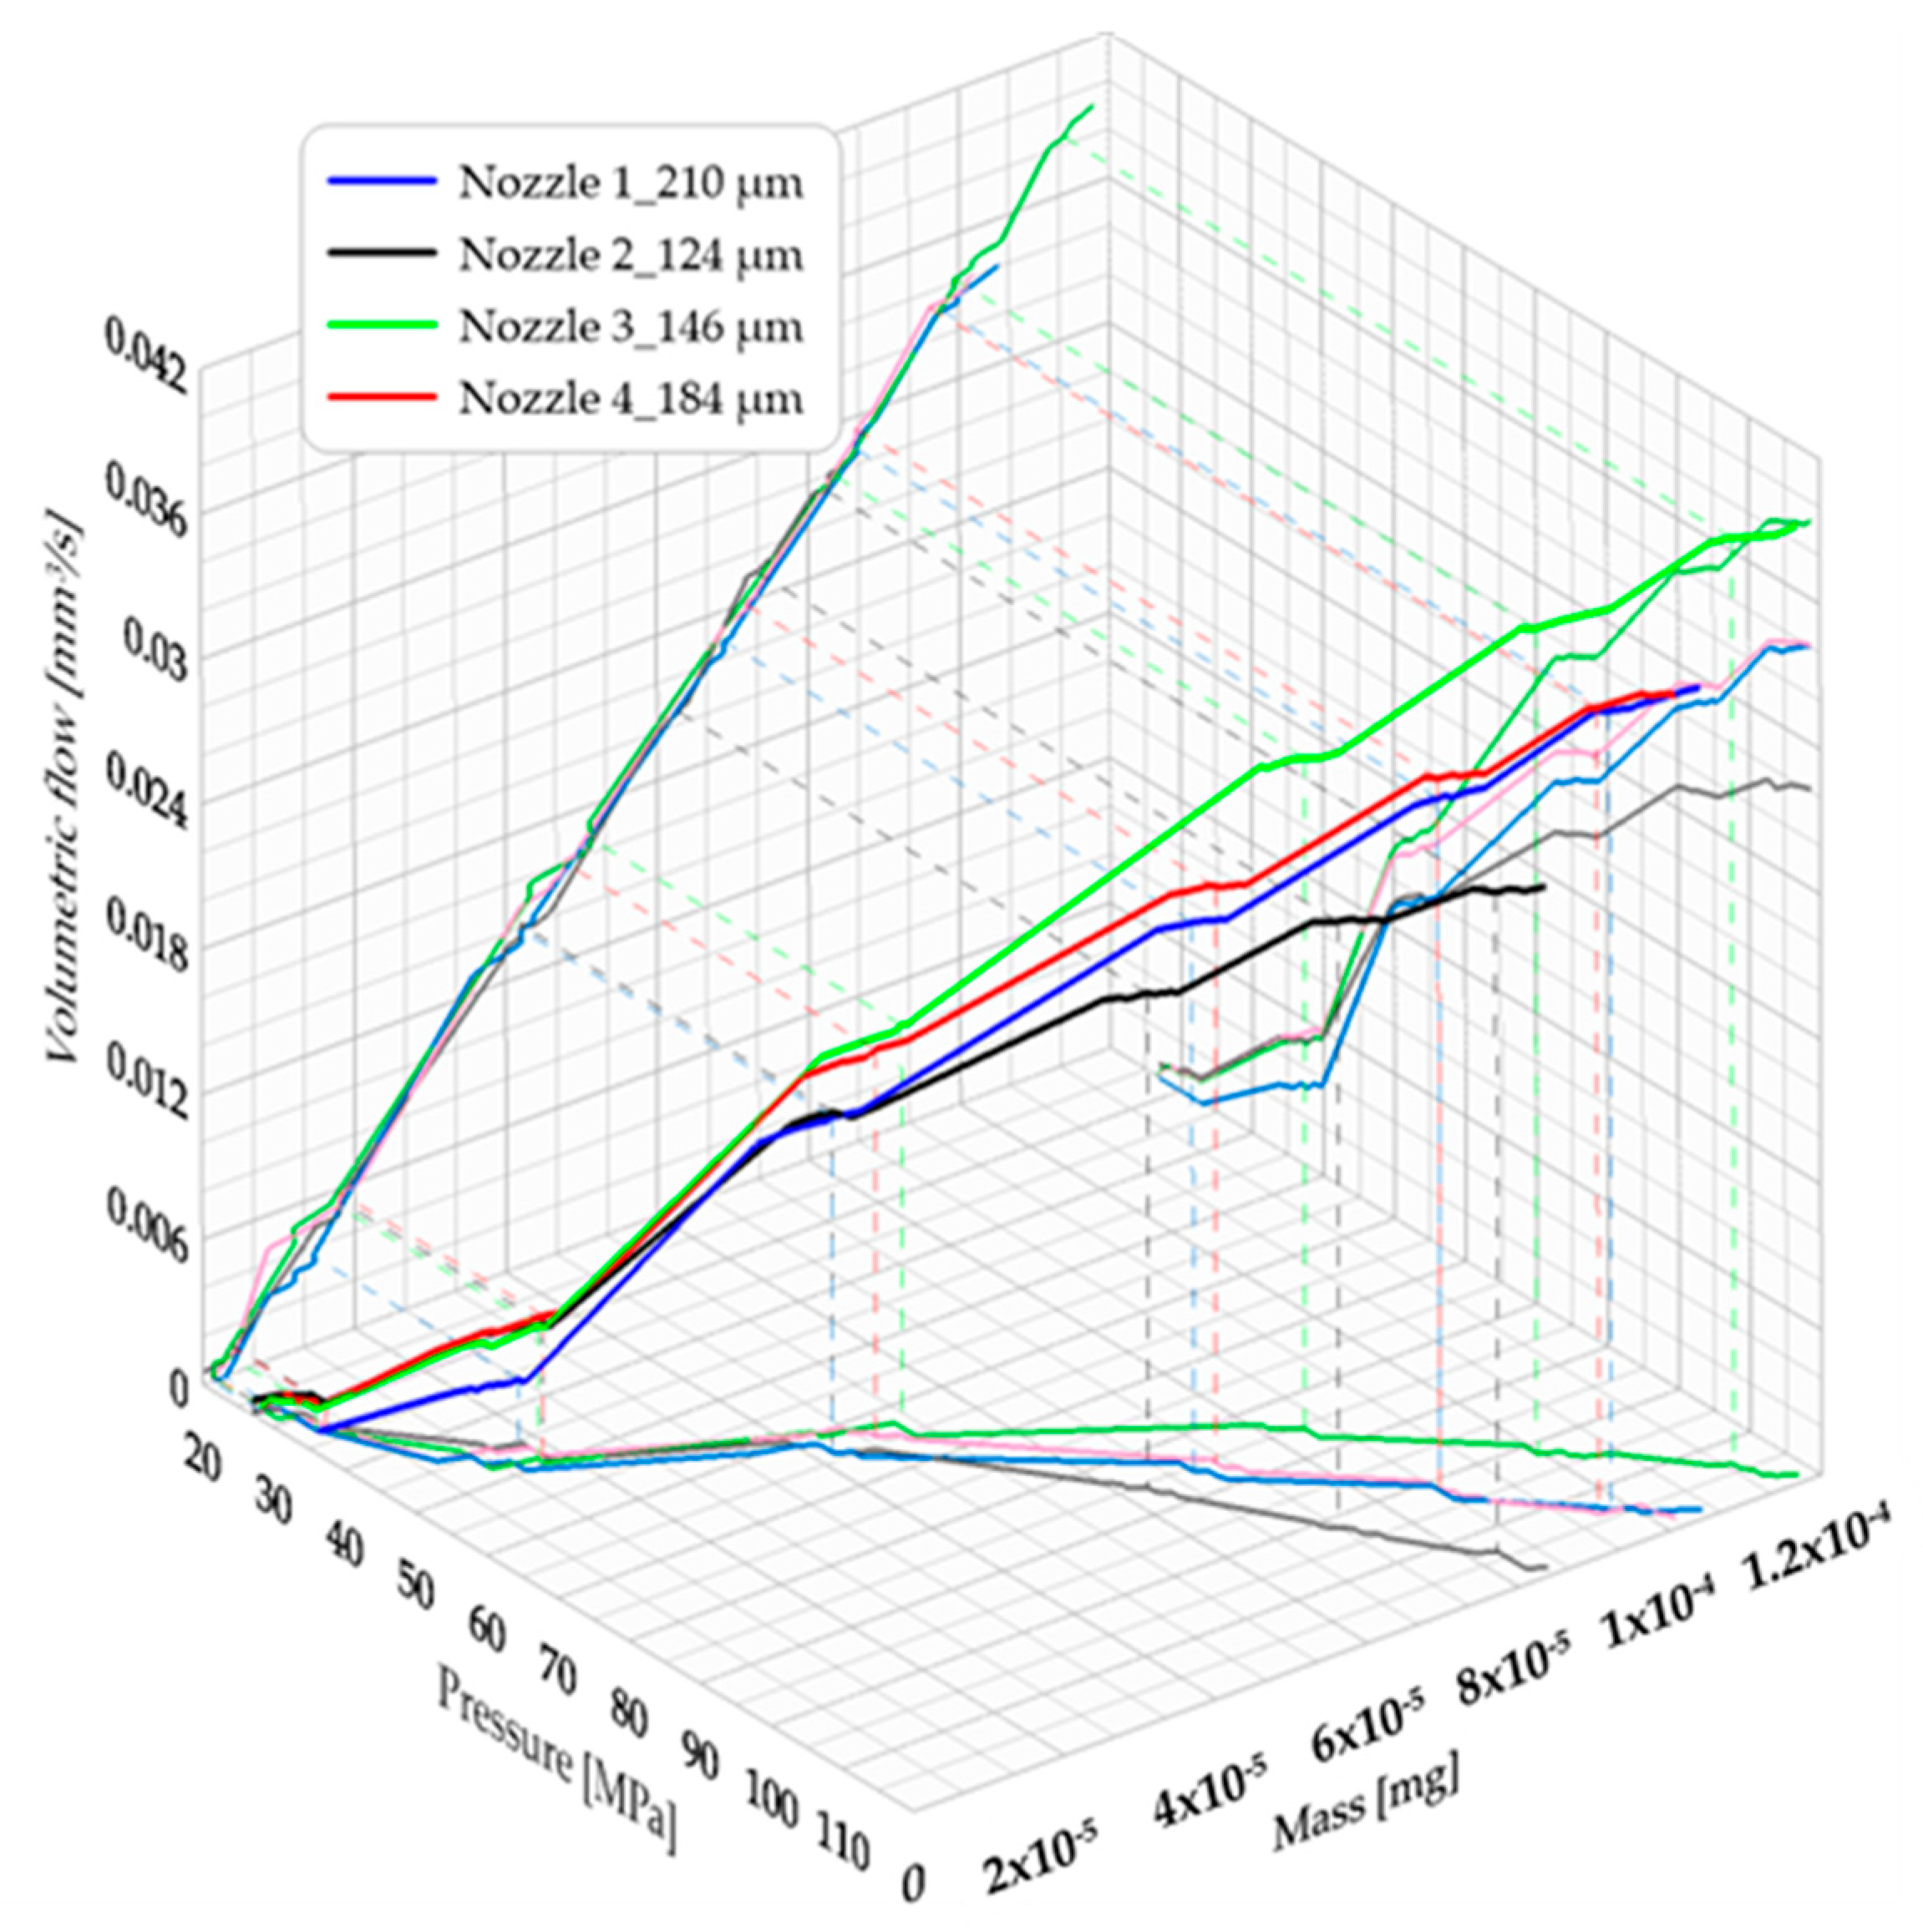
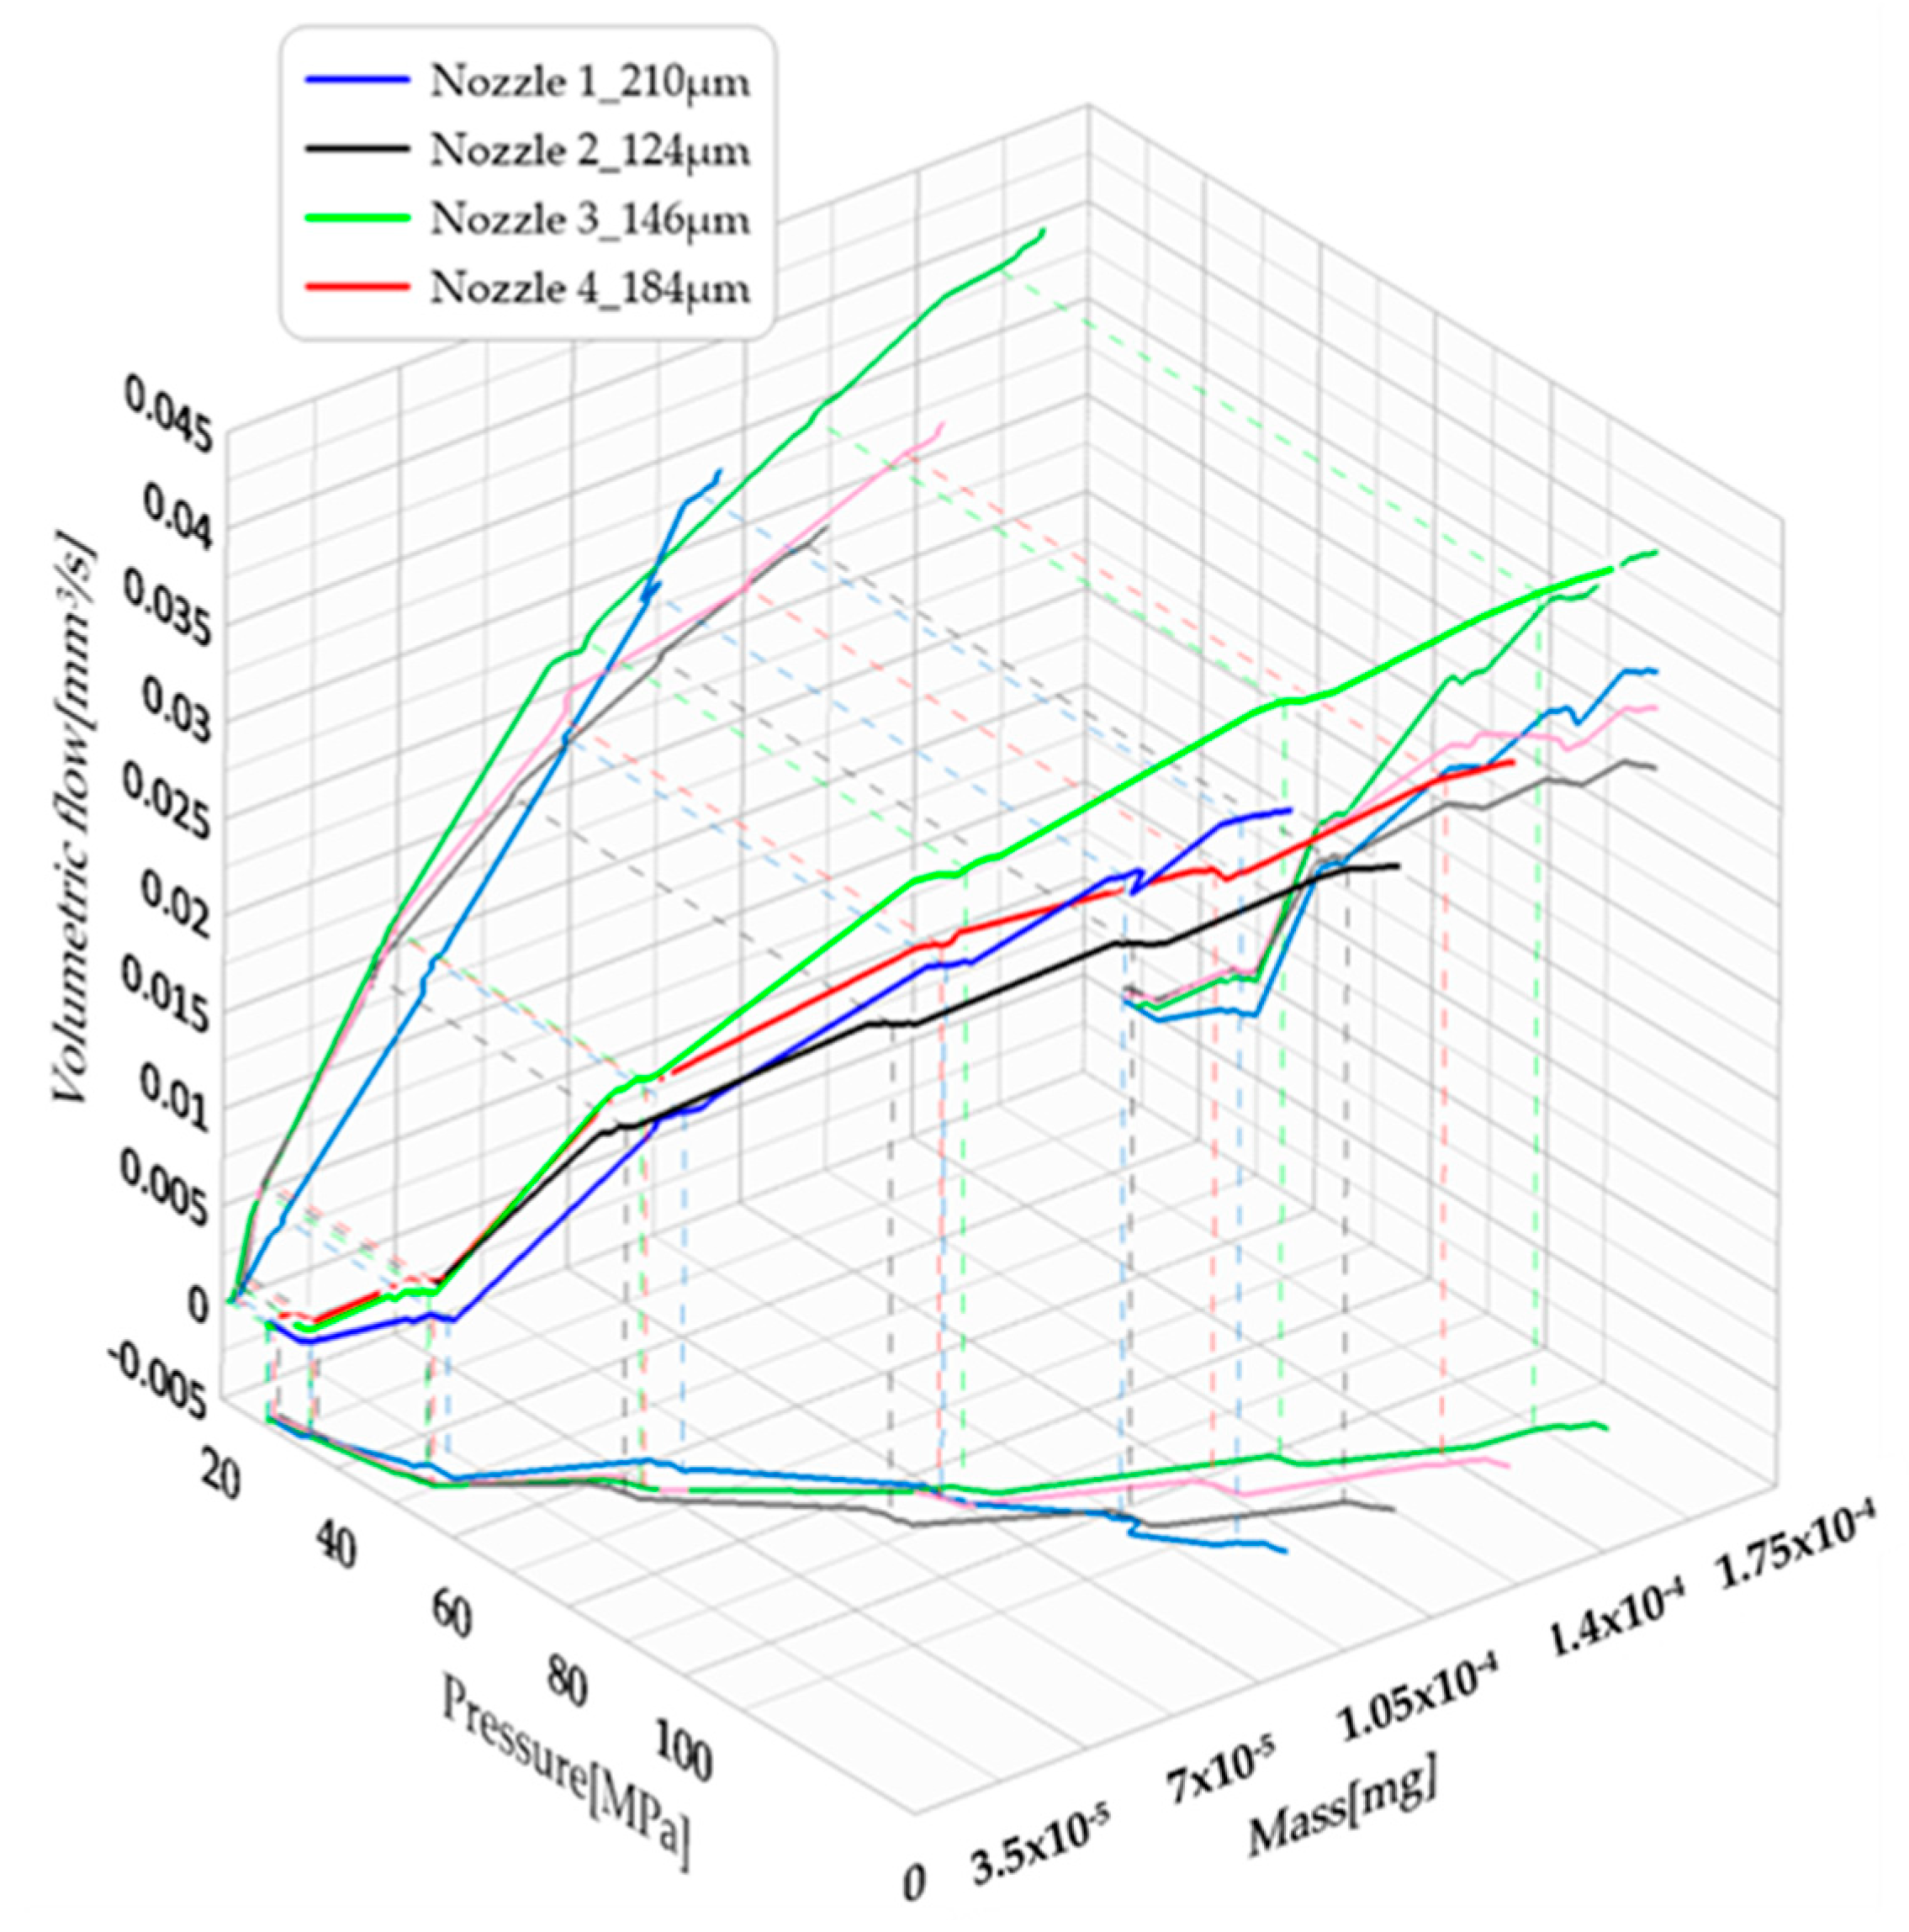
3.1. Volumetric Flow Rate and Mass Fuel
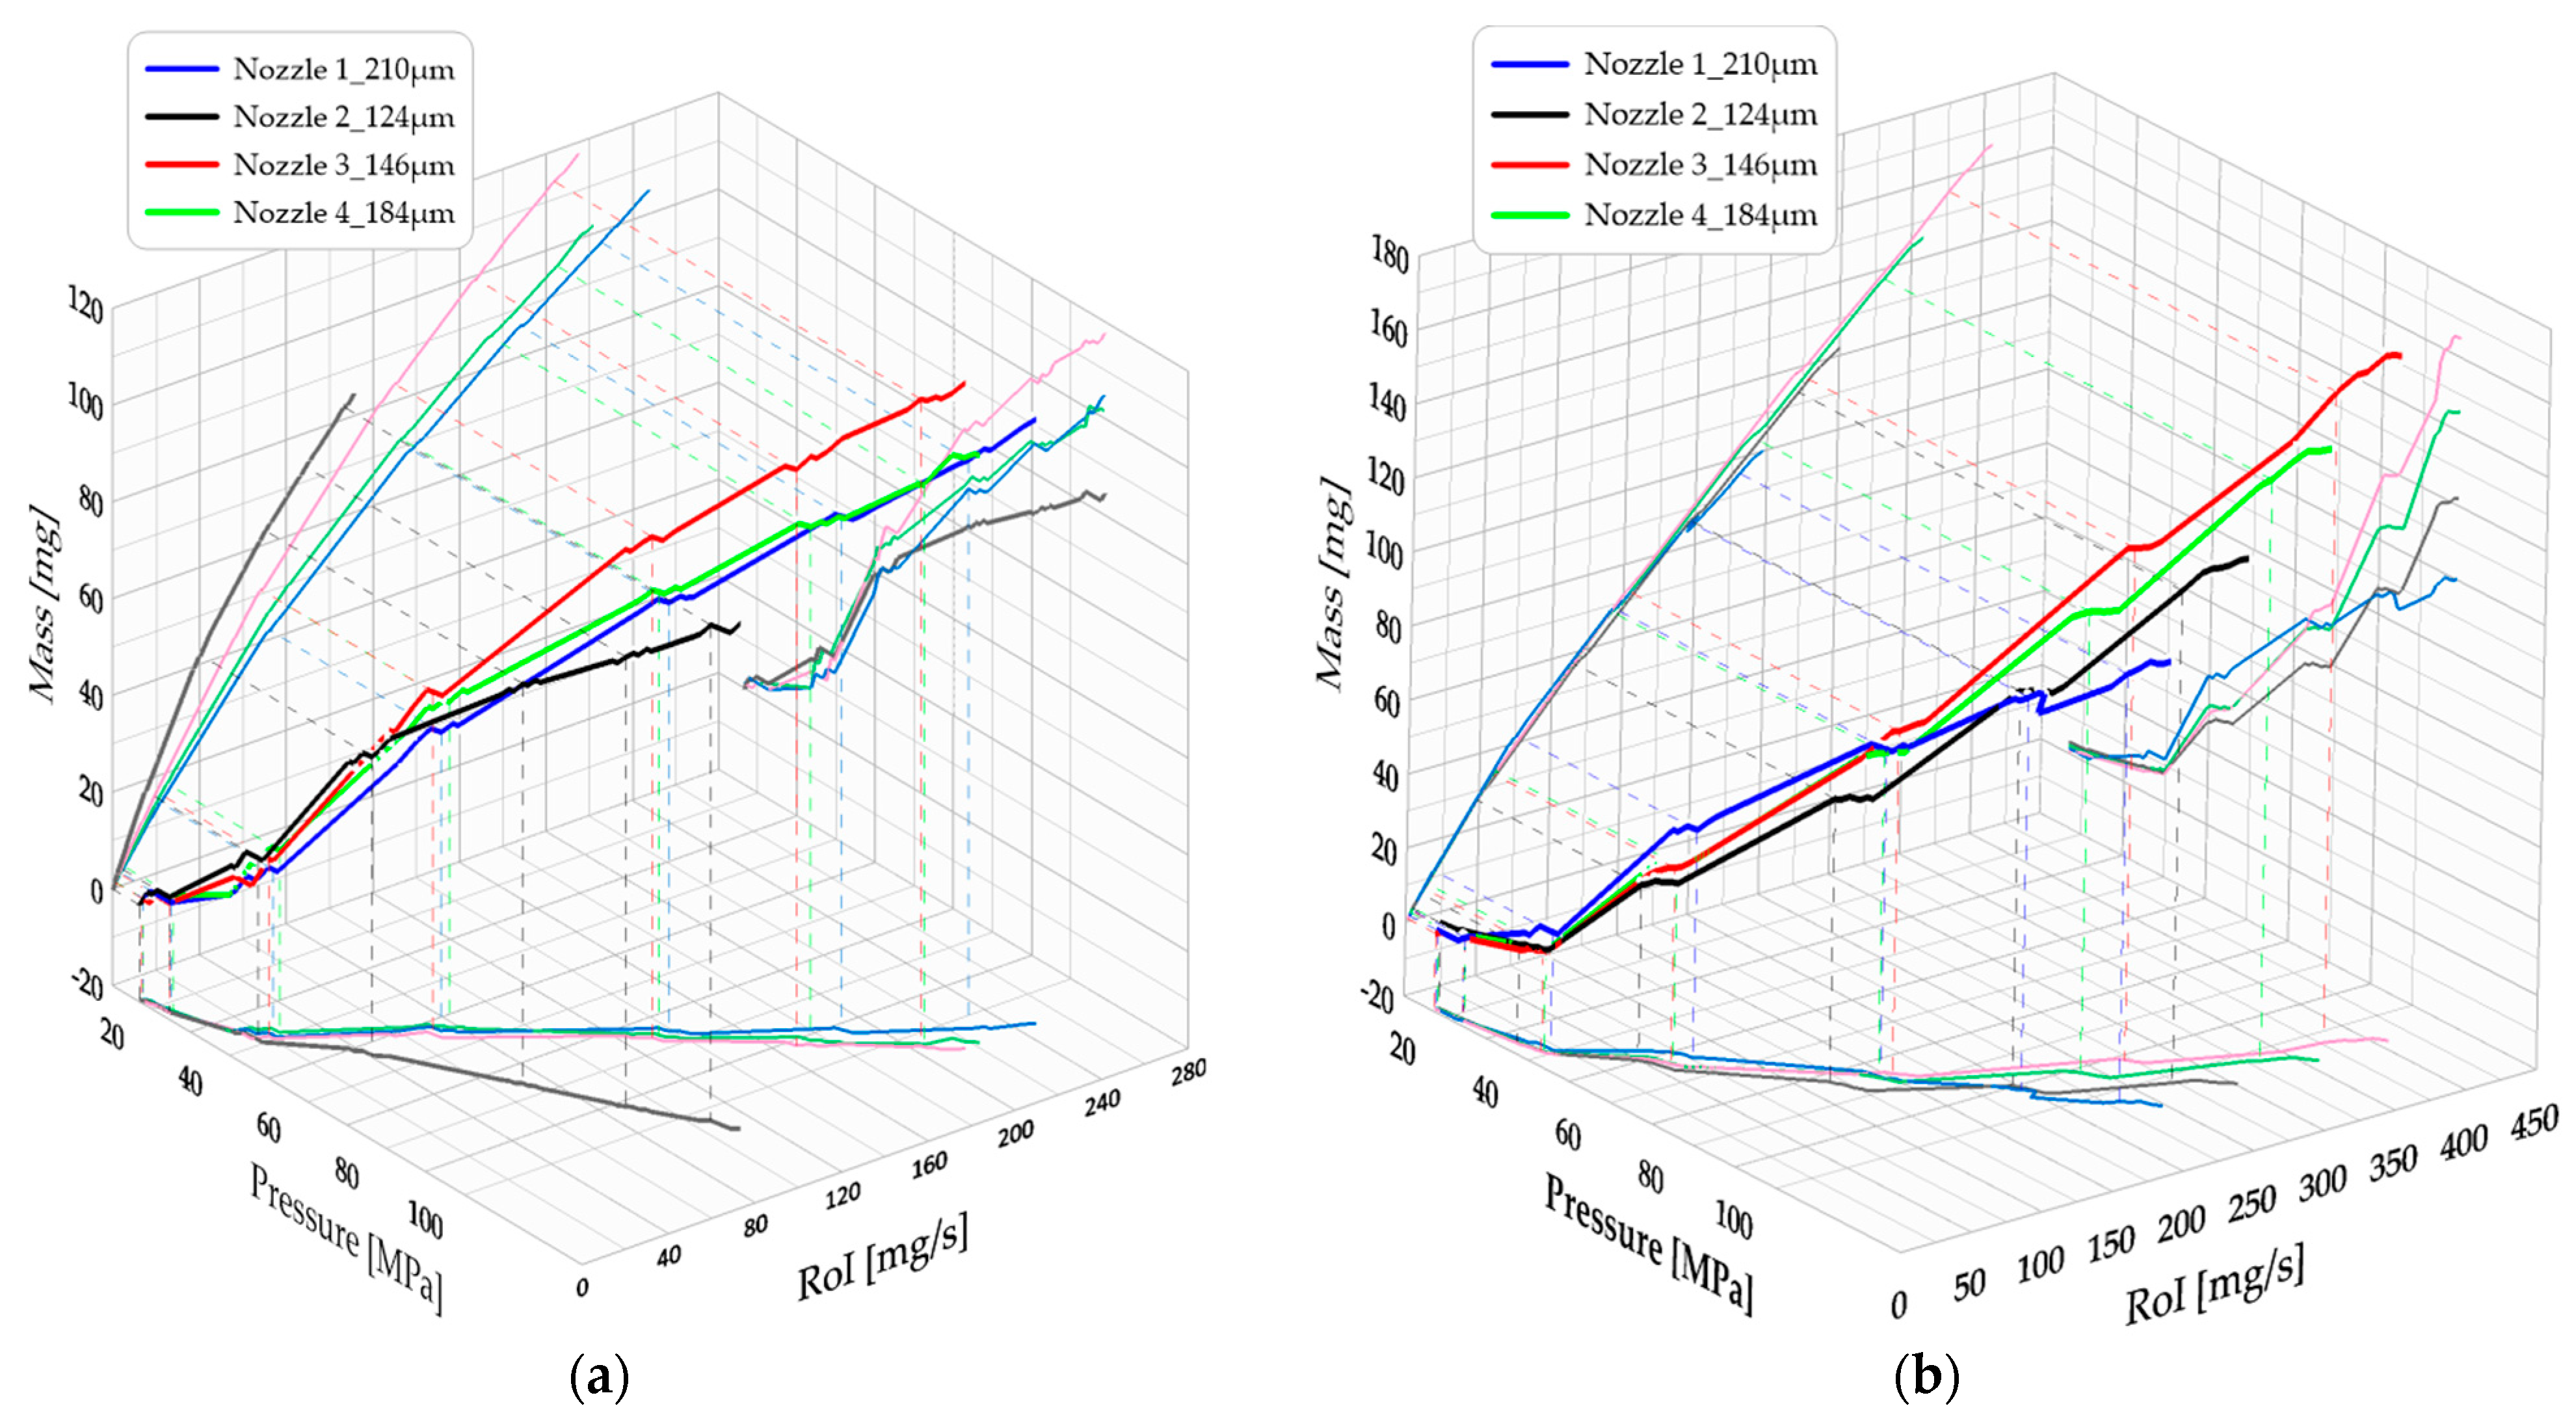
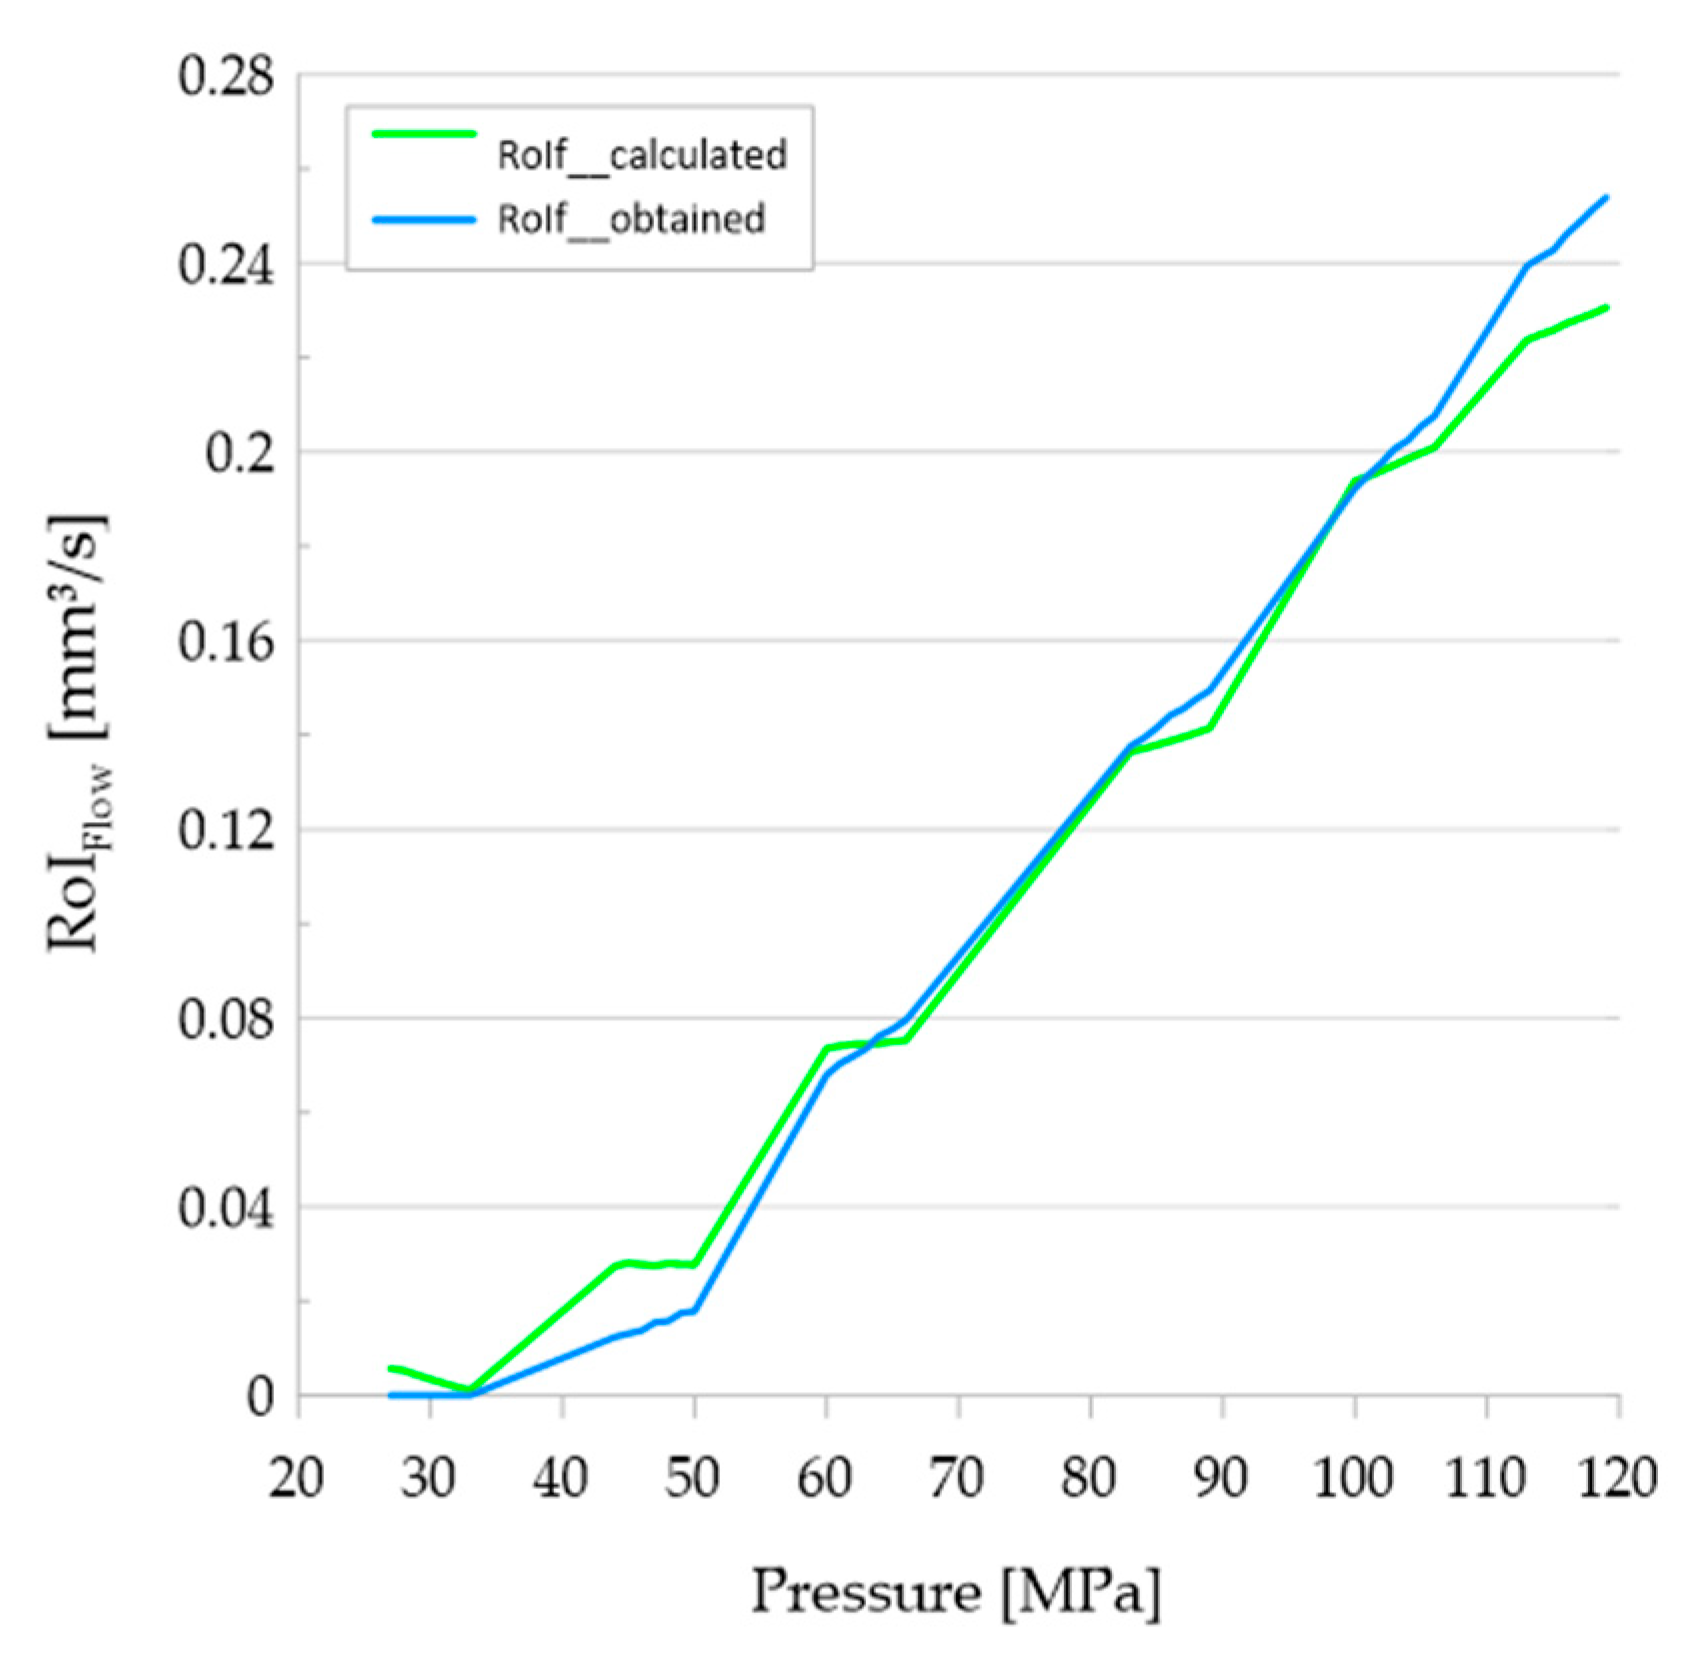
3.2. Calculated RoI Data
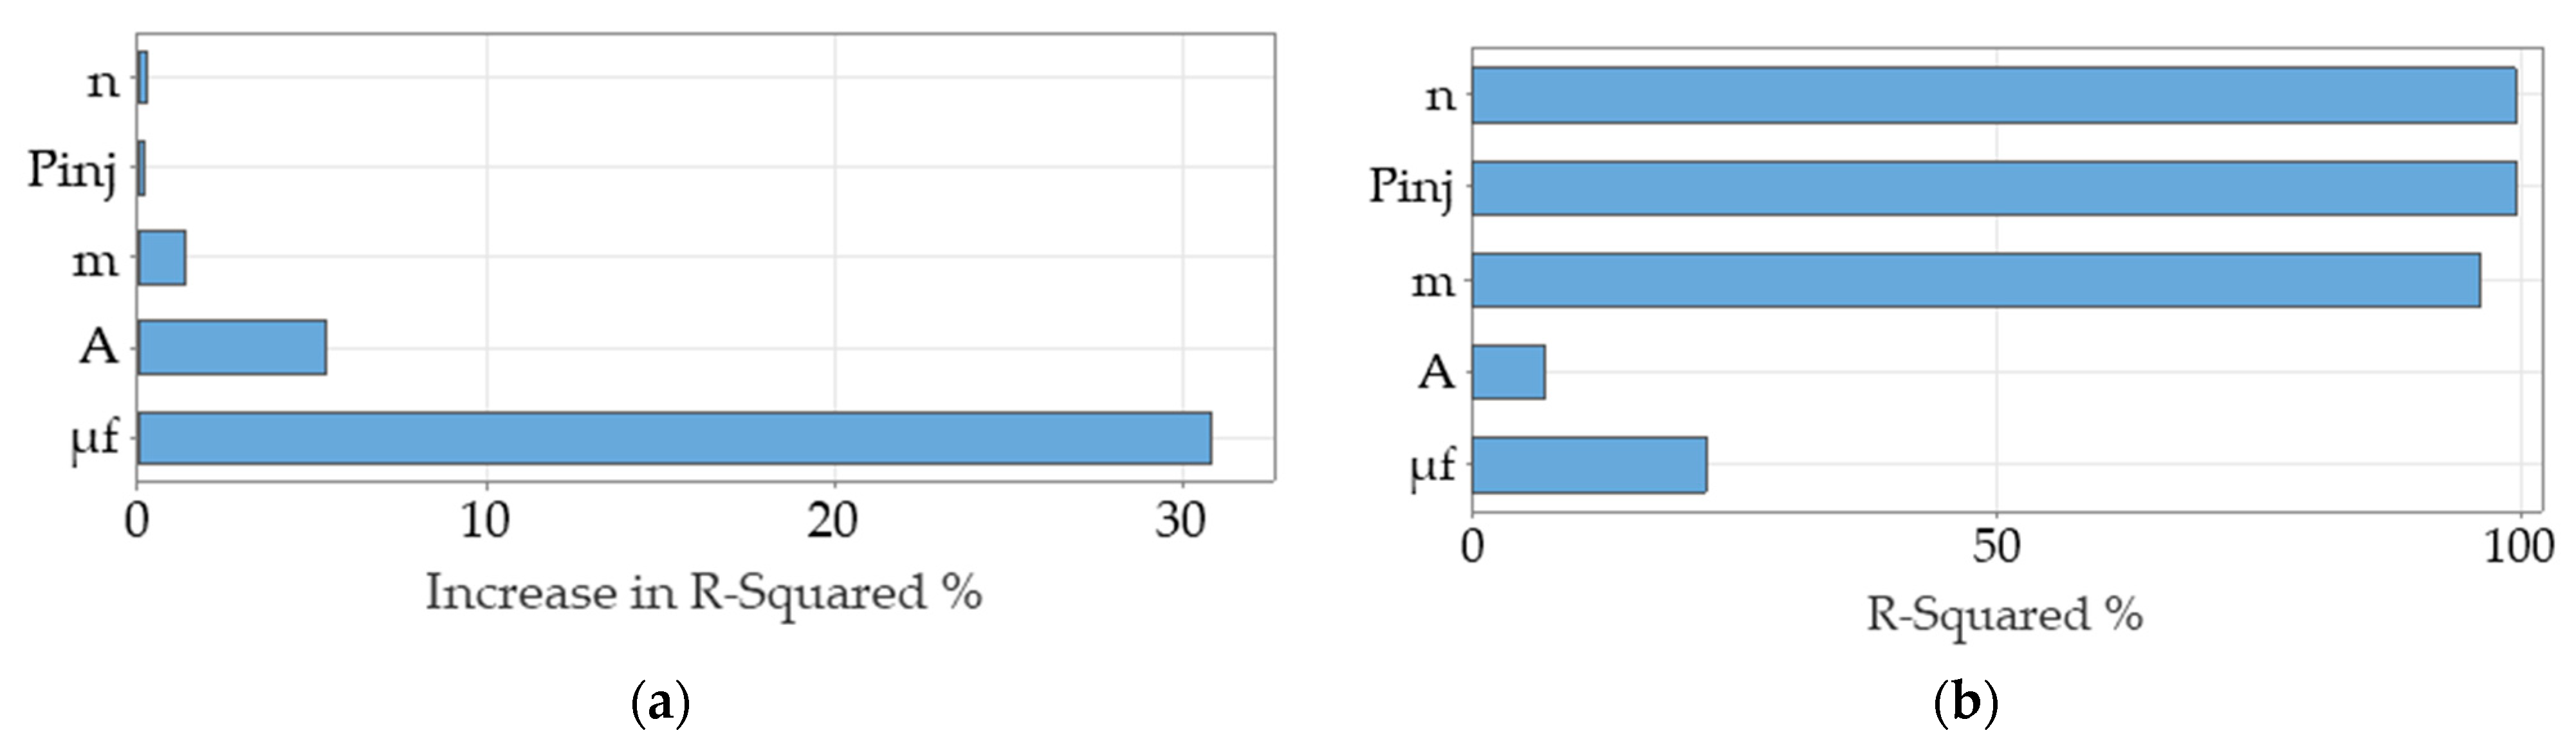
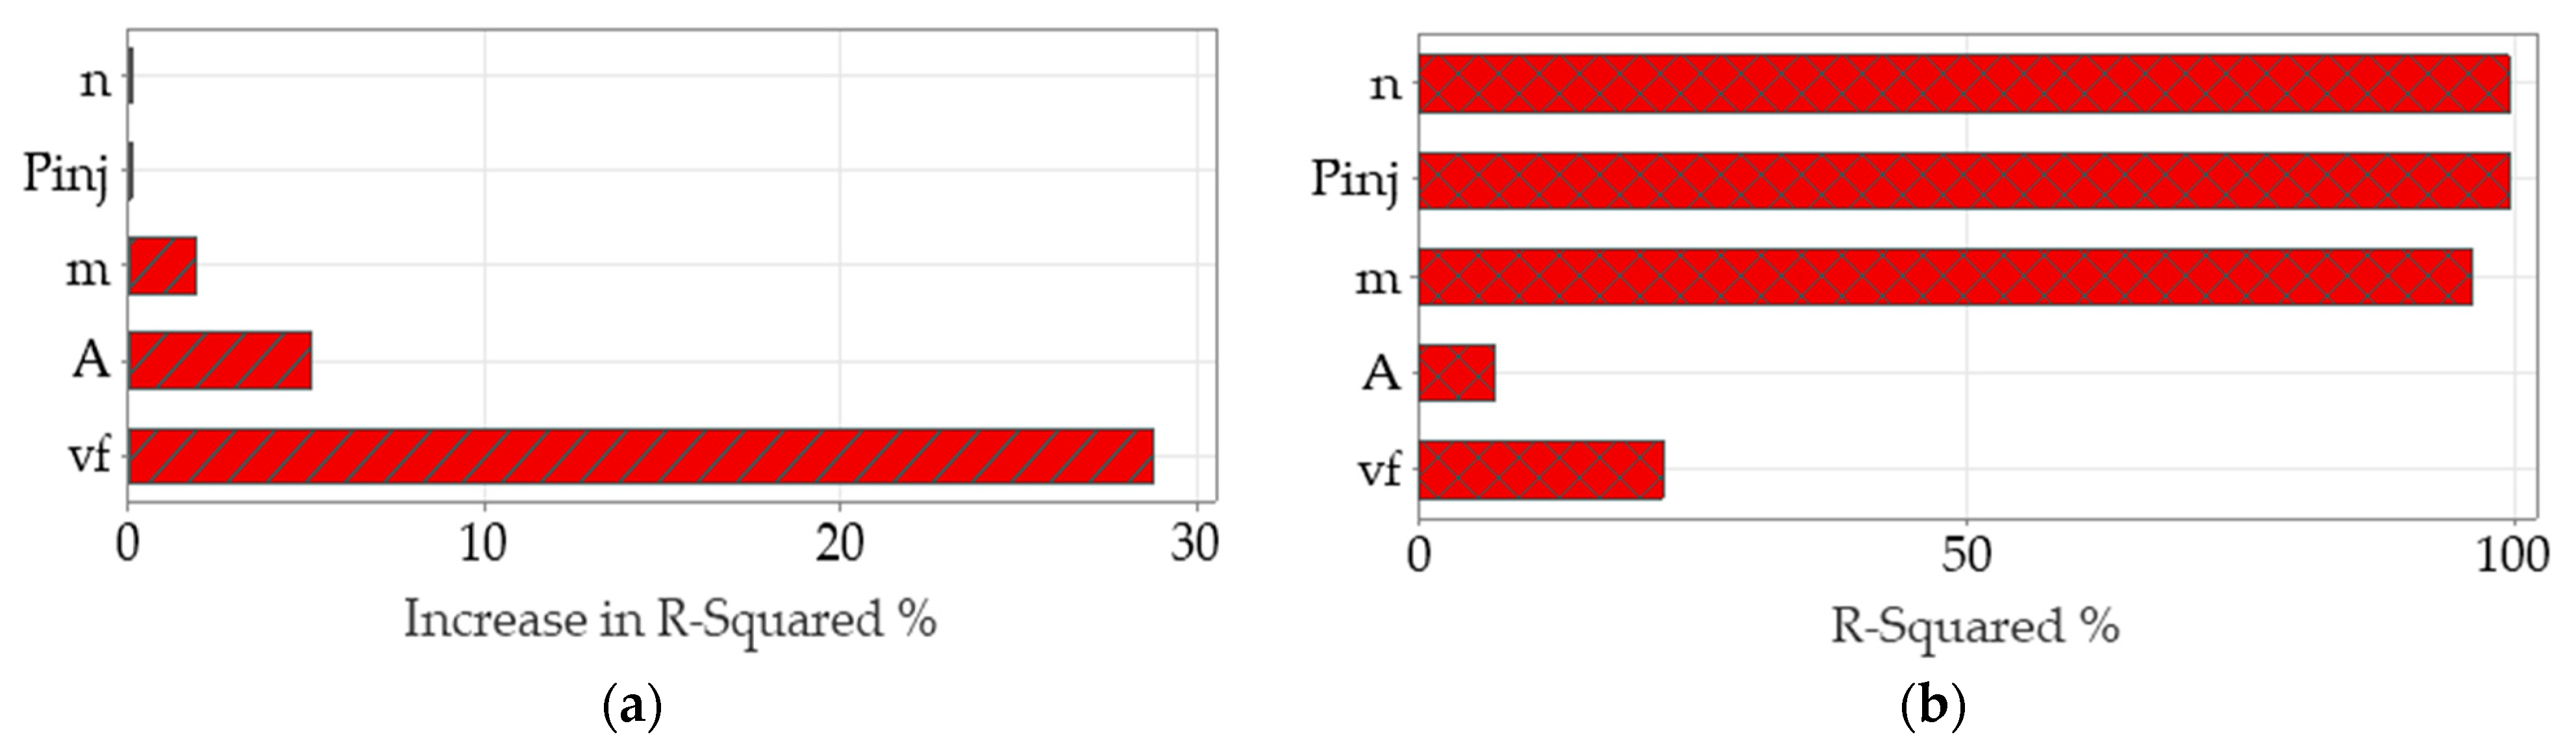
3.3. Results of Multiple Regression
3.3.1. Multiple Regression Model for RoIm
3.3.2. Multiple Regression Model for Fuel Mass Flow
3.4. Discussion
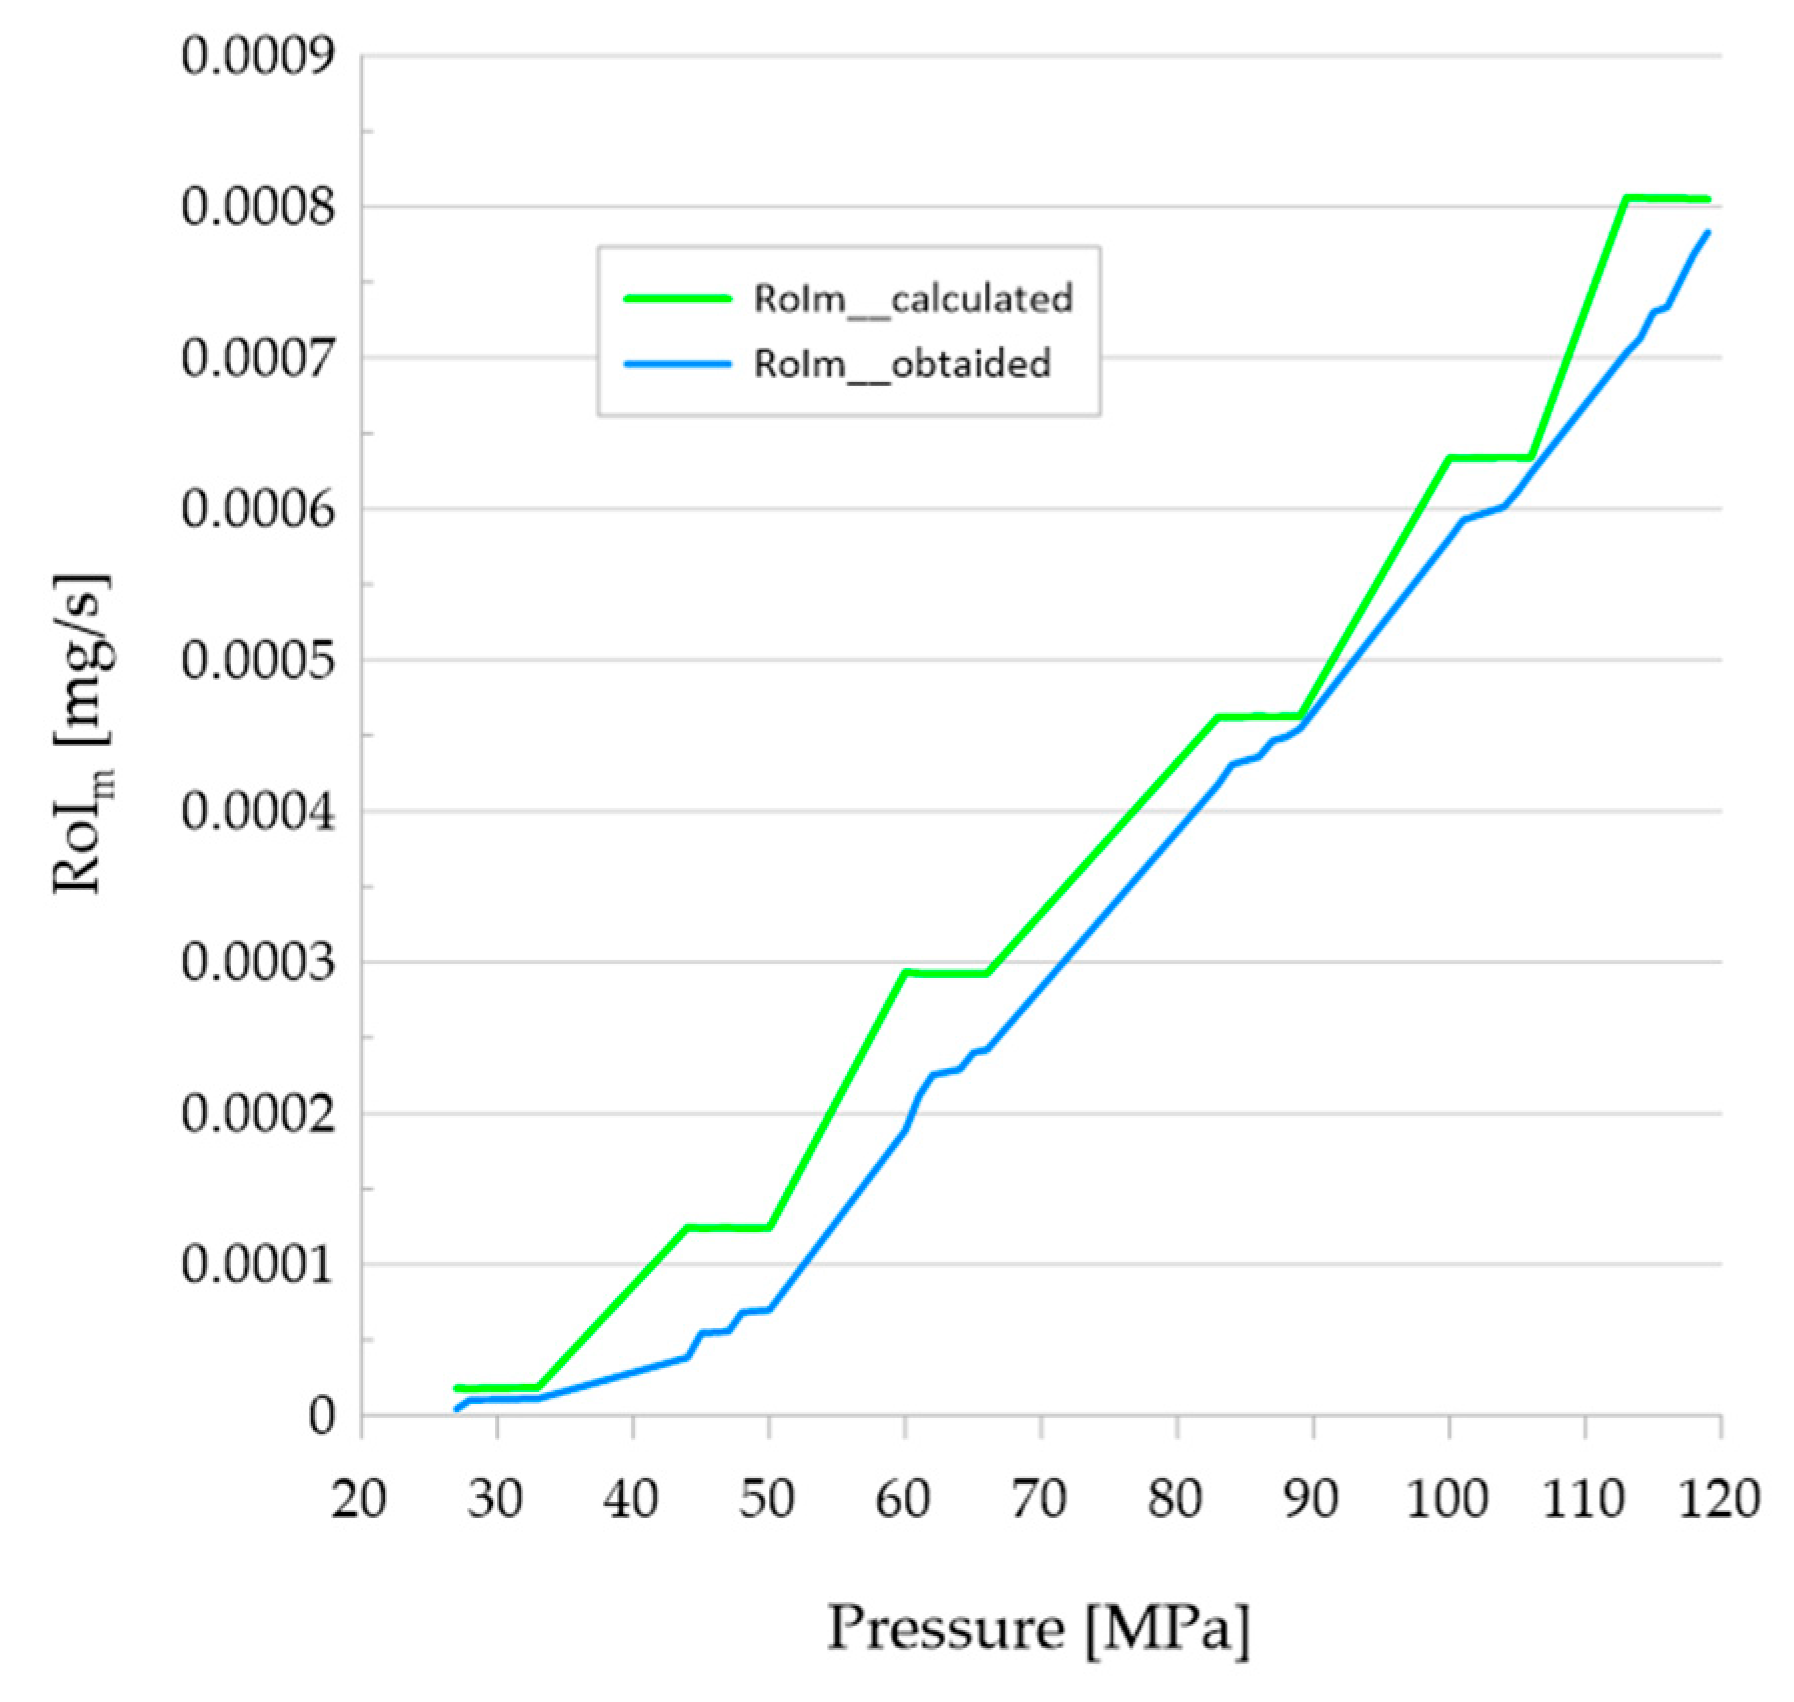
4. Model Validation
5. Conclusions
- ▪
- The nozzle with the highest fuel efficiency was the eight-hole nozzle with 124 microns, as it provided a better atomisation of the fuel with a lower injection rate value. In this way, it was possible to increase the injection pressure and decrease the pulse width or energisation time. In addition, by obtaining better atomisation, the air–fuel mixture would be more homogeneous, which would increase the combustion engine performance.
- ▪
- If the cross-sectional area of the holes was smaller and the number of holes was greater, the fuel distribution in the engine would be much better and the injection rate would be adequate, as happened with nozzle number 2. On the other hand, nozzle number 1 (x number of holes and x diameter) was the least efficient in this case, since the values of flow rate, mass, and injection rate were the highest compared to the rest of the nozzles.
- ▪
- When working nozzle 1 was used at a low engine speed and pressure (idle), injector 1 was not activated. This indicates that, to keep the vehicle running, the injection pressure, engine speed, and injection pulse would have to be increased, resulting in an even higher injection rate and fuel consumption.
- ▪
- It is important to stress the importance of fuel viscosity characteristics, as these were shown to play important roles in the behaviour of the injection rate and, thus, fuel efficiency. This would extend engine life and reduce emissions to the environment.
- ▪
- The two zero-dimensional models presented to predict the injection rate behaviour were close to the real behaviour of the 4JJ1 engine, so this will be very useful for future studies concerning injection rate behaviour.
- ▪
- The importance of the zero-dimensional model used in the study should be emphasised, as this model facilitates data collection and shortens processing time. This is because, in most cases, physical data are used, which are often not very accessible.
Author Contributions
Funding
Data Availability Statement
Conflicts of Interest
References
- Yu, H.; Liu, Y.; Li, J.; Ma, K.; Liang, Y.; Xu, H. Investigations on Fuel Consumption Characteristics of Heavy-Duty Commercial Vehicles under Different Test Cycle. Energy Rep. 2022, 8, 102–111. [Google Scholar] [CrossRef]
- Liu, J.; Feng, L.; Wang, H.; Zheng, Z.; Chen, B.; Zhang, D.; Yao, M. Spray Characteristics of Gasoline/PODE and Diesel/PODE Blends in a Constant Volume Chamber. Appl. Therm. Eng. 2019, 159, 113850. [Google Scholar] [CrossRef]
- Conway, G.; Joshi, A.; Leach, F.; García, A.; Senecal, P.K. A Review of Current and Future Powertrain Technologies and Trends in 2020. Transp. Eng. 2021, 5, 100080. [Google Scholar] [CrossRef]
- Oh, J.; Oh, S.; Kim, C.; Lee, S.; Lee, S.; Jang, H.; Lee, J. Effect of Multi-Angle Diesel Injector Nozzle on Emission and Efficiency of Natural Gas/Diesel Dual-Fuel Combustion in Compression Ignition Engine. Fuel 2022, 316, 123442. [Google Scholar] [CrossRef]
- Panda, K.; Ramesh, A. Diesel Injection Strategies for Reducing Emissions and Enhancing the Performance of a Methanol Based Dual Fuel Stationary Engine. Fuel 2021, 289, 119809. [Google Scholar] [CrossRef]
- He, X.; Xu, K.; Xu, Y.; Zhang, Z.; Wei, W. Effects of Nozzle Diameter on the Characteristic Time Scales of Diesel Spray Two-Stage Ignition under Cold-Start Conditions. Fuel 2023, 335, 126700. [Google Scholar] [CrossRef]
- Sujesh, G.; Ramesh, S. Modeling and Control of Diesel Engines: A Systematic Review. Alex. Eng. J. 2018, 57, 4033–4048. [Google Scholar] [CrossRef]
- Praveena, V.; Leenus Jesu Martin, M.; Varuvel, E.G. Combined Effects of Nozzle Hole Variation and Piston Bowl Geometry Modification on Performance Characteristics of a Diesel Engine with Energy and Exergy Approach. J. Clean. Prod. 2022, 375, 133946. [Google Scholar] [CrossRef]
- Atac, O.F.; Lee, S.; Moon, S. Development of Simplified Model for Injection Rate Prediction of Diesel Injectors during Transient and Steady Operation. Fuel 2022, 324, 124655. [Google Scholar] [CrossRef]
- Mohan, B.; Yang, W.; Chou, S.K. Fuel Injection Strategies for Performance Improvement and Emissions Reduction in Compression Ignition Engines—A Review. Renew. Sustain. Energy Rev. 2013, 28, 664–676. [Google Scholar] [CrossRef]
- Ishak, M.H.H.; Ismail, F.; Mat, S.C.; Abdullah, M.Z.; Abdul Aziz, M.S.; Idroas, M.Y. Numerical Analysis of Nozzle Flow and Spray Characteristics from Different Nozzles Using Diesel and Biofuel Blends. Energies 2019, 12, 281. [Google Scholar] [CrossRef]
- Vera-Tudela, W.; Haefeli, R.; Barro, C.; Schneider, B.; Boulouchos, K. An Experimental Study of a Very High-Pressure Diesel Injector (up to 5000 Bar) by Means of Optical Diagnostics. Fuel 2020, 275, 117933. [Google Scholar] [CrossRef]
- Ni, P.; Xu, H.; Zhang, Z.; Zhang, X. Effect of Injector Nozzle Parameters on Fuel Consumption and Soot Emission of Two-Cylinder Diesel Engine for Vehicle. Case Stud. Therm. Eng. 2022, 34, 101981. [Google Scholar] [CrossRef]
- Payri, R.; Bracho, G.; Soriano, J.A.; Fernández-Yáñez, P.; Armas, O. Nozzle Rate of Injection Estimation from Hole to Hole Momentum Flux Data with Different Fossil and Renewable Fuels. Fuel 2020, 279, 118404. [Google Scholar] [CrossRef]
- Rojas-Reinoso, V.; Duque-Escobar, S.; Guapulema-Guapulema, C.; Soriano, J.A. Study of the Variation of Fuel Pressure to Improve Spraying and the Range of the Injection Jet. Energies 2023, 16, 5472. [Google Scholar] [CrossRef]
- Safiullah; Chandra Ray, S.; Nishida, K.; McDonell, V.; Ogata, Y. Effects of Full Transient Injection Rate and Initial Spray Trajectory Angle Profiles on the CFD Simulation of Evaporating Diesel Sprays-Comparison between Singlehole and Multi Hole Injectors. Energy 2023, 263, 125796. [Google Scholar] [CrossRef]
- Yao, C.; Geng, P.; Yin, Z.; Hu, J.; Chen, D.; Ju, Y. Impacts of Nozzle Geometry on Spray Combustion of High Pressure Common Rail Injectors in a Constant Volume Combustion Chamber. Fuel 2016, 179, 235–245. [Google Scholar] [CrossRef]
- Soriano, J.A.; Mata, C.; Armas, O.; Ávila, C. A Zero-Dimensional Model to Simulate Injection Rate from First Generation Common Rail Diesel Injectors under Thermodynamic Diagnosis. Energy 2018, 158, 845–858. [Google Scholar] [CrossRef]
- Luo, T.; Jiang, S.; Moro, A.; Wang, C.; Zhou, L.; Luo, F. Measurement and Validation of Hole-to-Hole Fuel Injection Rate from a Diesel Injector. Flow. Meas. Instrum. 2018, 61, 66–78. [Google Scholar] [CrossRef]
- Rojas-Reinoso, V.; Mata, C.; Soriano, J.A.; Armas, O. Zero-Dimensional Modeling of the Rate of Injection with a Diesel Common Rail System Using Single-Hole Nozzles with Neat Low-Carbon Fuels. Appl. Sci. 2024, 14, 2446. [Google Scholar] [CrossRef]
- Mata, C.; Rojas-Reinoso, V.; Soriano, J.A. Experimental Determination and Modelling of Fuel Rate of Injection: A Review. Fuel 2023, 343, 127895. [Google Scholar] [CrossRef]
- Salvador, F.J.; Gimeno, J.; Martín, J.; Carreres, M. Thermal Effects on the Diesel Injector Performance through Adiabatic 1D Modelling. Part I: Model Description and Assessment of the Adiabatic Flow Hypothesis. Fuel 2020, 260, 116348. [Google Scholar] [CrossRef]
- Zhang, T. An Estimation Method of the Fuel Mass Injected in Large Injections in Common-Rail Diesel Engines Based on System Identification Using Artificial Neural Network. Fuel 2022, 310, 122404. [Google Scholar] [CrossRef]
- Kim, J.; Lee, J.; Kim, K. Numerical Study on the Effects of Fuel Viscosity and Density on the Injection Rate Performance of a Solenoid Diesel Injector Based on AMESim. Fuel 2019, 256, 115912. [Google Scholar] [CrossRef]
- Zhai, C.; Jin, Y.; Nishida, K.; Ogata, Y. Diesel Spray and Combustion of Multi-Hole Injectors with Micro-Hole under Ultra-High Injection Pressure–Non-Evaporating Spray Characteristics. Fuel 2021, 283, 119322. [Google Scholar] [CrossRef]
- Catania, A.E.; Finesso, R.; Spessa, E. Predictive Zero-Dimensional Combustion Model for Di Diesel Engine Feed-Forward Control. Energy Convers. Manag. 2011, 52, 3159–3175. [Google Scholar] [CrossRef]
- Payri, R.; Molina, S.; Salvador, F.J.; Gimeno, J. A Study of the Relation between Nozzle Geometry, Internal Flow and Sprays Characteristics in Diesel Fuel Injection Systems. KSME Int. J. 2004, 18, 1222–1235. [Google Scholar] [CrossRef]
- Rojas-Reinoso, V.; Alvarez-Loor, J.; Zambrano-Becerra, H.; Soriano, J.A. Comparative Study of Gasoline Fuel Mixture to Reduce Emissions in the Metropolitan District. Sustainability 2023, 15, 2921. [Google Scholar] [CrossRef]
- AEADE. BOLETÍN DE PRENSA Ventas de Vehículos-Resumen; AEADE: Quito, Ecuador, 2023. [Google Scholar]


| Brand | Model | Engine | Fuel | Cylinder | Cylinder Number |
|---|---|---|---|---|---|
| Isuzu | D-max | 4JJ1 CRDI | Diesel | 3.0 L | 4 |
| Equipment | Brand | Model |
|---|---|---|
| Scanner | Launch | X-431 PAD V |
| Laptop | Dell | G3 |
| Oscilloscope | Missing | tBook mini TO1104 |
| Amperometric clamp | Fluke | 362 |
| Number | Denomination |
|---|---|
| 1 | Diesel injector test bench |
| 2 | Electronic Control Unit |
| 3 | Injection pump |
| 4 | Common Rail |
| 5 | Injector |
| 6 | Nozzle |
| 7 | Clamp meter |
| 8 | Oscilloscope |
| 9 | Beaker |
| 10 | Gravimetric balance |
| 11 | Personal Computer |
| Denomination | Fuel 1 | Fuel 2 | Units |
|---|---|---|---|
| Commercial designation | Viscor 1487 AW-2 | Diesel | - |
| Density | 780 | 850 | [kg/m3] |
| Viscosity kinematics at 40 °C | 2.62 | 4.1 | [mm2/s] |
| Kinematic viscosity at 100 °C | 1.07 | 1.9 | [mm2/s] |
| Kinematic viscosity at 20 °C | 102 | 52 | [mm2/s] |
| Engine Speed [min−1] | Injection Pressure [Bar] | Injection Pulse [µs] | Injector Current [A] | Injector Voltage [V] |
|---|---|---|---|---|
| 695 | 300 | 614 | 9.94 | 14.3 |
| 1000 | 470 | 855 | 12.93 | 14.2 |
| 1500 | 630 | 1200 | 17.20 | 14.2 |
| 2000 | 860 | 1470 | 21.47 | 14.2 |
| 2500 | 1030 | 1665 | 25.74 | 14.2 |
| 3000 | 1160 | 1800 | 30.01 | 14.0 |
| Number Test | Pressure [MPa] | Energy Time [μs] |
|---|---|---|
| 5 | 27–33 | 614 |
| 5 | 44–50 | 855 |
| 5 | 60–66 | 1200 |
| 5 | 83–89 | 1470 |
| 5 | 100–106 | 1665 |
| 5 | 113–119 | 1800 |
| Denomination | Value | Units |
|---|---|---|
| Injector manufacturer | Denso | - |
| Model | 8-98011604 | - |
| Inductance | 100 < I < 1200 H | Henry |
| Nozzle | 8 | Holes |
| Hole diameter | 145.98 | μm |
| Average injection flow | 300 | mm3/h |
| Return flow | 82.5 | mm3/h |
| Work pressure | 25 < Pinj < 150 | MPa |
| Weight | 689 | g |
| Nozzle | Number of Holes | Diameter [μm] |
|---|---|---|
| 1 | 5 | 209.8 ≈ 210 |
| 2 | 8 | 123.87 ≈ 124 |
| 3 | 8 | 145.98 ≈ 146 |
| 4 | 6 | 184.27 ≈ 184 |
| Variables | Variable | Units |
|---|---|---|
| RoIm | ||
| Engine speed | ||
| Pressure | ||
| Mass fuel | ||
| Area | ||
| Kinematic viscosity |
| Denomination | Variable | Units |
|---|---|---|
| Flow volume | ||
| Engine speed | ||
| Pressure | ||
| Mass | ||
| Area | ||
| Kinematic viscosity |
Disclaimer/Publisher’s Note: The statements, opinions and data contained in all publications are solely those of the individual author(s) and contributor(s) and not of MDPI and/or the editor(s). MDPI and/or the editor(s) disclaim responsibility for any injury to people or property resulting from any ideas, methods, instructions or products referred to in the content. |
© 2024 by the authors. Licensee MDPI, Basel, Switzerland. This article is an open access article distributed under the terms and conditions of the Creative Commons Attribution (CC BY) license (https://creativecommons.org/licenses/by/4.0/).
Share and Cite
Rojas-Reinoso, E.V.; Morales-Chauca, K.; Lara-Lara, J.; Soriano, J.A.; García-Contreras, R. Adaptation and Validation of Injection Rate Predictive Model for Solenoid Type Injectors with Different Nozzle Geometry. Appl. Sci. 2024, 14, 3394. https://doi.org/10.3390/app14083394
Rojas-Reinoso EV, Morales-Chauca K, Lara-Lara J, Soriano JA, García-Contreras R. Adaptation and Validation of Injection Rate Predictive Model for Solenoid Type Injectors with Different Nozzle Geometry. Applied Sciences. 2024; 14(8):3394. https://doi.org/10.3390/app14083394
Chicago/Turabian StyleRojas-Reinoso, Edgar Vicente, Karen Morales-Chauca, Jandry Lara-Lara, José Antonio Soriano, and Reyes García-Contreras. 2024. "Adaptation and Validation of Injection Rate Predictive Model for Solenoid Type Injectors with Different Nozzle Geometry" Applied Sciences 14, no. 8: 3394. https://doi.org/10.3390/app14083394
APA StyleRojas-Reinoso, E. V., Morales-Chauca, K., Lara-Lara, J., Soriano, J. A., & García-Contreras, R. (2024). Adaptation and Validation of Injection Rate Predictive Model for Solenoid Type Injectors with Different Nozzle Geometry. Applied Sciences, 14(8), 3394. https://doi.org/10.3390/app14083394