Abstract
Asphalt cores in embankment dams are subject to loading and temperature changes during construction and reservoir impounding. Asphalt samples were drilled out from the Quxue Dam and Laojiaoxi Dam cores during construction. The diameter of the samples was 100 mm, and the length was about 450 mm. The samples were cut into specimens measuring 200 mm in length. Long-term triaxial creep tests were conducted on the specimens. The tests were run systematically at different radial confining stresses in the range of 0.5–1.5 MPa and at different temperatures in the range of 5–30 °C. More than 3.5 years were required to complete the tests. Based on the systematic test results and the application of the viscoelastic theory, a material stress–strain–time–temperature creep model (SSTTC) is proposed. The performance of asphalt cores in dams is discussed. The proposed SSTTC model may be applied in the numerical analysis of asphalt cores in dams during dam construction and reservoir impounding.
1. Introduction
Asphalt concrete is a viscoelastic material. Asphalt core embankment dams (ACEDs) have been adopted and used for more than 60 years. With the advantages of asphalt concrete becoming apparent, this dam type is being increasingly adopted, and the number of ACEDs built was about 120 in 2010 and about 250 in 2020 [1,2]. The highest ACED was about 125 m before 2005, and it was increased to about 170 m in 2017. Many high ACEDs located in deep compressive overburdens are being designed.
The width of the asphalt core from the top to the bottom of a dam is commonly in the range of 0.5–1.2 m. An asphalt mixture is either manually placed in pre-erected steel formworks or is placed by a machine paver. Once placed, the asphalt mixture and adjacent transition zone materials are compacted by vibratory rollers. The core is constructed at a common rate of two layers per day. The layer thickness of the core and adjacent transition zones is in the range of 0.2–0.25 m. It is inevitable that construction must be stopped for a few days per month to conduct quality checks or for a few months during rainy seasons or winter. Typically, 2–3 years are spent constructing a 100 m high ACED. The dam construction procedures and processes suggest that asphalt cores are subjected to stepwise loading creep during construction.
The temperature of the asphalt mixture is usually between 140 and 160 °C during its placement and compaction when using bitumen type B70 or B90. The temperature may be 10–20 °C lower when the softer bitumen type B180 is used. The asphalt core is in the center of the embankment dam and is protected by the adjacent transition zones. It is overlaid layer by layer with hot asphalt concrete when raising the embankment. The temperature in the core is reduced gradually with time. The reduction rate depends on the dam construction rate and weather conditions. Field observations at Quxue Dam indicated that the temperature in the core was around 40 °C after one month and around 20 °C after half a year [3]. During reservoir impounding, the temperature changes relatively quickly and gradually approaches a constant temperature. In some situations, a dam is constructed, and the reservoir is simultaneously impounded. In such cases, the temperature in the core cools quickly.
The performance of asphalt cores in dams during their construction is subjected to stepwise loading creep and is simultaneously affected by changes in temperature. In previous studies, long-term triaxial creep tests were conducted at a constant temperature, and the test results showed that the stress–strain reached a creep-stable state over time [4,5,6,7,8,9]. When the test results from Pircher and Schwab [4] and Gallacher [5] were reanalyzed, the deviator stress and lateral or axial strain presented a good linear relationship. In the reanalysis of the results from Rienossl, Schober, and Haas [6,7,8], this relationship was also found to be roughly linear with a larger scatter. This relationship in the reanalyzed results from Ferner et al. [9] also presented roughly linear characteristics, covering about 70% of the deviator stress strength. Based on a reanalysis of test results in the literature and on their own test results, Wang and Höeg [10] proposed a creep-stable model (CS model) for analyzing the behavior of the cores of dams. To extend previous studies [10] and establish a material stress–strain–time–temperature creep model (SSTTC model), systematic investigations were conducted.
2. Materials and Specimen Preparation
To make the tests representative, typical limestone aggregates and fillers were selected, and the bitumen that was used was the most popular type in China: B70. B70 is a bitumen grade that is specified to have a depth of penetration of 60–80 (measured in 1/10 mm) when using a standard needle to penetrate a bitumen sample under standard test conditions and procedures. To avoid the limitations of preparing asphalt specimens in the laboratory, asphalt samples were drilled out from the core of the Quxue Dam in China during its construction [11]. A few asphalt samples drilled out from the core of the Laojiaoxi Dam in China were also used as materials in the study, and the asphalt mixes were almost identical to those of the Quxue Dam core [3]. The 174 m high Quxue Dam is the highest ACED constructed to date. The design, construction, and field observations for the Quxue Dam have been presented in several studies [3]. The asphalt mixture recipe used in the asphalt plant for the Quxue Dam core is shown in Table 1. There were inevitable deviations in the mix from the design target during construction, but the deviations were controlled within the allowable ranges [1,12].

Table 1.
Asphalt concrete recipe used for the Quxue Dam core [3].
The diameter of the drilled asphalt samples was 100 mm, and the sample length was about 450 mm. The samples were cut into specimens of 200 mm in length for testing. The air porosities of the test specimens were less than 2.0%.
3. Results of Long-Term Triaxial Creep Tests at Different Temperatures
To achieve a complete stress–strain curve, water in a triaxial cell was prevented from penetrating the surface of a cylindrical specimen during a test by covering the specimen’s surface with a bitumen membrane. The specimens were tested by applying different pre-set temperatures. Initially, the vertical axial stress was equal to the radial stress. The tests were run by applying a pre-set constant radially confining stress level and increasing the axial stress in a stepwise manner. The long-term triaxial creep test results at different temperatures and the radially confining stress levels are shown in Figure 1, Figure 2, Figure 3, Figure 4 and Figure 5.

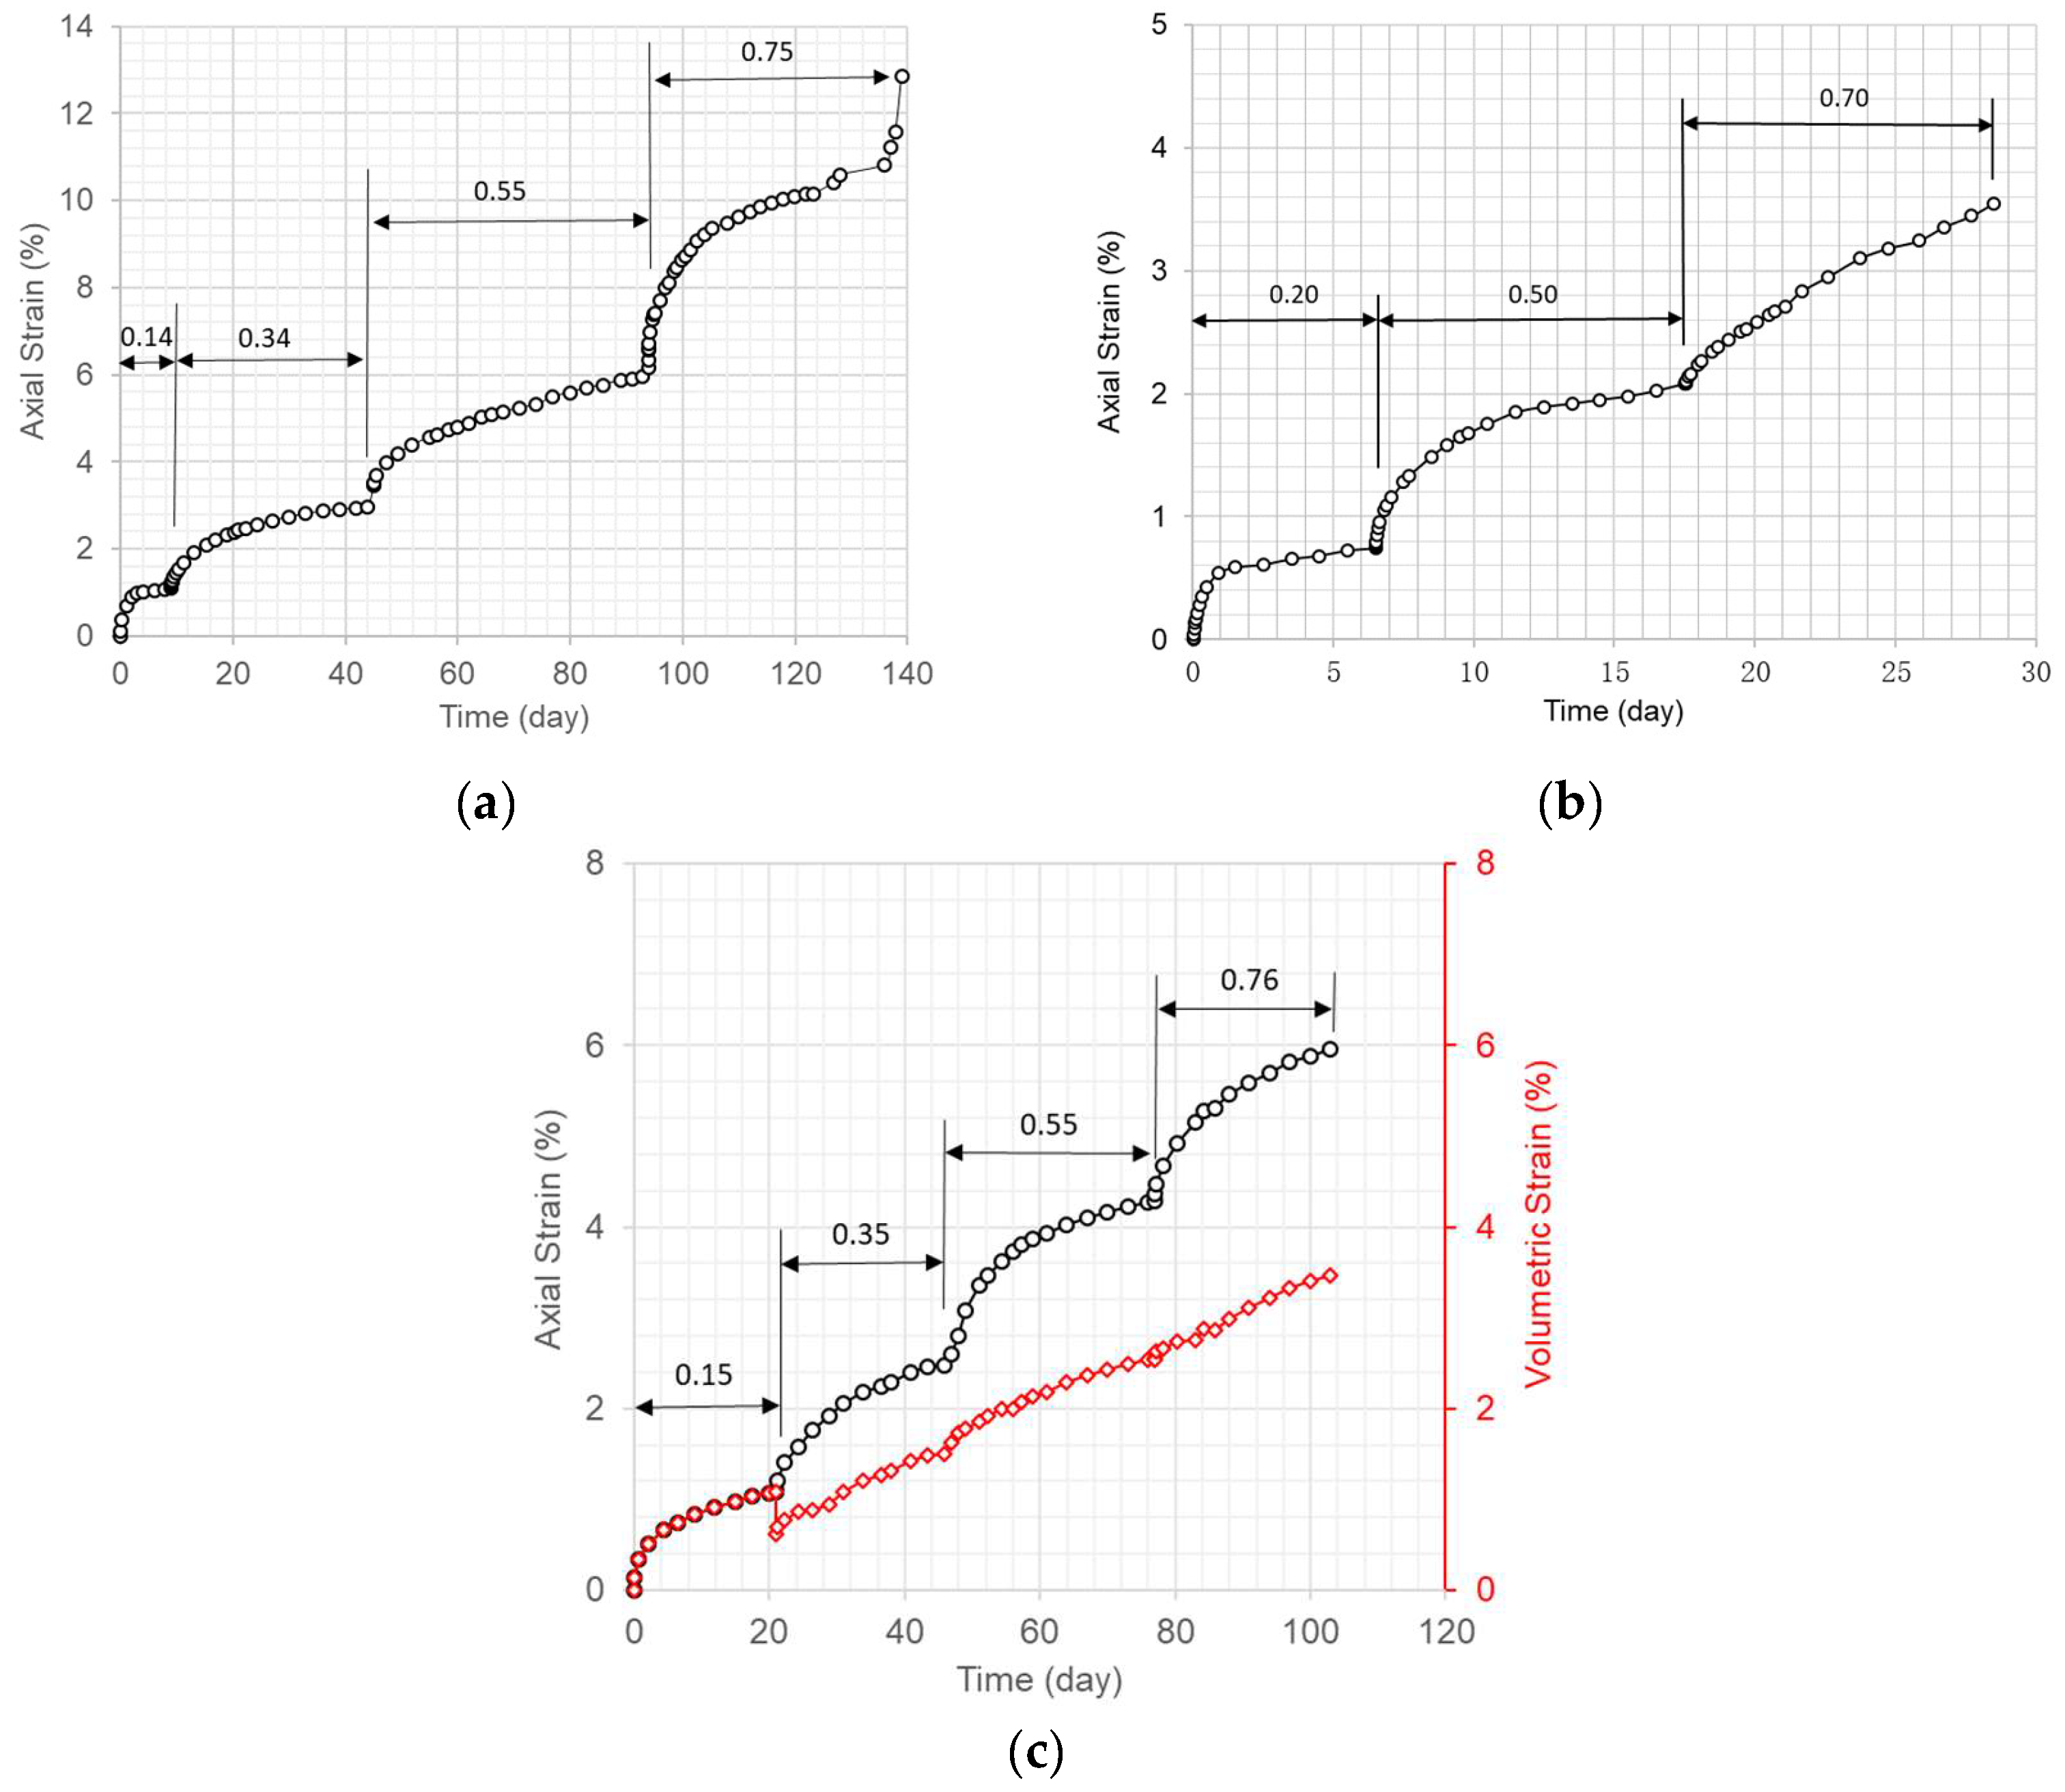
Figure 1.
Axial strain and volumetric strain versus time for dam core specimens under various radially confining stress levels and at 5 °C with a stepwise increase in axial stress (unit: MPa). (a) Confining stress of 0.5 MPa. (b) Confining stress of 0.8 MPa. (c) Confining stress of 1.0 MPa.

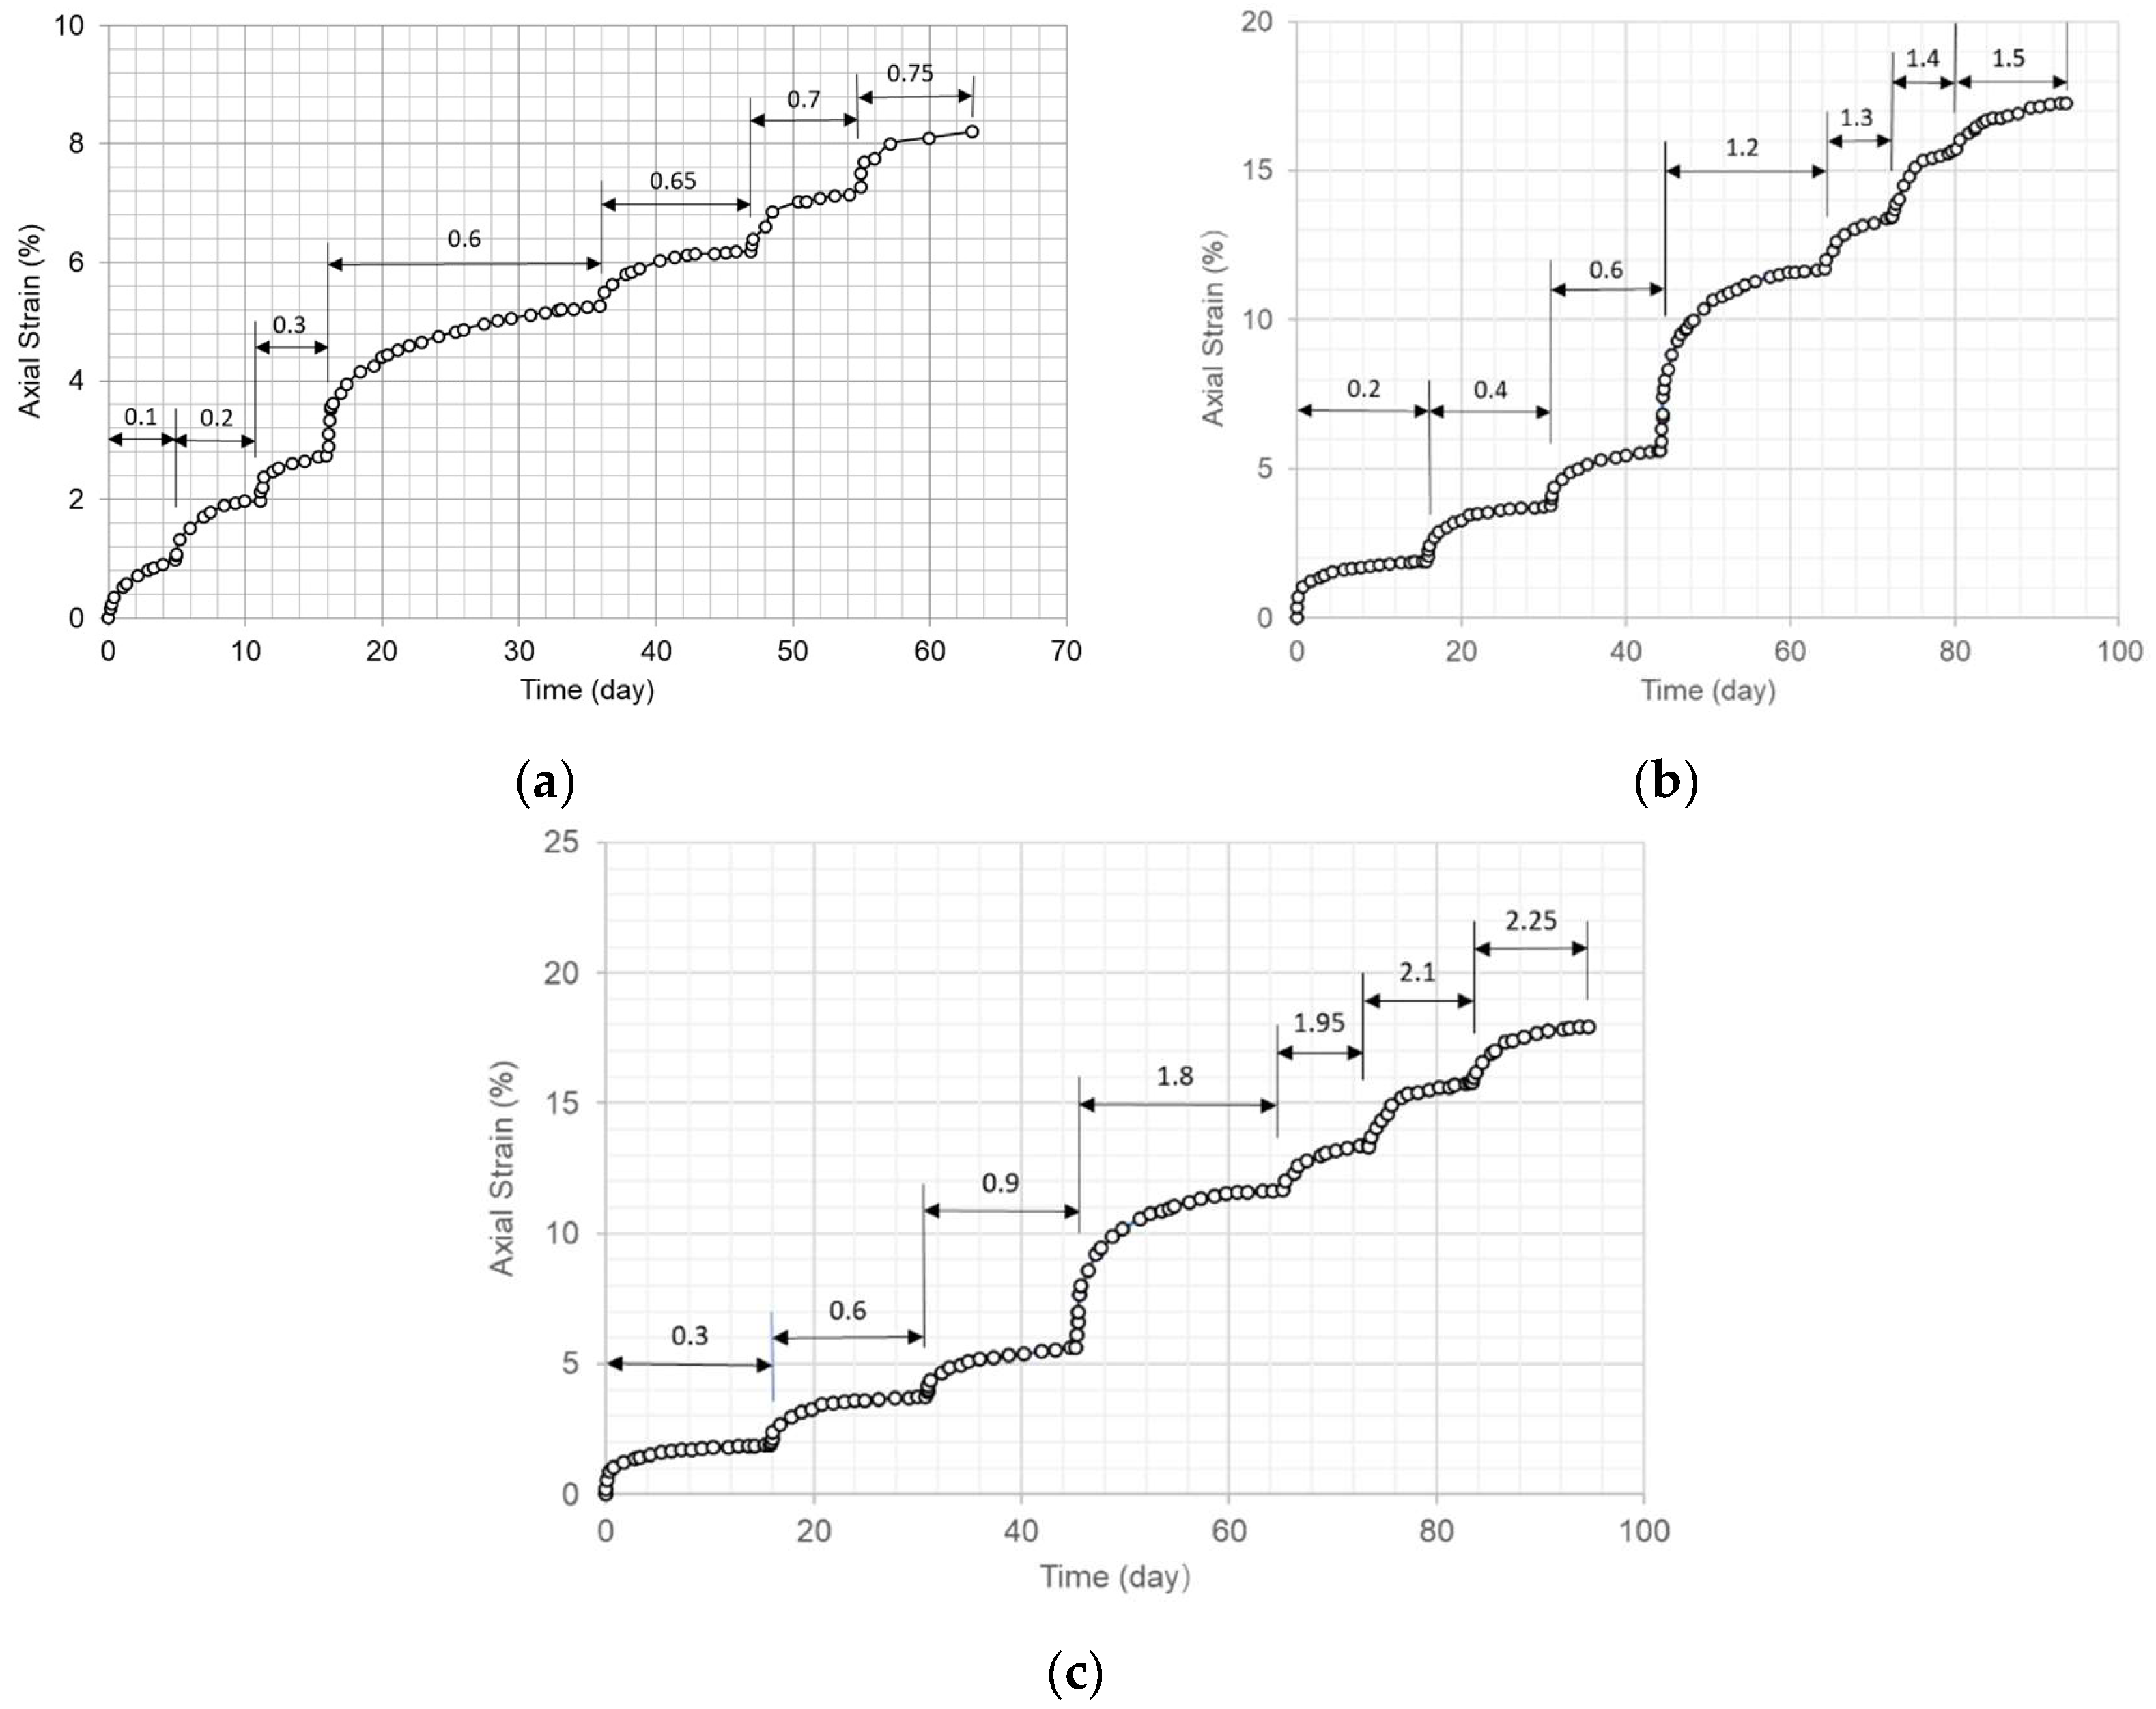
Figure 2.
Axial strain versus time for dam core specimens under various radially confining stress levels and at 15 °C with a stepwise increase in axial stress (unit: MPa). (a) Confining stress of 0.5 MPa. (b) Confining stress of 1.0 MPa [13]. (c) Confining stress of 1.5 MPa.

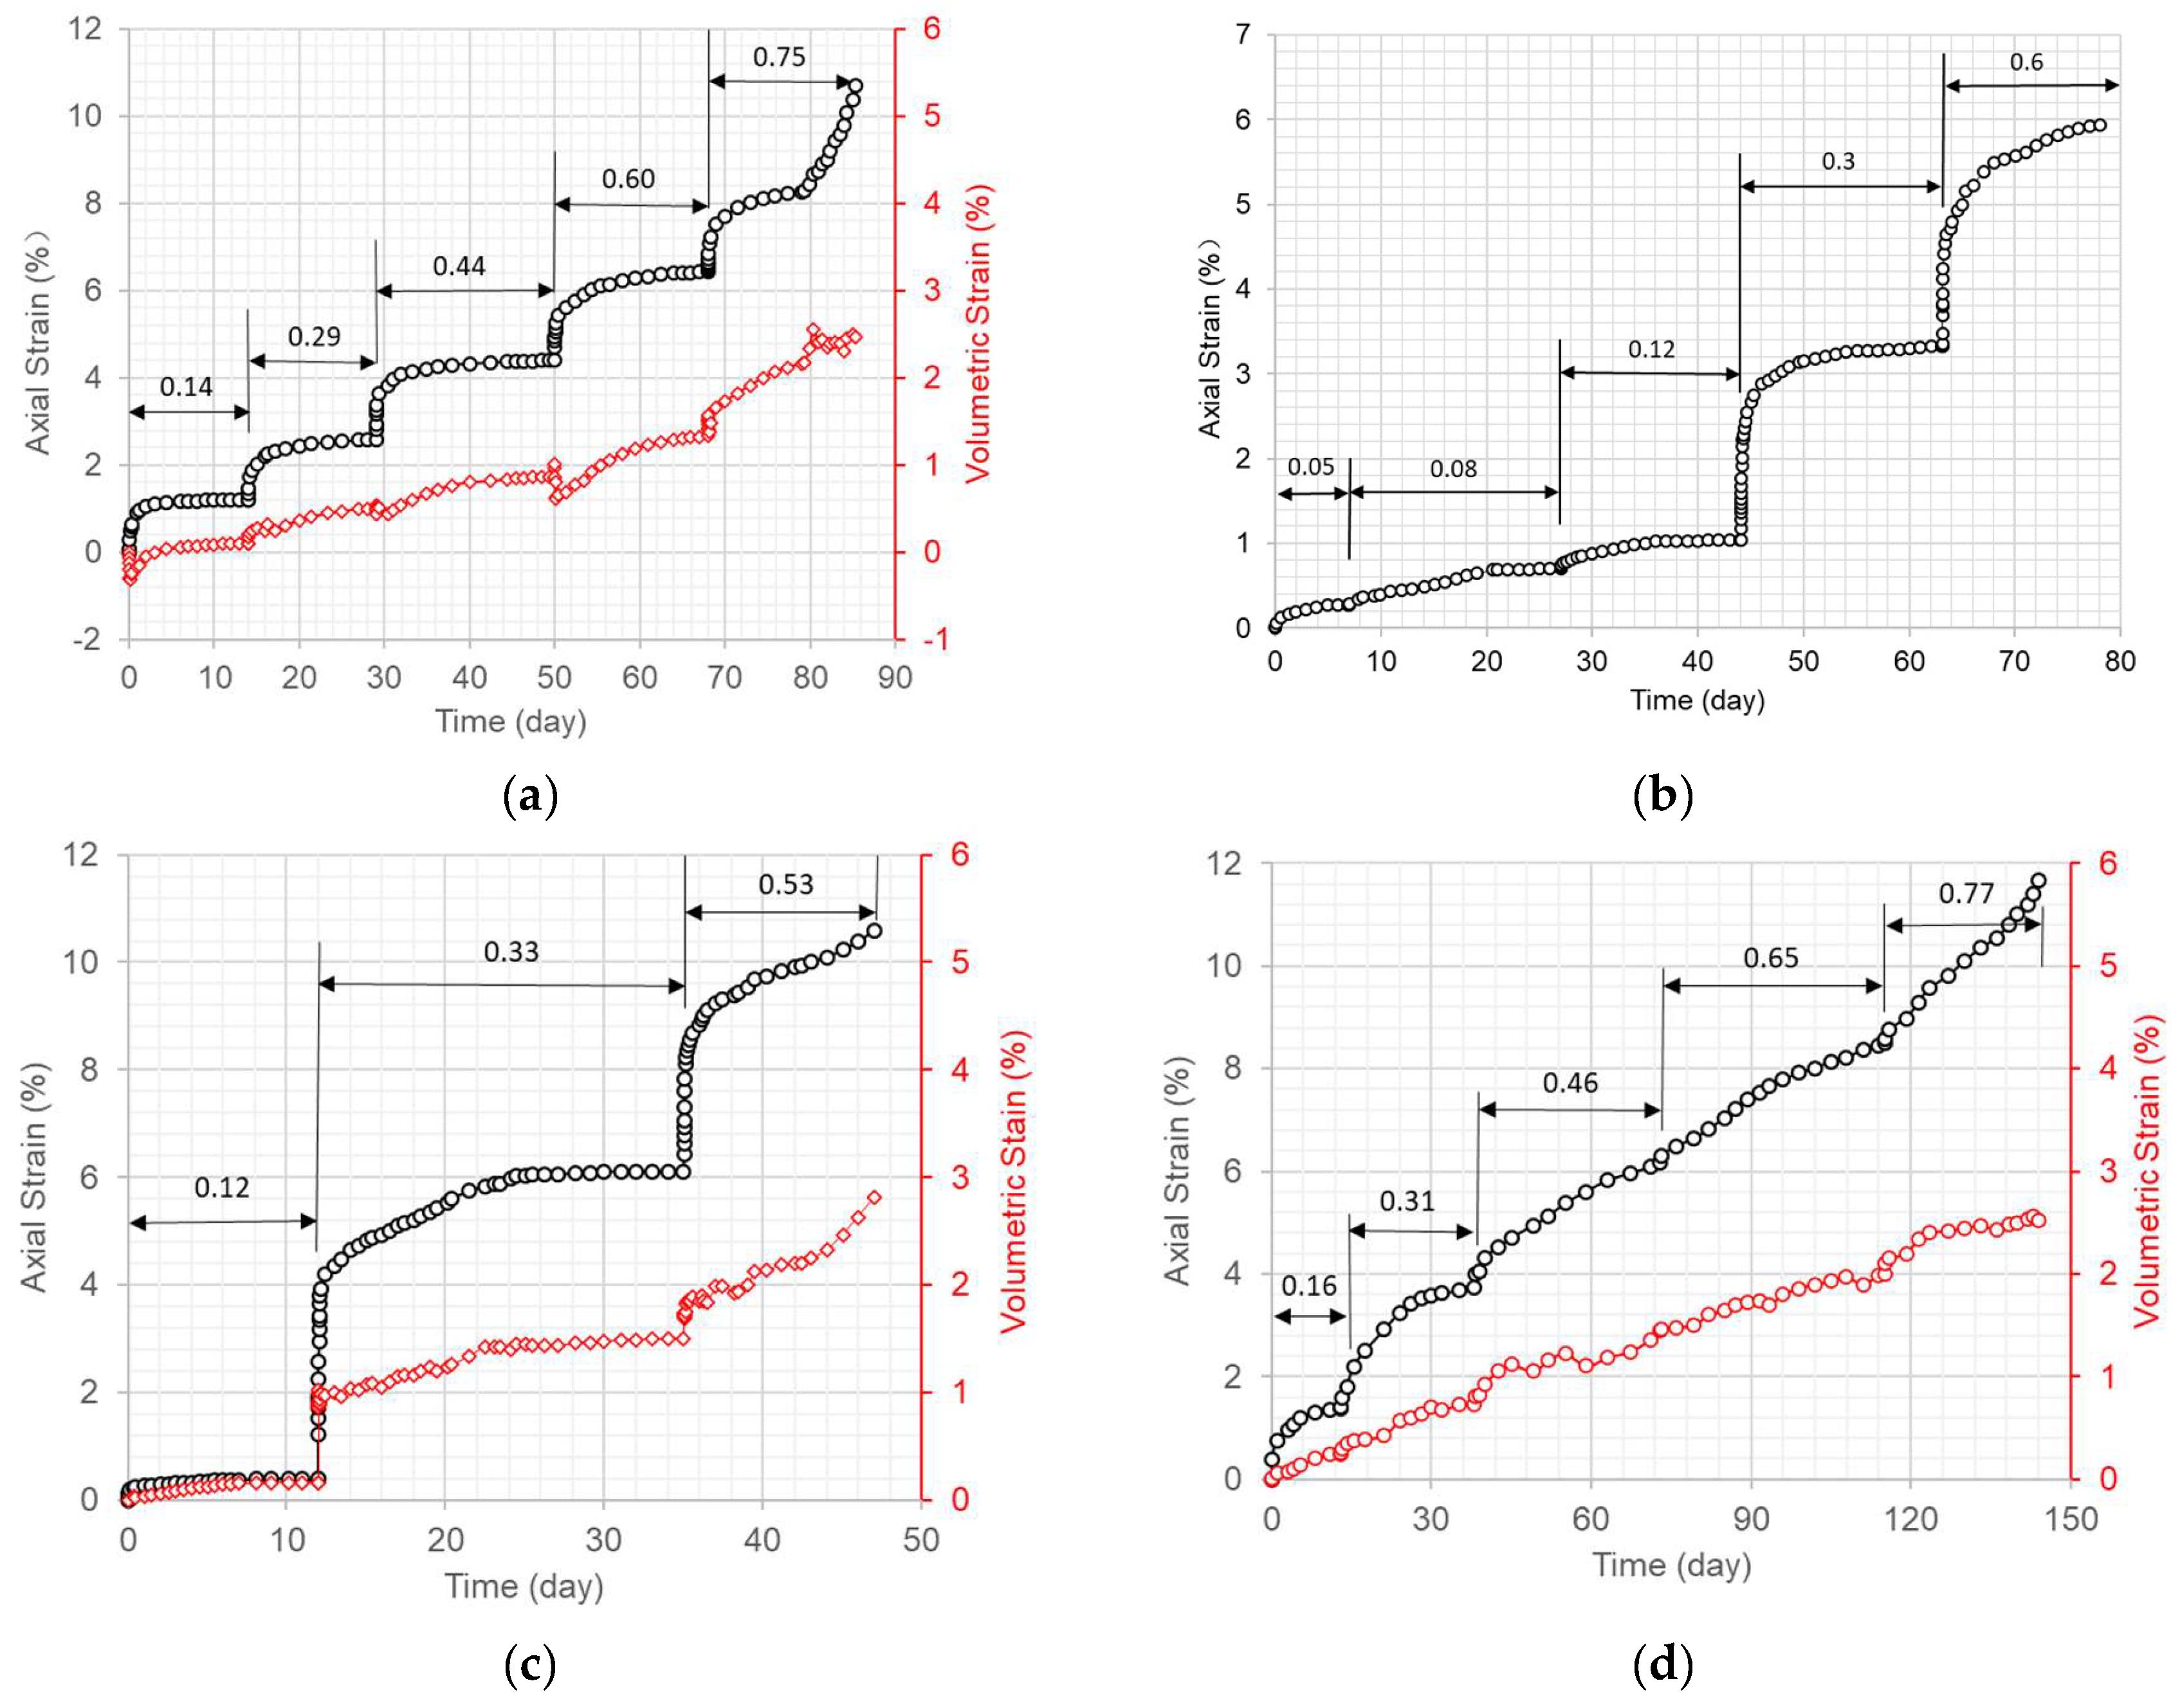
Figure 3.
Axial strain and volumetric strain versus time for dam core specimens under various radially confining stress levels and at 20 °C with a stepwise increase in axial stress (unit: MPa). (a) Confining stress of 0.5 MPa. (b) Confining stress of 0.8 MPa. (c) Confining stress of 1.0 MPa. (d) Confining stress of 1.5 MPa.
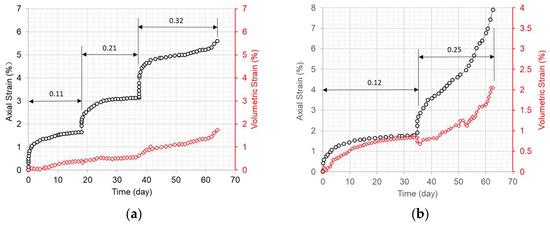
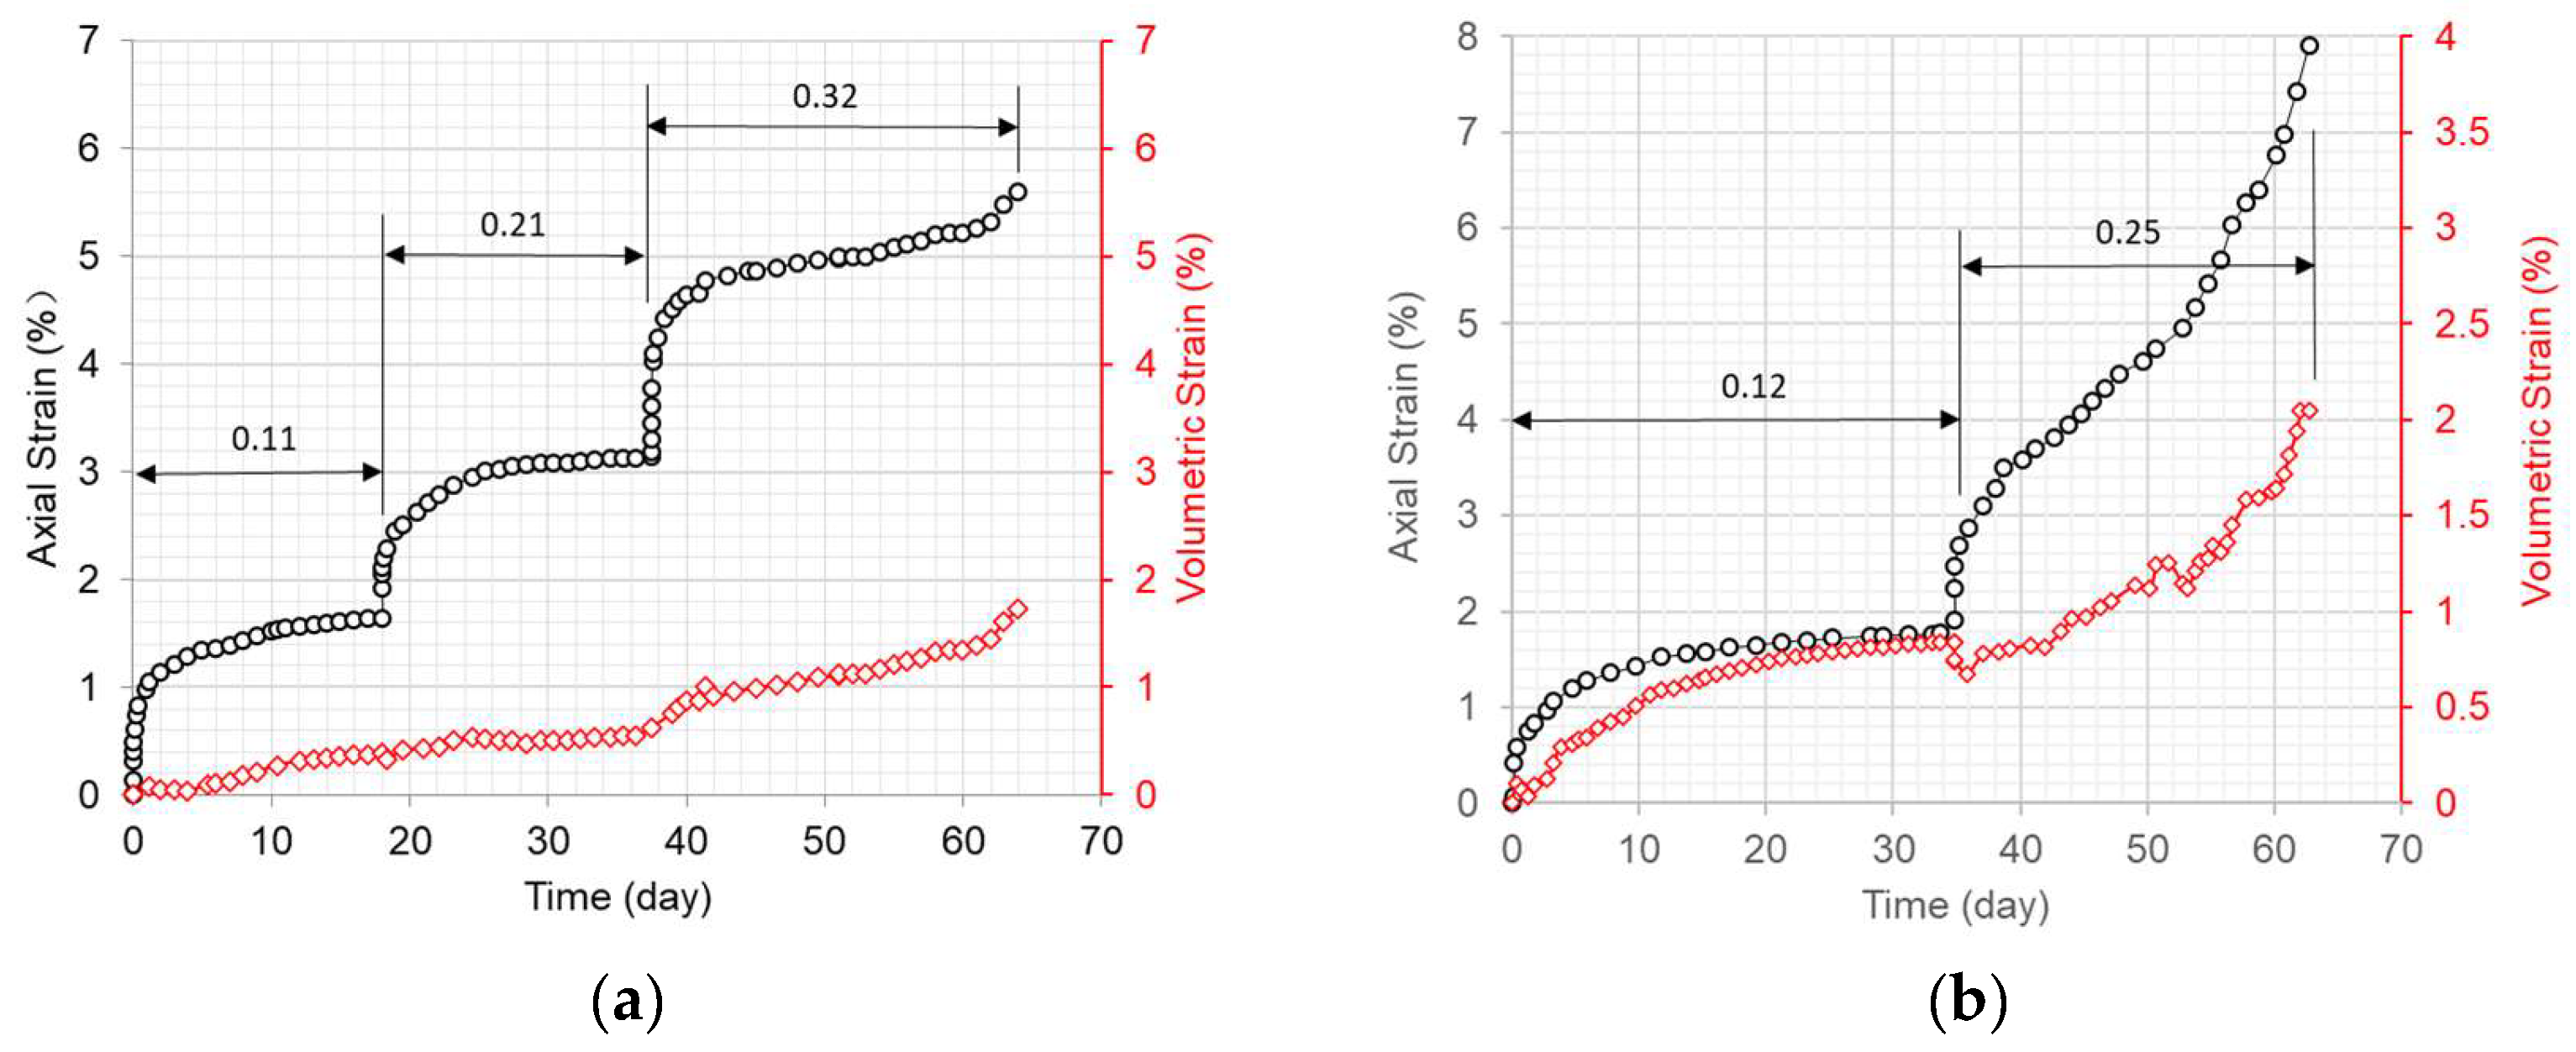
Figure 4.
Axial strain and volumetric strain versus time for dam core specimens under various radially confining stress levels and at 25 °C with a stepwise increase in axial stress (unit: MPa). (a) Confining stress of 0.5 MPa. (b) Confining stress of 1.0 MPa.

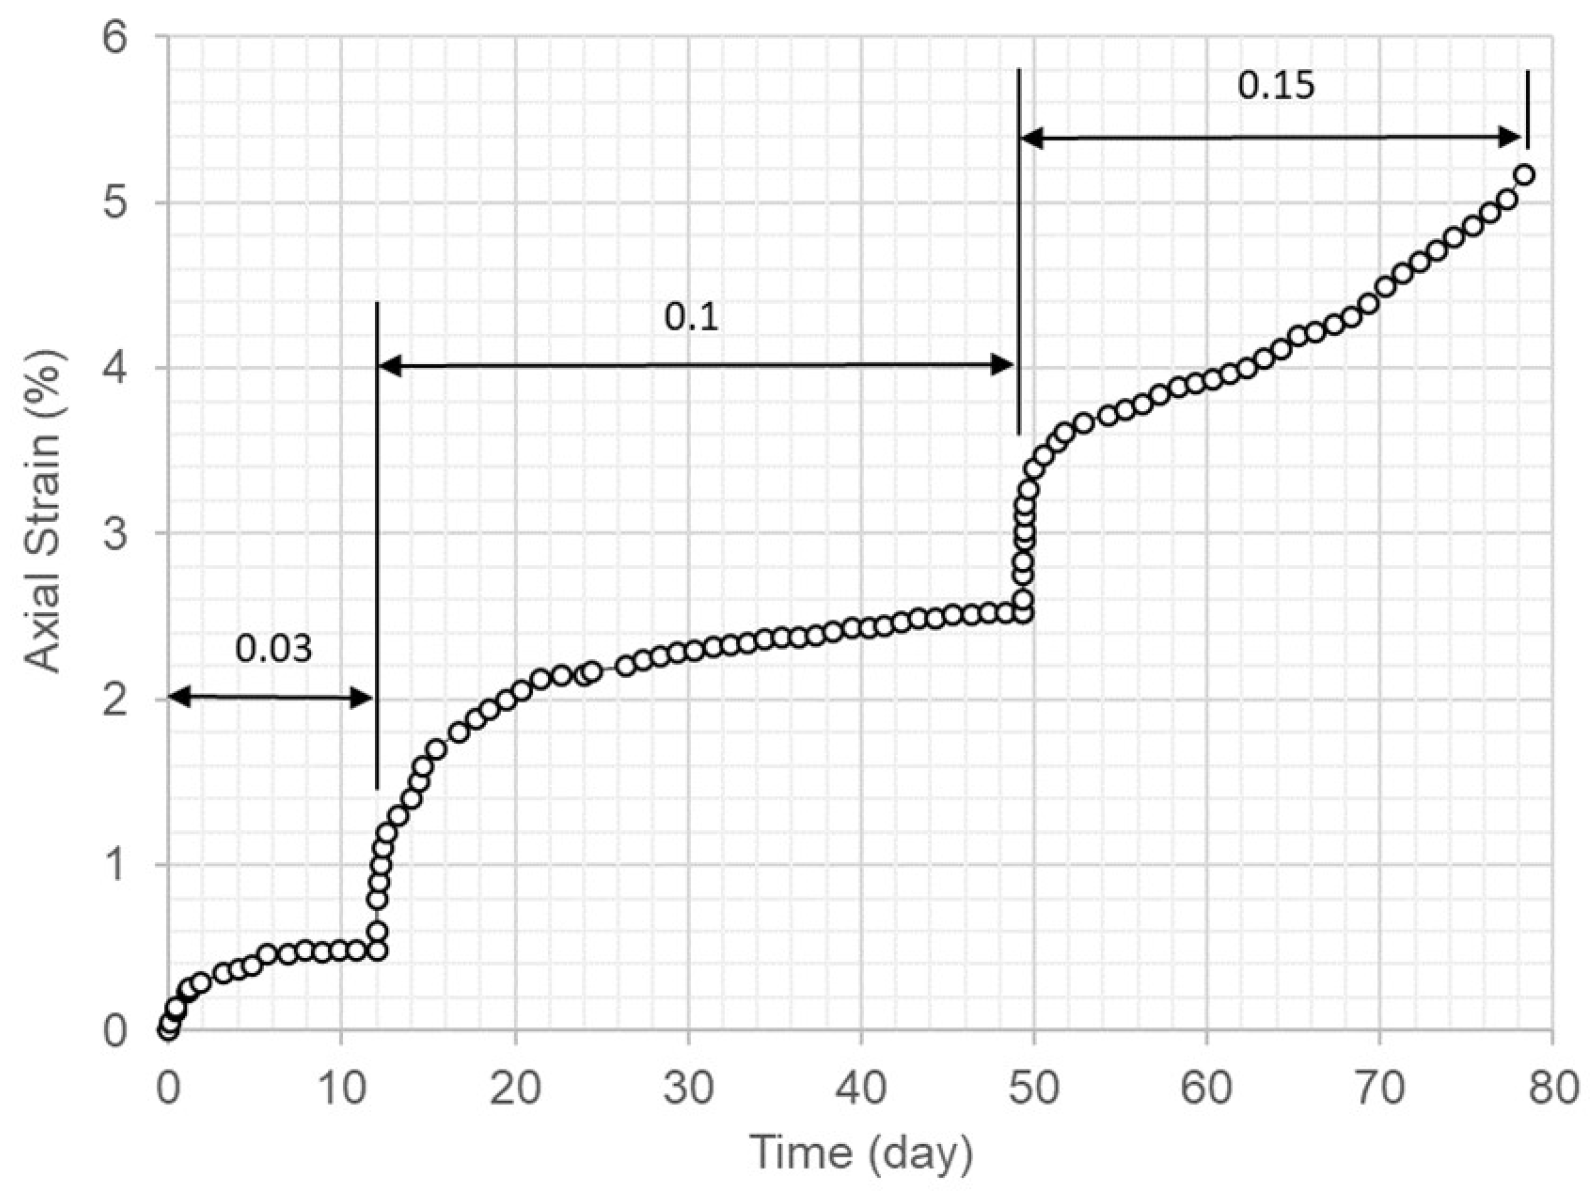
Figure 5.
Axial strain versus time for dam core specimens under a radially confining stress level of 0.8 MPa and at 30 °C with a stepwise increase in axial stress (unit, MPa).
Figure 1, Figure 2, Figure 3, Figure 4 and Figure 5 indicate that the strain due to axial creep increasingly approached a constant value over time at low levels of deviator stress. When the deviator stress level was increased to a high value, the axial stain continued to increase until the strain started to accelerate and the specimen failed.
Figure 1c, Figure 3a,c,d and Figure 4 show that the volumetric strain responded with time in a similar way to the axial strain. All of the volumetric strains were compressive strains. A few tests (Figure 1c, Figure 3a and Figure 4b showed some instantaneous dilation in the volumetric strain due to the swift imposition of an increase in deviator stress during the tests.
4. Proposed Material Model and Analysis of the Test Results
4.1. Viscoelastic Theory
The viscoelasticity of asphalt concrete has been widely modeled with the generalized Kelvin model [13,14,15]. The linear form of creep compliance can be expressed as a Prony series, as shown in Equation (1).
where Dg is the instantaneous compliance, Di and τi are the retardation strengths and retardation times, respectively, of the ith Kelvin element in the generalized model, and t is the time. In the generalized Kelvin model, only the independent spring element (D0) bears the stress after an infinite creep time (t = ∞). Therefore, the long-term compliance D0 can be expressed as follows:
where D0 is the long-term compliance.
For the long-term triaxial creep tests, the axial creep strain can be expressed as
where is the axial creep strain (%) and are the deviator stresses (MPa).
Equation (1) can be written as
where Eg is the instantaneous elastic modulus and Ei is the retardation modulus. The long-term compliance D0 can be expressed as
Ecs is defined as the long-term creep-stable modulus [1,10].
4.2. Analysis of the Test Results
The long-term triaxial creep test results for the dam core specimens were assumed to follow the generalized Kelvin model in the linear form of creep compliance. After using trial and error find the best fit of the test results with reasonable accuracies for a simplified equation, two Kelvin elements were taken for Equations (4) and (5), that is,
The viscoelastic parameters taken from the test results in Figure 1, Figure 2, Figure 3, Figure 4 and Figure 5 for the equations at different temperatures and loading conditions in each of the individual tests to find the best fit of the curves, as shown in Table 2. The long-term creep curves derived by using the model with the parameters in Table 2 were compared with the test curves, and they are shown in Figure 6, Figure 7, Figure 8, Figure 9 and Figure 10.
Table 2.
Viscoelastic parameters from the long-term triaxial creep test results at different temperatures and radially confining stress levels for each of the individual tests.

Figure 6.
Comparison of the long-term axial creep strain curves (solid line) using the material model and the test results for the dam core specimens under various radially confining stress levels and at 5 °C. (a) Confining stress of 0.5 MPa (refer to Figure 1a). (b) Confining stress of 0.8 MPa (refer to Figure 1b). (c) Confining stress of 1.0 MPa (refer to Figure 1c).

Figure 7.
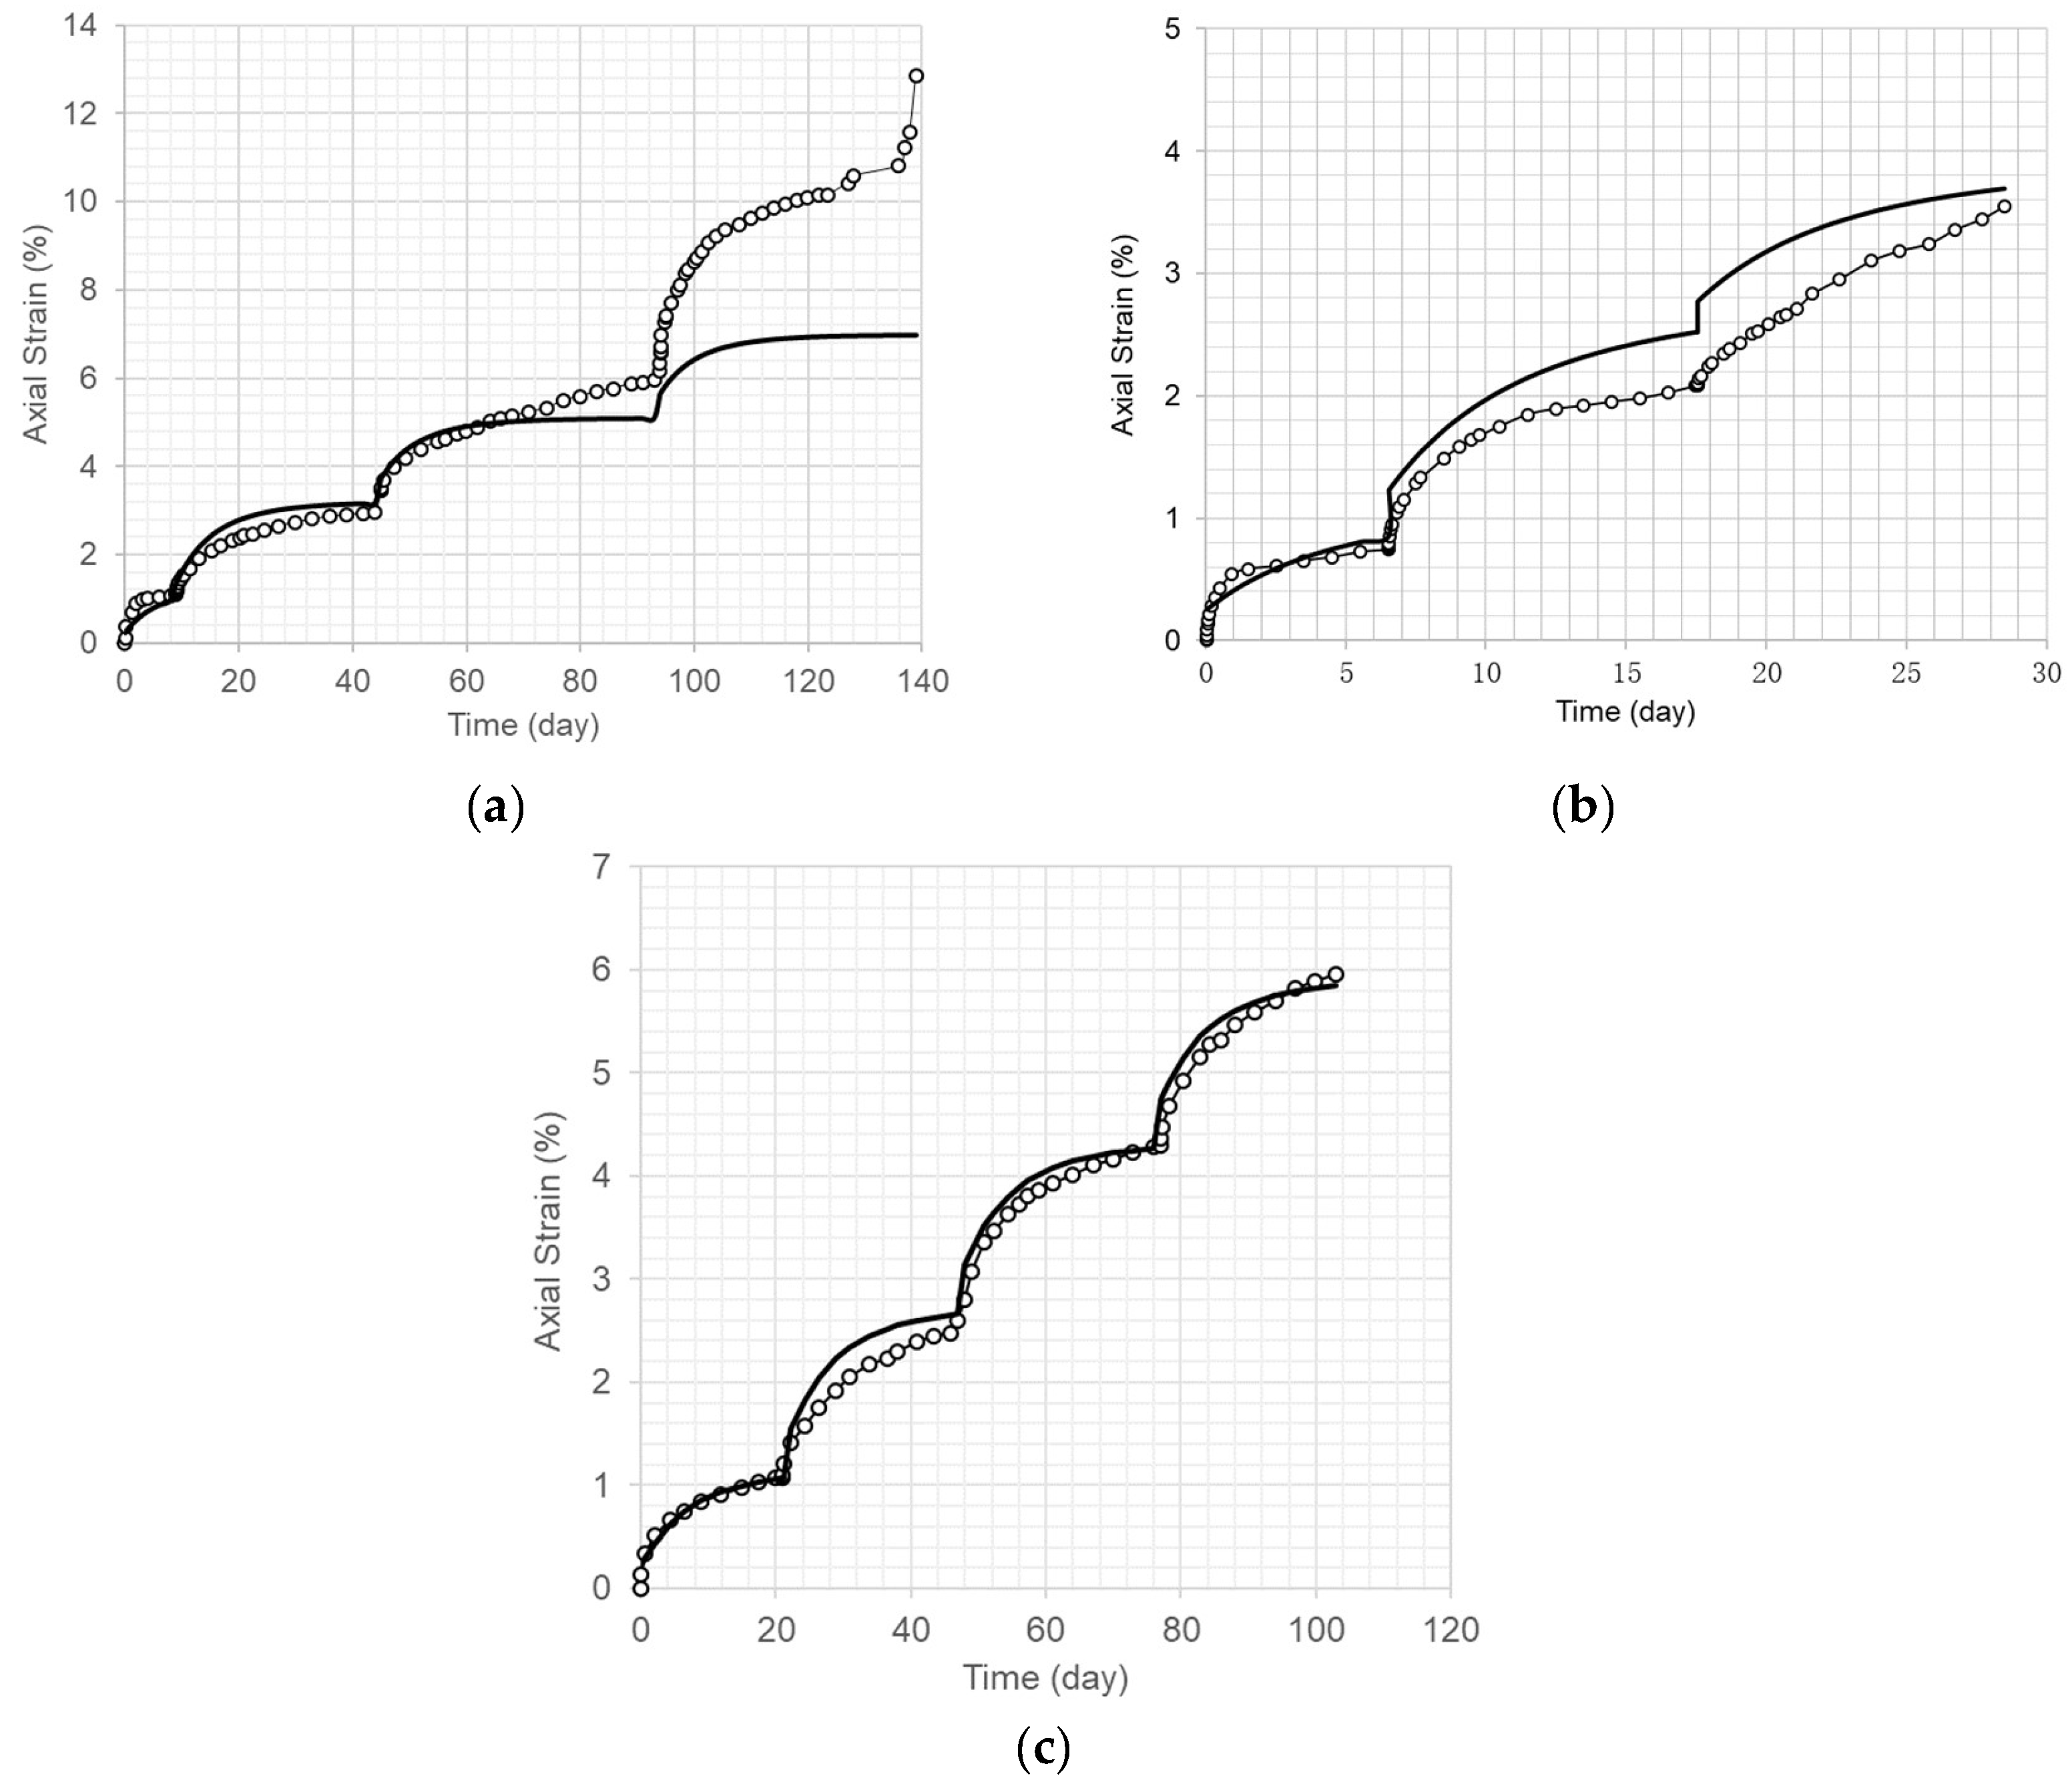
Comparison of the long-term axial creep strain curves (solid line) using the material model and the test results for dam core specimens under various radially confining stress levels and at 15 °C. (a) Confining stress of 0.5 MPa (refer to Figure 2a). (b) Confining stress of 1.0 MPa (refer to Figure 2b). (c) Confining stress of 1.5 MPa (refer to Figure 2c).

Figure 8.
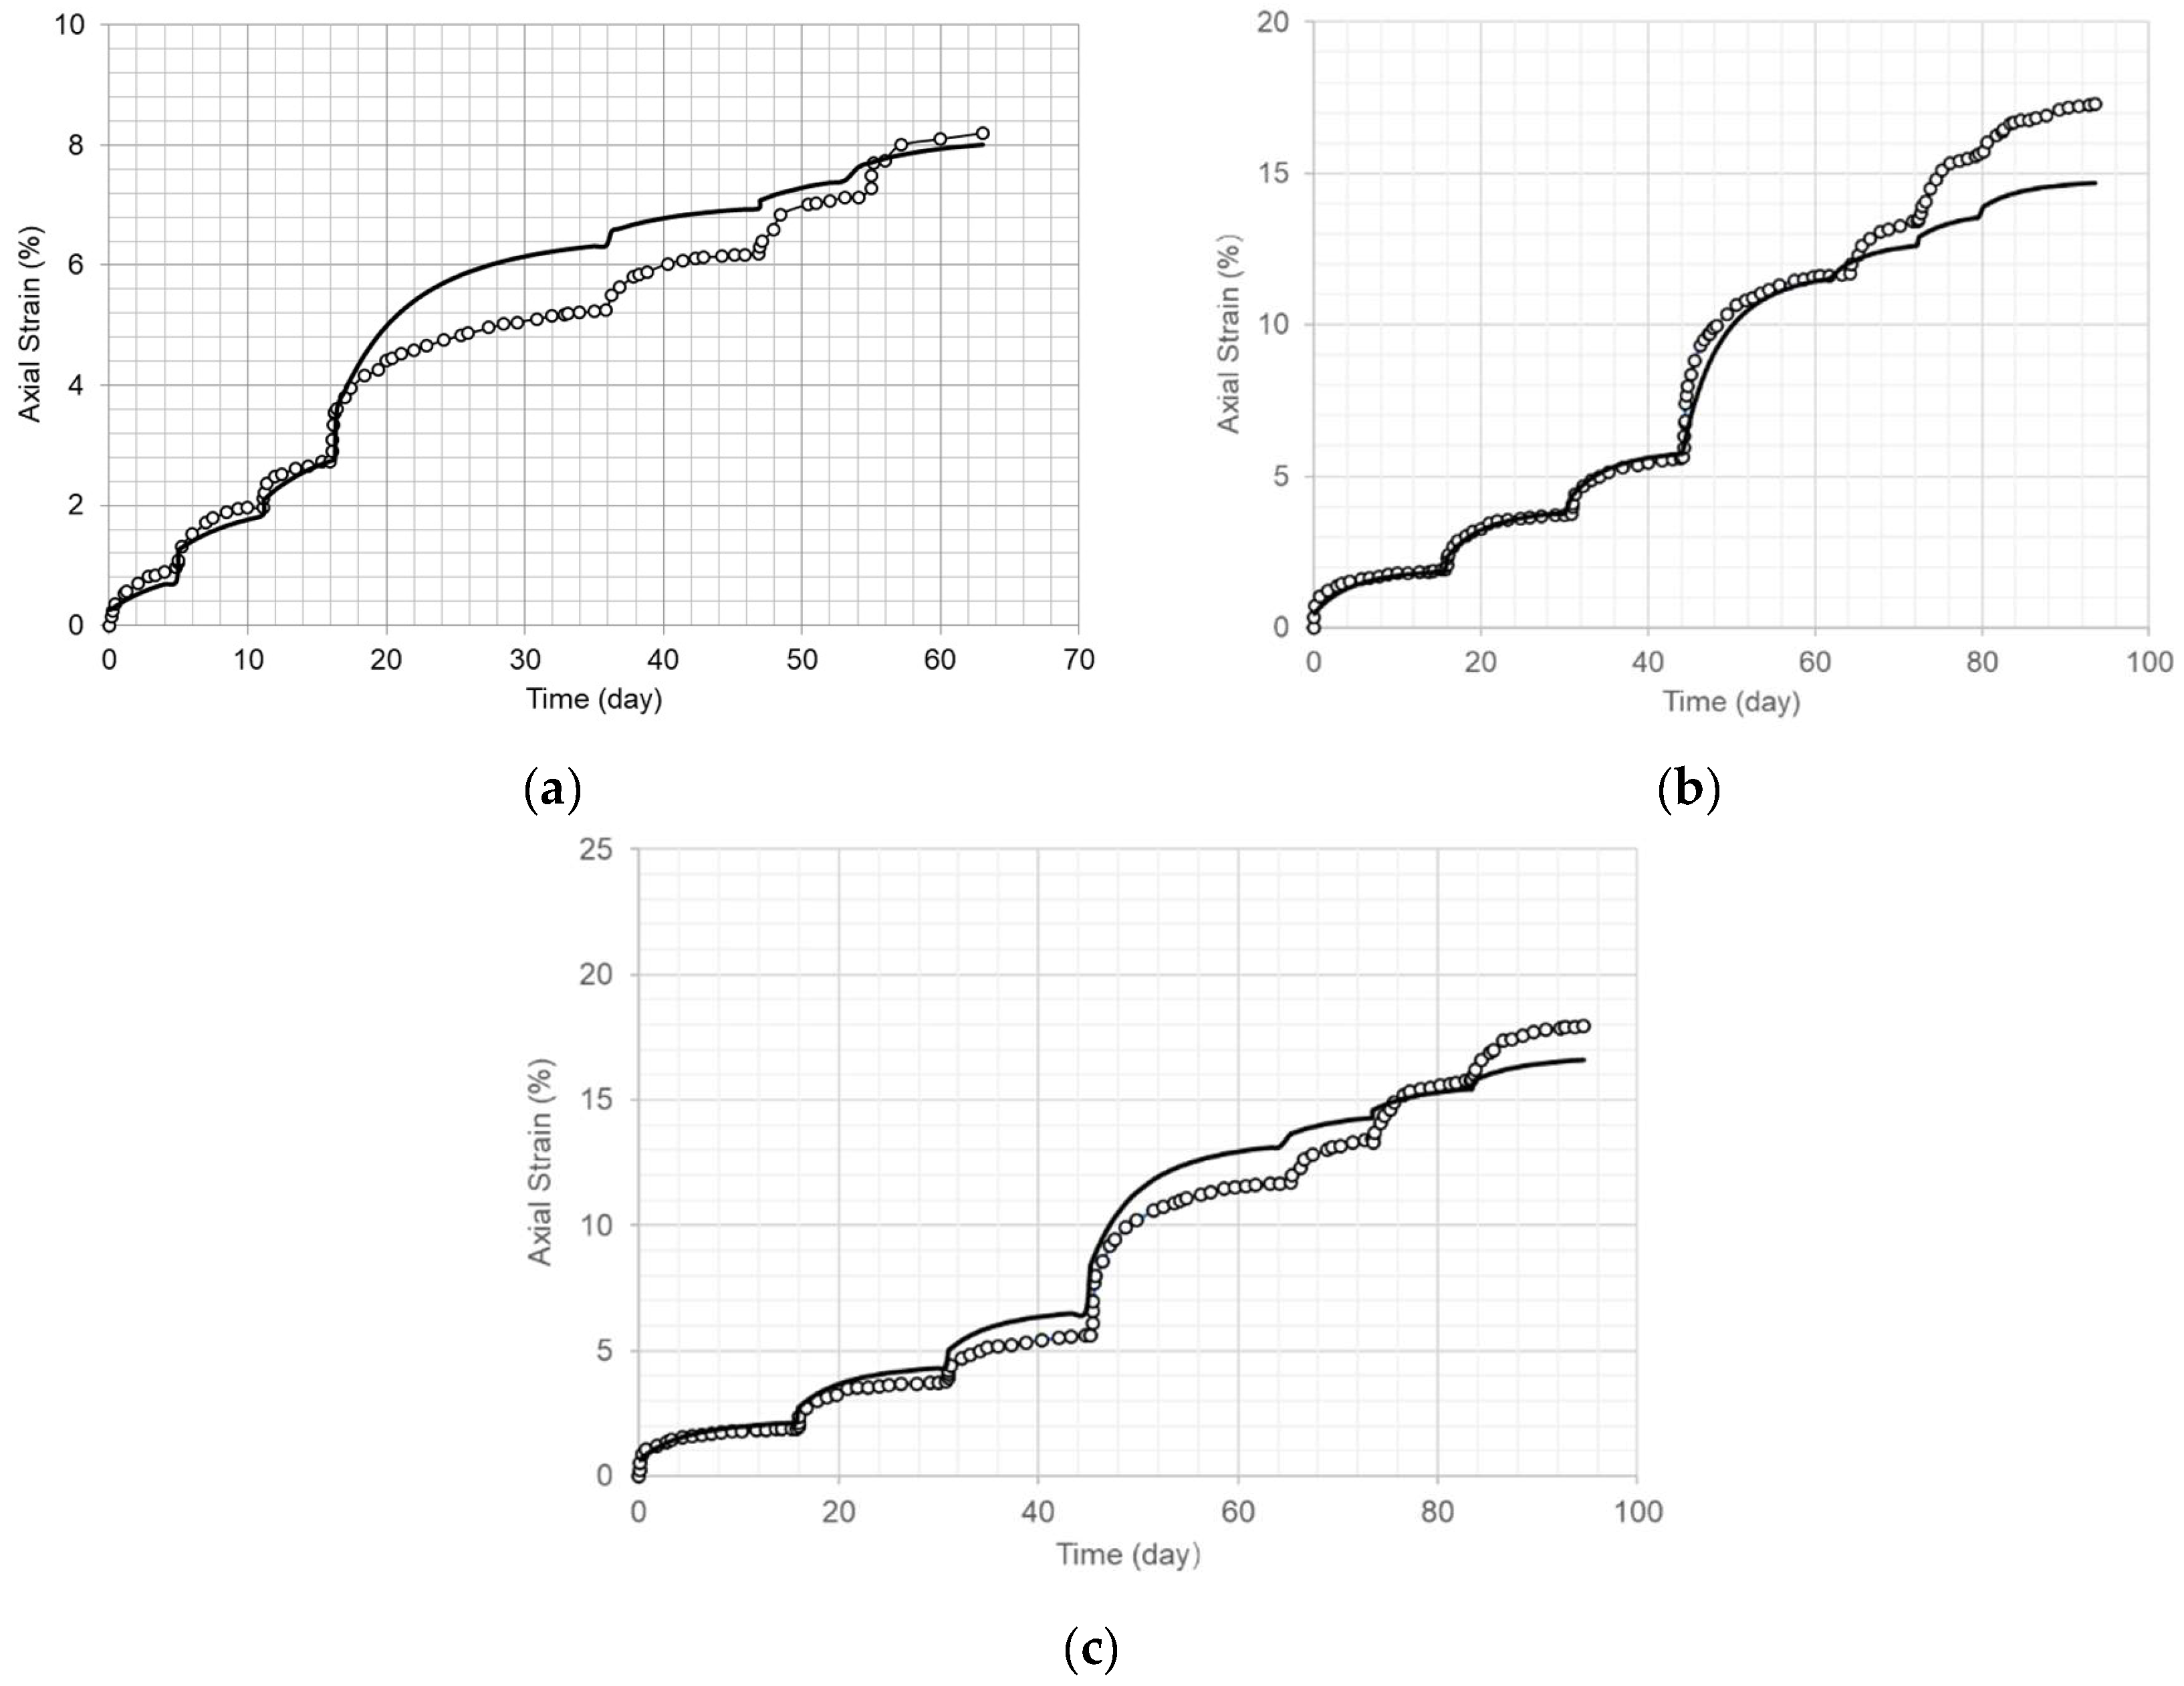
Comparison of the long-term axial creep strain curves (solid line) using the material model and the test results for dam core specimens under various radially confining stress levels and at 20 °C. (a) Confining stress of 0.5 MPa (refer to Figure 3a). (b) Confining stress of 0.8 MPa (refer to Figure 3b). (c) Confining stress of 1.0 MPa (refer to Figure 3c). (d) Confining stress of 1.5 MPa (refer to Figure 3d).
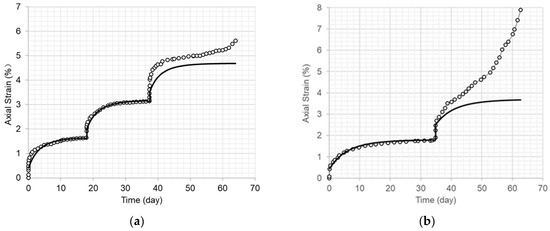
Figure 9.
Comparison of the long-term axial creep strain curves (solid line) using the material model and the test results for dam core specimens under various radially confining stress levels and at 25 °C. (a) Confining stress of 0.5 MPa (refer to Figure 4a). (b) Confining stress of 1.0 MPa (refer to Figure 4b).
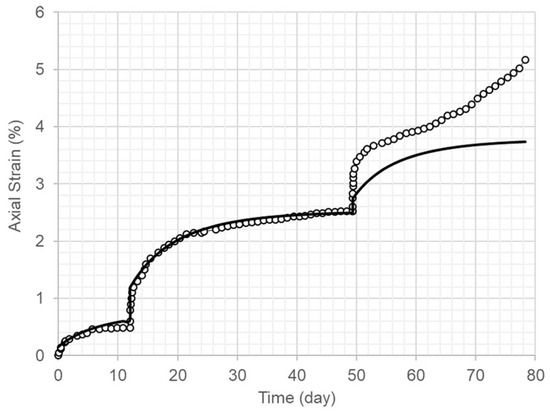
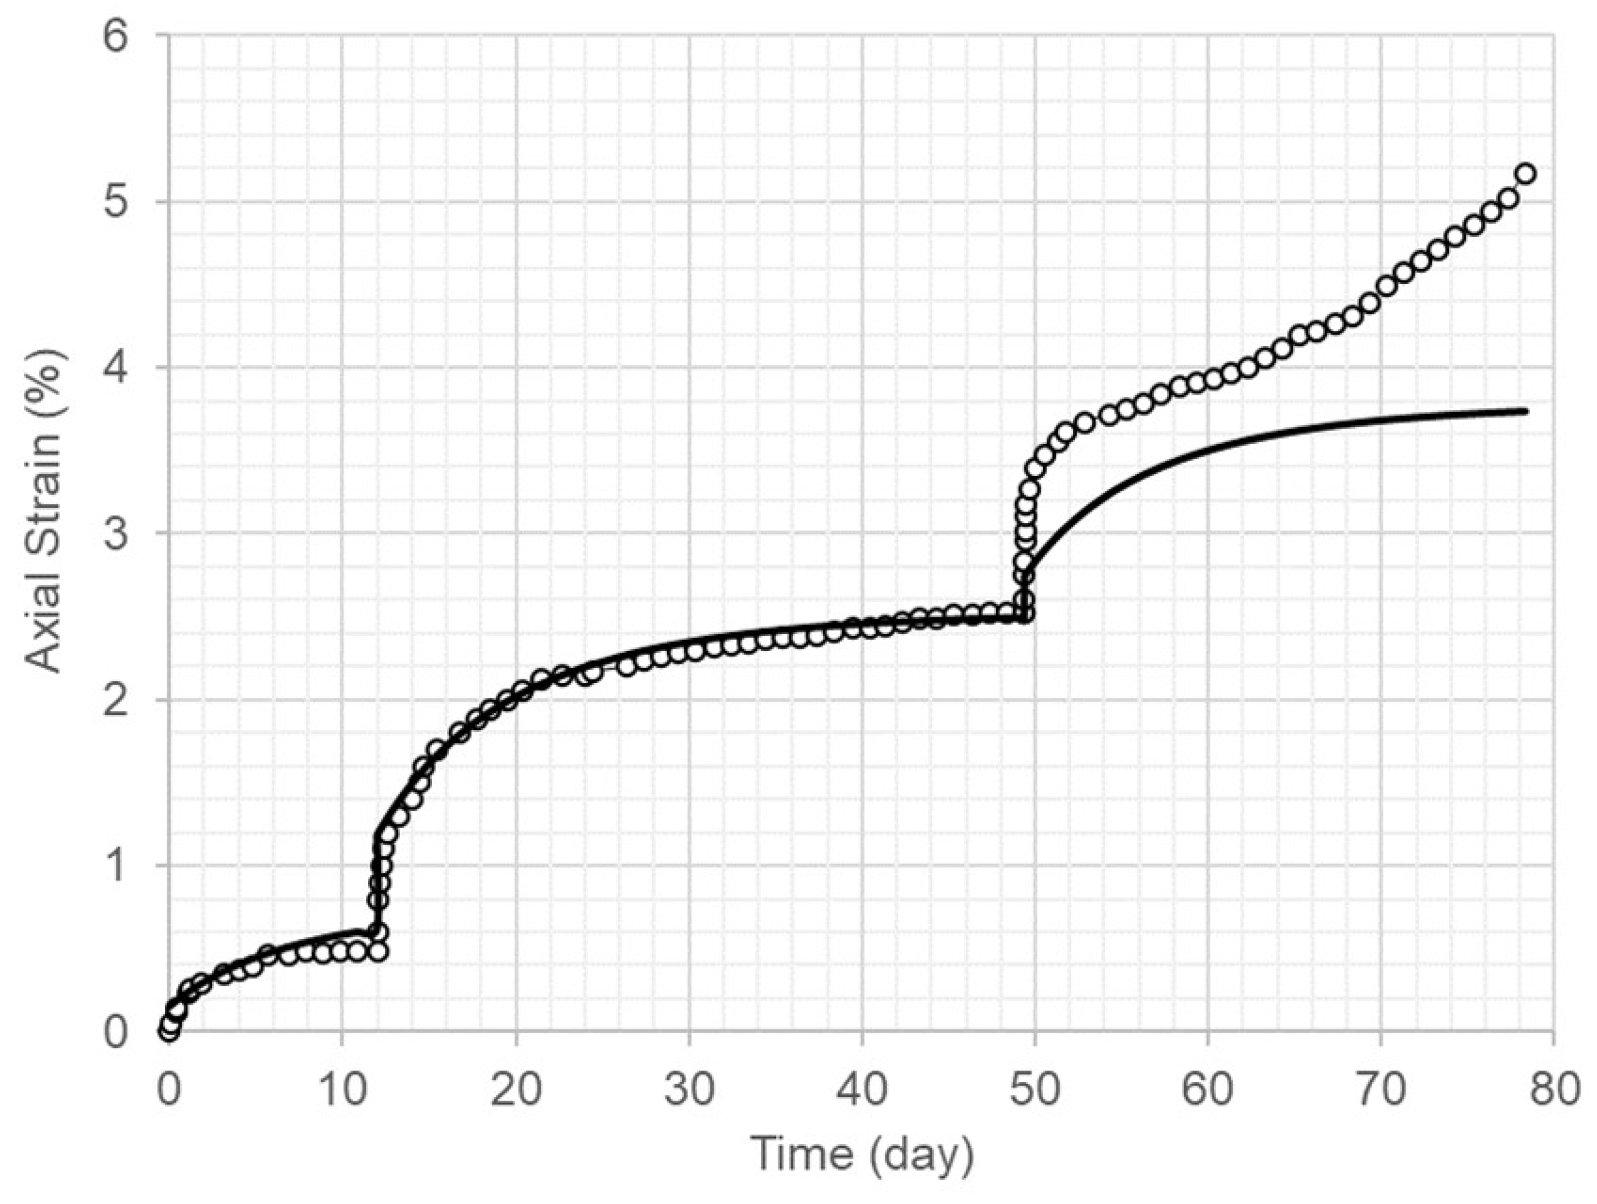
Figure 10.
Comparison of the long-term axial creep strain curve (solid line) using the material model and the test results for dam core specimens under a radial stress level of 0.8 MPa and at 30 °C.
Figure 6, Figure 7, Figure 8, Figure 9 and Figure 10 indicate that the long-term axial creep strain curves derived from the model fit the test results well when the axial strain increased and approached a stable value.
Equations (6) and (7) are used for constant temperature conditions. When the viscoelastic parameters are considered as functions of temperature, the equations are expressed as follows:
The relationships of the viscoelastic parameters and temperature from Table 2 are shown in Figure 11 and Figure 12.
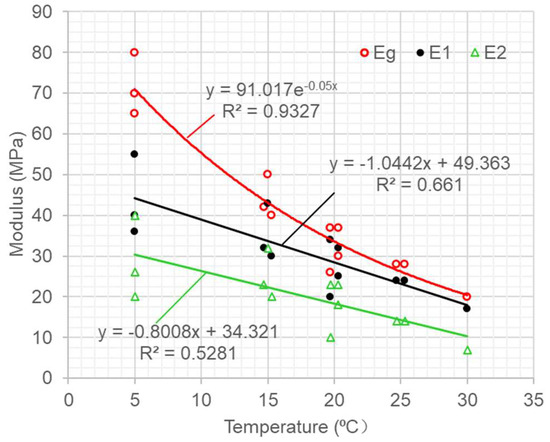
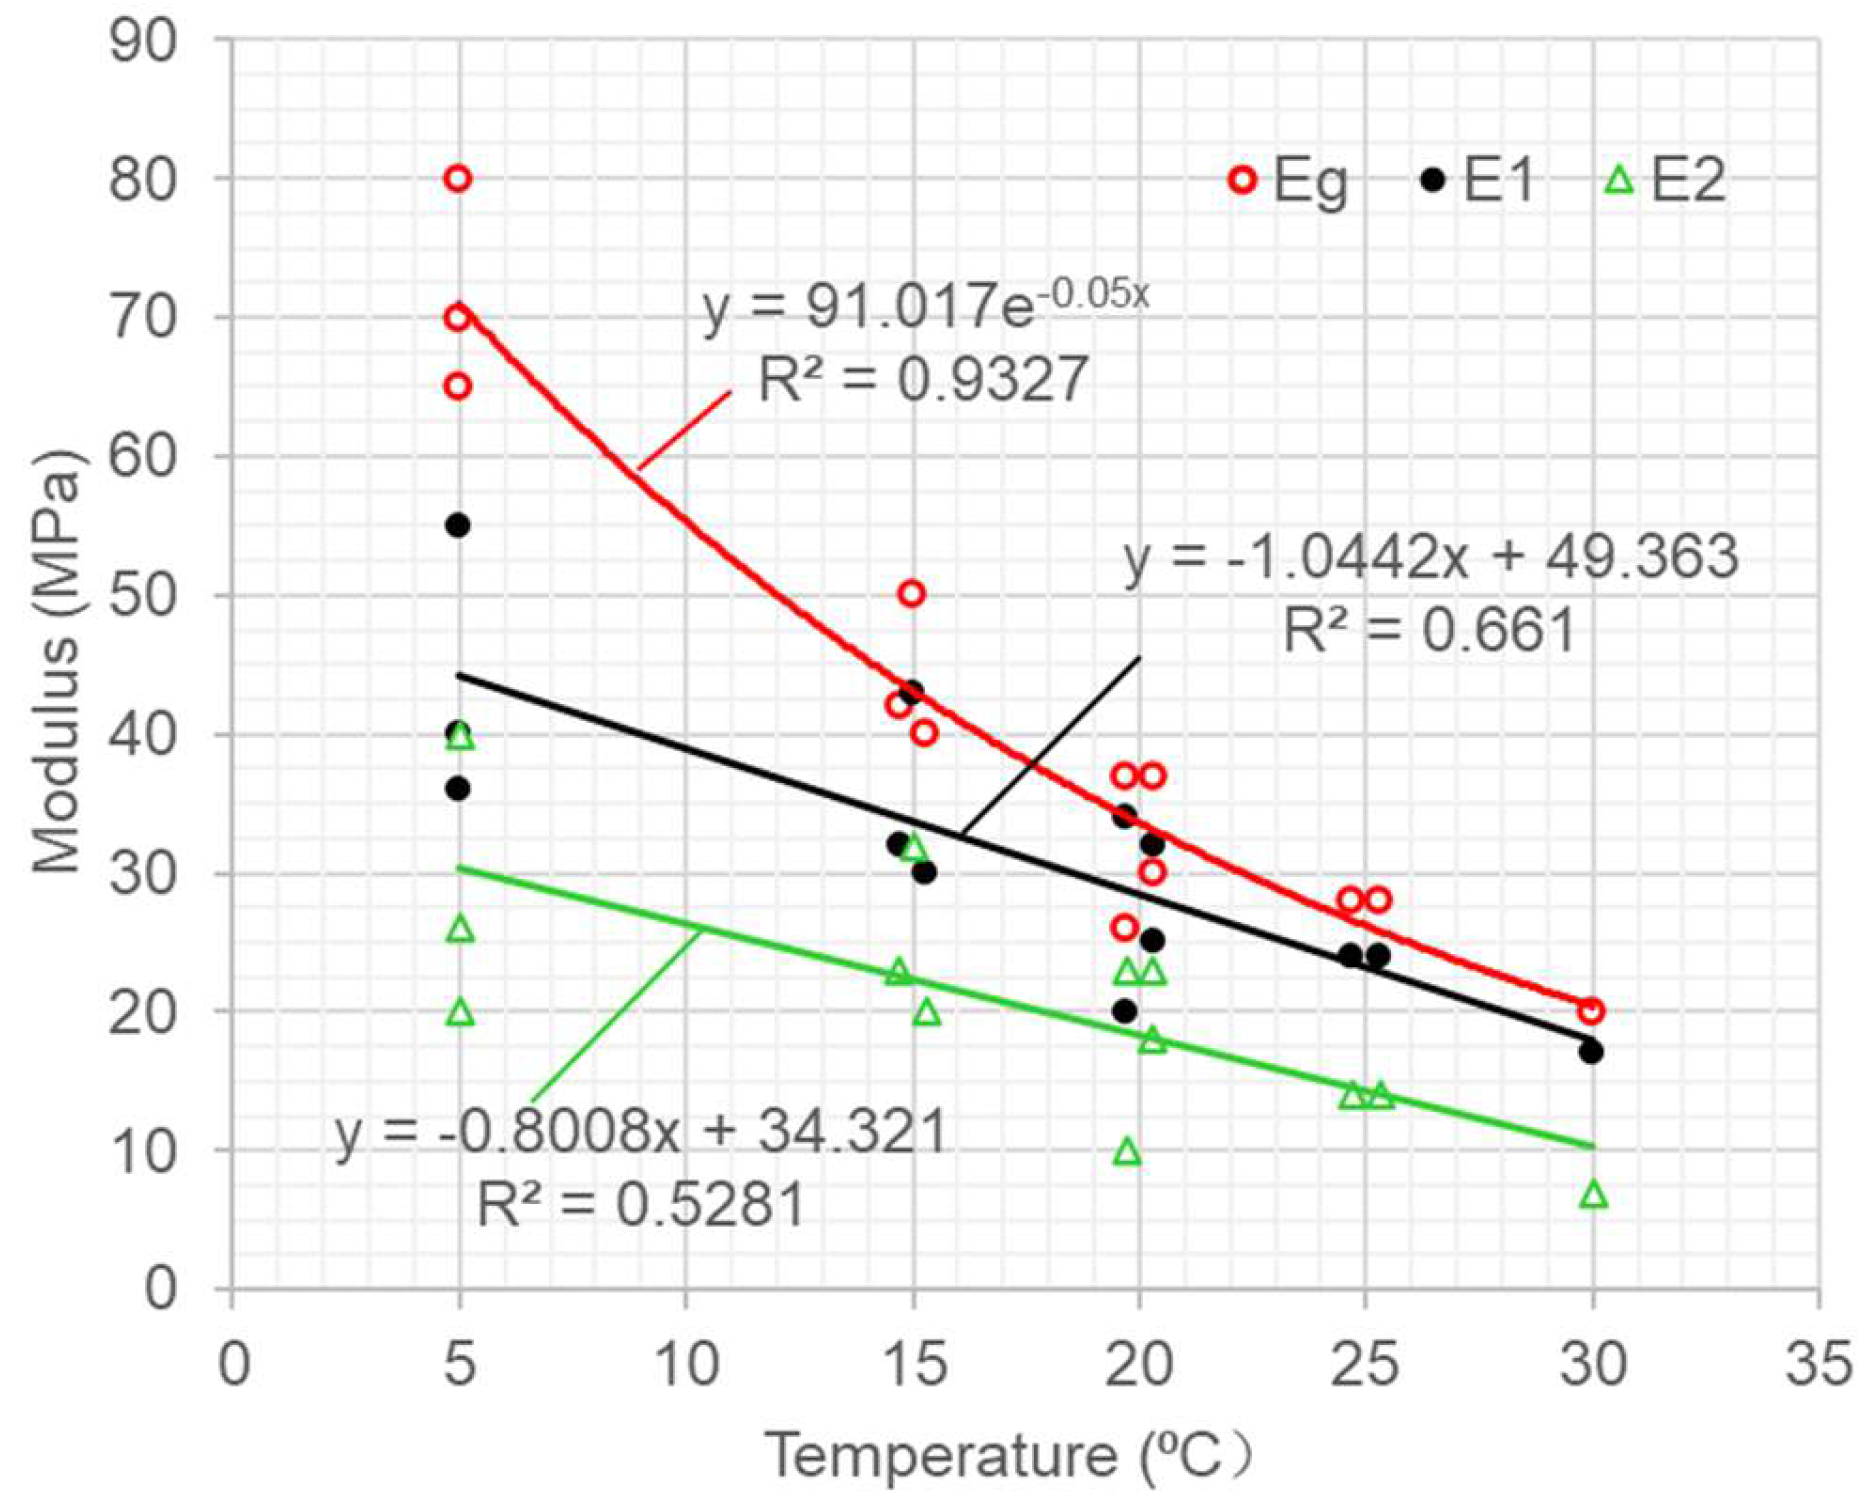
Figure 11.
Instantaneous elastic (red circle, Eg) and retardation moduli (black circle, E1; triangle, E2) versus temperature.
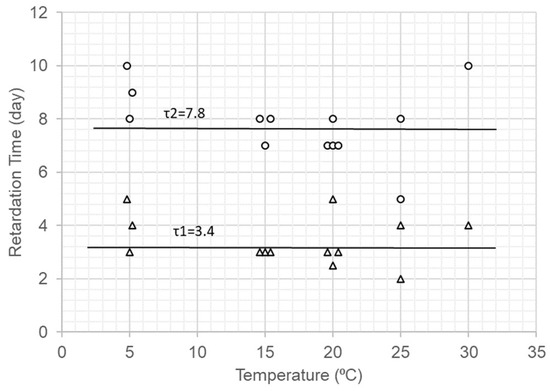
Figure 12.
Retardation times (triangle, τ1; black circle, τ2) versus temperature.
Figure 11 indicates that the moduli were reduced with the decrease in temperature. The instantaneous elastic modulus presented an exponential relationship with the temperature, while the retardation modulus presented a linear relationship with the temperature. The curves were scattered with data, especially for the retardation modulus curves, but the trends were clear. The asphalt specimens were drilled from the Quxue Dam and Laojiaoxi Dam cores, and there were unavoidable variations in the asphalt mixes, weather conditions, and compaction procedures during construction.
Figure 12 indicates that the temperature had insignificant effects on the retardation time. From the viscoelastic theory, the retardation time is equal to the coefficient of viscosity divided by the retardation modulus (). When the temperature is increased, the coefficient of viscosity is reduced, and the retardation modulus also decreases. This combination of the coefficient of viscosity and retardation modulus causes the retardation time to be constant with the temperature.
According to the viscoelastic theory and the analysis of the long-term triaxial creep test results, the functions comprising the material stress–strain–time–temperature creep model (SSTTC model) are the following:
Equation (9) can be expressed as
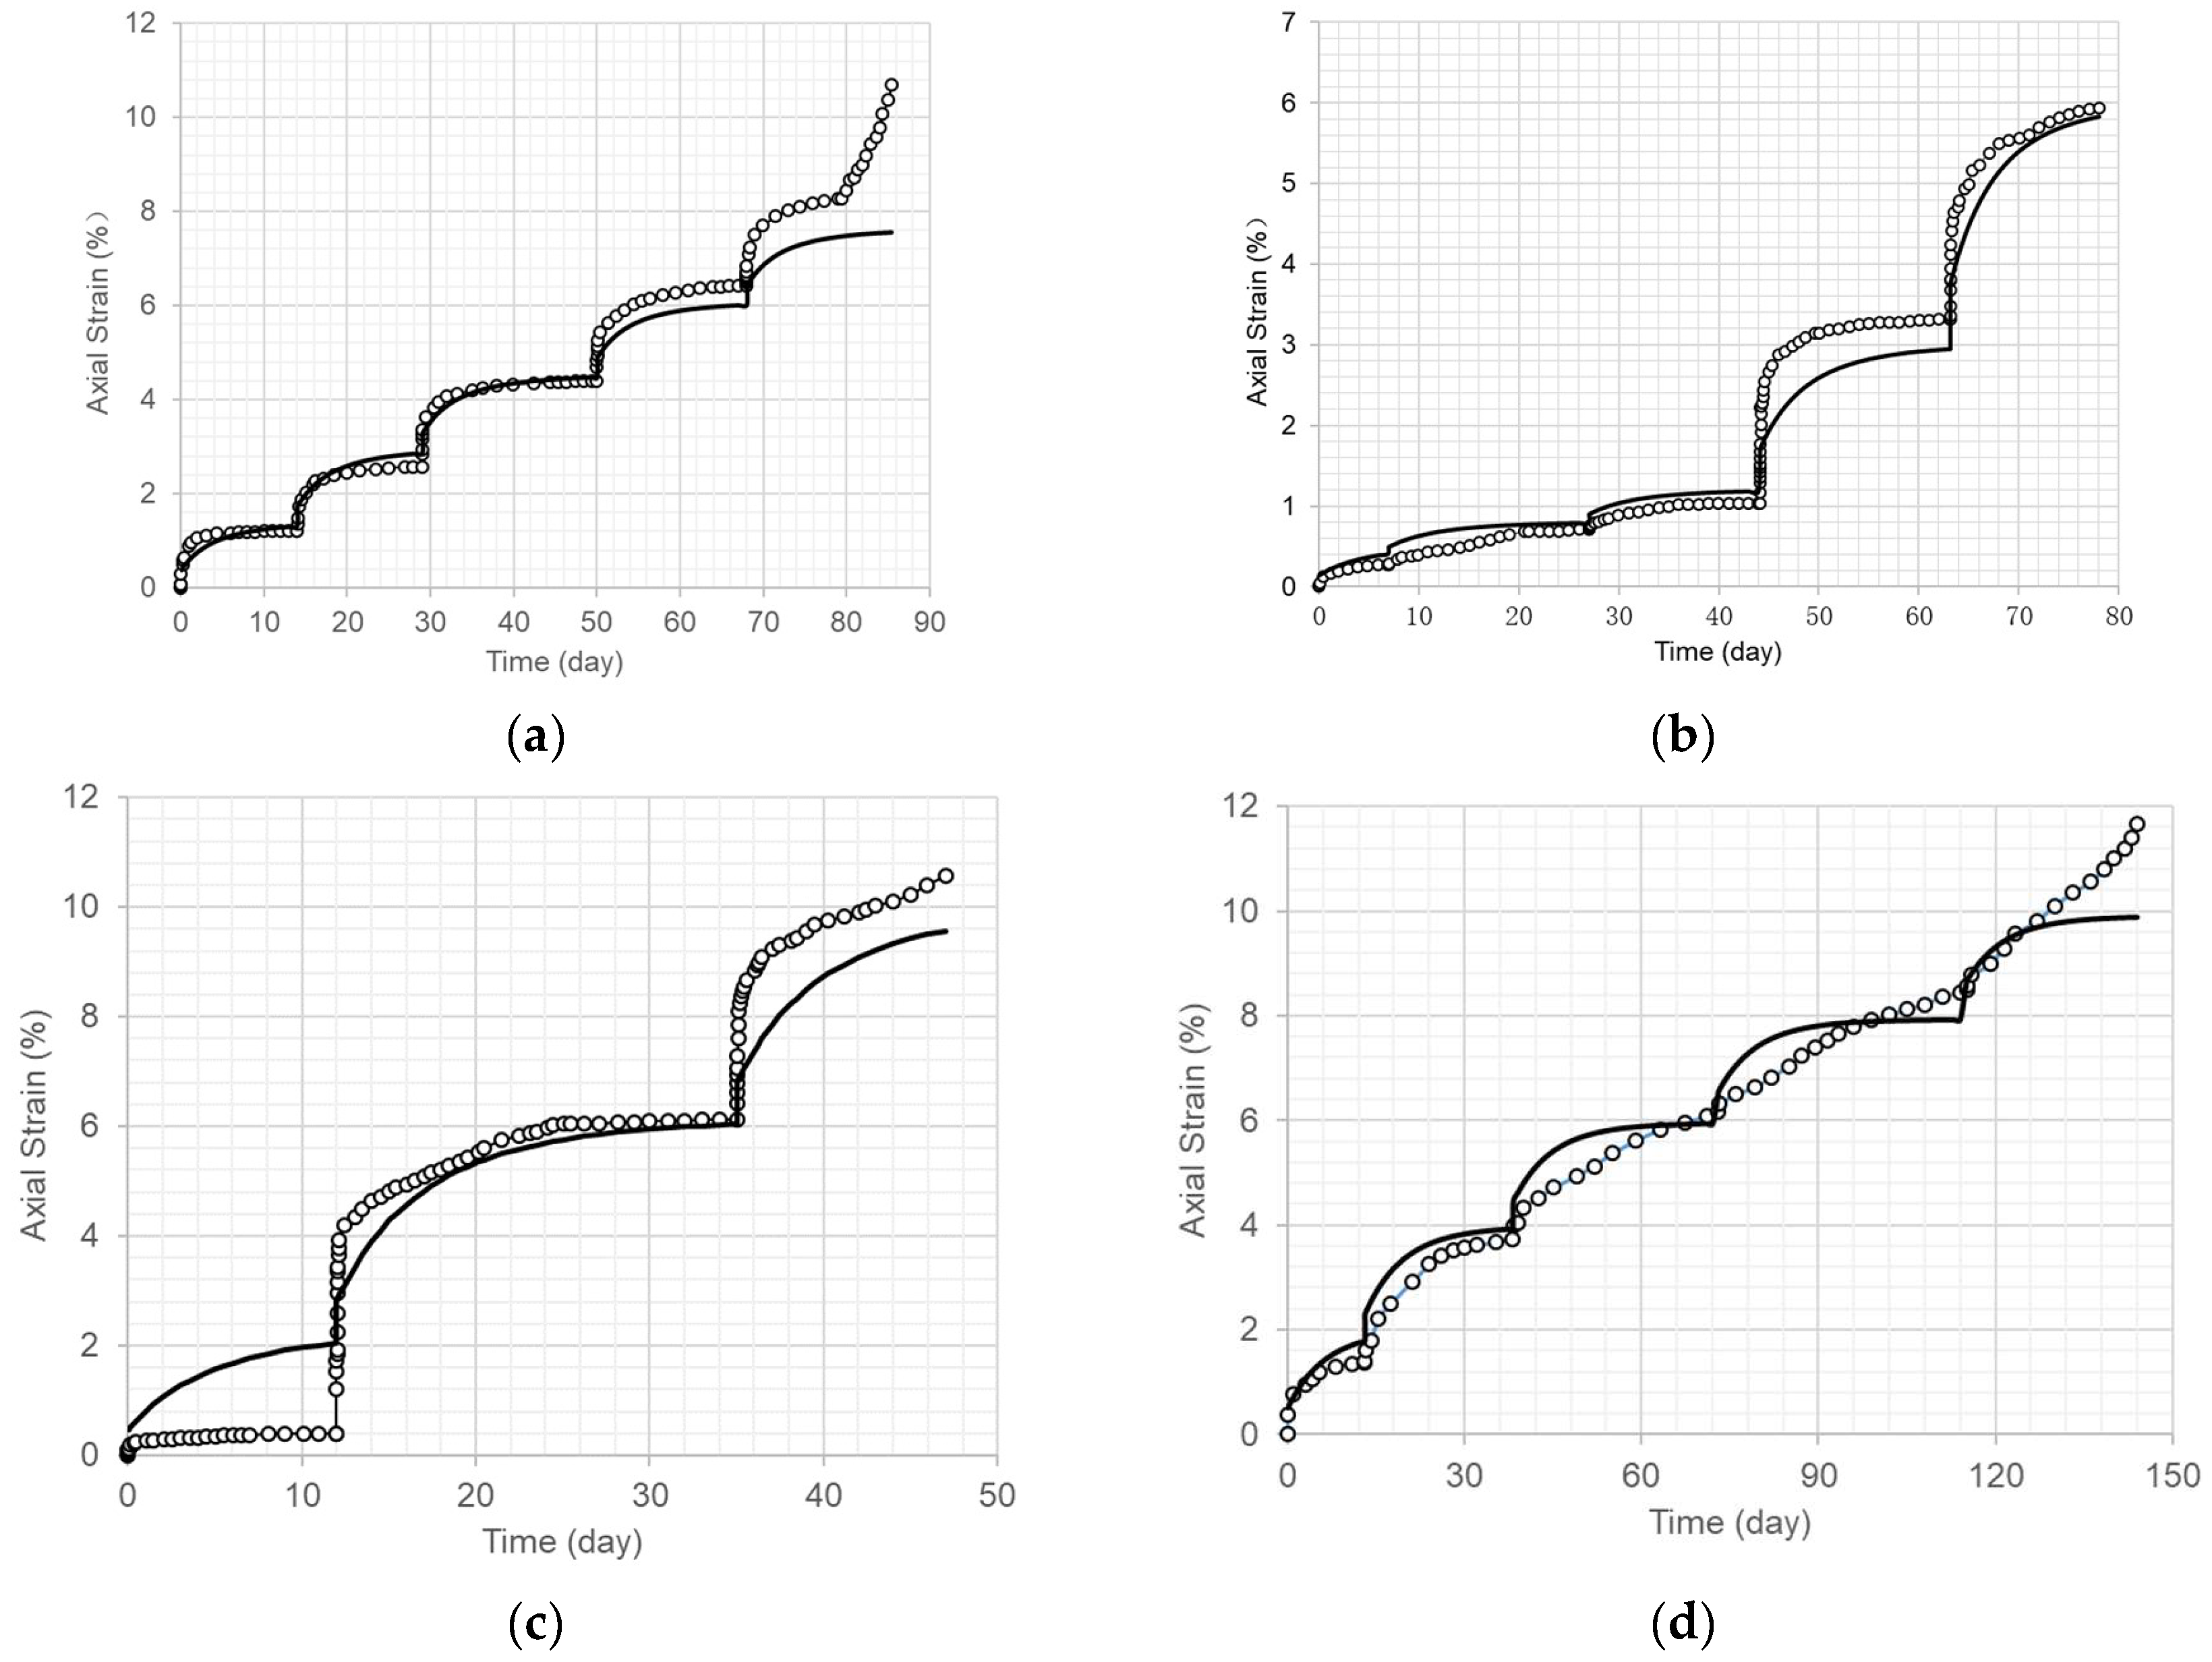
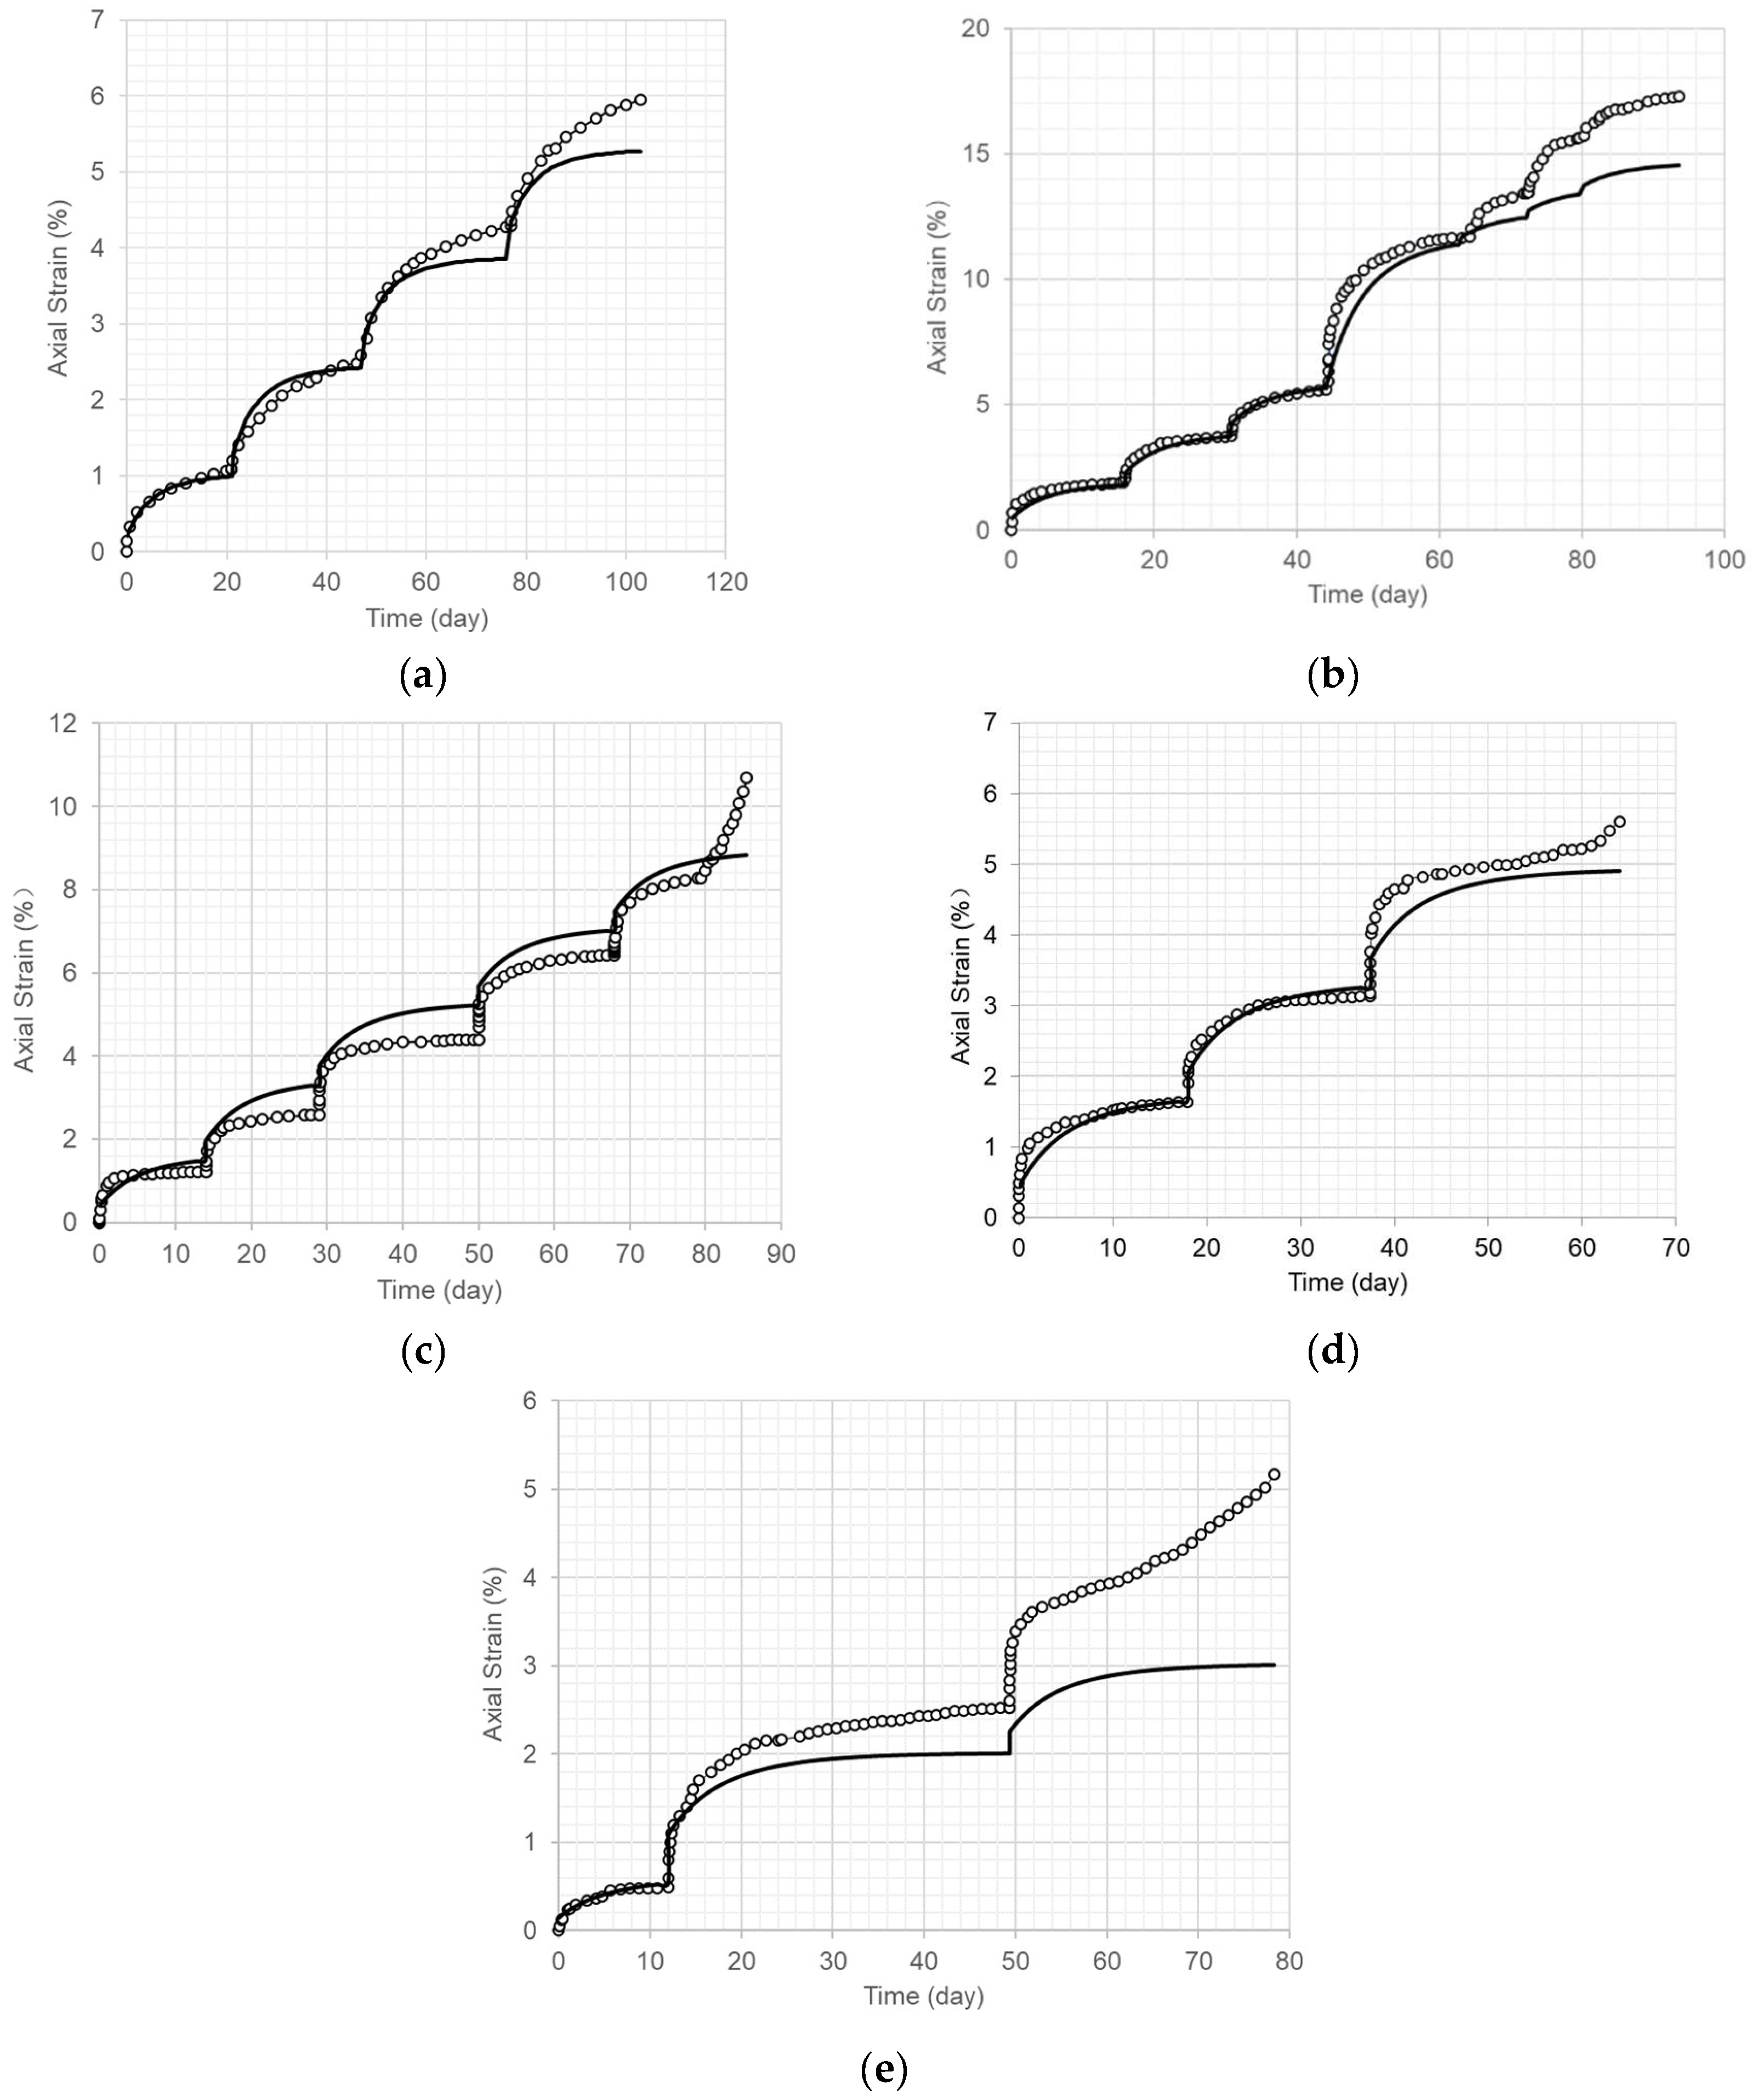
According to the established SSTTC model (Equations (8) and (11)–(14)), the typical long-term creep curves derived by using the generalized model were compared with the test curves, as shown in Figure 13.
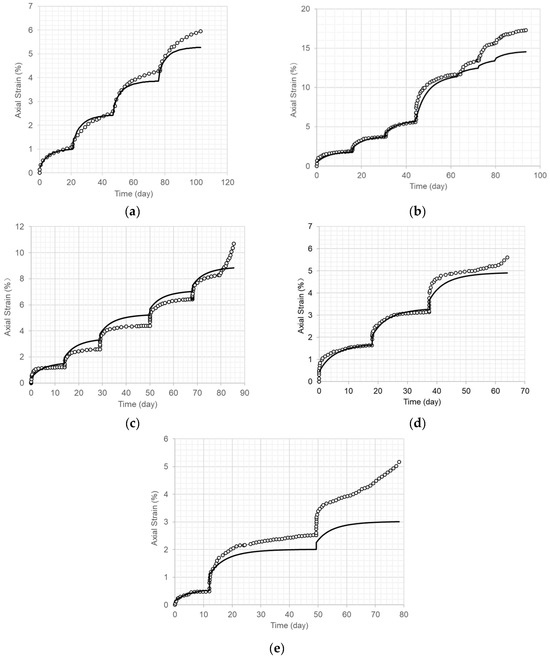
Figure 13.
Typical comparison of the long-term axial creep strain curves (solid line) using the material stress–strain–time–temperature creep model (SSTTC) and the test results under different radial confining stresses and different temperatures. (a) Confining stress of 1.0 MPa at 5 °C. (b) Confining stress of 1.0 MPa at 15 °C. (c) Confining stress of 0.5 MPa at 20 °C (refer to Figure 3a). (d) Confining stress of 0.5 MPa and at 25 °C (refer to Figure 4a). (e) Confining stress of 0.8 MPa at 30 °C (refer to Figure 5).
Figure 13 indicates that the long-term axial creep strain curves obtained using the proposed SSTTC model fit the test results well with reasonable variations when the axial strain increased and approached a stable value.
5. Discussion and Practical Implications
Asphalt concrete is used for impervious cores in dams, and it is commonly called hydraulic asphalt concrete (HAC) in dam engineering. A core should be flexible and ductile to adjust to deformations in the dam and its foundations. This requires the mix design for HAC to consist of more fine aggregates, more filler content, and more bitumen content. The aggregates are “supersaturated” with bitumen. Furthermore, HAC is compacted into a dense state with a vibratory roller in the field, and there are significant kneading effects. The skeleton structure of aggregates in an asphalt core is weak, and the performance of the core is dominantly governed by the asphalt mortar in the HAC. The test results showed that the magnitude of confining stress levels had insignificant effects on the stress–strain relationship, which was linear in the creep-stable state. Therefore, the viscoelasticity of asphalt concrete can be modeled with the generalized Kelvin model in a linear form of creep compliance.
When HAC is designed to have less bitumen content (for instance, 6.1% of the total weight) and is compacted in the laboratory in a steel mold, the HAC is constrained in the steel mold when subjected to compaction. The skeleton structure in the aggregates in compacted asphalt specimens is strong. The behavior of asphalt concrete is affected by the aggregate’s skeleton structure and the interlocking thereof. The creep-stable modulus Ecs was high [10].
From Equation (7) and the test results shown in Table 2, the relationship between the creep-stable modulus Ecs and temperature is shown in Figure 14.
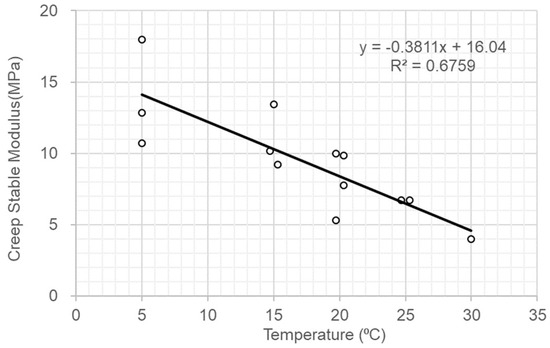
Figure 14.
Creep-stable modulus Ecs versus temperature for dam core specimens.
Based on the axial and volumetric strains in the creep-stable state during the tests, the equivalent Poisson ratio at different temperatures was found to be approximately 0.37, as shown in Figure 15.
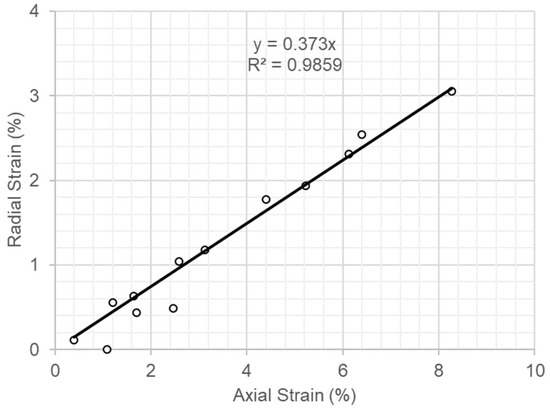
Figure 15.
Radial strain versus axial strain in the ‘‘creep-stable state” in triaxial compression tests.
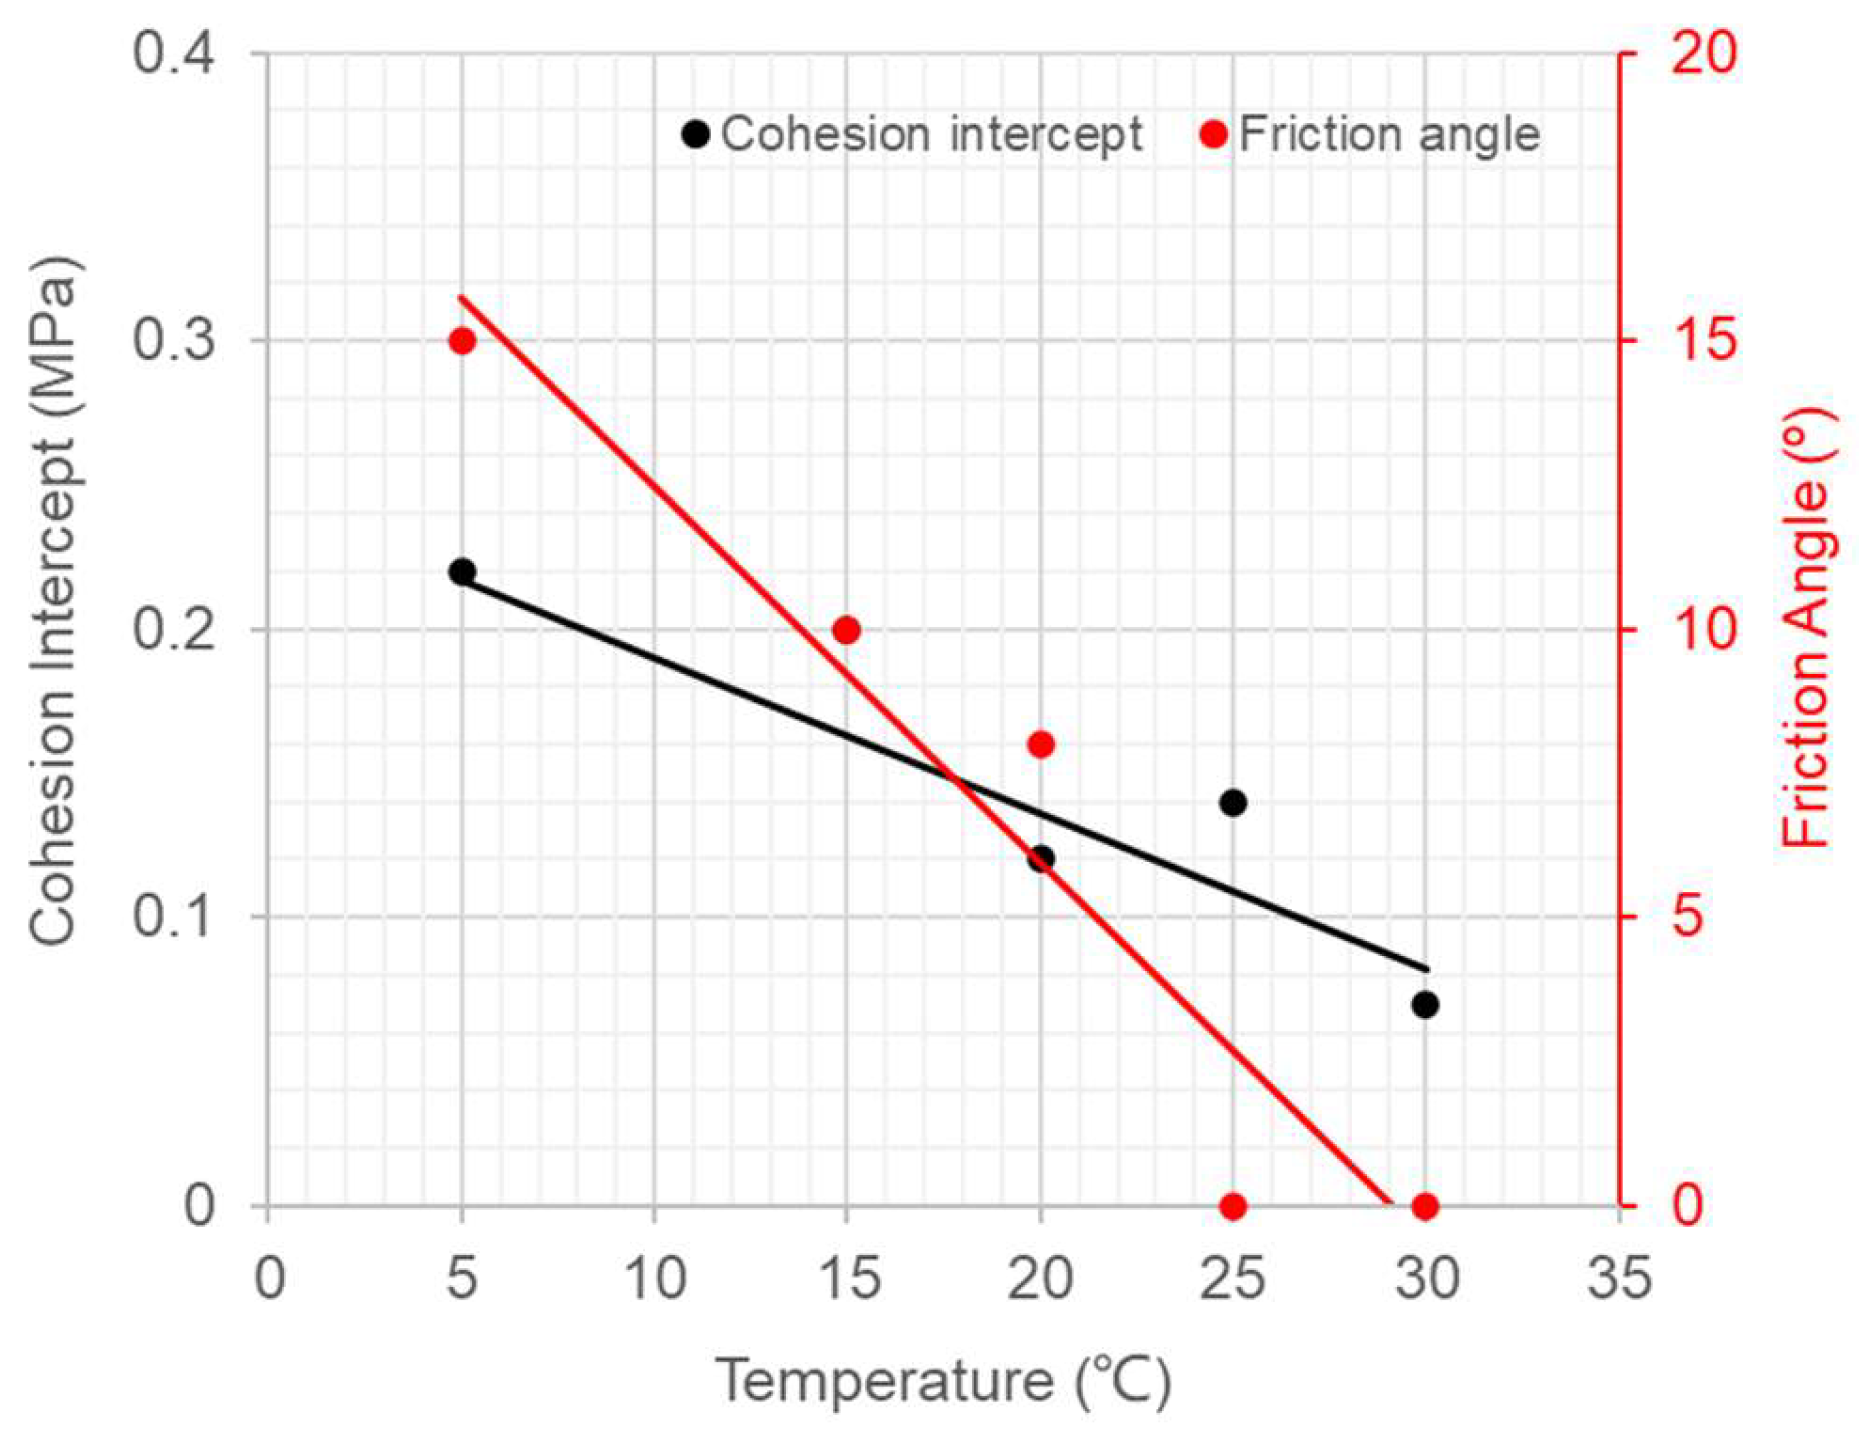
Under conditions of high deviator stress, asphalt concrete is unable to reach a creep-stable state of equilibrium and presents plastic flow. The creep strain continues to increase, and the asphalt concrete eventually fails. There must be a stress-state boundary where asphalt concrete changes from a creep-stable state to a creep-unstable state. This boundary was defined as the plastic yield boundary (PBY) by Wang and Höeg [10]. The PBY can be estimated by using creep tests with stepwise loading. The deviator stress at the PBY is larger than the last step of creep-stable deviator stress but is smaller than the step of creep-unstable deviator stress. Applying the Mohr–Coulomb criterion, the relationships of the cohesion intercept and friction angle with temperature for the PBY are shown in Figure 16.

Figure 16.
Cohesion intercept and friction angle versus temperature.
It should be noted that the relationship of the PYB with the cohesion intercept and friction angle shown in Figure 16 does not mean that the asphalt concrete fails. It is a stress state at the PYB in which the creep strain continues to increase. When used in impervious cores in dams, asphalt concrete is recognized to fail when it is cracked and loses its watertightness.
Asphalt cores are in the center of embankment dams and are constructed in a hot state. Load is increasingly applied on an asphalt core when raising an embankment. Figure 14 shows that the creep-stable modulus Ecs was less than 10 MPa when the temperature in the asphalt core was higher than 20 °C. The performance of an asphalt core is mostly determined by the behavior of the asphalt mortar in the HAC, as the aggregate’s skeleton structure is weak, and the friction angle in the plastic state of the asphalt concrete is near zero at 25 °C and 30 °C (Figure 16). The deviator stresses in the asphalt core are small during construction, as the creep-stable modulus Ecs is small at high temperatures. The bonding (cohesion) between aggregates is increased with the decrease in temperature (Figure 16). The friction angle of asphalt concrete may depend on the bonding between aggregates and the interlocking of the aggregate skeleton structure. When the temperature in an asphalt core is lower than 25 °C, the bonding between the bitumen and aggregates is increased, the aggregate skeleton structure is strengthened, and the friction angle is increased with the decrease in temperature (Figure 16).
The creep-stable modulus Ecs of an asphalt core during construction is about 10 times lower than that in adjacent transition zones. The asphalt core must resist the applied stresses from the transition zones by deforming. The evaluation of asphalt cores in dams according to their watertightness is determined by their deformability. The design principles for asphalt cores in dams should include the optimization of the asphalt mix to possess a high strain capacity without cracking or losing watertightness.
The proposed SSTTC model may be used in a numerical analysis considering the construction process and temperature changes in the asphalt cores of dams during their construction and the impoundment of reservoirs. The calculated strains in the asphalt core can be compared with the allowable strains of the asphalt concrete mix to evaluate the safety of asphalt cores in embankment dams.
6. Summary and Conclusions
Extensive long-term triaxial creep tests on core specimens from Quxue Dam and Laojiaoxi Dam were performed at different radially confining stress levels in the range of 0.5–1.5 MPa and at different temperatures in the range of 5–30 °C. Based on the test results and the application of the generalized Kelvin model in the linear form of creep compliance, the author proposed a material stress–strain–time–temperature creep model (SSTTC model) for the analysis of asphalt cores in embankment dams.
The following conclusions and findings were obtained:
- The magnitude of radially confining stress levels has insignificant effects on the stress–strain relationship of HAC in the creep-stable state that has been compacted with a vibratory roller in the field.
- The long-term triaxial creep test results showed that the curves of creep strains with time could be fit well toward a strain-stable state by applying the generalized Kelvin model in the linear form of creep compliance with two Kelvin elements in the temperature range of 5–30 °C.
- The relationships of the viscoelasticity and temperature parameters were established based on the test results, and a material stress–strain–time–temperature creep model (SSTTC model) was proposed. The creep curves obtained using the SSTTC model showed good agreement with the test curves of the asphalt specimens with reasonable variations.
- The volumetric strain was compressive strain during the long-term triaxial creep tests. The asphalt concrete specimens failed at high strain levels, as the bitumen (binder) was torn off the aggregates.
- An equivalent Poisson ratio up to the creep-stable state was, based on the recorded axial and volumetric strains, estimated to be 0.37.
- The creep-stable modulus Ecs of an asphalt core during construction is about 10 times lower than that in the adjacent transition zones. The asphalt core must resist the applied stresses from the transition zones by deforming.
- The relationships between the viscoelastic parameters and temperature for the SSTTC model must be determined for the asphalt mix used in the core, and the construction process and temperature changes in the asphalt core during construction and reservoir impounding must be specified. The strains in the asphalt core, calculated by using the SSTTC model in a numerical analysis, can be compared with the allowable strains of an asphalt concrete mix to evaluate the safety of an asphalt core in an embankment dam. If core cracking is likely to occur and could lead to unacceptable leakage or even dam rupture, the design of the ACED must be modified or mitigation measures must be introduced to prevent any serious and unacceptable consequences of the cracking.
Funding
The research in this study was supported by the National Natural Science Foundation of China (no. 52039008).
Institutional Review Board Statement
Not applicable.
Informed Consent Statement
Not applicable.
Data Availability Statement
The original contributions presented in the study are included in the article, further inquiries can be directed to the author.
Acknowledgments
The author appreciates the assistance of Dazhi Li, Tao Qiu, Kai Hu, Heng Guan, and Yongli Zheng during the experimental work.
Conflicts of Interest
The author declares no conflicts of interest.
References
- ICOLD. Asphalt Concrete Cores for Embankment Dams; Bulletin 179; International Commission on Large Dams (ICOLD): Paris, France, 2018. [Google Scholar]
- Hydropower & Dams. Asphaltic Concrete Cores for Dams; Listing in H & D World Atlas and Industry Guide; Hydropower & Dams: Sutton, UK, 2023. [Google Scholar]
- Feng, S.; Wang, W.; Hu, W.; Deng, Y.; Yang, J.; Wu, S.; Zhang, C.; Höeg, K. Design and performance of the Quxue asphalt-core rockfill dam. Soils Found. 2020, 60, 1036–1049. [Google Scholar] [CrossRef]
- Pircher, W.; Schwab, P. Design, construction and behaviour of the asphaltic concrete core wall of the Finstertal Dam. In Proceedings of the 16th ICOLD Congress, R49-Q61, San Francisco, CA, USA, 13–17 June 1988; pp. 901–924. [Google Scholar]
- Gallacher, D. Asphaltic concrete core at the Megget Dam. In Proceedings of the 16th International Congress on Large Dams, R.39-Q.61, San Francisco, CA, USA, 13–17 June 1988; pp. 707–731. [Google Scholar]
- Rienossl, K. Embankment dams with asphaltic concrete cores experience and recent test results. In Proceedings of the 11th International Congress on Large Dams, R.45-Q.42, Madrid, Spain, 11–15 June 1973; pp. 801–816. [Google Scholar]
- Schober, W. Considerations and investigations for the design of a rockfill dam with a 92 m high bituminous mix core. In Proceedings of the 11th International Congress on Large Dams, R.34-Q.42, Madrid, Spain, 11–15 June 1973; pp. 575–600. [Google Scholar]
- Haas, H. Zur Eignung und Optimierung von Asphaltbeton für Kerndichtungen in Staudämmen; Part 3; Bitumen: Heft, UK, 1983; pp. 97–106. [Google Scholar]
- Feiner, A.; Lehnert, J.; Lohr, A. Asphaltic concrete core problems and their solutions. In Proceedings of the 12th International Congress on Large Dams, R.3-Q.44, Mexico City, Mexico, 29 March–2 April 1976; pp. 33–47. [Google Scholar]
- Wang, W.; Höeg, K. Simplified material model for analysis of asphalt core in embankment dams. Constr. Build. Mater. 2016, 124, 199–207. [Google Scholar] [CrossRef]
- Grenier, S.; Konrad, J.M.; Péloquin, É.; Longtin, H. Effects of compaction method on the properties of asphalt concrete for dams and dykes. In Proceedings of the CDA 2010 Annual Conference, Canadian Dam Association (CAD), Niagara Falls, ON, Canada, 2–7 October 2010. [Google Scholar]
- DL/T 5363-2016; Specifications for Construction of Hydraulic Rolled Bituminous Concrete. China Water and Power Press: Beijing, China, 2016. (In Chinese)
- Tong, J.; Shen, K.; Ma, T.; Zhang, J. Characterizing the tension-compression asymmetric viscoelasticity of asphalt mixture using the uniaxial tension and compression test. Constr. Build. Mater. 2022, 350, 128854. [Google Scholar] [CrossRef]
- Gu, L.; Zhang, W.; Ma, T.; Qiu, X.; Xu, J. Numerical simulation of viscoelastic behavior of asphalt mixture using fractional constitutive model. J. Eng. Mech. 2021, 147, 04021027. [Google Scholar] [CrossRef]
- Lagos-Varas, M.; Movilla-Quesada, D.; Arenas, J.P.; Raposeiras, A.C.; Castro-Fresno, D.; Calzada-Pérez, M.A.; Vega-Zamanillo, A.; Maturana, J. Study of the mechanical behavior of asphalt mixtures using fractional rheology to model their viscoelasticity. Constr. Build. Mater. 2019, 200, 124–134. [Google Scholar] [CrossRef]


Disclaimer/Publisher’s Note: The statements, opinions and data contained in all publications are solely those of the individual author(s) and contributor(s) and not of MDPI and/or the editor(s). MDPI and/or the editor(s) disclaim responsibility for any injury to people or property resulting from any ideas, methods, instructions or products referred to in the content. |
© 2024 by the author. Licensee MDPI, Basel, Switzerland. This article is an open access article distributed under the terms and conditions of the Creative Commons Attribution (CC BY) license (https://creativecommons.org/licenses/by/4.0/).