Article

Design and Application of New Aeration Device Based on Recirculating Aquaculture System

by
Chengbiao Tong
1,2,*,
Kang He
1 and
Haoyu Hu
3
1
College of Electrical and Mechanical Engineering, Hunan Agricultural University, Changsha 410125, China
2
Intelligent Agricultural Machinery Equipment Hunan Key Laboratory, Changsha 410125, China
3
Hunan Kaitian New Agricultural Technology Co., Ltd., Changsha 410215, China
*
Author to whom correspondence should be addressed.
Appl. Sci. 2024, 14(8), 3401; https://doi.org/10.3390/app14083401
Submission received: 12 March 2024 / Revised: 8 April 2024 / Accepted: 12 April 2024 / Published: 17 April 2024
(This article belongs to the Special Issue State-of-the-Art Agricultural Science and Technology in China)

Abstract

:
This study optimized the design of an aeration device for pond engineered recirculating aquaculture systems (RASs) whose application is aimed at increasing dissolved oxygen (DO) levels in RAS aquaculture practice. DO is a key factor in aquaculture productivity, and oxygenators are the power devices used for regulating its levels in aquaculture ponds. In this study, grass carp (Ctenopharyngodon idellus) aquaculture trials were conducted in a self-built RAS by using the new aeration device (NAD); the microporous and impeller aeration components were individually tested in terms of performance, and then combined for the orthogonal testing of their operating parameters in order to assess the NAD’s oxygenation capacity. The test results show that the device effectively increased the dissolved oxygen levels in the RAS tank, enhanced the upper–lower water layer exchange and directional flow, and met the design and parameter selection requirements. Compared with the existing RAS oxygenation equipment, the NAD operated with the optimal parameters and increased the oxygen transfer rate in the pond water tank by 122%.

1. Introduction

According to the Food and Agriculture Organization (FAO) of the United Nations, China is the largest producer of freshwater fish for exporting and domestic consumption [1]. China alone supplied 58% and 59% of the global aquaculture volume and value, respectively, for all categories combined in 2017 [2]. Inland pond aquaculture, which represented 12.12% of total aquatic production in 1954, has surged significantly, reaching 44.30% by 2019 [1]. Notably, recirculating aquaculture systems (RASs) have emerged as pivotal contributors to this growth trajectory. These systems are distinguished by their capacity for accommodating high fish densities and achieving a substantial amount of production outputs [2,3]. RAS is a simplified version of the zonal aquaculture system invented by researchers at Clemson University (Clemson) [4,5]. It consists of a water-flow-generating and oxygenation device, a breeding raceway, and a dirt collection area. The device at the front end collects fish excreta and transfers them to a downstream purification area, where they are collected and treated with water pumps and fecal collection equipment or by filter-feeding fish bred for water purification; finally, the debris is transported, through the outfall pipe, to farmland for watering or other treatments. This is, thus, a feasible green aquaculture model which allows for the sustainable use of water. In 2013, Zhou, who worked in the U.S. Soybean Export Association, introduced it into China and actively promoted its use [6].
In RASs, among the essential factors affecting the quality of water, which is directly related to the productivity of the model, is dissolved oxygen (DO) [7]. In aquaculture practice, under natural aeration conditions, when the DO level in the water column is lower than 5 mg/L at night, fish growth is hindered, and fish may exhibit a behavior known as “floating head” or may even suffocate and die, resulting in significant economic losses [8]. On the other hand, DO also directly affects the feed coefficients and operating costs of the aquaculture process; thus, different DO levels may lead to significant differences in the economic efficiency of the same aquaculture model. For example, Anamika Yadav et al. [9] suggested that the fish feeding rate is affected by changes in DO, as it was shown that this parameter significantly decreased with less than 20–30% of saturated DO. Further, the productivity of conventional ponds is limited to 0.4–1 kg fish/m3 due to the dynamics of the natural DO level and dissolution efficiency of the water column; additional artificial aeration (mechanical aeration) can increase fish productivity by up to 4 kg fish/m3 [10]. Therefore, mechanical aeration equipment is used to dynamically regulate the DO level in pond water in recirculating aquaculture systems, which is a common and effective method employed to improve the productivity of fish.
At present, aeration devices of various sizes and types have been developed, but they are not designed to cope with high-density aquaculture, such as that based on RASs. In this regard, researchers have proposed a variety of aerator designs. The majority of paddlewheel aerators used globally, including in China, are surface aerators [8], such as impeller-type, micro- or nano-bubble, and surge-type aeration equipment. S.M. Roy et al. [11] proposed an improved circular step aerator by optimizing the geometric parameters of the original device and the dynamic conditions, which significantly improved its efficiency. M. Adel et al. [12] evaluated the standard aeration efficiency of different configurations of mechanical surface aerators; explored the effects of the number of blades, rotational speed, and submergence depth on aeration efficiency; and determined the highest aeration efficiency that could be achieved under the optimal device operating conditions. M.A. Dayıoğlu [13] designed and tested a venturi aeration system for aquaculture, and its flow characteristics and actual performance parameters were experimentally confirmed, demonstrating high aeration efficiency.
However, with the continuous increment in the density of fish cultured in RASs, these oxygenators are increasingly unable to meet the actual demand, showing poor performance. Zhang Zhuli et al. [14], in their study, suggested that the oxygen consumption of four large fish is about 1.35 mg/(L·h); the “oxygen capacity” calculated from the data measured in the laboratory with some of the currently used oxygenators did not meet the oxygen demand of fish in high-density aquaculture. There is a need to design a device with better aeration performance for application in RASs.
Thus, this study aimed to develop a new aeration device (NAD) for RASs. Its main components include two commonly used oxygenation devices, i.e., an impeller and a microporous aeration component. After we redesigned them, prototypes of these two oxygenation components were applied to a grass carp RAS in combination, so that we could test their actual culture oxygenation and flow generation effects. The rationality and feasibility of our design were verified by using experimental methods, and the optimal combination of operating parameters (i.e., the rotational speeds of the two components) was deduced to improve aeration performance and reduce costs in RAS aquaculture. In this study, ideas were provided for the improvement in the design of oxygenation devices and as a reference for their application in RASs.

2. Materials and Methods

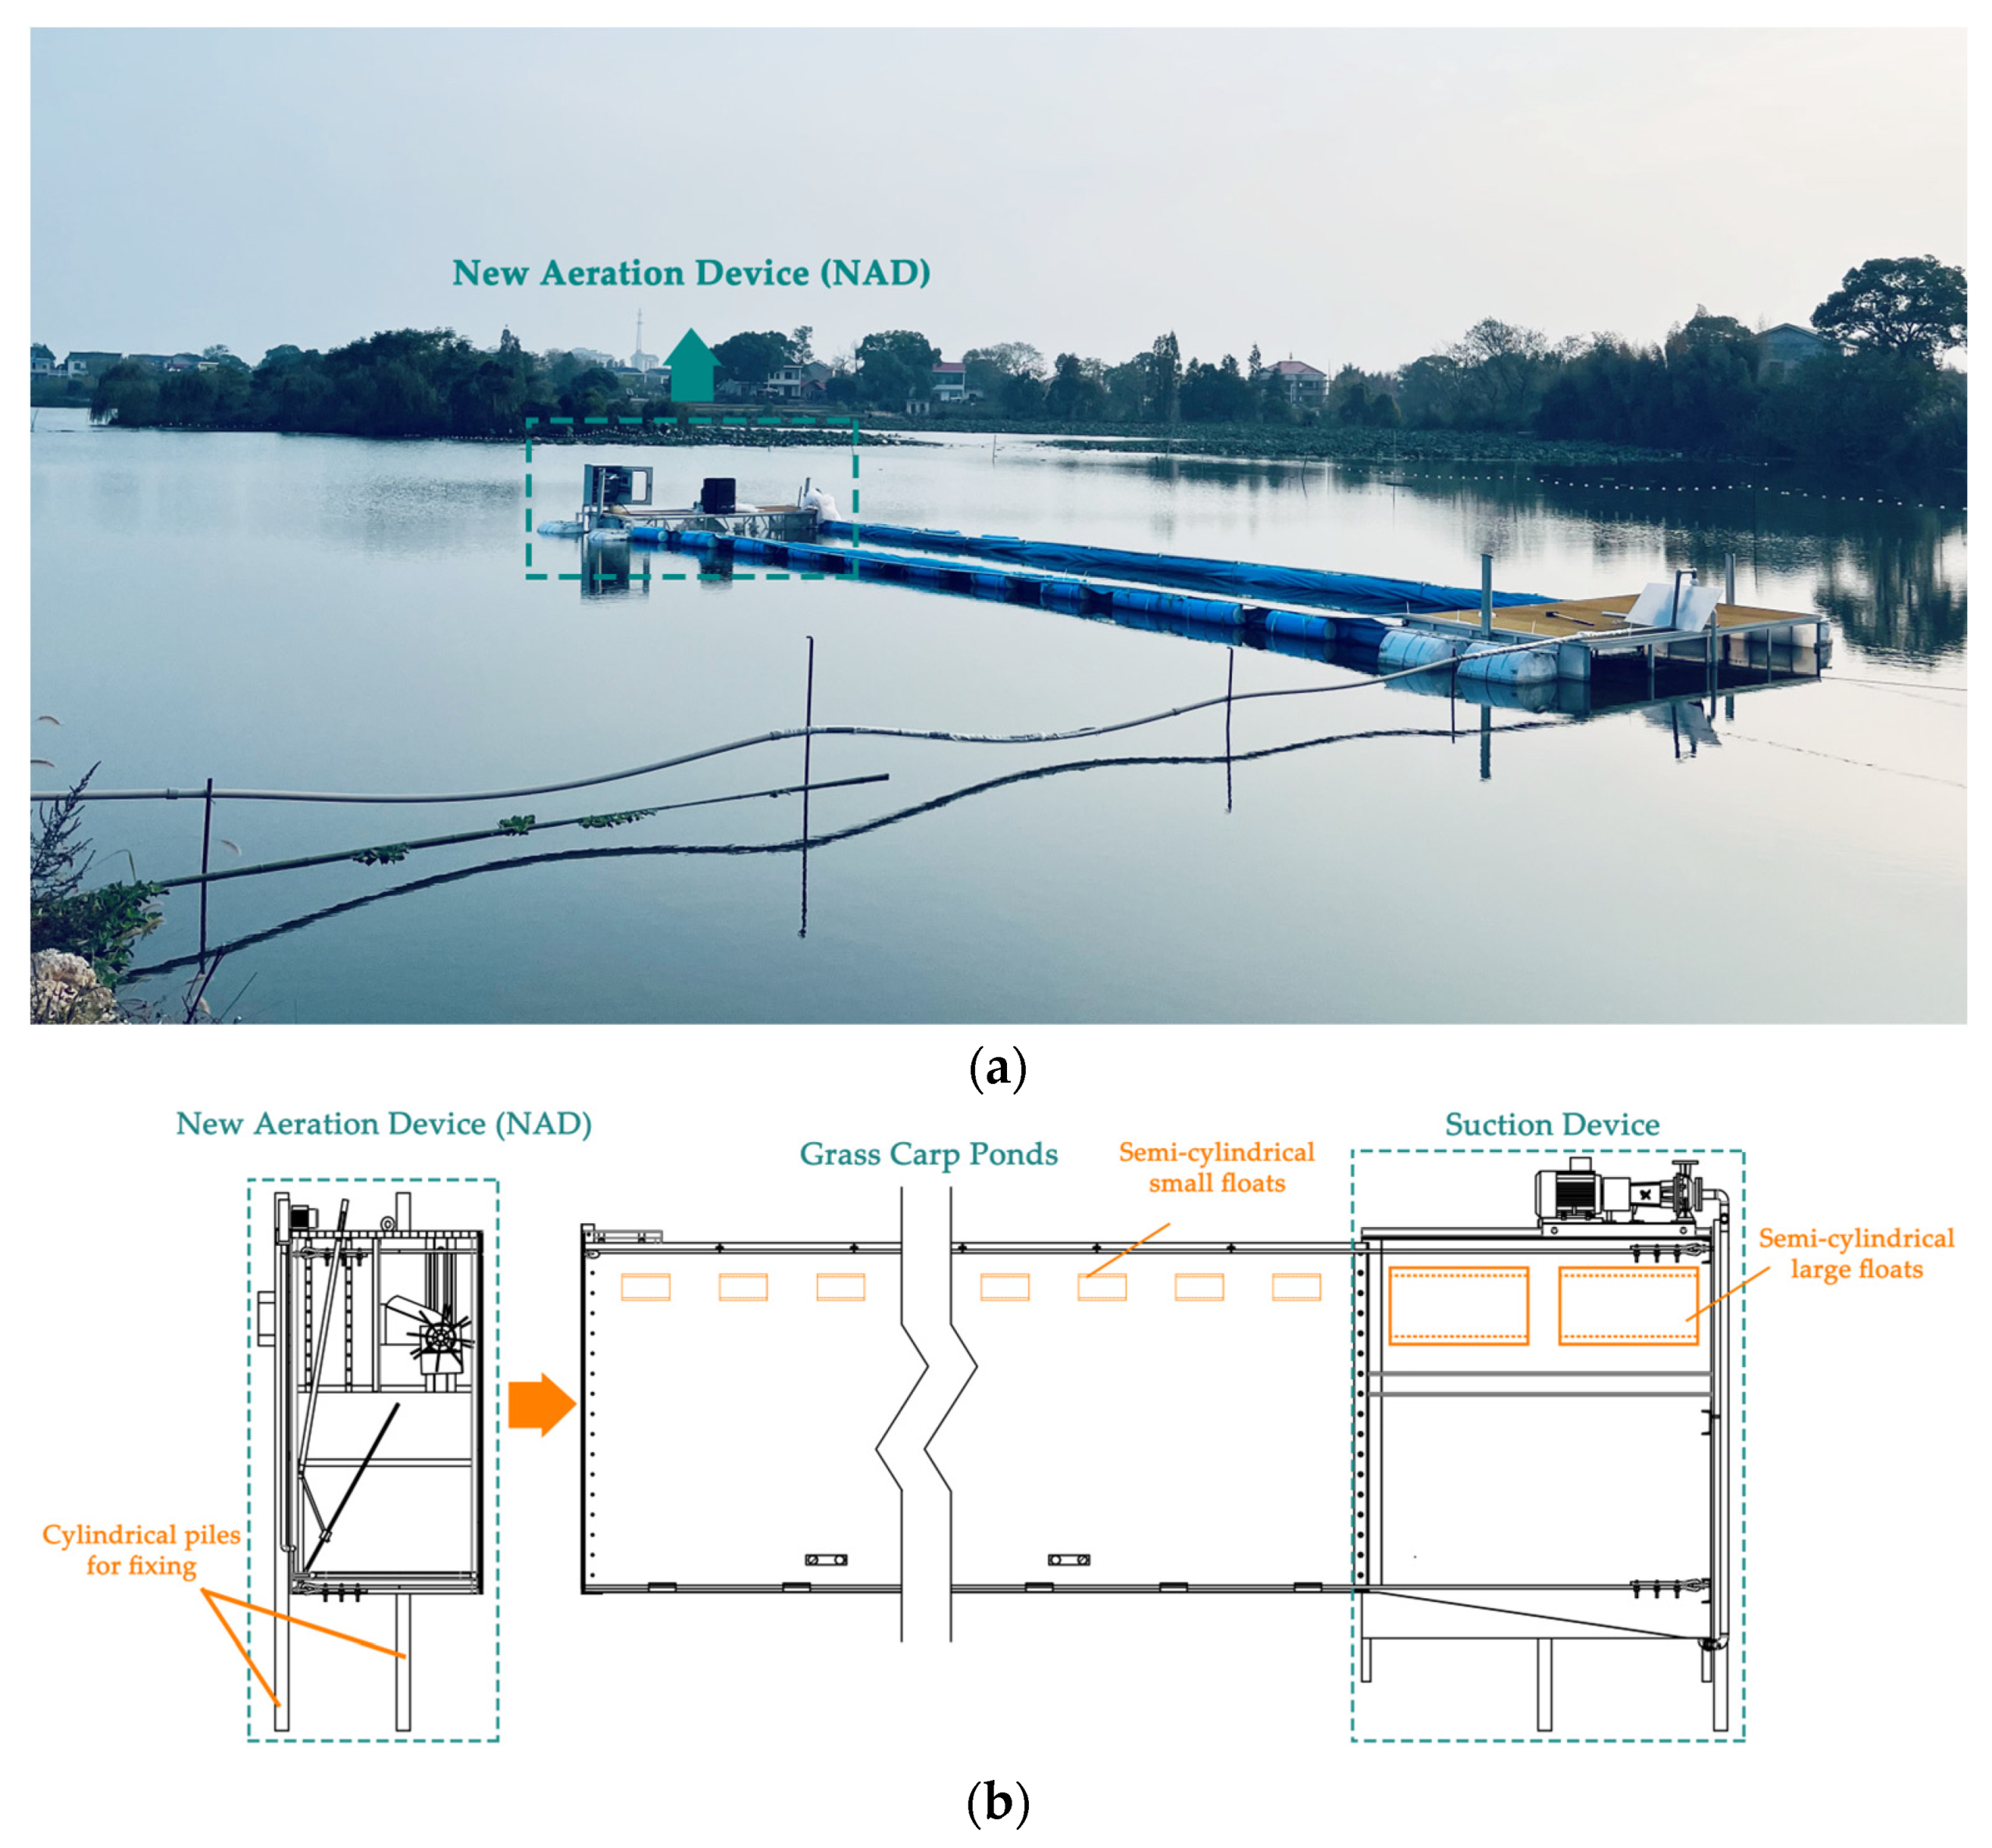
2.1. Study Area and Principle of Operation

The test site was an outdoor pond in Kaitian Fishing Village, Changsha, Hunan Province, China (112°73′73.2″ N; 28°48′86.51″ E), with an area of about 2.2 hm2 and an average water depth of 2.5 m. In the RAS set up in the pond, the overall load-bearing system consisted of a number of floats whose front and rear ends were connected to galvanized vertical columns fixed to the bottom of the pond and which could float up and down with the change in water level. In order to facilitate measurement and observation, load-bearing walkways were installed at the front and rear ends of the system. The new aerator was mounted at the front of the system and was secured to the flexible tank at the centre. In addition, the system also included a flexible culture tank, a suction element, and a pipe. The central culture tank of the system was made of fabric material, and its overall dimensions were 22.0 m in length × 5.0 m in width × 2.7 m in height; its average water level and volume were 2.0 m and 220 m3, respectively. (Here, the height of the border of the culture tank was slightly larger than the height of the water level in the tank in order to ensure that the cultured fish could not escape.) The main fish species was grass carp; the carrying capacity was about 15,000 fishes, and the density was 25–30 fishes/kg. The study RAS is shown in Figure 1.
We designed an NAD whose operation could meet the high actual DO demand of fish culture in RASs. A microporous aeration component and an impeller aeration component make up the main structure of the device. The remaining assembled parts are made of galvanized steel. The structure and working principle are shown in Figure 2.
The microporous aeration component includes a high-pressure fan, an aeration disk set at the bottom, an output pipe for the fan, and an inclined plate whose angle is adjustable. The fan, together with the aeration pipeline arranged at the bottom of the aeration plate, generates high-pressure gas in the form of micro-bubbles in the water, to achieve the effects of water flow generation and oxygenation. The angle of the inclined plate can be changed by using an adjusting lever according to the water depth and the speed of water flow in the ponds; the structure comprises a three-link rotating mechanism including a control lever, a crank, a fixed rod connected to the main frame, a guide rod connected to the inclined plate of the water-flow-generating fan, and a slider. The other component is a water flow generation and oxygenation device driven by a vertical gear motor fixed to the main frame and impeller rotor shaft through a stainless-steel chain, and the rotor shaft is connected to the side plate of the frame through a flange and bolts. Uniformly set on the rotor shaft are 8 impellers of the same size, 4 of which are connected to the floating bearing seat. In the frame side plate, there is an oblong hole that can be used to adjust the height of the rotor shaft centerline; the structure allows for a certain range so as to be adapted to different pond water depths.
When the two components are synchronously operated, the centrifugal fan performs air inhalation and compression; then, the high-pressure gas is delivered to the bottom of the tank through the pipeline and into the aeration disc, which produces micro-bubbles and shoots them upward, providing them with initial kinetic energy; the bubbles are further propelled forward through the reaction force generated by their impact against the baffle plate. This process drives the lower water layer constantly upward until it mixes with the surface layer. At the same time, the eight high-speed rotating impellers perform bubble refinement, continuously compress gas, and generate a water flow that carries the compressed air across the tank, causing the continuous renewal of the surface layer of water. Due to the effect of gravity, oxygenated surface water gradually descends and mixes with the lower water layer; the water in the tank, along with the fish excrement it contains, is simultaneously guided towards the suction device. Thus, the water in the breeding tank is in a state of continuous flow, facilitating the process of water renewal and oxygenation.

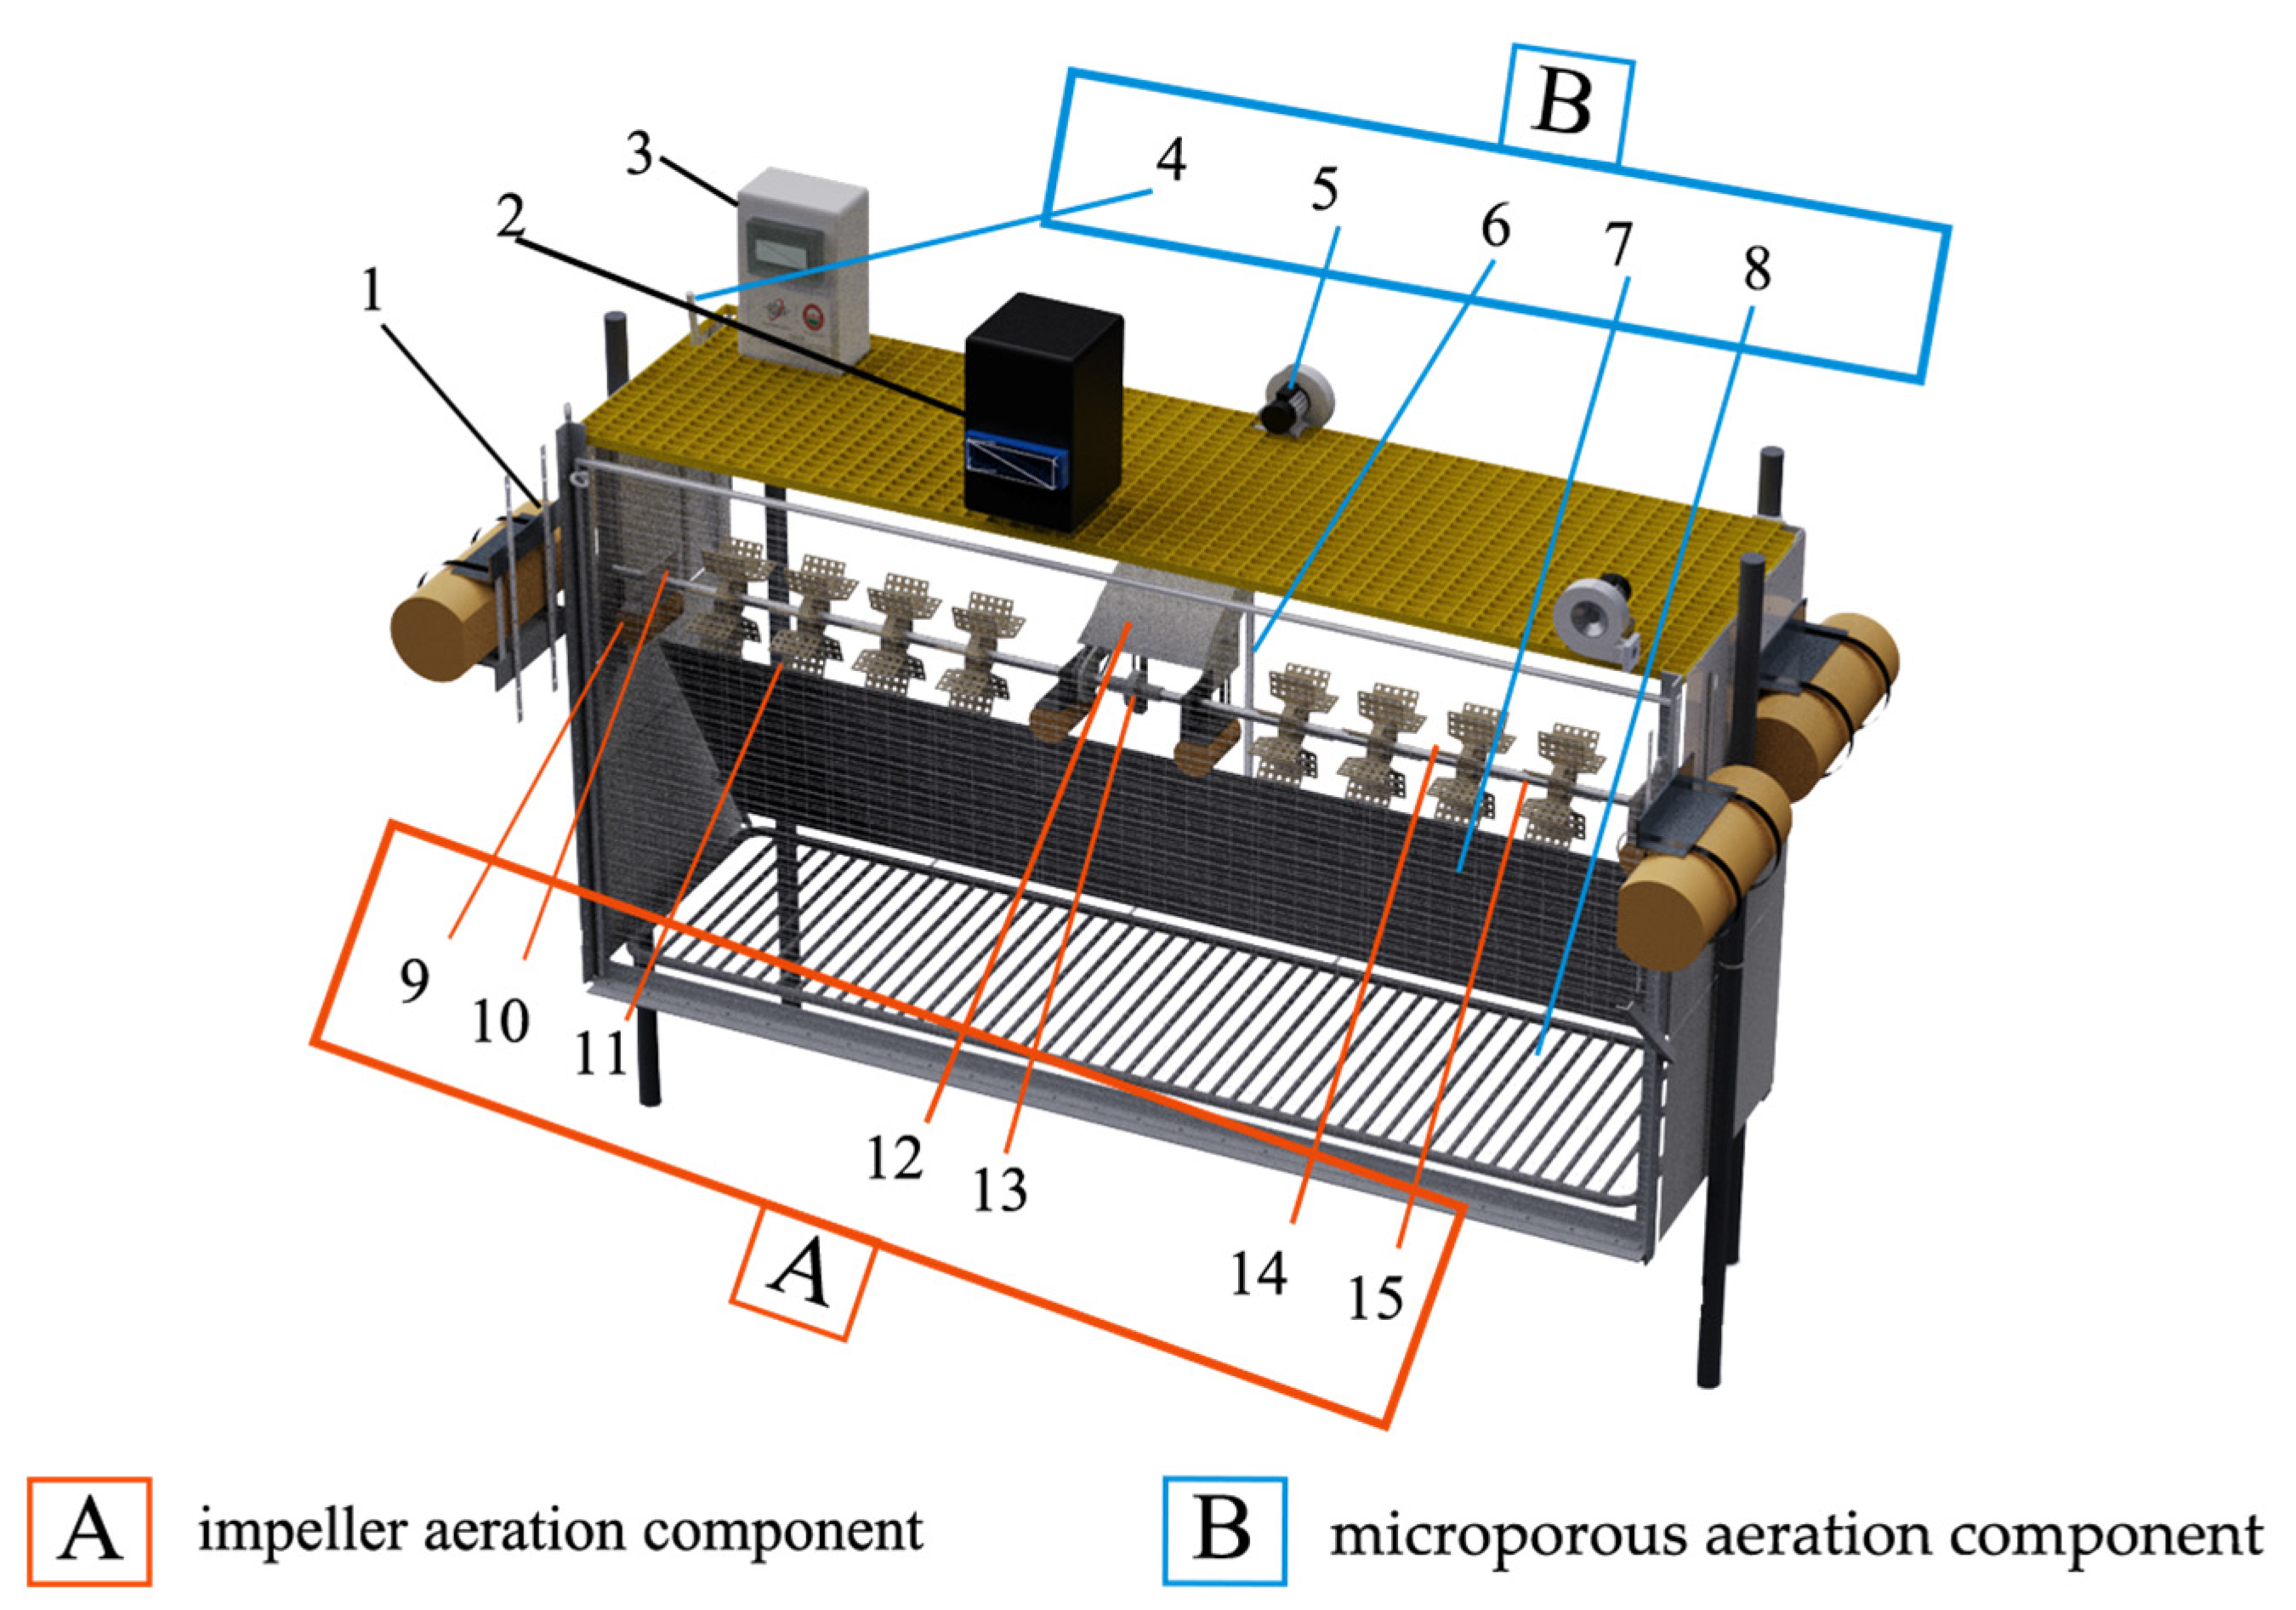
2.2. Design and Parameter Selection

2.2.1. Key Structure of Microporous Aeration Component: Centrifugal Fan

The centrifugal fan is the core component of the microporous aeration component driving water oxygenation. Two main aspects were considered in the calculation of its parameters. On one hand, the rated boost pressure of the fan has to be greater than the sum of the actual outlet aeration loss pressure and the water depth pressure, i.e., P P 1 ; on the other hand, the fan’s outlet airflow rate has to satisfy the overall oxygen demand of the cultured fish and the other organisms in the water, i.e., q v q v 2 . However, under actual use conditions, the outlet airflow ( q v 2 ) is affected by a variety of outdoor conditions, including temperature ( T ), relative humidity ( d ), air pressure, etc.; thus, the outdoor test conditions need to be determined prior to calculating the outlet airflow.
This study was conducted in an environment with maximum temperature T = 20 ° C and average relative humidity d = 80%. The RAS had tank area A = 110 m2, a maximum fish load of 80 kg/m2, average hourly oxygen consumption K 1 = 39 × 10−4 kg/(h·kW), and hourly ammonia discharge from the farmed fish K 2 = 57 × 10−4 kg/(h·kW). Based on work by J.C. Hu et al. [6], the necessary theoretical air supply, q v 1 = 185.3 m3/h, was computed, and Equation (1) displays the actual output air volume of the aquaculture tank under standard conditions:
q v 2 = q v 1 T 2 P 1 ( 1 + d 2 ) T 1 P 2 ( 1 + d 1 ) = q v 1 T 2 P 1 ( 1 + d 2 ) T 1 P 2
where q v 1 denotes the theoretical volume of gas required for the aquaculture tank; T 1 and T 2 denote the absolute temperature of the gas under standard and actual conditions, respectively (in K); P 1 and P 2 denote the inlet pressure of the blower under standard and actual conditions, respectively (in kPa); and d 1 and d 2 denote the air moisture content under standard (equal to 0.0073, generally negligible) and actual conditions, respectively (dimensionless).
For the microporous aeration component in the form of the arrangement of the gas delivery pipe, the aeration diffuser determines the pressure loss of the device. The same kind of aeration diffuser as that in the study by Z.M. Xu [15] was used for the loss ( P g ) in the fan distribution pipe in order to simplify the calculation. The parameters of the pipeline losses are included in Table 1, and the arrangement of eleven branch pipes. All pipelines were of tee type. With the aeration diffuser pressure loss, h 0 = 1.5 kPa, one can compute the overall loss of the aeration pipeline, taking into account the resistance loss due to diffuser clogging. The pressure losses in the main pipe ( h 1 ) and branch pipe ( h 2 ) were estimated using the pressure loss calculation presented, as indicated in Equation (2):
P g = h 0 + h 1 + h 2
where P g denotes the total loss of the aeration pipeline (in kPa) and h 0 , h 1 , and h 2 denote the pressure losses of the bottom aerators, main pipeline, and branch pipeline and along the course, respectively (in kPa).
For incompressible fluids, the parallel piping has the following characteristics: the flow rate of the main pipe is the sum of the flow rates of the branches [16], as shown in Equation (3):
Q 0 = Q 1 + Q 2 + + Q i
where Q 0 denotes the total flow in the pipe (in m3/h); and Q i denotes the flow rate of each branch of a parallel pipeline (in m3/h).
The size of the pipeline affects the performance of the fan, as too large a diameter increases the cost, while too small a diameter increases the pressure loss and power consumption. The inner diameter of the pipe d is calculated by the formula [17]:
D = 4 Q π V
where D denotes the inner diameter of the pipe (in m); and V denotes the cross-sectional flow rate of the pipe (in m/s).
Equation (5) indicates that the total pipe loss ( P g ) and the water pressure ( P h ) add up to the minimum lift of the fan under actual operating conditions:
P 1 = P h + P g
where P 1 denotes the minimum fan lift required for the water in the aquaculture tank (in kPa) and P h denotes the pressure at the water depth where the aerators are located (in kPa).
According to the calculation of the above formula, the mass flow rate and the minimum pressure increase under standard conditions are q v 2 = 197.7 m3/h and P 1 = 27.7 kPa, respectively. It can be assumed that the quantity of dissolved oxygen produced by the microporous aeration component can meet the direct (grass carp) and nitrification oxygen demands. Therefore, this fan model meets basic oxygen demand in RAS culture, and the specific parameters are shown in Table 2.

2.2.2. Key Structures of Impeller Aeration Component: Impellers

Impeller size and rigid strength are the primary parameters to be calculated in the design of the impeller component. The evaluation index comprises the device’s total power and the average water flow rate, along with intermediate parameters such as drag coefficient, blade rotational speed, blade submergence depth, diameter, and number of blades. First, the resistance created by the water is reduced to a concentrated force operating at the centre of the submerged blade, which simplifies the combined resistance of the water against the blade. Then, geometric data such as the radius of the blade and the angle in the vertical direction are used to determine the moment. Lastly, by considering the instantaneous power, the average power that will be used by the blades overall is obtained. The impeller shaft may also be thought of as a spinning shaft. Stiffness and strength are calibrated based on the torsional stiffness conditions and the bending and torsion synthetic strength criteria of the shaft, respectively.
The following are the primary specifications for the design of an impeller-type aerator, according to Z.N. Li et al. [18]: impeller size of 0.5 m, shaft of 0.05 m, blade rotational speed of 100 r/min, maximum blade submergence depth of 0.125 m, blade width of 0.1 m, and 64 blades in total. This leads to the calculation of P z , the minimal total power needed for the impeller aeration component. Its specific design parameters are shown in Table 3.
F = C D A ρ v i 2 2
A = b x
x = R ( R H ) / cos α
l = ( R + R H cos α ) / 2
P i = M ω = M 2 π n 60
P ¯ = 1 0 α 0 α 0 0 P i d α
P z = 2 P ¯ α 0 z 2 π
where A denotes the projected area of the blade in the vertical direction of the flow velocity (in m2); b denotes the width of the blade (in m); x denotes the blade submergence depth (in m); F denotes the resistance generated by a single blade movement in the water and consists of differential pressure resistance and friction resistance (in N); C D denotes the drag coefficient associated with the shape of the blade (here, we took = 1.5*; dimensionless); v i denotes the relative velocity of the blade and the water (in m/s); ρ denotes the density of water (in kg/m3); R denotes the radius of the blade wheel at the maximum depth of entry (in m); H denotes the blade rotation (in m); α denotes the angle between the blade and the vertical direction at a certain point in time (in °); α 0 denotes the angle between the vertical direction and the position of the blade when the latter is submerged or out of the water at a certain point in time (in °); l denotes the length of the blade arm subject to water resistance F (in m); I denotes the instantaneous power consumed by the impeller at a certain moment (in kW); M denotes the moment of a single blade subject to water resistance (in N·mm); ω denotes the angular velocity of the impeller (in rad/s); n is the impeller’s speed (in r/min); P ¯ denotes the average power consumption of a single blade (in kW); and P z denotes the total power consumed by the impeller (in kW).
* C D : When the Reynolds number of the fluid R e > 104, it can be estimated according to the constant; when an impeller-type aerator is operated, R e ≈ 3 × 10⁶, and C D is generally taken as 1.4~1.5 for blade operation. C D = 1.5 in this study [19,20].

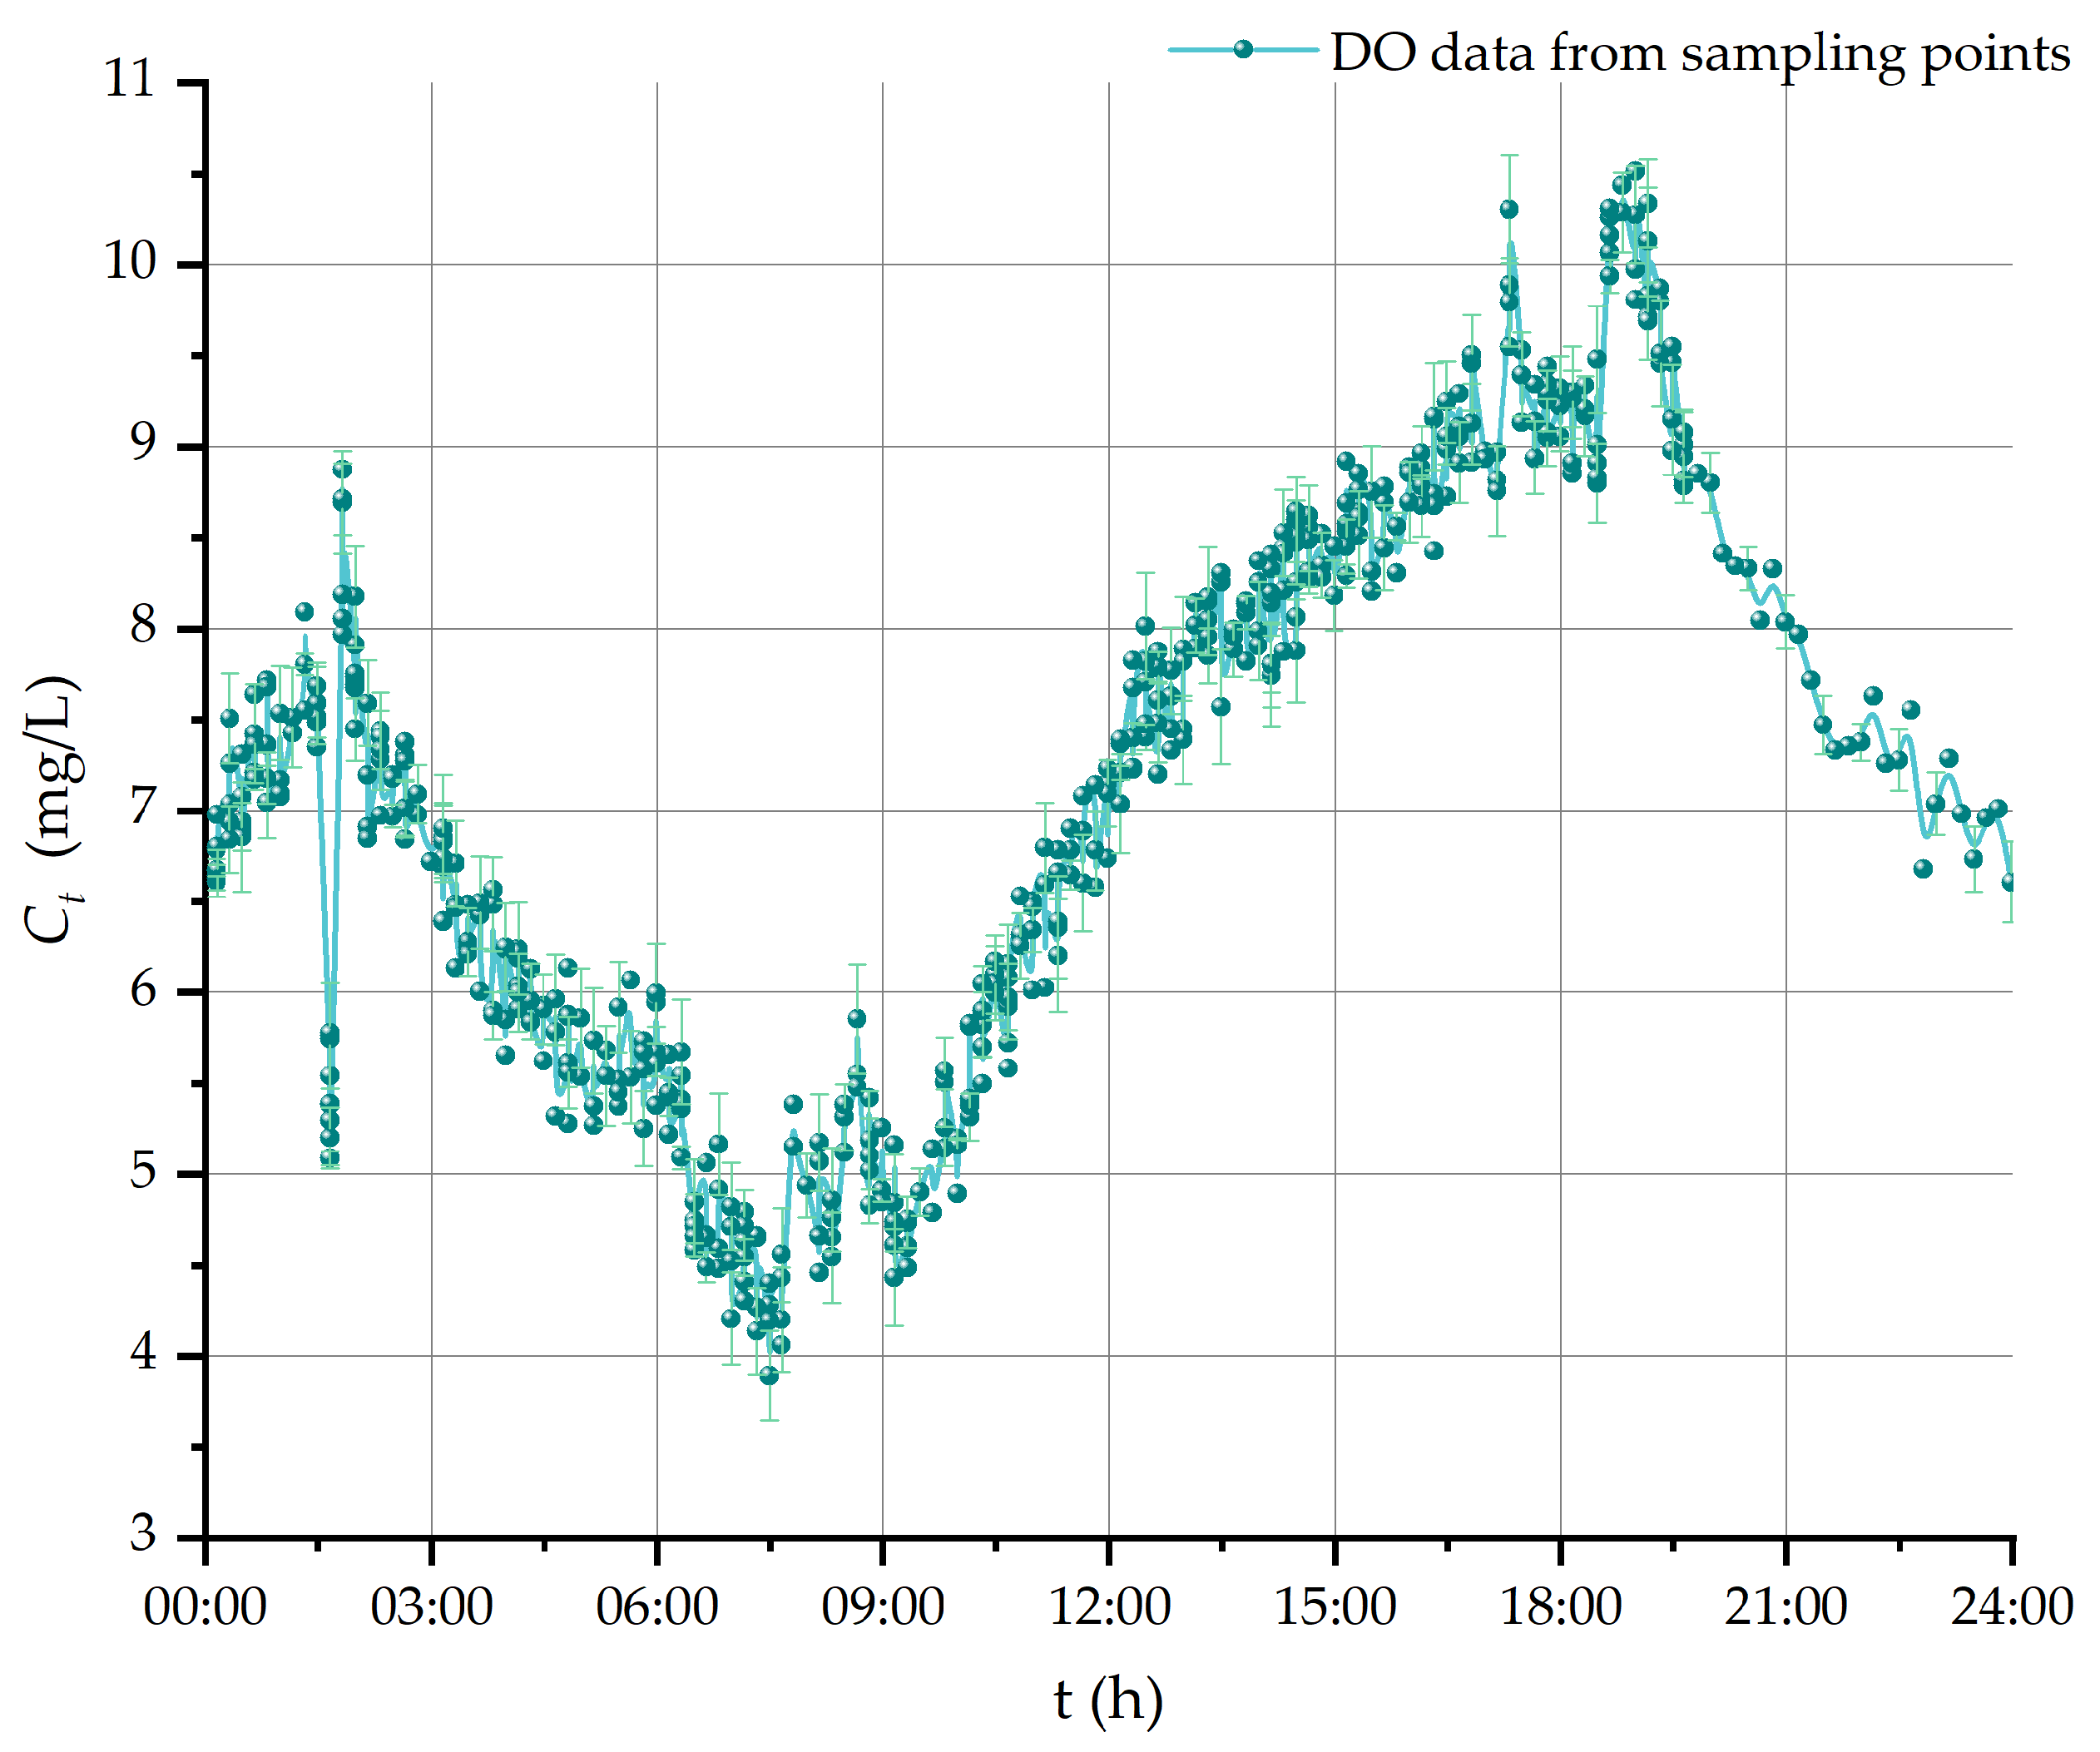
2.3. Analysis of Outdoor Pond Conditions

Since the test site was outdoors in a freshwater aquaculture pond, we had to consider that the dissolved oxygen level in outdoor water is affected by many factors, including physical, chemical, biological, and anthropogenic factors [21,22]. To minimize the measurement error due to outdoor conditions on the values of dissolved oxygen and other water indicators of the aquaculture tanks, we chose to conduct the tests on 15 days that presented similar conditions (i.e., the factors affecting the dissolved oxygen levels, pH value, water temperature, and air pressure, were similar). The experiment was conducted in January 2023, abstaining from the activation of any oxygenation devices, to maintain consistency in culture management practices. It is worth noting that fish were not farmed in this pond. DO levels in the pond were monitored using a dissolved oxygen meter (YSI-58), with measurements recorded every five minutes. Each measurement was replicated three times under identical conditions to ensure accuracy and reliability.
Figure 3 shows the changes in the natural dissolved oxygen level in the test pond over 24 h. It can be found that the lowest daily DO level was at 6:00–10:00 [23], and that, over 24 h, there were significant changes in the magnitude of this parameter, which was mainly due to light intensity. Therefore, in all of the oxygenation tests, devices were operated in the range of 7:00–10:00, which effectively reduced the interference of light intensity with the experimental results, allowing us to better verify the performance of the NAD.

2.4. Test Design and Methodology

2.4.1. Theoretical Considerations and Data Processing

The tests in this study are based on the mass transfer theory of oxygen molecules proposed by Whitman in 1926, according to which the process of aeration equipment essentially consists of the penetration of oxygen molecules from the gas phase into the liquid phase through the gas–liquid interface; in a system containing two or more phases, due to the existence of a concentration gradient, there exists a tendency for substances to diffuse from the higher- to the lower-concentration phase, a process referred to as mass transfer [24]. The process of dissolving oxygen molecules into water is referred to as oxygen mass transfer and is represented in Equation (13):
d C t d t = K L a T ( C C 0 )
where C t , C , and C 0 denote the current, saturated, and initial dissolved oxygen, respectively, at water temperature T (in mg/L), where the initial DO is generally 0.
Integrating from Equation (13) yields Equation (14), with which the mass transfer coefficient ( K L a T ) for the total volume of the liquid phase in the aeration mass transfer system is calculated:
I n ( C C t C C 0 ) = K L a T × t
According to the Arrhenius temperature relation, Equation (15) is the transformation of the mass transfer coefficient ( K L a 20 ) in the standard state into that at temperature T :
K L a 20 = K L a T / θ T 20
where θ is the temperature correction factor (=1.024) for pure water.
In order to evaluate the performance of an aerator, standard oxygen transfer rate ( S O T R ) and standard aeration efficiency ( S A E ) are generally used [25]:
S O T R = K L a 20 × ( C C 0 ) × V = K L a 20 × 9.07 × V × 10 3
However, aerators used in pond applications, which are subject to outdoor conditions, present different SOTR and S A E from those measured under standard conditions. The oxygen transfer rate (OTR) calculation formula proposed by Boyd [26,27] is shown in Equation (17):
O T R = S O T R × α × 1.024 T 20 β C C 0 / 9.07
where O T R denotes the oxygen transfer rate under pond conditions (in kg/h); S O T R denotes the standard oxygen transfer rate (in kg/h); α = K L a 20 pond water/ K L a 20 tap water; and β = DO saturation concentration of pond water/DO saturation concentration of tap water.
DO increase ( R S ) refers to the increase in water DO induced by the aerator, expressed as shown in Equation (18):
R s = C 2 C 1
where R s denotes the average increase in pond DO level (in mg/L); C 1 and C 2 denote the dissolved oxygen concentrations recorded at times t 1 and t 2 , respectively (in mg/L); and t 1 and t 2 denote the time elapsed since the device started the aeration process (in min).
To determine the uniformity of the dissolved oxygen distribution in water, the DO data from each collection point are analyzed for standard deviation [28].
S 1 = 1 x 1 i = 1 x ( C i C ¯ ) 2
M 1 = 1 S 1 C ¯ × 100 %
where S 1 denotes the standard deviation of dissolved oxygen; x denotes the number of collection points; C i are the dissolved oxygen data from collection points (in mg/L); C ¯ denotes the average of dissolved oxygen at x collection points (in mg/L); and M 1 denotes the uniformity of the dissolved oxygen distribution in water (in %).
The above equations can be used to calculate the average oxygen increase and oxygenation capacity with different operating parameters and to comprehensively evaluate the actual oxygenation effect of the NAD in the RAS, respectively.

2.4.2. Test Methods

In this study, one-component oxygenation tests, orthogonal oxygenation tests, and mean flow rate influence tests were carried out sequentially by using different parameters. The aim was to investigate the effect of different parameters on DO level and RAS water flow rate and determine the optimal operating parameters of the NAD. In order to minimize the interference of outdoor conditions with the test results, the tests were conducted at 7:00–9:00 a.m. on 15 days with similar outdoor conditions, specifically, air pressure of 1010 ± 5 kPa, pH of 8.5 ± 0.5, and water temperature of 15 ± 2 °C.
Therefore, according to APHA et al. [29], under the outdoor conditions of the study pond, the typical values of α and β were assumed to be 0.95 and 0.90, respectively. The value of C at 15 °C was taken as 10.07 mg/L. The values of standardized oxygen transfer rate (SOTR) were taken as 2.98 kg/h and 2.25 kg/h for the microporous and impeller aeration components, as shown in Table 2 and Table 3, respectively. Therefore, the overall SOTR of the NAD was obtained as the sum of the two values above, i.e., SOTR = 5.23 kg/h.

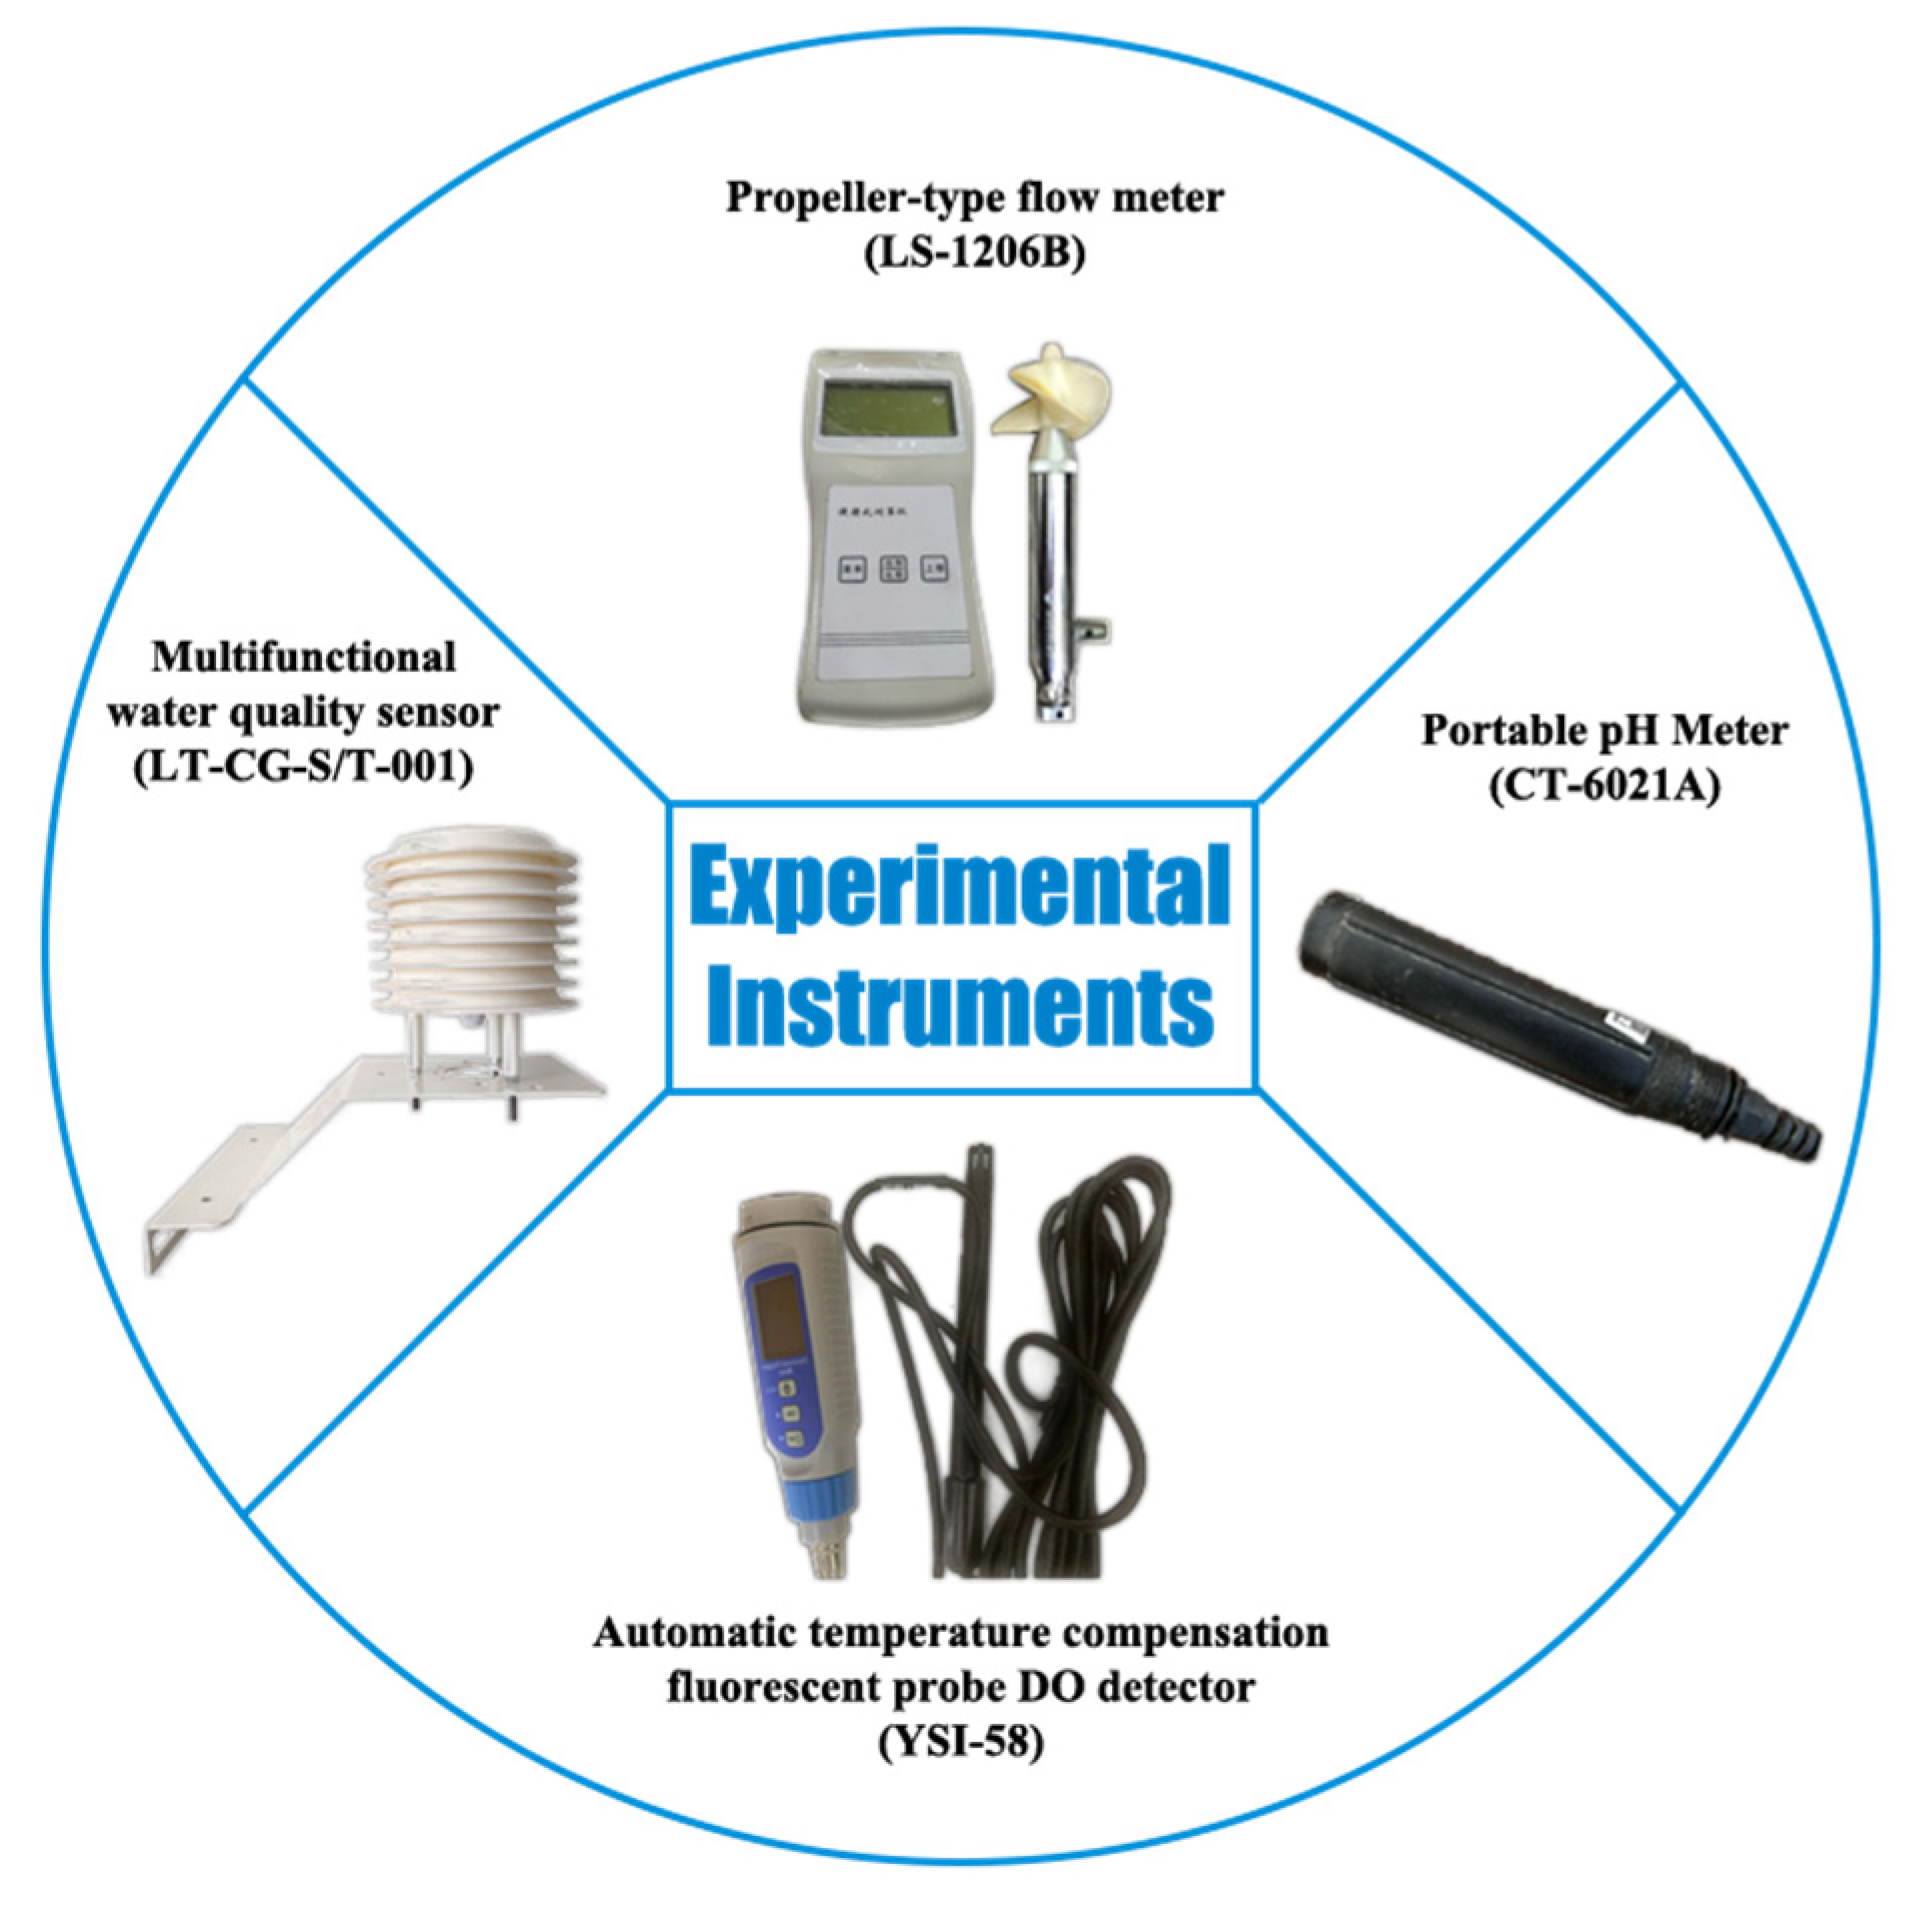
2.4.3. Experimental Instruments

As shown in Figure 4, the main test collection instruments included a dissolved oxygen meter (model YSI-58; fluorescent probe dissolved oxygen meter with automatic temperature compensation and full scale measurement error of ±2%F.S), a multi-functional water quality sensor (model LT-CG-S/T-001; used to determine the parameters of water temperature, turbidity, ammonia nitrogen, etc.), a portable pH meter (model CT-6021A; used to determine the pH value of the water in the aquaculture tanks), and a propeller-type flow rate meter (model LS-1206B; used to determine the average water flow rate in the aquaculture tanks).

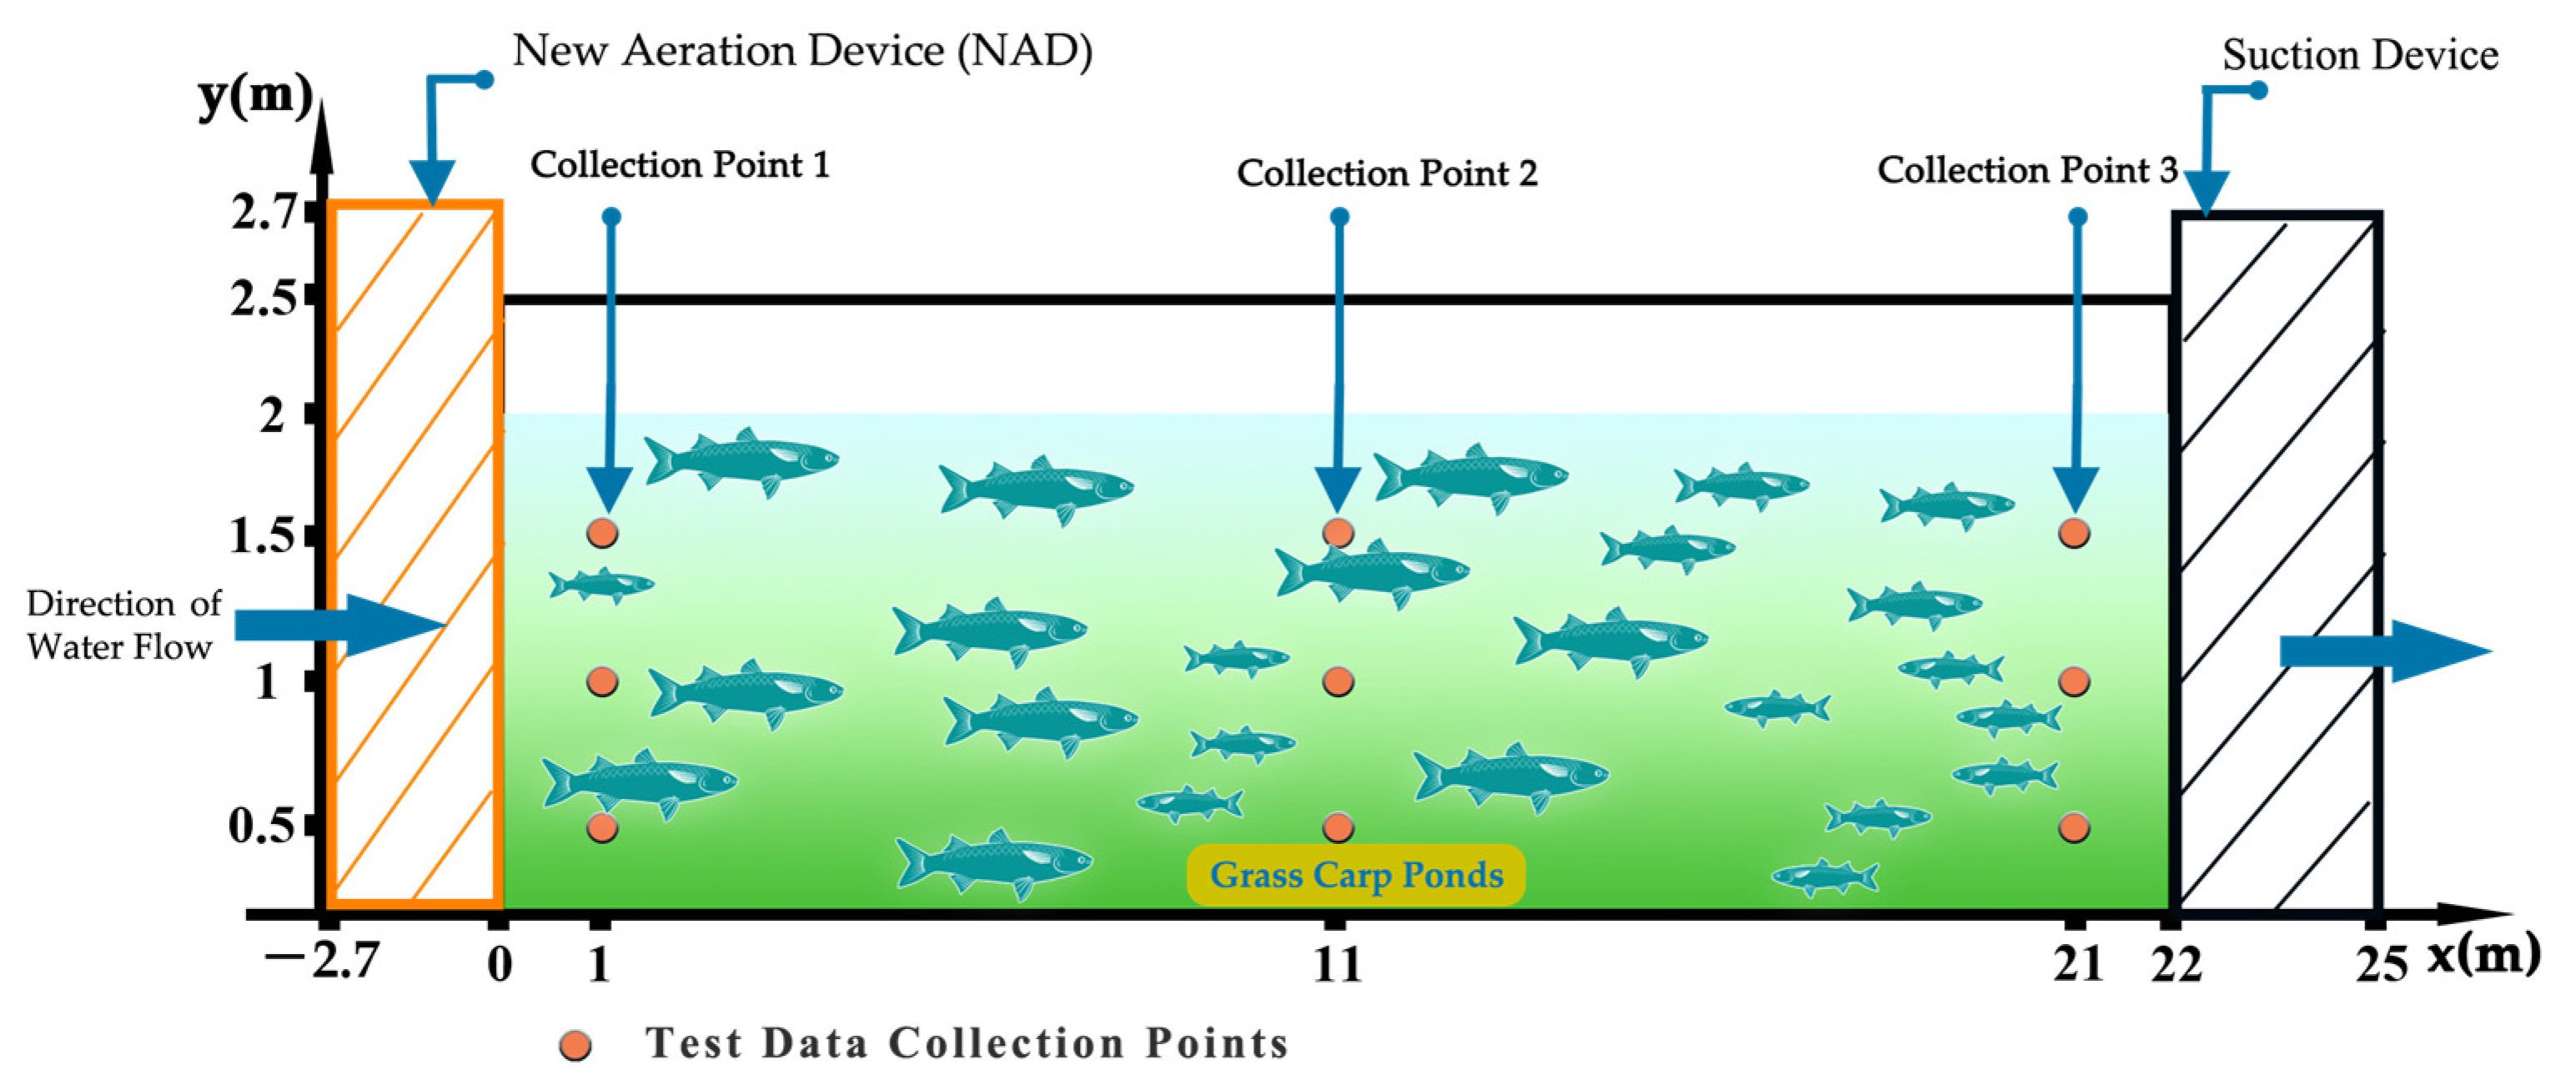
2.4.4. Setting of Collection Points

For the tests, the data collection points in the RAS were set up at three locations, which were evenly arranged along the x-axis in the positive direction 1 m, 11 m, and 21 m away from the connect point between the culture tank and the NAD, denoted as point 1, point 2, and point 3, respectively. Further, in order to comprehensively determine the changes in dissolved oxygen, three collection points for each x-axis collection point were also set up along the y-axis in the positive direction at the water depths of 1/4, 2/4, and 3/4 of the tank height. Therefore, a total of nine collection points were set up for the tests, as shown in Figure 5. In order to achieve data collection at these locations, the dissolved oxygen probe was connected to a retractable rod, so that we could adjust the probe submergence depth.

2.4.5. Design of Test Groups

Before the start of each group of tests, it was necessary to restore the operating parameters of the NAD to the preset value and achieve a stable operating state to start measuring and recording data. The frequency of data measurement at each sampling point was 5 min/time, and each group of tests was conducted for a total of 60 min. The specific experimental design is shown in Table 4.

3. Results

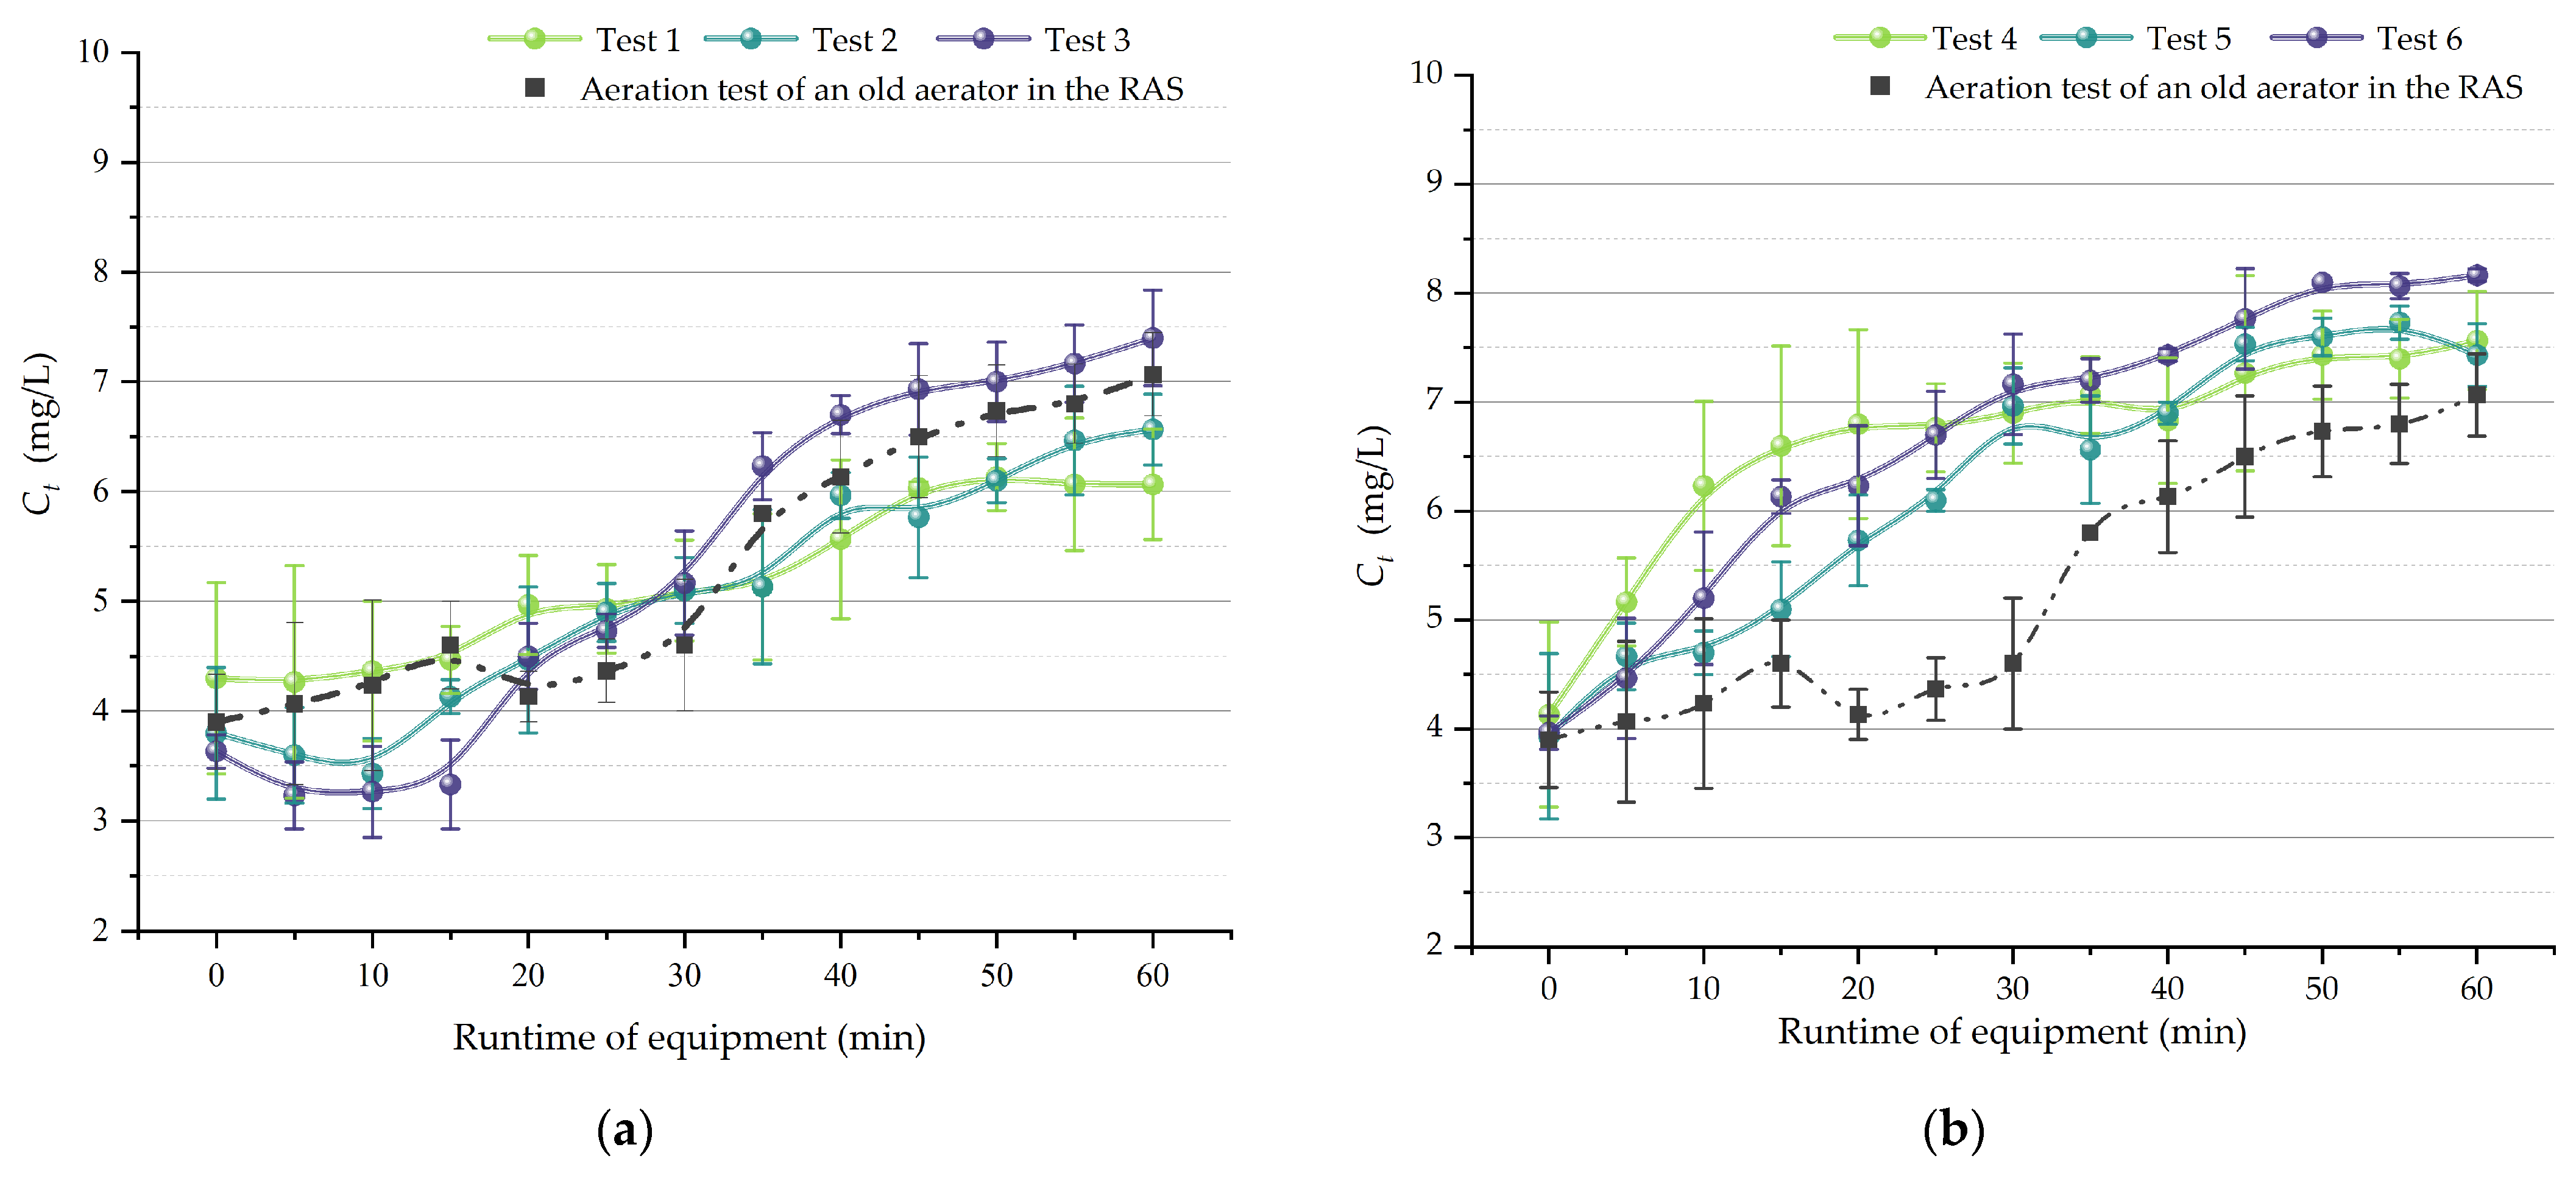
3.1. Test Results for Each Aeration Component

Figure 6a shows the variation in dissolved oxygen in the water column under three different operating conditions for the impeller oxygenation assembly. Before the three sets of tests, the initial DO ( C 0 ) in the RAS tank water fluctuated within ranges of 3.3–4.4, 3.5–3.8, and 3.8–5.3 mg/L, with large differences in the initial values among the three sets of tests. During the first 20 min of operation, there were almost no changes in these ranges. After 25 min, the dissolved oxygen level in the water gradually increased, and the intervals narrowed. Then, after 50 min, the slope of the curve flattened down, and the final DO values were 6, 6.5, and 7.5 mg/L for the rotational speeds of 600, 1000, 1400 r/min, respectively. The three sets of tests also showed that the operation of the aeration component increased the R s values in the pond water tank by 1.63, 2.30, and 2.33 mg/L, respectively. Therefore, increasing the rotational speed of the blades in an impeller aerator can effectively improve its aeration capacity.
Test groups 4, 5, and 6 were conducted under almost the same test conditions. Figure 6b shows the variation in DO under the three sets of operating parameters of the microporous aeration component. The initial dissolved oxygen in the water at the beginning of the three sets of tests ranged from 3.2 to 4.9 mg/L, which is roughly consistent with the C 0 values in the impeller aerator tests. Based on the test results, the average DO increases ( R ) in the upper, middle, and lower layers of the water tank achieved with the device were calculated to be 2.33, 3.01, and 3.37 mg/L, respectively. The average DO increases in the three test groups were 3.13, 2.50, and 3.03 mg/L, respectively.
For the first 50 min of operation of the equipment tested, the slope of the curve in the graph remains constant, showing that the DO in the pond water tank continued to increase in this period. Then, the slope of the curve gradually flattens as the DO approaches 8 mg/L, at which time K L a T tends to 0 with the increase in device operation time.
A pond oxygenation test based on commonly used equipment was conducted in the same RAS as a control for the NAD, and the results are represented by the black dotted lines in Figure 6. The initial DO ( C 0 ) was similar to those described above. During the test period, this parameter varied from 3.5 to 7.4 mg/L; the average measured mean oxygen increases ( R s ) in the upper, middle, and lower water layers were 1.89, 2.49, and 3.03 mg/L, and the mean value of R s in the water tank was 2.47 mg/L.

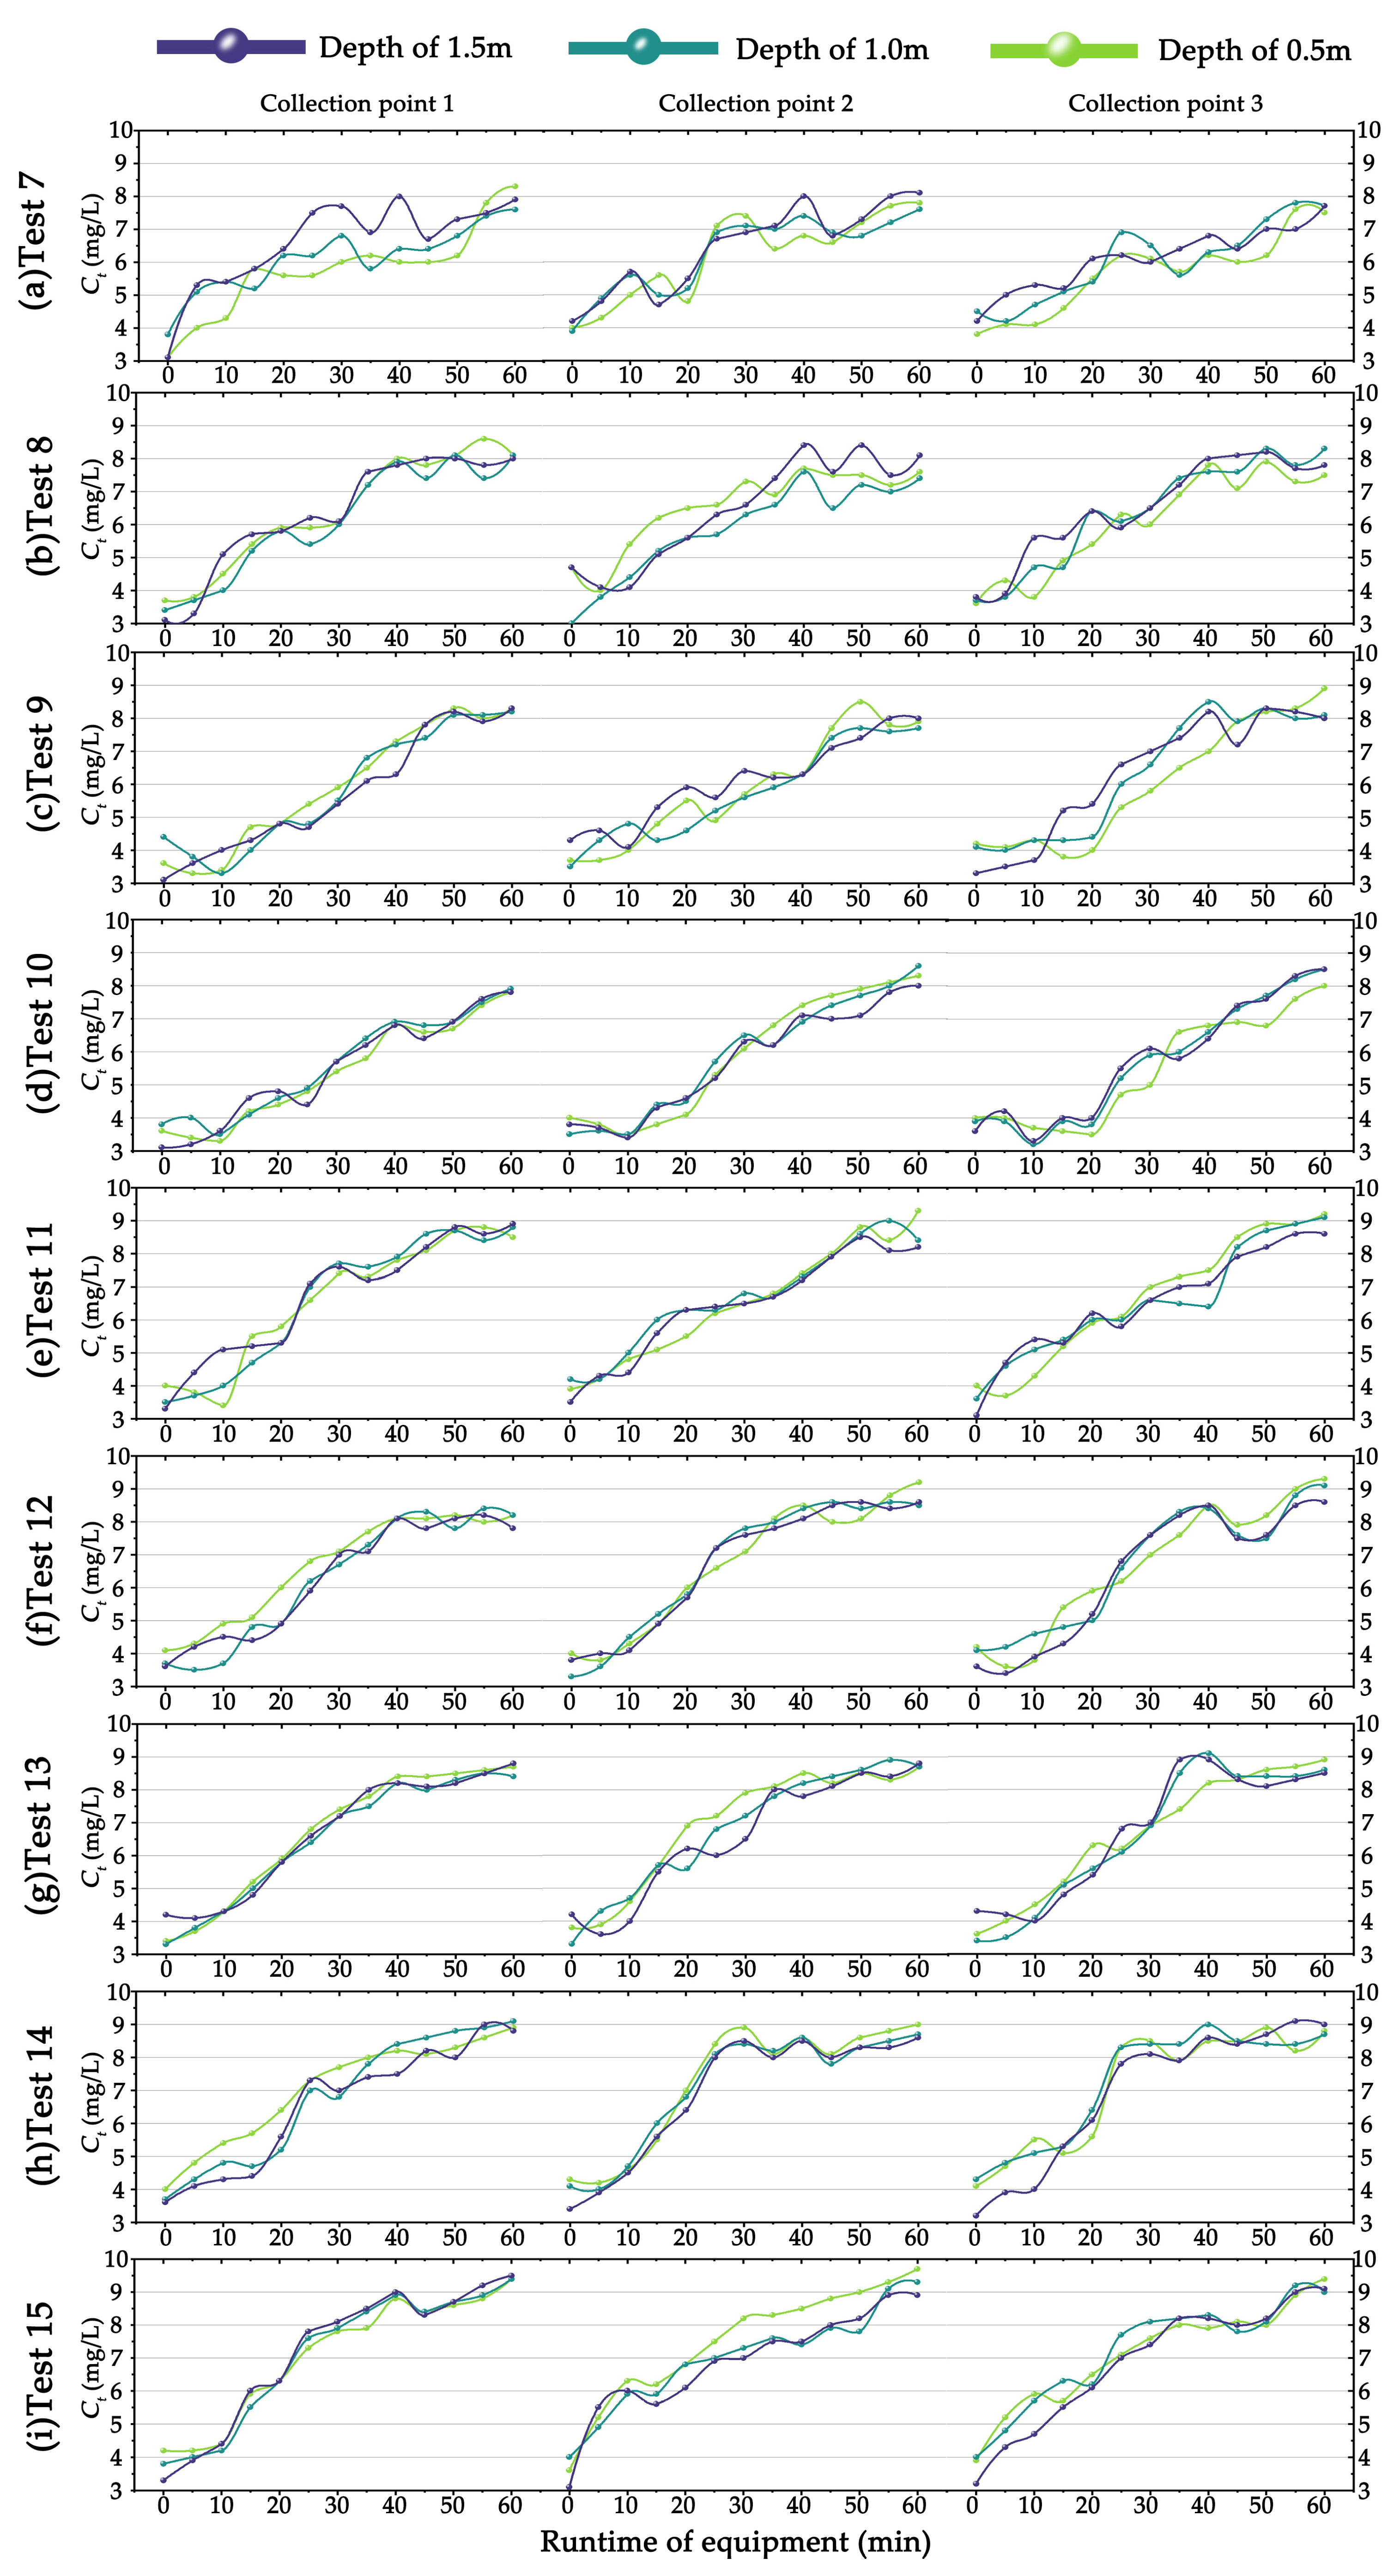
3.2. Test Results of Combined Aeration

Figure 7 shows the results of nine sets of orthogonal tests. From the figure, it can be seen that the DO ( C t ) was positively correlated with the operation time ( t ) of the NAD; i.e., it gradually increased with the increase in the operation time of the device.
In all test groups, when the device was operated for 30 min, the DO in the water tank increased to a much higher value than the initial one. This indicates that the device has a strong oxygenation capacity for RAS pond water. Moreover, the oxygenation curve gradually converged in the late stage of the test, when the oxygen transfer coefficient ( K L a T ) gradually decreased; then, the curve rapidly decreased to a specific level and maintained a dynamic equilibrium. This is because the closer the DO level is to the saturation state, the smaller the mass solubility difference is, and the lower the mass transfer coefficient is; higher DO levels in water also facilitate respiration in cultured fish, and aquatic plants and animals.
Based on the test results in Figure 7a, the average DO increase with the operating parameters of test 7 was 3.14 mg/L. Notably, there was a greater oxygen increase under these operating conditions when compared with Figure 6a. That is, when the operating parameters of the impeller aeration component remained unchanged, activating the microporous aeration component produced a better oxygenation effect, which indicates that operating both components simultaneously is beneficial for the aeration process, ascribing a greater practical application value to the NAD. The same conclusion can be drawn by comparing the other test results in Figure 6 and Figure 7.
It is worth noting the results of experiments 11 and 15, according to which the mean values of the DO increase ( R s ) were 5.50 mg/L and 5.17 mg/L and the DO distribution uniformity values were 96.6% and 98.1%, respectively. Running the device with the operating parameters of test 11 ( n 1 = 1000 r/min and n 2 = 2280 r/min) resulted in the highest average DO and oxygenation capacity; therefore, this speed was determined to be the optimal operating parameter for the device. In Figure 7, the power of the comparison RAS oxygenation device in the control group was 2.2 kW, while that of the NAD under the operating parameters of test 11 was 2.83 kW. A comparison of the above data shows that operating the NAD with 28.6% higher power under the optimal operating parameters increased DO and the oxygenation capacity of the device by 122% compared with the comparison RAS oxygenation device. Through a comparative analysis of the test results from each experimental group, it was observed that the combined operation of the two components yielded superior outcomes compared to their separate activation. This finding underscores the synergistic effect achieved by the simultaneous operation of both components, highlighting the importance of integrated approaches in optimizing the aeration efficiency within RAS.

3.3. Dissolved Oxygen Distribution Uniformity

Based on the data obtained from the tests, Table 5 shows the rates of change in dissolved oxygen distribution uniformity under various NAD operating conditions.
In the absence of artificial intervention, DO in pond water decreases as the water depth increases [30]. According to the test results in Figure 7, it can be concluded that, with the activation of the NAD, not only has the DO in the pond water tank increased, but the uniformity of its distribution has also increased, indicating the exchange among water layers in the RAS tank. On one hand, in the tests where only one of the two components was operated, it was evident that the impeller aerator increased the dissolved oxygen distribution uniformity more efficiently than the microporous aerator. On the other hand, the pond water DO distribution uniformity was greater following the NAD orthogonal tests compared with the experiments testing the individual components.

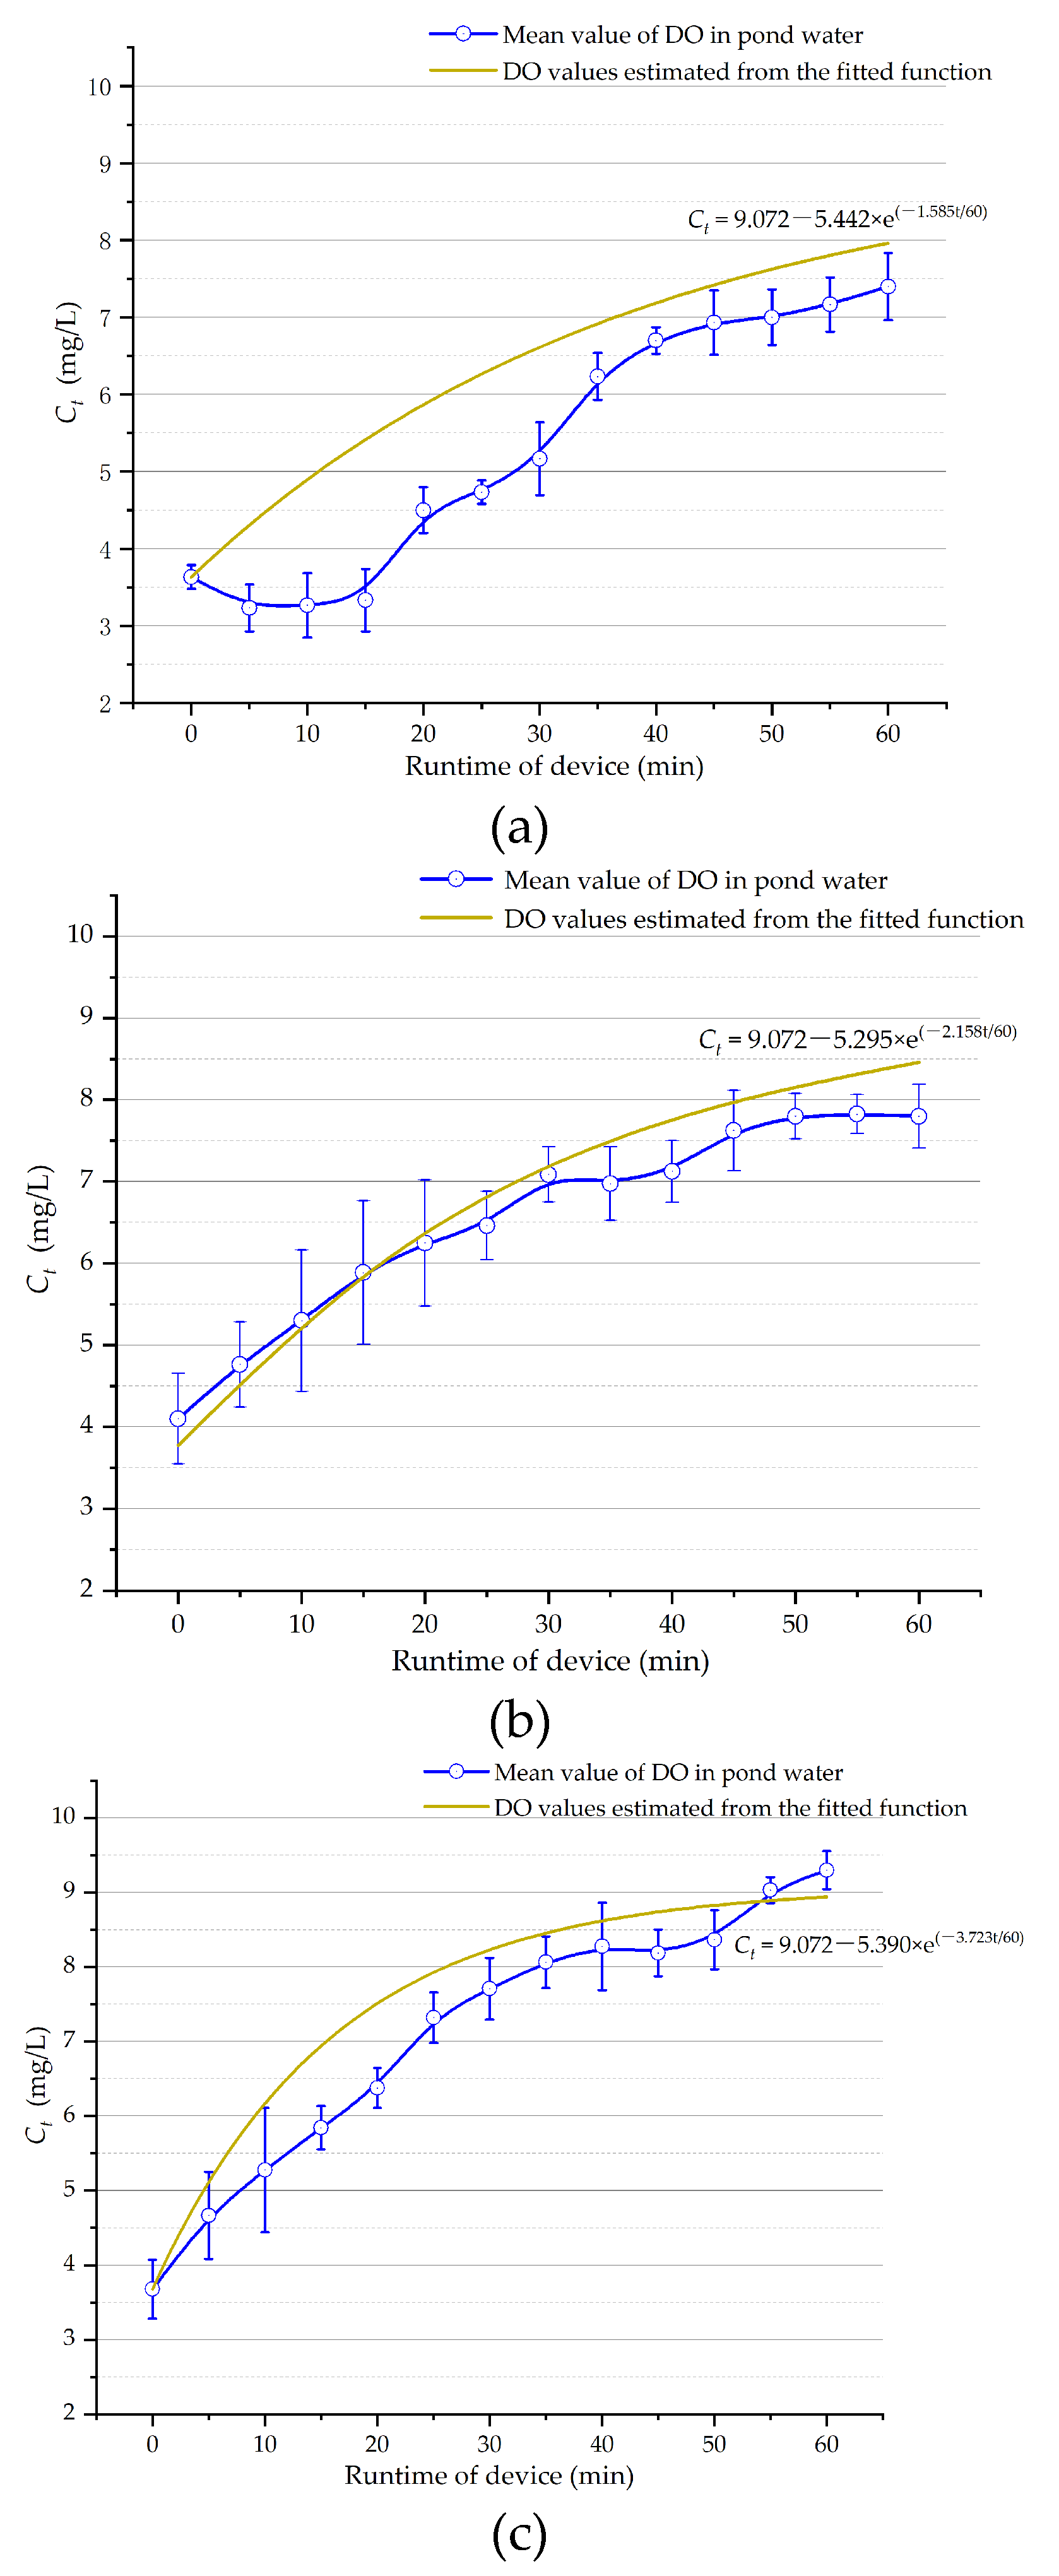
3.4. Regression Modelling of NAD in Pond Water

In this study, the OTR of the device and the oxygen transfer rate ( K L a 15 ) of the RAS tank water were estimated with Equations (13) and (16). The regression model for K L a T is a function of C t and the operating time ( t ) of the device. Moreover, the mean value of the experimental data was selected as the actual measured value to evaluate the goodness of fit with the estimated value of the regression model. The coefficient of determination of the goodness of fit, R 2 , was the metric used, as shown in Table 6.
From the graphical data shown in Table 6 and Figure 8, it can be seen that any C t can be easily determined using the equations in the table based on the provided input values of C 0 and t. In this study, the three models’ (impeller, microporous aeration components, and NAD) coefficients of determination ( R 2 ) were 0.901, 0.992, and 0.938, respectively, which indicates that the regression models are well-fitted and all have a degree of error of less than 10%. It can also be found that, when the two aeration components are operated in combination, the oxygen transfer rate is higher, and the oxygenation effect observable in pond water is better. Therefore, the device meets the aerator design requirements. From the point of view of RAS application, the dissolved oxygen level in pond water can be increased extremely quickly by using the device.

4. Discussion

This study investigated the ability of NAD to rapidly increase oxygen levels under hypoxic conditions and verified its effectiveness in the water layer exchange within RAS ponds. Furthermore, the characteristics of each of the two aerators were elucidated. Microporous aerators, known for their highly efficient and economically viable nature, are particularly suitable for ponds with volumes of less than 1000 m3. Conversely, the waterwheel oxygenator exhibits robust push flow capabilities and a moderate mixing ability, thereby augmenting the oxygen–liquid contact area [31]. Studies conducted by the Chinese Academy of Aquatic Sciences (CAAS) indicate that impeller oxygenators typically exhibit standard oxygen transfer rates (STORs) ranging from 2.16 to 2.59 kg/h. However, the research by Gu Jian et al. showcased that the microporous aerator used for pond aeration achieved a STOR of 4.49 kg/h [32]. Despite this higher transfer rate, it remains insufficient to meet the oxygen demand of cultured fish [33]. Given the suboptimal performance of the current RAS oxygenation equipment, this study proposes a novel method that combines flow generation and oxygenation using aerators. A new flow generation and oxygenation equipment with a STOR of 5.23 kg/h was designed and tested in an outdoor environment, demonstrating its feasibility. The results underscore the efficacy of employing multiple aerators in RAS aquaculture practice, yielding superior outcomes compared to deploying individual components.
In aquaculture practice, environmental conditions such as temperature, salinity, light, and DO levels are often challenging to control, leading to circumstances where they may only be monitored or maintained at tolerable, rather than optimal, levels [34]. Deviations from optimal environmental conditions can severely limit the growth performance of fish. For instance, the feeding rates were low under low-temperature conditions despite the high oxygen availability [35]. Conversely, high temperatures increase metabolic rates in fish, leading to a higher oxygen demand. To address this, NAD introduced two types of aeration devices that allow for variable frequency control. DO levels can be adjusted in a timely manner by using different combinations of operating parameters depending on the environmental conditions. Consequently, environmental conditions became less critical for fish growth.
Aquaculture’s oxygen demand exhibits daily fluctuations and responds to diverse climatic conditions. An analysis of the test results, as depicted in Figure 3, reveals that, on sunny days, the dissolved oxygen content in the upper water column gradually increases from 7:00 a.m. until reaching its peak at noon. Conversely, during the night (between 22:00 and 8:00 the following day), the dissolved oxygen values in both upper and lower pond layers drop below 5.0 mg/L, necessitating the activation of an oxygenator with a significant oxygenation capacity to ensure optimal fish growth. During other periods, changes in the dissolved oxygen concentration in the upper water body are minimal due to saturation by light, whereas the middle and lower water layers are less affected. The role of the oxygenator during these periods primarily involves stirring the pond water to facilitate the water layer exchange.
Consequently, aerators should not be excessively used, and their utilization should be limited to instances when supplemental oxygen is required, thus reducing the energy consumption for aeration and pumping, and, consequently, reducing production costs. During favorable weather conditions, operating the NAD at low parameters can sustain daily fish oxygen consumption, providing an effective manner to balance aeration use with need.

5. Conclusions

These considerations indicate that the NAD meets the needs of RAS aquaculture practice and the design requirements. The optimal motor speeds of the microporous aeration and impeller water lifting components ( n 1 and n 2 , respectively) of the NAD were found to be 1000 r/min and 2280 r/min, respectively. With these operating parameters, the mean value of the average oxygen increase ( R s ) was 5.50 mg/L, and the DO distribution uniformity ( M 1 ) in the water column was 96.6%. Further, the oxygenation capacity was increased by 122% compared with the currently used RAS oxygenation equipment. The NAD was found to fit the corresponding regression model very well, and the latter produced similar estimates to those of current pond aerators. The aerator was implemented in an RAS, and the oxygenation achieved by using the two components together was greater than that achieved by operating one of the currently used aerators alone.

Author Contributions

Conceptualization, K.H.; methodology, C.T.; software, K.H.; validation, K.H. and H.H.; investigation, K.H. and C.T.; resources, C.T.; data curation, K.H. and H.H.; writing—original draft preparation, C.T.; writing—review and editing, C.T. and H.H.; visualization, K.H.; supervision, C.T.; project administration, C.T.; funding acquisition, C.T. All authors have read and agreed to the published version of the manuscript.

Funding

This research was funded by the Hunan Provincial Key R&D Programme, grant number 2022NK2028; 2024 Hunan Provincial Natural Science Foundation Upper-level Programs, grant number 2020JJ4045; the Hunan Province Degree and Postgraduate Teaching Reform Research Project, grant number 2022JGSZ040; the Scientific Research Project of Hunan Provincial Education Department, grant number 22B0186.

Institutional Review Board Statement

Not applicable.

Informed Consent Statement

Not applicable.

Data Availability Statement

The data used to support the findings of this study are available from the corresponding author upon request. The data are not publicly available due to privacy.

Acknowledgments

The authors are very grateful to Kaitian New Agricultural Science and Technology Co. in Hunan Province, China, for providing the test site. The authors would like to express their appreciation for the valuable suggestions and support of Lvhang He, Haoyu Liu and Yihua Wu.

Conflicts of Interest

Author Haoyu Hu is employed by the company Hunan Kaitian New Agricultural Technology Co., Ltd. The remaining authors declare that the research was conducted in the absence of any commercial or financial relationships that could be construed as a potential conflict of interest.

References

  1. Liu, X.G.; Shao, Z.Y.; Cheng, G.F.; Gu, Z.; Zhu, H. Ecological engineering in pond aquaculture: A review from the whole-process perspective in China. Rev. Aquac. 2021, 13, 1060–1076. [Google Scholar] [CrossRef]
  2. Naylor, R.L.; Hardy, R.W.; Bush, A.H.; Cao, L.; Klinger, D.H. A 20-year retrospective review of global aquaculture. Nature 2021, 591, 551–563. [Google Scholar] [CrossRef] [PubMed]
  3. Brune, D.E.; Schwartz, G.; Eversole, A.G.; Collier, J.A.; Schwedler, T.E. Intensification of pond aquaculture and high rate photosynthetic systems. Aquac. Eng. 2003, 28, 65–86. [Google Scholar] [CrossRef]
  4. Drapcho, C.M.; Brune, D.E. The partitioned aquaculture system: Impact of design and environmental parameters on algal productivity and photosynthetic oxygen production. Aquac. Eng. 2000, 21, 151–168. [Google Scholar] [CrossRef]
  5. Brune, D.E.; Schwartz, G.; Eversole, A.G.; Collier, J.A.; Schwedler, T.E. 19 Partitioned aquaculture systems. Dev. Aquac. Fish. Sci. 2004, 34, 561–584. [Google Scholar] [CrossRef]
  6. Hu, J.C. Influence of Design and Operation of Aeration Push Device on Recirculating Aquaculture System. Master’s Thesis, South China University of Technology, Guangzhou, China, 2018. [Google Scholar]
  7. Brown, T.W.; Chappell, J.A.; Boyd, C.E. A commercial-scale, in-pond raceway system for Ictalurid catfish production. Aquac. Eng. 2011, 44, 72–79. [Google Scholar] [CrossRef]
  8. Li, W.H.; Cheng, X.J.; Xie, J.; Wang, Z.; Yu, D. Hydrodynamics of an in-pond raceway system with an aeration plug-flow device for application in aquaculture: An experimental study. R. Soc. Open Sci. 2019, 6, 182061. [Google Scholar] [CrossRef] [PubMed]
  9. Yadav, A.; Kumar, A.; Sarkar, S. Economic comparison of venturi aeration system. Aquac. Int. 2022, 30, 2751–2774. [Google Scholar] [CrossRef]
  10. Nguyen, N.T.; Matsuhashi, R.; Vo, T.T.B.C. A design on sustainable hybrid energy systems by multi-objective optimization for aquaculture industry. Renew. Energy 2021, 163, 1878–1894. [Google Scholar] [CrossRef]
  11. Roy, S.M.; Moulick, S.; Mukherjee, C.K. Design characteristics of perforated pooled circular stepped cascade (PPCSC) aeration system. Water Supply 2020, 20, 1692–1705. [Google Scholar] [CrossRef]
  12. Adel, M.; Shaalan, M.R.; Kamal, R.M.; EI Monayeri, D.S. A comparative study of impeller aerators configurations. Alex. Eng. J. 2019, 58, 1431–1438. [Google Scholar] [CrossRef]
  13. Dayıoğlu, M.A. Experimental study on design and operational performance of solar-powered venturi aeration systemdeveloped for aquaculture–A semi-floating prototype. Aquac. Eng. 2022, 98, 102255. [Google Scholar] [CrossRef]
  14. Zhang, Z.L.; Gu, H.T.; He, Y.P. Study on the test of oxygen effect of aerator in pond. Fish. Mod. 2012, 39, 64–68. [Google Scholar]
  15. Xu, Z.M. Calculation of aeration tank air piping and blower selection. Constr. Technol. Newsl. (Water Supply Drain.) 1979, 1, 4–10. [Google Scholar] [CrossRef]
  16. Marchildon, K.; Mody, D. Pumps, Fans, Blowers, and Compressors. In Mechanical Engineers’ Handbook: Energy and Power; John Wiley & Sons, Inc.: Hoboken, NJ, USA, 2006; Volume 4, pp. 717–752. [Google Scholar]
  17. Lin, Z.; Jia, B.; Qing, Z.; Li, Q. Experimental research of flow detection based on parallel pipeline. J. Saf. Sci. Technol. 2022, 18, 96–102. [Google Scholar] [CrossRef]
  18. Li, Z.A. Research and Design of Triangular Blade Waterwheel Aerators. Bachelor’s Thesis, Journal of Beijing Agricultural Engineering University, Beijing, China, 1992; pp. 54–59. [Google Scholar]
  19. Elger, D.F.; LeBret, B.A.; Crowe, C.T.; Roberson, J.A. Engineering Fluid Mechanics; John Wiley & Sons: Hoboken, NJ, USA, 2020. [Google Scholar]
  20. Roy, S.M.; Moulick, S.; Mal, B.C. Design characteristics of spiral aerator. J. World Aquac. Soc. 2017, 48, 898–908. [Google Scholar] [CrossRef]
  21. Chen, W.B.; Liu, W.C. Artificial neural network modeling of dissolved oxygen in reservoir. Environ. Monit. Assess. 2014, 186, 1203–1217. [Google Scholar] [CrossRef] [PubMed]
  22. AntanasijeviĆ, D.; Pocajt, V.; PovrenoviĆ, D.; Perić-Grujić, A.; Ristić, M. Modelling of dissolved oxygen content usingartificial neural networks: Danube River, North Serbia, case study. Environ. Sci. Pollut. Res. 2013, 20, 9006–9013. [Google Scholar] [CrossRef] [PubMed]
  23. Zhao, S.Q.; Zhao, S.Q.; Gu, J.B. Analysis and research on dissolved oxygen stability in the feeding area of pond aquaculture. J. Chin. Agric. Mech. 2023, 44, 74–81. [Google Scholar]
  24. Badiola, M.; Mendiola, D.; Bostock, J. Recirculating aquaculture systems (RAS) analysis: Main issues on management and future challenges. Aquac. Eng. 2012, 51, 26–35. [Google Scholar] [CrossRef]
  25. Roy, S.M.; Machavaram, R.; Moulick, S.; Mukherjee, C.K. Economic feasibility study of aerators in aquaculture using life cycle costing (LCC) approach. J. Environ. Manag. 2022, 302, 114037. [Google Scholar] [CrossRef] [PubMed]
  26. Boyd, C.E.; Tucker, C.S.; Tucker, C.S. Ecology of Aquaculture Ponds. In Pond Aquaculture Water Quality Management; Springer: Berlin/Heidelberg, Germany, 1998; pp. 8–77. [Google Scholar]
  27. Boyd, C.E.; Torrans, E.L.; Tucker, C.S. Dissolved oxygen and aeration in ictalurid catfish aquaculture. J. World Aquac. Soc. 2017, 49, 7–79. [Google Scholar] [CrossRef]
  28. Ding, X.W.; Zhang, S.G.; Sun, X.C.; Zhao, W.; Gao, Z. Experimental study on applying biofan to cultivate Penaeus vannamei. Trans. CSAE 2010, 26, 130–135. [Google Scholar]
  29. Rice, E.W.; Bridgewater, L.; American Public Health Association (Eds.) Standard Methods for the Examination of Water and Wastewater; American Public Health Association: Washington, DC, USA, 2012; Volume 10. [Google Scholar]
  30. Gu, H.T.; Zhang, Z.L.; Cao, J.J. Performance Study of Surge Oxygenator. Fish. Mod. 2019, 46, 35–39. [Google Scholar]
  31. Gu, J.; Gu, H.T.; Men, T.; Liu, X.; Cao, J. Performance comparison for different mechanical aeration methods in pond. Trans. CSAE 2011, 27, 148–152. [Google Scholar]
  32. Gu, J.; Men, T.; Liu, X.G.; Din, J.; Gu, C. Energy-saving technology for pond mechanical aeration based on oxygen mass transfer. Trans. CSAE 2011, 27, 120–125. [Google Scholar]
  33. Zhang, Z.L.; Gu, H.T.; He, Y.P. A study on the test of oxygenation effect of aerators in ponds. Fish. Mod. 2012, 39, 64–68. [Google Scholar]
  34. Burel, C.; Person-Le Ruyet, J.; Gaumet, F.; Le Roux, A.; Severe, A.; Boeuf, G. Effects of temperature on growth and metabolism in juvenile turbot. J. Fish Biol. 1996, 49, 678–692. [Google Scholar] [CrossRef]
  35. Buentello, J.A.; Gatlin, D.M., III; Neill, W.H. Effects of water temperature and dissolved oxygen on daily feed consumption, feed utilization and growth of channel catfish (Ictalurus punctatus). Aquaculture 2000, 182, 339–352. [Google Scholar] [CrossRef]
Figure 1. A schematic diagram of the RAS and the NAD constructed in the freshwater pond under study. (a) RAS in the freshwater pond. (b) NAD installation in RAS.
Applsci 14 03401 g001
Figure 2. Specific structure of the NAD: (A) impeller aeration component; (B) microporous aeration component. (1) Load-bearing float; (2) feeder; (3) control box; (4) inclined plate adjusting rod; (5) centrifugal fan; (6) aeration pipeline; (7) water baffle plate; (8) aeration disc; (9) buoy; (10) bearing seat; (11) water-flow-generating impeller; (12) electric motor for component; (13) coupling; (14) impeller shaft; (15) bearing.
Applsci 14 03401 g002
Figure 3. Variations in natural conditions of test pond’s DO content during 24 h period.
Applsci 14 03401 g003
Figure 4. Measuring instruments used in tests.
Applsci 14 03401 g004
Figure 5. Collection points for tests distributed at specific locations in RAS water tank.
Applsci 14 03401 g005
Figure 6. Variations in DO under different operating conditions when the two oxygenation components were operated individually: (a) impeller aeration component; and (b) microporous aeration component.
Applsci 14 03401 g006
Figure 7. Variations in DO in orthogonal tests with different NAD operating parameters. Results of (a) test 7, (b) test 8, (c) test 9, (d) test 10, (e) test 11, (f) test 12, (g) test 13, (h) test 14, and (i) test 15.
Applsci 14 03401 g007
Figure 8. Degree of fit of regression model of oxygen transfer rate under different NAD operating conditions to experimental data. Regression modelling of DO changes in pond water during operation of (a) impeller aerator, (b) microporous aerator, and (c) NAD.
Applsci 14 03401 g008
Table 1. Specific parameters for all pipes.
NameFlow Rate
Q [m3/h]
Length
L [m]
Diameter
D [m]
Airflow Rate
V [m/s]
Pressure Loss along
the Pipeline
h 1 [kPa]
Local Pressure Loss
h 2 [kPa]
Main pipe2402.000.0813.43.370.136
All branch pipes3048.000.056.71.501.4872
Table 2. Main design parameters of microporous aeration component.
Name Parameter ValueUnit
Machine size (length × width × height)3000 × 5000 × 2850mm
Number of aeration discs475/
Size of aeration holes3.2mm
Angle of inclined plate40–60°
Vertical height of inclined plate2m
Minimum boost pressure for fan−290kPa
Theoretical outlet flow rate of fan230m3/h
Total motor power2.2kW
Standard oxygen transfer rate (SOTR)2.25Kg/h
Table 3. Main design parameters of impeller aeration component.
Name Parameter ValueUnit
Calibre500mm
Individual impeller diameter380mm
Blade width100mm
Number of blades8/
Shaft assembly diameter50mm
Total motor power1.5kW
Standard oxygen transfer rate (SOTR)2.25Kg/h
Table 4. Test design of Influence of operating parameters on aerator effect.
Test GroupOperating Status of the Two Components Rotational SpeedMotor Power
( P F ) [kW]
Test Data
Collection Points
Impeller Aeration ComponentMicroporous Aeration Component n 1
[r/min]
n 2
[r/min]
1Applsci 14 03401 i001Applsci 14 03401 i00260000.641
2Applsci 14 03401 i003Applsci 14 03401 i004100001.071
3Applsci 14 03401 i005Applsci 14 03401 i006140001.501
4Applsci 14 03401 i007Applsci 14 03401 i008015201.171
5Applsci 14 03401 i009Applsci 14 03401 i010022801.761
6Applsci 14 03401 i011Applsci 14 03401 i012028502.201
7Applsci 14 03401 i013Applsci 14 03401 i01460015201.811, 2, 3
8Applsci 14 03401 i015Applsci 14 03401 i01660022802.401, 2, 3
9Applsci 14 03401 i017Applsci 14 03401 i01860028502.841, 2, 3
10Applsci 14 03401 i019Applsci 14 03401 i020100015202.241, 2, 3
11Applsci 14 03401 i021Applsci 14 03401 i022100022802.831, 2, 3
12Applsci 14 03401 i023Applsci 14 03401 i024100028503.271, 2, 3
13Applsci 14 03401 i025Applsci 14 03401 i026140015202.671, 2, 3
14Applsci 14 03401 i027Applsci 14 03401 i028140022803.261, 2, 3
15Applsci 14 03401 i029Applsci 14 03401 i030140028503.701, 2, 3
Table 5. Dissolved oxygen distribution uniformity ( M 1 ) in pond water tank in each set of tests with NAD.
Test Group Dissolved   Oxygen   Distribution   Uniformity   M 1 [%]
Pre-TestPost-TestChange Value
183.194.311.2
281.294.112.9
383.598.715.2
481.385.23.9
585.487.62.2
682.689.46.8
784.596.111.6
878.698.019.4
975.997.221.3
1077.197.019.9
1180.396.616.3
1279.397.117.8
1382.398.816.5
1482.098.416.4
1581.498.116.7
Table 6. Regression modelling of oxygen transfer rates ( K L a T ) in RAS tank water under different NAD operating conditions ( T = 15 °C, α = 0.95, and β = 0.9).
AeratorsMotor Power
[kW]
SOTR
[kg/h]
Regression Models R 2 Value
Impeller aeration component1.52.25 C t = 9.072 5.442 e ( 1.585 t 60 ) 0.901
Microporous aeration component2.22.98 C t = 9.072 5.295 e ( 2.158 t 60 ) 0.992
NAD3.75.23 C t = 9.072 5.390 e ( 3.723 t 60 ) 0.938
Disclaimer/Publisher’s Note: The statements, opinions and data contained in all publications are solely those of the individual author(s) and contributor(s) and not of MDPI and/or the editor(s). MDPI and/or the editor(s) disclaim responsibility for any injury to people or property resulting from any ideas, methods, instructions or products referred to in the content.

