1. Introduction
The human perception of vibration stands as a fundamental parameter in the design of new buildings situated in proximity to transport sources. Despite numerous past investigations and the existing standards and regulatory requirements in this field, the subjective nature of vibration perception by diverse individuals still renders it a topic that is not fully comprehended. The biggest influence on human perception of vibration is floor acceleration [
1].
This paper aims to scrutinize the human perception of railway vibrations, utilizing a specific building as an illustrative example. While the literature contains various studies on railway-induced vibration and its associated annoyance (cf. [
2,
3,
4,
5]), these studies often overlook considerations pertaining to protection against the adverse effects of vibration. It is noteworthy that low-frequency vibrations, particularly in the range of 5–25 Hz, can pose potential risks to human health due to their proximity to the resonant frequencies of internal organs [
6]. Such vibrations may lead to sleep disorders, headaches, and neurotic conditions [
7,
8]. Furthermore, the precise factors influencing human perception of vibration remain unclear. Individuals exhibit heightened sensitivity to unexpected low-frequency vibrations, emphasizing the importance of incorporating vibrational comfort as a fundamental criterion in building design [
9,
10].
While some authors establish connections between height, gender, or age and vibration perception [
9,
10], others do not [
11], contributing to the non-deterministic nature of research on human vibration perception. Another crucial aspect is the active versus passive perception of vibrations. Active perception arises when vibrations are directly transmitted to the body from the vibration source, common among operators of construction machinery or vehicle drivers and passengers [
12,
13]; passive perception, on the other hand, occurs when vibrations are transmitted from the source to the human body through a medium, typically the ground. This situation predominantly occurs in buildings where vibrations are transmitted from transport sources [
14,
15].
This article specifically delves into the passive perception of vibration within a building induced by the passage of trains. In such scenarios, according to [
16], three evaluation methods are employed: the root mean squared method (RMS); vibration dose value (VDV); and maximum transient vibration value (MTVV). The RMS method, as referred to in [
16], is considered the basic method suitable for vibrations exhibiting a low crest factor. The crest factor, defined as the modulus of the ratio between the maximum instantaneous peak value of the frequency-weighted acceleration signal and its RMS value, plays a crucial role in this evaluation:
The RMS method averages acceleration values in the time duration:
where
aw(
t) is the weighted acceleration as a function of time [m/s
2], and
T is the duration of measurement [s].
The MTVV method also averages acceleration values but is more sensitive to occasional shocks and transient vibration, using a short integration time constant:
where
τ is the integration time (for running averaging, it is recommended to use τ = 1 s), and
t0 is the time of observation (instantaneous time).
The VDV method is best for peaks in recorded signals because it uses the fourth power instead of the second power, as is used in RMS and MTVV:
Considering the passive perception of vibration in buildings, there are five diagnosis situations in which vibrations are investigated (comp.
Table 1).
Diagnosis represents the simplest scenario, necessitating only measurements. Subsequent situations demand the incorporation of models. The most challenging diagnostic circumstance, particularly for experts, is a posteriori diagnosis, relying on expert judgment due to its non-reproducibility. This article focuses on a diagnostic scenario wherein the building and railway source already exist, incorporating prediction and regression.
In situ measurements demand meticulous planning, involving reconnaissance for local insight, selection of the measurement room (preferably a residence situated on the side experiencing dynamic excitation), and choosing measurement points based on the desired information. The selection of measurement points hinges on whether the focus is on the human perception of vibration or the influence of vibration on the building. In the former case, the measurement point should be strategically placed where human perception of vibration is most pronounced, typically at the center of the floor. Conversely, when investigating the influence of vibration on the building, the measurement point should be situated on the ground level in the building’s stiff node (typically the corner) closest to the excitation source.
It is crucial to highlight that the choice of the measurement room is not arbitrary. For ground excitation, the optimal location is on the top floor of the building, whereas for underground excitation, the most suitable location is the lowest floor. This strategic selection enhances the accuracy and relevance of the measurements in capturing the nuances of vibration perception and its impact on the building structure.
2. The Analyzed Building
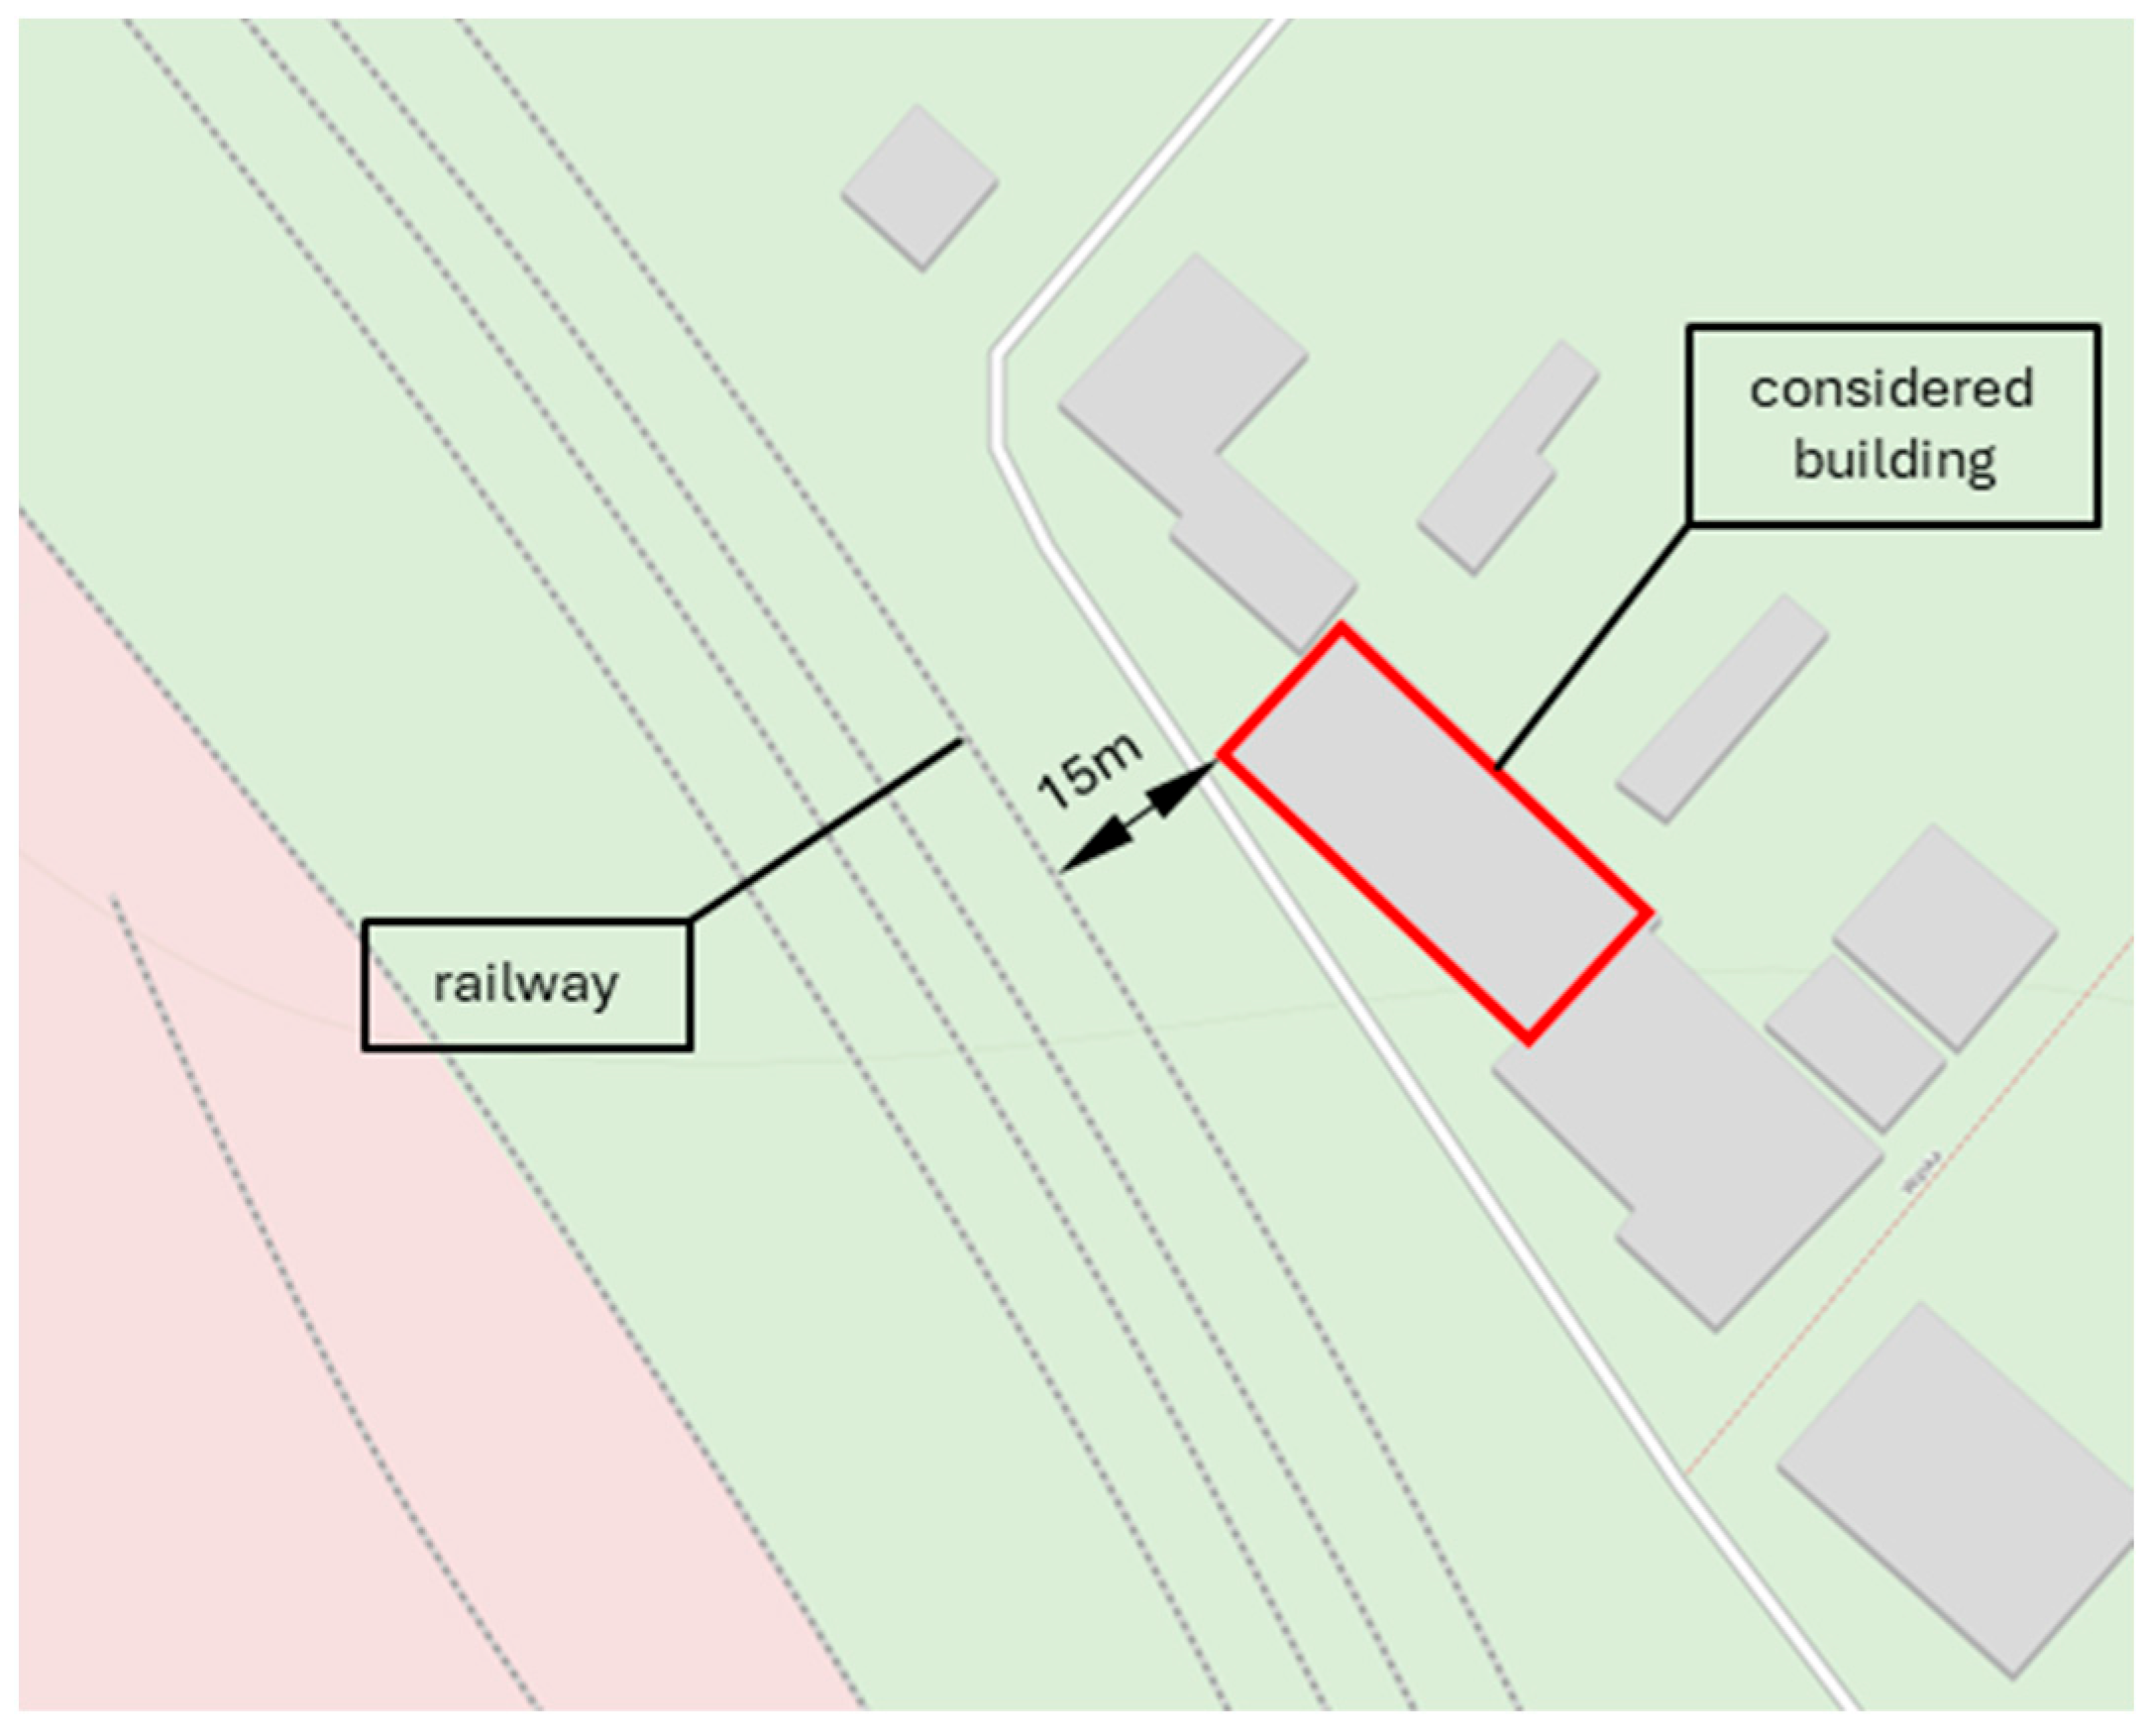
The selected structure for analysis is a masonry multi-family residential building situated approximately 15 m from a high-speed railway (refer to
Figure 1). Specifically located at Wezilera 28St., Zawiercie, it stands in proximity to the Central Railway Line, which extends from the south to the north of Poland.
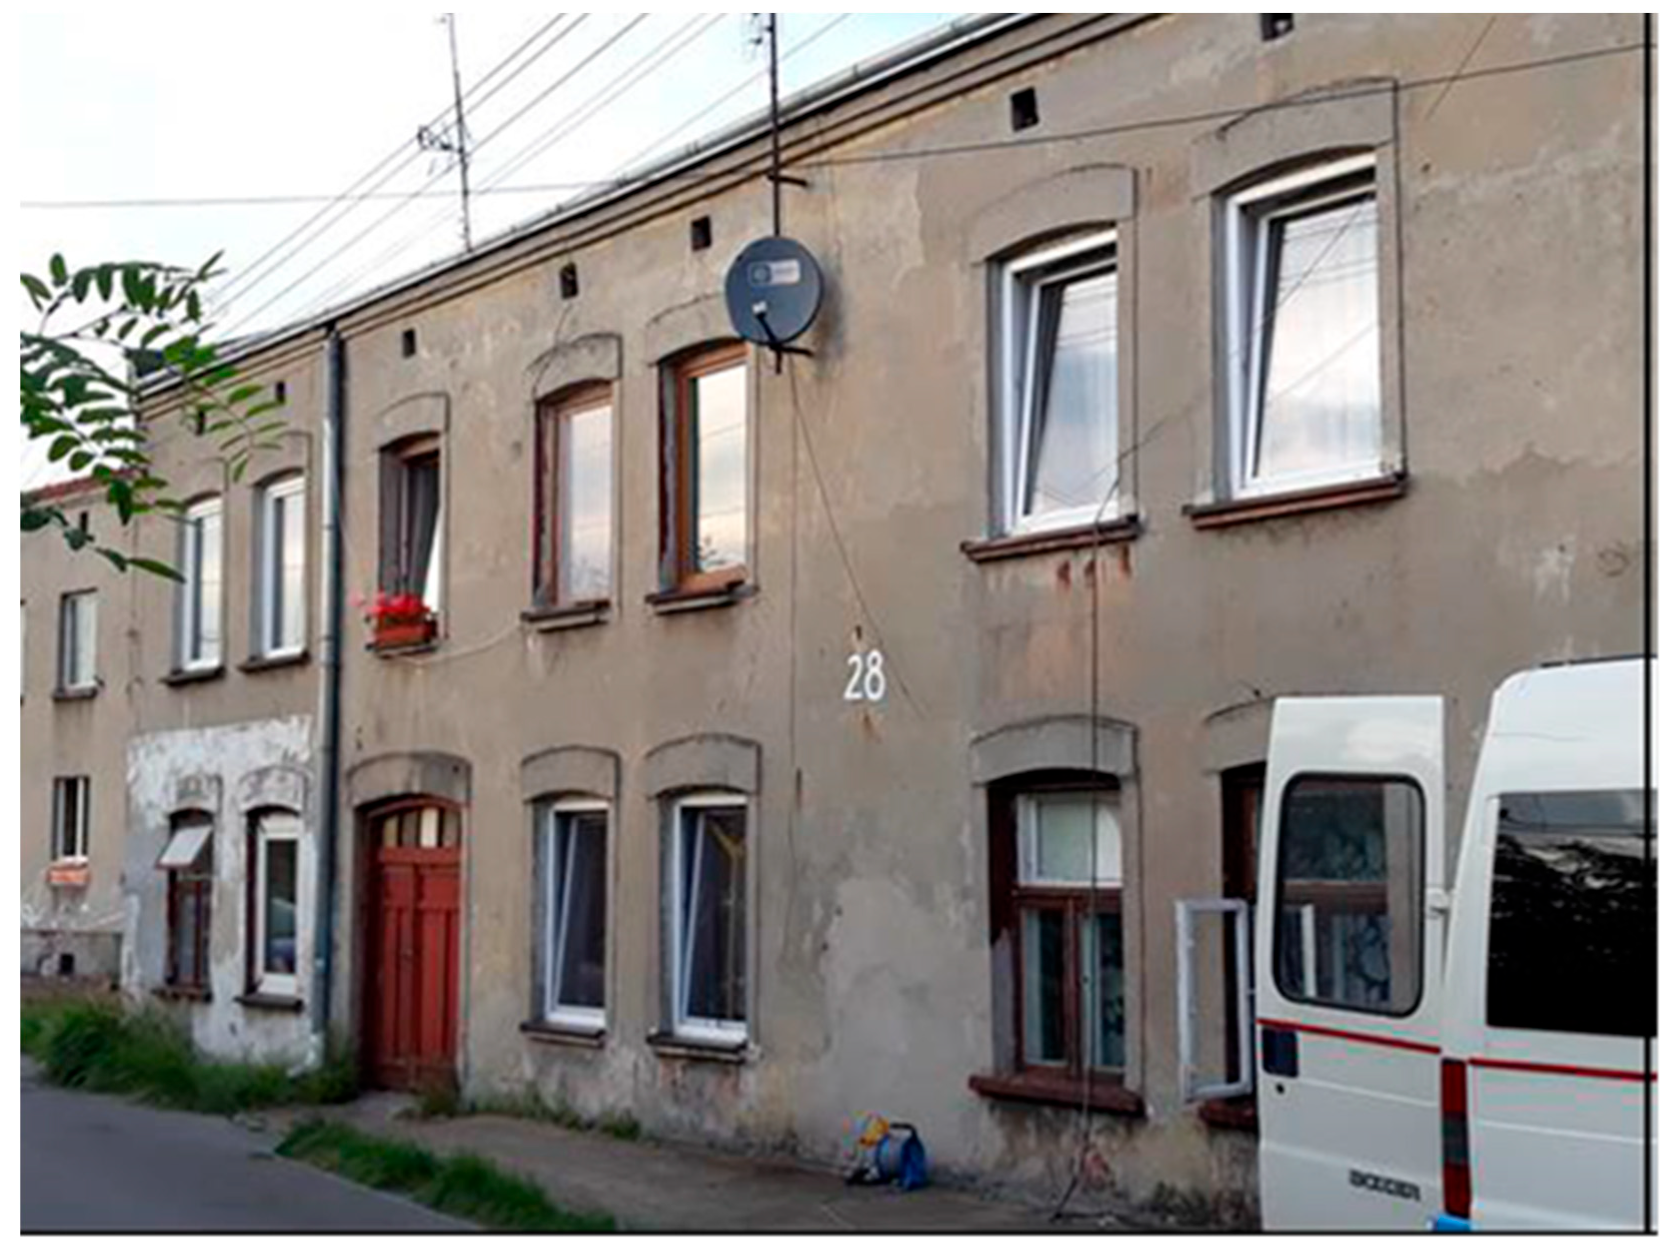
Notably, the building exhibits signs of deterioration, including visible cracks, and is of particular significance due to its construction featuring wooden floors (refer to
Figure 2). This type of flooring is highly susceptible to ground-transmitted vibrations and is commonly found in aged masonry buildings across Poland.
3. Measurement Methodology
3.1. Duration of Vibration
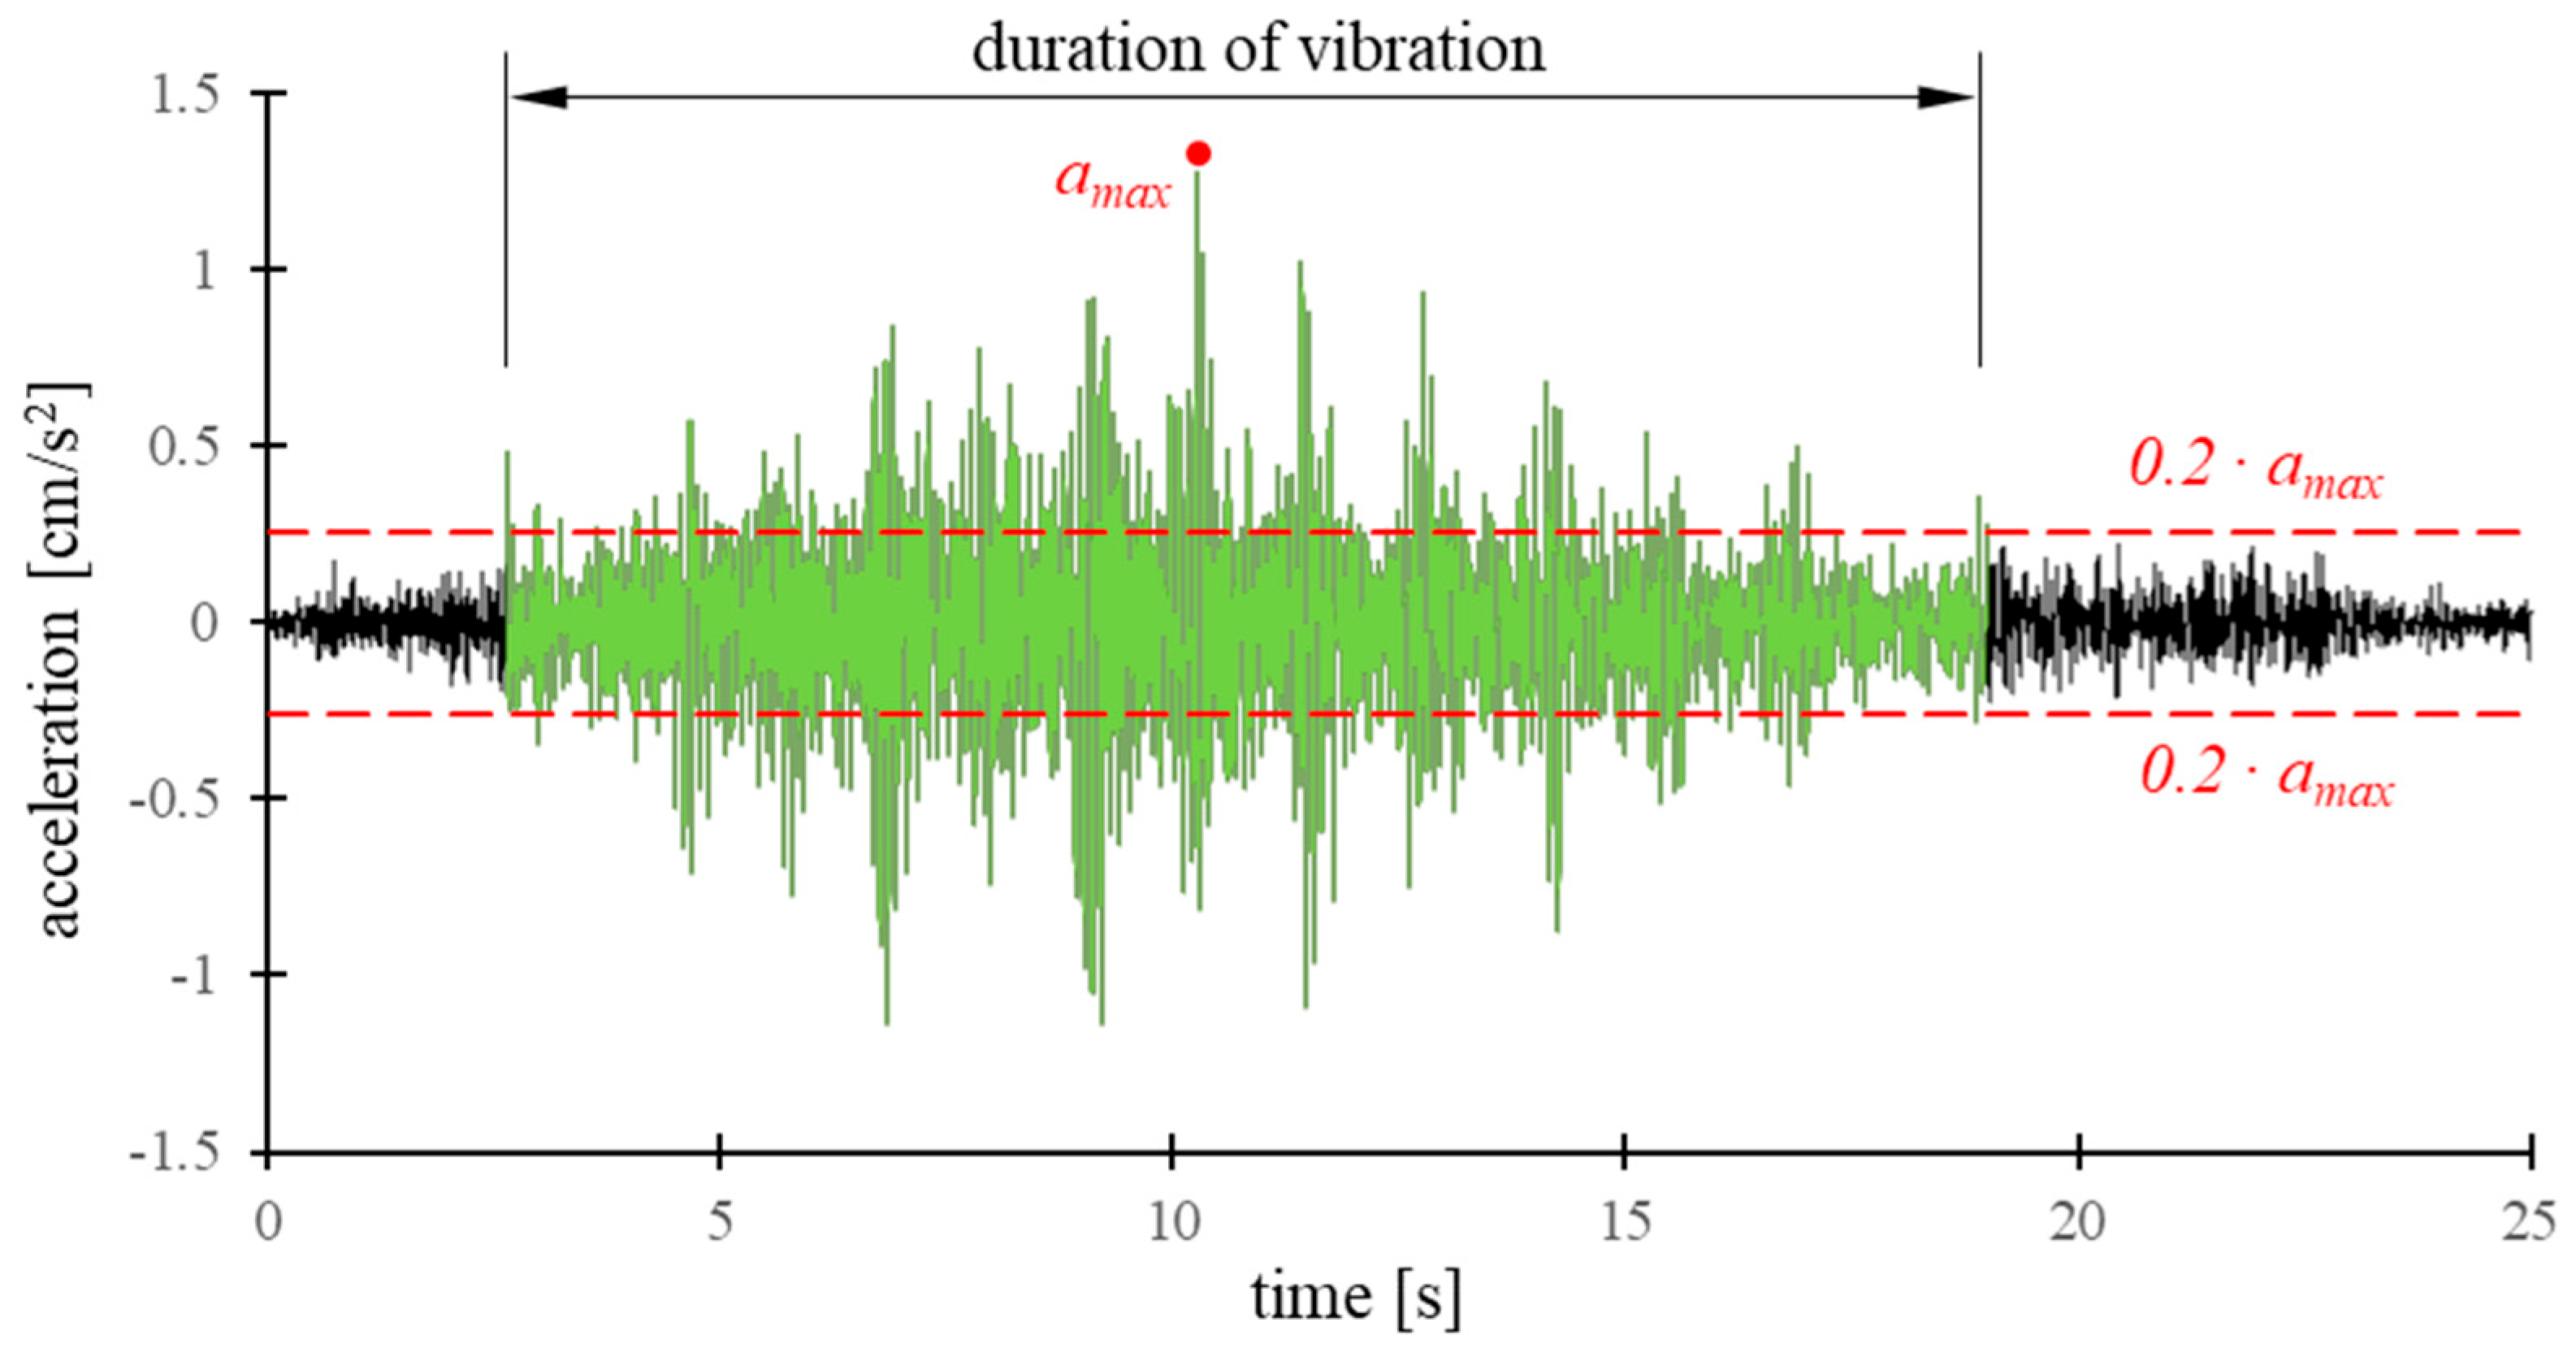
This analysis of human perception of vibrations within the building employed the widely recognized evaluation method, namely, the root mean squared method (RMS), as outlined following the ISO standard [
16]. Notably, the Polish standard [
17] strictly specifies the duration of vibration. This duration delineates the range within which the amplitude of the vibration acceleration does not descend below 0.2 times the value of the maximum amplitude in the recorded signal (refer to
Figure 3).
Therefore, conducting an RMS analysis necessitates the formulation of a MATLAB procedure. This is imperative since the standard RMS analyses integrated into data analysis programs do not incorporate the specified duration of vibration as outlined in [
17]. The RMS analysis was conducted within the 1/3 octave bands to enhance result visibility and determine the frequency bands in which the comfort level is exceeded. Additionally, by [
17], the WODL coefficient was employed to enhance the visibility of the results obtained via the RMS method:
where
aRMS is the acceleration RMS value, and
az is the acceleration RMS value equivalent to the threshold for human perception of vibration in the Z direction.
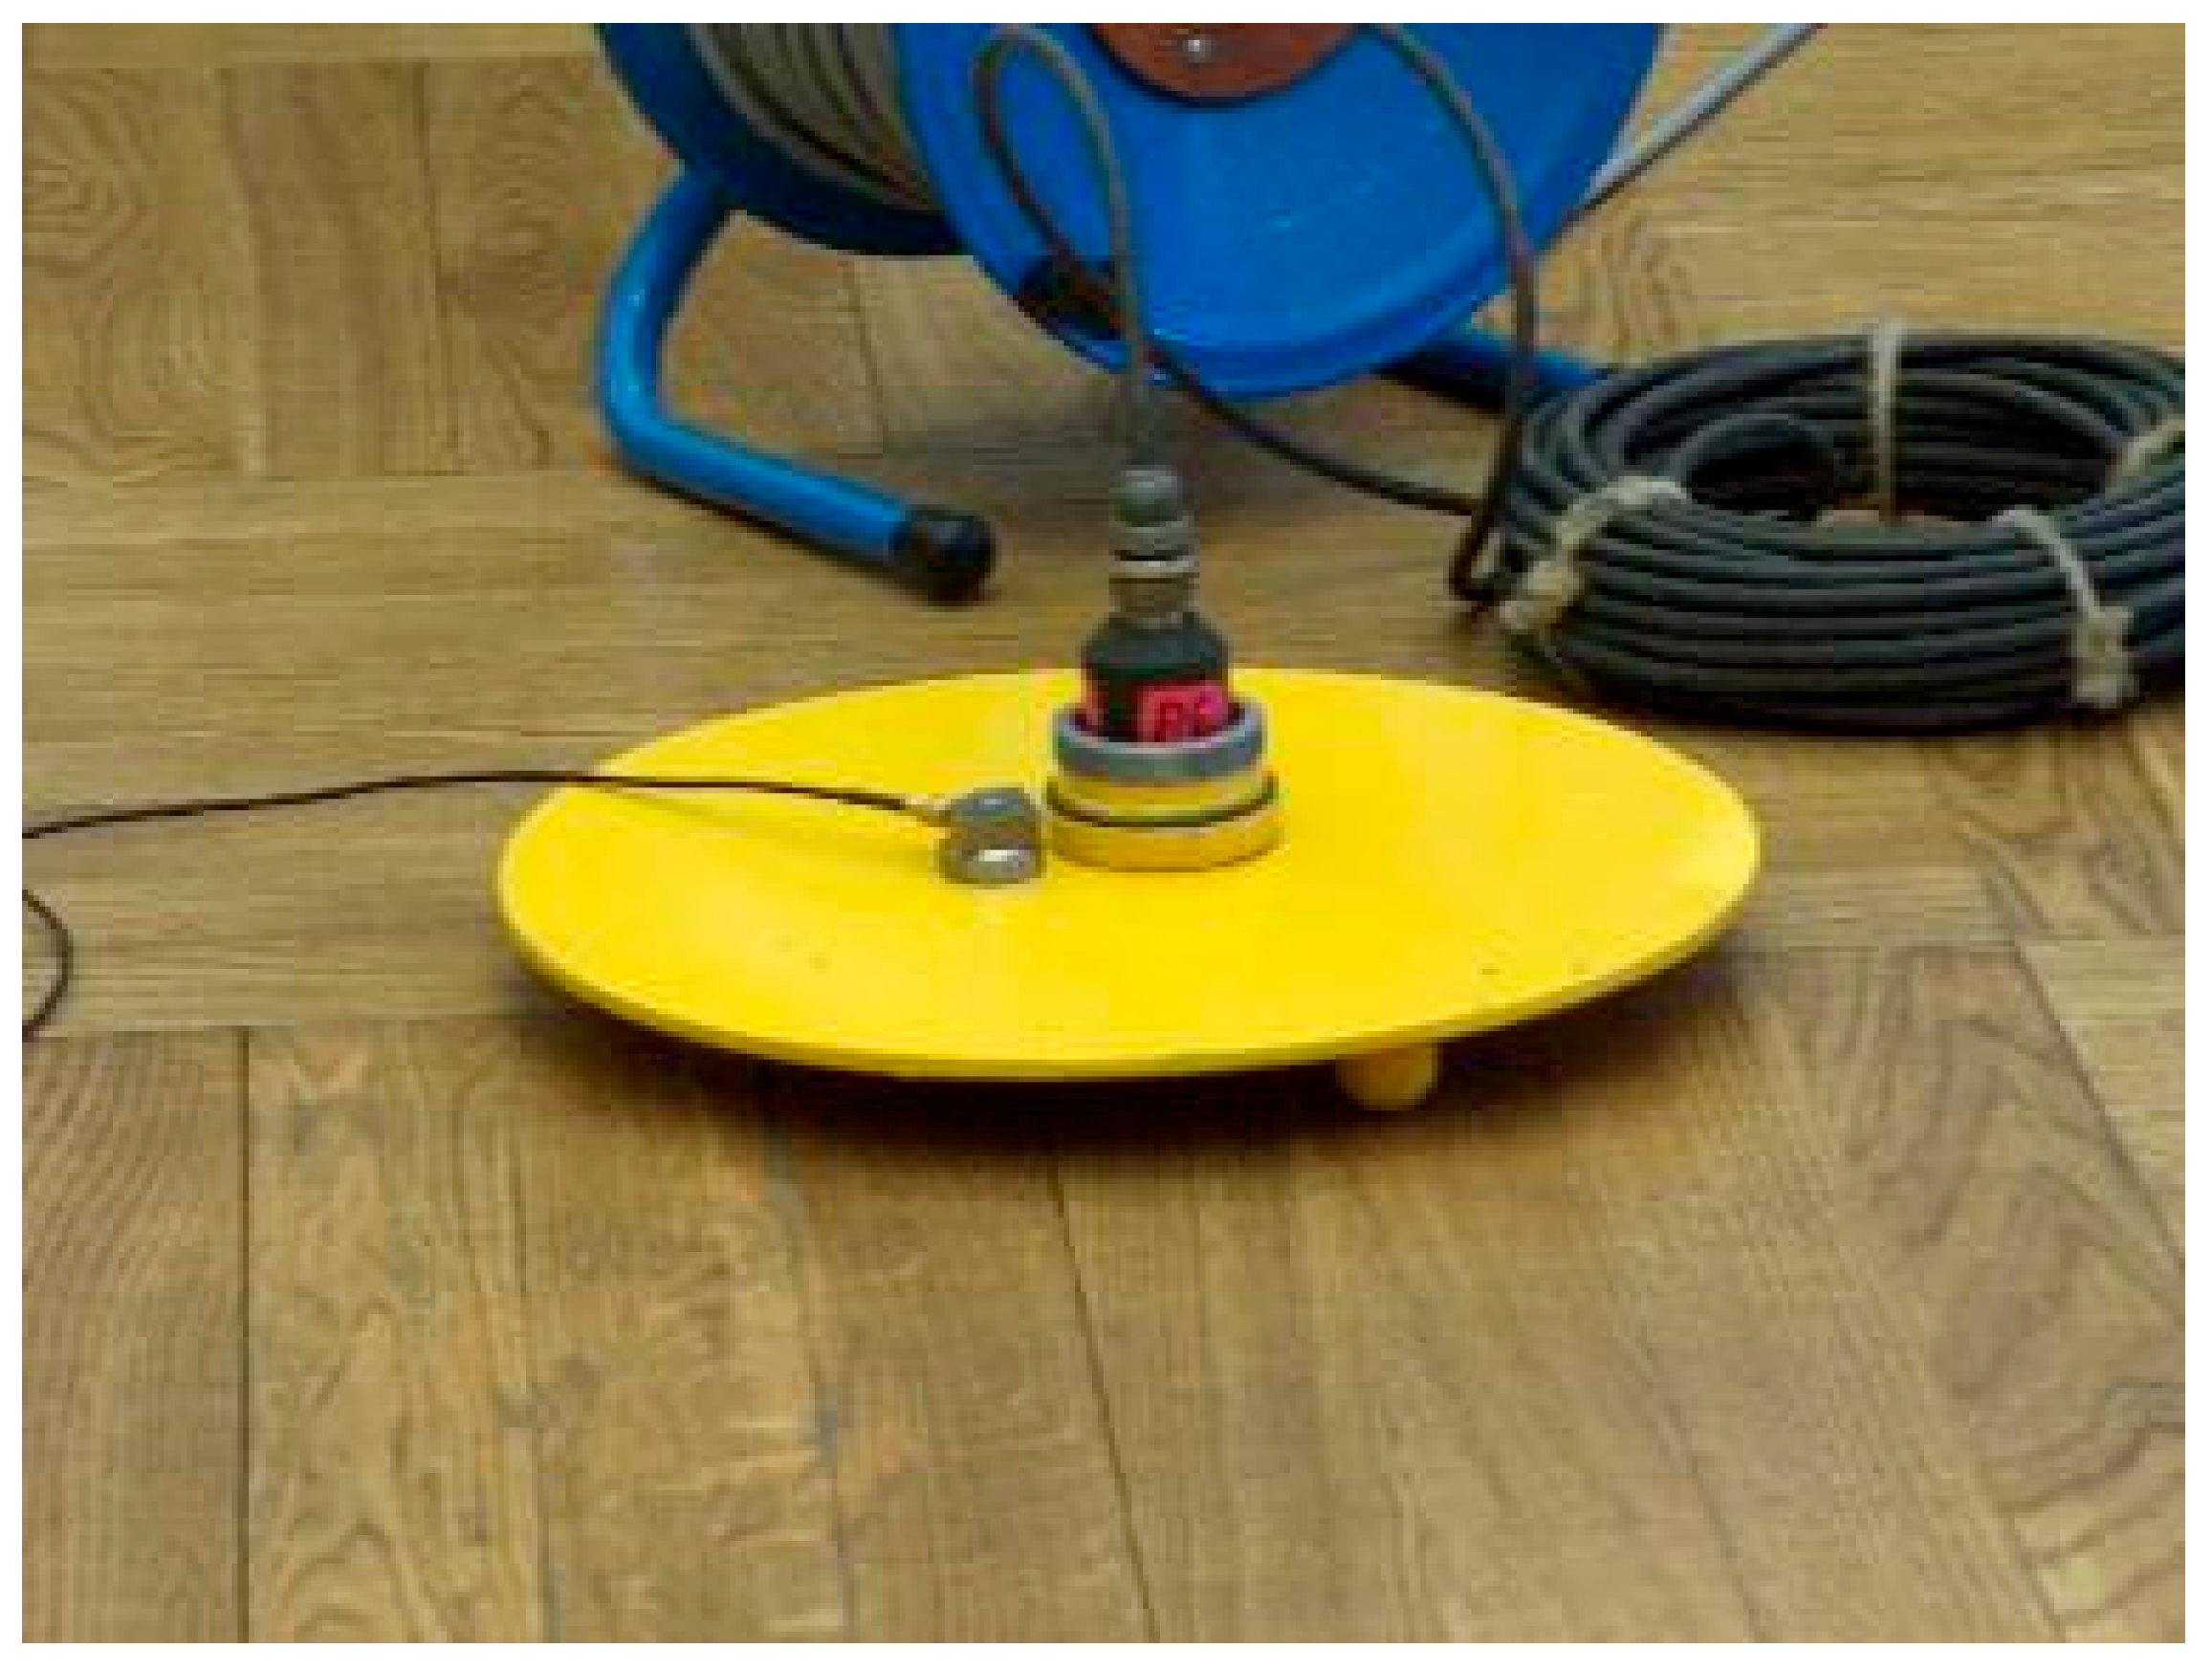
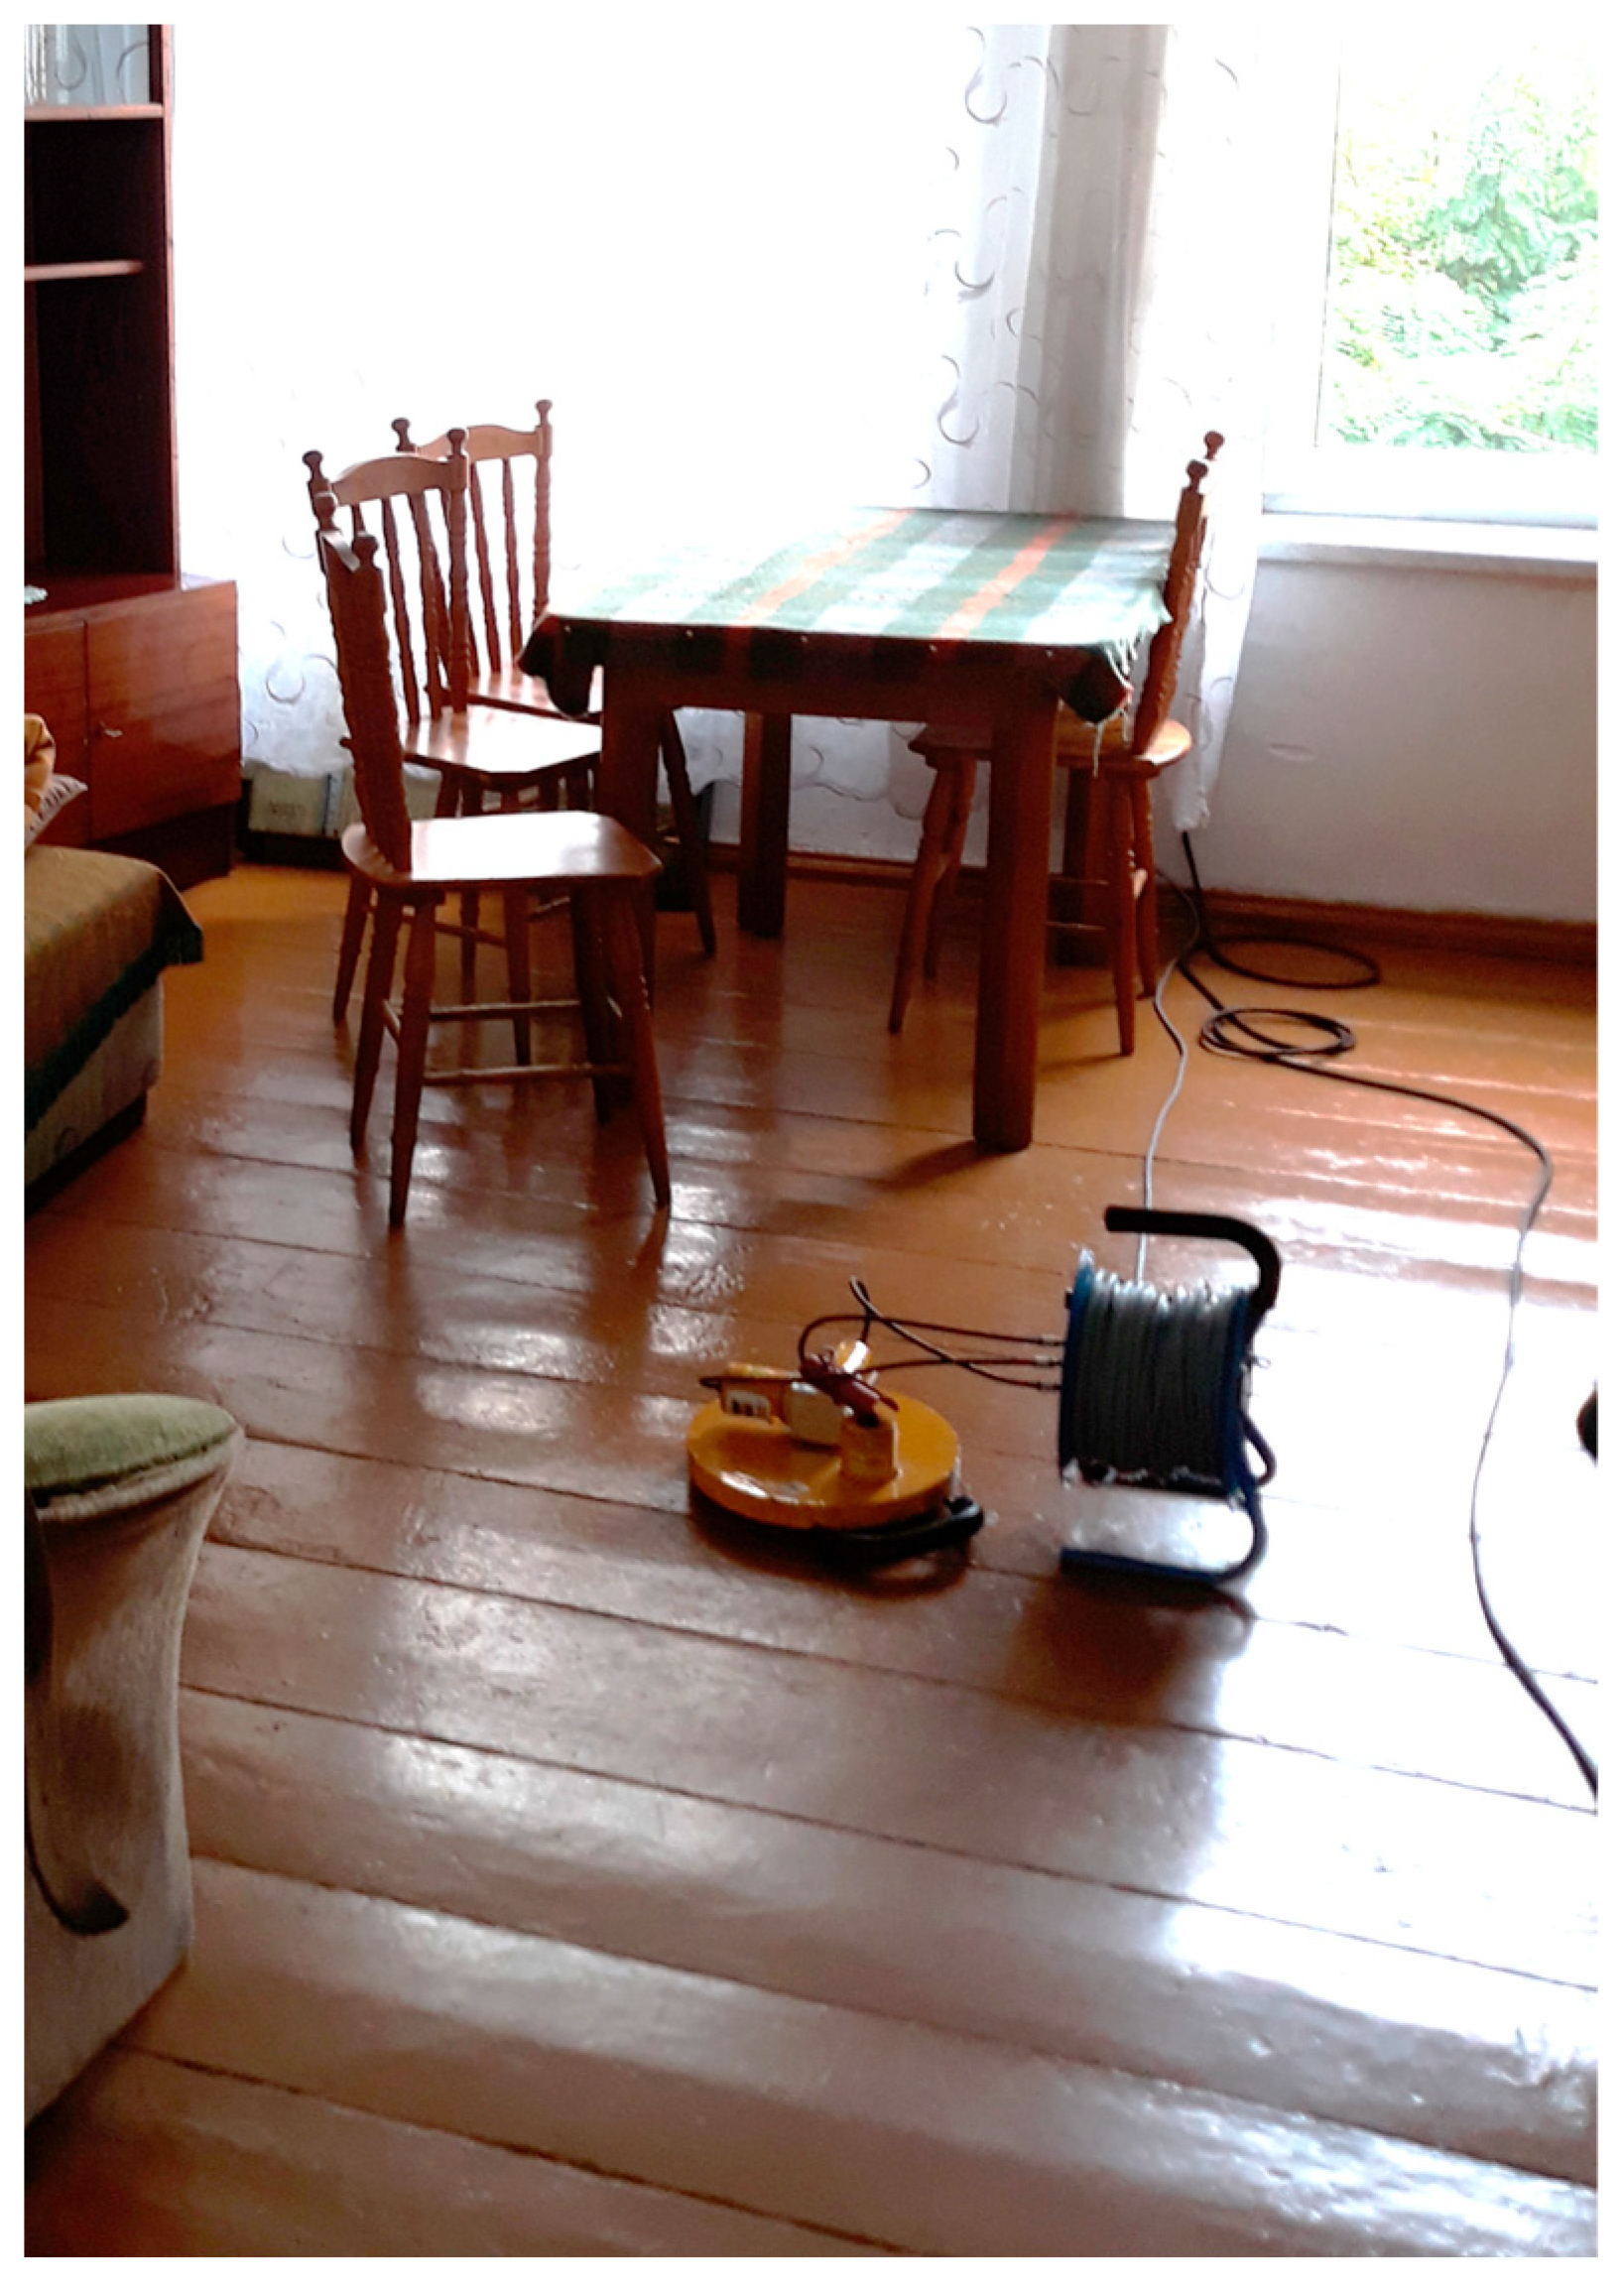
3.2. Using a Special Measuring Disk
For measuring the human perception of vibrations in passive scenarios, the use of a measuring disk is recommended. This disk should be positioned at the designated measuring point, with sensors for capturing vibration parameters affixed in three perpendicular directions. Support for the disk should be provided at three points, and it should possess a diameter of 30 cm and a minimum weight of 30 kg. To meet this weight requirement, additional weight may be added if necessary. Similar disks were previously utilized in the Laboratory of Deformation and Vibration of Structures at the Institute of Structural Mechanics, predating the development of a new disk version [
17] (refer to
Figure 4).
Following the analysis of vibration measurement results, it was evident that in certain instances, the mass of the disk alone, amounting to several kilograms, was inadequate. Consequently, issues related to the vibrations of the disk itself surfaced. Based on experience, it was determined that loading the disk with 10 kg weights was necessary. Initially, two weights were employed, but it became apparent that this was insufficient. Consequently, each measuring disk was equipped with three weights (refer to
Figure 5).
The measurement disk offered an advantage over other methods due to its capacity for non-invasive and non-destructive vibration measurement, a critical consideration in residential structures.
The optimal placement of weights became a subject of debate, and challenges arose with vibrations induced by additional weights. This led to a recognition of the necessity for stable mass distributions. The literature suggests a solution in [
18], presenting a steel disk with a diameter of 300 mm and a thickness of 4 mm. The disk features three support points (legs) positioned at 120° angles to each other (see
Figure 6).
Based on experiences and archival versions of discs in [
16], a new disc was proposed (
Figure 7).
The proposed solution is free from the disadvantages of other previously used devices. The disk is an integral system with a sensor mounting and a load ensuring good contact of the disk with the floor surface regardless of its structure and surface layer. The disc enables non-invasive measurements and repeatability of results. The disc consists of a plate equipped with three ball supports and is characterized by the fact that inside the plate (1), there is ballast material (2), and in its central part, there is a spacer element (3) with a height similar to the height of the plate side surface (1), where a cube with holes (4) is attached to the spacer element (3) (comp.
Figure 8).
Using a disc does not require drilling holes in the floor, cutting the carpet, cutting holes in the carpet, or the constant presence of third parties in the room conducting research. Thanks to the use of the disk, the time needed to prepare the test stand is significantly shortened, as it is only necessary to place the disk on the tested surface and properly orient it about the selected coordinate system. In vibration tests, sensors are often attached to the tested surface with glue or screws or pins. In such cases, however, the measurement may not be accurate enough because the upper layer of the floor, without any weight, may vibrate differently than the entire ceiling. In turn, mounting with screws or glueing is highly invasive and often requires damage to the tested surface (e.g., drilling holes in the floor, cutting out fragments of the carpet, etc.).
The disk used in this research allows for our testing of the impact of building vibrations on humans with the least possible invasion of the tested facility and the least disruption to the functioning of the people staying there while ensuring high measurement accuracy. Moreover, the disk is easy to transport and to install at the place of research.
The essence of the mounting base (disk) for vibration sensors is that it takes the form of a plate equipped with three ball supports at the bottom, ensuring the stability of the base and, therefore, the stable position of the sensors during the test. There is ballast material inside the disc. In the central part of the mounting base, there is a spacer element with a height similar to the height of the disk side surface, to which a cube with holes for mounting measurement sensors is attached.
3.3. Carrying out Measurements
A total of 87 dynamic events originating from the railway were recorded. Concurrently, each train type was identified, and its speed was accurately measured. Additionally, the specific track on which the train passed was identified. After the recording, a verification process was conducted, and only signals that were correctly recorded without interference were subjected to further analyses. The chosen waveforms of vibration acceleration, obtained from sensors positioned in both vertical and horizontal directions within the building (specifically in the structural center of the floor, as illustrated in
Figure 9), were then subjected to detailed analysis.
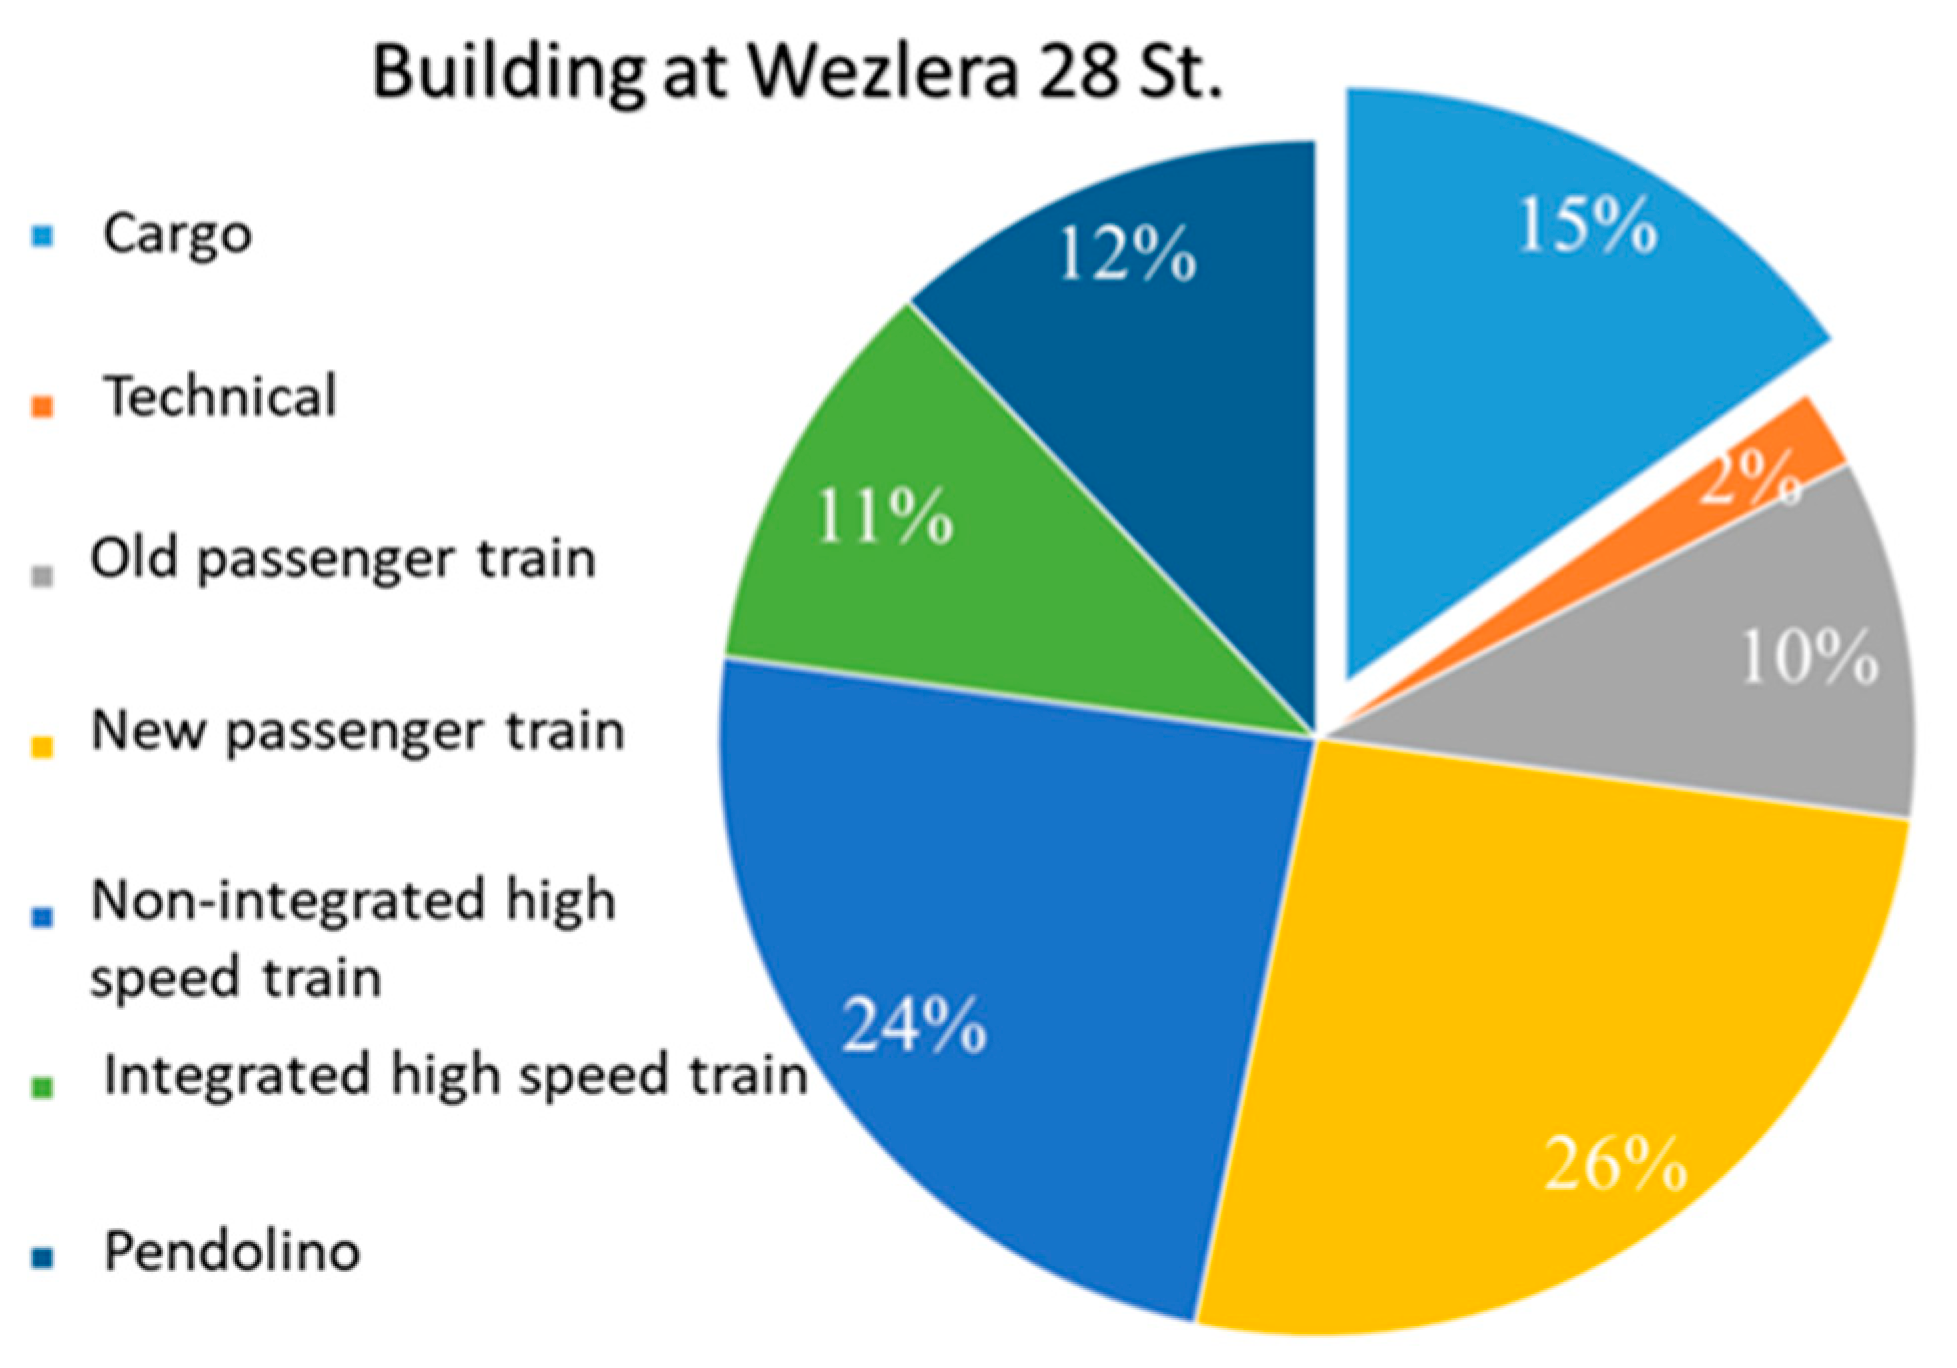
The structure of the trains that passed during the 24 h vibration monitoring varied considerably (see
Figure 10).
4. Measurement Results
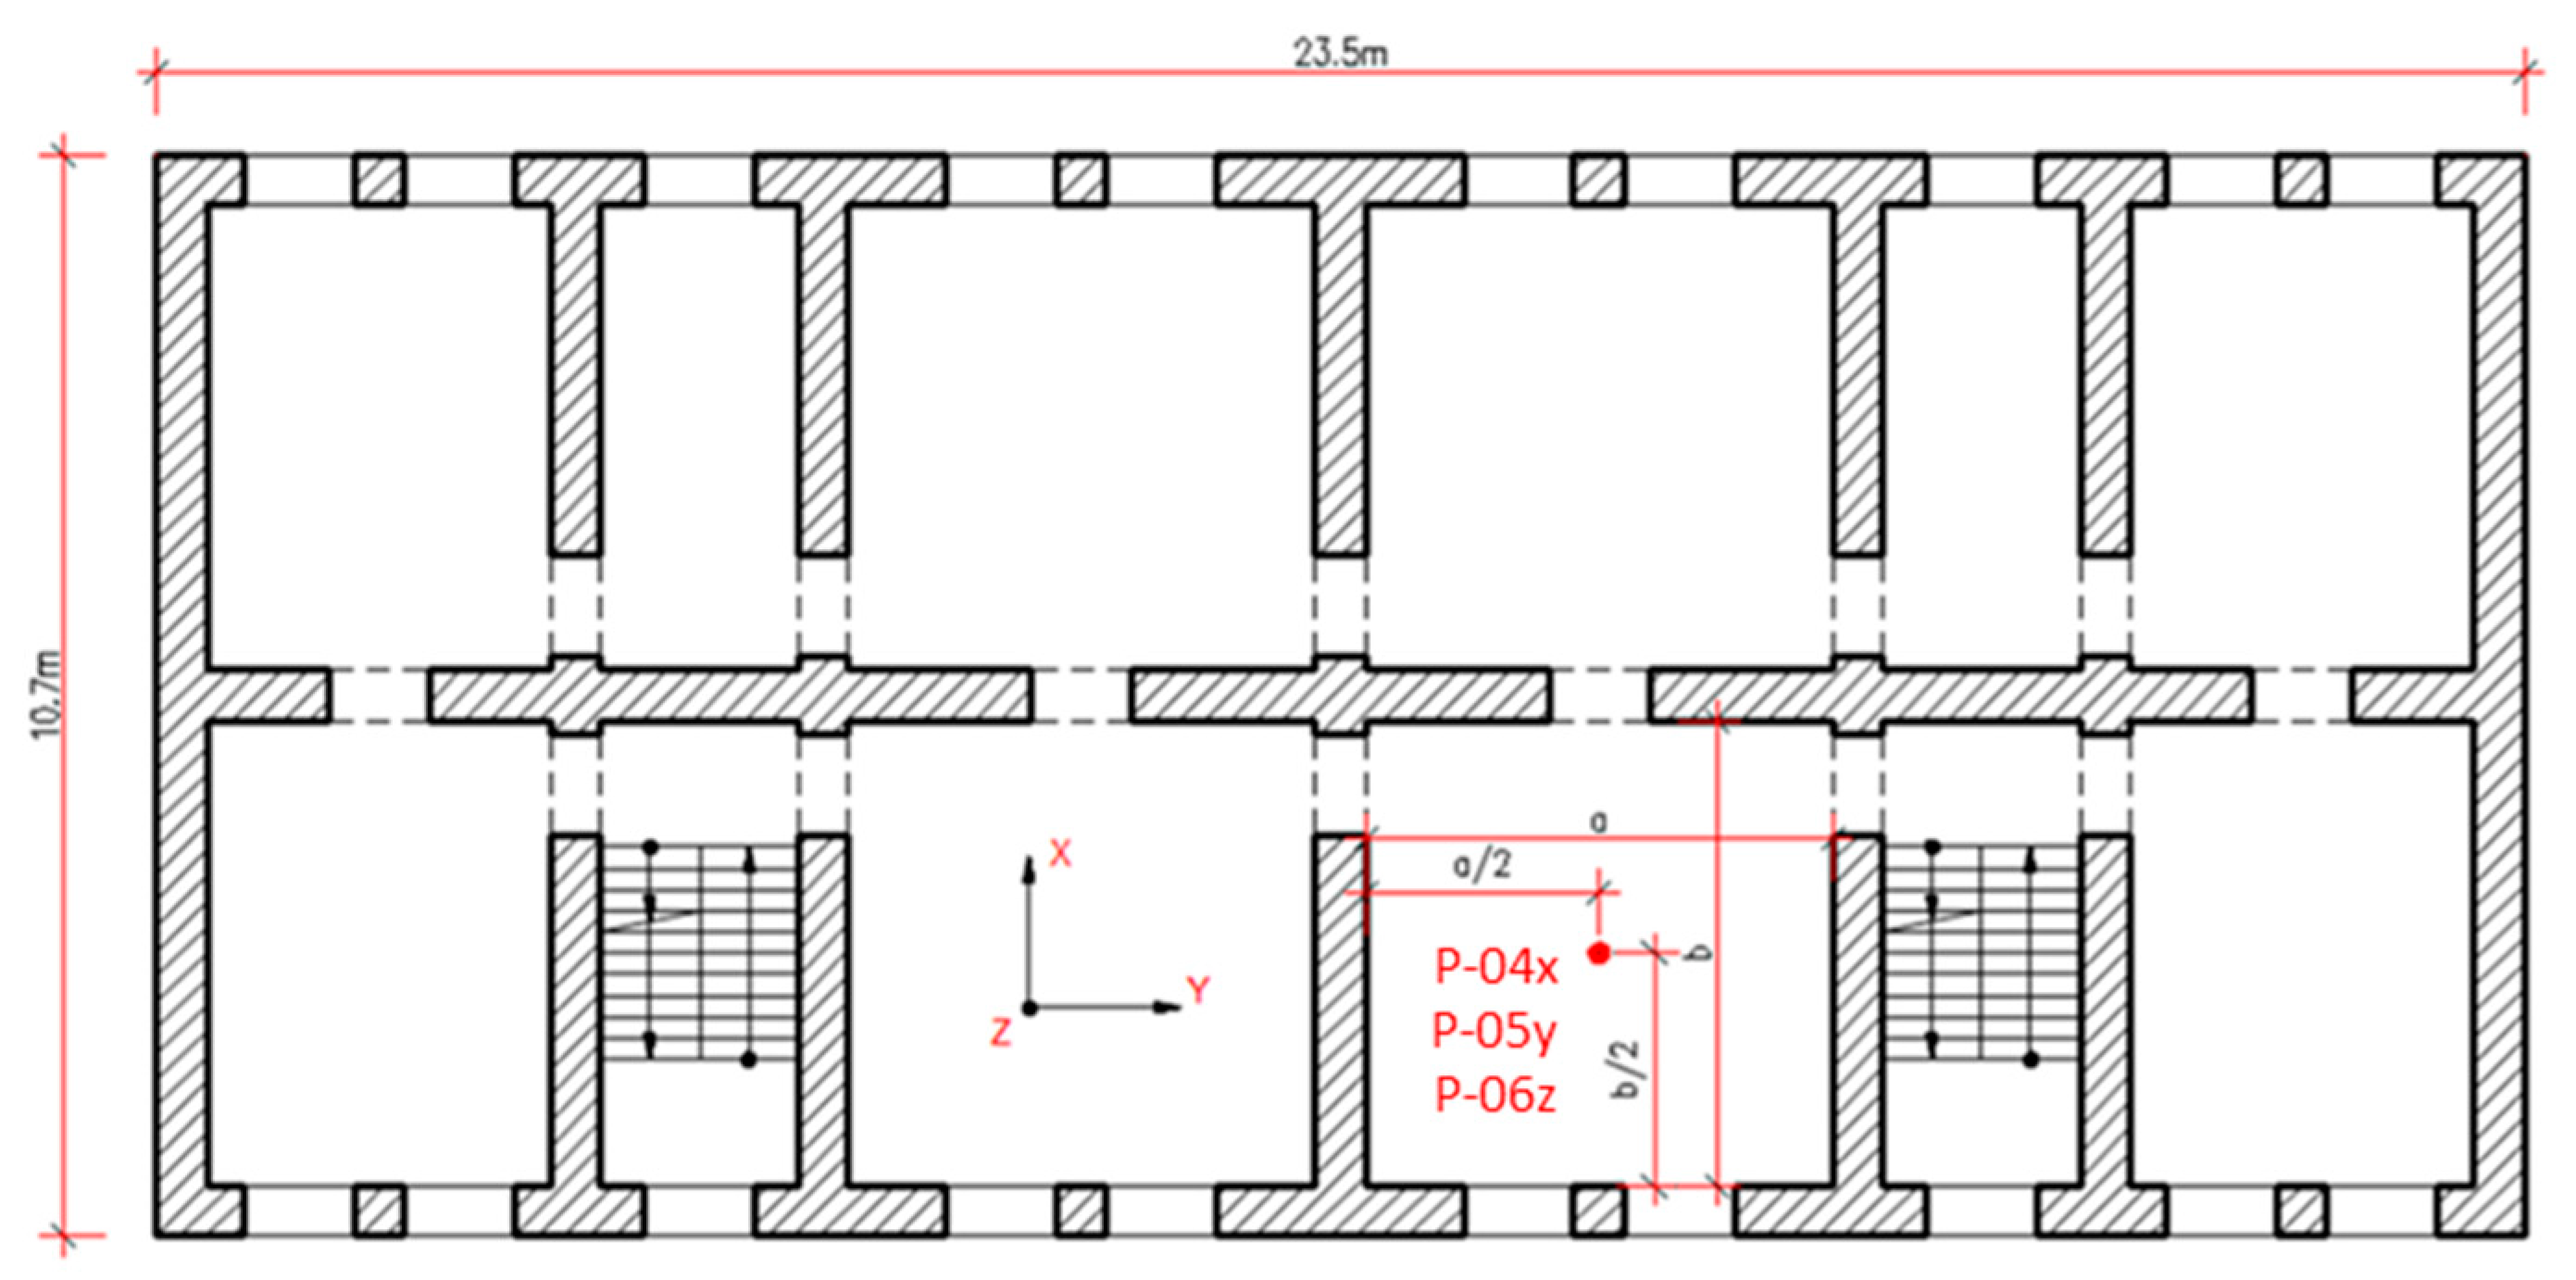
A comprehensive 24 h monitoring initiative was conducted to assess the impact of vibrations on individuals within a residential room close to the track which is the dynamic excitation. Following the standard [
16] for ground vibration sources, a measurement point was selected, located in the structural center of the floor in a room located on the side of the force and intended for permanent stay of people. Additionally, it was the room with the largest ceiling span, which guarantees that the human perception of passive vibrations will be the highest in this room. The measurements were recorded in three orthogonal directions: X—the horizontal direction perpendicular to the input; Y—the horizontal direction parallel to the input, and Z—the vertical direction (see
Figure 11).
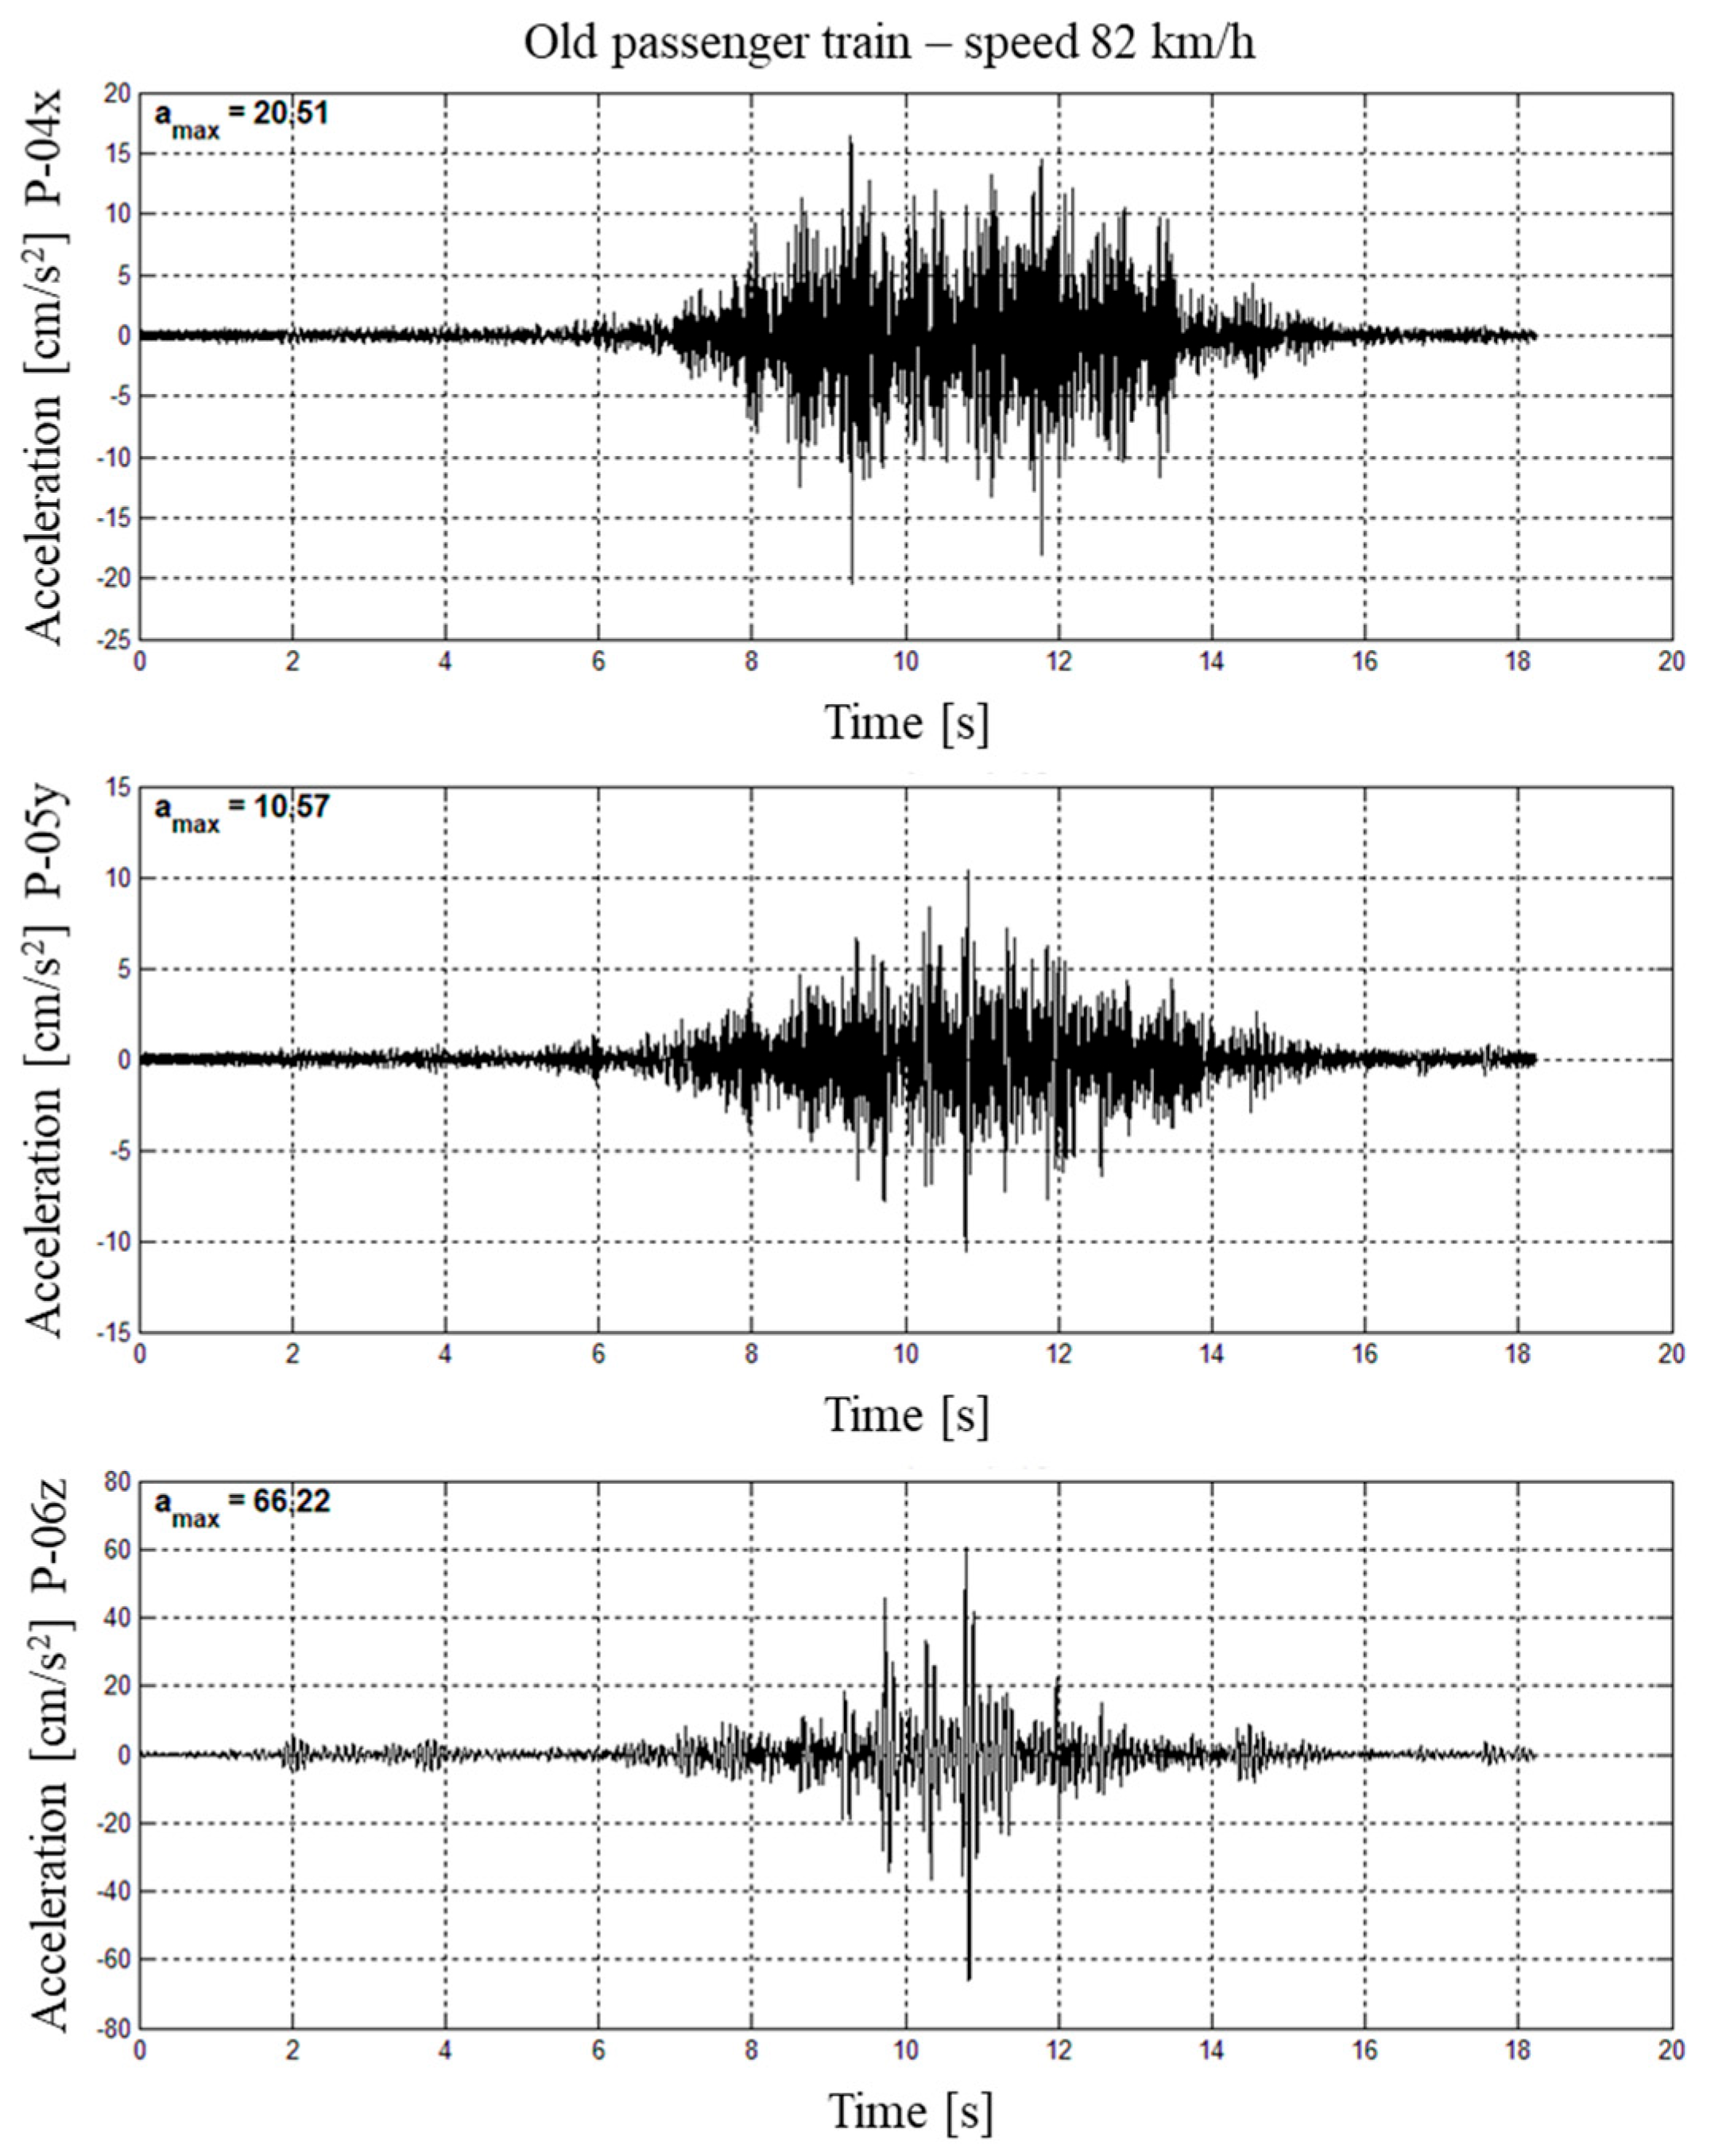
Examples of recorded waveforms of vibrations in all three directions are shown in
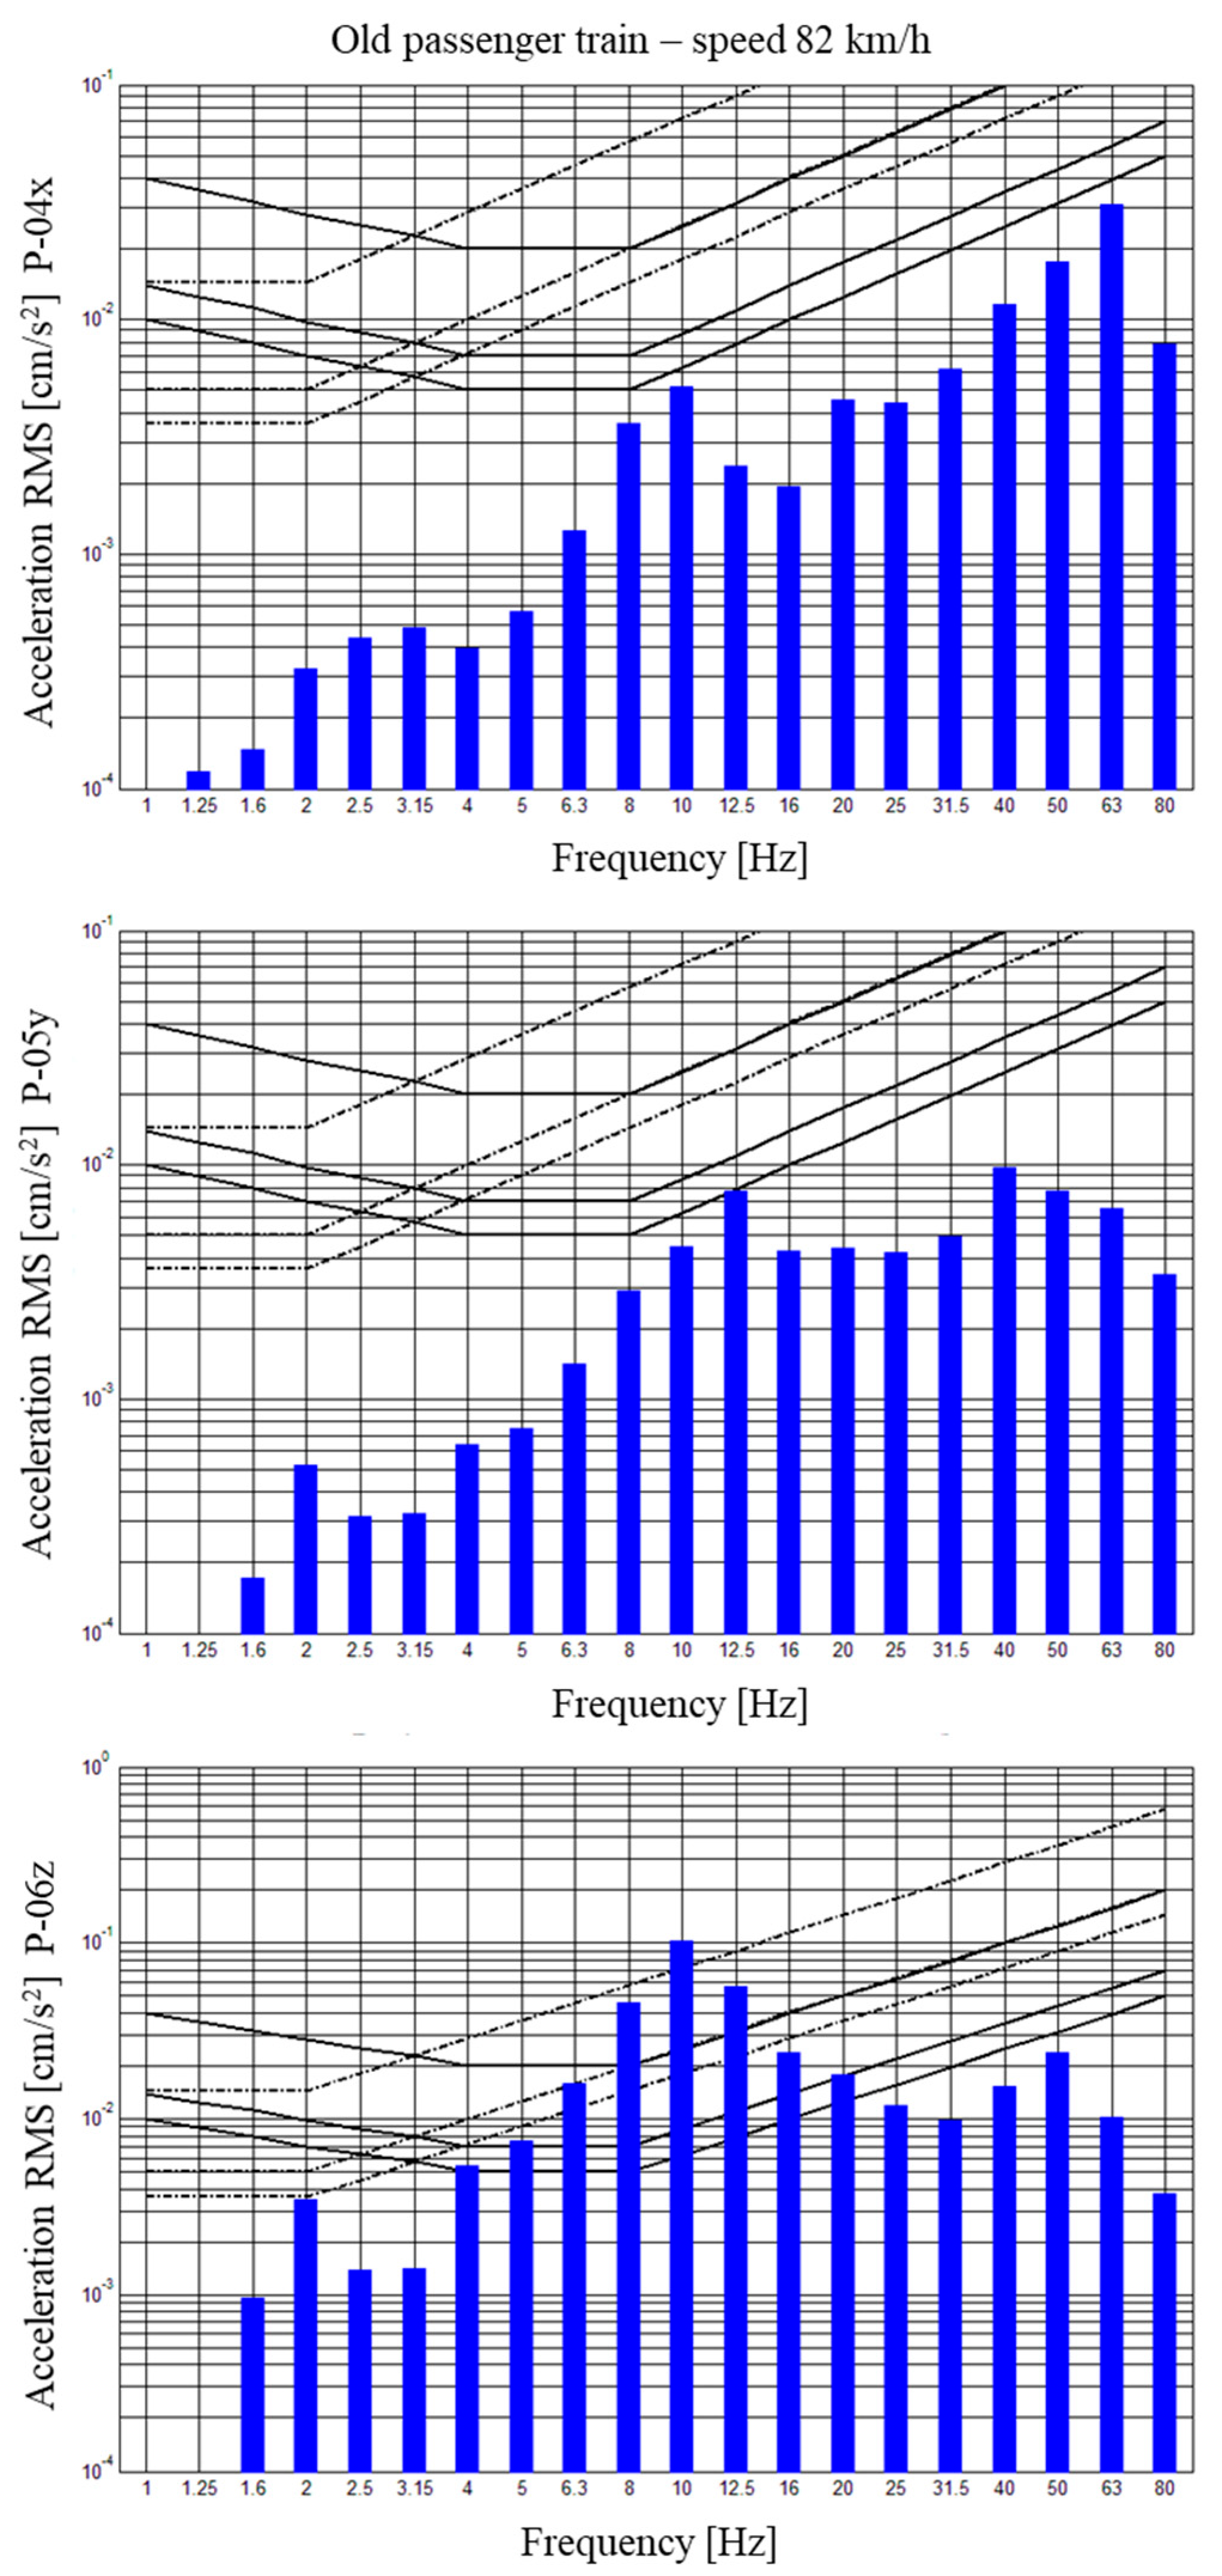
Figure 12. It is a registration of an old passenger train ride, as a result of the analysis of which the highest value of exceeding the comfort threshold was obtained, equal to 16.65. To illustrate the recorded vibration waveforms, the most intense horizontal components, x and y, as well as the vertical component z, recorded from the passage of an old type of passenger train, were selected (see
Figure 12). The maximum value of the acceleration of the vertical z component of vibrations is particularly noteworthy. The maximum acceleration value for this component is 66.22 cm/s
2. The maximum acceleration values of the horizontal x and y components of the vibrations are significantly smaller (see
Figure 12). Such a high value of the acceleration of the vertical z component of the vibrations is due to the flexibility of the wooden ceiling structure and the distance of the building from the railway tracks.
After recording the vibration waveforms, the RMS procedure was carried out to assess the impact of vibrations on the building residents. In
Figure 13, examples of RMS, made from waveforms shown in
Figure 12, are summarized. In the vertical z component of vibrations, frequencies from the 8 to the 12.5 Hz band dominate (see
Figure 13). In the horizontal x component of vibrations (the
x-axis is perpendicular to the railway tracks), higher components from the 40 to the 63 Hz band dominate. A lower frequency band ranging from 8 to 10 Hz can also be distinguished. On the other hand, in the horizontal y component of vibrations (the
y-axis is parallel to the direction of the railway tracks), dominant frequency bands of 12.5 and 40 to 63 Hz can be distinguished (see
Figure 13).
Out of the 87 dynamic events, the perception threshold of vibrations was surpassed in 50 instances. Furthermore, in seven of these cases, the vibrational comfort level was also exceeded (see
Table 2)
The maximum value of the WODL coefficient reached 16.6, observed within a frequency band of 10 Hz. As evident from
Table 2, nearly every type of train resulted in the exceedance of the comfort level according to the Polish Standard [
16] (refer to
Table 3).
As evident from
Table 3, nearly every type of train resulted in the exceedance of the comfort level. To facilitate predictions, leveraging the substantial dataset, a decision was made to conduct a nonlinear regression analysis.
5. Regression Analysis
The primary objective of multiple regression, a term initially coined by Pearson in 1908 [
19], is to quantify the relationship between multiple independent (explanatory) variables and a dependent (criterion, response) variable. While both Pearson correlation and basic linear regression assess the linear relationship between two statistical variables, significant distinctions exist between these two methods. Pearson correlation gauges the strength and direction of the linear association between two numeric variables without assuming causality.
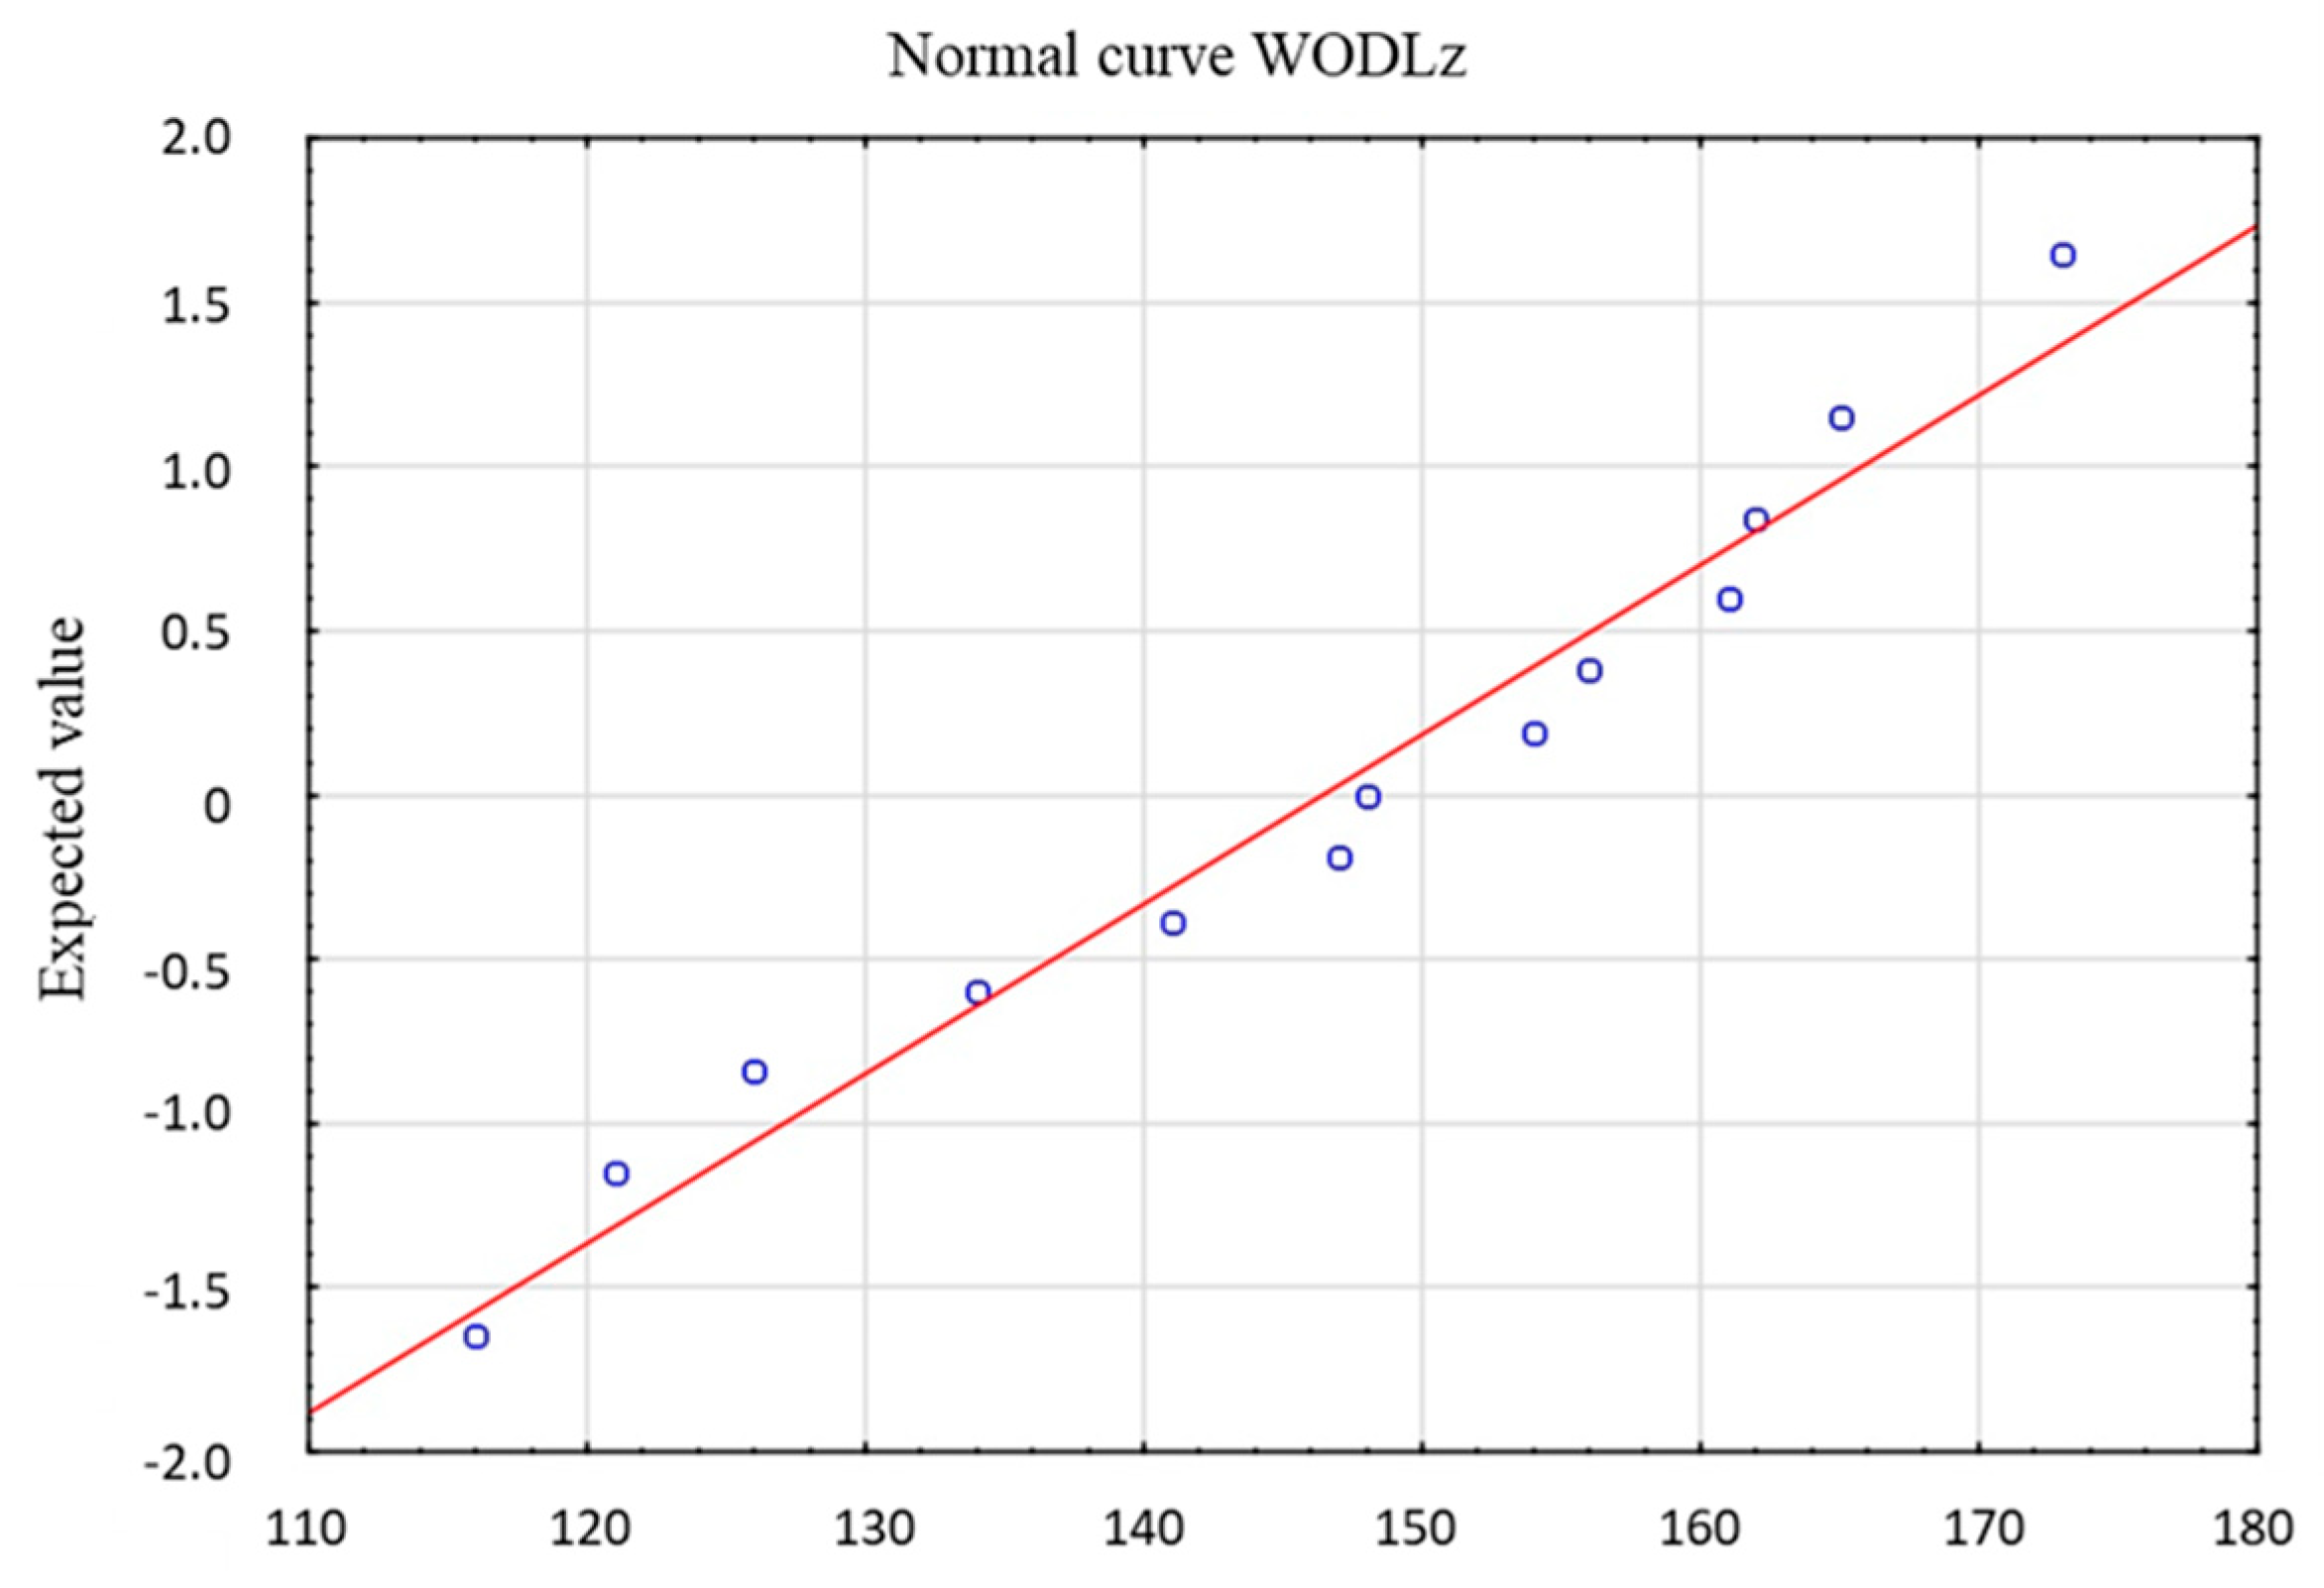
The focus of the analysis in this article was primarily to ascertain whether a cause-and-effect relationship exists between train speed and the WODL index. To enable such predictions, it is prudent to verify whether the WODL indicator exhibits a normal distribution. In
Figure 14, a check for the normal distribution of the WODLz indicator (in the vertical direction) is presented.
As can be seen from
Figure 14, the normality of the distribution is quite good. Then, the linear regression function was checked to determine if a linear relationship is possible. The results are summarized in
Table 4.
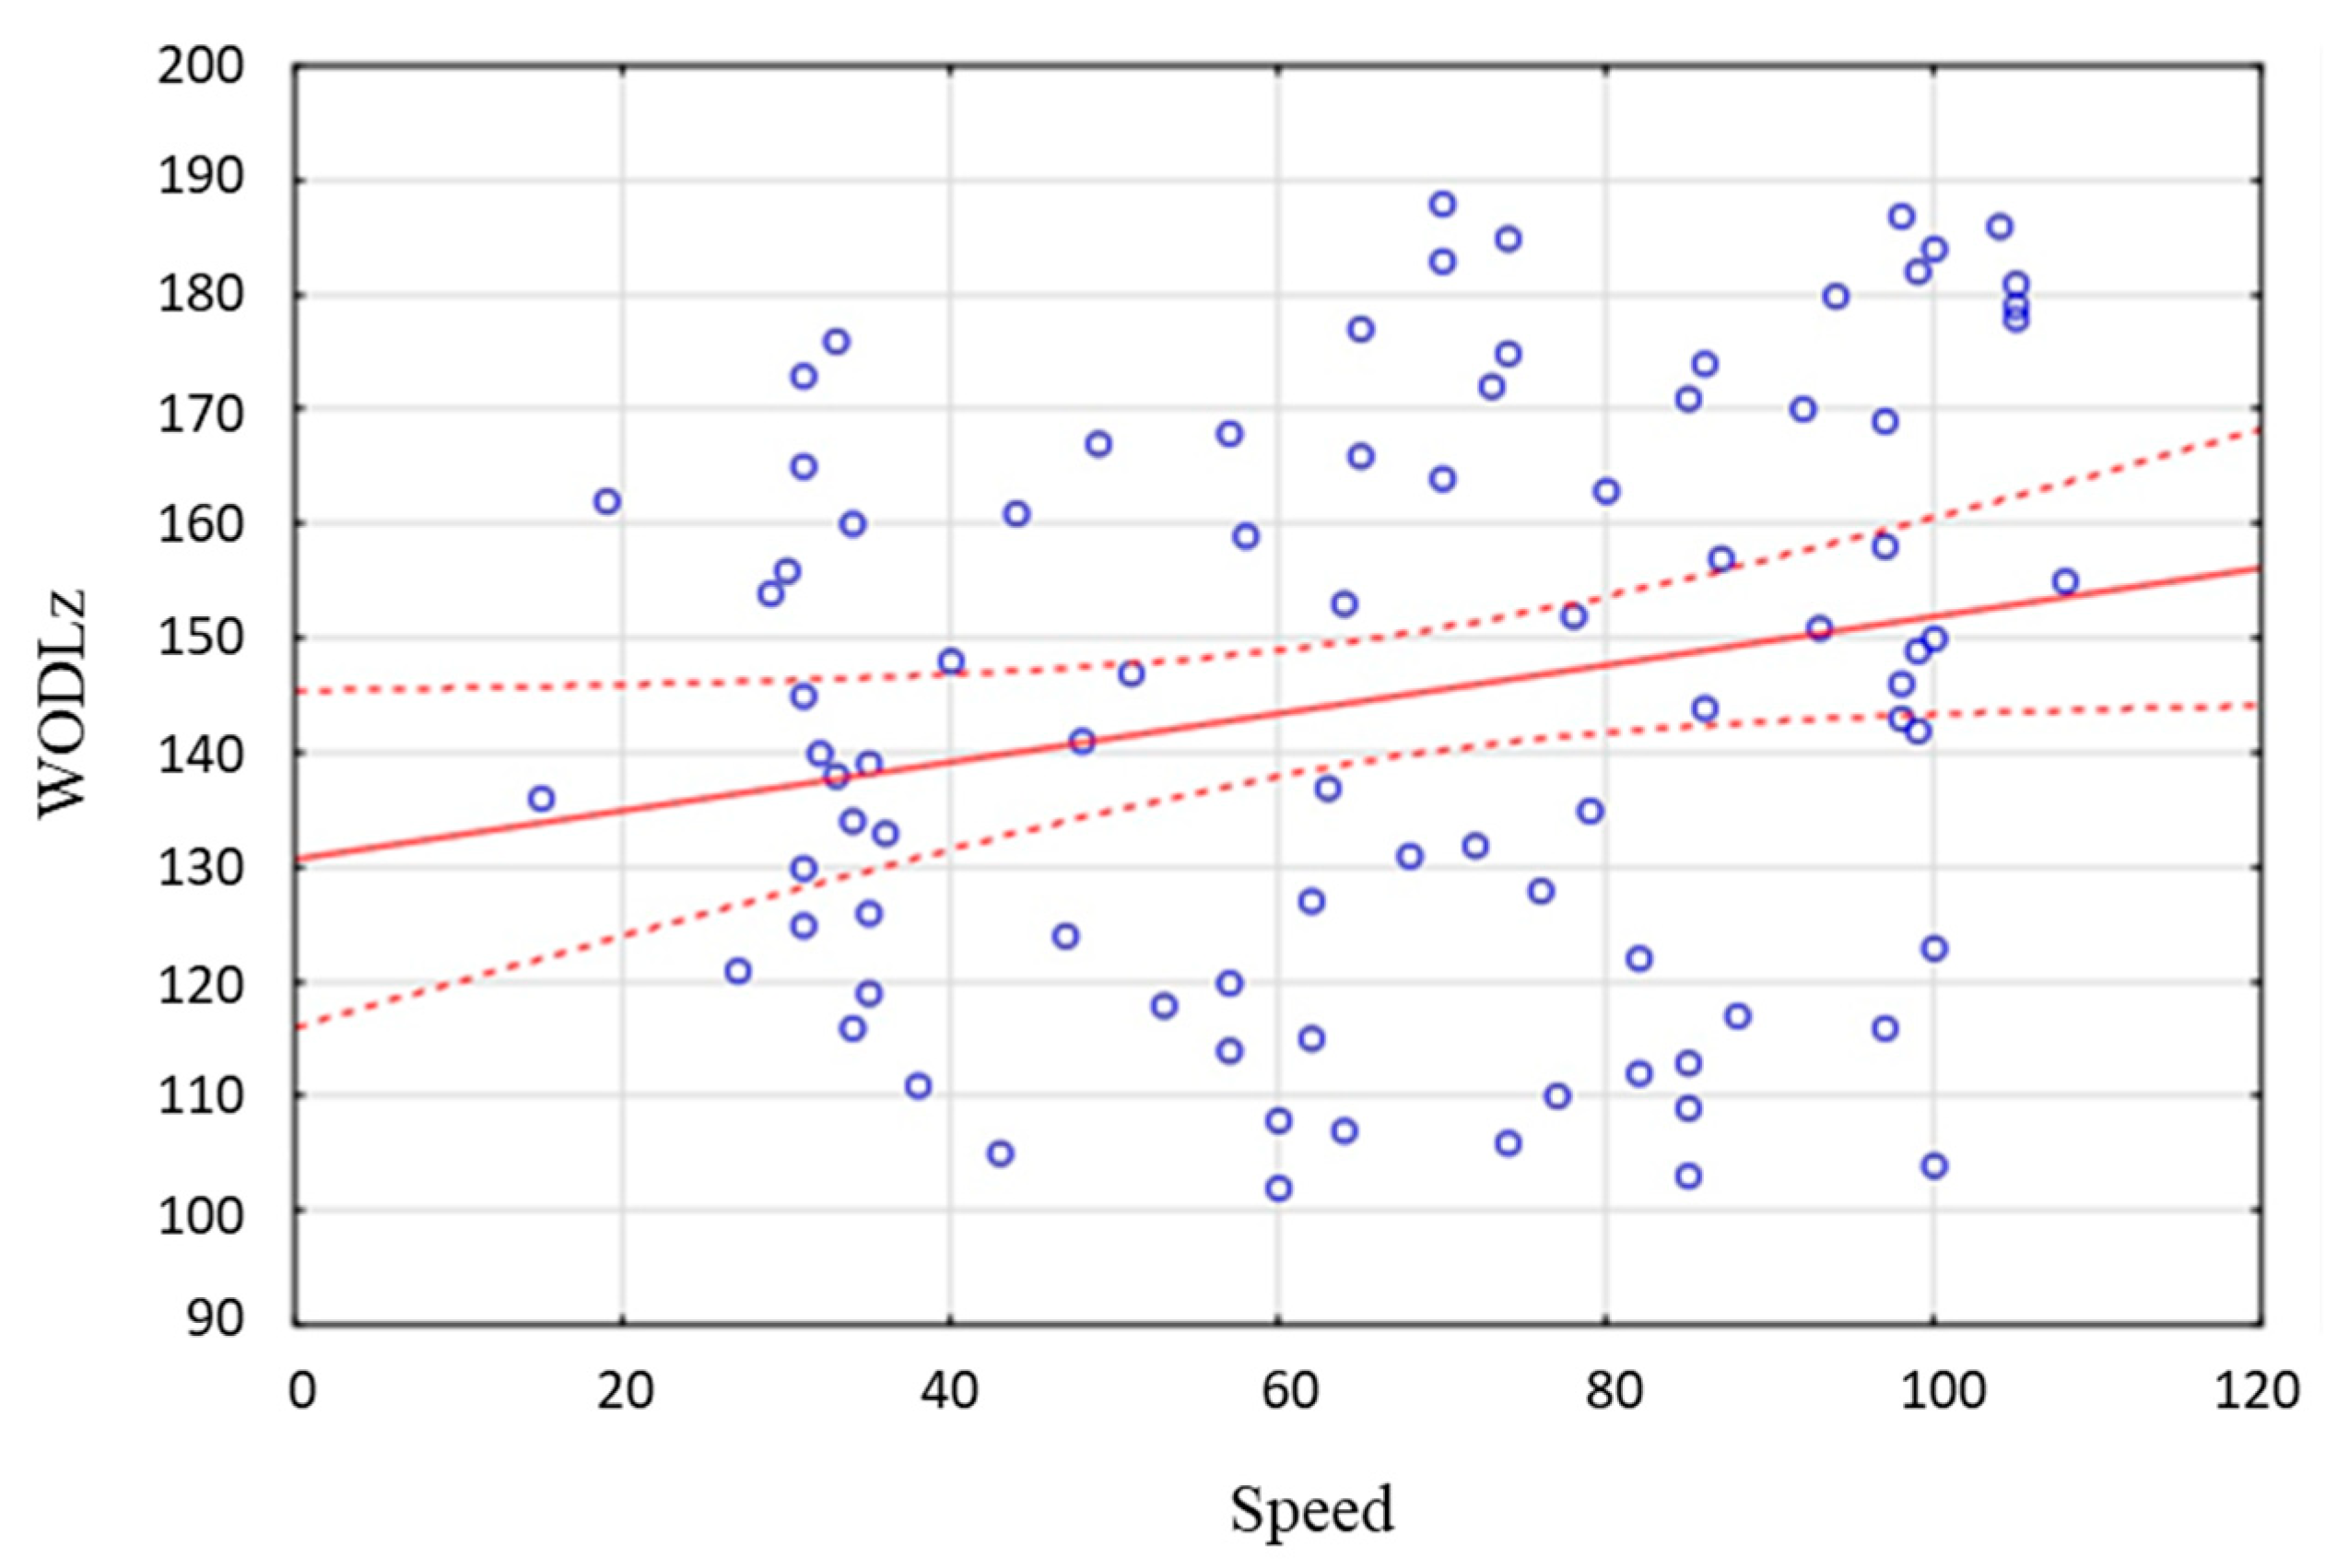
The
p-value is below 0.05, which means that the hypothesis of a linear relation between train speed and the value of the WODLz index can be recognized as true, and this relation is as follows:
where S is the train speed.
Although the
p-value is quite good, the correlation is weak (see
Figure 15).
However, when treating train types separately and endeavoring to achieve an improved linear fit during the linearity checking stage, p-values above 0.05 were obtained, signalling a rejection of the linearity hypothesis. The most favourable p-value, nearing 0.05 and equating to 0.07, was observed for high-speed trains.
The subsequent analysis aimed to determine whether if speed influences on the WODL index or this influence is more closely associated with the type of train. For this analysis, multiple regression, specifically utilizing the stepwise regression method, was employed. Initially, the investigation sought to establish the presence of a linear relationship between WODLz, train speed, and the type of train. The outcomes of this analysis are outlined in
Table 5.
As can be seen from this multiple regression analysis, there is a relation between train type, train speed, and the value of the WODLz factor, and it is much stronger than for train speed and WODLz alone.
6. Discussion
There are a number of researchers working on the subject of vibrational comfort, but they are mostly concerned on whole-body vibrations in vehicles. For example, very interesting research can be found in [
20], in which the effect of road imperfections on human vibration perception while driving a car is investigated. Similar research is described in [
21].
Much more relevant research was conducted in [
22]. In this article, the relationship between the train speed and the WODL ratio was investigated. Only one train, Pendolino type, was investigated. The train was passing at different speeds. Interestingly, in
Table 1 of this article [
22], it can be seen that the WODL ratios are mostly higher when the higher train speed is, but some dynamic events do not suit this trend (see
Table 6).
As can be seen from these results, even for the same train with controlled passing and speed, the correlation is not good.
These investigations indicate a discernible relationship between train speed and the WODL ratio. However, the correlation is not entirely robust, primarily due to certain events that deviate from the established model. A more reliable correlation emerges when considering a multiple regression model that incorporates not only train speed but also the type of train. Despite these insights, the problem remains unsolved, and its significance persists, particularly in the prediction of annoyance in buildings induced by the passage of nearby trains. Further research and analysis are warranted to address the complexity of this issue.
7. Conclusions
This article focuses on examining the influence of train vibrations on human perception, especially in the context of residential buildings located close to railways. The conducted measurements and analyses revealed significant relationships between the type of train, the travel speed, and the level of people’s vibration perception. The research results indicate a correlation between train speed and the value of the WODL index, which measures the impact of vibrations on people in residential buildings.
Impact of Train Type on Vibration Level:
Differences in vibration levels were observed depending on the type of train, with varying WODL values for different types of trains.
Vibrations generated by different types of trains may have varied effects on building residents, underscoring the importance of considering this factor in the design and operation of railway transportation systems.
Regression Analysis:
The application of multiple regression analysis provided a better understanding of the relationship between train speed, type, and the level of vibration perception by people in buildings.
The analysis results indicate a stronger correlation when both train speed and type are considered, suggesting that both factors may significantly influence the level of vibration perception.
The study demonstrates the need to consider the impact of train vibrations on people living in nearby buildings during the planning and design of railway transportation systems. The research findings may be useful for designers and managers responsible for planning and operating railway transportation systems, aiding in the identification of potential vibration-related issues and the implementation of appropriate preventive measures.
Further research and analysis are needed to fully understand the complex issue of the impact of train vibrations on residential buildings and the people living in them. Possible future research could include the following.
Conducting similar measurements and analyses on a larger number of residential buildings situated near railway lines to obtain a more comprehensive understanding of the impact of train vibrations.
Including buildings of varying construction types, ages, and distances from railway tracks to capture a wider range of scenarios and factors influencing vibration perception.
Supplementing vibration measurements with survey studies to gather subjective feedback from residents regarding their perception of vibrations and any associated discomfort or annoyance.
Designing structured questionnaires to assess various aspects pertaining to train-induced vibrations, such as frequency of vibration perception, impact on daily activities, and overall satisfaction with living conditions.
Conducting longitudinal studies to observe changes in vibration perception over time, considering factors such as seasonal variations, changes in train schedules or types, and potential structural modifications to buildings.
Tracking the long-term effects of continuous exposure to train vibrations on residents’ well-being and quality of life.
Comparing the effects of train vibrations with vibrations generated by other transport modes, such as road traffic or underground metro systems, to evaluate relative levels of discomfort and annoyance.
Examining how factors like vibration frequency, amplitude, and duration differ across various transport modes and their respective impacts on human perception.
By pursuing these avenues of research, a more comprehensive understanding of the complex interactions between train vibrations, buildings, and human perception can be achieved, ultimately contributing to the development of strategies for mitigating the adverse effects of railway-induced vibrations on residential communities.
Author Contributions
Conceptualization, A.K.-K., F.P. and T.T., methodology, A.K.-K. and F.P.; software, A.K.-K. and F.P; validation, A.K.-K., F.P. and T.T., formal analysis A.K.-K., F.P. and T.T.; investigation, A.K.-K. and F.P.; resources, A.K.-K. and F.P.; data curation, A.K.-K. and F.P.; writing—original draft preparation, A.K.-K., F.P. and T.T.; writing—review and editing, T.T.; visualization, A.K.-K. and F.P.; supervision, T.T.; project administration, T.T.; funding acquisition, T.T. All authors have read and agreed to the published version of the manuscript.
Funding
This research received no external funding.
Data Availability Statement
The data presented in this study are available on request from the corresponding author. The data are not publicly available due to privacy.
Conflicts of Interest
The authors declare no conflict of interest.
References
- Rizzo, F.; Caracoglia, L.; Piccardo, G. Examining wind-induced floor accelerations in an unconventionally shaped, high-rise building for the design of “smart” screen walls. J. Build. Eng. 2021, 43, 103115. [Google Scholar] [CrossRef]
- Zou, C.; Wang, Y.; Moore, J.A.; Sanayei, M. Train-induced field vibration measurements of ground and over-track buildings. Sci. Total Environ. 2017, 575, 1339–1351. [Google Scholar] [CrossRef] [PubMed]
- Howarth, H.; Griffin, M.J. Human response to simulated intermittent railway-induced building vibration. J. Sound Vib. 1988, 120, 413–420. [Google Scholar] [CrossRef]
- Khan, D.; Burdzik, R. Measurement and analysis of transport noise and vibration: A review of techniques, case studies, and future directions. Measurement 2023, 220, 113354. [Google Scholar] [CrossRef]
- Peris, E.; Woodcock, J.; Sica, G.; Sharp, C.; Moorhouse, A.T.; Waddington, D.C. Effect of situational, attitudinal and demographic factors on railway vibration annoyance in residential areas. J. Acoust. Soc. Am. 2014, 135, 194–204. [Google Scholar] [CrossRef] [PubMed]
- Coermann, R.R. The Mechanical Impedance of the Human Body in Sitting and Standing Position at Low Frequencies. Hum. Factors J. Hum. Factors Ergon. Soc. 1962, 4, 227–253. [Google Scholar] [CrossRef] [PubMed]
- Arnberg, P.W.; Bennerhult, O.; Eberhardt, J.L. Sleep disturbances caused by vibrations from heavy road traffic. J. Acoust. Soc. Am. 1990, 88, 1486–1493. [Google Scholar] [CrossRef] [PubMed]
- Croy, I.; Smith, M.G.; Persson Waye, K. Effects of Train Noise and Vibration on Human Heart Rate During Sleep: An Experimental Study. BMJ Open 2013, 3, e002655. [Google Scholar] [CrossRef] [PubMed]
- Plumbj, C.S.; Meigs, W. Human vibration perception. I. Vibration perception at different ages (normal ranges). Arch. Gen. Psychiatry 1961, 4, 611–614. [Google Scholar] [CrossRef] [PubMed]
- Meh, D.; Denislic, M. Influence of age, temperature, sex, height and diazepam on vibration perception. J. Neurol. Sci. 1996, 134, 136–142. [Google Scholar] [CrossRef] [PubMed]
- Tamura, Y.; Kawana, S.; Nakamura, O.; Kanda, J.; Nakata, S. Evaluation perception of wind-induced vibration in buildings. Struct. Build. 2006, 159, 283–293. [Google Scholar] [CrossRef]
- Deo, M.M.; Mani, A.K. Whole Body Vibration on drivers seat and fender with fully loaded double axle tractor-trailers under different operating conditions: Whole Body Vibration on drivers seat and fender. J. Agri Search 2021, 8, 149–154. [Google Scholar] [CrossRef]
- Sujatha, C.; Phaskara Rao, P.V.; Narayanan, S. Whole-body vibration exposure in Indian buses. Int. J. Heavy Veh. Syst. 1995, 2, 160–173. [Google Scholar]
- Noviyanti, A.; Woodcock, J. A multidimensional valuation of the human perception of construction vibration. J. Phys. Conf. Ser. 2018, 1075, 012044. [Google Scholar] [CrossRef]
- Cao, Z.; Guo, T.; Zhang, Z.; Li, A. Measurement and analysis of vibrations in a residential building constructed on an elevated metro depot. Measurement 2018, 125, 394–405. [Google Scholar] [CrossRef]
- ISO 2631-1; Mechanical Vibration and Shock: Evaluation of Human Exposure to Whole-Body Vibration—Part 1: General Requirements. International Organization for Standardization: Geneva, Switzerland, 1997.
- PN-B-02171:2017-06; Evaluation of Vibrations Influence on People in Buildings. Polish Standard: Warsaw, Poland, 2017. (In Polish)
- Ministry of Health of the USSR. Ministry of Health of the USSR No. 2957-84, Methodological Recommendations Regarding the Measurement and Hygienic Assessment of Vibrations in Residential Buildings; Ministry of Health of the USSR: Moscow, Russia, 1984. [Google Scholar]
- Pearson, K. A Second Study of the Statistics of Pulmonary Tuberculosis: Marital Infection; Dulau & Co.: London, UK, 1908. [Google Scholar]
- Wenbo, S.; Ming, L.; Jingxuan, G.; Kaixuan, Z. Evaluation of Road Service Performance Based on Human Perception of Vibration While Driving Vehicle. J. Adv. Transp. 2020, 2020, 8825355. [Google Scholar]
- Knothe, K.; Stichel, S. Human Perception of Vibrations—Ride Comfort. In Rail Vehicle Dynamics; Springer: Berlin/Heidelberg, Germany, 2017. [Google Scholar]
- Pachla, F. The impact of the passenger train speed on the comfort of humans in a building close to the railway. Vibroeng. Procedia 2018, 19, 147–152. [Google Scholar] [CrossRef][Green Version]
Figure 1.
Site plan of the analyzed building.
Figure 1.
Site plan of the analyzed building.
Figure 2.
The front elevation (from the side of the railway line) of the building.
Figure 2.
The front elevation (from the side of the railway line) of the building.
Figure 3.
Definition of vibration duration.
Figure 3.
Definition of vibration duration.
Figure 4.
The old version of the measuring disc.
Figure 4.
The old version of the measuring disc.
Figure 5.
The old version of the measuring disc with three additional weights.
Figure 5.
The old version of the measuring disc with three additional weights.
Figure 6.
Plan and cross-section of the disc used in the USSR.
Figure 6.
Plan and cross-section of the disc used in the USSR.
Figure 7.
New disc proposal.
Figure 7.
New disc proposal.
Figure 8.
Construction diagram of the measuring disk.
Figure 8.
Construction diagram of the measuring disk.
Figure 9.
Measurement point in the center of the floor.
Figure 9.
Measurement point in the center of the floor.
Figure 10.
Types of trains passing next to the building.
Figure 10.
Types of trains passing next to the building.
Figure 11.
The location and directions of the measurement point (P-04x sensor for registration vibration in perpendicular direction; P-05y—sensor for registration vibration in parallel direction; P-06z sensor for registration vibration in horizontal direction).
Figure 11.
The location and directions of the measurement point (P-04x sensor for registration vibration in perpendicular direction; P-05y—sensor for registration vibration in parallel direction; P-06z sensor for registration vibration in horizontal direction).
Figure 12.
Examples of waveforms of vibration in three directions.
Figure 12.
Examples of waveforms of vibration in three directions.
Figure 13.
Examples of RMS analysis in three directions.
Figure 13.
Examples of RMS analysis in three directions.
Figure 14.
Checking the normality of the distribution.
Figure 14.
Checking the normality of the distribution.
Figure 15.
Linear regression between train speed and WODLz for all types of trains.
Figure 15.
Linear regression between train speed and WODLz for all types of trains.
Table 1.
Diagnosis situation.
Table 1.
Diagnosis situation.
| Situation No. | Name of Situation | Source of Vibration | Object Receiving Vibration |
|---|
| 1 | Diagnosis | Active | Executed |
| 2 | Diagnosis with forecast | Designed | Executed |
| 3 | Designing | Active | Designed |
| 4 | Design with forecast | Designed | Designed |
| 5 | Diagnosis with
forecast
(a posteriori) | Previously occurred (it is not reaction possible) | Realized (now in damage) |
Table 2.
Division of measured phenomena due to thresholds of vibration comfort and perception.
Table 2.
Division of measured phenomena due to thresholds of vibration comfort and perception.
| Number of Measurements | Number of Phenomena Exceeding the Perception Threshold | The Number of Phenomena Not Exceeding the Comfort and Perception Thresholds |
|---|
| 87 | 50 | 37 |
Table 3.
Exceedances of comfort level according to different types of train.
Table 3.
Exceedances of comfort level according to different types of train.
| Train Type | Train Speed [km/h] | Value of WODL [-] |
|---|
| Old passenger train | 64 | 9.28 |
| Old passenger train | 82 | 16.65 |
| Technical train | 44 | 4.52 |
| Non-integrated high-speed train | 80 | 4.92 |
| Cargo train | 31 | 4.94 |
| New integrated high-speed train | 101 | 13.66 |
| Old integrated high-speed train | 92 | 6.21 |
Table 4.
The possibility of using a linear equation in regression.
Table 4.
The possibility of using a linear equation in regression.
| N = 87 | B | Standard Error from b | p |
|---|
| Intercept | 130.71 | 7.39 | 0.00000 |
| Train speed | 0.21 | 0.103 | 0.04328 |
Table 5.
The possibility of using a linear equation in multiple regression.
Table 5.
The possibility of using a linear equation in multiple regression.
| N = 87 | B | Standard Error from b | p |
|---|
| Intercept | 2369.61 | 552.30 | 0.000047 |
| Type of train | −11.62 | 2.87 | 0.000112 |
Table 6.
Results of analysis from [
22].
Table 6.
Results of analysis from [
22].
| No. | Speed [km/h] | Central Frequency [Hz] | WODL [-] |
|---|
| 1 | 40 | 20 | 0.20 |
| 2 | 80 | 16 | 0.32 |
| 3 | 120 | 16 | 0.33 |
| 4 | 160 | 16 | 1.60 |
| 5 | 160 | 16 | 1.71 |
| 6 | 200 | 16 | 3.08 |
| 7 | 200 | 16 | 2.86 |
| 8 | 200 | 16 | 2.60 |
| 9 | 230 | 16 | 5.14 |
| 10 | 230 | 16 | 5.21 |
| 11 | 250 | 20 | 2.62 |
| 12 | 250 | 20 | 2.72 |
| 13 | 250 | 16 | 5.08 |
| 14 | 250 | 20 | 2.89 |
| 15 | 250 | 20 | 3.06 |
| Disclaimer/Publisher’s Note: The statements, opinions and data contained in all publications are solely those of the individual author(s) and contributor(s) and not of MDPI and/or the editor(s). MDPI and/or the editor(s) disclaim responsibility for any injury to people or property resulting from any ideas, methods, instructions or products referred to in the content. |
© 2024 by the authors. Licensee MDPI, Basel, Switzerland. This article is an open access article distributed under the terms and conditions of the Creative Commons Attribution (CC BY) license (https://creativecommons.org/licenses/by/4.0/).


