Review

Notes on Bus User Assignment Problem Using Section Network Representation Method

1
Department of Civil and Environmental Engineering, College of Engineering, Majmaah University, Majmaah 11952, Saudi Arabia
2
Civil Engineering Department, Faculty of Engineering, Sphinx University, New Assiut 71684, Egypt
3
Civil Engineering Department, Faculty of Engineering, Assiut University, Assiut 71515, Egypt
*
Author to whom correspondence should be addressed.
Appl. Sci. 2024, 14(8), 3406; https://doi.org/10.3390/app14083406
Submission received: 6 February 2024 / Revised: 29 March 2024 / Accepted: 8 April 2024 / Published: 17 April 2024
(This article belongs to the Special Issue Transportation Planning, Management and Optimization)

Abstract

:
A recurrent solution to consecutive transit assignment problems is typically required to help address the bus network design problem (BNDP). Intriguingly, the transit assignment issue is differentiated by a number of distinctive characteristics. In this article, a complete analysis of one of the well-known graphical representations of the problem is conducted. The presented design is founded on the representation of the transit network by De Cea and Fernandez (1993). They developed an innovative section-based graph augmentation of the real transit network to overcome many of the mathematical formulation complexities of the problem. This study is organized to thoroughly investigate and review the model to shed light on its capabilities for use in BNDP solution schemes. The review provides the needed information to give the reader a full assessment of the selected bus assignment model. The importance of this review is shown by the fact that the most widely utilized transit assignment models in the BNDP are inadequate in their fundamental assumptions when compared to the model under consideration. The model’s graphical representation and solution technique are described in depth in addition to the constraints that will be integrated into the BNDP solution approaches. We want to refocus emphasis on this approach for further BNDP research since it is infrequently used in BNDP solution frameworks.

1. Introduction

Transit assignment models are essential assessment tools for the bus network design problem (BNDP), which is considered one of the most difficult issues to address in transportation science. Due to its great degree of intricacy, this is the case. Non-convexity and non-linearity, NP-hard/combinatorial complexity, bi-level problem formulation, and the multi-objective structure of the challenge often impede the search for an optimum solution [1]. The employment of these models determines the quality of a BNDP solution forecasting how each passenger chooses a path/route from his/her starting location to the destination location [2,3,4]. The BNDP might also be designed as a bi-level programming paradigm, with an assignment method serving as the low-level model. The final BNDP solution requires a recursive calling to the transit assignment stage [5].
In addition to the amount of aggregation attempted by each model, there are several assumptions about passengers’ information and tactics for bus line selection at the station level, where people and buses have distinct probability distributions of their arrivals. The primary distinction between transit assignment models and ordinary traffic models is that, in virtually all circumstances, bus passengers are more likely to navigate overlapping bus lines in which some lines share common stations and sections (see Figure 1). Intriguingly, this transforms the issue, even in its uncongested situations, into a multi-path assignment [1].
The example of a simple bus network in Figure 1 illustrates the core principle influencing the results of an assignment model directed to the bus networks. In actual practice, a transportation passenger always finds the most economical route (i.e., the least travel time) to their destination. Passengers boarding at station A and traveling to station B would rationally consider line 1 (L1) in their path selection as it is the direct service to the desired destination from the originating bus stop. From another perspective, L2 (with transfer at y or x) could be included in their desirable options if they were aware that it decreases overall journey time. Then, users would take the first vehicle to arrive on the two routes. In another situation, L1 might become unattractive to passengers if intelligent information on the residual wait time for L2 and the probable wait time at stations y and x is made accessible. All users would board L2 and then make transfers, even if L1 has the first arriving vehicle. This issue is referred to in the literature as the common lines problem (CLP) [6], in which customers would always opt to board the first coming bus among specified alternative lines if the target/main line is unavailable. The CLP is concerned with whether the user boards the approaching vehicle of a line, waits at the stop for the following vehicle of a different line, or goes to a different stop in search of other options. The whole CLP solution relies on the amount of data accessible at each stage and the choice made at that stage [7].
When line capacity is concerned, more dimensions are introduced. Even if L1 were the sole desirable option, some users might be unable to take the first inbound vehicle owing to the unavailability of seats. The options are to either wait for a vacant place in L1, switch entirely to the other line, or consider both options. Additionally, L2 users might not be able to determine the exact decision cost (i.e., travel time). When riding aboard, passengers must choose whether to alight to transfer at station x or remain on board until station y.
All transit assignment models are regarded to be based on these reasonable scenarios. Each model defines the strategies (i.e., a set of rules for sequential line selection) that the users might take to minimize the total waiting and in-vehicle periods. The analyst uses the assignment model to anticipate the volume of lines as well as the critical design factor of time spent by passengers on the seeded bus network. Operators make judgments about transit planning issues in order to provide the desired level of service while balancing overall operation cost and user cost [8].
The assignment models in the literature may be divided into three approaches: simulation-based, schedule-based, and frequency-based (FB). In simulation models, the real-time route selection of transport customers is monitored. Vehicles and people are represented as independent entities in the models, allowing for far more realistic modeling capabilities. The schedule-based method considers each vehicle journey individually, and its modeling approach may express each bus’s exit time via a diachronic graph. In contrast, the FB models take into account the cumulative frequencies on bus lines when computing the passenger share percentages [9].
Mathematically, the BNDP solution methods value FB models for their capacity to conduct assignments on real-world networks in a manageable amount of time. As previously indicated, several transit assignments are needed in the BNDP solution process. Therefore, the FB model aggregation would reduce the inherent complexity of the BNDP. Technically, no research has yet calibrated any current FB models using data from the actual world. In addition, the majority of BNDP studies have used transit assignment models based on naive (i.e., unrealistic) assumptions (this will be discussed in detail in the next section). The reliance on such inadequate models is due to the necessity, as referred to before, of conducting many assignments before arriving at convergence and the lack of a solid calibrated model upon which all BNDP solutions can be based.
This paper addresses one of the most popular transit assignment FB models [10]. It attempts to clarify some aspects of the well-known traffic equilibrium over the section-based graph representation. The structure of the rest of this study is as follows: Section 2 offers a succinct summary of the current state of the art for FB models, Section 3 describes the fundamental ideas employed in the chosen model, and Section 4 provides the graphical depiction. In Section 5, the strategies for achieving equilibrium are described. Section 6 concludes with the conclusion and discussion.

2. Background

In the last 50 years, several publications have been written about transit assignment models based on frequency distribution. While a number of models have been presented to forecast the behavior of passengers in picking their lines, the idea of common/attractive routes at the stations continues to be the underlying concept for such models. In [6], the notion that each passenger picks a group of routes to reduce the sum of in-vehicle time and average waiting time in her/his destination plan is initially developed. In [11], the emphasis is placed on estimating the waiting time for this issue based on the probabilistic arrival distributions of users and vehicles. In the two studies [12,13], the concept of optimum strategies is developed as a predetermined set of steps/rules the passenger follows in his/her travel journey. The CLP is summarized in a single mathematical formulation, producing a mixed-integer non-linear programming model. Interestingly, the model could be simplified into a linear form that facilitates solution discovery. In addition, the provided formulation might be expanded to include the congestion impact, much as equilibrium models of conventional traffic models do. In [14], the optimum strategies method is adopted into a graph-theoretic formulation in which the idea of hyper-paths is added. Different hyper-paths for each Origin–Destination (O/D) consisting of specific/basic pathways could be constructed. At each station, outbound connections distribute passengers throughout the basic pathways. The frequency at each stop determines the distribution components, which are then summed into one. The least-cost hyper-path for the O/D equates to the optimum strategy derived from the [12,13] formulation. To readily modify the Bellman optimality equation [15], bus frequencies are supposed to obey an exponential distribution with stochastic passenger arrivals. Figuring ideal hyper-paths in large networks with different frequency distributions using a label-correcting or label-setting method is more complicated, according to [16].
In [1], De Cea and Fernandez suggested an alternative graph representation based on what is known as line sections. In this depiction, similar lines are intrinsic to the graph architecture. The hyperbolic equation published in [7] is used at each section formulation to solve the CLP corresponding to that section. Fortunately, the methods proposed in [1] can effectively solve the hyperbolic equation.
The congestion effect has been a popular area of study in frequency models. It is an essential issue in several global transit networks [17]. Users often face completely crowded stations that force them to switch lines owing to either inability to board the preferred line due to insufficient capacity (strict capacity) or an increase in travel time impediment (moderate capacity). Modeling users’ preferences becomes a more complex problem when individual preferences and network congestion levels are included [18].
Adapting the Wardrop principles of equilibrium demonstrates the utility of congestion modeling [19]. In [20], for instance, the transit network assignment is handled using stochastic passenger equilibrium under the multinomial logit (MNL) presumption, while [1,12] employed deterministic user equilibrium principles for route selection. Instead, in [21], the probit-based approach is used to represent the path choice in order to avoid the Independence of Irrelevant Alternatives (IIA) characteristic seen in the MNL.
A well-defined congestion-cost formula is required to formulate a crowded equilibrium assignment model. Some formulae may result in challenging assignment models to use or analyze. For this reason, the congestion-cost formula must have desirable mathematical qualities (such as a monotonically growing function) [22]. Typically, cost is proportional to flow. Hence, arc costs are shown as flow-dependent. This illustrates the inefficiency and discomfort caused by overcrowded transportation. It may also manifest itself in lengthier wait times due to the bunching phenomena or the likelihood of full vehicles (i.e., being unable to board the first vehicle). The decrease in the nominal line headway is called the effective line headway and is used to account for the rise in wait times [1]. In [23], a novel model for crowded transit assignment is introduced, and it is founded on the hyper-path graph depiction that contains queuing models [24].
The stringent capacity of lines has also been addressed in transit assignment schemes. In [25], the same algorithm provided in [23] is modified to include stringent capabilities, while the main objective is to demonstrate the algorithm requirements for solution uniqueness and existence. The model minimized a newly designed gap function by using the method of successive averages (MSA). In [26], an alternative method for analyzing congestion is devised. The presented formulation included consumers’ aversion to the possibility of missing the next ride. Failure to board links and nodes is added to each station’s graph representation. The chance of failure to board is assigned based on the remaining capacity of the vehicle, and the line flows using Markov chains. In [27], the research of [26] is expanded by taking into account the availability of seats. In lieu of “failure to board”, the phrase “fail to sit” was used to describe the route selection based on the pain of standing.
All of the aforementioned models ignored the phenomenon of First-In–First-Out (FIFO) queuing, assuming that passengers mix at the stations. In [28], an FB-capacitated method is developed by taking the FIFO paradigm into consideration. The hyper-path graph is expanded to the dynamic situation, and the CLP is directly included in the path selection modeling. A bottleneck queue model with varying exit capacity over time is often used to represent congestion [29]. The concept allows users with various appealing sets to pass one another while waiting at a single stop.
Due to the proliferation of internet travel information, non-equilibrium assignment models have recently been a popular area of study. This makes consumers more aware of the transport network’s operating circumstances and suggests routes to take. In [30], a heuristic assignment methodology is suggested for determining the optimal system architecture. It tries to reduce transportation network congestion as a whole. In [31], a heuristic task is created to examine online information that might result in non-equilibrium line flows. The study in [31] is expanded in [32] to address the stringent capacity of lines.
As an assessment tool, the evaluated transit assignment models have received minimal attention in the BNDP literature. In [33,34,35], a path-generating algorithm’s set of path configurations is evaluated using the TRUST analysis process. TRUST employs basic principles to allocate demand across O/Ds in the network where similar trajectories are addressed differently. Even though they are longer, users prioritize direct paths (i.e., without transfers). The user is always supposed to take a group of paths within a certain span of the shortest route and has the least number of feasible transfers to reach his/her destination. Numerous studies, such as [36,37,38,39], decided to follow the exact protocol: consumers would select the route set with the fewest feasible transfer numbers and then choose the first bus to arrive in that set.
Similarly, references [40,41,42,43,44,45] used all-or-nothing assignment algorithms to capture line flows in which each user is allocated the shortest way in total travel time. In [46,47,48,49,50,51], when just in-vehicle periods are analyzed to establish served passengers’ preferences, more lenient assumptions are utilized. They do not address waiting periods in their goal functions.
In contrast, passenger assignment was performed in [52,53] using multiple path assignments and the frequency-sharing approach. If accessible, it is believed that all customers would use no more than two lines. In [54], the MNL approach includes the frequency-sharing concept. The assumption was that, for each O/D pair, the traveler looks first for transfer-free path options, where the frequency sharing rule is implemented. Using the MNL share function, users were divided among paths with transfers (up to three transfers) if no direct choices were available.
Some research concentrated on the design of the network lines without addressing the assignment issue. The assessment conditions might include a path time relative to the shortest route time (i.e., path directness) [55], network demand coverage [56], and required transfers [4,52,53,57]. The construct costs might also be evaluated if the system is specified to be buried [52,58]. Conversely, in [59,60], the mathematical functions included the non-equilibrium assignment models to maximize the concurrent bus line design and passenger line assignment.
Notably, the majority of non-equilibrium-based BNDP research employed capacity-free assignment [61]. It was claimed that the bus network architecture intends to determine the capacities of the routes based on the total number of prospective boarding passengers without limitation. Moreover, it has been shown that capacity-free assigning algorithms are convenient and rapid in complex systems [62,63].
To this end, equilibrium assignment algorithms have been used in a few BNDP studies. In the bulk number of studies, it is evident that the prerequisites for the uniqueness and existence of equilibrium in FB approaches exclude their implementation in suggested solution methods.
This study will shed light on section network representation as an efficient assignment tool for BNDP solution schemes. This study provides the needed information to give the reader a full assessment of the selected transit assignment model. The model’s graphical representation and solution technique are described in depth in addition to the constraints that will be integrated into the BNDP solution approaches. It is aimed to regain focus on this approach for the following BNDP research since it is infrequently used in BNDP solution frameworks, as previously discussed. In addition, the most popular transit assignment models have weak fundamental assumptions compared to the model under consideration.

3. Problem Formulation

3.1. Supply Model

In simple terms, the transit network is defined by the constituted bus lines L = {l1, l2, … ln} with the group of matching line frequencies (i.e., headways reciprocal) Φ = { φ 1 , φ 2 , ……. φ n }. Then the capacity set is found as LC = {lcm: m   L, lcm = φ m vm} where vm is the bus operating on line m capacity, considering the standing user ratio. These lines are assembled to form the transit network, which is then depicted using an enhanced graph architecture. Different functional edges/links carry passenger flows between decision nodes (i.e., accessing, walking, waiting, egressing arcs, and hauling). I = (V, E) represents the graph, where V is the collection of nodes (vertices) linked by the set of arcs (E = {(i, j): i, j V, cij }). The index e i j indicates an arc as an abbreviation for an arranged pair of indices i, j where cij is the conglomerate resistance for transiting this arc via the virtual/augmented network, which is dependent on the arc roles. A(i) is the group of edges headed toward vertex i, whereas A(i+) = {(i, j)|(i, j) E} is the group of edges coming straight from vertex i. Each link (i, j) e i j refers to a section of a bus line or a model that determines its properties (i.e., capacity and cost). The general route R cost (i.e., hyper-path or segment path) may be defined as follows:
g R w = k R ʎ k i j E c i j δ i j k w + n R w
where g R w is the average elementary pathway (k) cost that includes en-route/pre-trip selections chosen by the user (pertaining to the CLP assumption). ʎ k is the conditional probability of selecting the basic route k, if R  R is the collection of options available to users of w. The reader must distinguish between the word route and the basic route. Each time a route (R) is referred to, it is assumed to be the collection of basic pathways (k) that make up the user’s en-route/pre-journey option set. Although it is usual in the literature to refer to this route as a hyper-path, we were unable to do so in our investigation due to the presence of another similar graph representation (i.e., segment path). Consequently, it is sufficient to refer to it as route R. The incident symbol δ i j k w equals 1 if the e i j is a piece of the basic route k and 0 otherwise. n R w is the route R cost that cannot be calculated as the addition of link-particular costs. That is to say, it cannot be declared until the route has been completely configured. In bus network terminology, the factors of performance that are not additive are the waiting times at various stations. Curiously, any edge e i j may be chosen by several elementary paths inside the same collective route. Given R, we may thus calculate the conditional probability of e i j being picked:
α i j / R = k R ʎ k δ i j k w
where α i j / R is the conditional probability that edge (ij) is picked by the set of routes R given ʎ k is the conditional probability of choosing the elementary route k R and δ i j k w is the incident factor that equals 1 if route k of demand pair w contains ij and 0 otherwise.

3.2. Demand Model

Bus network demand is the outcome of the present transit supply and the transport activity systems, where complicated interactions between the two, along with the socioeconomic characteristics of users, result in journeys (i.e., d w ). Note that there is a need to define a subscript to identify the vehicle type since the bus is the sole means investigated in this study. The group of O/D pairings that are not zero W = { w   (o, d) , w V × V | d w > 0 }.
d w ( SEC , T ) = o d O u ( o / z , h ) D u d / O u , z , h p u ( m / O u , D u , z , h )
The demand function in Equation (3) calculates the overall demand amount ( d w ) , which is a result of the socioeconomic (SEC) features and the current transportation system (T). O u represents the total trip number made by passengers of category (u) and trip aim (z) originating from o , whereas D u is the total attraction for passengers of category (u) and trip aim (z). p u is the distribution share that is dependent on origin, destination, trip aim, reference time (h), and vehicle (m).
It is worth noting that as strategic bus network design is the concern of most BNDP studies, it is reasonable to evaluate the inflexible demand type with regard to sufficient reference time (i.e., one hour), the destination, and transit mode (only) to establish static traffic equilibrium in the transit network. Demand elasticity only appeared in the route choice evaluation. It is hypothesized that mixed en-route/pre-trip behavior results from a series of choices taken at various nodes in the network. It relates to the fundamental CLP in which each d w is allocated a starting station (s) and an ending station (r).

3.3. Network Loading Assumptions

The set of possible link and path flows need to be defined to explain transit network loading assumptions in the following manner:
h R = w W h R w = w W d w R w ( g R w ) , R R
f i j = R R α i j / R h R i j E
where R w is the route selection percentage for w, which is a result of the route cost g R w . The investigated model results in link or path flows in accordance with the equilibrium conditions represented by the Wardrop principle [64]. Due to the transit assignment model’s asymmetric characteristic, the network loading mechanism cannot be simplified to an analogous mathematical programming model. Consequently, it is resolved using a variational inequality defined with regard to link flows as follows:
N t ( H H D ) + C t F F D 0 , H S h & F S f
s.t.
H D S h & F D S f
where the two sets Sf and Sh are every viable solution to the assignment problem in Equations (4) and (5). The capital notation represents the vector of all small notation variables, t represents vector transpose, and the deterministic equilibrium solution is represented in D.

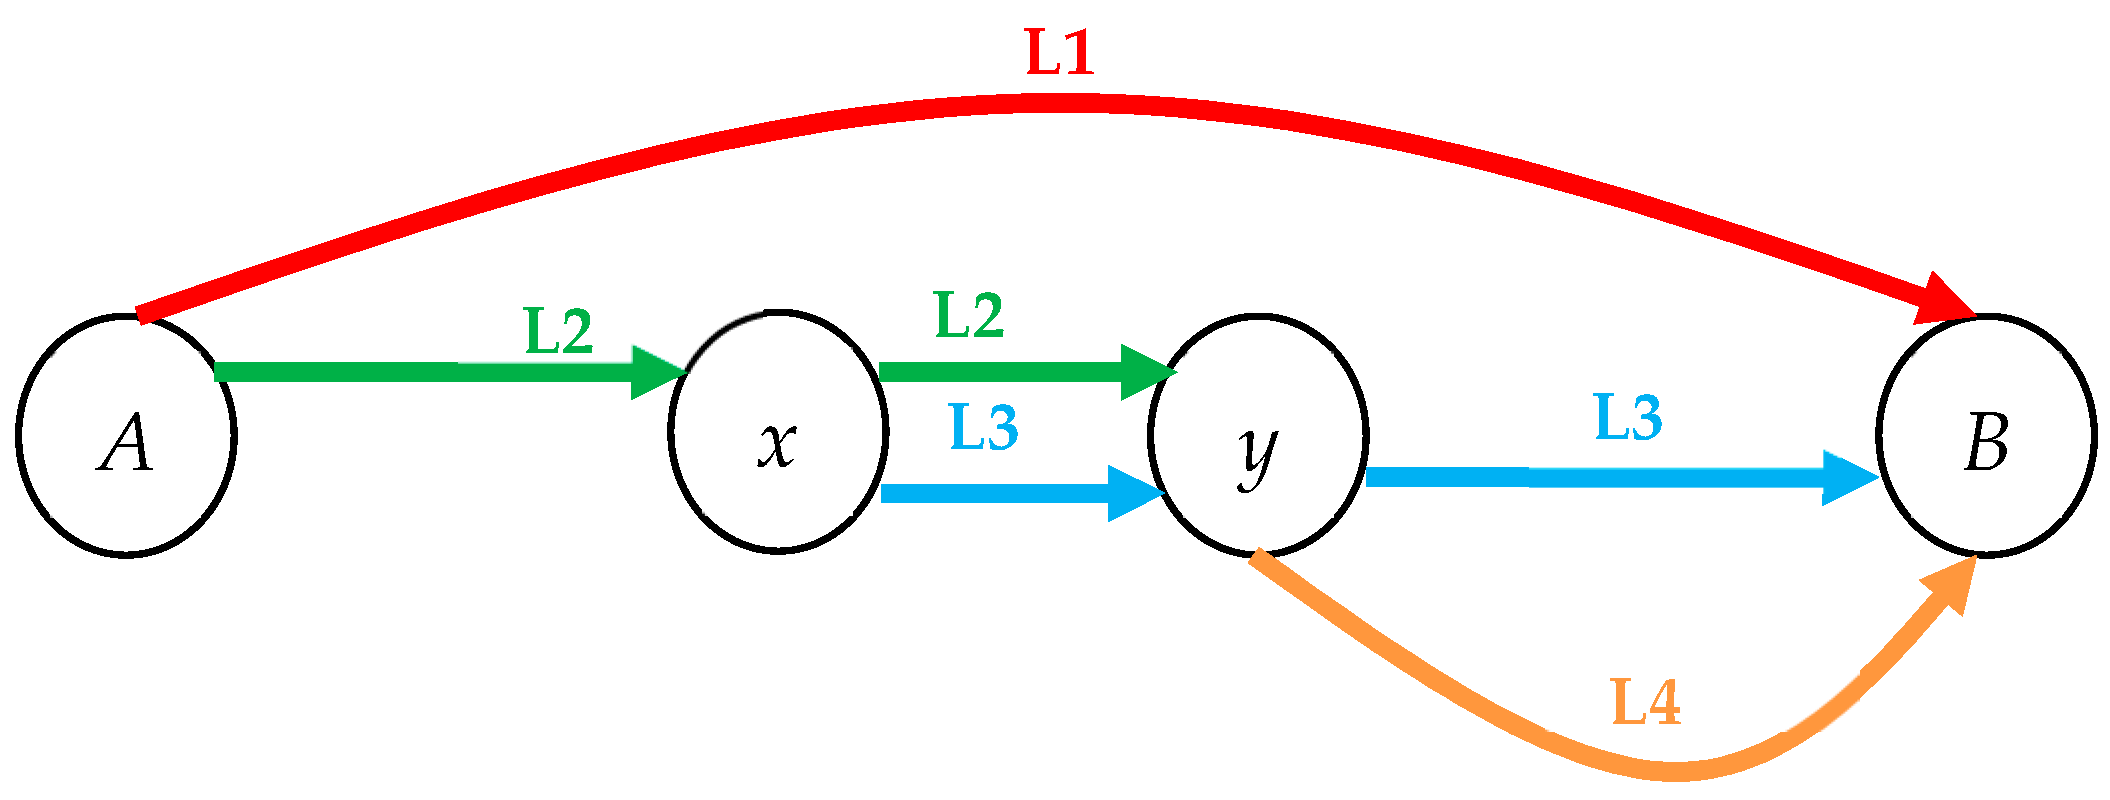
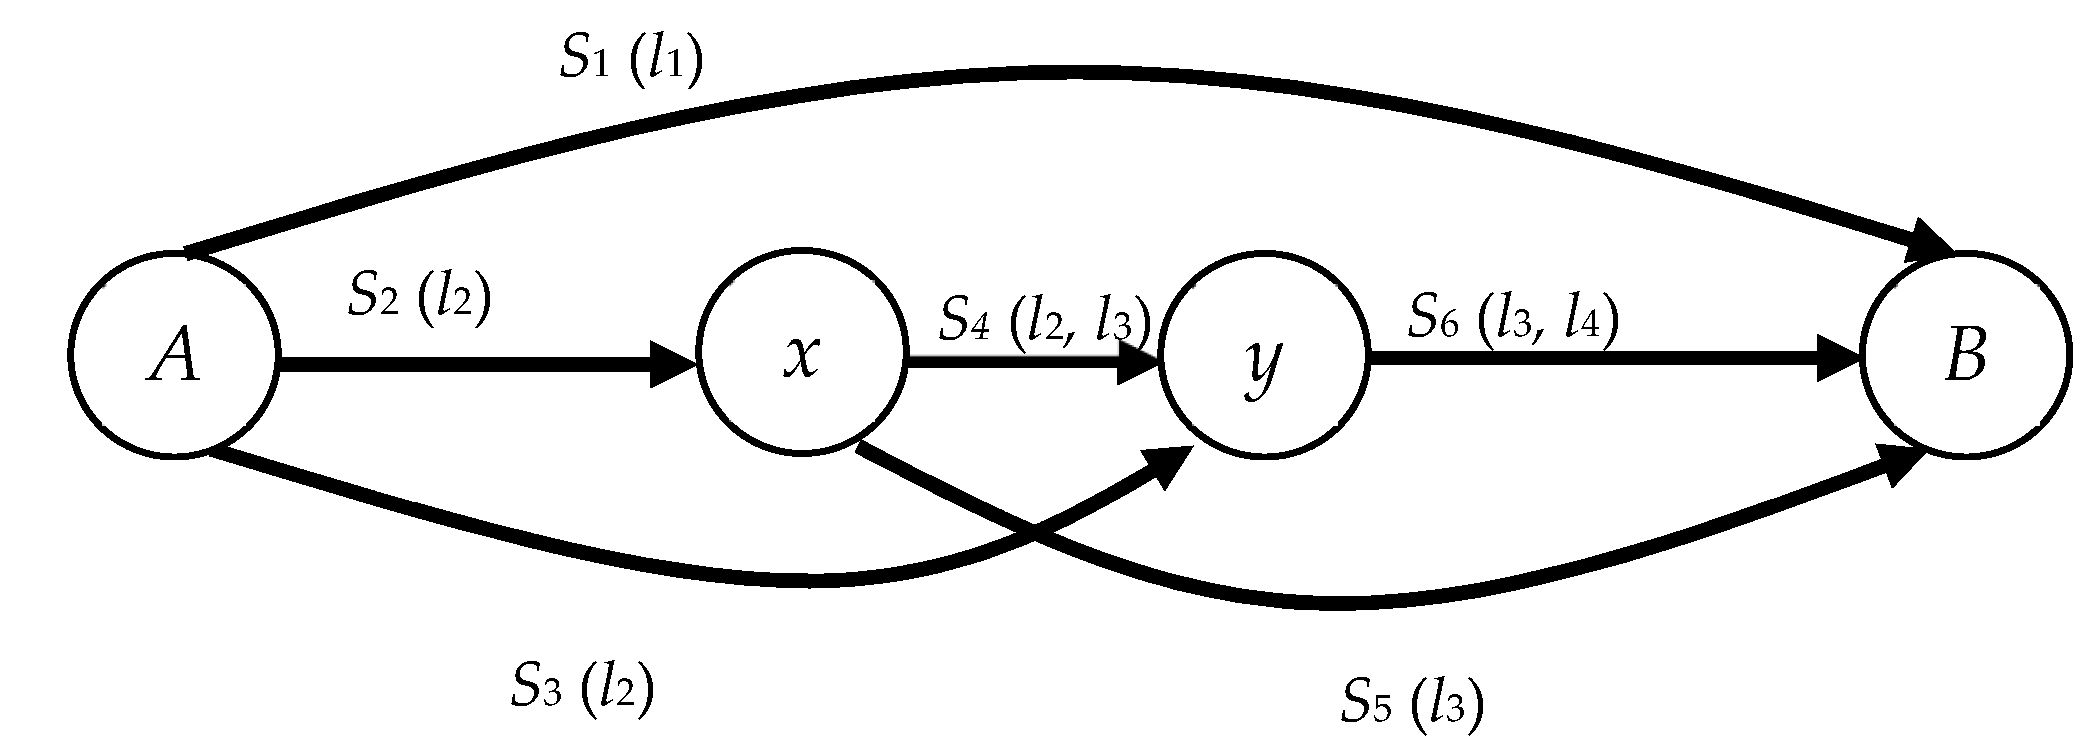
4. Transit Network Representation

4.1. The CLP

The bus station modeling problem, which involves calculating the anticipated users’ times at the stations and their distribution between the attractive bus lines, is sometimes referred to as the CLP. Consider the fundamental transit network with a single O/D pair of stations connected by n lines. Now, a user at the station may select from many lines with varying IT “in-vehicle time”. Intuitively, a traveler would select the line with the lowest IT. However, the issue arises whether (s)he would alter her/his mind if the first car to arrive was from a longer IT line. Typically, it is believed that each passenger determines a group of appealing lines based on which (s)he would board the first approaching bus of this group.
In addition to users’ real-time information and choice model, we must make assumptions on users’ arrival rates, lines’ IT probability distributions, and lines’ frequencies in order to estimate this set. The progress of the various lines is assumed to be an independent stochastic variable with an exponential distribution for the sake of the reliability of formulating the mathematical model. The users come at random according to the Poisson distribution; however, the IT timings are predictable. The answer to the following hyperbolic formulation will specify the collection of appealing lines ( L ¯ s,r    L s,r):
arg m i n x l P C = l = 1 n φ l x l l = 1 n I T l φ l x l l = 1 n φ l x l
s.t.
x l { 0 , 1 } l L s , r
where PC is the passenger’s average cost for the group of lines with x l = 1, which is updated to the set L ¯ s,r. is a factor that reflects the variation of both the bus and passenger arrival processes (e.g., = 1 in our case) [65]. Intriguingly, Equation (8) might be solved using reliable heuristics by which the lines are arranged ascendingly relating to their IT, and then each line is consecutively examined to be added to L ¯ s,r if they would not contribute to a decrease/increase in the PC value. The passengers are spread throughout the lines based on the frequency of each line:
f l = d w φ l l L ¯ s , r φ l l L ¯ s , r
Note that Equations (8)–(10) become more complicated when LC is regarded. Even if lines in L ¯ s,r are the sole desirable option, some users may be unable to board the first vehicle owing to the limited capacity. They would logically change their boarding strategies when they may find it more lucrative to wait until a bus of the set ( L ¯ s,r) is empty before boarding. Consequently, lines may surpass their stated capacity (lcm). This assumption is regarded as a moderate capacity limitation, and the selected congestion is to be addressed in the wider context of the assignment models.

4.2. Section-Based Augmented Graph

Each line’s stations are separated as unique identities for the transit network made of a collection of lines L. Then, each pair of stations and their respective lines is selected. Finally, the hyperbolic formulation at Equation (8) is solved to obtain the group of attractive lines linking each pair of stations ( L ¯ ij). This set is regarded as an edge (i.e., section/segment) in the = (V, E) since V S and E = { L ¯ ij: i, j S, cij }. Figure 2 depicts the transition of lines to the segment network representation. Each segment’s expense might be characterized as follows:
c ij = 1 + l L ¯ i j I T l φ l l L ¯ i j φ l e i j E
Intriguingly, the hyper-path R is compressed in this form into a basic route k, for which the route cost from Equation (1) is computed as follows:
g R w = i j E c i j δ i j k w + n R w
s.t.
n R w = 0 , ( for solution algorithm convenience ) and R = { k }
In other words, a hyper-path corresponds to any series of linked connections (segments) inside the hypernetwork context of this model. Now, the parameters for transit loading in Equations (4) and (5) are specified as follows:
α i j / R = R w = 1 , i f g R w = min { R k w } 0 , o t h e r w i s e

5. Transit Assignment Algorithm

The ultimate goal of a transit assignment model is to create R w and α i j / R variables that determine the ridership of transit lines. As noted before, transit riders’ route selection is a combination of en-route and pre-trip selections. This behavior might be implicitly reflected in the outlined model by establishing route R. Even when a single route R is considered for a given demand (dw), multi-line selection will be involved. The recursive calculation of the shortest route R (for each s and r) may be expressed using the generalized Bellman’s equation for the proposed deterministic model as follows:
q i = 0 i f i = r m i n i j A i + q j + c i j i f i S { r }
where qi is the length of the shortest R ¯ ( R ) route from an intermediate node i to a final node r.
It is essential to include volume-delay relationship models in the assignment process in order to simulate the consequences of growing waiting periods caused by the inconvenience of boarding (or inability to board) the first-arriving bus(es). As the suggested function may not reflect real waiting times, this assessment would aid the analyst in determining the adequacy of the analyzed design of a transit network more properly during the strategic phase. Nonetheless, it might indicate the comparative effectiveness of many examined alternatives. In this research, the impact of the higher cost will be expressed using a formula similar to the one used by the Bureau of Public Roads (BPR):
c i j = 1 + l L ¯ i j I T l φ l l L ¯ i j φ l + b f i j + i j E f ¯ i j m L ¯ i j l c m P
where f ¯ i j is the competitive flow of other sections that possess the CLP, with b and P as parameters that must be calibrated to evaluate how the flow impacts journey time. The solution flows for these cost functions may exceed the physical limits of the lines (i.e., capacities). When employing volume-delay functions immediately from calibration, this may be the case. The use of these formulae may be defended in two different ways. First, the line’s physical capacity might be surpassed in real life by lengthening the wait until an empty spot becomes available. Second, these formulae satisfy the necessary convergence and uniqueness conditions for the majority of assignment models [66,67,68,69]. Consequently, they are the most effective means of communicating the supply–demand interplay at the strategic phase of design.
The objective of the assignment procedure is to resolve the variational inequalities given in Equation (6) or (7), where they may provide a unique solution in terms of arc flows. The monotonicity assumption of the performance function in Equation (16) guarantees this uniqueness, and the assumption that the non-additive cost is flow-independent ensures that the non-additive cost is independent of the flow.
The MSA might solve either fixed-point or variational inequality versions of the problem. As the segment representation, a has an inseparable cost function architecture and an asymmetric Jacobian matrix. It would need a diagonalization phase in which the Jacobian matrix would be approximated to a diagonal matrix by taking into account just the fluctuation of the link cost at each diagonal cell. In addition, the approach proposed in [70] can be deployed to minimize the number of iterations the whole algorithm needs (see Algorithm 1). For improved convergence performance, it is essential to note that in step 4, the calculation of an improving direction and optimum step length would be necessary. However, if the objective of the assignment is to analyze the transit network in relation to the BNDP solution methods, the MSA technique would suffice.
Algorithm 1 Transit Assignment Equilibrium Algorithm.
Pre-condition : connected
Post-condition : set of link flows (F)

  1.
Initialization: 
  1.1. 
u: = 0
  1.2. 
compute a feasible arc flow F u through all or nothing using Algorithm (1) and the costs associated with none flow on the links, then compute the associated non-additive costs ( N u ) if any.
  2. 
Auxiliary flow estimation step:
diagonalize the C vector to compute the auxiliary arc flow F ¯ u by using one iteration for the diagonalized C associated with F u and N u (if any).
  3.
Set u:= u + 1
  4. 
Find the updated flow vector (MSA):
F u : = F i + 1/(u)[ F u F ¯ u ]
  5. 
Check the stopping criterion:
Test the current flow: If i j E ( f i j u f i j u 1 ) 2 | E | κ then stop and return F u  as the solution, otherwise go to step 2.
  6.
End algorithm

6. Discussion and Conclusions

This paper provides a thorough analysis of a well-known transit assignment model in order to provide a thorough comprehension of it. Numerous research studies have been conducted after modifying equilibrium solution techniques or the passengers’ behavior assumptions. According to the best of the author’s knowledge, no research examines the presented model from the standpoint of a BNDP analyst. In spite of the fundamental logic in its passenger selection behavior, it is seldom called in the BNDP literature. This was the case for a variety of reasons; one of them may be that the graph formulation still has significant representation difficulties. The best-reported CPU time was 6.58 min utilizing a network of 570 stations and 34 lines [71], while [18] reported 0.24 min with a network consisting of just 6 lines and 24 nodes. These execution durations restrict the use of the proposed model as subroutines in the BNDP solution frameworks.
Using the most recent contributions, BNDP solution techniques that require many consecutive assignments would counteract the running time explosion. In addition, the model does not limit the transfer number required to reach the destination. According to equilibrium conditions, the passenger would undertake the journey if capacity existed and the time impediment was feasible regardless of the required transfer number. Transfers could only be incorporated in the cost function as an additional impedance. Therefore, the model does not enable the designer to manage or monitor the transfer number in the final BNDP solution. In a poll conducted by [72] in the United States, almost sixty percent of respondents from various transport agencies felt that bus riders are only willing to make one transfer per journey. As standard assignment issues on road networks, they may be constructed as arc-based or roue-based models based on the requisite transit flow data (i.e., arc flow or route flow). To reach relatively rapid answers, equilibrium models are mostly link-based, eliminating the combinatorial process of entire route enumeration. Unfortunately, link-based methodologies do not allow the analyst to monitor the paths of network users. Route-based models, on the other hand, give path flow information, allowing the analyst to analyze the influence of the proposed BNDP design on a particular set of users. Furthermore, the assignment model has not been calibrated with the real passenger flow on a bus network. This calls to question the actual value of using a more complicated/sophisticated assignment scheme in the BNDP. Developing a realistic and efficient transit assignment model is still an open door for new contributions.

Author Contributions

Conceptualization, M.O.; data curation, A.A. and A.S.A.; formal analysis, M.O.; methodology, M.O.; resources, A.A. and A.S.A.; software, A.A. and A.S.A.; validation, M.O., A.A. and A.S.A.; writing—original draft, M.O.; writing—review and editing, A.A. and A.S.A. All authors have read and agreed to the published version of the manuscript.

Funding

The authors would like to thank Deanship of Scientific Research at Majmaah University for supporting this work under Project Number No. R-2024-1046.

Data Availability Statement

Not applicable.

Conflicts of Interest

The authors declare no conflicts of interest.

Nomenclature

i, jGeneric nodes in V
oOrigin node
d Destination node
mBus line index
sStart bus stop
rEnd bus stop
RPath R is composed of a set of k paths
hReference time
p u Distribution share
d w The number of transit trips from o to d
w Demand pair index
kElementary path index
O u The total production of user class u
D u The total attraction of user class u
eijedge of an ordered pair of indexes (i, j)
h R Path R flow
φ m Line m frequency
f ¯ i j The competing flow of other sections that contain common lines of section i j
α i k Incident symbol that equals 1 if path k traverses i, 0 otherwise
ʎ k The conditional probability of choosing k
cijAggregate impedance on link eij
g R w The average cost of R
n R w Non-additive path R cost
vmLine m vehicle capacity, including the loading factor
lcmLine m nominal capacity
τ i Waiting time at node i
f i j Link i j flow
Graph of V and E
δ i j k w Incident symbol that equals 1 if e i j is part of k, 0 otherwise
R w Path R choice proportion for w
TSTransfer number
ITIn-vehicle time
£Weight factor
b , P Calibrated factors
GPath cost set
CLink cost set
FLink flow set
HPath flow set
WNode pair set
LCBus line capacity set
ΦBus line frequency set
LSet of lines that defines the transit system
ESet of edges
VSet of vertices (nodes)
BNDPBus network design problem
CLPCommon lines problem
FBFrequency-based
FIFOFirst In–First Out
O/DOrigin–Destination
MNLMultinomial logit
MSAMethod of successive averages
IIAIndependence of Irrelevant Alternatives
ITIn-vehicle time

References

  1. Cea, J.D.; Fernandez, E. Transit assignment for congested public transport system: An equilibrium model. Transp. Sci. 1993, 27, 133–147. [Google Scholar] [CrossRef]
  2. Owais, M.; Ahmed, A.S. Frequency based transit assignment models: Graph formulation study. IEEE Access 2022, 10, 62991–63003. [Google Scholar] [CrossRef]
  3. Owais, M.; Osman, M.K. Complete hierarchical multi-objective genetic algorithm for transit network design problem. Expert Syst. Appl. 2018, 114, 143–154. [Google Scholar] [CrossRef]
  4. Owais, M.; Ahmed, A.S.; Moussa, G.S.; Khalil, A.A. Integrating underground line design with existing public transportation systems to increase transit network connectivity: Case study in greater cairo. Expert Syst. Appl. 2021, 167, 114183. [Google Scholar] [CrossRef]
  5. Gao, Z.; Sun, H.; Shan, L. A Continuous Equilibrium Network Design Model and Algorithm for Transit Systems. Transp. Res. Part B Methodol. 2004, 38, 235–250. [Google Scholar] [CrossRef]
  6. Chriqui, C.; Robillard, P. Common Bus Lines. Transp. Sci. 1975, 9, 115–121. [Google Scholar] [CrossRef]
  7. Owais, M. Deep Learning for Integrated Origin–Destination Estimation and Traffic Sensor Location Problems. IEEE Trans. Intell. Transp. Syst. 2024, in press. [Google Scholar] [CrossRef]
  8. Sadrani, M.; Tirachini, A.; Antoniou, C. Vehicle dispatching plan for minimizing passenger waiting time in a corridor with buses of different sizes: Model formulation and solution approaches. Eur. J. Oper. Res. 2022, 299, 263–282. [Google Scholar] [CrossRef]
  9. Owais, M.; Alshehri, A.; Gyani, J.; Aljarbou, M.H.; Alsulamy, S. Prioritizing Rear-End Crash Explanatory Factors for Injury Severity Level Using Deep Learning and Global Sensitivity Analysis. Expert Syst. Appl. 2024, 245, 123114. [Google Scholar] [CrossRef]
  10. Almutairi, A.; Yi, P.; Owsais, M. New Approach for Estimating Intersection Control Delay from Passive Traffic Sensors at Network Level. IEEE Access 2024, 12, 2882–2900. [Google Scholar] [CrossRef]
  11. Marguier, P.; Ceder, A. Passenger Waiting Strategies for Overlapping Bus Routes. Transp. Sci. 1984, 18, 207–230. [Google Scholar] [CrossRef]
  12. Spiess, H.; Florian, M. Optimal strategies: A new assignment model for transit networks. Transp. Res. Part B Methodol. 1989, 23, 83–102. [Google Scholar] [CrossRef]
  13. Spiess, H. On Optimal Route Choice Strategies in Transit Networks; Centre de Recherche sur les Transports, Université de Montréal: Montreal, QC, Canada, 1983. [Google Scholar]
  14. Nguyen, S.; Pallottino, S. Equilibrium traffic assignment for large scale transit networks. Eur. J. Oper. Res. 1988, 37, 176–186. [Google Scholar] [CrossRef]
  15. Bellman, R. On a routing problem. Q. Appl. Math. 1958, 16, 87–90. [Google Scholar] [CrossRef]
  16. Li, Q.; Chen, P.W.; Nie, Y.M. Finding optimal hyperpaths in large transit networks with realistic headway distributions. Eur. J. Oper. Res. 2015, 240, 98–108. [Google Scholar] [CrossRef]
  17. De Bona, A.; Rosa, M.; Fonseca, K.; Lüders, R.; Kozievitch, N. Congestion Potential–A New Way to Analyze Public Transportation based on Complex Networks. In Proceedings of the 2018 IEEE International Smart Cities Conference (ISC2), Kansas City, MO, USA, 16–19 September 2018; pp. 1–8. [Google Scholar]
  18. Larrain, H.; Suman, H.K.; Muñoz, J.C. Route based equilibrium assignment in congested transit networks. Transp. Res. Part C Emerg. Technol. 2021, 127, 103125. [Google Scholar] [CrossRef]
  19. Sun, S.; Szeto, W. Logit-based transit assignment: Approach-based formulation and paradox revisit. Transp. Res. Part B Methodol. 2018, 112, 191–215. [Google Scholar] [CrossRef]
  20. Lam, W.H.-K.; Gao, Z.; Chan, K.; Yang, H. A stochastic user equilibrium assignment model for congested transit networks. Transp. Res. Part B Methodol. 1999, 33, 351–368. [Google Scholar] [CrossRef]
  21. Nielsen, O.A. A stochastic transit assignment model considering differences in passengers utility functions. Transp. Res. Part B Methodol. 2000, 34, 377–402. [Google Scholar] [CrossRef]
  22. Bouzaïene-Ayari, B.; Gendreau, M.; Nguyen, S. Modeling bus stops in transit networks: A survey and new formulations. Transp. Sci. 2001, 35, 304–321. [Google Scholar] [CrossRef]
  23. Cominetti, R.; Correa, J. Common-lines and passenger assignment in congested transit networks. Transp. Sci. 2001, 35, 250–267. [Google Scholar] [CrossRef]
  24. Spiess, H. Technical note—Conical volume-delay functions. Transp. Sci. 1990, 24, 153–158. [Google Scholar] [CrossRef]
  25. Cepeda, M.; Cominetti, R.; Florian, M. A frequency-based assignment model for congested transit networks with strict capacity constraints: Characterization and computation of equilibria. Transp. Res. Part B Methodol. 2006, 40, 437–459. [Google Scholar] [CrossRef]
  26. Kurauchi, F.; Bell, M.G.; Schmöcker, J.-D. Capacity constrained transit assignment with common lines. J. Math. Model. Algorithms 2003, 2, 309–327. [Google Scholar] [CrossRef]
  27. Schmöcker, J.-D.; Fonzone, A.; Shimamoto, H.; Kurauchi, F.; Bell, M.G. Frequency-based transit assignment considering seat capacities. Transp. Res. Part B Methodol. 2011, 45, 392–408. [Google Scholar] [CrossRef]
  28. Trozzi, V.; Gentile, G.; Bell, M.G.; Kaparias, I. Dynamic user equilibrium in public transport networks with passenger congestion and hyperpaths. Transp. Res. Part B Methodol. 2013, 57, 266–285. [Google Scholar] [CrossRef]
  29. Gentile, G.; Meschini, L.; Papola, N. Spillback congestion in dynamic traffic assignment: A macroscopic flow model with time-varying bottlenecks. Transp. Res. Part B Methodol. 2007, 41, 1114–1138. [Google Scholar] [CrossRef]
  30. Cheung, L.L.; Shalaby, A.S. System optimal re-routing transit assignment heuristic: A theoretical framework and large-scale case study. Int. J. Transp. Sci. Technol. 2017, 6, 287–300. [Google Scholar] [CrossRef]
  31. Oliker, N.; Bekhor, S. A frequency based transit assignment model that considers online information. Transp. Res. Part C Emerg. Technol. 2018, 88, 17–30. [Google Scholar] [CrossRef]
  32. Oliker, N.; Bekhor, S. A frequency based transit assignment model that considers online information and strict capacity constraints. EURO J. Transp. Logist. 2020, 9, 100005. [Google Scholar] [CrossRef]
  33. Baaj, M.H.; Mahmassani, H. An AI-Based Approach for Transit Route System Planning and Design. J. Adv. Transp. 1991, 25, 187–210. [Google Scholar] [CrossRef]
  34. Shih, M.-C.; Mahmassani, H. A Design Methodology for Bus Transit Networks with Coordinated Operation. Ph.D. Thesis, Center for Transportation, Bureau of Engineering Research, University of Texas: Austin, TX, USA, 1994. [Google Scholar]
  35. Baaj, M.H.; Mahmassani, H. Hybrid Route Generation Heuristic Algorithm for the Design of Transit Networks. Transp. Res. Part C Emerg. Technol. 1995, 3, 31–50. [Google Scholar] [CrossRef]
  36. Tom, V.; Mohan, S. Transit route network design using frequency coded genetic algorithm. J. Transp. Eng. 2003, 129, 186–195. [Google Scholar] [CrossRef]
  37. Szeto, W.Y.; Wu, Y. A simultaneous bus route design and frequency setting problem for Tin Shui Wai, Hong Kong. Eur. J. Oper. Res. 2011, 209, 141–155. [Google Scholar] [CrossRef]
  38. Liu, Y.; Feng, X.; Zhang, L.; Hua, W.; Li, K. A Pareto Artificial Fish Swarm Algorithm for Solving a Multi-Objective Electric Transit Network Design Problem. Transp. A Transp. Sci. 2020, 16, 1648–1670. [Google Scholar] [CrossRef]
  39. Du, M.; Cun, D.; Chen, A.; Tan, H. A Weibit-Based sequential transit assignment model based on hyperpath graph and generalized extreme value network representation. Transp. Res. Part C Emerg. Technol. 2023, 151, 104142. [Google Scholar] [CrossRef]
  40. Ngamchai, S.; Lovell, D.J. Optimal time transfer in bus transit route network design using a genetic algorithm. J. Transp. Eng. 2003, 129, 510–521. [Google Scholar] [CrossRef]
  41. Agrawal, J.; Mathew, T.V. Transit route network design using parallel genetic algorithm. J. Comput. Civ. Eng. 2004, 18, 248–256. [Google Scholar] [CrossRef]
  42. Fan, L.; Mumford, C.L. A metaheuristic approach to the urban transit routing problem. J. Heuristics 2010, 16, 353–372. [Google Scholar] [CrossRef]
  43. Gutiérrez-Jarpa, G.; Laporte, G.; Marianov, V.; Moccia, L. Multi-objective rapid transit network design with modal competition: The case of Concepción, Chile. Comput. Oper. Res. 2017, 78, 27–43. [Google Scholar] [CrossRef]
  44. Iliopoulou, C.; Kepaptsoglou, K. Integrated transit route network design and infrastructure planning for on-line electric vehicles. Transp. Res. Part D Transp. Environ. 2019, 77, 178–197. [Google Scholar] [CrossRef]
  45. Ahmed, L.; Mumford, C.; Kheiri, A. Solving urban transit route design problem using selection hyper-heuristics. Eur. J. Oper. Res. 2019, 274, 545–559. [Google Scholar] [CrossRef]
  46. Fan, W.; Machemehl, R.B. Tabu search strategies for the public transportation network optimizations with variable transit demand. Comput. Aided Civ. Infrastruct. Eng. 2008, 23, 502–520. [Google Scholar] [CrossRef]
  47. Nikolić, M.; Teodorović, D. Transit network design by bee colony optimization. Expert Syst. Appl. 2013, 40, 5945–5955. [Google Scholar] [CrossRef]
  48. Kechagiopoulos, P.N.; Beligiannis, G.N. Solving the urban transit routing problem using a particle swarm optimization based algorithm. Appl. Soft Comput. 2014, 21, 654–676. [Google Scholar] [CrossRef]
  49. Nayeem, M.A.; Rahman, M.K.; Rahman, M.S. Transit network design by genetic algorithm with elitism. Transp. Res. Part C Emerg. Technol. 2014, 46, 30–45. [Google Scholar] [CrossRef]
  50. Islam, K.A.; Moosa, I.M.; Mobin, J.; Nayeem, M.A.; Rahman, M.S. A heuristic aided Stochastic Beam Search algorithm for solving the transit network design problem. Swarm Evol. Comput. 2019, 46, 154–170. [Google Scholar] [CrossRef]
  51. Cervantes-Sanmiguel, K.I.; Chavez-Hernandez, M.V.; Ibarra-Rojas, O.J. Analyzing the trade-off between minimizing travel times and reducing monetary costs for users in the transit network design. Transp. Res. Part B Methodol. 2023, 173, 142–161. [Google Scholar] [CrossRef]
  52. Owais, M.; Ahmed, A.S.; Moussa, G.S.; Khalil, A.A. An optimal metro design for transit networks in existing square cities based on non-demand criterion. Sustainability 2020, 12, 9566. [Google Scholar] [CrossRef]
  53. Owais, M.; Ahmed, A.S.; Moussa, G.S.; Khalil, A.A. Design scheme of multiple-subway lines for minimizing passengers transfers in mega-cities transit networks. Int. J. Rail Transp. 2021, 9, 540–563. [Google Scholar] [CrossRef]
  54. Arbex, R.O.; da Cunha, C.B. Efficient transit network design and frequencies setting multi-objective optimization by alternating objective genetic algorithm. Transp. Res. Part B Methodol. 2015, 81, 355–376. [Google Scholar] [CrossRef]
  55. Zhao, F.; Ubaka, I. Transit network optimization-minimizing transfers and optimizing route directness. J. Public Transp. 2004, 7, 4. [Google Scholar] [CrossRef]
  56. Mauttonw, A.; Urquhart, M. A route set construction algorithm for the transit network design problem. Comput. Oper. Res. 2009, 36, 2440–2449. [Google Scholar] [CrossRef]
  57. Zhao, F.; Ubaka, I.; Gan, A. Transit network optimization: Minimizing transfers and maximizing service coverage with an integrated simulated annealing and tabu search method. Transp. Res. Rec. 2005, 1923, 180–188. [Google Scholar] [CrossRef]
  58. Marín, Á. An extension to rapid transit network design problem. Top 2007, 15, 231–241. [Google Scholar] [CrossRef]
  59. Guan, J.; Yang, H.; Wirasinghe, S.C. Simultaneous optimization of transit line configuration and passenger line assignment. Transp. Res. Part B Methodol. 2006, 40, 885–902. [Google Scholar] [CrossRef]
  60. Goerigk, M.; Schmidt, M. Line planning with user-optimal route choice. Eur. J. Oper. Res. 2017, 259, 424–436. [Google Scholar] [CrossRef]
  61. Bagloee, S.A.; Ceder, A.A. Transit-network design methodology for actual-size road networks. Transp. Res. Part B Methodol. 2011, 45, 1787–1804. [Google Scholar] [CrossRef]
  62. Owais, M.; Moussa, G.; Abbas, Y.; El-Shabrawy, M. Simple and effective solution methodology for transit network design problem. Int. J. Comput. Appl. 2014, 89, 32–40. [Google Scholar] [CrossRef]
  63. Ul Abedin, Z. A Methodology to Design Multimodal Public Transit Networks: Procedures and Applications; Nanyang Technological University: Singapore, 2019. [Google Scholar]
  64. Krylatov, A.; Zakharov, V.; Tuovinen, T.; Krylatov, A.; Zakharov, V.; Tuovinen, T. Principles of wardrop for traffic assignment in a road network. In Optimization Models and Methods for Equilibrium Traffic Assignment; Springer: Berlin/Heidelberg, Germany, 2020; pp. 17–43. [Google Scholar]
  65. Idriss, L.K.; Owais, M. Global sensitivity analysis for seismic performance of shear wall with high-strength steel bars and recycled aggregate concrete. Constr. Build. Mater. 2024, 411, 134498. [Google Scholar] [CrossRef]
  66. Sheffi, Y.; Powell, W. A comparison of stochastic and deterministic traffic assignment over congested networks. Transp. Res. Part B Methodol. 1981, 15, 53–64. [Google Scholar] [CrossRef]
  67. Sheffi, Y.; Powell, W.B. An algorithm for the equilibrium assignment problem with random link times. Networks 1982, 12, 191–207. [Google Scholar] [CrossRef]
  68. Nielsen, O.A.; Frederiksen, R.D. Optimisation of timetable-based, stochastic transit assignment models based on MSA. Ann. Oper. Res. 2006, 144, 263–285. [Google Scholar] [CrossRef]
  69. Di Gangi, M.; Cantarella, G.; Vitetta, A. MSA Algorithms for solving SUE in Urban Transit Networks. In Proceedings of the 4th hEART Conference, Lyngby, Denmark, 15–18 August 2011. [Google Scholar]
  70. Sheffi, Y. Urban Transportation Networks; Prentice-Hall: Englewood Cliffs, NJ, USA, 1985; Volume 6. [Google Scholar]
  71. Ren, H.; Song, Y.; Long, J.; Si, B. A new transit assignment model based on line and node strategies. Transp. Res. Part B Methodol. 2021, 150, 121–142. [Google Scholar] [CrossRef]
  72. Stern, R. Passenger Transfer System Review; Transportation Research Board: Washington, DC, USA, 1996; Volume 19. [Google Scholar]
Figure 1. Small bus system taken from [1].
Applsci 14 03406 g001
Figure 2. Section-based network graph representation for the network presented in Section 1.
Applsci 14 03406 g002
Disclaimer/Publisher’s Note: The statements, opinions and data contained in all publications are solely those of the individual author(s) and contributor(s) and not of MDPI and/or the editor(s). MDPI and/or the editor(s) disclaim responsibility for any injury to people or property resulting from any ideas, methods, instructions or products referred to in the content.

