Abstract
Tunnel construction adjacent to the fault fracture zone is prone to water inrush disasters, which pose a serious threat to the safety of tunnel construction. To provide theoretical support for the early warning and prevention of water inrush disasters of the tunnel adjacent to the water-rich faults, a numerical analysis based on the three-dimensional discrete element method (DEM) was performed to study the evolution of the displacement and seepage fields of the water-resistant rock mass of a tunnel adjacent to a water-rich fault during the water inrush process by taking the Xianglushan tunnel as the research project. With reference to the obtained results, a grouting reinforcement scheme was developed, and its effectiveness was evaluated. The results indicated that as the tunnel face approached the water-rich fault fracture zone, the effect of water pressure gradually became obvious, and the displacement at the face continuously increased. When the tunnel face was excavated to the position 5 m from the fault, the displacement at the center of the face changed suddenly with a sudden increase in water pressure. The water-resistant rock mass ahead of the center of the face was damaged, and a water inrush disaster occurred in the tunnel. Numerical simulation results demonstrated the feasibility of the grouting reinforcement scheme. The assessment based on the borehole acoustic waves, borehole TV, geological radar detection, and convergence monitoring as well as the excavation results confirmed that the water inrush disasters in the 2# adit of Xianglushan tunnel adjacent to the water-rich fault were effectively prevented and controlled, which can provide a reference for the prevention and treatment of the frequent water inrush disasters in underground projects constructed in the water-rich fault area.
1. Introduction
“Accelerating the construction of a country with strong transportation network and improving the comprehensive transport corridor” is the core initiative of the 14th Five-Year Plan of the China, and the tunnel project is an important support for the grand strategy of realizing a country with a strong transportation network [1]. At present, China has been the country with the largest scale, the largest number, the most difficult, and the fastest development of tunnels in the world, and a large number of road, railway, and water diversion tunnels have been constructed in areas with complex topographical and geological conditions and abundant groundwater. Fault fracture zones with loose, broken, and poorly self-stabilized rock masses are common adverse geological conditions faced in tunnel construction. There is a significant difference in physical and mechanical properties between the fault and the rock mass around the fault, and various geological hazards are often encountered when tunnelling approaches the fault. Among them, water inrush and mud outburst that possess extremely high risks are the most frequently encountered, which not only affects the regular construction of tunnels, resulting in delays, but also seriously threatens the safety of personnel and construction machinery in the field [2,3,4,5]. During the construction of the Anshi tunnel on the Yunfeng Expressway, a hidden aquifer fracture zone was confirmed in the right-upper part of the right hole at mileage of K42 + 955. Two large-scale water inrush and mud outburst disasters occurred when the face was advanced to the mileage of YK42 + 951.6, which caused 12 deaths, 10 injuries, and a direct economic loss of 2,520,100 CNY. The Dafengyakou tunnel, a controlling project of Yuanjiang-Maohei Expressway, experienced a large-scale water inrush and mud outburst when the excavation of the tunnel passed through the fault-concentrated development zone, with a water inrush amount of 24,000 m3 and a mud outburst amount of 11,000 m3. When the Baiyun tunnel on the Nanning-Guangzhou Railway was excavated to the mileage of DK334 + 733, a large-scale water inrush and mud outburst occurred, with a mud outburst amount of about 2000 m3 and a water inrush rate of about 300 m3/h, which resulted in 5 deaths. Therefore, it is very urgent to perform the research regarding the water inrush mechanism to provide theoretical guidance for the tunnel construction adjacent to the fault.
In recent years, a large number of scholars have explored the water inrush mechanism of tunnels adjacent to faults, and the results are quite fruitful. In terms of theoretical analyses, many scholars worldwide have deeply examined the water inrush mechanism of faults according to theories such as the total potential energy principle, silo theory, and limit equilibrium method [6,7,8,9]. However, the water inrush in the face of the tunnel adjacent to the fault is a systematic imbalance process that is affected by a triggering factor of excavation disturbance and a coupling of multiple factors and conditions in the water-resistant rock mass at the face, which is a highly non-linear mathematical problem. It is difficult to theoretically depict the whole process of the water inrush disaster in the water-resistant rock mass. The model test can simulate the destabilization of the water-resistant rock mass at the face and reproduce the whole process of the water inrush disaster. Many scholars have studied the change characteristics of displacement, water surge, and permeability pressure in the rock mass when a water inrush disaster occurs in a tunnel adjacent to the fault by conducting physical model tests [10,11,12,13,14]. Since physical model tests require a large amount of manpower, material resources, and time, it is difficult to carry out multiple large-scale tests. Also, due to the limited number of monitoring devices and the limitations of the monitoring instruments, the model test cannot obtain the full-field multivariate information during the process of the damage and destabilization of the water-resistant rock mass of the tunnel adjacent to the fault. Numerical simulation methods can solve the above problems by visualizing the process of a water inrush disaster occurring in the tunnel adjacent to the fault. Regarding numerical simulation, Wang et al. [15] used finite element software ANSYS 11.0 to study the deformation and stress distribution characteristics of the rock mass when tunnel excavation passed through the fault fracture zone, and analyzed influence of fault dip angle and width on the stability of tunnel rock mass. Zhang et al. [16] performed a 3D finite element analysis to investigate the evolution of a fault mud outburst of a tunnel and classified the evolution process into three stages, i.e., the prepared stage, latent stage, and explosive stage. Li et al. [17] investigated the influences of the dip angle, permeability, and flow pattern of the fault on the pressure and velocity of water inrush in a tunnel by means of finite element software COMSOL 5.6. Fu et al. [18] used the finite difference programme to analyze the distribution of the rock seepage field, face extrusion deformation, plastic zone volume, water yield, and shear deformation of the grouting reinforcement circle ahead of the face when the face advanced to different positions, and they finally determined a reasonable thickness of the grouting reinforcement circle. Zhang et al. [19] used FLAC 3D to simulate the evolution of seepage, stress, and displacement fields in the process of water inrush and mud outburst in a fault-crossing tunnel and summarized the disaster conditions and catastrophic characteristics of water inrush and mud outburst in a water-rich section. The above numerical simulations have greatly promoted the research on the catastrophic process of water inrush in tunnels adjacent to faults. However, the numerical simulations based on the finite element method and finite difference method generally regard the water-resistant rock mass at the face as a porous continuous medium, which is unable to simulate the process of water inrush and the destruction of the water-resistant rock mass due to the formation, expansion, and dynamic evolution of the seepage channel. In recent years, scholars often study the law and mechanism of water inrush in tunnels with the DEM, which offers more obvious advantages in simulating the damage of tunnel rock mass [20,21,22,23]. Most of these studies focus on the mechanism of rock mass damage caused by groundwater in fault fracture zones, and there are fewer studies on analyzing the damage evolution law of the water-resistant rock mass of the tunnel adjacent to the fault and the minimum safe thickness.
The Central Yunnan Water Diversion Project is the largest and most invested water resource allocation project in Southwest China and is also one of the largest water diversion projects under construction in China. Its construction is faced with major engineering geological problems, such as active fault, karst groundwater, high geo-stress, and a large deformation of soft rock, which brings great challenges to the tunnel construction [24]. Xianglushan tunnel is the first structure in the Dali I section of the Central Yunnan Water Diversion Project, and it is also the most complicated deep long tunnel in the whole line with the most complicated geological conditions. Since its location is close to several fault zones, the groundwater flow is irregular, and water inrush disasters are prone to occur at the tunnel face during the excavation. In view of this, this paper took the 2# adit of Xianglushan tunnel as the research object and used the 3D DEM to analyze the evolution characteristics of displacement and seepage-pressure fields during the catastrophic process of water inrush at the face. The minimum safe thickness of the water-resistant rock mass was determined, and the grouting treatment scheme was established. The reasonableness of the grouting scheme was analyzed using numerical simulations, and the effectiveness of the grouting was evaluated. The results of the study are of great significance to the prevention of water inrush disasters and the safe construction of tunnels adjacent to water-rich faults.
2. Tunnel Description and Geological Conditions
The Central Yunnan Water Diversion Project is located in the mountainous region of the Central Yunnan Plateau in Yunnan Province on the southeastern edge of the Tibetan Plateau, with high mountains and deep valleys along the route and developed and complex geological formations. The project starts from Shigu Town of Lijiang City and ends at Xinpobei Village of Honghe Prefecture. The main water diversion channel is about 664.24 km long, and there are 118 main water diversion structures, including 58 tunnels with a length of 612.00 km, accounting for 92.13%. Adverse geological structures are developed along the whole route of the project, and there are 43 major fracture zones directly intersecting with the main water diversion channel, including 16 engineering active fracture zones.
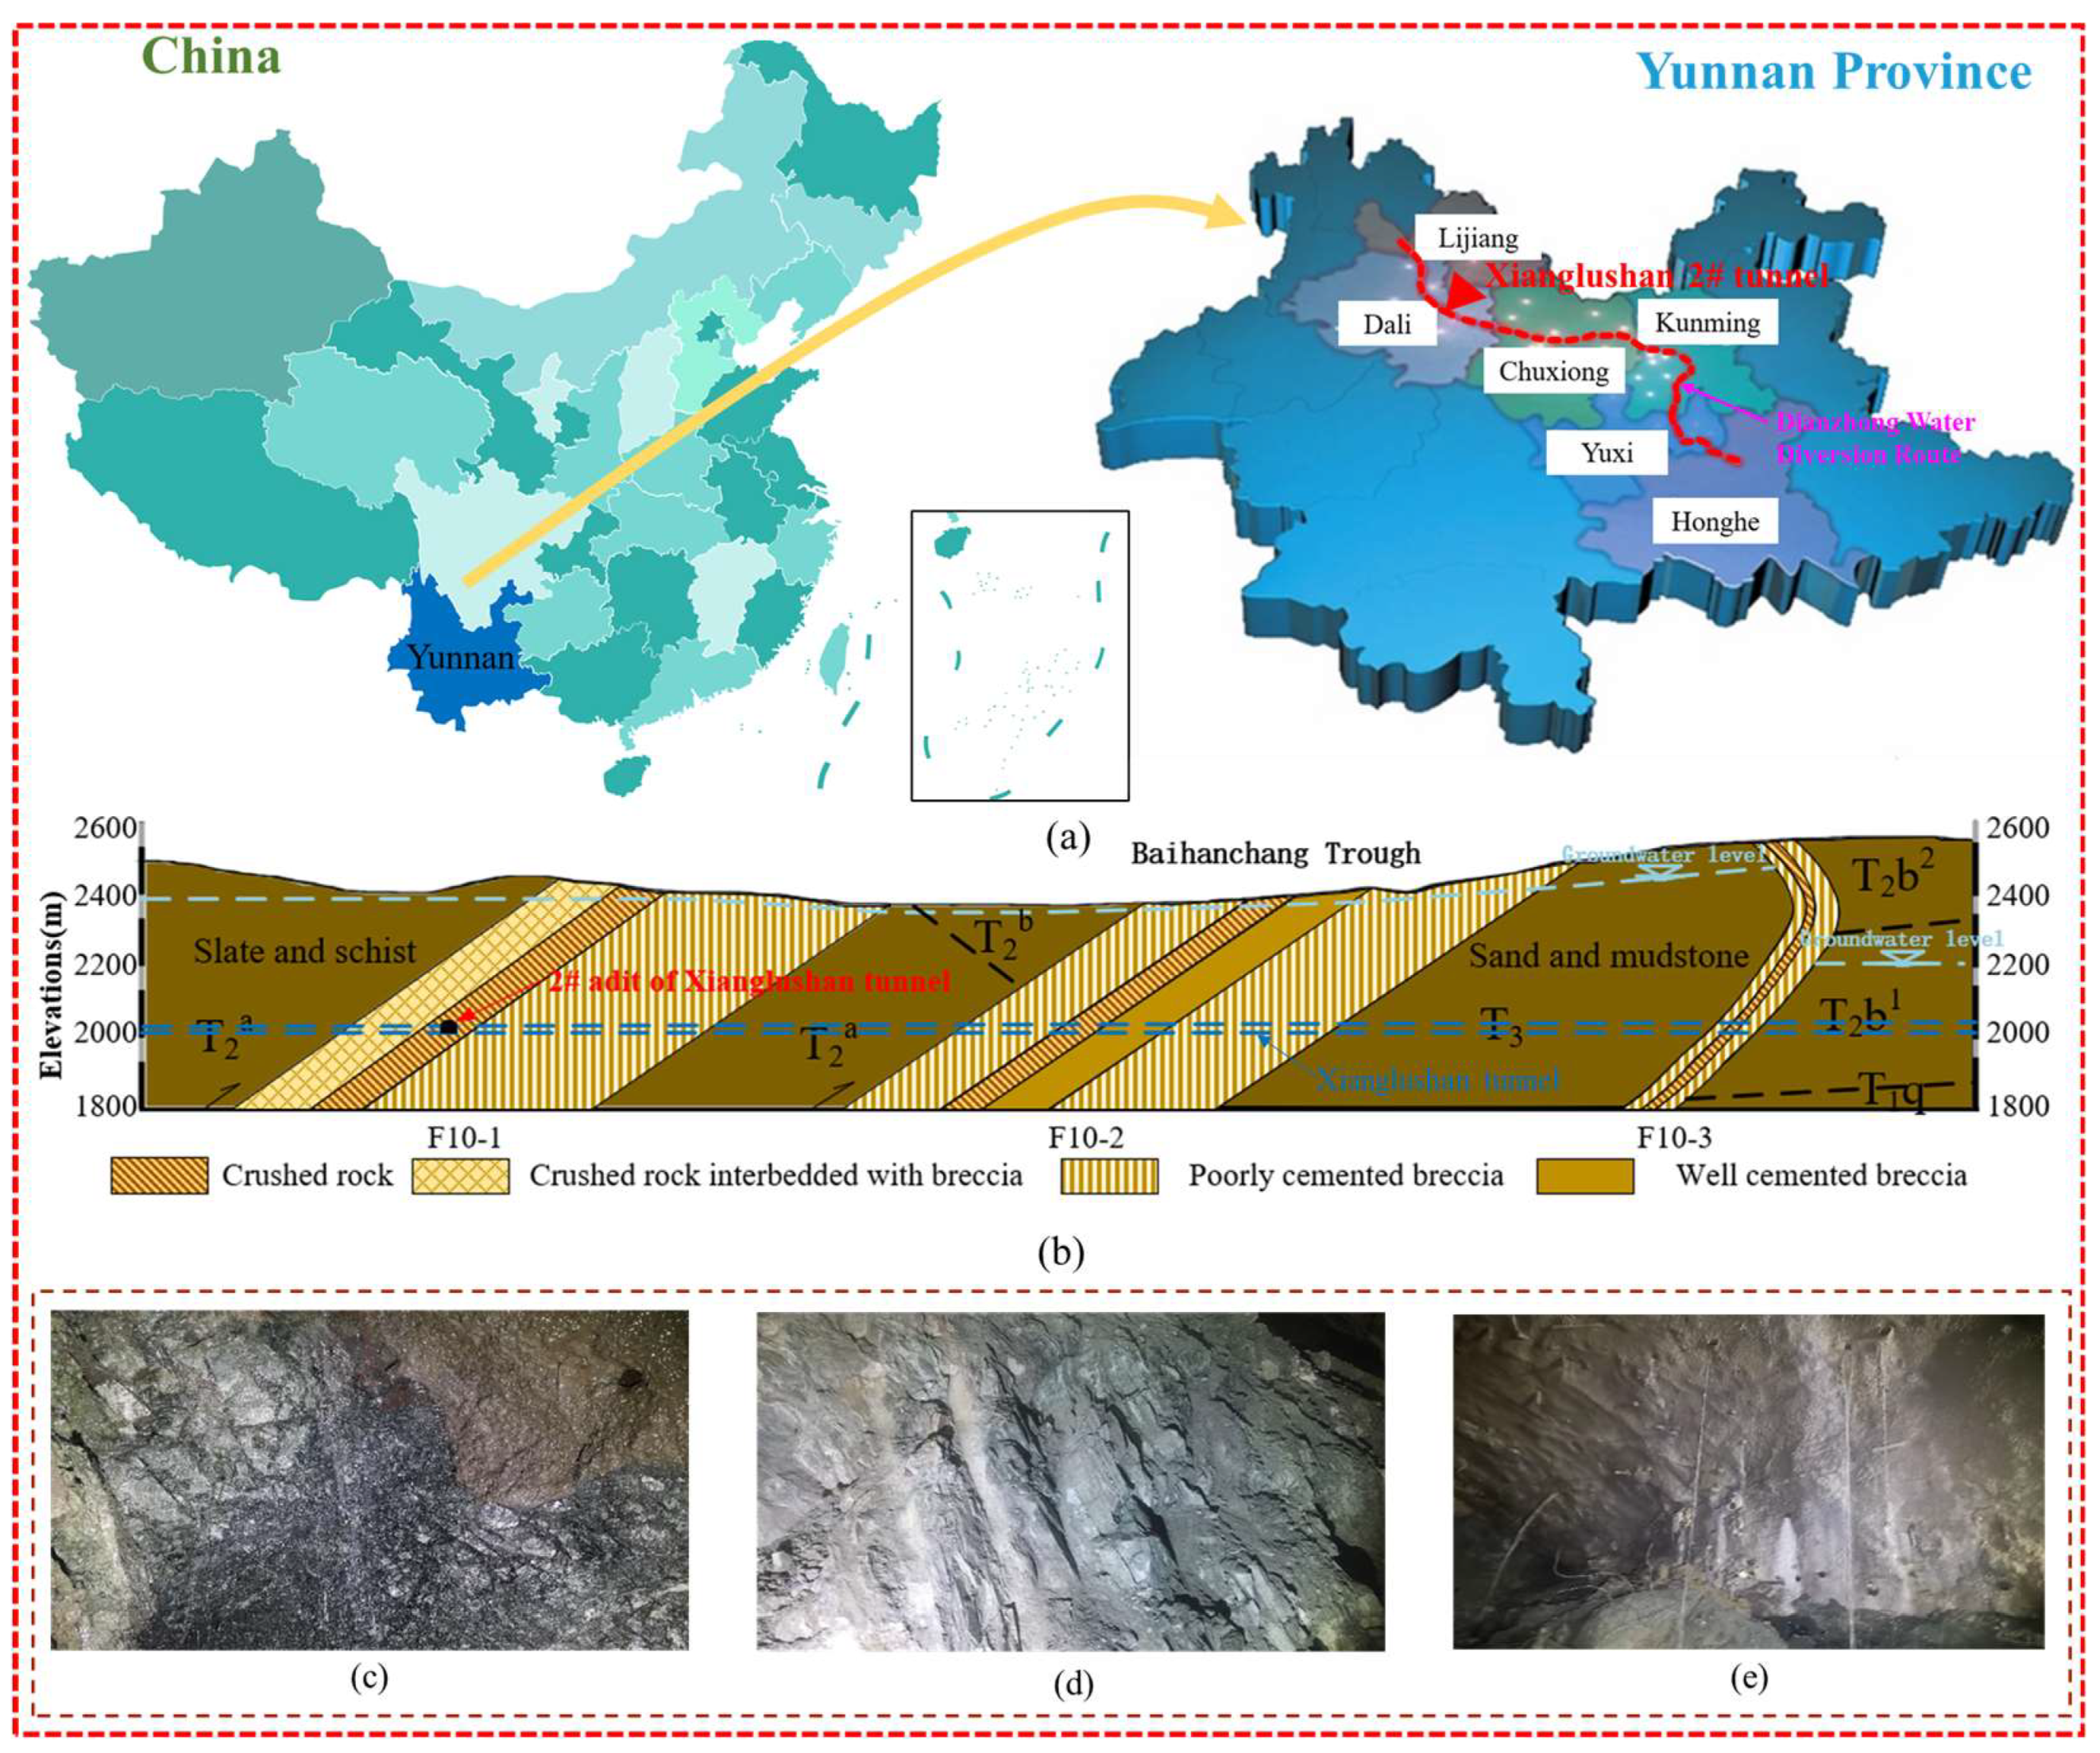
The Xianglushan tunnel is located at the junction of the Hengduan Mountains and the central Yunnan Plateau, and it crosses the watershed of the Jinsha River and the Lancang River, with complex regional tectonic and geological conditions. The location of the Xianglushan tunnel is illustrated in Figure 1a. The total length of the tunnel is 62.60 km, with a depth of 600–900 m and a maximum depth of 1450 m, which is a typical super-long tunnel with a large depth. The rock masses of the Xianglushan tunnel revealed by the excavation are dark grey thinly bedded epidote schist and chlorite schist in the lower part of the Middle Triassic. The tectonic rocks are cataclasite, breccia, granulitic rock, powdery rock, and fault clay. The continued excavation would encounter the cataclasite zone, granulitic rock zone, powdery rock zone, and breccia zone, respectively. There is a risk of water inrush under high groundwater head after the excavation of the relatively poorly water-bearing strata (granulitic rock zone and powdery rock zone), as revealed in Figure 1c–e. The inappropriate treatment of water inrush may drain the groundwater system of the Baihanchang reservoir and even have a greater impact on the Baihanchang reservoir and the const.

Figure 1.
Overview of 2# adit of Xianglushan tunnel: (a) Location of 2# adit of Xianglushan tunnel; (b) Longitudinal geological profile of Xianglushan Tunnel; (c) Surrounding rock with fractured structure; (d) Misalignment situation; (e) Water leakage occurs in the tunnel.
3. DEM-Based Analysis of the Catastrophic Process of Water Inrush at the Face of the Tunnel Adjacent to the Water-Rich Fault
3.1. DEM-Based Numerical Simulation
3DEC 5.20 software is a 3D discrete element programme focusing on discontinuous media, and it provides a powerful support for the in-depth study of deformation damage and movement of rock masses by employing an explicit solution method to compute the discontinuous motions of blocks. The M-C model is used for the calculation of surrounding rock blocks in the model. The joint constitutive model adopts the Mohr Coulomb slip model, which considers the shear failure and tensile failure of joints as well as the shear dilation of joints. The Mohr Coulomb joint slip model is applicable to the contact between rigid blocks and the contact between deformable blocks. The block can be further divided using DNF. Tetrahedral mesh is automatically generated in blocks, and each element mesh responds to a specified linear or nonlinear stress–strain relationship. The average length of the tetrahedral area after meshing was 2 m in this article. In this case, seepage in rock mass was regarded as a hydrodynamic coupling problem, which meant that changes in seepage pressure affected the mechanical deformation. At the same time, the mechanical deformation would in turn affect the seepage pressure. This interrelationship was accurately expressed in the hydrodynamic coupling formulation for discrete fracture networks, especially the effect of mechanical deformation on fracture permeability, which was mainly reflected by the change in fracture openness. The numerical simulation calculation process of tunnel excavation approaching water-rich faults is shown in Figure 2.
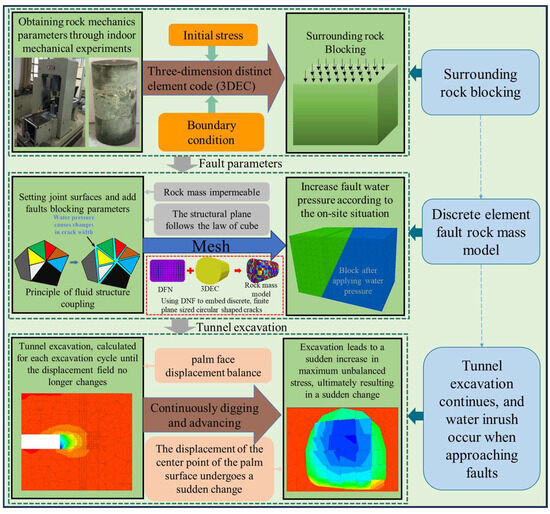
Figure 2.
Numerical simulation calculation process of tunnel excavation approaching water-rich faults.
3.2. Establishment of the DEM-Based Computational Model
The dip angle of the fault in the 2# adit of Xianglushan tunnel of the Central Yunnan Water Diversion Project is 70°. The length, width, and height of the numerical model were 60 m, 40 m, and 40 m, respectively. The tunnel adopted straight-wall and semi-circular-arch cross-sections, with a height of 6 m and a span of 6.5 m. The origin of the model was located at the center of the tunnel cross-section, and the coordinates of the x-axis of the left and right boundaries of the model were −20 m and 40 m, respectively. The fault zone was located at x = 10 m. The tunnel-fault system presented in Figure 3a was simplified and modeled in Figure 3b. After the model was established, the weight of the rock masses above the tunnel was converted into ground stresses according to the tunnel depth, which were then applied to the top boundary of the model. The bottom boundary of the model was fixed, and displacement constraints were applied to the left, right, front, and back boundaries. Constant water pressure was applied directly to the fault fracture zone. The tunnel was excavated from the left side (i.e., at x = −20 m) of the model. The numerical model of the tunnel crossing the water-rich fault zone is displayed in Figure 3.
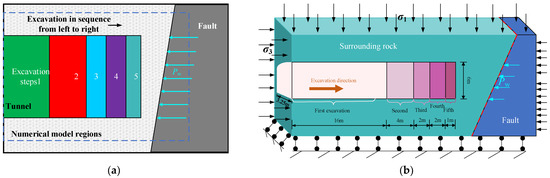
Figure 3.
Tunnel fault system and its simplified numerical calculation model: (a) Tunnel–Fault System; (b) Simplified numerical calculation model.
The mechanical parameters of the rock masses and the mechanical parameters of the joint of the Xianglushan tunnel obtained from the relevant experiments are summarized in Table 1 and Table 2, which were used for model construction. The simulation of tunnel excavation was somewhat simplified. The tunnel was excavated with the full-face excavation method, and the excavation lengths were 16 m (the distance between the tunnel face and the fault was 14 m), 4 m (the distance between the tunnel face and the fault was 10 m), 2 m (the distance between the tunnel face and the fault was 8 m), and 2 m (the distance between the tunnel face and the fault was 6 m), respectively. The excavation length was reduced to 1 m at x = 4 m until the damage of the water-resistant rock mass at the tunnel face occurred, as displayed in Figure 3b. Eight monitoring points were set up at the tunnel face to monitor the displacement and water pressure after each excavation. The excavation simulation ended when the maximum unbalanced stress and the transverse displacement at the center of the face converged, and the model damage was identified by the sudden change in the displacement at the center of the face.

Table 1.
Mechanical parameters of the rock masses of the Xianglushan tunnel.
Table 2.
Mechanical parameters of the joint of the Xianglushan tunnel.
3.3. Catastrophic Law of Water Inrush of the Water-Resistant Rock Mass at the Tunnel Face Induced by Water-Rich Fault
3.3.1. Change Rule of Displacement Field
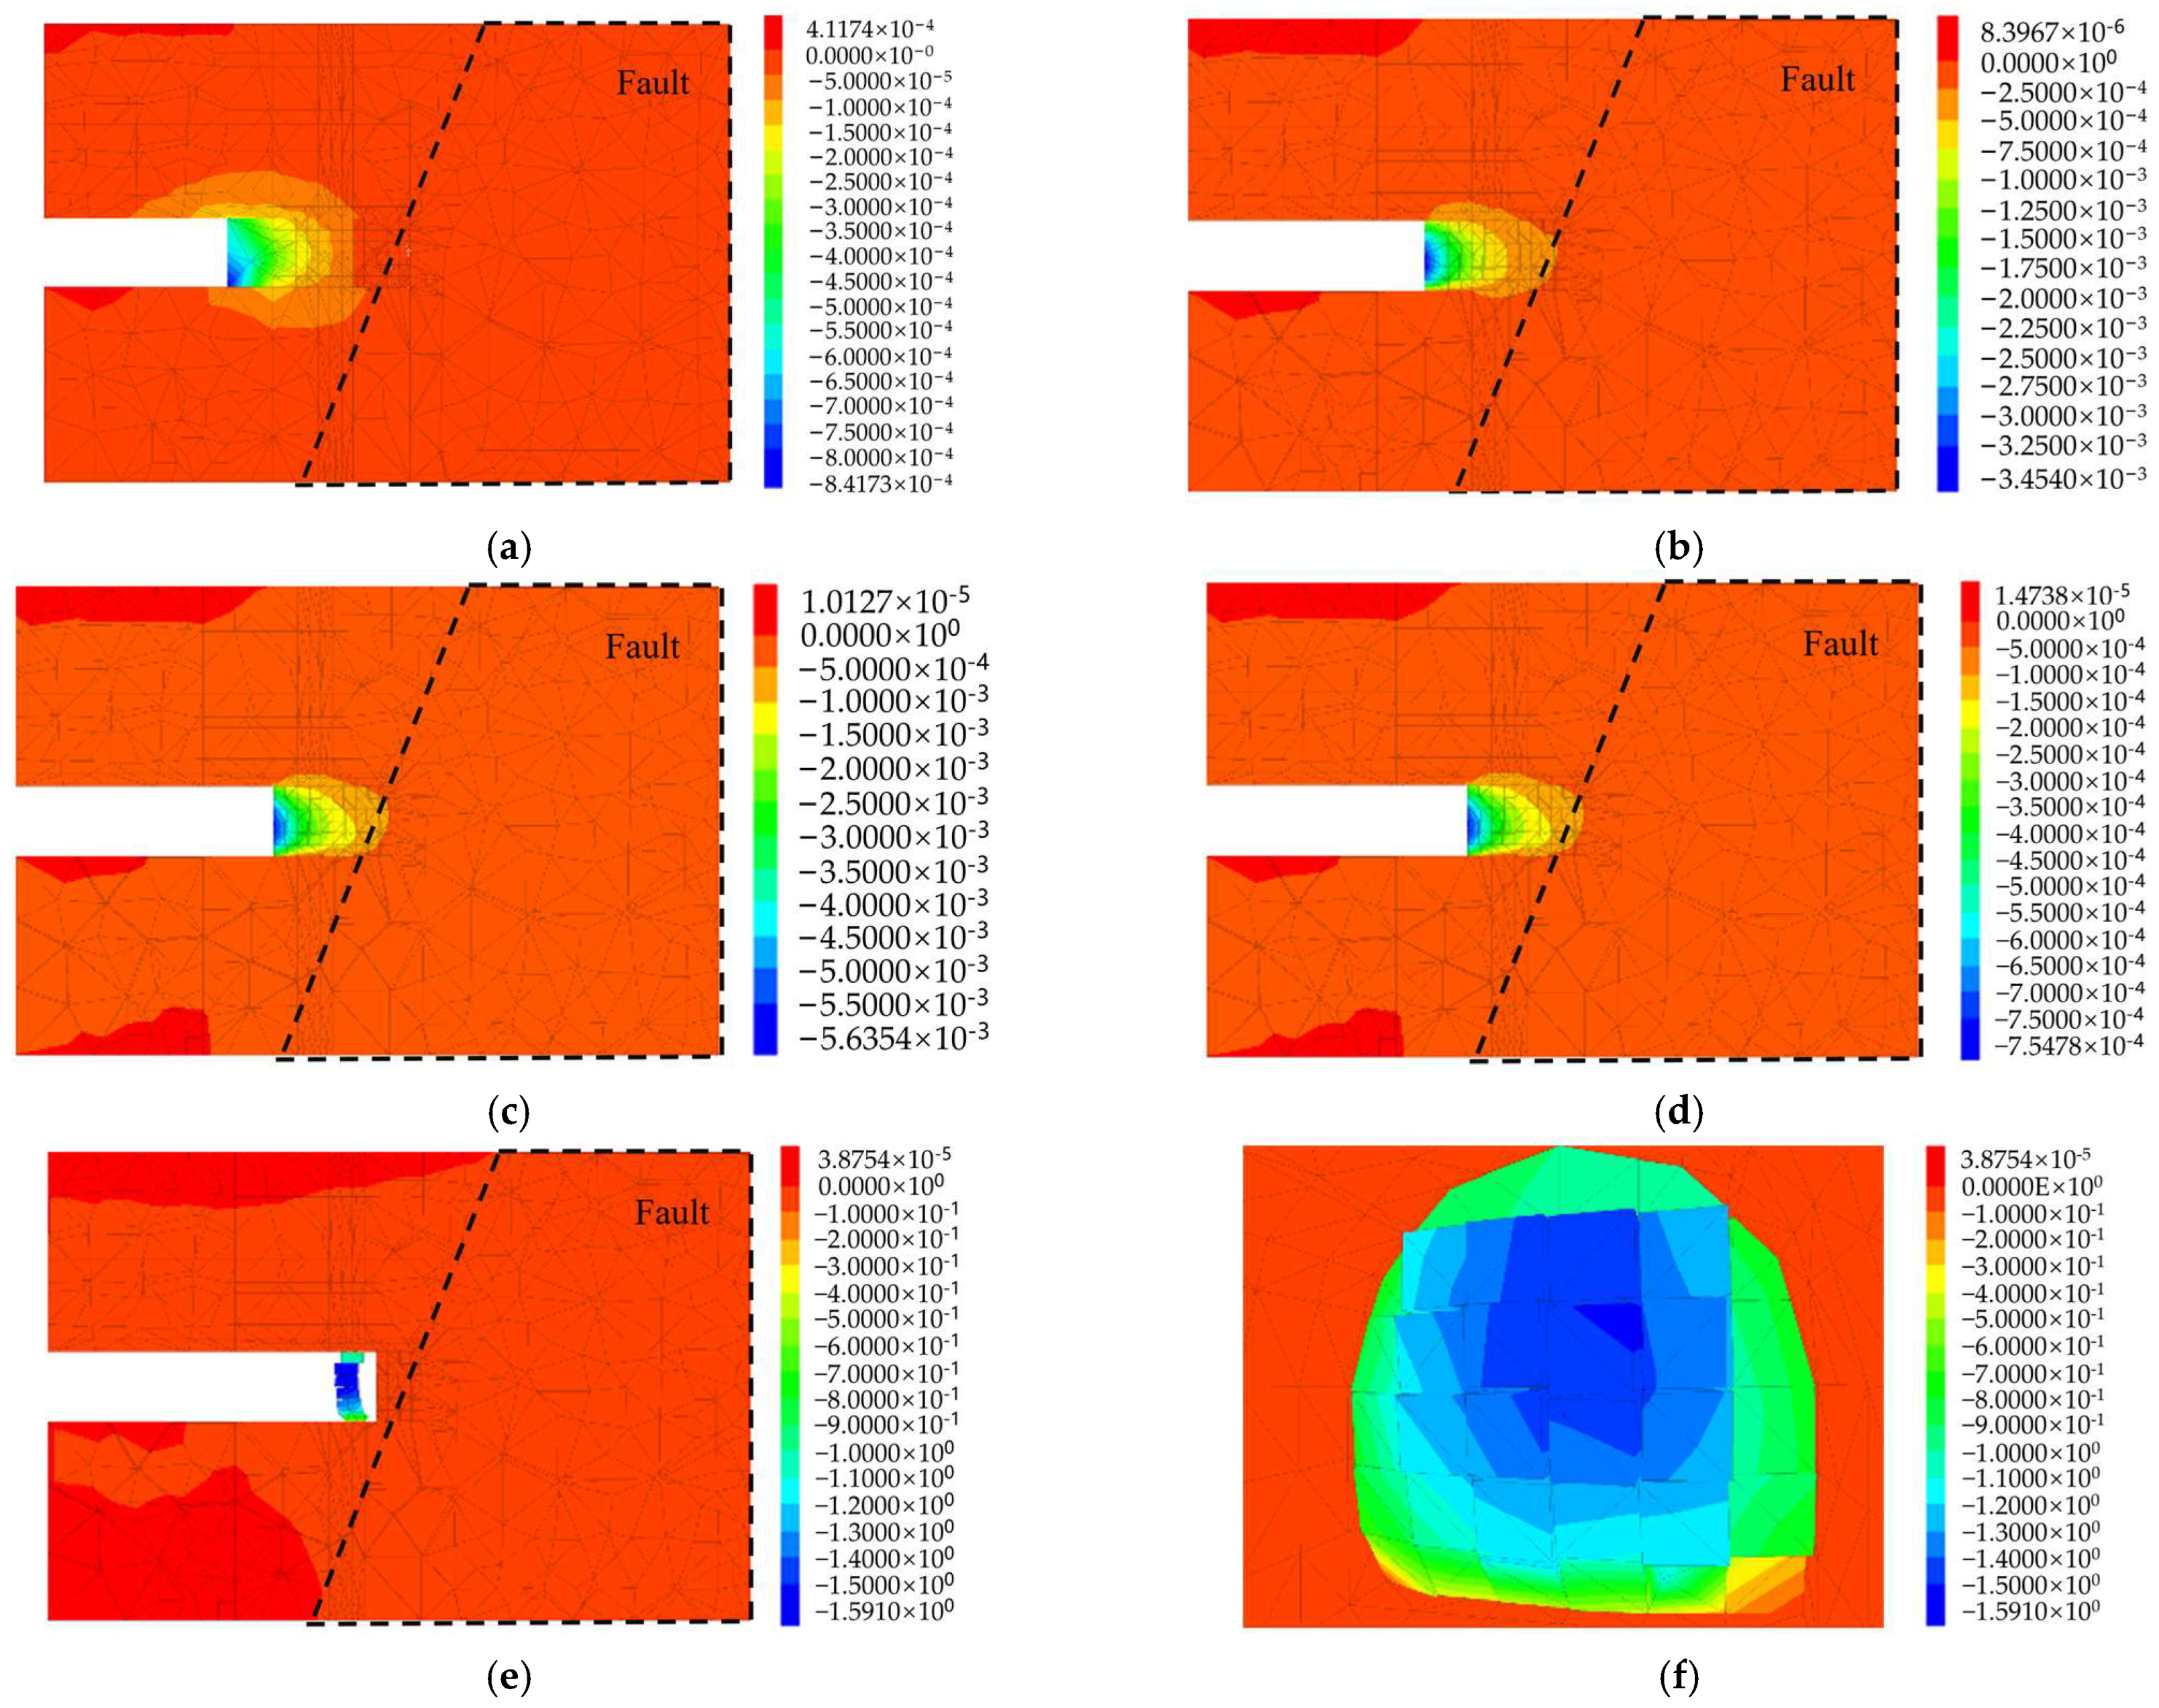
A scenario with a tunnel depth of 400 m, a fault dip angle of 50°, and a water pressure of 2 MPa was selected for analysis. Figure 4 illustrates the process of tunnel face excavation crossing the water-rich fault fracture zone until the occurrence of water inrush damage, where the numbers in different colors indicate the displacements and h is the distance between the tunnel face and the fault. The displacement nephograms in Figure 4 indicated the displacement conditions when the model was in equilibrium after each excavation, and the displacement nephogram after the 5th excavation was the displacement condition when the face was obviously destabilized and damaged. Figure 4a–d confirmed that the maximum transverse extrusion displacements of the water-resistant rock mass at the face after the first, second, third, and fourth excavation steps were 0.84 mm, 3.45 mm, 5.63 mm, and 7.54 mm, respectively, which were increased by 2.61 mm, 2.18 mm, and 1.91 mm, respectively. This indicated that with the tunnel advancing towards the fault, the maximum transverse extrusion displacement of the water-resistant rock mass at the face increased continuously under the joint influence of excavation disturbance and fault water pressure. Meanwhile, after the excavation was completed, the displacement of the lower part of the face on the axial longitudinal section of the tunnel was significantly larger than that of the upper part, indicating that the fault dip angle had a significant influence on the tunnel excavation. Figure 4d–f demonstrated that when the 4th excavation of the tunnel was advanced to x = 4 m, the water inrush damage did not occur yet. When the face was excavated to x = 5 m, the maximum transverse extrusion displacement reached 1.59 m. The water-resistant rock mass could not maintain stability, and its displacement changed abruptly. The fissures inside the rock mass were continuously generated and expanded to form a seepage channel. Finally, the water-resistant rock mass at the face collapsed and damaged under the joint action of excavation and fault water pressure, resulting in a water inrush disaster. Figure 4f revealed that there were obvious displacement changes in the blocks at the face, and it was expected that a large number of blocks would enter the tunnel if the calculation was continued. It was therefore concluded that under this scenario, the minimum safety thickness of the water-resistant rock mass at the face of the tunnel crossing the water-rich fault was about 5–6 m.
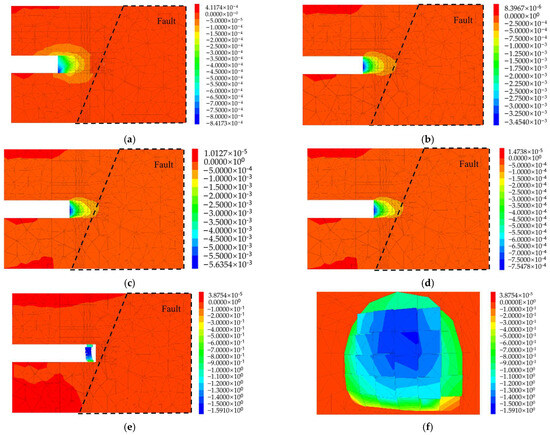
Figure 4.
Evolution process of displacement field (unit: m): (a) First excavation (h = 14 m); (b) Second excavation (h = 10 m); (c) Third excavation (h = 8 m); (d) Fourth excavation (h = 6 m); (e) Fifth excavation (h = 5 m); (f) Local failure at h = 5 m.
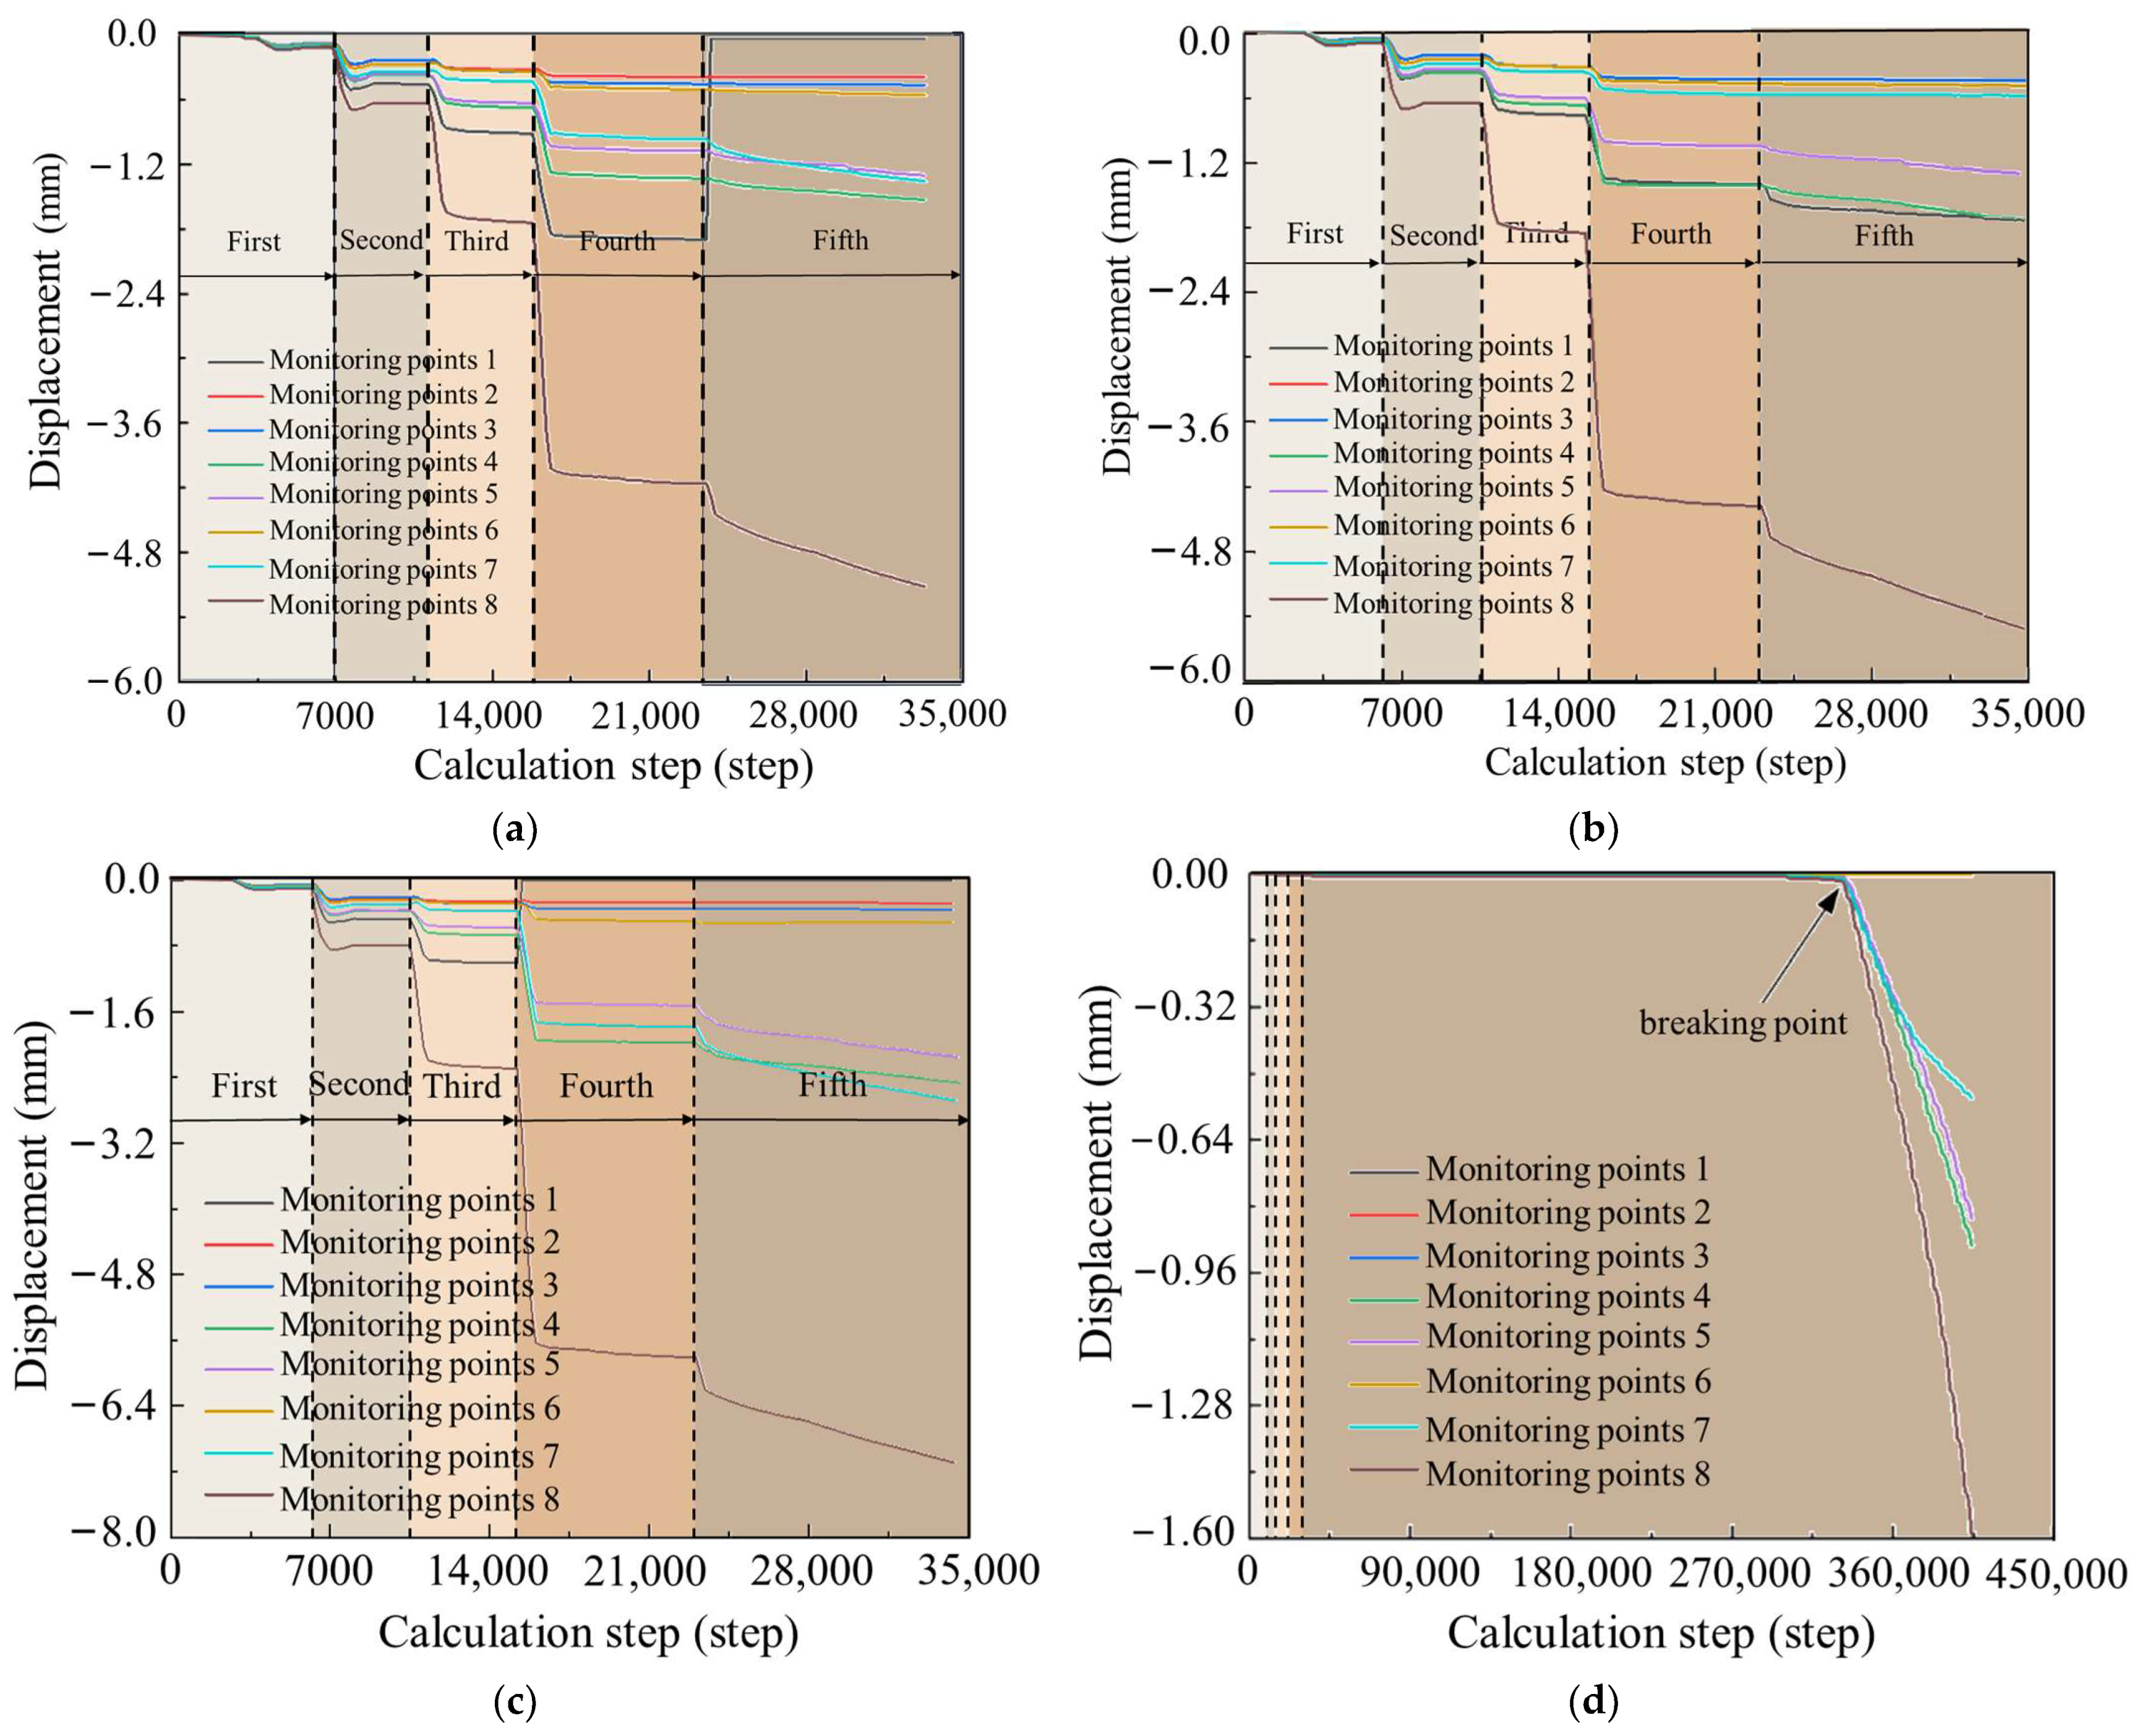
When the tunnel was excavated towards the water-rich fault, three monitoring sections were arranged at 3 m (x = 7 m), 4 m (x = 6 m), and 5 m (x = 5 m) away from the fault in the water-resistant rock mass at the face, and eight monitoring points were set on each monitoring section. The change curves of displacements at monitoring points on each monitoring section are displayed in Figure 5. It should be noted that the number of calculations in the horizontal coordinates in Figure 5a–c is not the final number of calculations corresponding to the damage of the face. The 35,000 calculations were taken to demonstrate the staged development of the displacements at each measuring point with multiple excavations of the tunnel and the variability of the displacement changes at each measuring point, which can be reflected in Figure 5d.
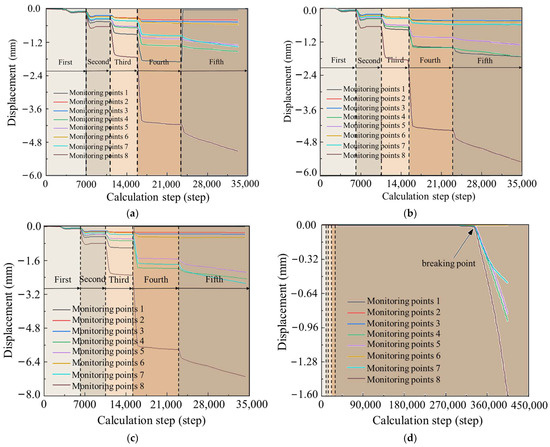
Figure 5.
Monitoring point displacement curve: (a) h = 3 m; (b) h = 4 m; (c) h = 5 m (Before 35,000 steps); (d) h = 5 m.
Figure 5 revealed that as the excavation of the tunnel face advanced, different degrees of displacement response were observed at each monitoring point on different monitoring sections, and the change trends at all monitoring points were basically the same. The change trends of transverse displacement at the same monitoring position on different monitoring sections were identical. As the face gradually approached the water-rich fault, the displacement became larger with increasing growth magnitude. After the completion of the fourth excavation step, the closer the monitoring section was to the face, the greater the transverse displacement was at each monitoring point. On the same monitoring section, the displacement at monitoring point 8 (at the center of the face) was much larger than those at other monitoring points at the edge of the face. It was observed from Figure 5d that after the completion of the fifth excavation step, the displacements at measuring points on the face (monitoring section of x = 5 m) suddenly increased, with obvious face instability and water inrush. It could be considered that the water-resistant rock mass at the face underwent destabilization damage, which was consistent with the interconnected damage of the water-resistant rock mass at the face after the completion of the fifth excavation step in Figure 4.
3.3.2. Change Rule of Seepage Pressure Field
During the excavation of the fault-crossing tunnel, the evolution of the seepage pressure field of the water-resistant rock mass at the face is displayed in Figure 6. Figure 6a demonstrated that after the completion of the second excavation step, the fault water entered the fissure connecting the water-resistant rock mass and the fault fracture zone, but the seepage effect of the face was not obvious at this time. It could be observed from Figure 6b,c that the seepage effect was increasingly obvious, and the closer the face to the fault, the faster the water pressure increased. Figure 6d confirmed that after the completion of the fifth excavation step, the water-resistant rock mass at the face was destabilized and damaged under the seepage. For each excavation of the tunnel, eight monitoring points were set up on the excavation surface to monitor the change in water pressure. Since the displacement response at the center of the face was more pronounced than that at the edges during the excavation, the change in water pressure at the center of the face was analyzed. The change curves of water pressured at measuring points (6,0,0), (7,0,0), and (8,0,0) are displayed in Figure 7.
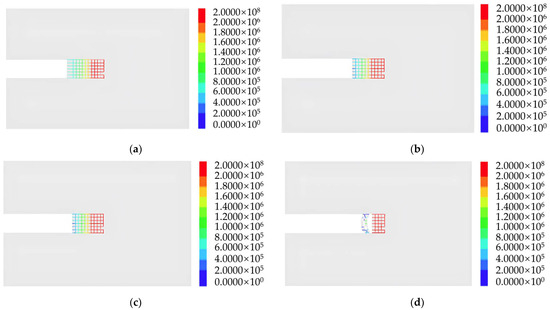
Figure 6.
Evolution law of seepage field (unit: Pa): (a) Second excavation (h = 10 m); (b) Third excavation (h = 8 m); (c) Fourth excavation (h = 6 m); (d) Fifth excavation (h = 5 m).
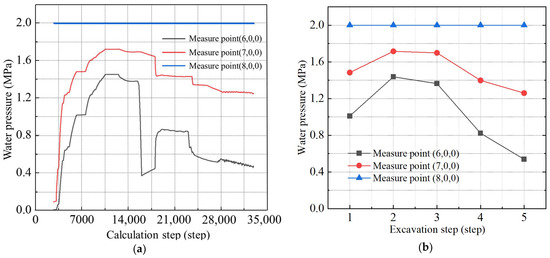
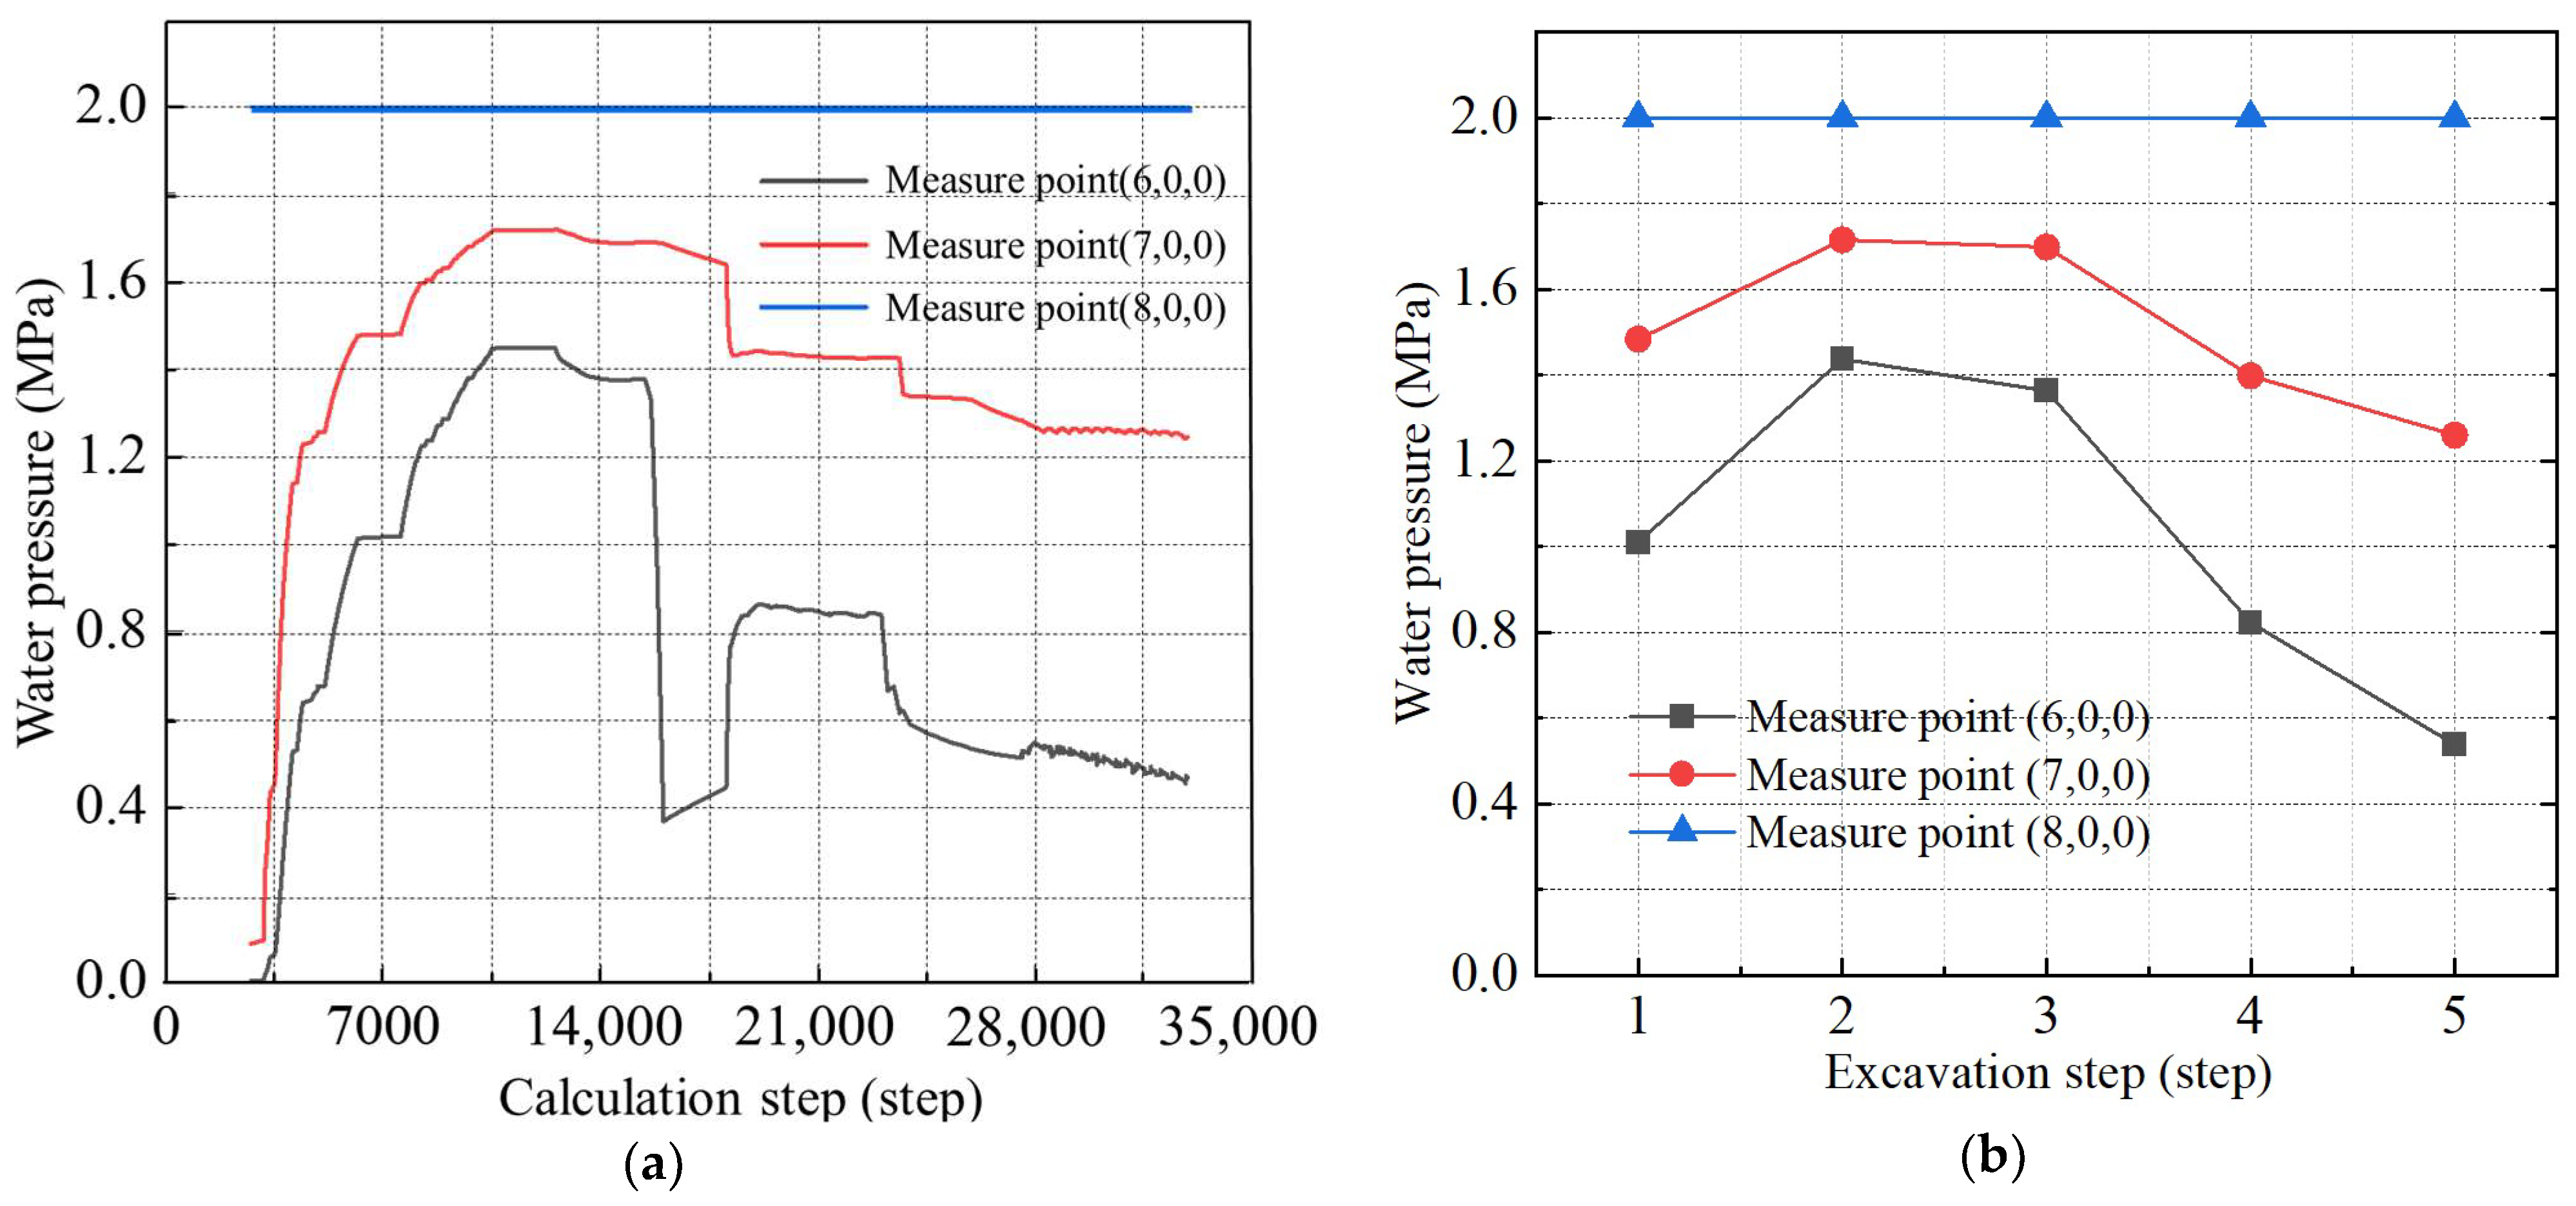
Figure 7.
Water pressure change curve: (a) Water pressure variation curve with calculation step; (b) Water pressure variation curve with excavation step.
Figure 7 showed that the water pressure of the fault at measuring point (8,0,0) was constant at 2 MPa. With the continuous excavation of the tunnel, the water pressures at measuring points (6,0,0) and (7,0,0) followed the same trend before the damage of the water-resistant rock mass. As the face gradually approached the fault, the water in the fault continuously entered the fissure, resulting in the rising water pressure. When the water-resistant rock mass at the face of the tunnel was damaged, the fissure was connected to the face, which led to the water flowing out from the face and the sudden decrease in fissure water pressure. The water-resistant rock mass underwent a large deformation under the joint action of disturbance stress and water pressure, and the blocks in the model were squeezed or separated from each other, resulting in a sharp change in the fissure width.
The variation in water pressure at each measuring point indicated that water in the fault flowed into the fissure at the early stage of tunnel excavation, and water pressure in the fissures increased continuously. Once the excavation face intersected the pre-established fissures, the water in the fissures flowed out from the face under the influence of the excavation disturbance, and the water pressure decreased. Then, the water pressure continued to rise under the recharge of fault water. When water inrush damage of the water-resistant rock mass occurred, the water pressure at each measuring point near the damage area increased sharply.
4. Prevention and Control Measures for Water Inrush at the Face of the Tunnel Adjacent to the Water-Rich Fault and Its Effectiveness
Relevant countermeasures should be implemented to prevent the water inrush disasters of tunnels adjacent to fault fracture zones. Based on the engineering practice, the grouting reinforcement measure of water inrush and mud outburst in the 2# adit of Xianglushan tunnel was investigated, and the prevention and control effect was evaluated.
4.1. Prevention and Control Measures of Water Inrush in the 2# Adit of Xianglushan Tunnel
The stability of the rock mass in the water-rich fault fracture zone of the Xianglushan tunnel is poor, and the stored water has good mobility, so it is necessary to undertake advanced pre-support measures. The method of permeation grouting is proposed to strengthen the surrounding rock of the 2# adit of Xianglushan tunnel. For permeation grouting, the slurry forms a slurry–soil grouted rock body with the stratum through drainage, densification, and formation of a skeleton to improve the stratum strength, water stability, and seepage resistance. The slurry can effectively fill the cracks in the surrounding rock, thereby blocking the underground water seepage channel. Therefore, rock mass grouting is effective in preventing the water inrush disasters of the tunnel adjacent to the water-rich fault. The mechanism of grouting reinforcement is illustrated in Figure 8.
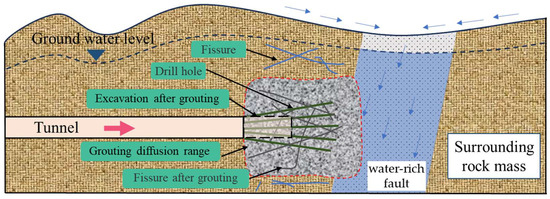
Figure 8.
Mechanism of grouting reinforcement.
To ensure the feasibility and reliability of the grouting scheme, numerical simulation experiments of the excavation of the tunnel adjacent to the fault after grouting reinforcement were performed. After the completion of the fifth excavation step of the face (x = 5 m), the displacements before and after grouting are displayed in Figure 9 When the fifth excavation step of the face with grouting was completed (x = 5 m), the maximum displacement after grouting was only 10.09 mm, as indicated in Figure 9b. In this case, no water inrush damage occurred. In contrast, when the fifth excavation step of the face without grouting was completed (x = 5 m), water inrush damage occurred, as presented in Figure 9a. The results confirmed that the grouting reinforcement was effective and the prevention and control measure was feasible.
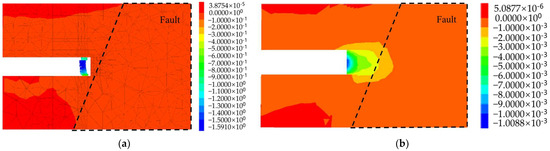
Figure 9.
Displacement field for excavation to step 5 before and after grouting (unit: m): (a) Displacement field for excavation to step 5 before grouting (h = 5 m); (b) Displacement field for excavation to step 5 after grouting (h = 5 m).
4.2. Grouting Scheme for 2# Adit of Xianglushan Tunnel
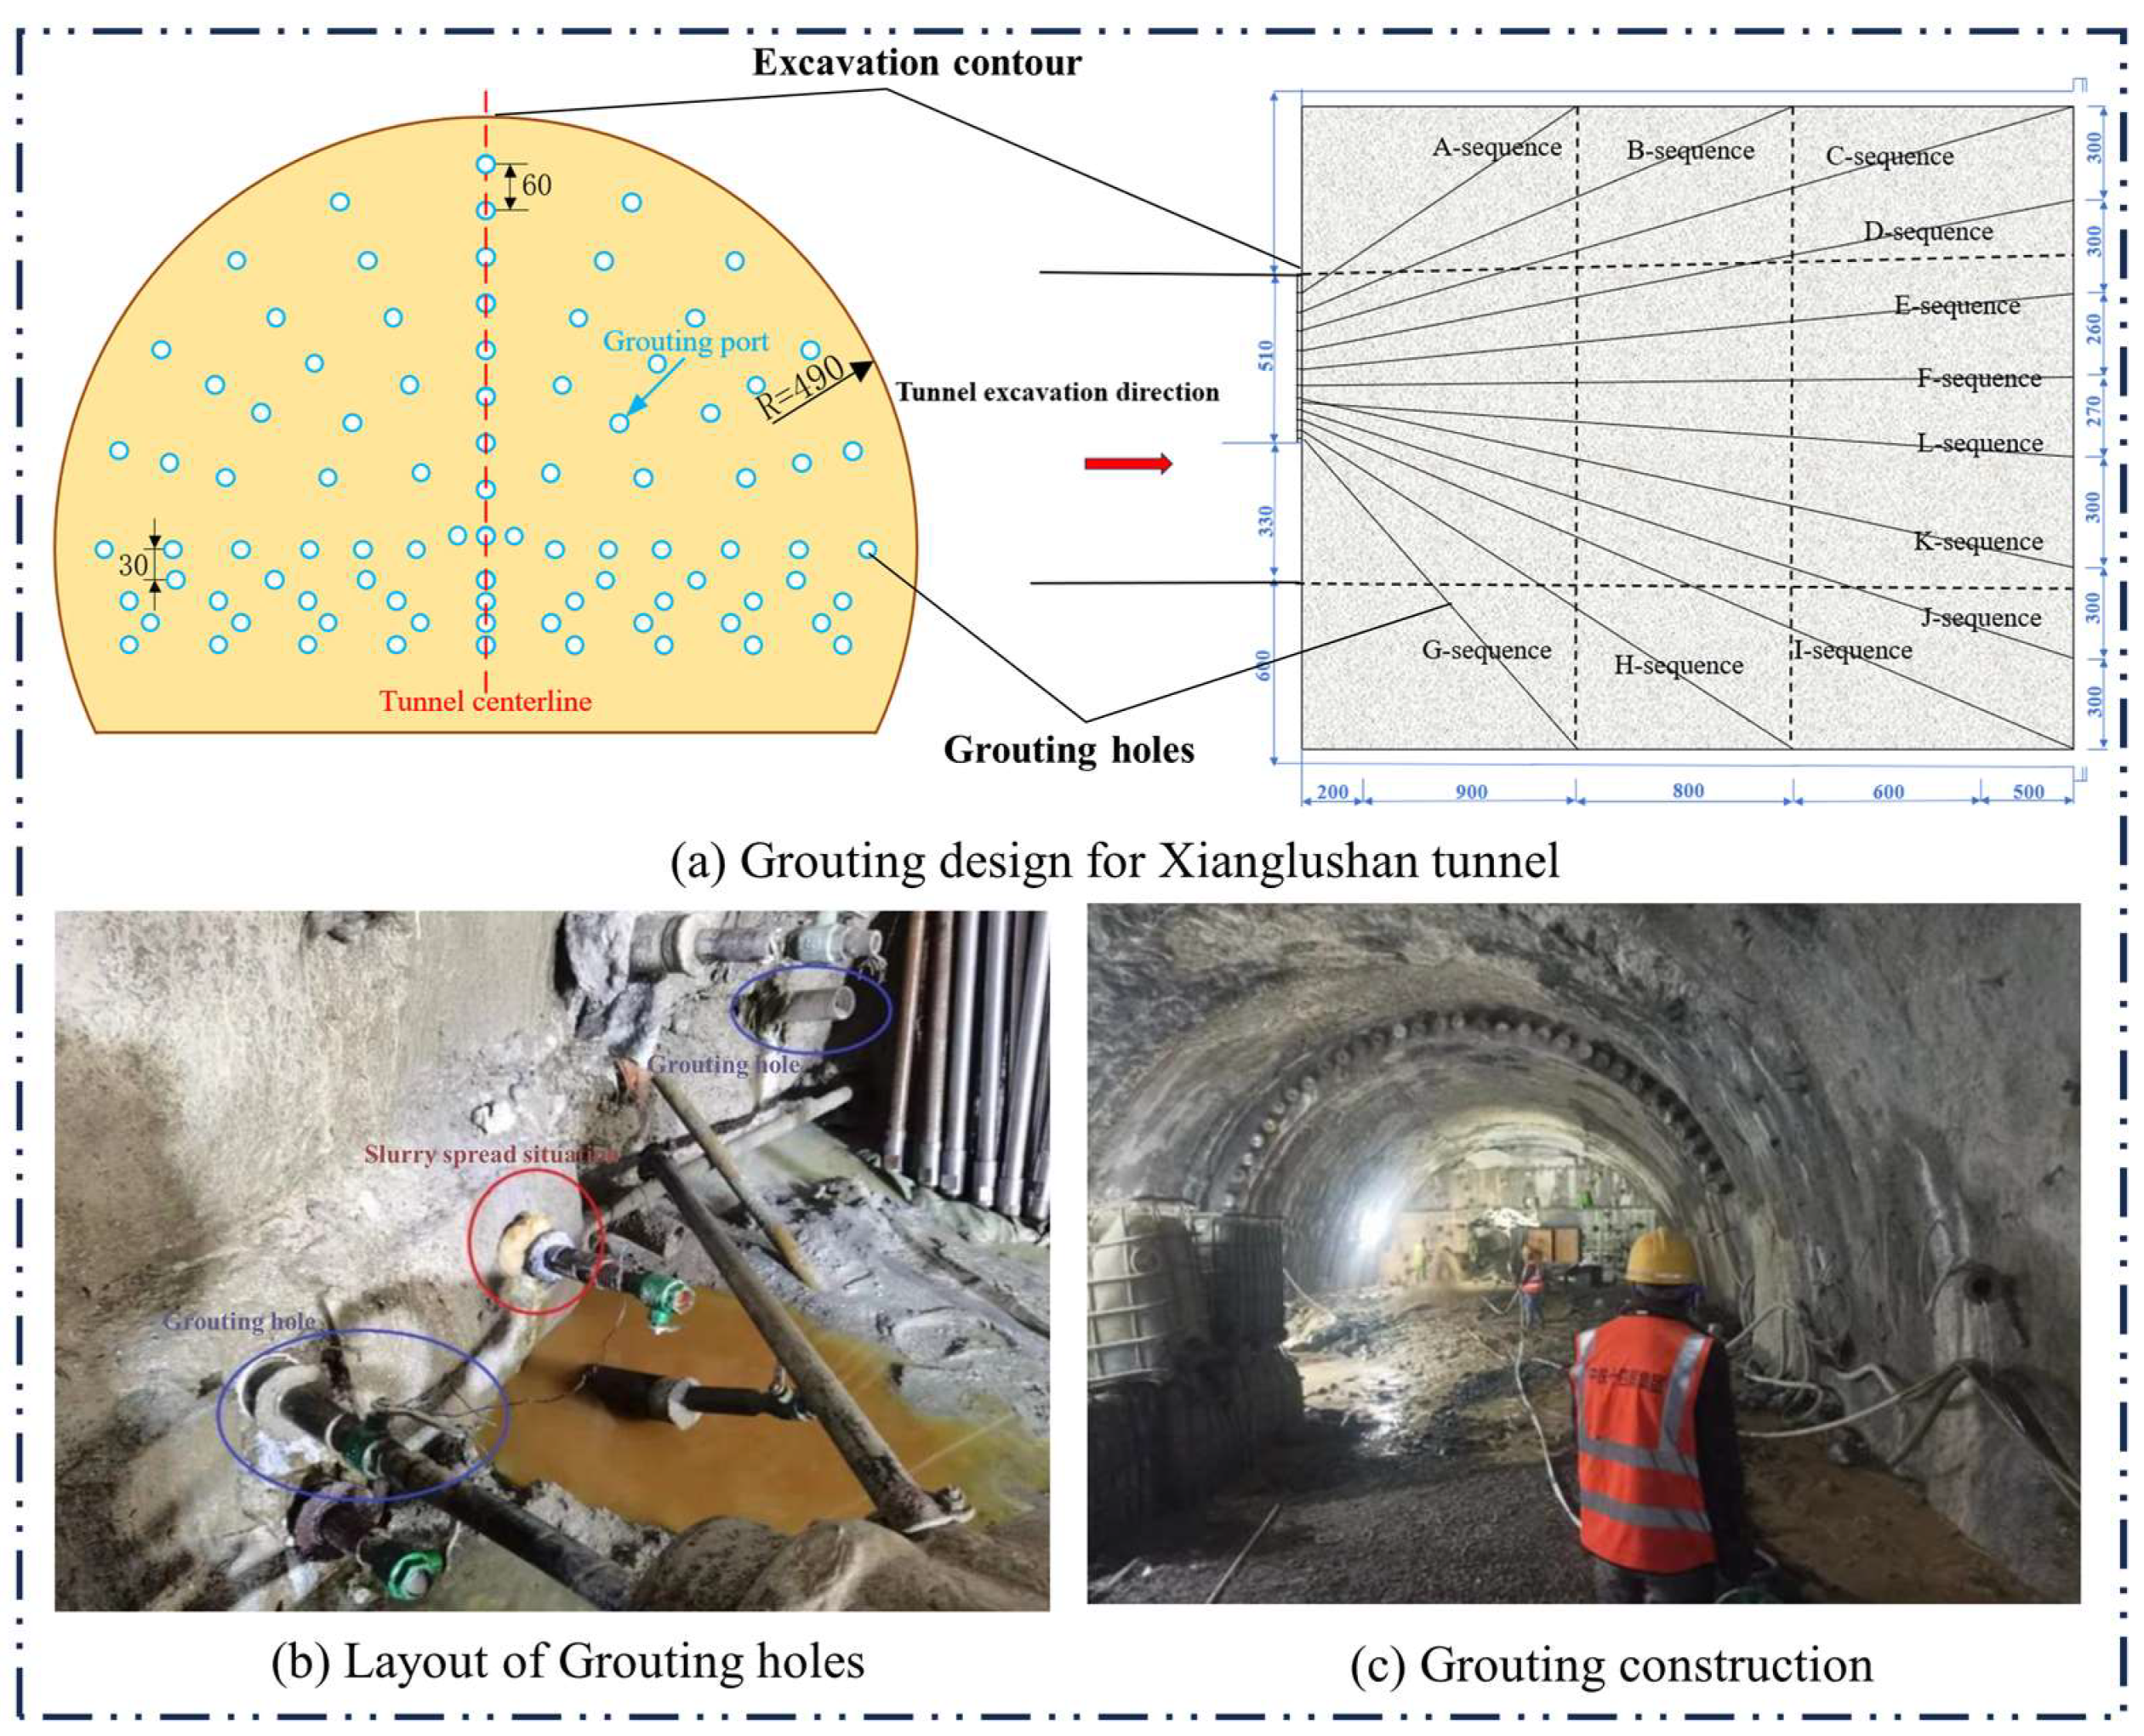
The middle bench of the 2# adit of Xianglushan tunnel was first excavated and supported at the face, and a C20 grouting wall with a thickness of 2.0 m was applied to the face. The range of the grouting reinforcement circle was 6 m outside the excavation profile, and the length of cyclic grouting was 30 m. The length of cyclic excavation was 25 m, and a 5 m long grouting rock disc was retained in each cycle. The layout of grouting holes is illustrated in Figure 9a. The grouting holes were arranged in the excavation direction from the face with a form of umbrella radiation. The radius of slurry diffusion was 2 m, and the distance between the bottom of the holes was not more than 3 m. The sequence of drilling and grouting followed the principle of “from the outside to the inside, from the bottom to the top, and jumping the holes at intervals” to achieve contour-controlled grouting and compacted reinforcement. The drilled and finished hole conditions suggested that the forward-type or backward-type segmental grouting method could be utilized. Grouting slurry was cement slurry with a water–cement mass ratio (W/C ratio) of 0.5–1:1. The design grouting pressure (final pressure value) was 4.5–6 MPa or the hydrostatic pressure at the grouting place plus 2 MPa. The grouting site and the diffusion of grouting holes are presented in Figure 10b,c.
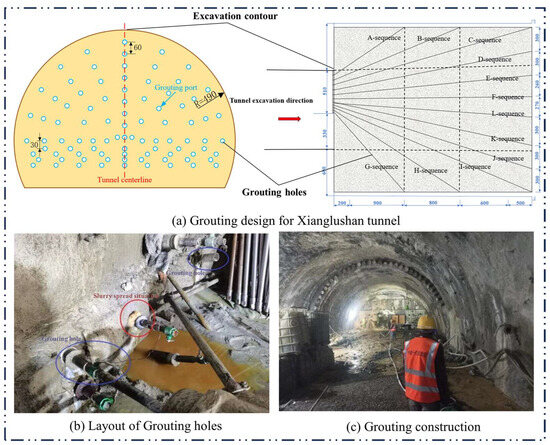
Figure 10.
Grouting hole arrangement and grouting site.
4.3. Effectiveness Analysis of Grouting Treatment
An evaluation of the grouting effect is an important part of the grouting reinforcement technique. The drilling acoustic wave, borehole TV, geological radar exploration, convergence monitoring, and numerical simulation were adopted to comprehensively examine the grouting effect and to accurately understand the actual situation of the grouting effect so as to ensure the reliability of the grouting effect and to prevent the recurrence of water inrush disasters due to insufficient grouting reinforcement.
As depicted in Figure 11, the average values of wave velocity after grouting reinforcement were larger, which identified an excellent grouting effect. Meanwhile, the borehole TV was used for videotaping rock masses in the inspection holes to visually assess the integrity of the strata, the cementation of the grouting reinforced rock bodies, and the location of the water inrush. The results of the borehole TV showed that the integrity of grouting reinforced rock bodies improved significantly and that the rock mass had the self-stabilization ability. No collapsed holes were observed, and the grouting reinforcement effect of the rock mass was remarkable. Portable geological radar was employed to detect the grouted rock mass and to identify the weak areas of grouting. The elliptical circled area was the water-bearing zone. The rectangular area was the artificial interpretation zone, whose signals were abnormal, and the information of this area was ignored for interpretation. The reflected wave groups in the radar images before grouting were few and horizontally distributed, while those after grouting were more energetic and exhibited a chaotic pattern with no regularity in the vertical and horizontal directions. This phenomenon demonstrated the change in the structure of the soil layer after grouting, which led to the destruction of the original soil layer after the slurry penetrated the soil layer. Horizontally and vertically distributed grouting areas or the staggered distribution of ungrouted areas formed a reflective surface between grouted and ungrouted areas. Due to the unevenness of this distribution, the above phenomenon reflected by radar images demonstrated the reinforcement effectiveness of the grouting. A convergence monitoring deformation analysis was carried out on section DLIBK0+840 of the tunnel. Since the upper bench was under excavation when the monitoring was conducted, the convergence monitoring points were arranged in the upper bench. Monitoring points A, B, and C were placed in the vault, left abutment, and right abutment, respectively. The convergence deformation of tunnel rock mass after grouting was controlled within 8.00 mm, which could ensure the safe construction of the tunnel.
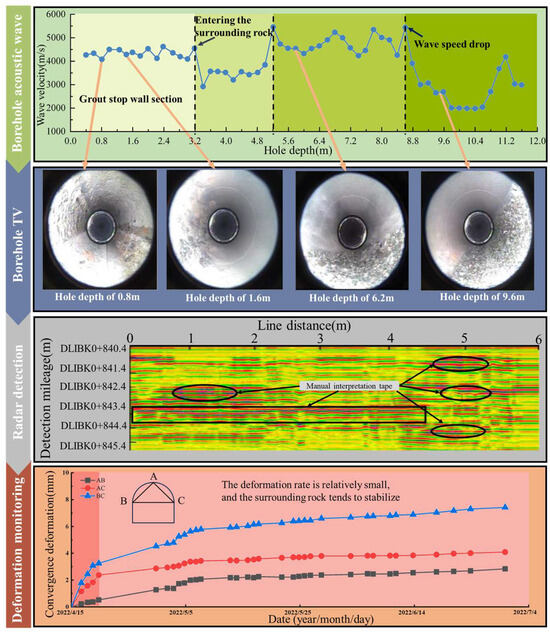
Figure 11.
Results of borehole acoustic, borehole TV, geo-radar detection, convergence monitoring.
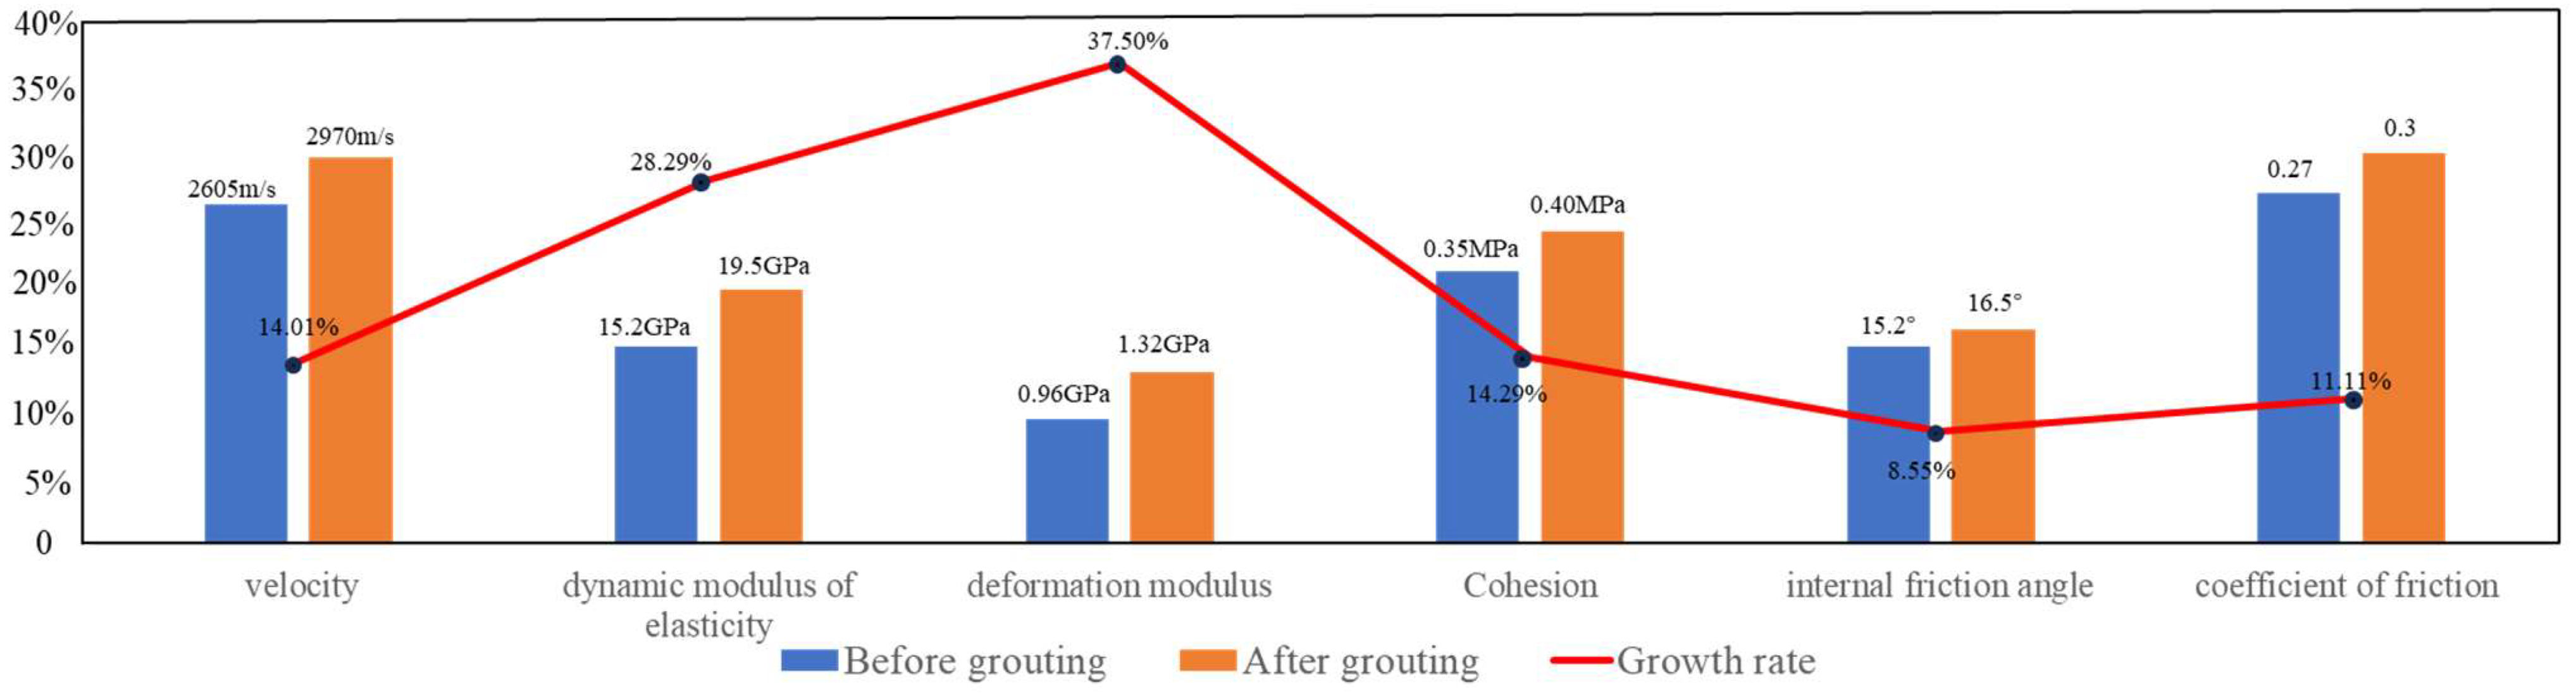
According to the laboratory mechanical test results of the core samples from the inspection holes, the comparison of the mechanical properties of the rock mass before and after the grouting of the 2# adit of Xianglushan tunnel was presented in Figure 12. The deformation modulus of the rock mass after grouting was increased by 37–53%. The rock mass possessed better elastic deformation capacity to external loads, which slowed down the deformation process of the rock mass. The shear strength parameters (cohesion c and friction coefficient tanφ) were increased by 10–14%, which enhanced the overall adhesion and improved the shear and sliding resistance of the rock mass.
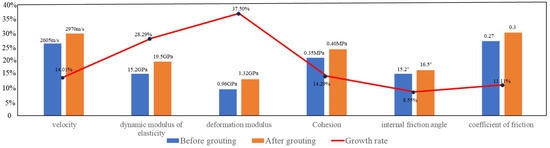
Figure 12.
Comparison of mechanical parameters of surrounding rock in the grouting section before and after grouting.
The analysis on the comprehensive geological investigation and evolution of the water inrush of the water-resistant rock mass at the face showed that the rock mass reinforced by the proposed grouting scheme experienced less deformation and had a high self-stabilization capacity.
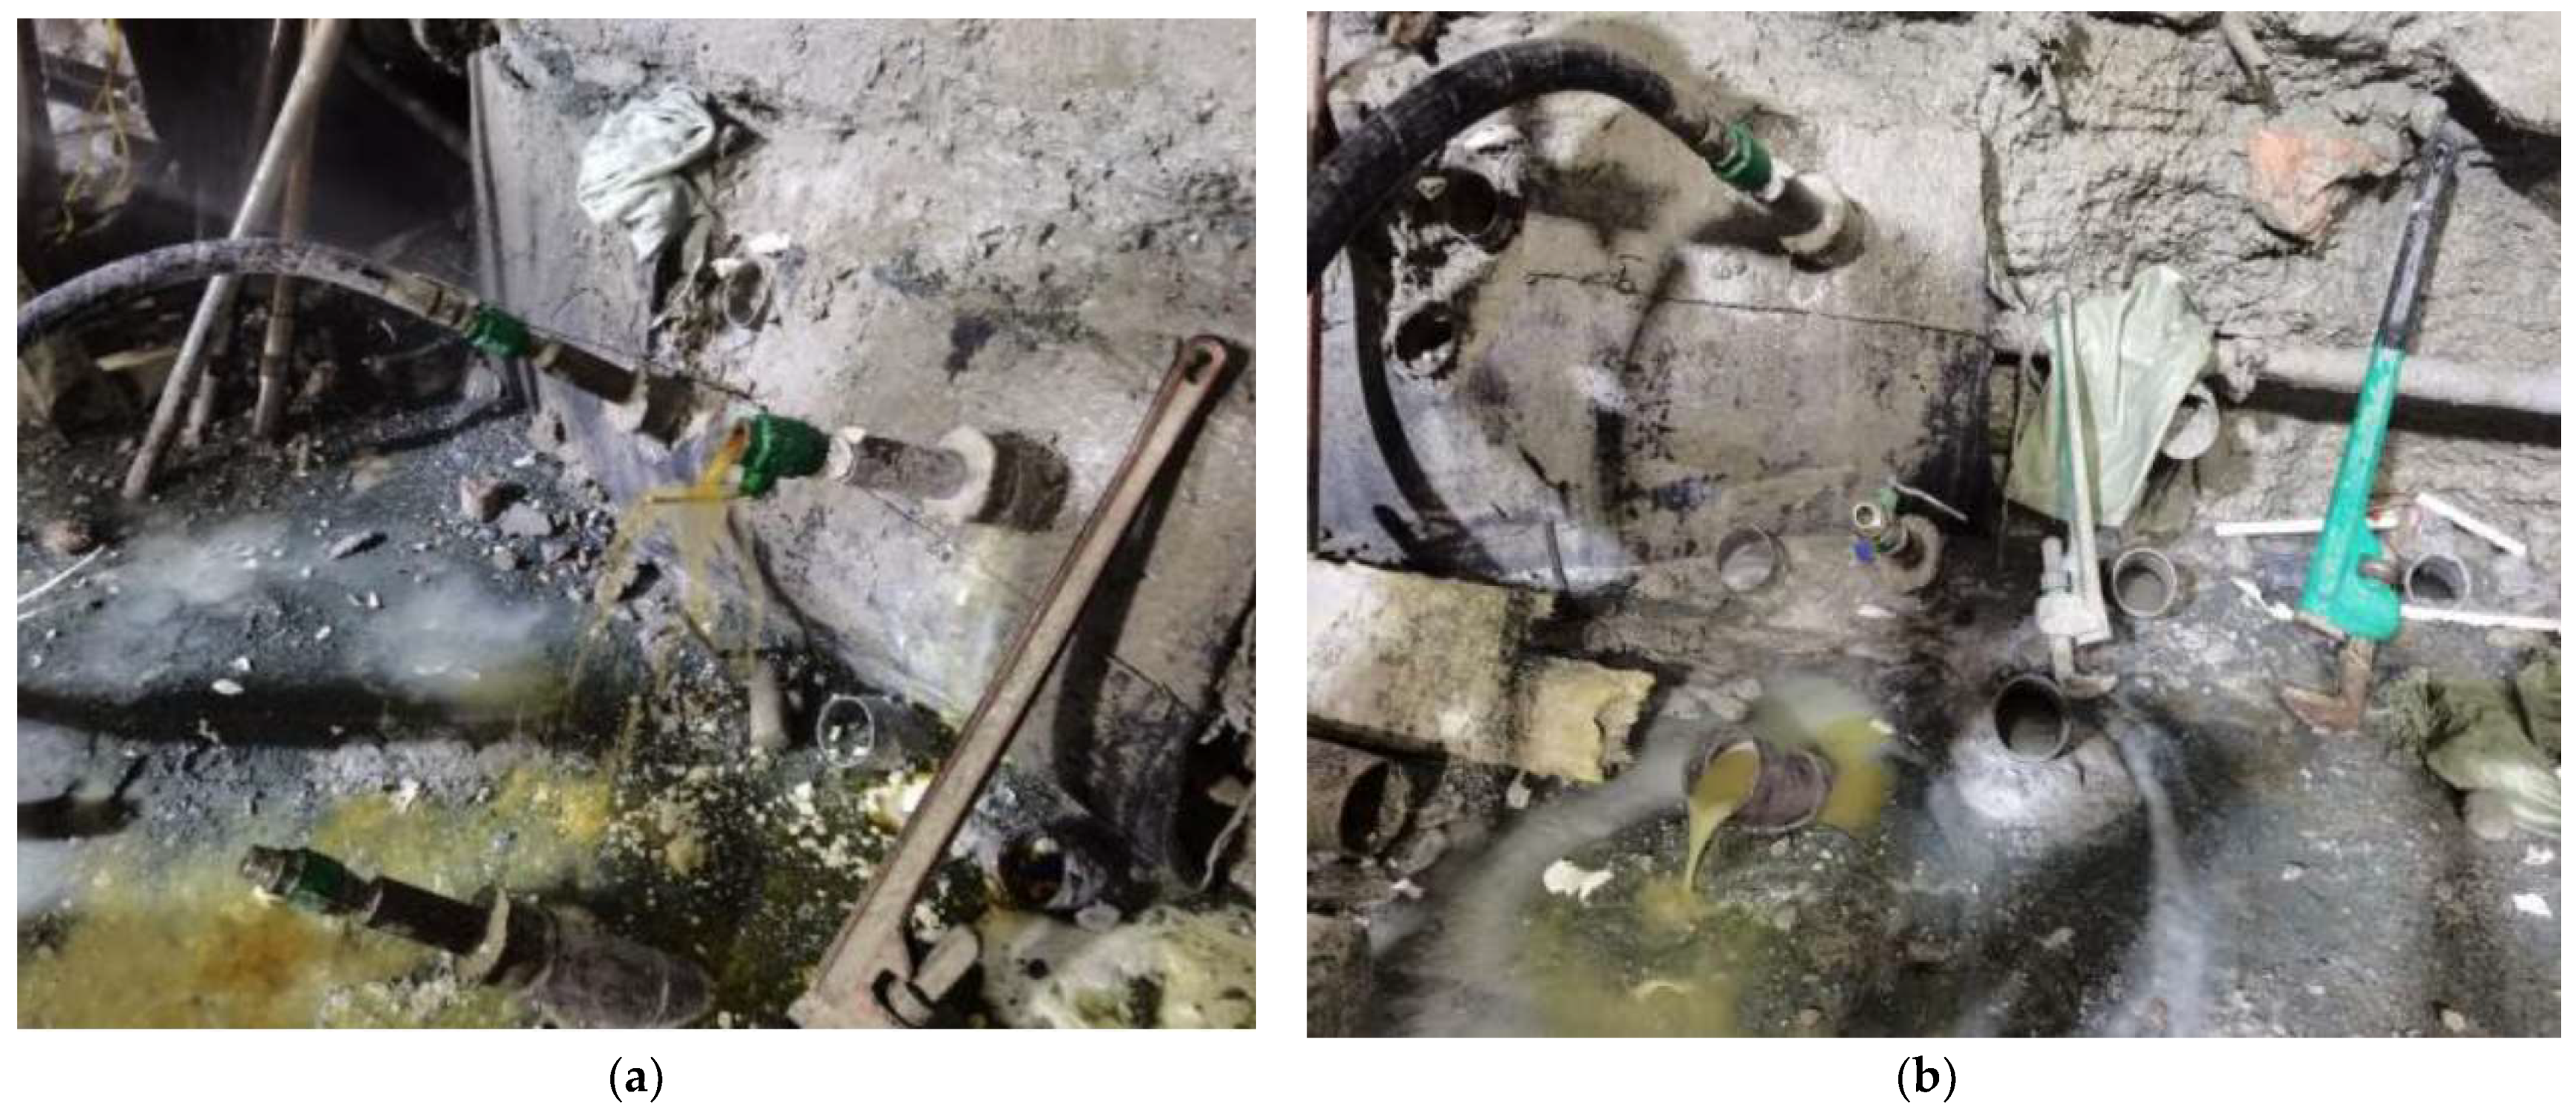
The water discharge situation of inspection hole and coring result are shown in the Figure 13. The slurry was well filled, with good densification, no obvious fractures were found, and the slurry had a high coagulation strength with the rubble mass. After grouting, the construction unit conducted a water pressure test on the inspection hole, and the depth of the inspection hole is generally slightly less than 10m, located within the range of the grouting reinforcement circle. The decreasing permeability of inspection holes is shown in Table 3. The average permeability of the inspection holes after grouting was 3.32 Lu, compared with the average permeability of 4.39 Lu before grouting, the permeability was reduced by 24%, which indicated that the rock mass was reinforced to some extent after grouting. The inspection hole on the right side of the tunnel face changed from flowing water to dripping water after grouting, and there was no water gushing in the later stage. Multiple boreholes are drilled in the lower left corner of the tunnel face, and the water gushing significantly decreases or stops after the diffusion of slurry.

Figure 13.
Water gushing situation of inspection hole: (a) Inspection hole of CGJ10-32; (b) Inspection hole of CGJ11-32.
Table 3.
Decreasing permeability of inspection holes.
The grouting technique achieved the dual effects of reinforcement and water plugging, and it effectively prevented and controlled the water inrush disasters in the tunnel adjacent to the fault.
5. Discussion
5.1. The Spatial Effect of the Tunnel Approaching Water-Rich Fault
Compared with ordinary engineering geological conditions, the disasters caused by the water-rich fault in tunnels exhibit regular spatial characteristics [25]. According to the numerical simulation results of the Xianglushan tunnel adjacent to the water-rich fault, it can be found that the inclination angle of the water-rich fault has a significant impact on the stress of the tunnel surrounding the rock. As the tunnel gets closer to the fault, there are significant differences in displacement and seepage fields between the upper part of the tunnel and the lower part, exhibiting asymmetry. In the area near the fault, the surrounding rock of the tunnel is more prone to damage, manifested by greater changes in the displacement and seepage fields of the surrounding rock.
5.2. Disposal Measures for the Tunnel Approaching the Water-Rich Fault
To prevent and control the occurrence of water inrush disasters in the tunnel face caused by the water-rich fault, certain disaster prevention and control measures are taken for the face, such as advanced geological prediction, advanced grouting reinforcement, advanced support, and advanced pressure relief [26,27,28,29]. In general, the control measures for tunnels should follow closely with the tunnel face, such as the new Austrian tunneling method, but this is suitable for situations where the rock mass of the tunnel face is relatively good [30]. When the self-stability ability of the tunnel face is poor and significant deformation or collapse occurs after excavation, advanced control measures should be taken, such as using the new method to predict the stability of the tunnel face rock mass based on the extrusion deformation of the tunnel face [31].
5.2.1. Advanced Geological Prediction and Detection
Before or during tunnel excavation, in order to avoid or reduce the occurrence of disasters, it is necessary to conduct an advanced geological prediction of the tunnel area and determine the location and orientation of geological high-risk areas, especially fracture zones, at a macro level through geological surveys and analyses [32]. Therefore, the differences in the geological environment background and geological conditions of the tunnel crossing the mileage section result in different threat factors faced by tunnel construction. It is necessary to select corresponding advanced geological prediction schemes based on different tunnels and dynamically adjust them as the geological conditions exposed by the tunnel change. Different advanced forecasting methods have different characteristics and applicable conditions. Drilling and geophysical methods are complementary. The drilling results are intuitive and reliable, but generally, point and line detection are carried out along the borehole, with limited detection range. Geophysical exploration often involves conducting large-scale exploration in both the plane and space, but geophysical data need to be processed and interpreted and generally require more reliable drilling to support it.
5.2.2. Advance Support
Advance support is the main measure to reinforce weak surrounding rock. From the perspective of support parts, it can be divided into two categories: advanced support for the top arch and stable control measures for the tunnel face. The advance support of the top arch is arranged in descending order of support strength, followed by advance pipe shed, advance small conduit, and advance anchor rod. The stability control measures for the tunnel face include reserving core soil, glass fiber anchor rods for the tunnel face, and sealing the spray layer.
5.2.3. Advance Pressure Relief
Advance pressure relief refers to drilling deep drainage holes on the excavation face to reduce external water pressure and improve the safety of the excavation process. The drainage holes on the tunnel face are generally constructed after grouting. Referring to the drilling records of the previous grouting holes, the drainage holes can be arranged close to the grouting holes with larger water inflow in the early stage. According to the principle of one hole for multiple purposes, first, control the depth of the hole within the grouting range as an inspection hole, take the core and record the water inflow situation of the drilling hole, sweep the hole outside the grouting range, and finally use it as a drainage hole.
5.2.4. Advanced Grouting
Grouting reinforcement can not only have a compaction effect on the rock mass but also improve the overall integrity of the surrounding rock. It can also act as an anchor for the surrounding rock, combining a certain range of rock layers to jointly bear loads, improving the bending and shear resistance of the surrounding rock; injecting grout into the rock layer through small conduit pipes reinforces the rock layer and improves the mechanical parameters of the surrounding rock. Based on the geological conditions, construction conditions, and grouting technology on site, a reasonable selection was made. While ensuring safety, the construction support tunnel of 2# adit of Xianglushan tunnel adopted advanced grouting reinforcement measures for the tunnel face to prevent water inrush disasters.
6. Conclusions
- (1)
- As the tunnel face approached the water-rich fault fracture zone, the displacement at each monitoring point in the water-resistant rock mass increased continuously. The closer the tunnel was to the fault, the greater the increase rate of the displacement was at each monitoring point in the water-resistant rock mass. When the tunnel was excavated to the position 5 m from the fault, a sudden displacement of the center of the face was observed. The water-resistant rock mass ahead of the face was damaged, and the tunnel was subjected to a water inrush disaster. The recommended safety thickness of the water-resistant rock mass was 5–6 m.
- (2)
- When the tunnel face was far away from the fault, the water-resistant rock mass at the face was less affected by the water pressure, and it was in a relatively stable state. As the tunnel face approached the fault, water seepage from the fault occurred, and the water entered the water-resistant rock mass through the fissures. Since the face was jointly affected by excavation disturbance and fissure water pressure, the water pressure encountered a slow decline trend with the excavation of the face.
- (3)
- The middle bench of the 2# adit of Xianglushan tunnel was first excavated and supported to the face, and a grouting wall was applied to the face. The range of the grouting reinforcement circle was 6 m outside the excavation profile, and the length of cyclic grouting was 30 m. The length of cyclic excavation was 25 m, and a 5 m long grouting rock disc was retained in each cycle. Grouting slurry was cement slurry with a water–cement mass ratio (W/C ratio) of 0.5–1:1.
- (4)
- The evaluation of the grouting effect by means of drilling acoustic wave, drilling TV, and radar detection confirmed that the grouting treatment scheme had an excellent reinforcement effect on the rock mass. The deformation modulus of the rock mass after grouting was increased by 37–53%. The rock mass possessed a better elastic deformation capacity to external loads, which slowed down the deformation process of the rock mass. The shear strength parameters (cohesion c and friction coefficient tanφ) were increased by 10–14%, which enhanced the overall adhesion and improved the shear and sliding resistance of the rock mass.
Author Contributions
Conceptualization, J.G. (Jiheng Gu) and F.C.; methodology, J.G. (Jiaqi Guo).; software, J.G. (Jiheng Gu); validation, J.G. (Jiheng Gu), F.C. and J.L.; formal analysis, J.G. (Jiaqi Guo); investigation, F.C.; resources, J.L.; data curation, F.C.; writing—original draft preparation, J.G. (Jiheng Gu); writing—review and editing, J.G. (Jiheng Gu); visualization, F.C.; supervision, J.L.; project administration, J.L.; funding acquisition, J.G. (Jiaqi Guo). All authors have read and agreed to the published version of the manuscript.
Funding
This study was funded by the National Natural Science Foundation of China (Grant Nos. 52178388, 42307259) and Yunnan Province Major Science and Technology Special Plan Project (Grant No. 202002AF080003).
Data Availability Statement
Data are contained within the article.
Acknowledgments
The authors greatly appreciate the financial support from funding bodies and would be grateful to the reviewers for their valuable comments and suggestions to improve the quality of the paper.
Conflicts of Interest
The authors declare no conflicts of interest.
References
- Zhang, Y.J.; Pu, S.J.; Zhou, H.; Wang, J.G.; Wu, S.C.; Ding, X.L. Research progress on key technologies for safe construction and efficient operation of the Dianzhong water diversion project-underground engineering. Chin. J. Rock Mech. Eng. 2024, 43, 333–357. [Google Scholar]
- Tu, W.F.; Li, L.P.; Cheng, S.; Chen, D.Y.; Yuan, Y.C.; Chen, Y.H. Evolution mechanism, monitoring, and early warning method of water inrush in deep-buried long tunnel. Geofluids 2021, 2021, e2023782. [Google Scholar] [CrossRef]
- Liu, N.; Pei, J.H.; Cao, C.Y.; Liu, X.Y.; Huang, Y.X.; Mei, G.X. Geological investigation and treatment measures against water inrush hazard in karst tunnels: A case study in Guiyang, southwest China. Tunn. Undergr. Space Technol. 2022, 124, 104491. [Google Scholar] [CrossRef]
- Wang, H.T.; Liu, P.; Liu, C.; Zhang, X.; Yang, Y.; Li, Y. Three-dimensional upper bound limit analysis on the collapse of shallow soil tunnels considering root stratification and pore water pressure. Math. Probl. Eng. 2019, 2019, 8164702. [Google Scholar] [CrossRef]
- Senent, S.; Jimenez, R. A tunnel face failure mechanism for layered ground, considering the possibility of partial collapse. Tunn. Undergr. Space Technol. 2015, 47, 182–192. [Google Scholar] [CrossRef]
- Song, R.G.; Zhang, D.L.; Wen, M. The cusp catastrophe theory analysis for instability of deep-buried tunnels surrounding rock through fault fracture zone. Chin. Civ. Eng. J. 2015, 48, 289–292. [Google Scholar]
- Zhang, L.W.; Wu, J.; Zhang, X.Y. Mechanism of water inrush from the tunnel face induced by fault and its application. J. Cent. South Univ. 2023, 30, 934–946. [Google Scholar] [CrossRef]
- Meng, F.S.; Wang, Y.C.; Jiao, Q.L.; Wang, Y.M.; Li, C.Y. Analysis of the minimum safe thickness of water inrush in fault fracture zone based on the silo theory. J. Harb. Inst. Technol. 2020, 52, 89–95. [Google Scholar]
- Guo, J.Q.; Li, H.F.; Chen, F.; He, Z.Y. Theoretical analysis on water-resisting thickness of karst tunnel face. Chin. J. Undergr. Space Eng. 2017, 13, 1373–1380. [Google Scholar]
- Wang, M.X.; Yang, W.M.; Zhou, Z.Q.; Li, L.P.; Yang, G.; Li, Z.H.; Sun, J.W. Experimental research on the effect of particle migration of a filling medium in a fault during water and mud inrush. Arab. J. Geosci. 2021, 14, 2206. [Google Scholar] [CrossRef]
- Wang, Y.C.; Chen, F.; Sui, W.H.; Meng, F.S.; Geng, F. Large-scale model test for studying the water inrush during tunnel excavation in fault. Bull. Eng. Geol. Environ. 2022, 81, 238. [Google Scholar] [CrossRef]
- Zhang, Q.S.; Jiang, Q.C.; Zhang, X.; Wang, D.M. Model test on development characteristics and displacement variation of water and mud inrush on tunnel in fault fracture zone. Nat. Hazards 2019, 99, 467–492. [Google Scholar] [CrossRef]
- Sun, W.B.; Hao, J.B.; Dai, X.Z.; Kong, L.J. Characteristics of the development mechanism of mining-induced fault fracture zone. Coal Geol. Expl. 2024, 2024, 1–8. [Google Scholar]
- Zhang, Q.Y.; Chen, Z.W.; Yuan, J.Q.; Liu, Q.; Rong, C. Experimental study on evolution characteristics of water and mud inrush in fault fractured zone. Rock Soil Mech. 2020, 41, 1911–1922+1932. [Google Scholar]
- Wang, Y.C.; Jing, H.W.; Su, H.J.; Xie, J.Y. Effect of a fault fracture zone on the stability of tunnel-surrounding rock. Int. J. Geomech. 2017, 17, 04016135. [Google Scholar] [CrossRef]
- Zhang, J.Q.; Li, S.C.; Zhang, Q.S.; Zhang, X.; Li, P.; Wang, D.M.; Weng, X.J. Mud inrush flow mechanisms: A case study in a water-rich fault tunnel. Bull. Eng. Geol. Environ. 2019, 78, 6267–6283. [Google Scholar] [CrossRef]
- Li, X.; Xue, Y.; Zhang, Z.H. Progressive evolution model of fault water inrush caused by underground excavation based on multiphysical fields. Geofluids 2023, 2023, 8870126. [Google Scholar] [CrossRef]
- Fu, H.L.; An, P.T.; Li, K.; Li, j.; Cheng, G.W.; Zhang, G.B. Analysis on the process of tunnel passing through high-pressurefault fractured zone with abundant water rich. Mod. Tunn. Tech. 2020, 57, 458–465. [Google Scholar]
- Zhang, Y.J.; Dong, J.X.; Zhou, Z.Q.; Zhou, L.S.; Mi, J. Water and sand inrush evolution and minimum safe thickness of waterproof-resistant slab in sandy dolomite tunnels near the faults. Chin. J. Rock Mech. Eng. 2024, 43, 639–652. [Google Scholar]
- Wang, J.; Cui, J.Y.; Chen, Z.L.; Li, Q.; Guo, Z.B. Prediction formula of critical safety thickness of tunnel water inrush in water-rich fault zone. Tunn. Constr. 2021, 41, 256–264. [Google Scholar]
- Zhang, Y.J.; Zhang, Z.W.; Xiao, J.; Li, Y.W.; Yu, Q.G. Study on mining water inrush mechanism of buried fault under coal seam floor above confined water body. Coal Sci. Tech. 2023, 51, 283–291. [Google Scholar]
- Xie, Q.; Cao, Z.L.; Sun, W.C.; Fumagalli, A.; Fu, X.; Wu, Z.H.; Wu, K. Numerical simulation of the fluid-solid coupling mechanism of water and mud inrush in a water-rich fault tunnel. Tunn. Unde. Space Tech. 2023, 131, 104796. [Google Scholar] [CrossRef]
- Chen, L.L.; Wang, Y.Q.; Wang, Z.F.; Fan, F.F.; Liu, Y. Characteristics and treatment measures of tunnel collapse in fault fracture zone during rainfall: A case study. Eng. Fail. Anal. 2023, 145, 107002. [Google Scholar] [CrossRef]
- Zhang, X.H.; Fu, P.; Yin, J.M.; Liu, Y.K. In-situ stress characteristics and active tectonic response of Xianglushan tunnel of Middle Yunnan Water Diversion Project. Chin. J. Geo. Eng. 2021, 43, 130–139. [Google Scholar]
- Xiao, W.B.; Xie, Y.B.; Zheng, Y.; Wu, K.; Chen, R.; Li, Q.L.; Cheng, R.Z. Deformation failure and damage evolution of urban metro tunnels under active faults. J. Shandong Univ. 2023, 53, 1–13. [Google Scholar]
- Xiao, G.Z. Problems of railway tunnel construction under some special geological conditions in China and their countermeasures. Tunn. Constr. 2019, 39, 1748–1758. [Google Scholar]
- Zhang, M.Q.; He, Z.J.; Huang, H.J.; Ren, S.Q.; Shan, H.Y. Causal analysis and governance of the water & mud bursting in Daliang tunnel on Lanzhou-Xinjiang second railway. J. Rail. Eng. Soc. 2015, 32, 77–80. [Google Scholar]
- Dai, Z.R.; Hu, R.Q.; Wang, Z.Y.; Zhao, Q.C. Mechanism and treatment measures of water and sand inrush in operational tunnel in karst area. Tunn. Constr. 2023, 43, 369–377. [Google Scholar]
- Guo, Q.J. Countermeasures and construction optimization against the water inrush event in a water-rich tunnel section. Mod. Tunn. Technol. 2020, 57, 219. [Google Scholar]
- Huang, K.; An, Y.L.; Yue, J.; Zeng, X.C.; Li, J.H.; Zhang, Y.J.; Wang, D. Influence of seepage force on tunnel face stability by new Austria tunneling method. J. Cent. South Univ. (Sci. Tech.) 2019, 50, 1221–1228. [Google Scholar]
- Ma, W.B. Development and prospect of key technology of drilling and blasting for railway mountain tunnels. J. Chin. Rail. Soc. 2022, 44, 64–85. [Google Scholar]
- Wang, B.J. Advanced geological prediction detection system for tunnel in karst areas and its application. Rail. Constr. Technol. 2023, 3, 148–151. [Google Scholar]


Disclaimer/Publisher’s Note: The statements, opinions and data contained in all publications are solely those of the individual author(s) and contributor(s) and not of MDPI and/or the editor(s). MDPI and/or the editor(s) disclaim responsibility for any injury to people or property resulting from any ideas, methods, instructions or products referred to in the content. |
© 2024 by the authors. Licensee MDPI, Basel, Switzerland. This article is an open access article distributed under the terms and conditions of the Creative Commons Attribution (CC BY) license (https://creativecommons.org/licenses/by/4.0/).